TL;DR#
The paper addresses the critical gap between visual generation and understanding in Multimodal Large Language Models(MLLMs). Current visual tokenizers struggle to balance fine-grained details for generation and high-level semantics for understanding, leading to performance limitations and the need for separate task-specific tokenizers. This disparity increases model complexity and hinders true integration. The research identifies that the bottleneck is from limited representational capacity of discrete tokens.
To address this, the paper introduces UniTok, a unified visual tokenizer employing multi-codebook quantization and attention factorization. This expands the latent feature space and enhances token expressiveness. UniTok achieves strong results, matching or surpassing domain-specific tokenizers in reconstruction and classification. It sets a new state-of-the-art for unified autoregressive MLLMs and is foundational for improved downstream task performance.
Key Takeaways#
Why does it matter?#
This paper matters because it bridges the gap between visual understanding and generation for MLLMs. UniTok’s multi-codebook quantization and attention factorization offer new directions for tokenizer design. It achieves impressive performance and contributes to stronger downstream task performance, which opens avenues for better unified MLLMs.
Visual Insights#

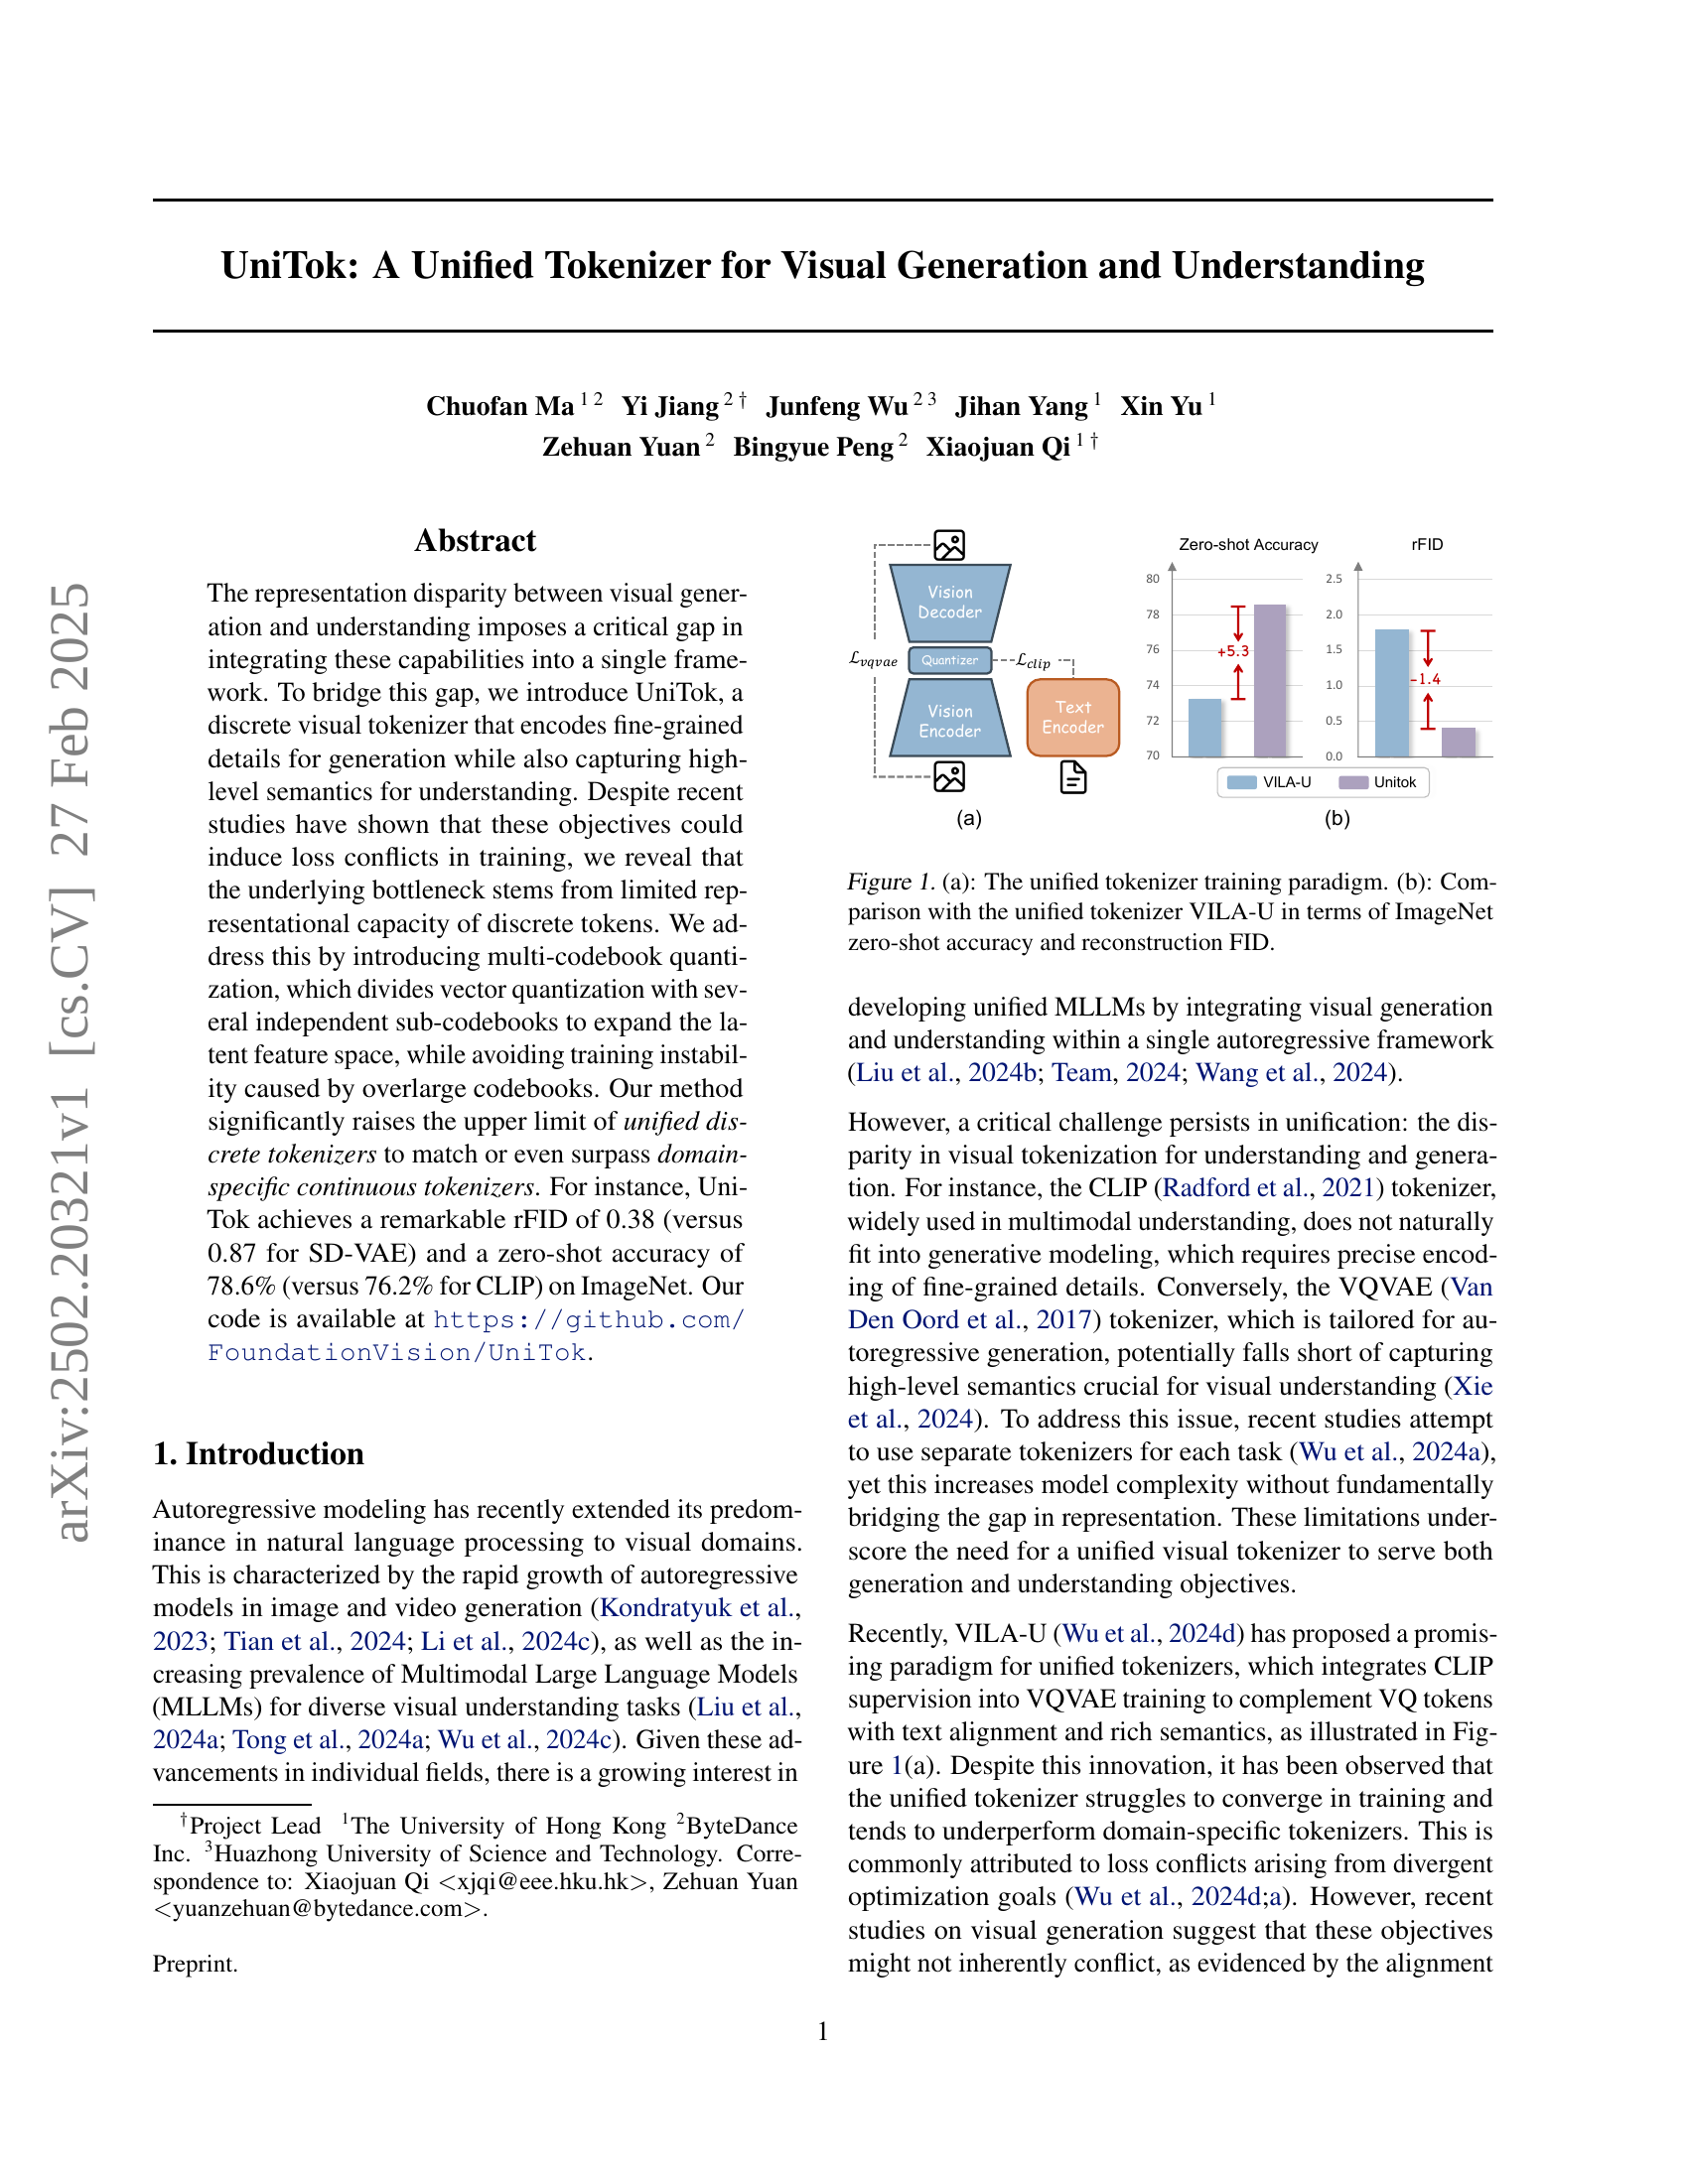
🔼 Figure 1(a) illustrates the training process of a unified visual tokenizer. It integrates both visual generation and understanding tasks by using a combined loss function: reconstruction loss to ensure accurate image reconstruction, and contrastive loss to align visual features with text captions. This unified training aims to bridge the gap between visual generation and understanding models, which often rely on separate tokenizers. Figure 1(b) presents a comparison of UniTok, the proposed unified tokenizer, against VILA-U, a state-of-the-art unified tokenizer, on two key metrics: ImageNet zero-shot accuracy (demonstrating understanding capabilities) and reconstruction FID (measuring generation quality). The results highlight UniTok’s superior performance in both tasks.
read the caption
Figure 1: (a): The unified tokenizer training paradigm. (b): Comparison with the unified tokenizer VILA-U in terms of ImageNet zero-shot accuracy and reconstruction FID.
| Method | #Tokens | rFID | Accuracy |
|---|---|---|---|
| VQVAE Model | |||
| VQ-GAN (Esser et al., 2021) | 256 | 4.98 | – |
| RQ-VAE (Lee et al., 2022) | 256 | 1.30 | – |
| VAR (Tian et al., 2024) | 680 | 0.90 | – |
| CLIP Model | |||
| CLIP (Radford et al., 2021) | 256 | – | 76.2 |
| SigLIP (Zhai et al., 2023) | 256 | – | 80.5 |
| ViTamin (Chen et al., 2024) | 256 | – | 81.2 |
| Unified Model | |||
| TokenFlow† (Qu et al., 2024) | 680 | 1.37 | – |
| VILA-U† (Wu et al., 2024d) | 256 | 1.80 | 73.3 |
| UniTok | 256 | 0.39 | 70.5 |
| UniTok† | 256 | 0.38 | 78.6 |
🔼 This table compares the performance of various image tokenizers on the ImageNet dataset. It evaluates both the reconstruction quality (using Fréchet Inception Distance or FID, a lower score is better) and the zero-shot classification accuracy. Reconstruction quality assesses how well a tokenizer can reconstruct an image from its encoded representation. Zero-shot classification accuracy measures the model’s ability to classify images into their respective categories without any prior training on those specific categories. The FID is calculated at a resolution of 256x256 pixels, with a 16x downsampling ratio. The table also indicates whether a model was initialized using pre-trained CLIP weights, a technique that can affect performance.
read the caption
Table 1: Comparison with modern tokenizers on ImageNet reconstruction FID and zero-shot classification accuracy. The rFID is measured at 256×256256256256\times 256256 × 256 resolution with 16×16\times16 × downsample ratio. ††\dagger† indicates the model uses pretrained CLIP weights for initialization.
In-depth insights#
Unified Tokenizer#
The concept of a unified tokenizer addresses a critical need in multimodal learning, aiming to bridge the gap between visual generation and understanding. The core idea revolves around creating a single tokenizer capable of encoding both fine-grained details for generating high-quality images and high-level semantics crucial for visual reasoning. This is challenging because traditional tokenizers are optimized for one task, leading to a trade-off between generation fidelity and understanding capability. A truly successful unified tokenizer would simplify model architectures, improve training efficiency, and facilitate seamless integration of diverse visual tasks within a single framework, potentially leading to more versatile and powerful AI systems. Overcoming loss conflicts is key, possibly via expanding representational capacity.
Multi-Code Quant#
Multi-codebook quantization (MCQ) addresses the limitations of standard vector quantization by splitting the latent space into multiple chunks, each quantized by an independent sub-codebook. This allows for a larger effective vocabulary size without the training instability associated with a single, massive codebook. The chunks number and dimensionality scale the latent code space by increasing sub-codebooks. In the context of unified tokenizers, MCQ can mitigate the bottleneck caused by limited representational capacity of discrete tokens, improving both reconstruction and downstream task performance. It enhances the representation and avoids optimization problem with large codebooks.
VQ Bottleneck#
The authors identify a quantization bottleneck limiting unified tokenizers’ performance, especially in visual understanding. Despite CLIP supervision, performance lags behind specialized CLIP tokenizers. Ablation studies reveal that token factorization (dimensionality reduction) and discretization (mapping to a small codebook) in VQ contribute to information loss. Reconstruction loss integration improves generation but doesn’t fully address the understanding gap, suggesting the limited representational capacity of discrete tokens is the primary issue, rather than inherent loss conflicts between reconstruction and contrastive learning. Thus motivates exploration of strategies to enhance feature space.
Attention Factor#
Regarding ‘Attention Factor,’ it’s plausible that the research explores how attention mechanisms influence the model’s performance. The study might delve into various attention techniques, such as self-attention or cross-attention, and their impact on capturing relevant information from different modalities. The ‘Attention Factor’ could quantify the degree to which the model focuses on specific features or regions of interest, possibly measured through attention weights or saliency maps. The analysis may investigate how different attention architectures or training strategies affect this factor, aiming to improve feature extraction, cross-modal alignment, or overall downstream task performance. Ultimately, fine-tuning the ‘Attention Factor’ could lead to more efficient and effective models for visual understanding and generation, possibly reducing computational costs or enhancing the quality of generated outputs.
Unified MLLM#
The “Unified MLLM” heading suggests a significant trend in multimodal machine learning: the creation of models capable of handling both visual and textual data within a single, cohesive architecture. This implies a move away from task-specific models toward more general-purpose systems that can perform a variety of tasks, such as image generation, visual understanding, and text-based reasoning. A key challenge in this area is bridging the gap between visual and textual representations. Models often struggle to effectively integrate information from these different modalities due to inherent differences in their structure and semantic content. The success of unified MLLMs hinges on developing effective techniques for aligning visual and textual features, enabling seamless information transfer between the modalities. This could involve novel architectures, training strategies, or representation learning methods that promote cross-modal understanding. The development of such models has the potential to revolutionize various applications, including image captioning, visual question answering, and multimodal dialogue systems. By enabling more sophisticated and versatile AI systems, unified MLLMs can pave the way for more seamless and intuitive human-computer interactions.
More visual insights#
More on figures
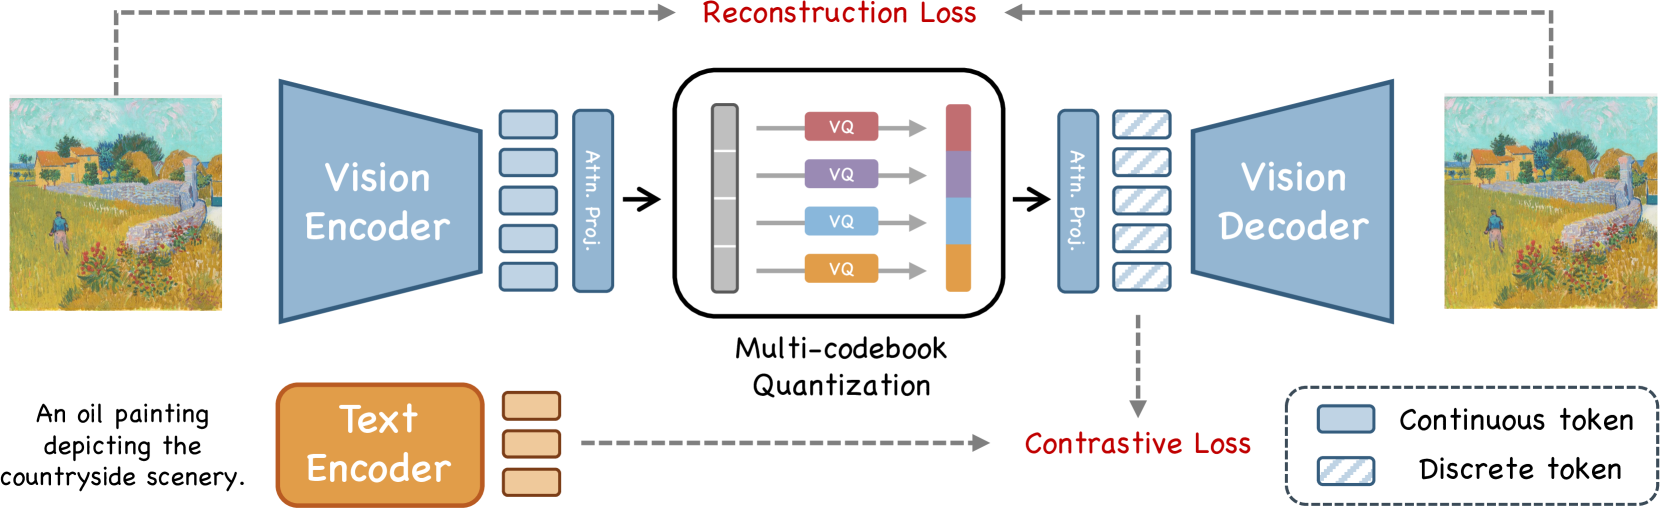
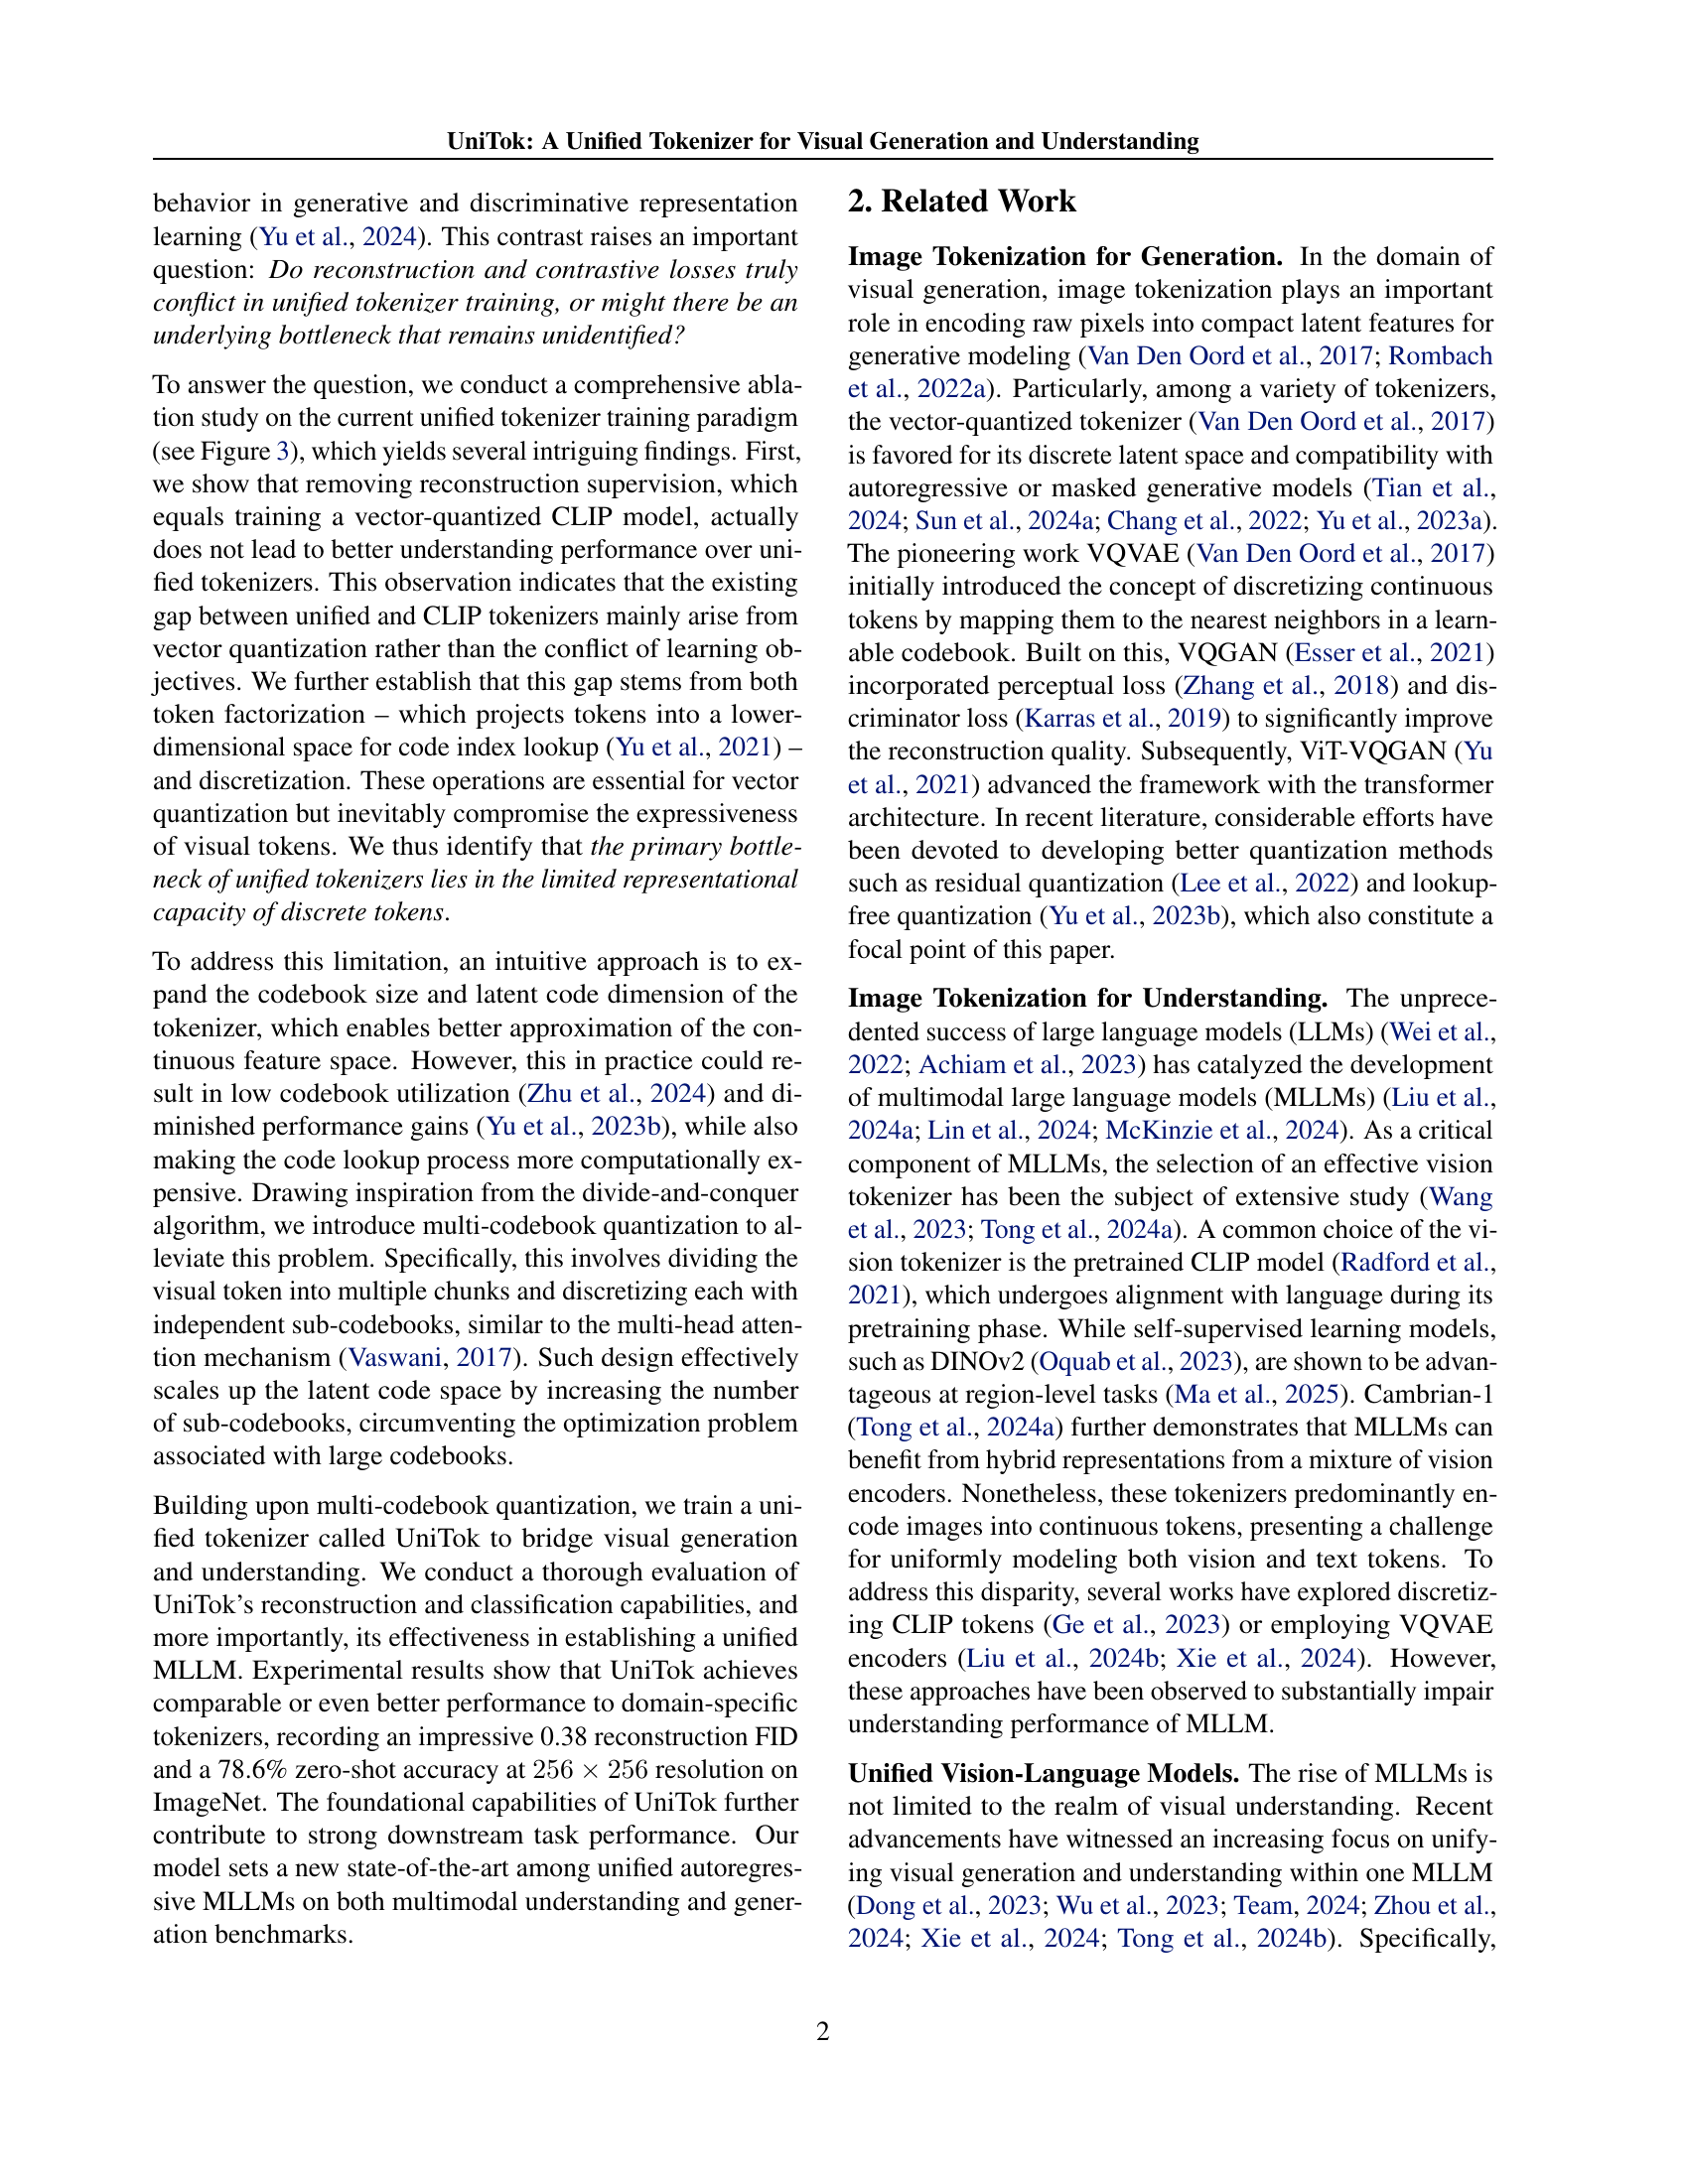
🔼 UniTok, a unified tokenizer, processes an image by first encoding it using a vision encoder. The resulting continuous token is then split into multiple chunks. Each chunk is independently quantized using a separate sub-codebook, resulting in a set of discrete tokens. This process is called multi-codebook quantization. These discrete tokens are projected, creating a representation suitable for both image generation and understanding. Simultaneously, the text caption undergoes processing through a text encoder. Finally, a contrastive loss is applied to align these discrete visual tokens with the text caption’s representation, ensuring that the visual representation captures the semantic meaning described in the text.
read the caption
Figure 2: An overview of UniTok. The tokenizer is trained to faithfully reconstruct the input image while aligning its discrete latent features with the text caption. For vector quantization, each visual token is split into multiple chunks, which then undergo code index lookup on corresponding sub-codebooks concurrently.

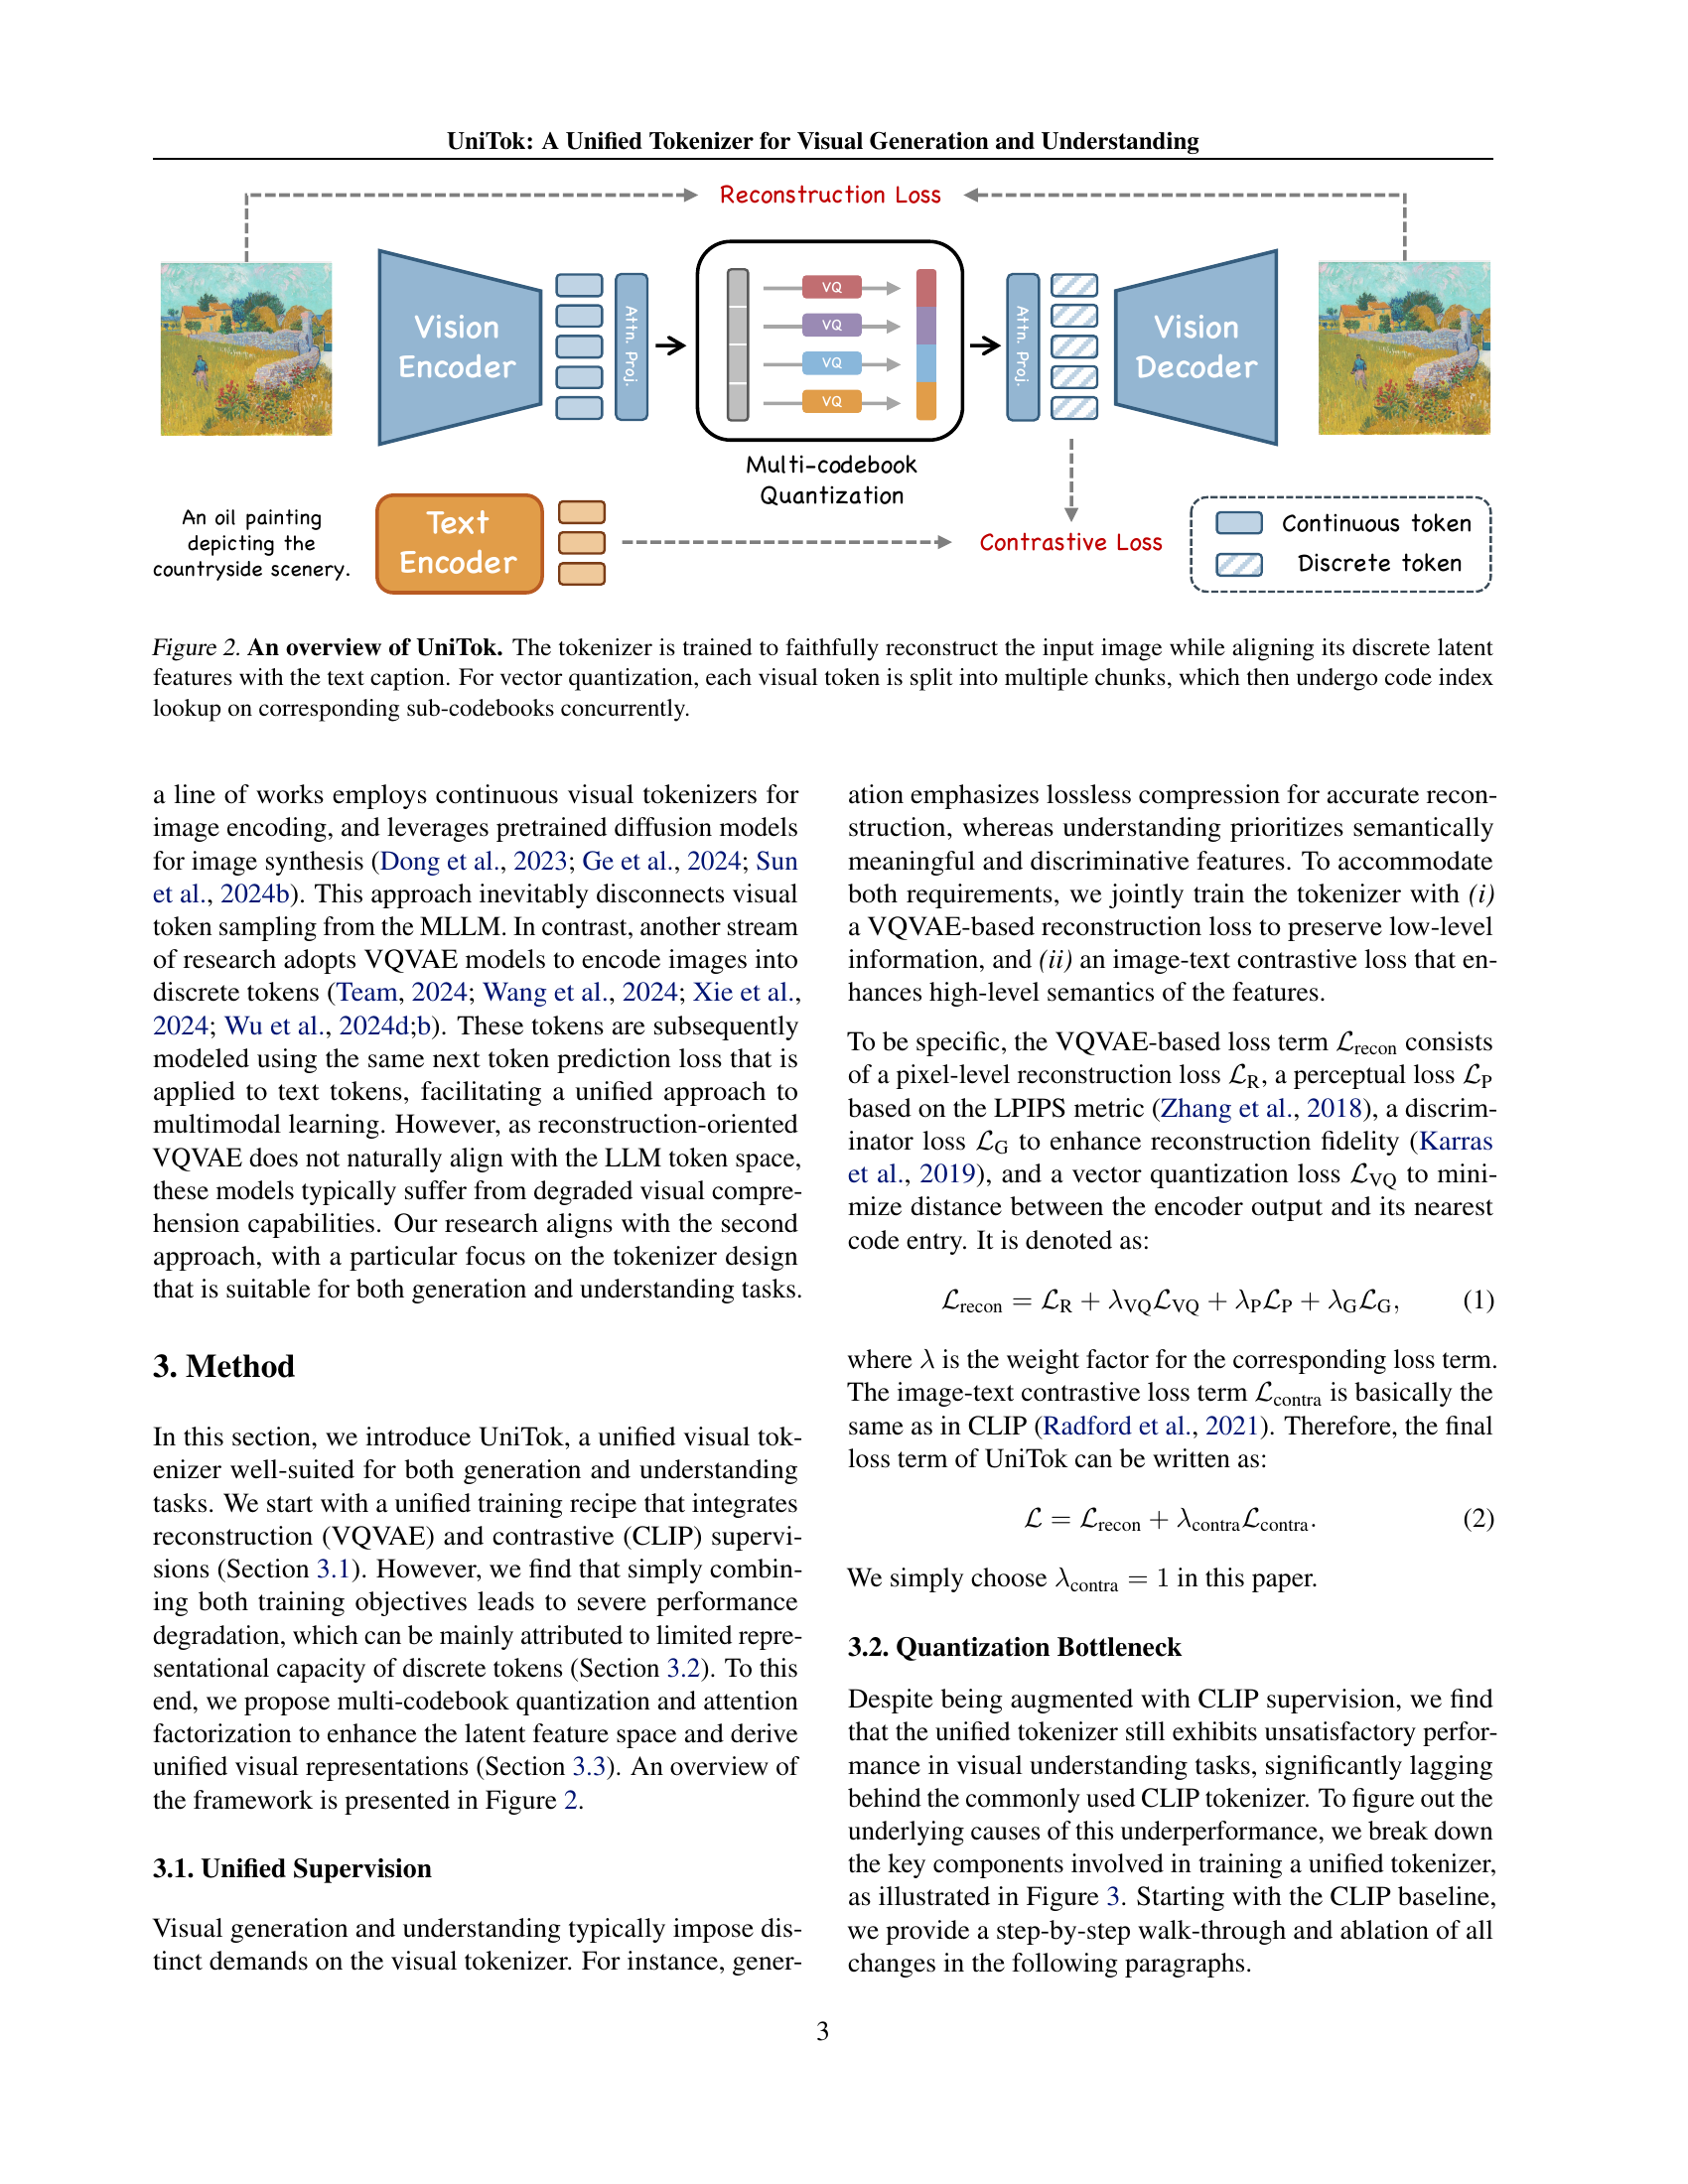
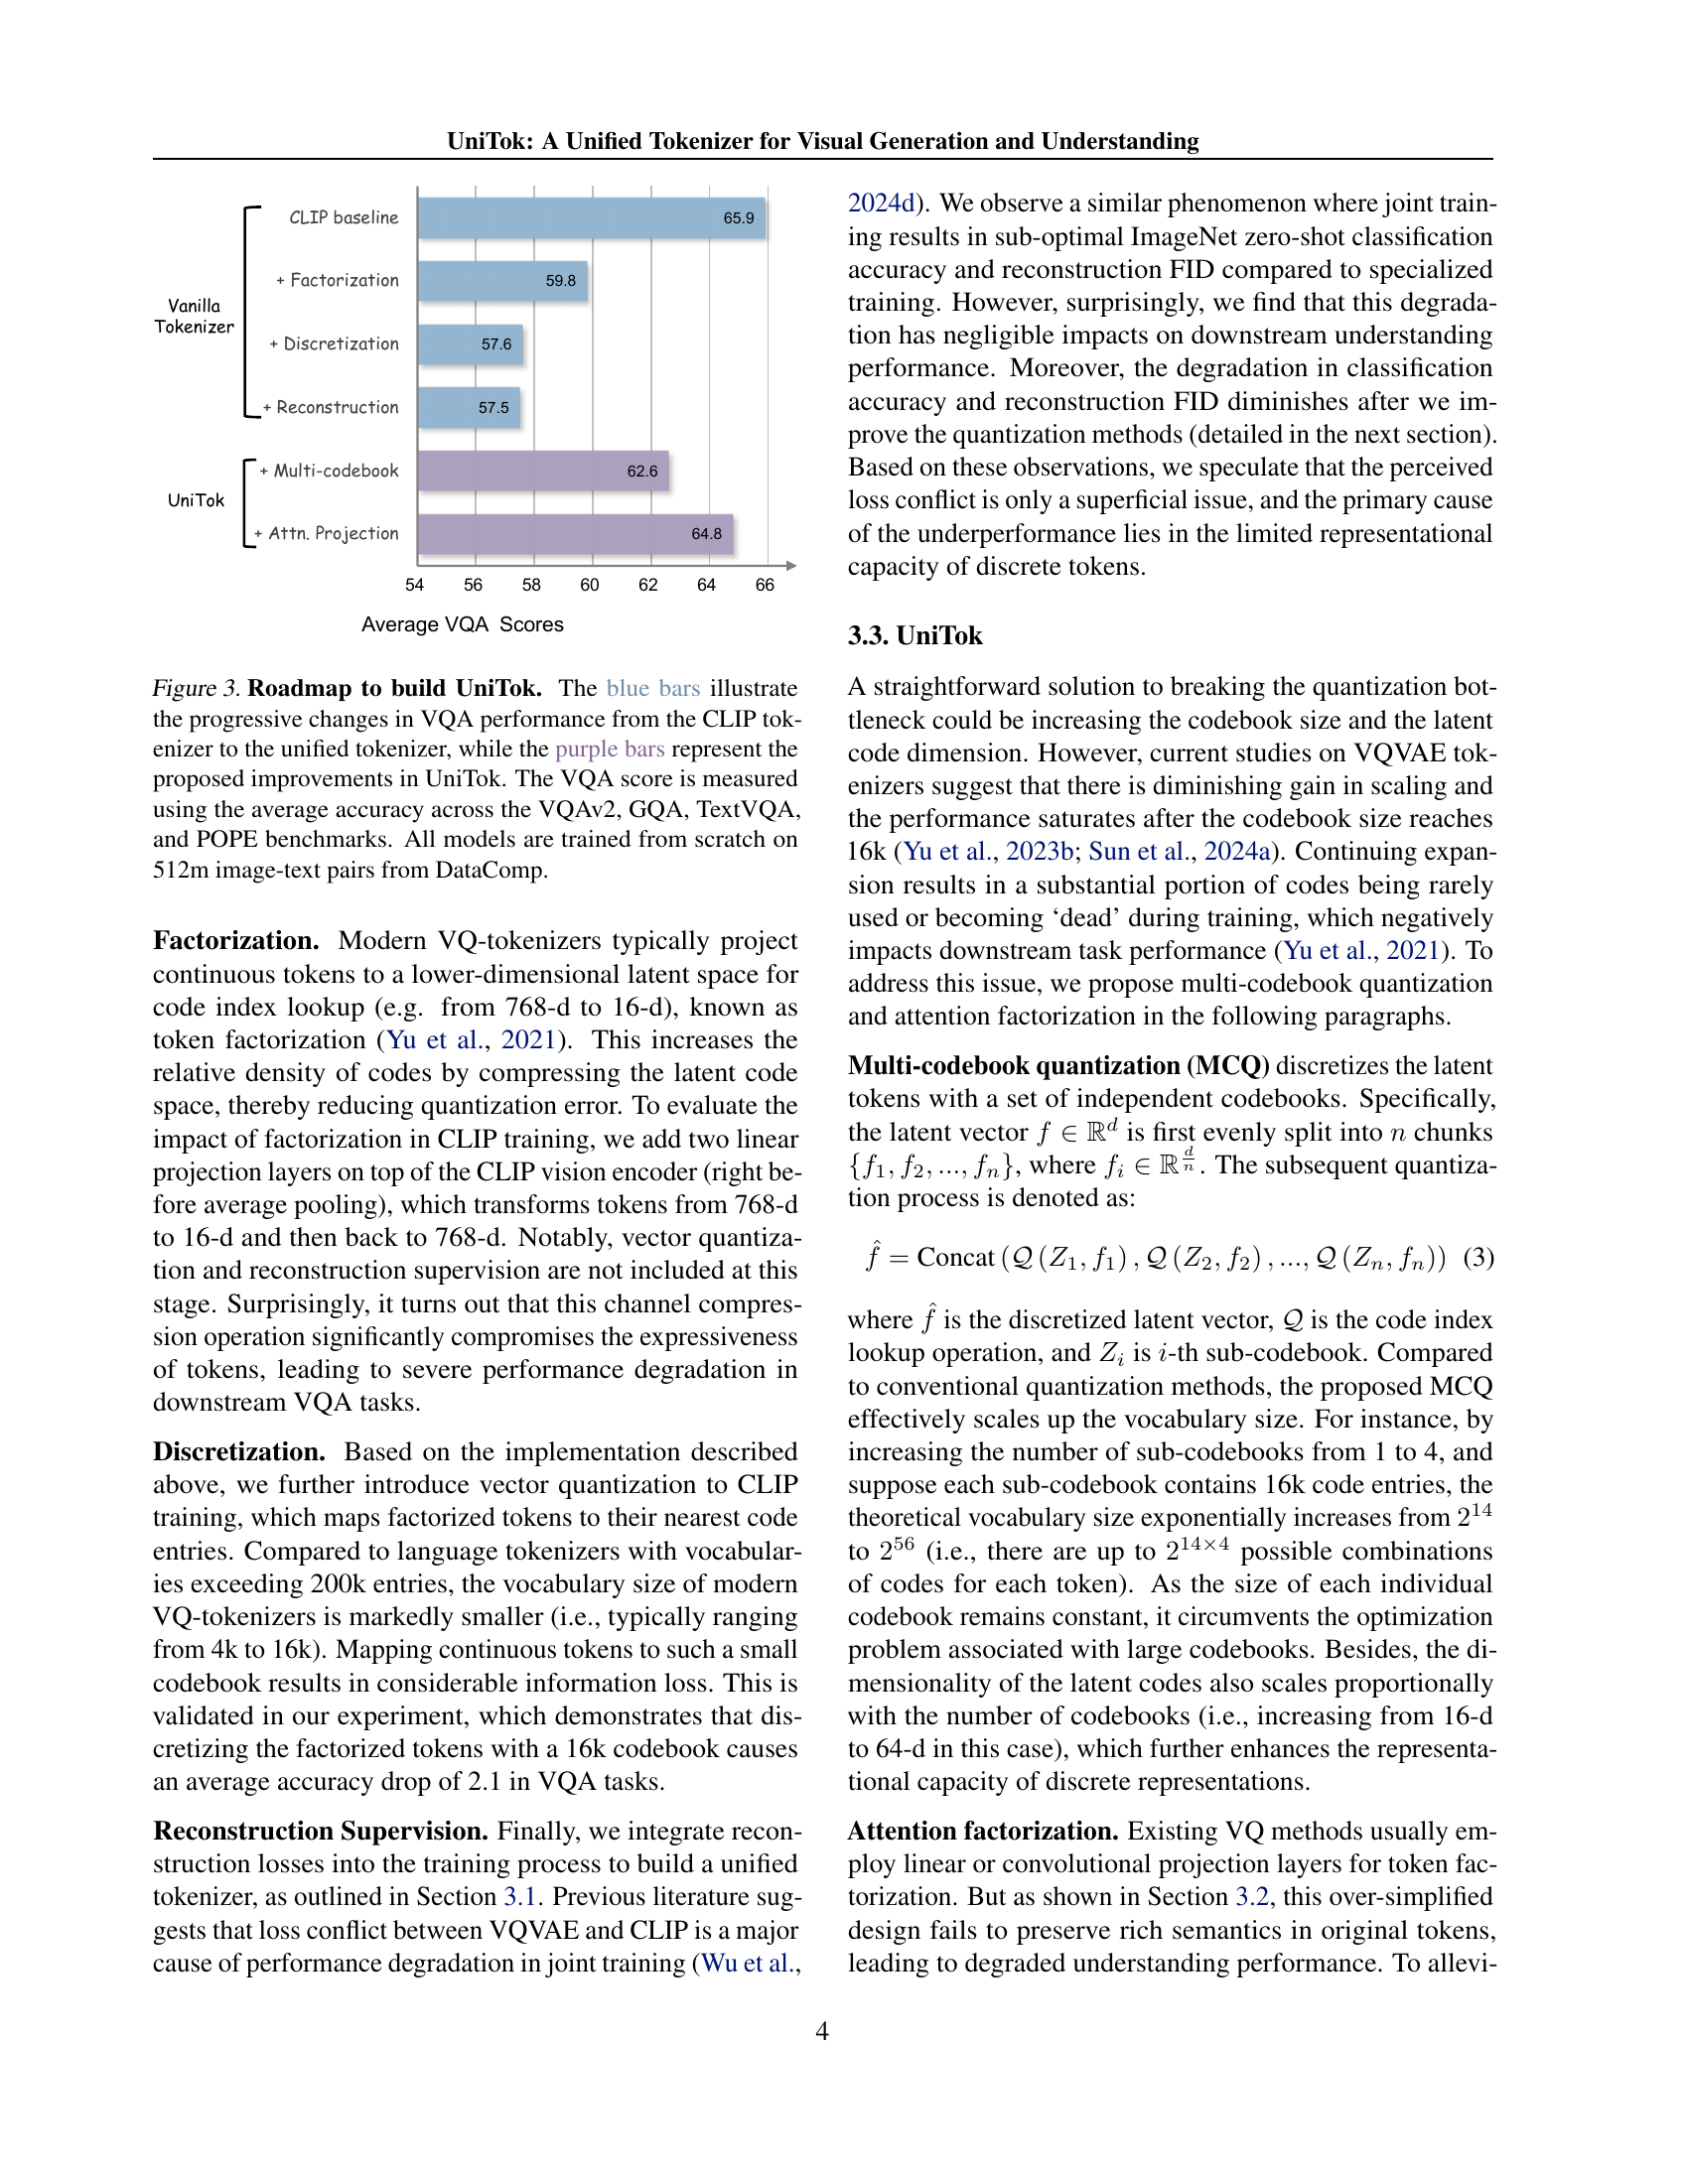
🔼 This figure illustrates the step-by-step improvement in Visual Question Answering (VQA) performance when developing the UniTok model. It starts with a CLIP tokenizer baseline and progressively adds components such as factorization, discretization, reconstruction loss, and multi-codebook quantization. Each addition’s effect on VQA performance, measured by averaging scores across four benchmark datasets (VQAv2, GQA, TextVQA, and POPE), is shown using blue bars. Purple bars represent the performance gains specifically due to UniTok’s proposed improvements. All models were trained on 512 million image-text pairs from the DataComp dataset.
read the caption
Figure 3: Roadmap to build UniTok. The blue bars illustrate the progressive changes in VQA performance from the CLIP tokenizer to the unified tokenizer, while the purple bars represent the proposed improvements in UniTok. The VQA score is measured using the average accuracy across the VQAv2, GQA, TextVQA, and POPE benchmarks. All models are trained from scratch on 512m image-text pairs from DataComp.

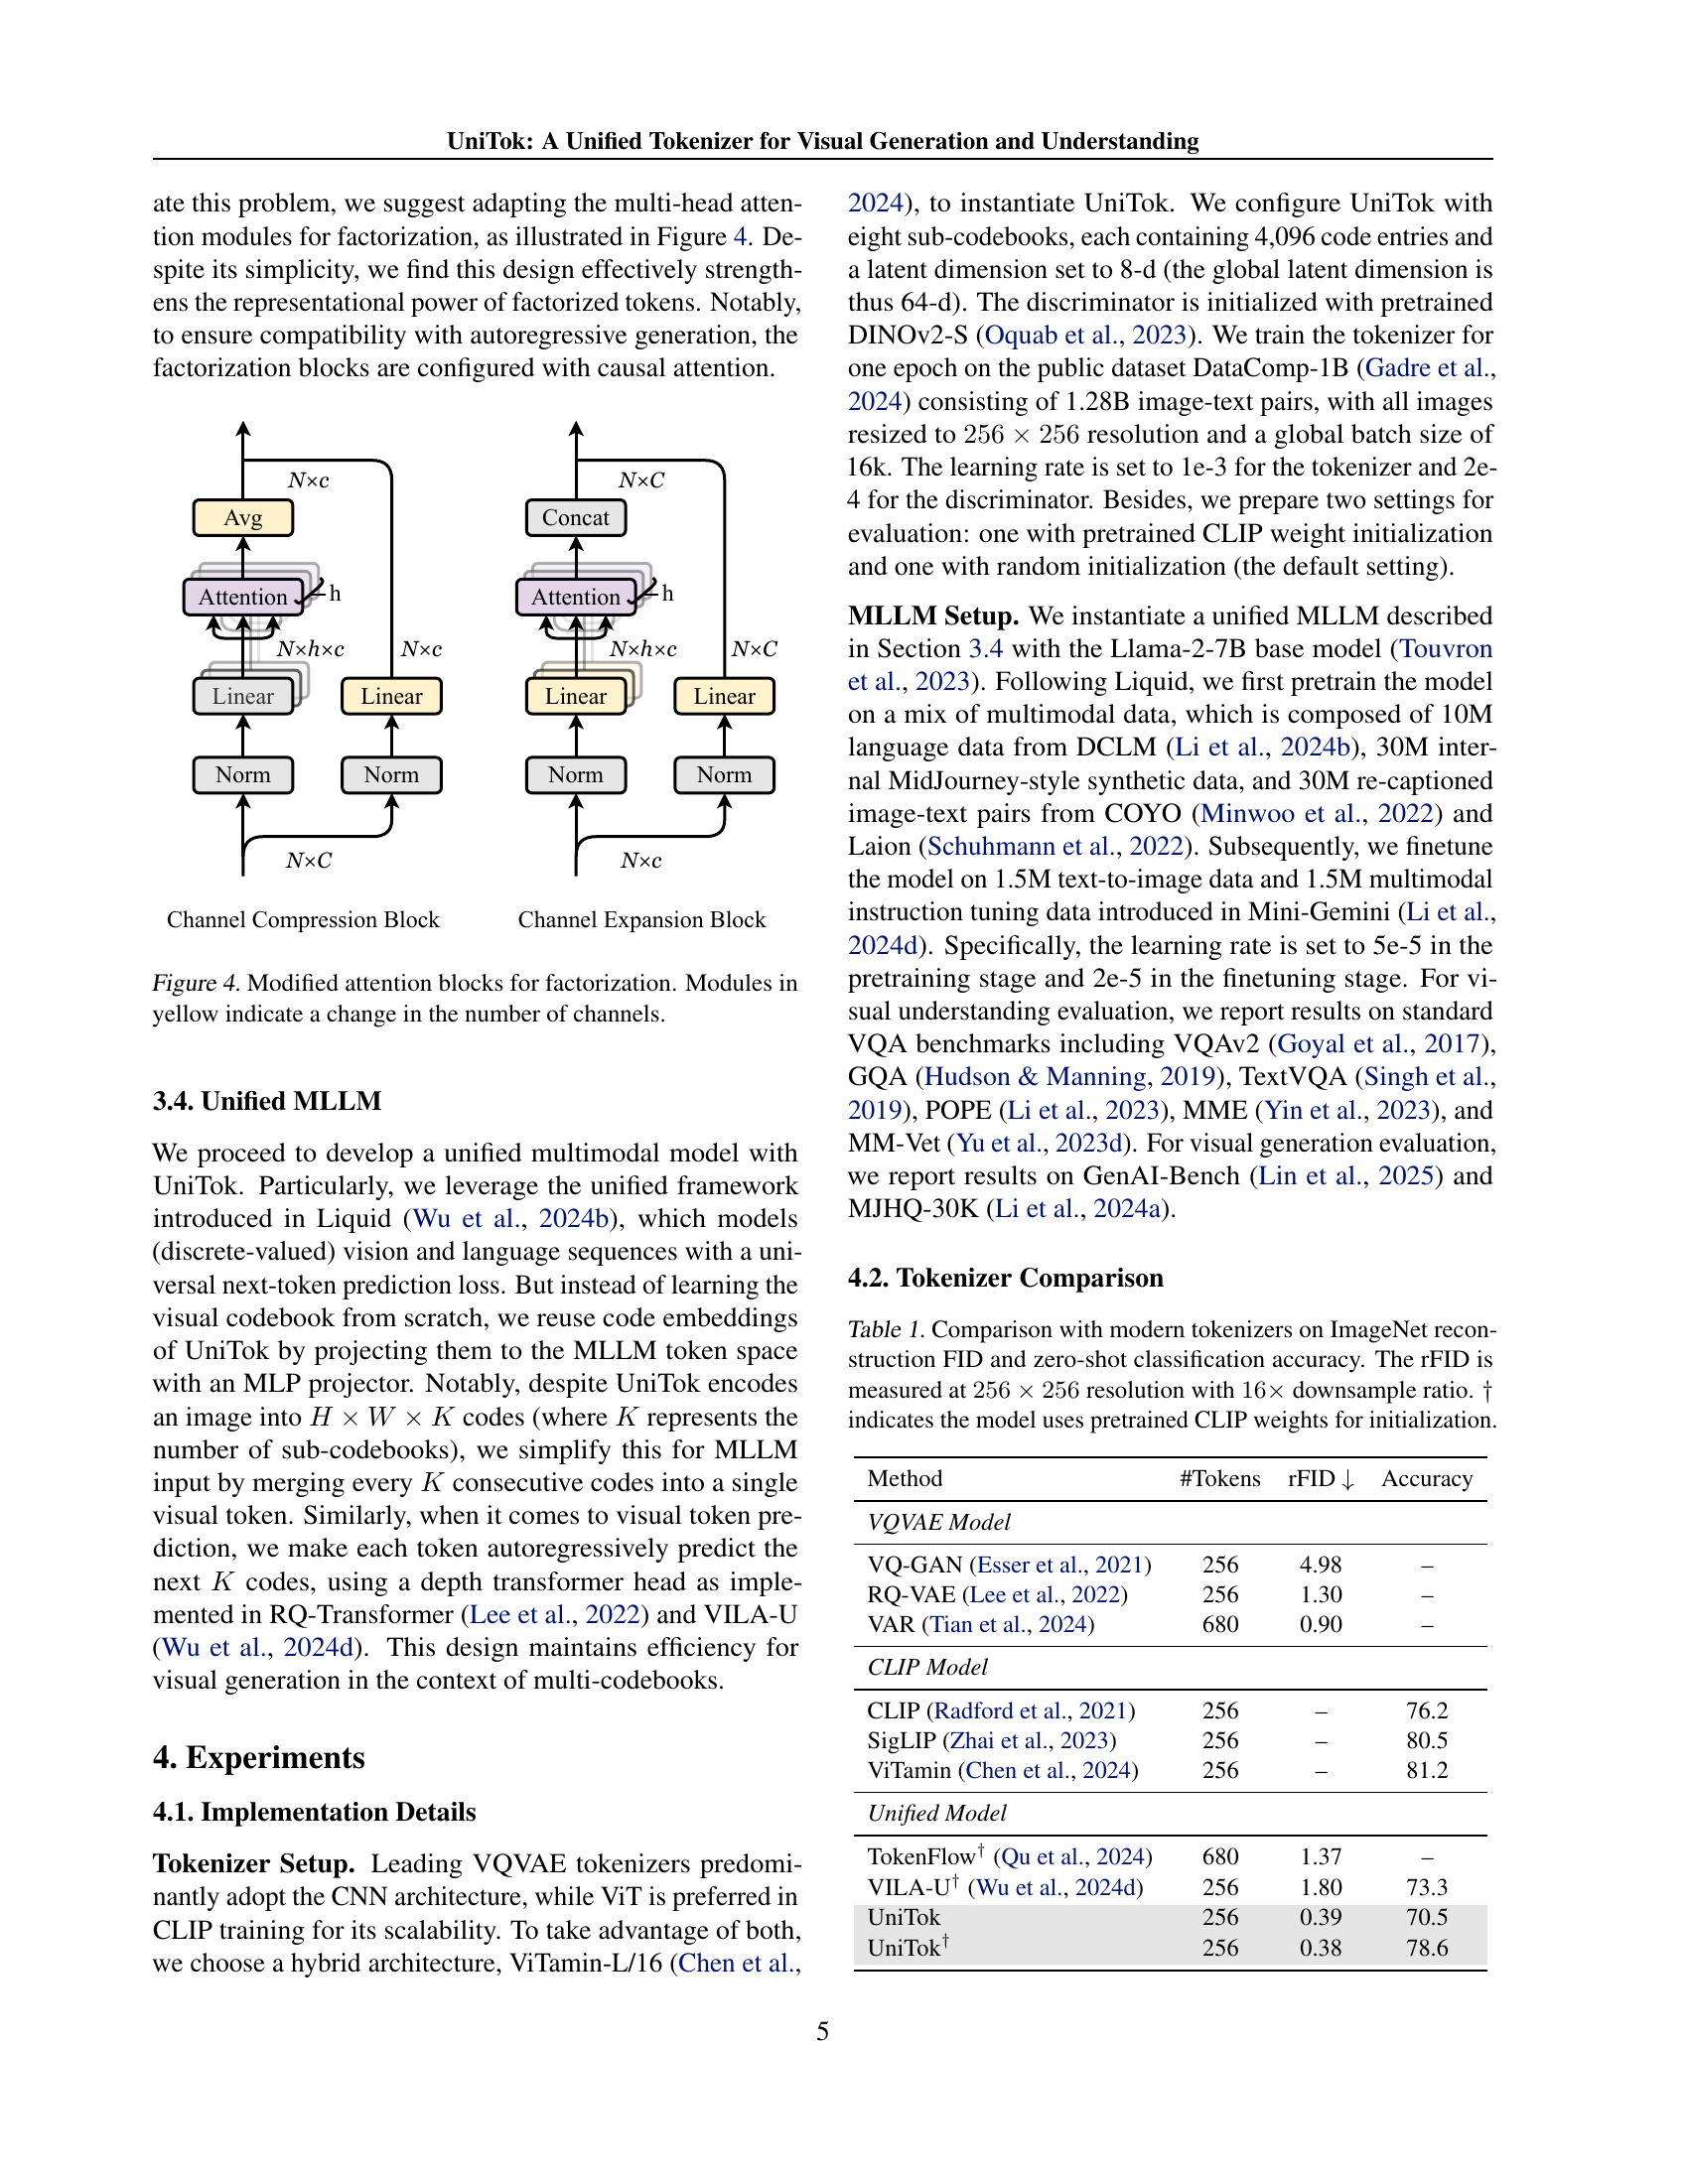
🔼 This figure illustrates the modified attention blocks used for factorization in UniTok. The original attention mechanism is adapted to improve the representation of factorized tokens. The yellow highlighted modules signify alterations in the number of channels, showing how the channel dimensions change during the factorization process. This modification is crucial for maintaining compatibility with autoregressive generation, enabling the model to effectively handle sequential visual data.
read the caption
Figure 4: Modified attention blocks for factorization. Modules in yellow indicate a change in the number of channels.

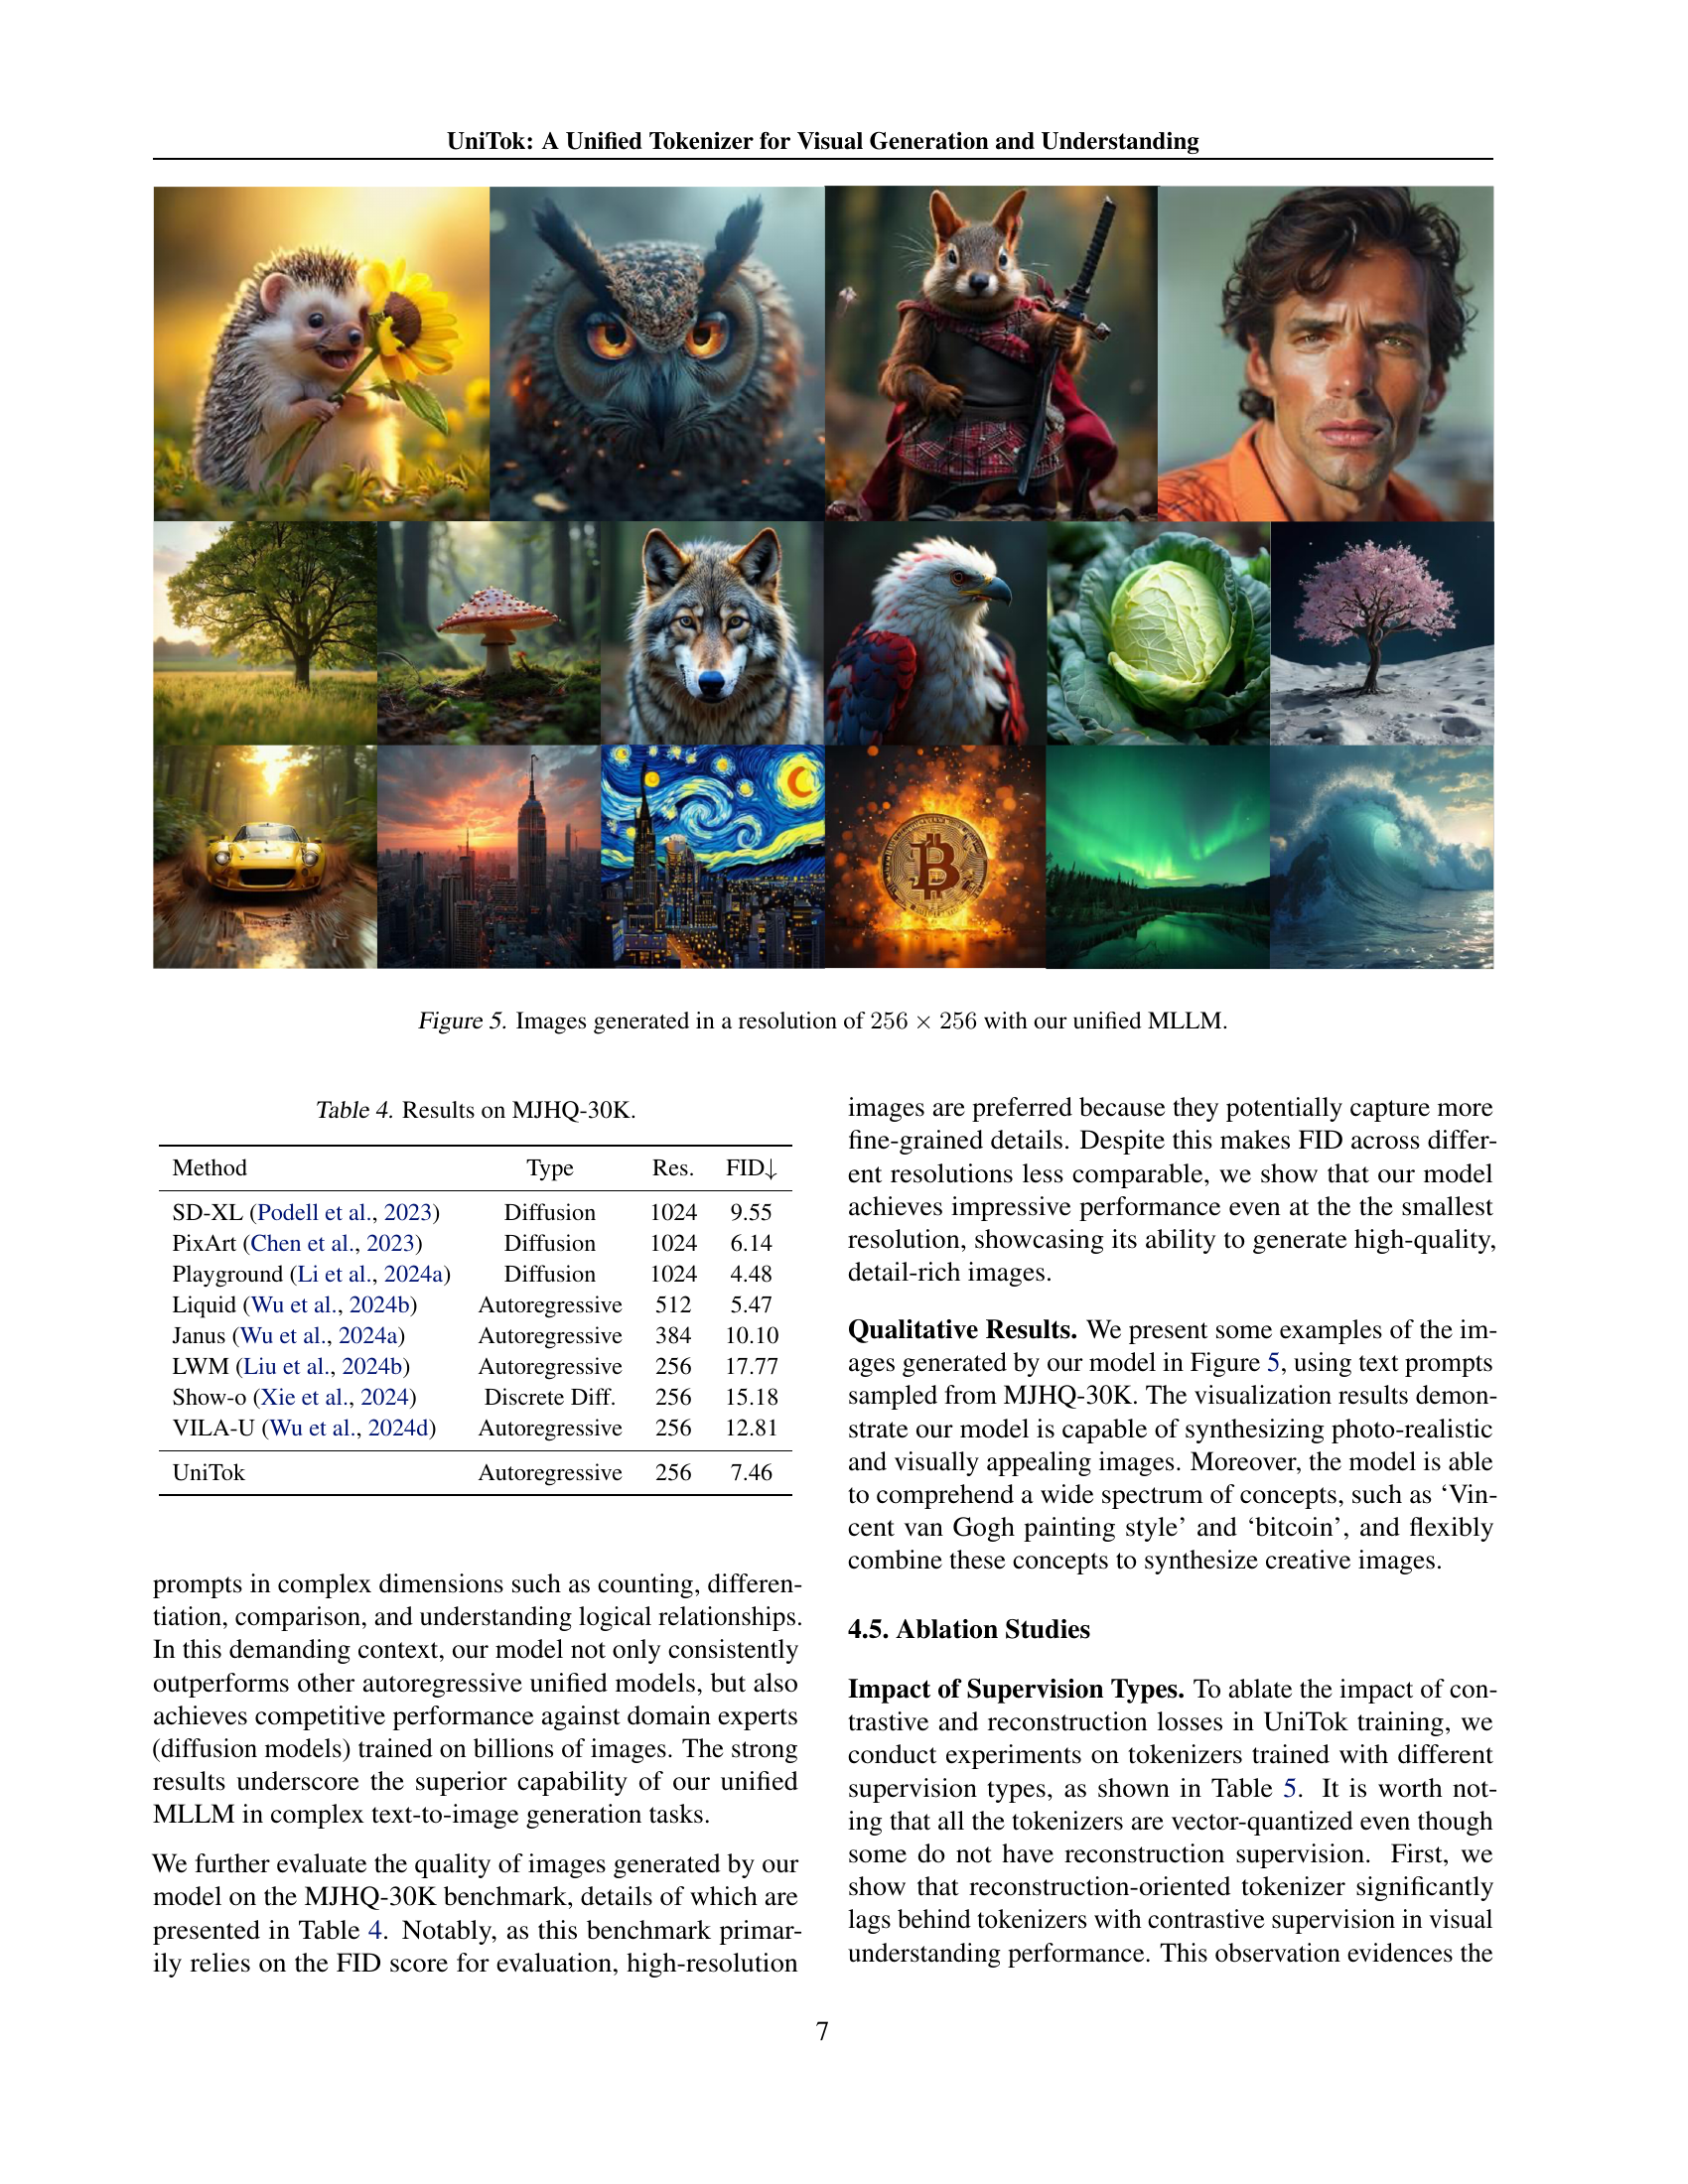
🔼 Figure 5 showcases various images generated using the UniTok unified multimodal large language model (MLLM). These images, produced at a 256x256 pixel resolution, demonstrate the model’s ability to create diverse and visually appealing outputs based on text prompts. The examples highlight a range of styles and subject matter, underscoring the MLLM’s capabilities for both photorealistic imagery and creative, stylized generation.
read the caption
Figure 5: Images generated in a resolution of 256×256256256256\times 256256 × 256 with our unified MLLM.

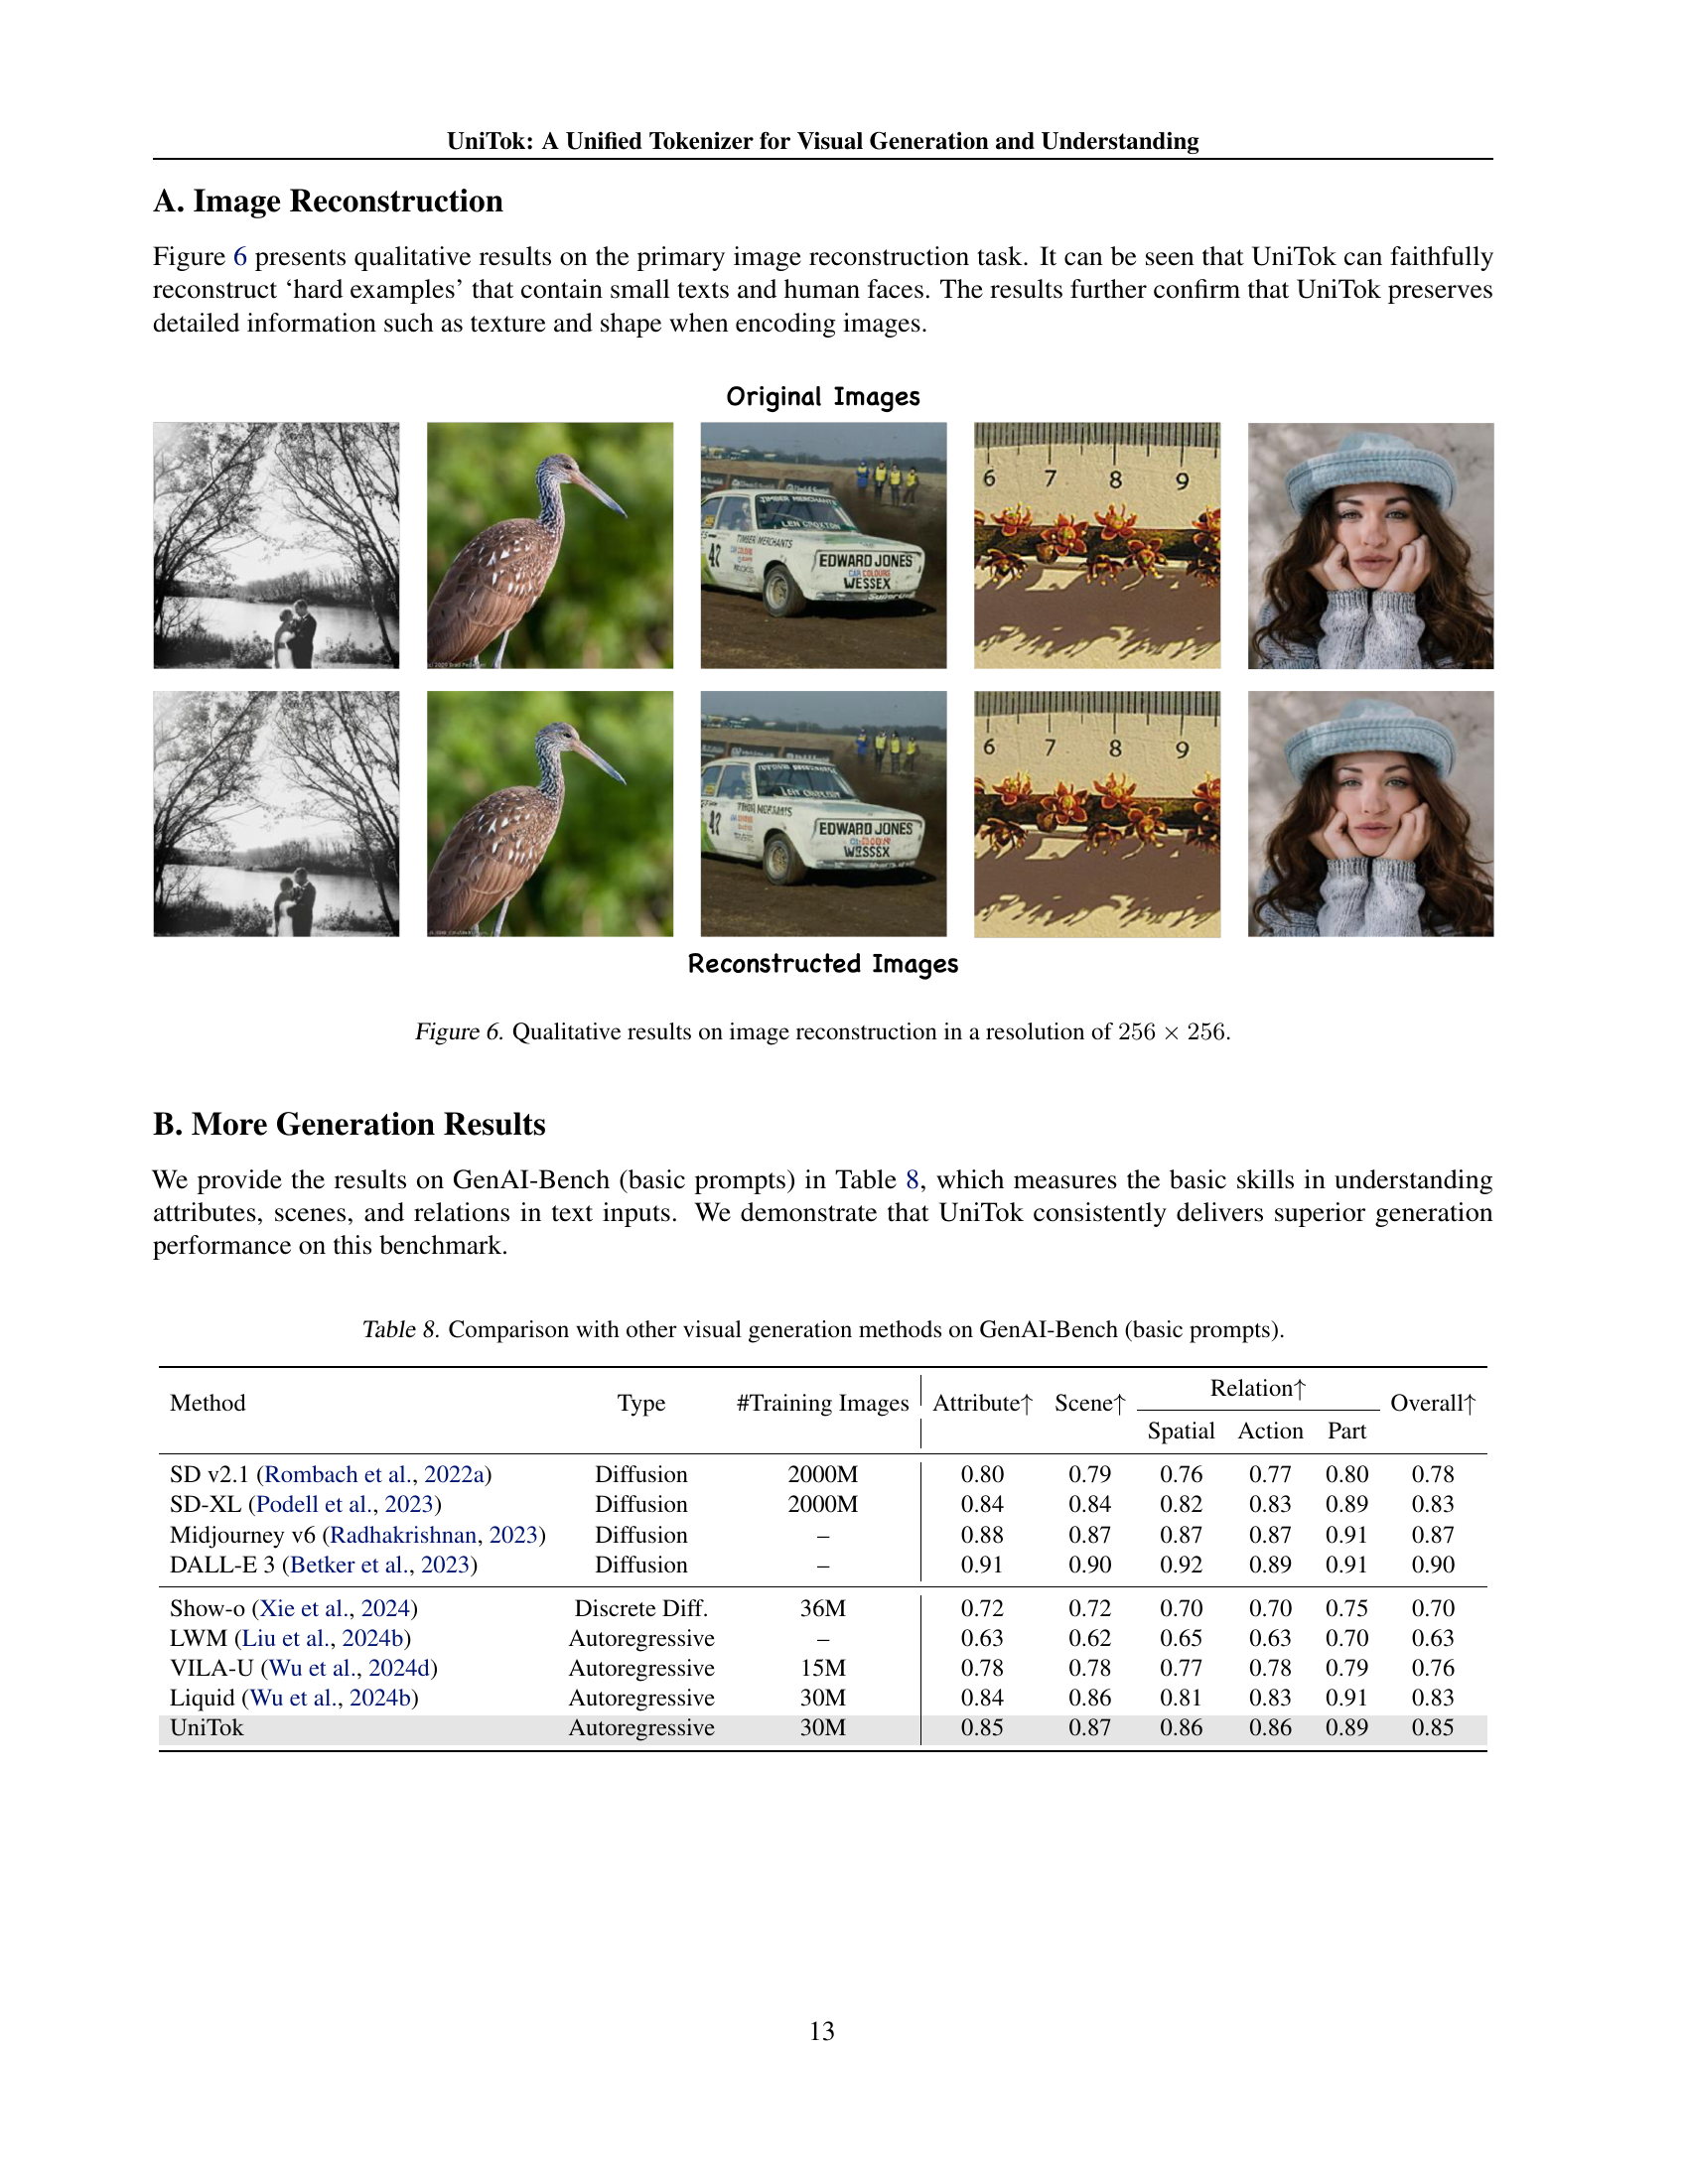
🔼 Figure 6 displays qualitative results demonstrating UniTok’s image reconstruction capabilities at a resolution of 256x256 pixels. The figure presents several example image pairs: the original image and its reconstruction by UniTok. This visual comparison showcases UniTok’s ability to accurately reconstruct images, including fine details such as text and facial features, even in complex scenes.
read the caption
Figure 6: Qualitative results on image reconstruction in a resolution of 256×256256256256\times 256256 × 256.
More on tables
| Method | LLM | Token Type | Res. | VQAv2 | GQA | TextVQA | POPE | MME | MM-Vet |
| Emu (Sun et al., 2023) | Llama-13B | Continuous | 224 | 52.0 | - | - | - | - | - |
| LaVIT (Jin et al., 2023) | Llama-7B | Continuous | 224 | 66.0 | 46.8 | - | - | - | - |
| DreamLLM (Dong et al., 2023) | Vicuna-7B | Continuous | 224 | 72.9 | - | 41.8 | - | - | 26.6 |
| Unified-IO 2 (Lu et al., 2024) | 6.8B from scratch | Continuous | 384 | 79.4 | - | - | 87.7 | - | - |
| Janus (Wu et al., 2024a) | DeepSeek-1.3B | Continuous | 384 | 77.3 | 59.1 | - | 87.0 | 1338 | 34.3 |
| CM3Leon (Yu et al., 2023c) | 7B from scratch | Discrete | 256 | 47.6 | - | - | - | - | - |
| LWM (Liu et al., 2024b) | Llama-2-7B | Discrete | 256 | 55.8 | 44.8 | 18.8 | 75.2 | - | - |
| Show-o (Xie et al., 2024) | Phi-1.5-1.3B | Discrete | 256 | 59.3 | 48.7 | - | 73.8 | 948 | - |
| Chameleon (Team, 2024) | 34B from scratch | Discrete | 512 | 69.6 | - | - | - | - | |
| Liquid (Wu et al., 2024b) | Gemma-7B | Discrete | 512 | 71.3 | 58.4 | 42.4 | 81.1 | 1119 | - |
| VILA-U (Wu et al., 2024d) | Llama-2-7B | Discrete | 256 | 75.3 | 58.3 | 48.3 | 83.9 | 1336 | 27.7 |
| UniTok | Llama-2-7B | Discrete | 256 | 76.8 | 61.1 | 51.6 | 83.2 | 1448 | 33.9 |
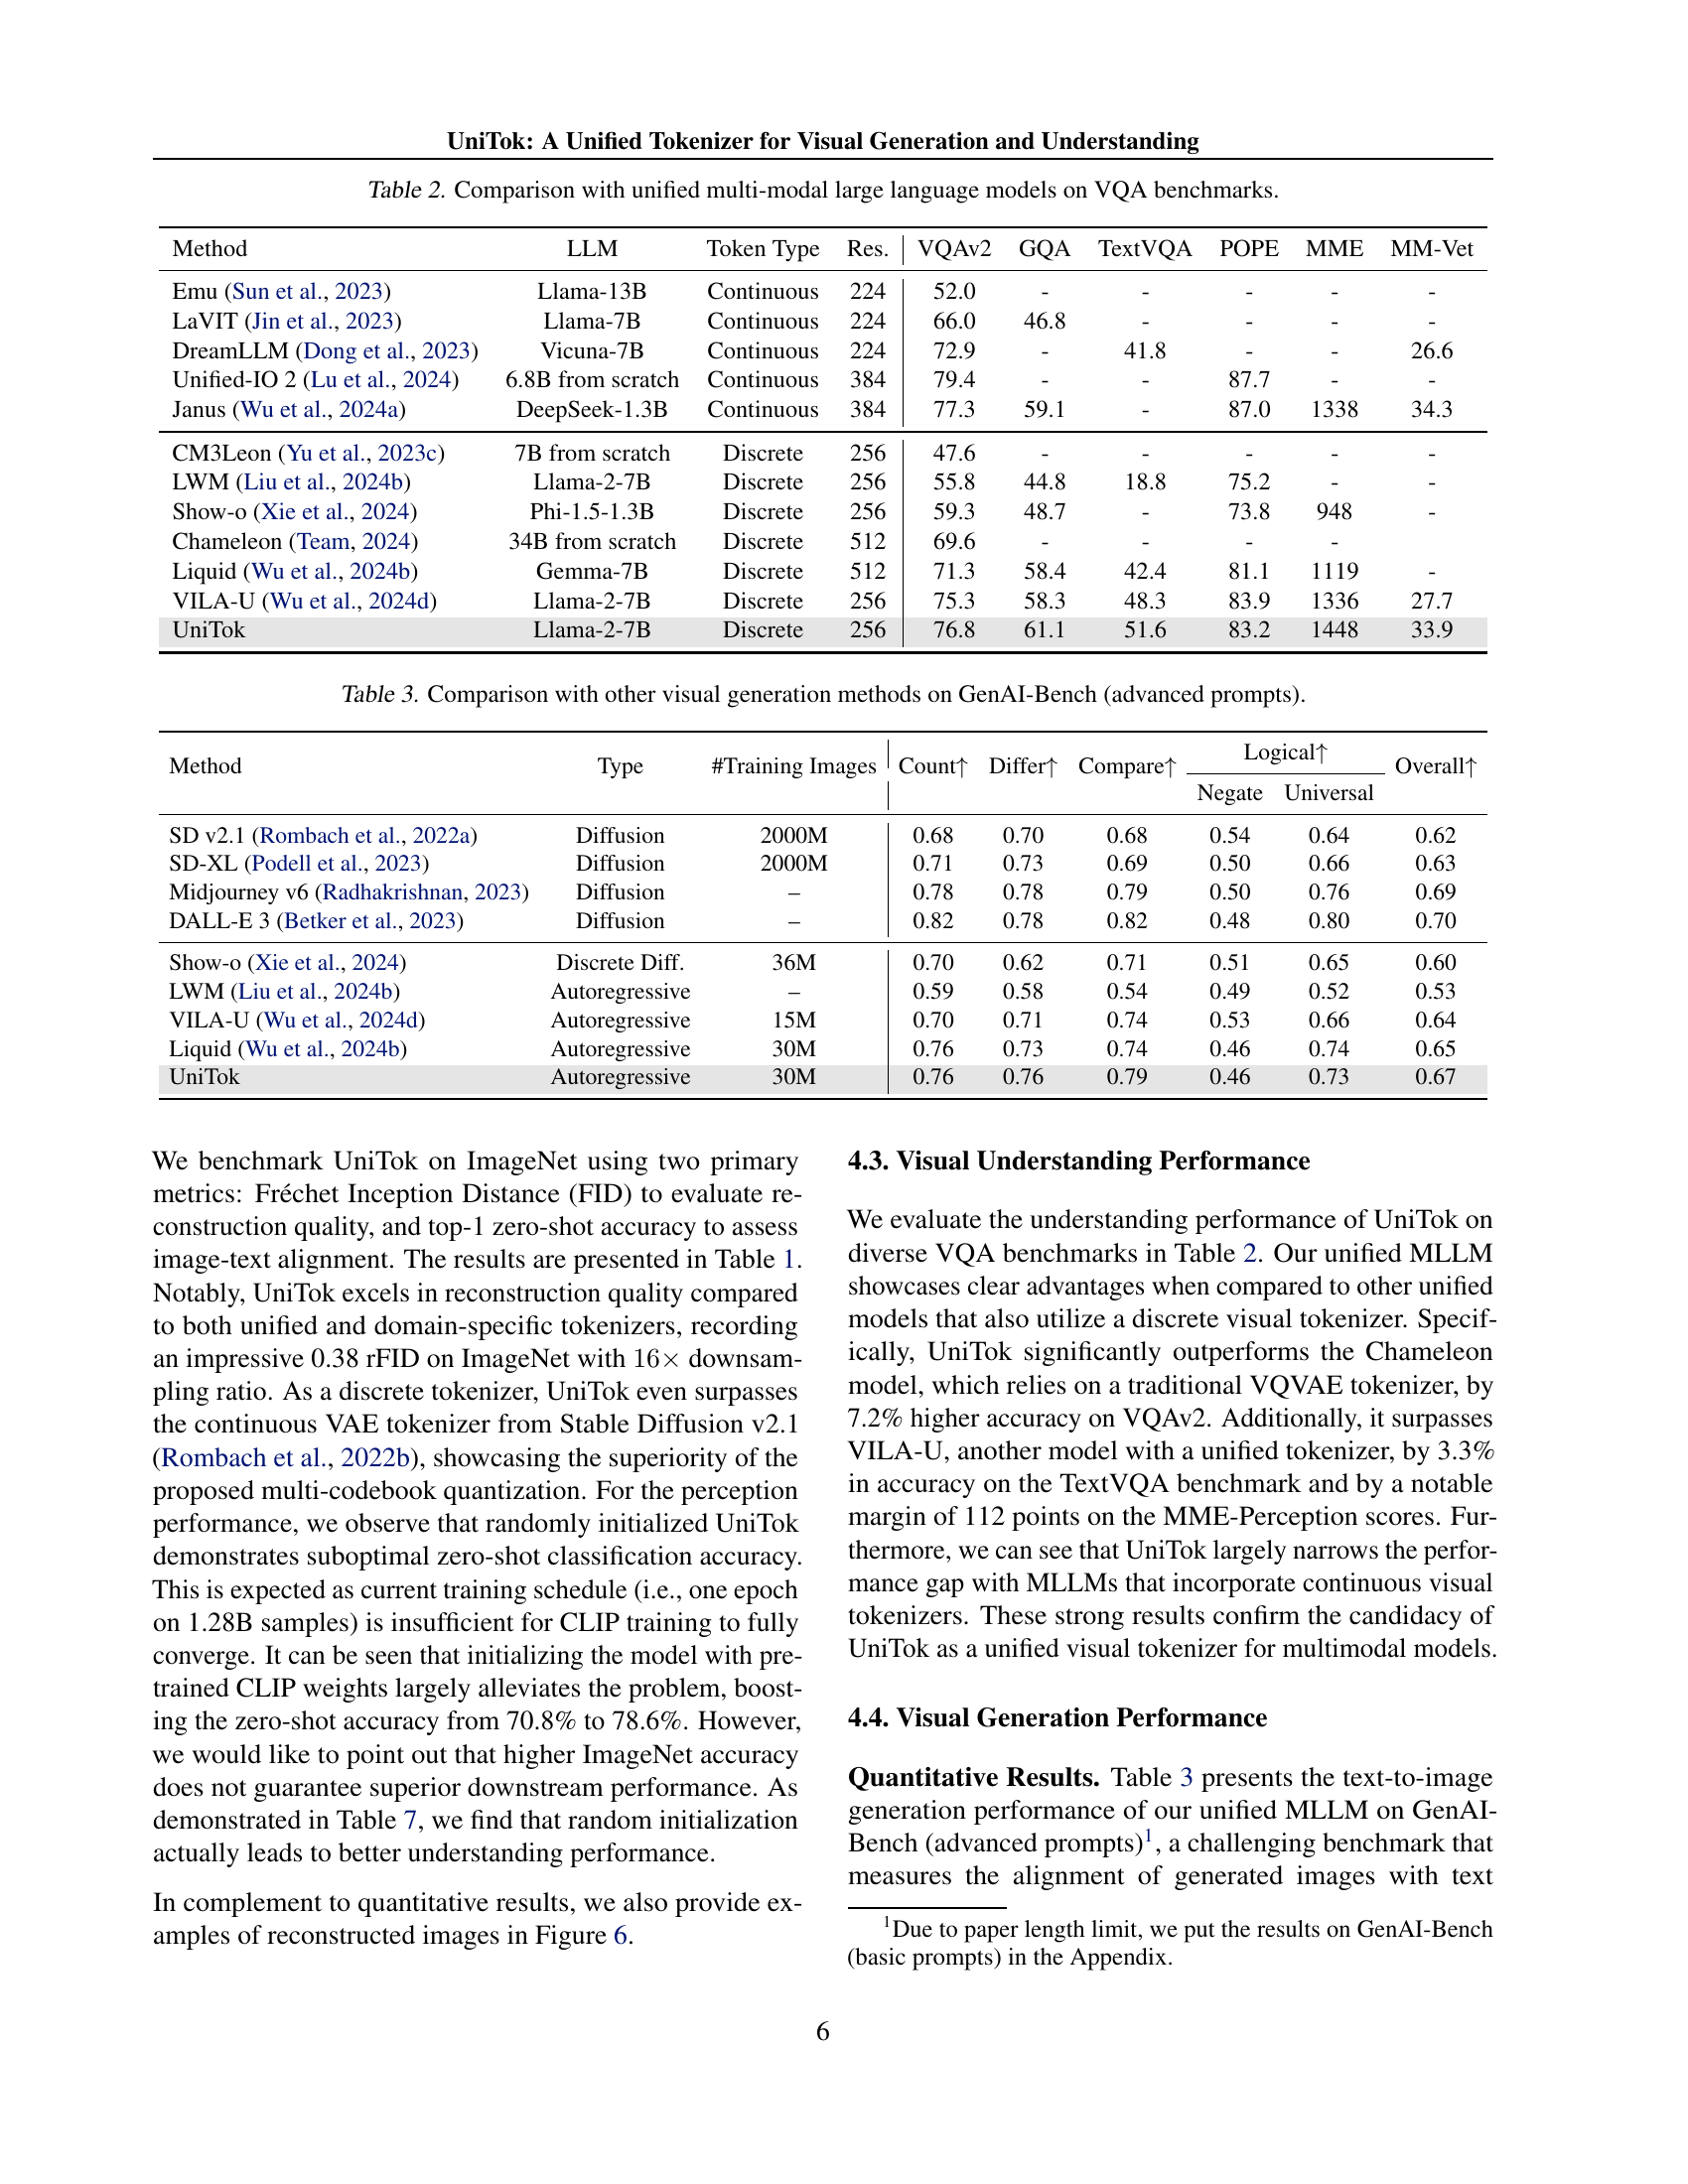
🔼 This table compares the performance of various unified multi-modal large language models (MLLMs) on several Visual Question Answering (VQA) benchmark datasets. It shows the accuracy of each model on various VQA tasks (VQAv2, GQA, TextVQA, POPE, MME, MM-Vet) along with details such as the underlying large language model (LLM) used, the type of visual tokenization (continuous or discrete), the resolution of the images used in the evaluation, and the source of the visual tokens. This allows for a comprehensive comparison of different approaches to integrating vision and language within MLLMs, highlighting strengths and weaknesses of various architectures.
read the caption
Table 2: Comparison with unified multi-modal large language models on VQA benchmarks.
| Method | Type | #Training Images | Count | Differ | Compare | Logical | Overall | |
| Negate | Universal | |||||||
| SD v2.1 (Rombach et al., 2022a) | Diffusion | 2000M | 0.68 | 0.70 | 0.68 | 0.54 | 0.64 | 0.62 |
| SD-XL (Podell et al., 2023) | Diffusion | 2000M | 0.71 | 0.73 | 0.69 | 0.50 | 0.66 | 0.63 |
| Midjourney v6 (Radhakrishnan, 2023) | Diffusion | – | 0.78 | 0.78 | 0.79 | 0.50 | 0.76 | 0.69 |
| DALL-E 3 (Betker et al., 2023) | Diffusion | – | 0.82 | 0.78 | 0.82 | 0.48 | 0.80 | 0.70 |
| Show-o (Xie et al., 2024) | Discrete Diff. | 36M | 0.70 | 0.62 | 0.71 | 0.51 | 0.65 | 0.60 |
| LWM (Liu et al., 2024b) | Autoregressive | – | 0.59 | 0.58 | 0.54 | 0.49 | 0.52 | 0.53 |
| VILA-U (Wu et al., 2024d) | Autoregressive | 15M | 0.70 | 0.71 | 0.74 | 0.53 | 0.66 | 0.64 |
| Liquid (Wu et al., 2024b) | Autoregressive | 30M | 0.76 | 0.73 | 0.74 | 0.46 | 0.74 | 0.65 |
| UniTok | Autoregressive | 30M | 0.76 | 0.76 | 0.79 | 0.46 | 0.73 | 0.67 |
🔼 This table compares the performance of UniTok against other visual generation methods on the GenAI-Bench benchmark, specifically using advanced prompts. The comparison considers several aspects of image generation quality, including the ability to correctly capture attributes, scenes, relations, spatial aspects, and actions within the generated image in response to a given prompt. The metrics used allow for a nuanced evaluation of how well different models handle complex and nuanced textual instructions, beyond basic image generation capabilities. UniTok’s performance is benchmarked against various diffusion and autoregressive models, indicating its competitive standing in this area.
read the caption
Table 3: Comparison with other visual generation methods on GenAI-Bench (advanced prompts).
| Method | Type | Res. | FID |
|---|---|---|---|
| SD-XL (Podell et al., 2023) | Diffusion | 1024 | 9.55 |
| PixArt (Chen et al., 2023) | Diffusion | 1024 | 6.14 |
| Playground (Li et al., 2024a) | Diffusion | 1024 | 4.48 |
| Liquid (Wu et al., 2024b) | Autoregressive | 512 | 5.47 |
| Janus (Wu et al., 2024a) | Autoregressive | 384 | 10.10 |
| LWM (Liu et al., 2024b) | Autoregressive | 256 | 17.77 |
| Show-o (Xie et al., 2024) | Discrete Diff. | 256 | 15.18 |
| VILA-U (Wu et al., 2024d) | Autoregressive | 256 | 12.81 |
| UniTok | Autoregressive | 256 | 7.46 |
🔼 This table presents a quantitative comparison of various visual generation models on the MJHQ-30K benchmark. It shows the FID score (lower is better) achieved by each model at different resolutions (Res), indicating the quality of generated images. The ‘Type’ column specifies the architecture of each model (e.g., Diffusion, Autoregressive). This provides insight into how different model architectures perform at various image resolutions in terms of visual fidelity.
read the caption
Table 4: Results on MJHQ-30K.
| Supervision | Generation | Understanding | ||||||
|---|---|---|---|---|---|---|---|---|
| rFID | gFID | VQAv2 | GQA | SciQA | TextVQA | POPE | MME | |
| Contrastive | – | – | 68.95 | 56.89 | 65.64 | 49.89 | 82.34 | 1373 |
| Reconstruction | 0.82 | 3.59 | 56.33 | 47.53 | 63.26 | 43.65 | 77.09 | 902 |
| Recon. + Contra. | 0.72 | 3.26 | 69.14 | 56.06 | 65.25 | 49.22 | 81.42 | 1333 |
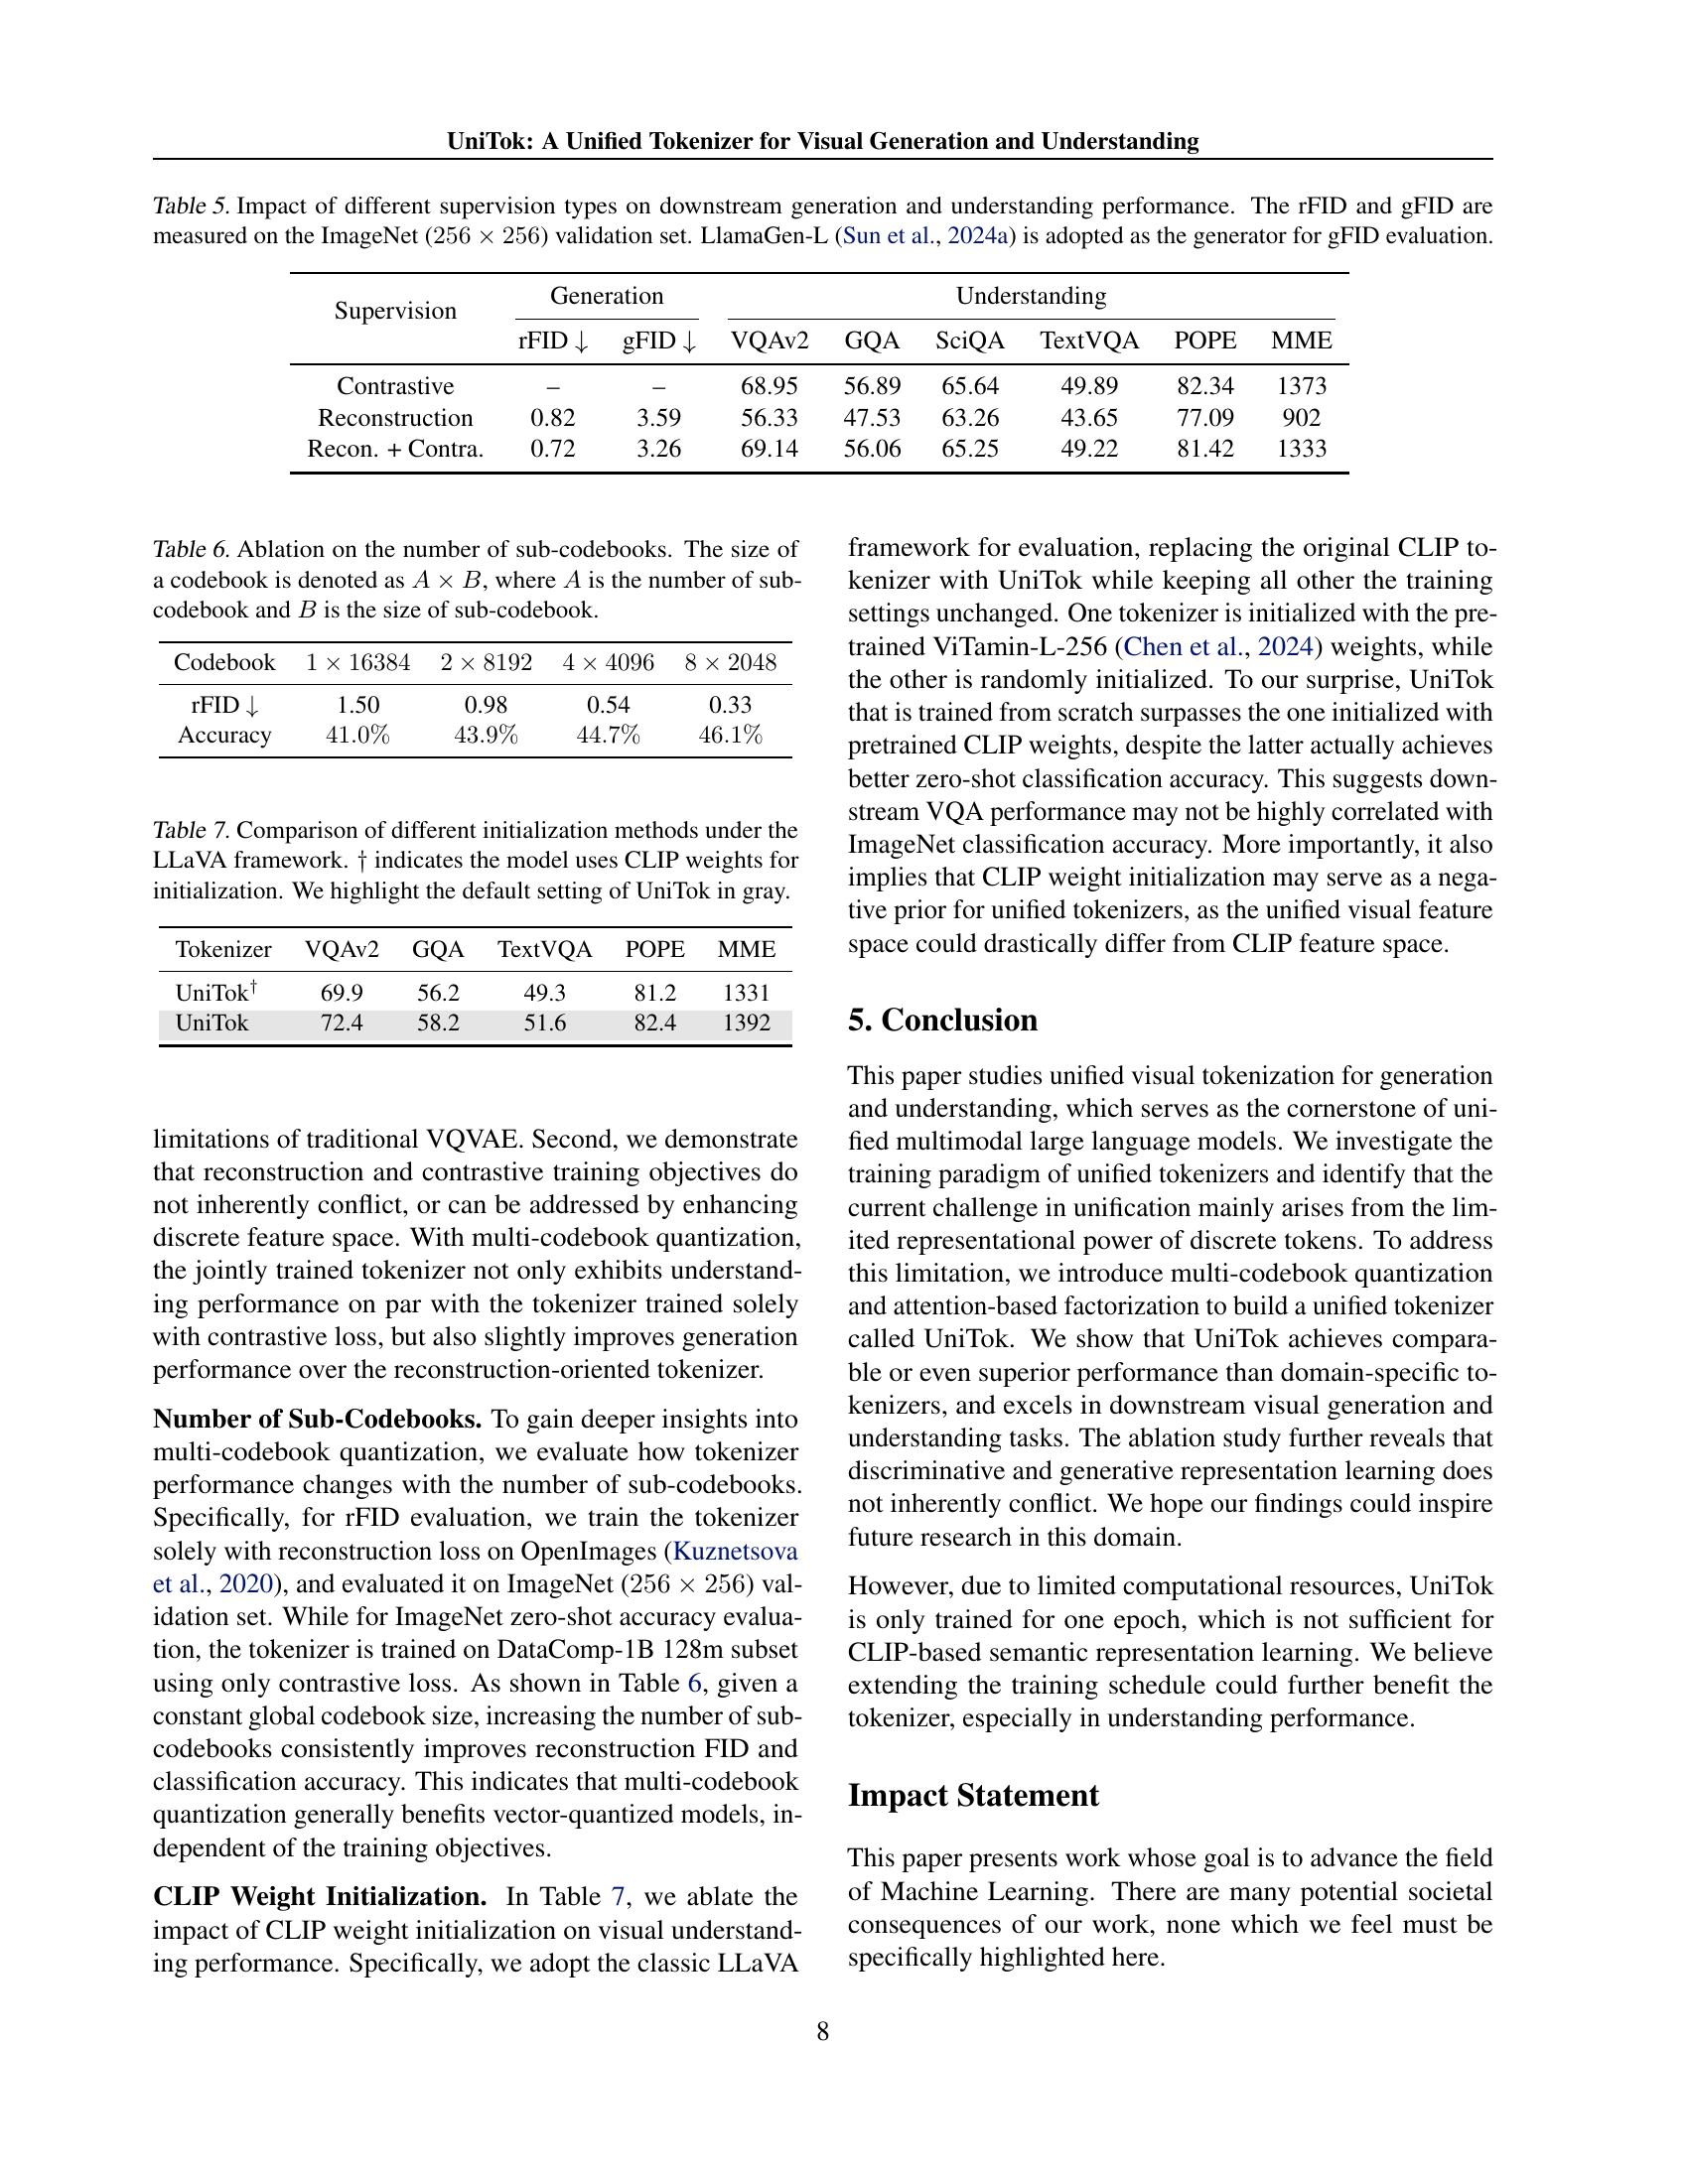
🔼 This table presents an ablation study on the impact of different supervision methods (reconstruction loss, contrastive loss, and a combination of both) used during the training of a unified visual tokenizer. It shows the resulting performance on downstream tasks, including image generation and visual understanding. The evaluation metrics are rFID and gFID for image generation (measured on the ImageNet validation set at 256x256 resolution), and several VQA scores for visual understanding. LlamaGen-L is used as the generator for gFID calculation.
read the caption
Table 5: Impact of different supervision types on downstream generation and understanding performance. The rFID and gFID are measured on the ImageNet (256×256256256256\times 256256 × 256) validation set. LlamaGen-L (Sun et al., 2024a) is adopted as the generator for gFID evaluation.
| Codebook | ||||
|---|---|---|---|---|
| rFID | 1.50 | 0.98 | 0.54 | 0.33 |
| Accuracy |
🔼 This table presents an ablation study on the impact of the number of sub-codebooks used in the UniTok model. It shows how varying the number of sub-codebooks (A) while maintaining a constant total codebook size (A * B) affects the model’s performance. The results demonstrate the trade-off between the number of sub-codebooks and model performance, specifically regarding reconstruction FID (rFID) and accuracy.
read the caption
Table 6: Ablation on the number of sub-codebooks. The size of a codebook is denoted as A×B𝐴𝐵A\times Bitalic_A × italic_B, where A𝐴Aitalic_A is the number of sub-codebook and B𝐵Bitalic_B is the size of sub-codebook.
| Tokenizer | VQAv2 | GQA | TextVQA | POPE | MME |
|---|---|---|---|---|---|
| UniTok† | 69.9 | 56.2 | 49.3 | 81.2 | 1331 |
| UniTok | 72.4 | 58.2 | 51.6 | 82.4 | 1392 |
🔼 This table compares the performance of UniTok models initialized with different methods within the LLaVA framework. Specifically, it contrasts the results of UniTok models initialized with pretrained CLIP weights against those initialized randomly. The performance is evaluated across multiple Visual Question Answering (VQA) benchmarks (VQAv2, GQA, TextVQA, POPE, MME). The default settings for UniTok are highlighted for easier comparison.
read the caption
Table 7: Comparison of different initialization methods under the LLaVA framework. ††\dagger† indicates the model uses CLIP weights for initialization. We highlight the default setting of UniTok in gray.
| Method | Type | #Training Images | Attribute | Scene | Relation | Overall | ||
| Spatial | Action | Part | ||||||
| SD v2.1 (Rombach et al., 2022a) | Diffusion | 2000M | 0.80 | 0.79 | 0.76 | 0.77 | 0.80 | 0.78 |
| SD-XL (Podell et al., 2023) | Diffusion | 2000M | 0.84 | 0.84 | 0.82 | 0.83 | 0.89 | 0.83 |
| Midjourney v6 (Radhakrishnan, 2023) | Diffusion | – | 0.88 | 0.87 | 0.87 | 0.87 | 0.91 | 0.87 |
| DALL-E 3 (Betker et al., 2023) | Diffusion | – | 0.91 | 0.90 | 0.92 | 0.89 | 0.91 | 0.90 |
| Show-o (Xie et al., 2024) | Discrete Diff. | 36M | 0.72 | 0.72 | 0.70 | 0.70 | 0.75 | 0.70 |
| LWM (Liu et al., 2024b) | Autoregressive | – | 0.63 | 0.62 | 0.65 | 0.63 | 0.70 | 0.63 |
| VILA-U (Wu et al., 2024d) | Autoregressive | 15M | 0.78 | 0.78 | 0.77 | 0.78 | 0.79 | 0.76 |
| Liquid (Wu et al., 2024b) | Autoregressive | 30M | 0.84 | 0.86 | 0.81 | 0.83 | 0.91 | 0.83 |
| UniTok | Autoregressive | 30M | 0.85 | 0.87 | 0.86 | 0.86 | 0.89 | 0.85 |
🔼 This table compares the performance of various visual generation models, including UniTok, on the GenAI-Bench benchmark using basic prompts. It assesses the models’ abilities in understanding and generating images based on textual descriptions, specifically evaluating their performance across attributes, scenes, relations, spatial arrangement, action, parts, and an overall score. The metrics used are crucial for judging the quality and complexity of image generation, reflecting the models’ grasp of fundamental visual concepts and relationships.
read the caption
Table 8: Comparison with other visual generation methods on GenAI-Bench (basic prompts).
Full paper#