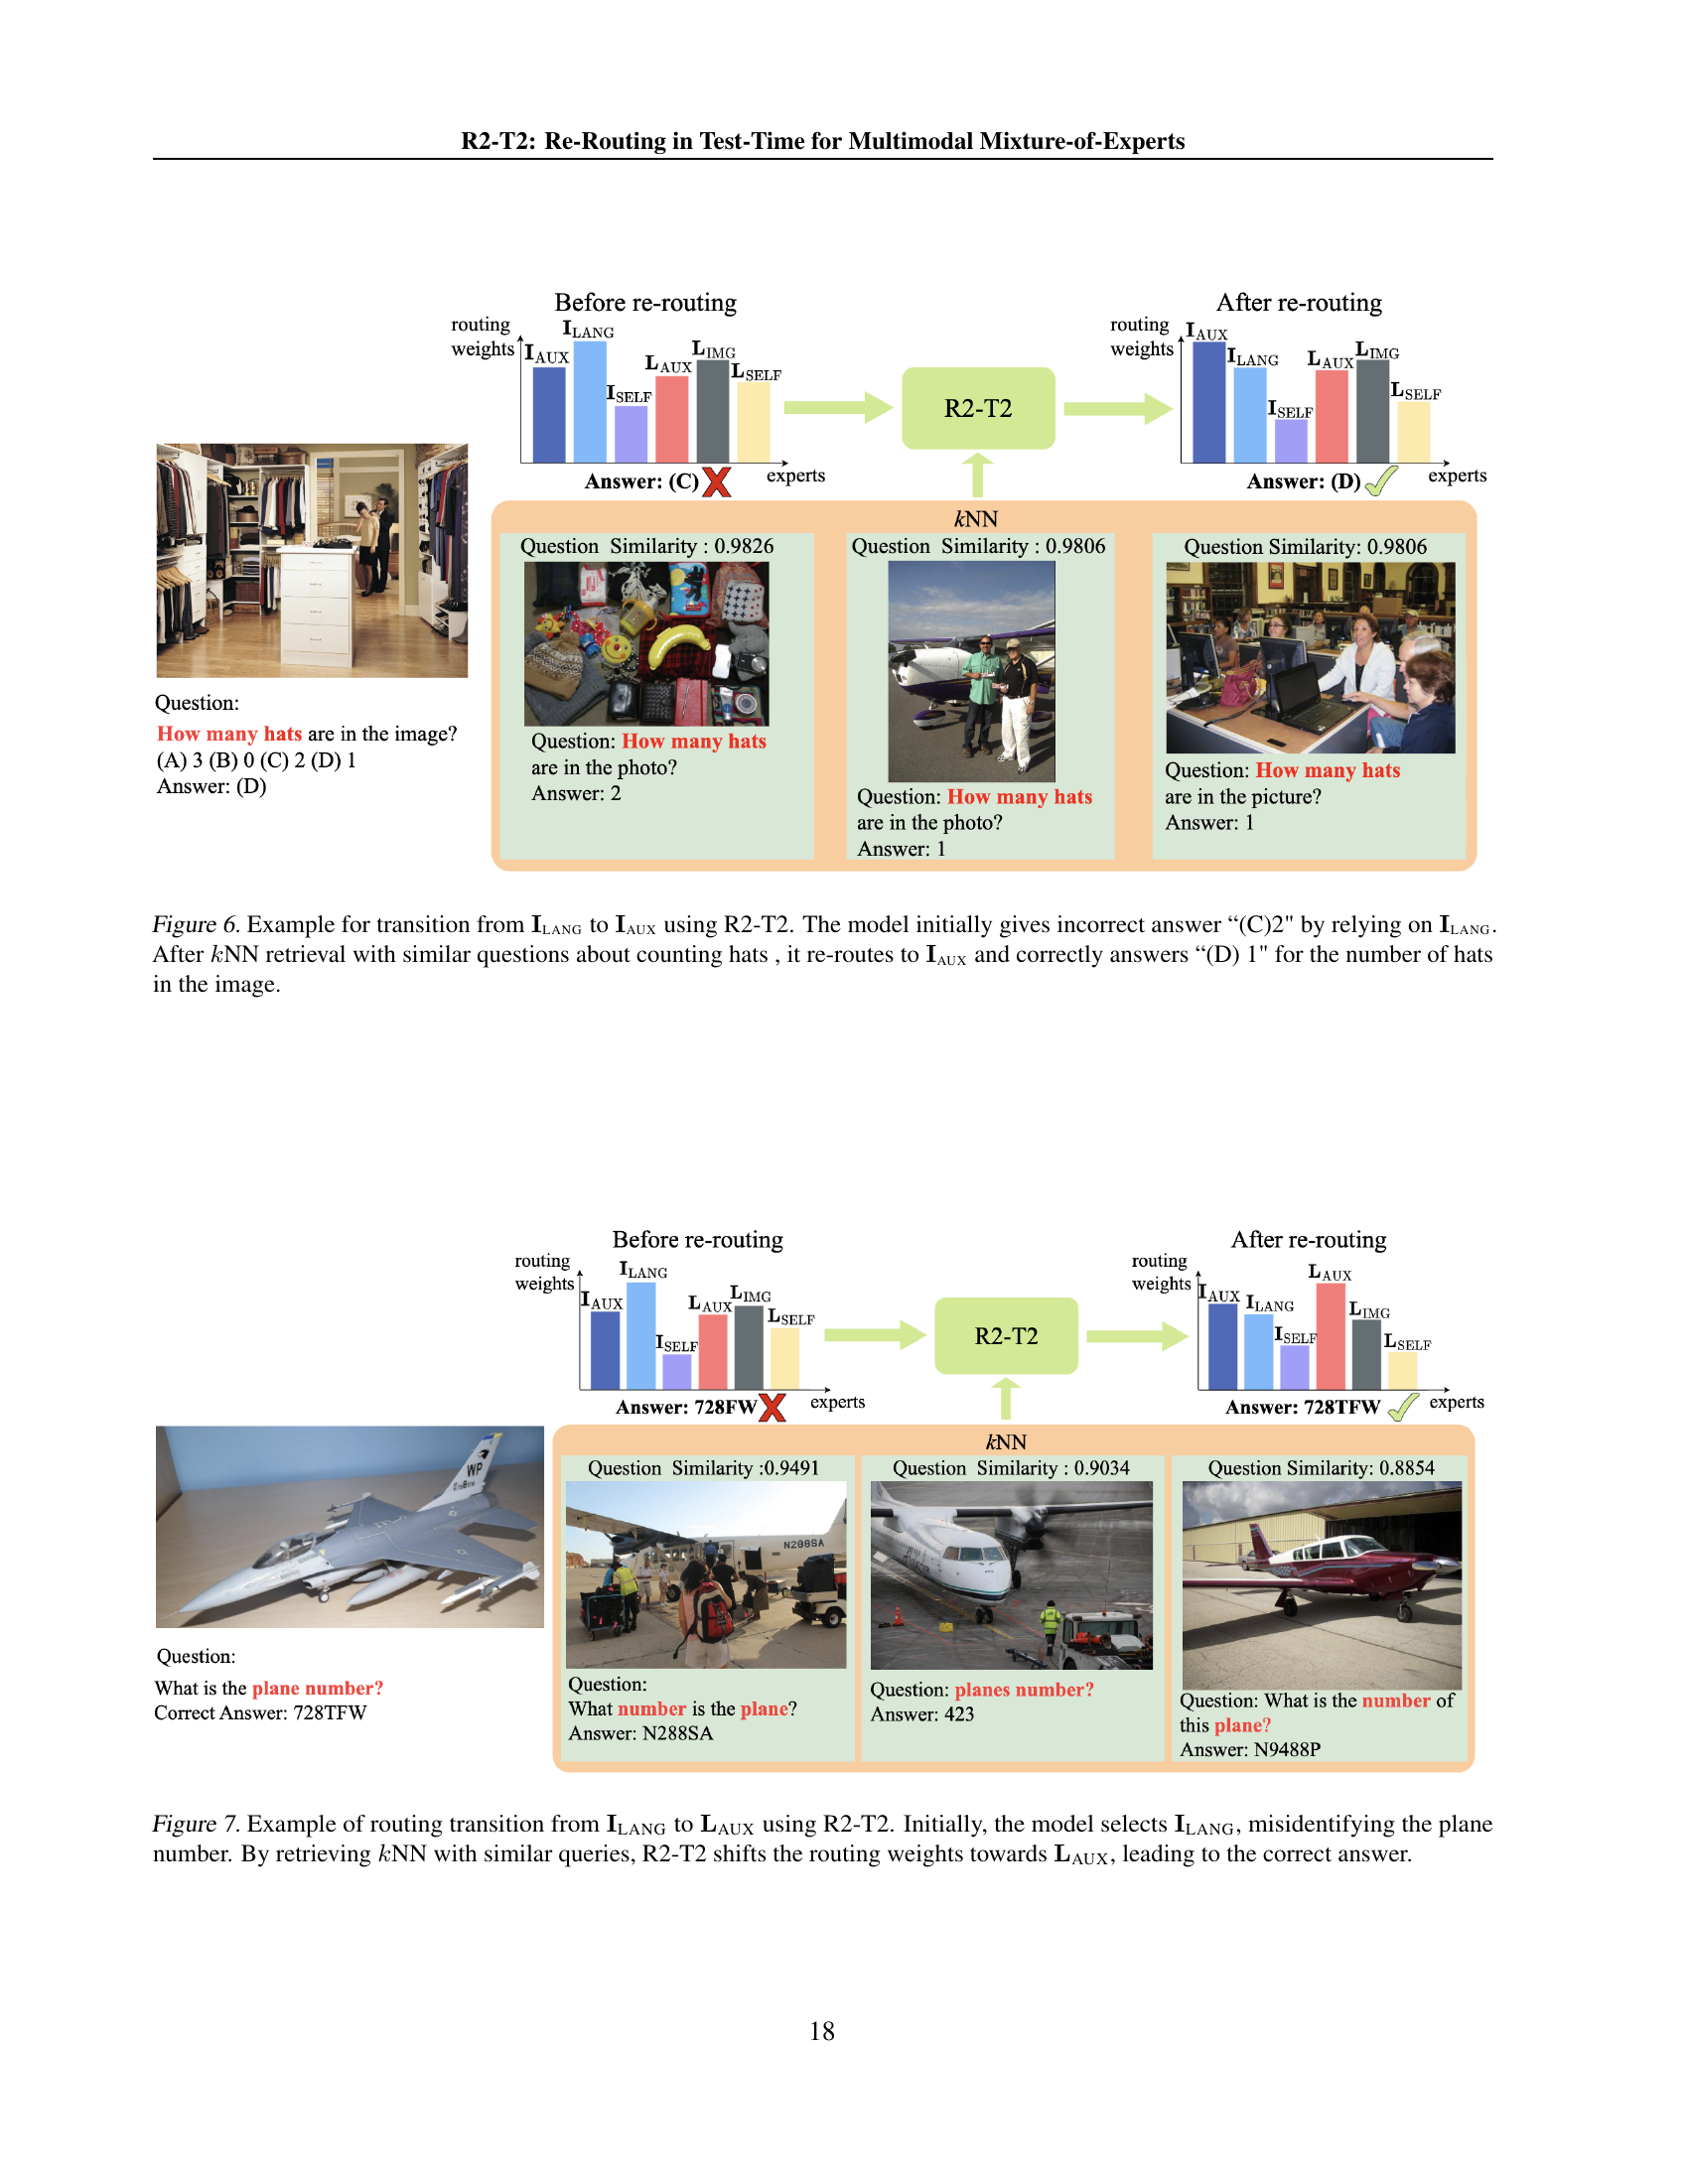
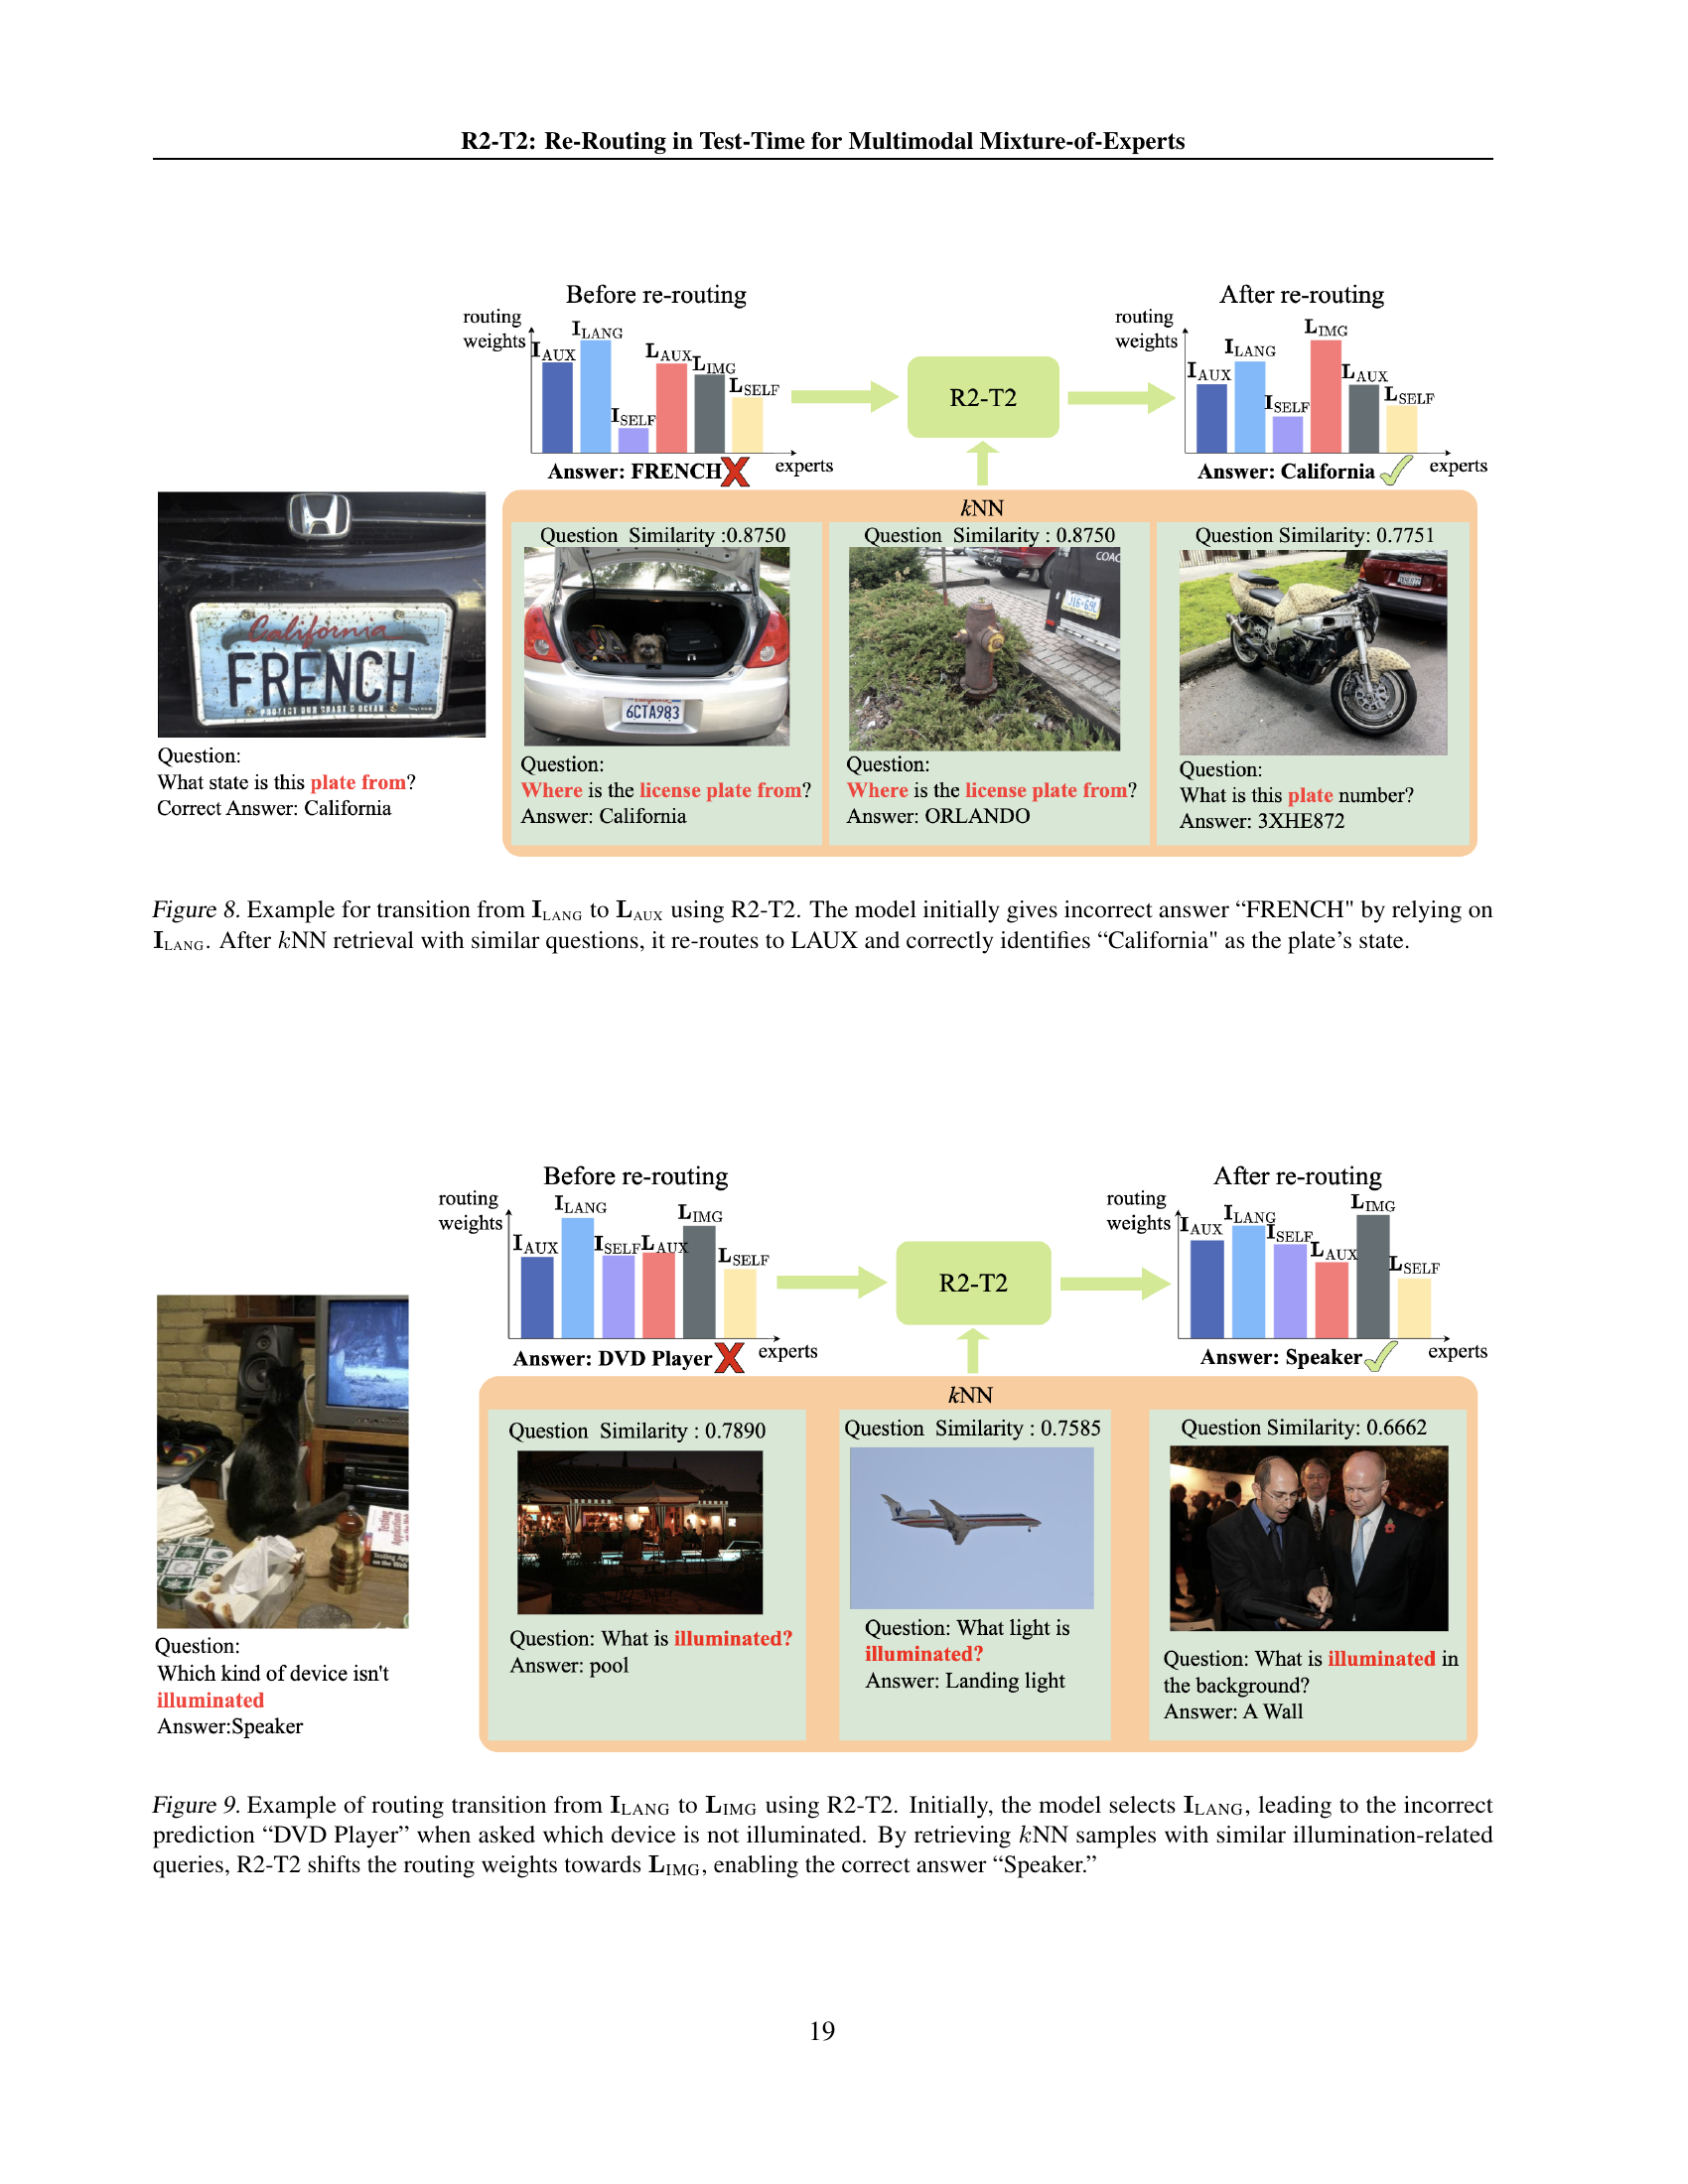
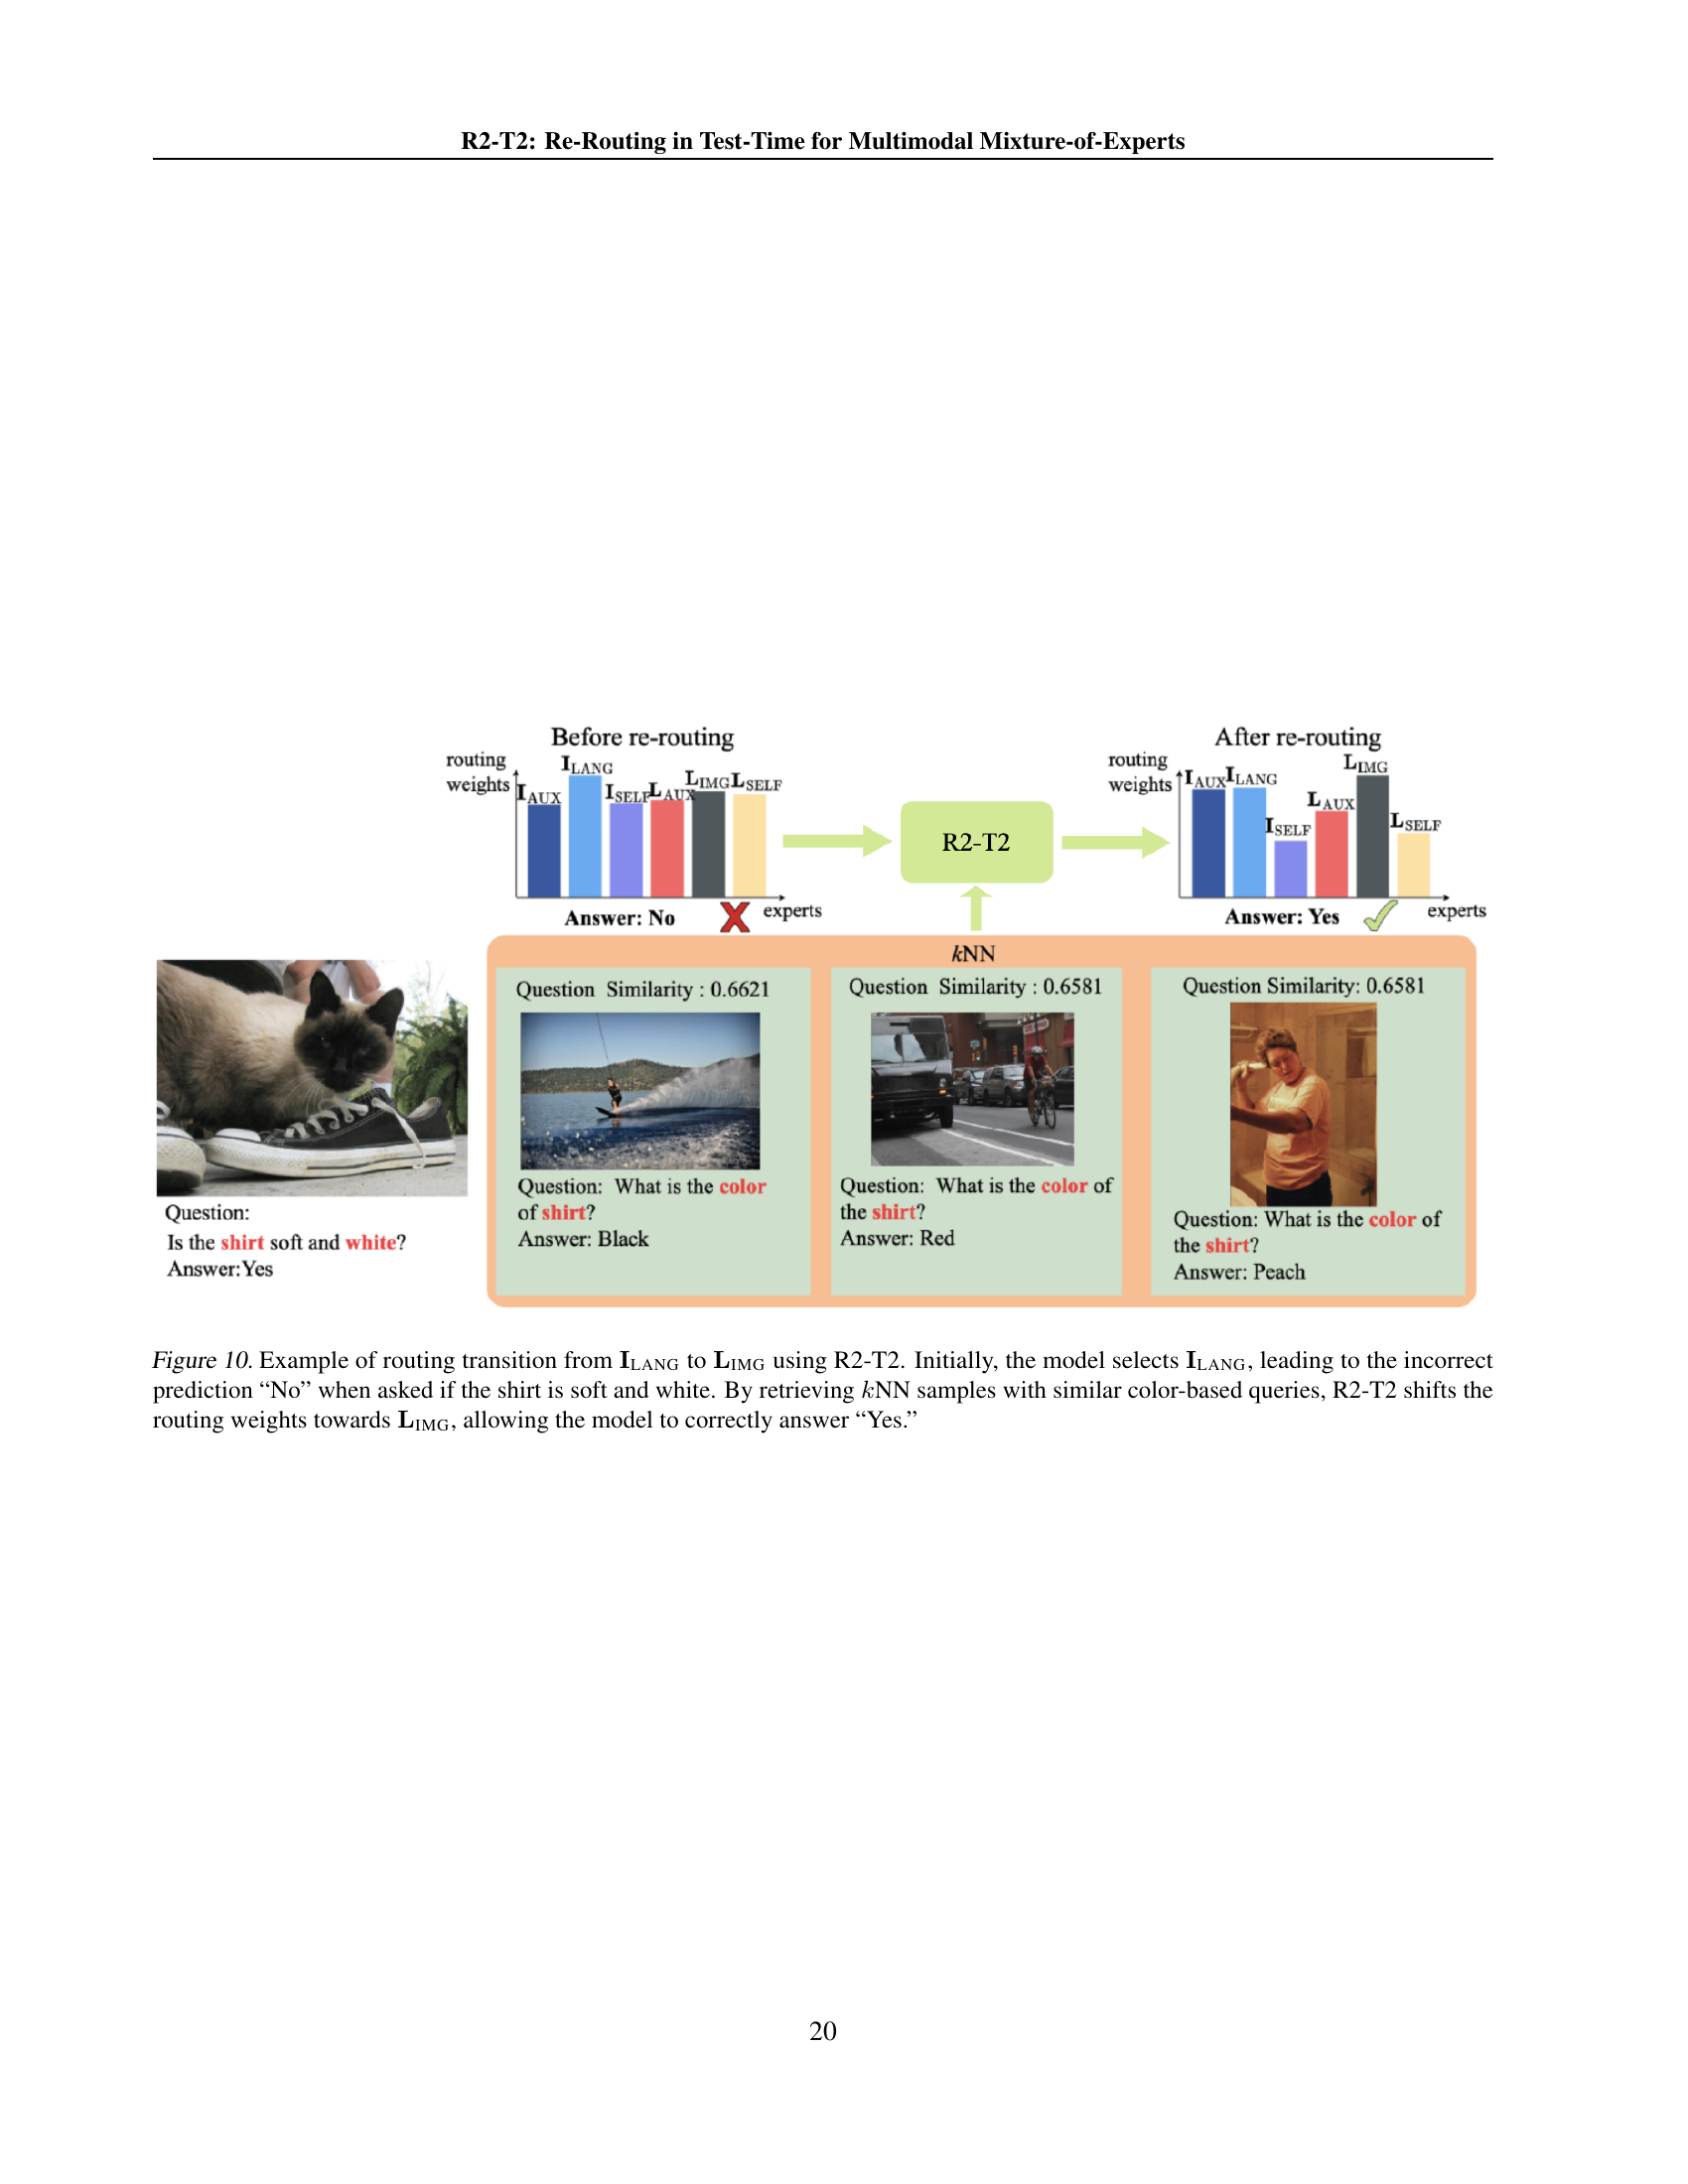
TL;DR#
Large Multimodal Models (LMMs) often underperform due to limitations in perceiving non-language modalities. Recent efforts mitigate this by using Mixture-of-Experts (MoE) to provide diverse representations. However, the router, which mixes experts, can be suboptimal for test samples, hindering performance. This paper addresses this issue by improving routing weights during test time.
The authors propose “Re-Routing in Test-Time (R2-T2)”, a method that optimizes routing weights locally. R2-T2 enhances performance by locally optimizing routing weights towards those of correctly predicted neighboring samples. They introduce three R2-T2 strategies with different optimization objectives, consistently improving LMM performance without training base-model parameters.
Key Takeaways#
Why does it matter?#
This work introduces a novel test-time adaptation method, R2-T2, for multimodal MoE models, improving performance without retraining. This approach tackles the critical issue of routing optimization, offering a new direction for enhancing LMMs’ adaptability and robustness across diverse tasks, potentially unlocking greater generalization capabilities.
Visual Insights#

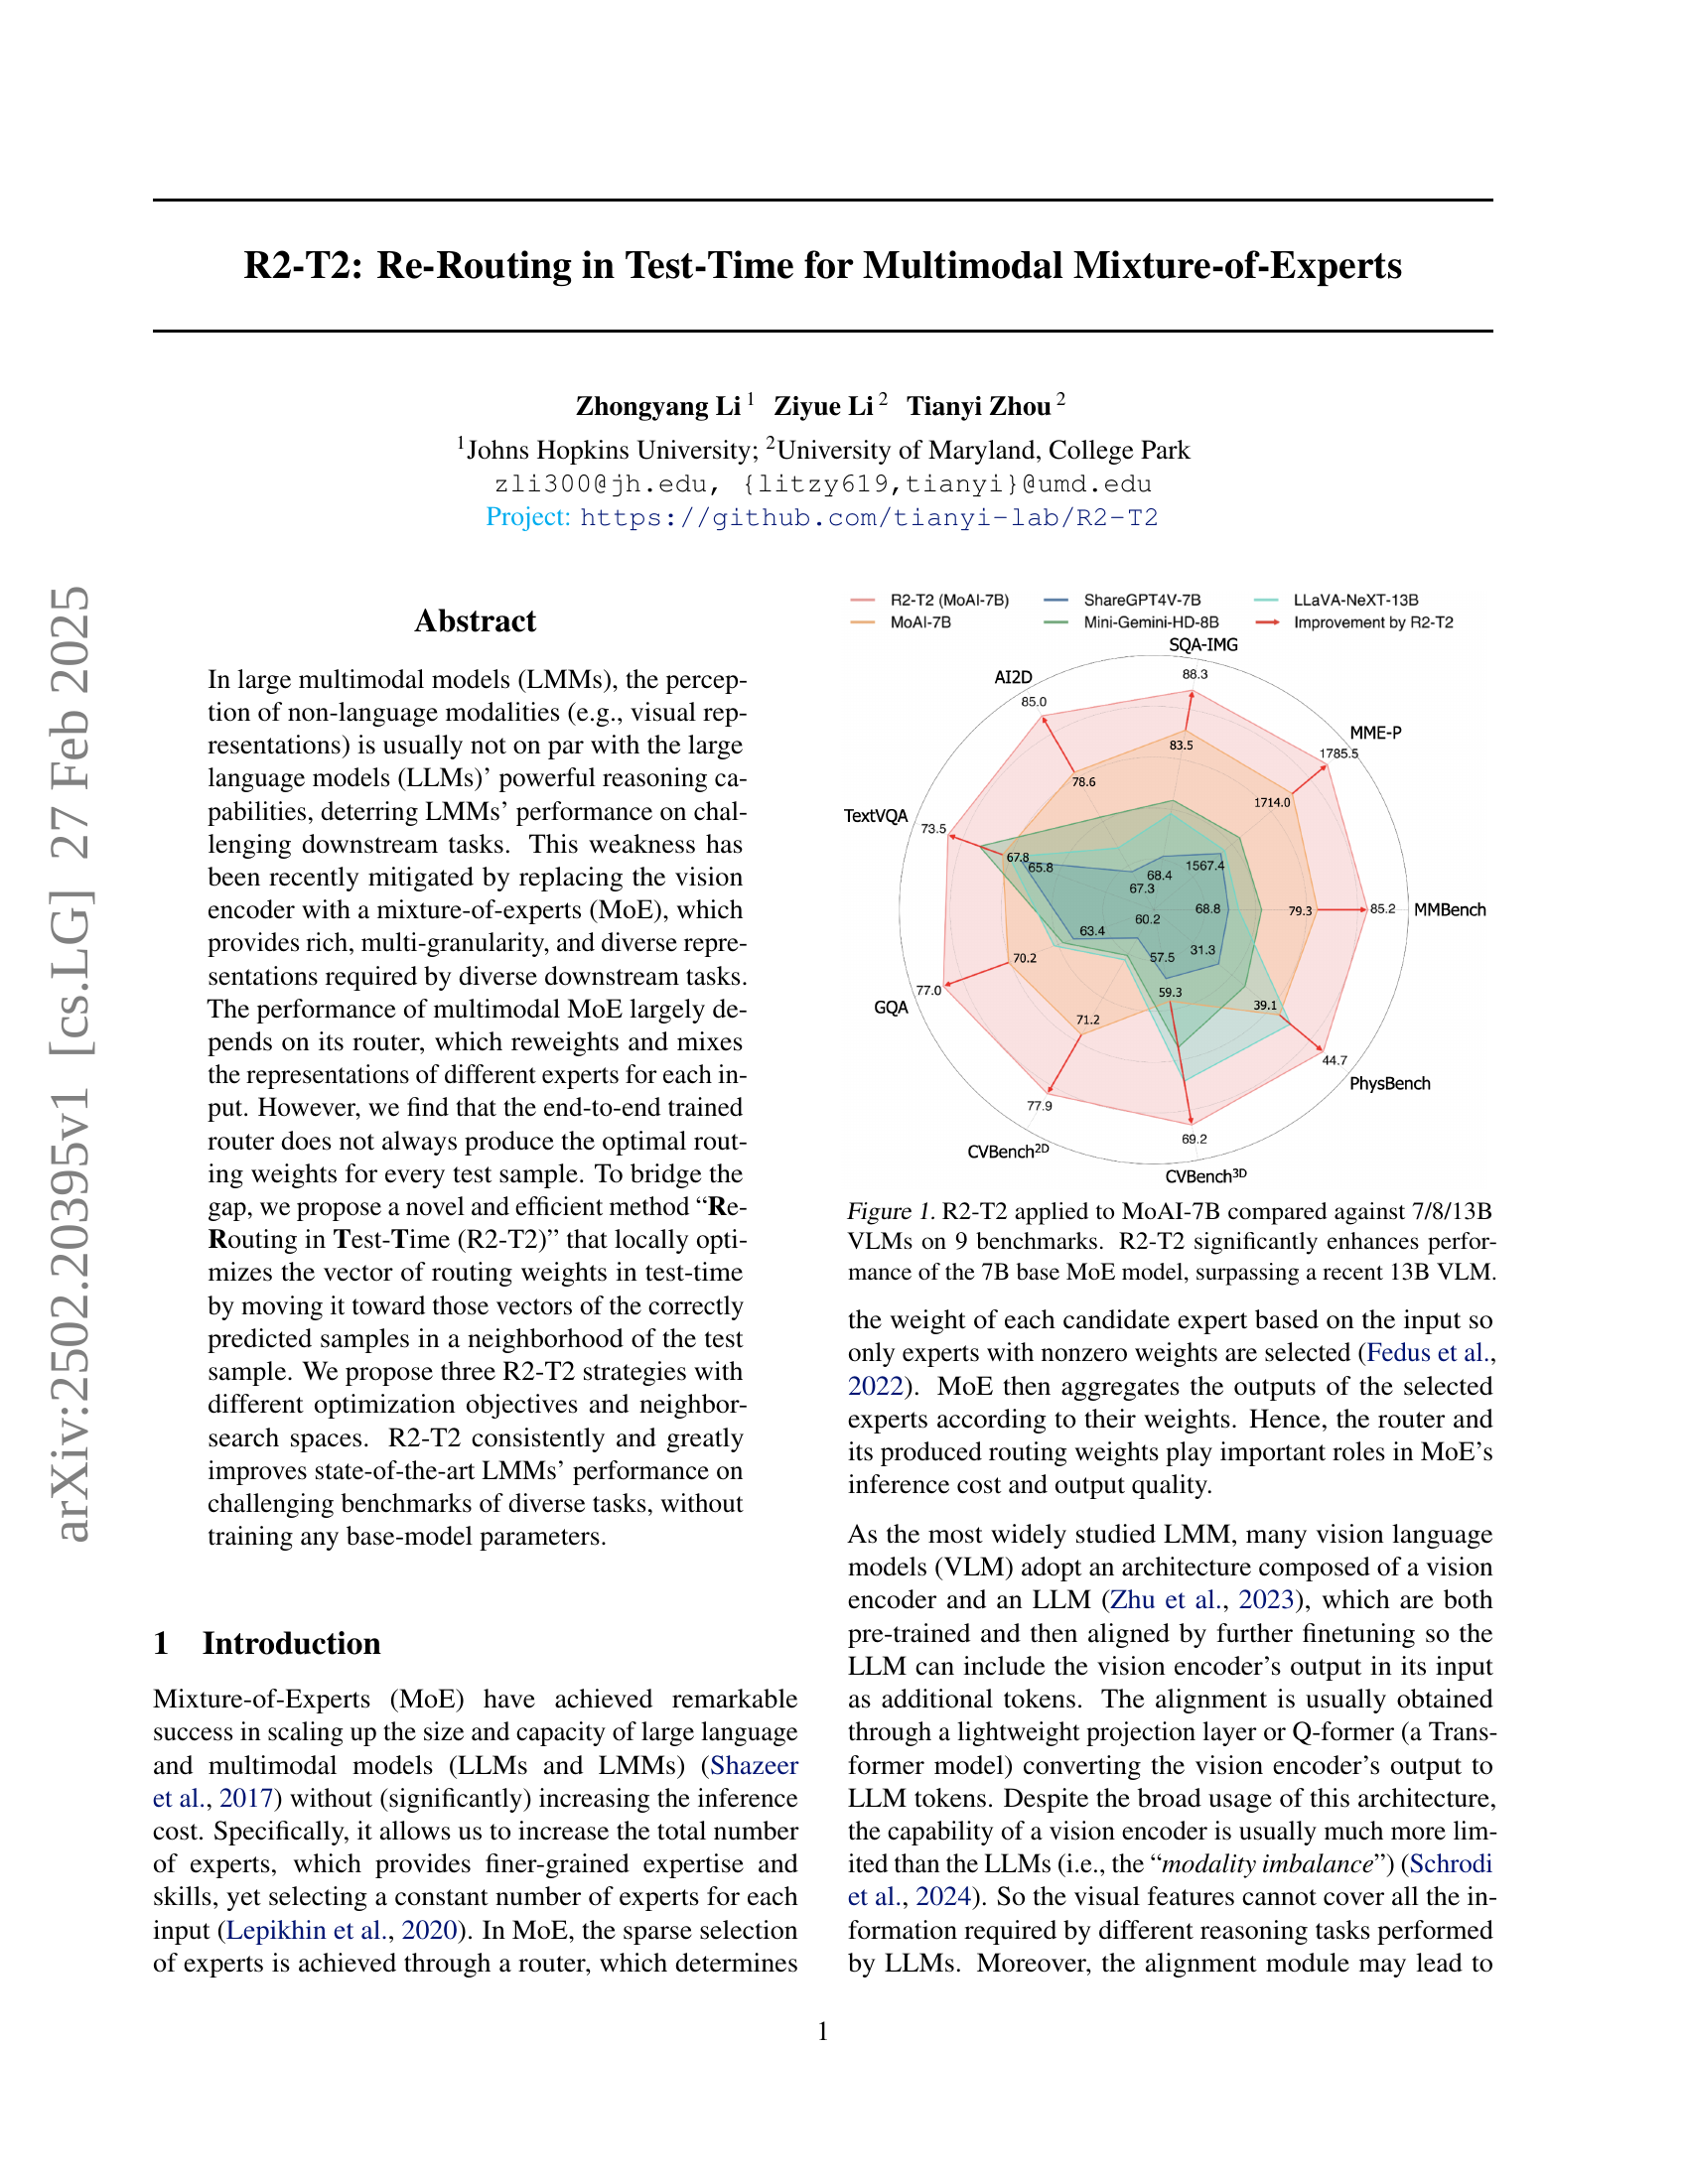
🔼 This figure displays a comparison of the performance of the R2-T2 method applied to the MoAI-7B model against various other Vision-Language Models (VLMs) with different parameter sizes (7B, 8B, and 13B) across nine benchmark datasets. The bar chart visually represents the improvement in performance achieved by R2-T2 on each benchmark. The key finding is that R2-T2 substantially improves the performance of the smaller 7B MoE model, even surpassing the performance of a larger 13B VLM in some cases. This demonstrates the effectiveness of R2-T2 in enhancing the capabilities of multimodal Mixture-of-Experts models.
read the caption
Figure 1: R2-T2 applied to MoAI-7B compared against 7/8/13B VLMs on 9 benchmarks. R2-T2 significantly enhances performance of the 7B base MoE model, surpassing a recent 13B VLM.
| Task Type | Reference | Size | Evaluation | Size |
| General Visual Understanding | VQA-V2 | 5,000 | MMBench | 2,374 |
| Visual7W | 5,000 | MME-P | 2,114 | |
| COCO-QA | 5,000 | CVBench2D/3D | 2,638 | |
| CLEVR | 5,000 | GQA | 1,590 | |
| Knowledge- Based Reasoning | A-OKVQA | 5,000 | SQA-IMG | 2,017 |
| TQA | 5,000 | AI2D | 3,087 | |
| MathVista | 5,000 | PhysBench | 2,093 | |
| Optical Character Recognition | ST-VQA | 5,000 | TextVQA | 5,734 |
| DocVQA | 5,000 |
🔼 This table presents a summary of the benchmark datasets used for evaluating the performance of multimodal mixture-of-experts models. It lists the dataset name, type of task, the number of samples in the reference set (limited to 5000 if the original set exceeds that number), and the number of samples in the corresponding evaluation set.
read the caption
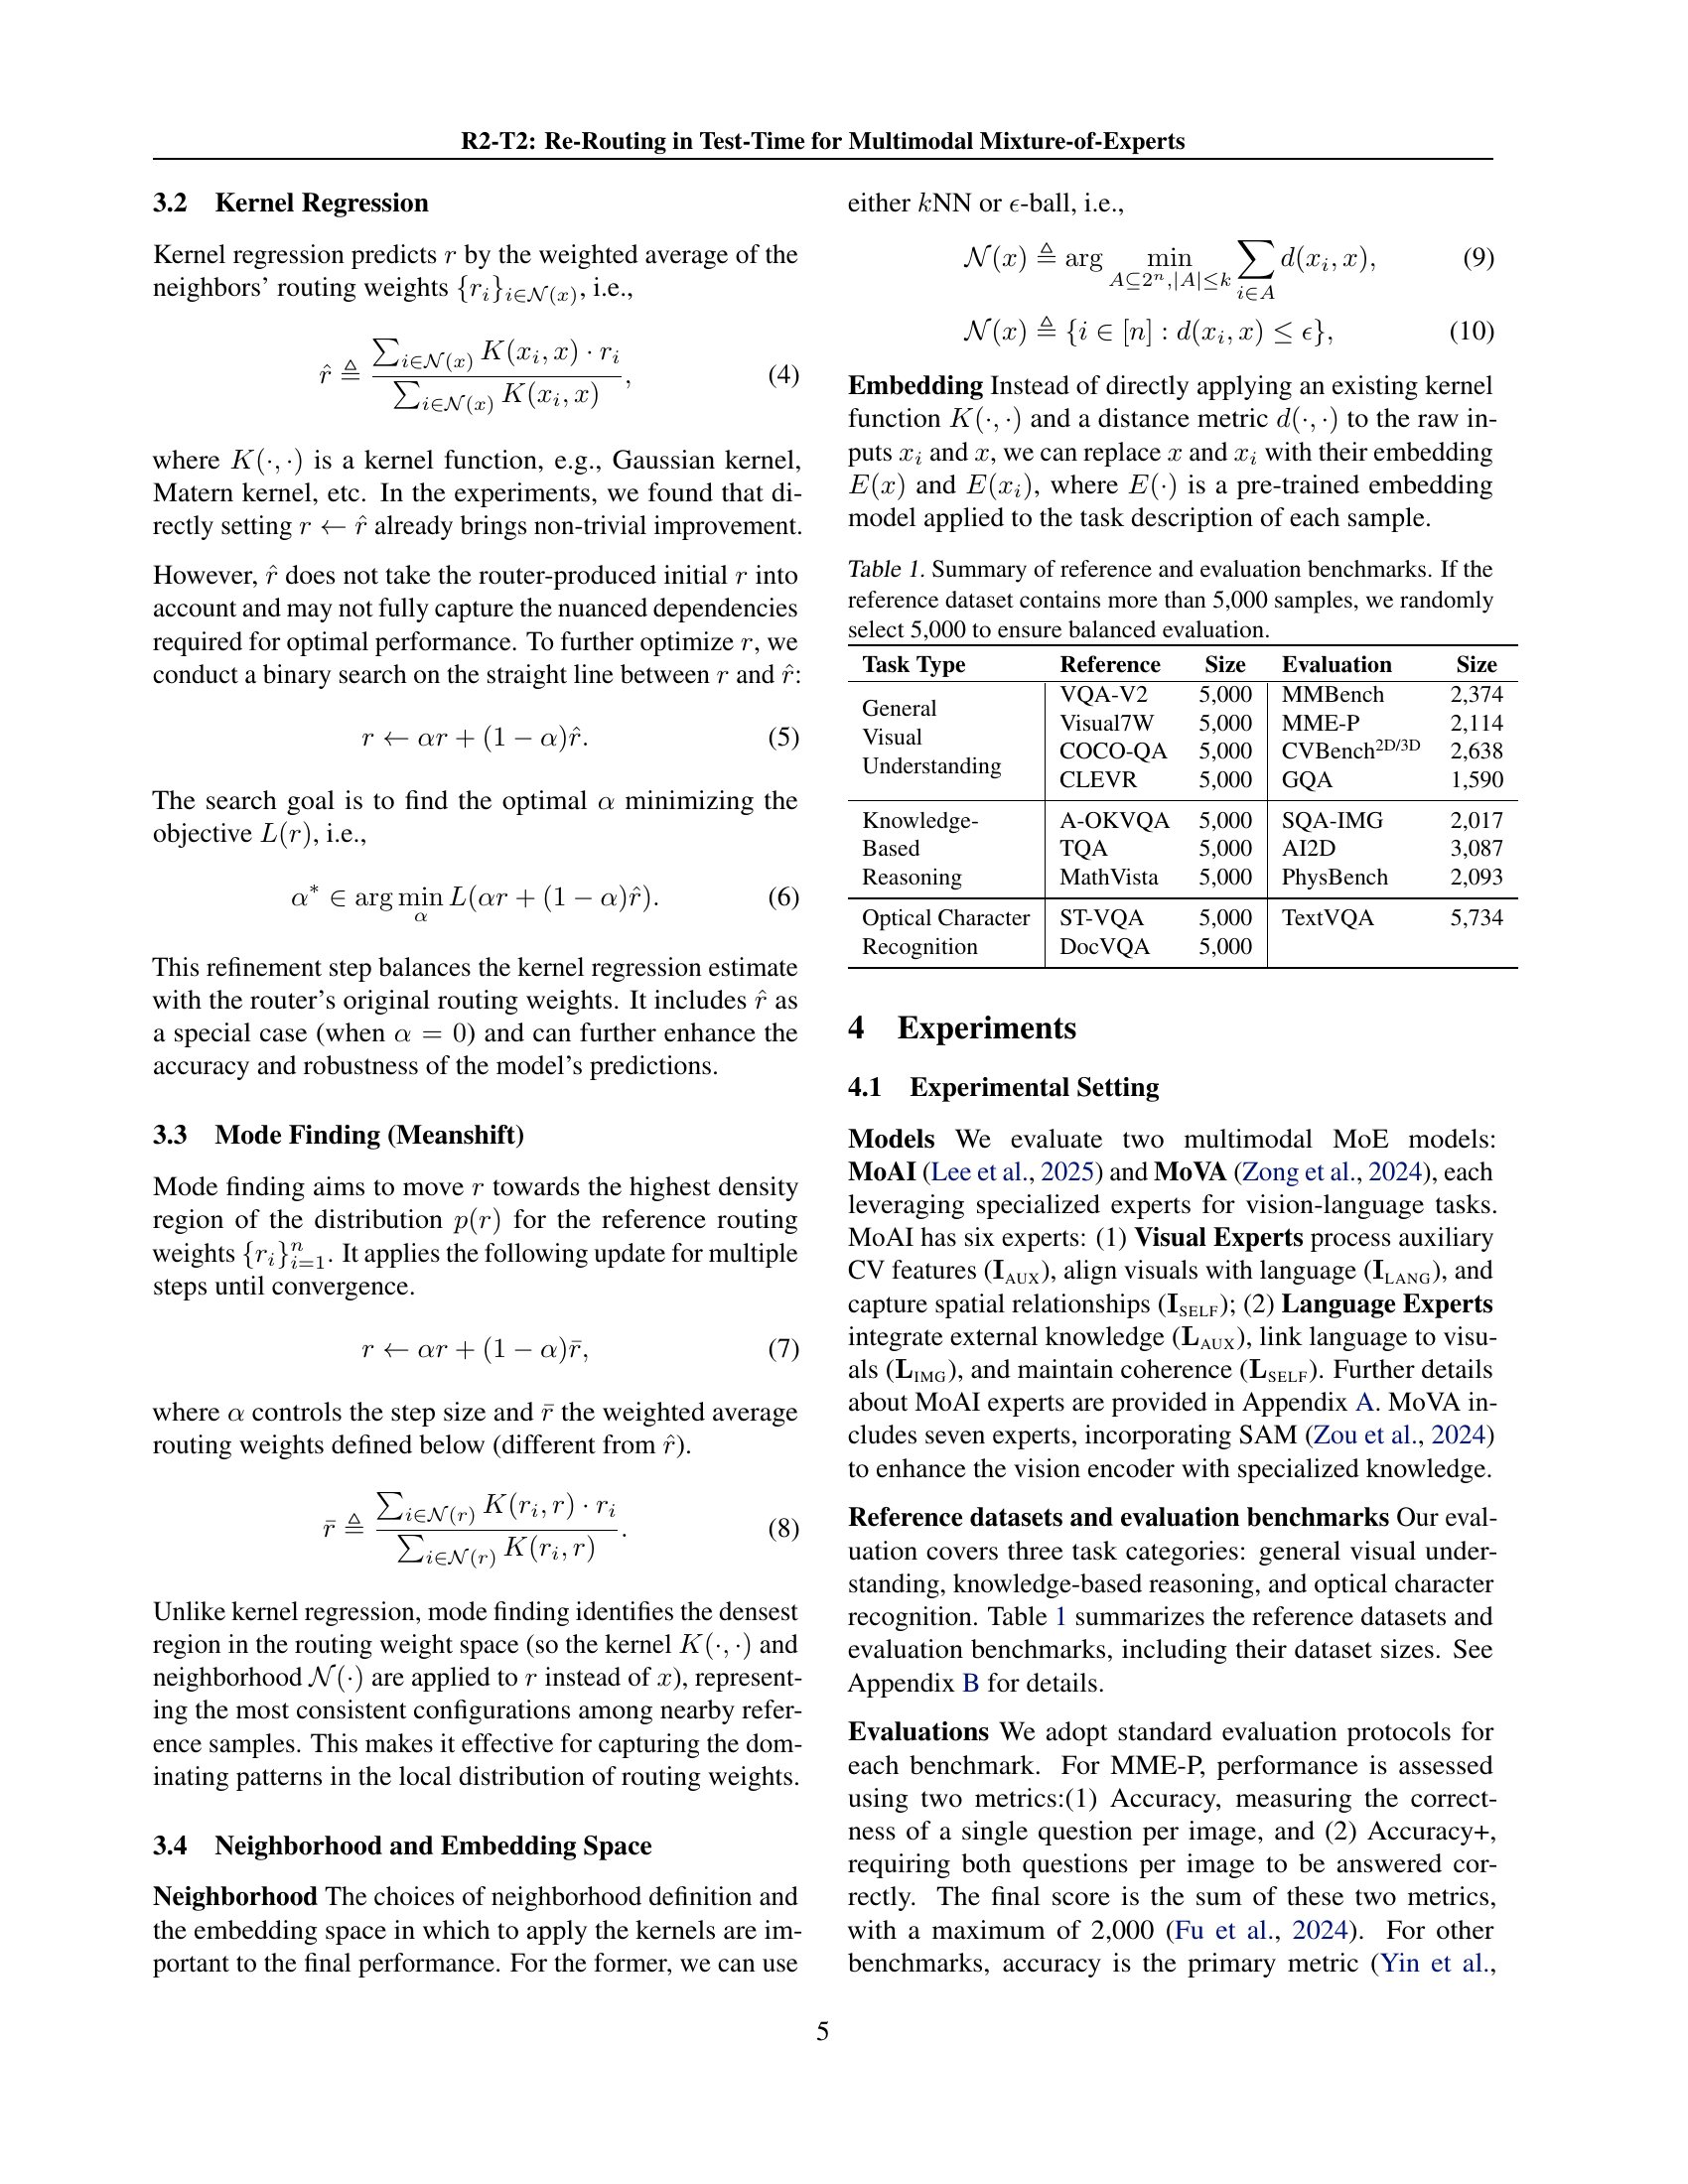
Table 1: Summary of reference and evaluation benchmarks. If the reference dataset contains more than 5,000 samples, we randomly select 5,000 to ensure balanced evaluation.
In-depth insights#
MoE Router Gaps#
While Mixture-of-Experts (MoE) models have shown remarkable success in various domains, a critical area for improvement lies in addressing the ‘MoE Router Gaps.’ These gaps refer to the suboptimal routing decisions made by the router, which can significantly impact the overall performance of the MoE. Ideally, the router should direct each input to the most relevant experts, ensuring efficient allocation of resources and optimal utilization of specialized knowledge. However, in practice, routers often struggle to make perfect decisions, leading to several potential issues. One key challenge is the lack of sufficient training data or diversity in the training data, which can result in the router being unable to generalize effectively to new or unseen inputs. Another issue is the inherent complexity of the routing task itself, as it requires the router to balance multiple factors such as input similarity, expert capacity, and load balancing considerations. Addressing these ‘MoE Router Gaps’ is essential for unlocking the full potential of MoE models and achieving state-of-the-art performance.
R2-T2: Re-Routing#
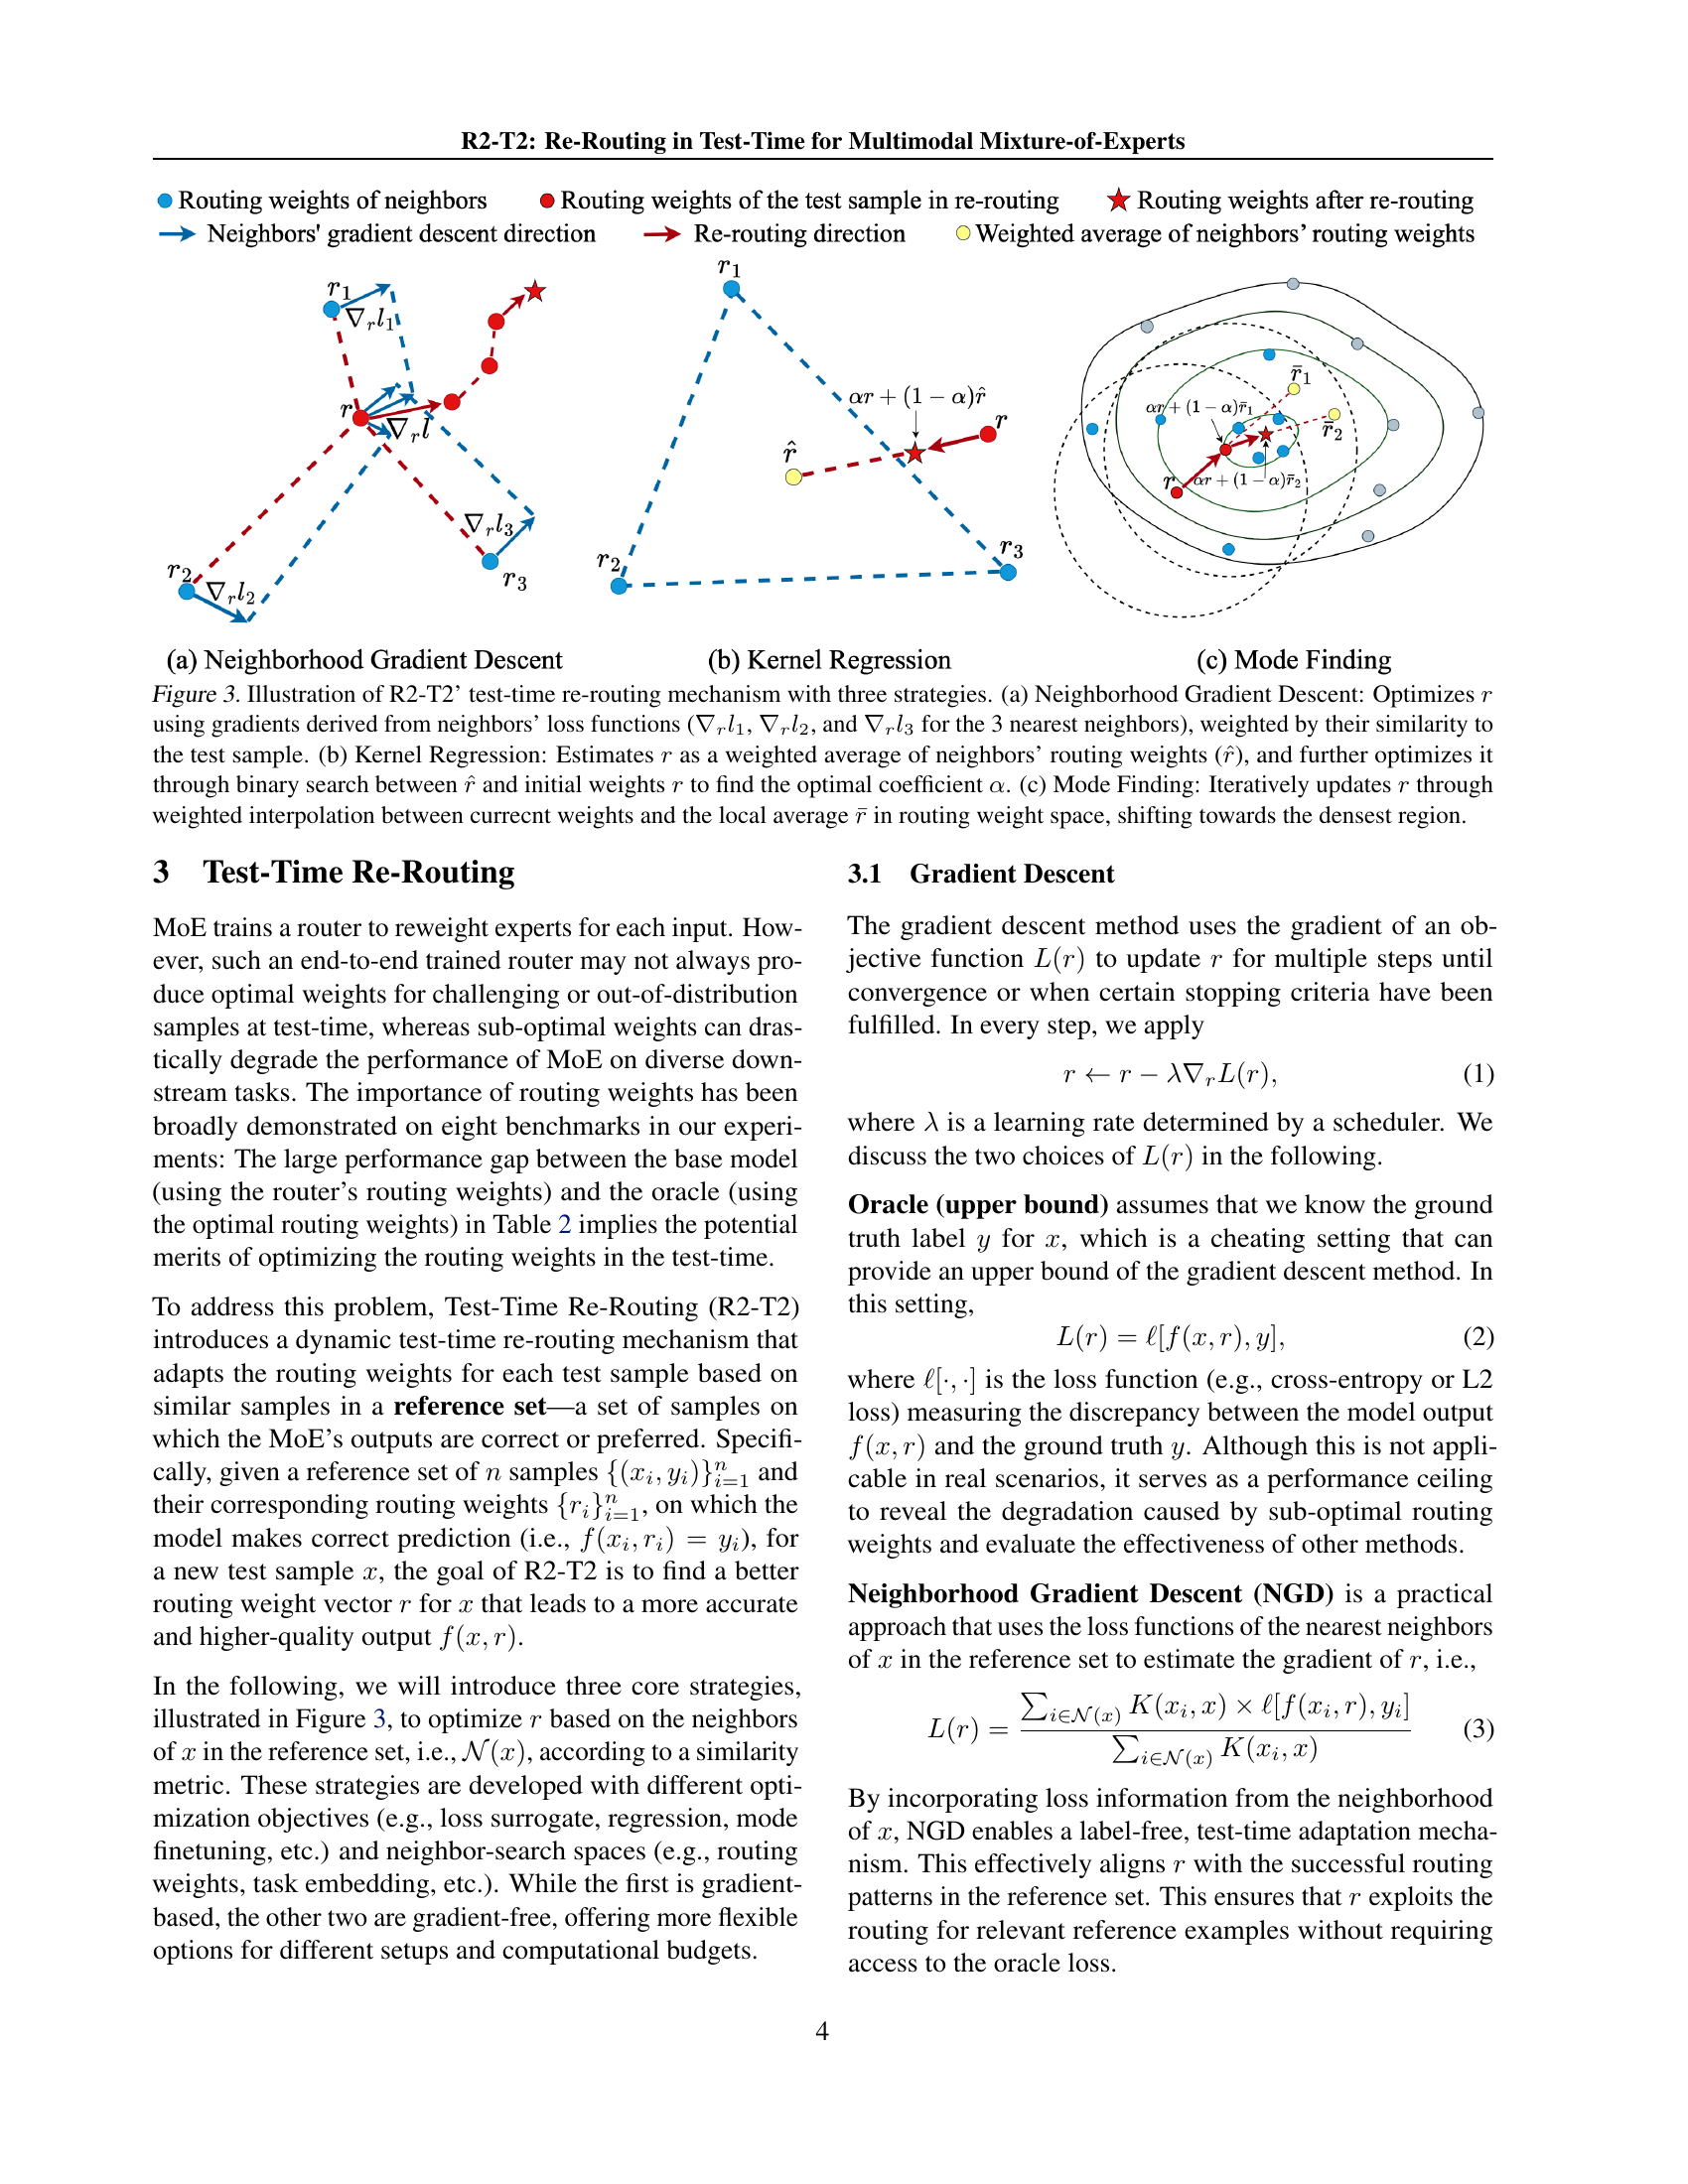
R2-T2: Re-Routing in Test-Time for Multimodal Mixture-of-Experts introduces a novel approach to enhance the performance of large multimodal models (LMMs) by dynamically adjusting the routing weights of experts during inference. This addresses the challenge of suboptimal expert selection in existing MoE architectures, where the router, trained end-to-end, may not always produce the best routing weights for every test sample. The core idea of R2-T2 is to leverage the routing weights of successful tasks to guide the re-routing process for new, potentially challenging, inputs. It posits that by identifying similar tasks in a reference set and adapting the routing weights based on their successful configurations, LMMs can achieve improved accuracy and generalization. The proposed method, R2-T2, optimizes the vector of routing weights in test-time by moving it toward those vectors of the correctly predicted samples. Three key strategies are explored: neighborhood gradient descent, kernel regression, and mode finding, each offering different optimization objectives and neighbor search spaces. A significant advantage is that R2-T2 is training-free, avoiding the need to re-train the entire model and thus conserving computational resources.
Gradient Descent#
Gradient Descent is a fundamental optimization algorithm used to minimize a function by iteratively moving towards the steepest descent direction. In this paper, it is used to optimize the routing weights of the model. The gradient descent method uses the gradient of an objective function L(r) to update r for multiple steps until convergence or when certain stopping criteria have been fulfilled. The paper further introduces Oracle and Neighborhood Gradient Descent (NGD) which is a practical approach that uses the loss functions of the nearest neighbors of x in the reference set to estimate the gradient of r. By incorporating loss information from the neighborhood of x, NGD enables a label-free, test-time adaptation mechanism. This effectively aligns r with the successful routing patterns in the reference set and exploiting the routing for relevant reference examples without requiring access to the oracle loss.
Robust on MoVA/MoAI#
It seems the study aims for robustness in multimodal models, specifically MoVA/MoAI. This suggests an investigation into how well these models perform under varying conditions, such as noisy data or out-of-distribution samples. The research likely explores methods to make these models more reliable and generalizable, which is vital for real-world applications. Key aspects may include evaluating performance across diverse datasets, analyzing failure cases, and implementing techniques to improve resilience. The study may delve into data augmentation strategies, regularization methods, or architecture modifications. Essentially, the goal is to ensure that MoVA/MoAI models consistently deliver accurate results, even when faced with unexpected or challenging inputs. Enhancing robustness improves the usability and trust in these models, promoting their adoption in various domains. This focus aligns with the broader trend of developing more dependable and adaptable AI systems.
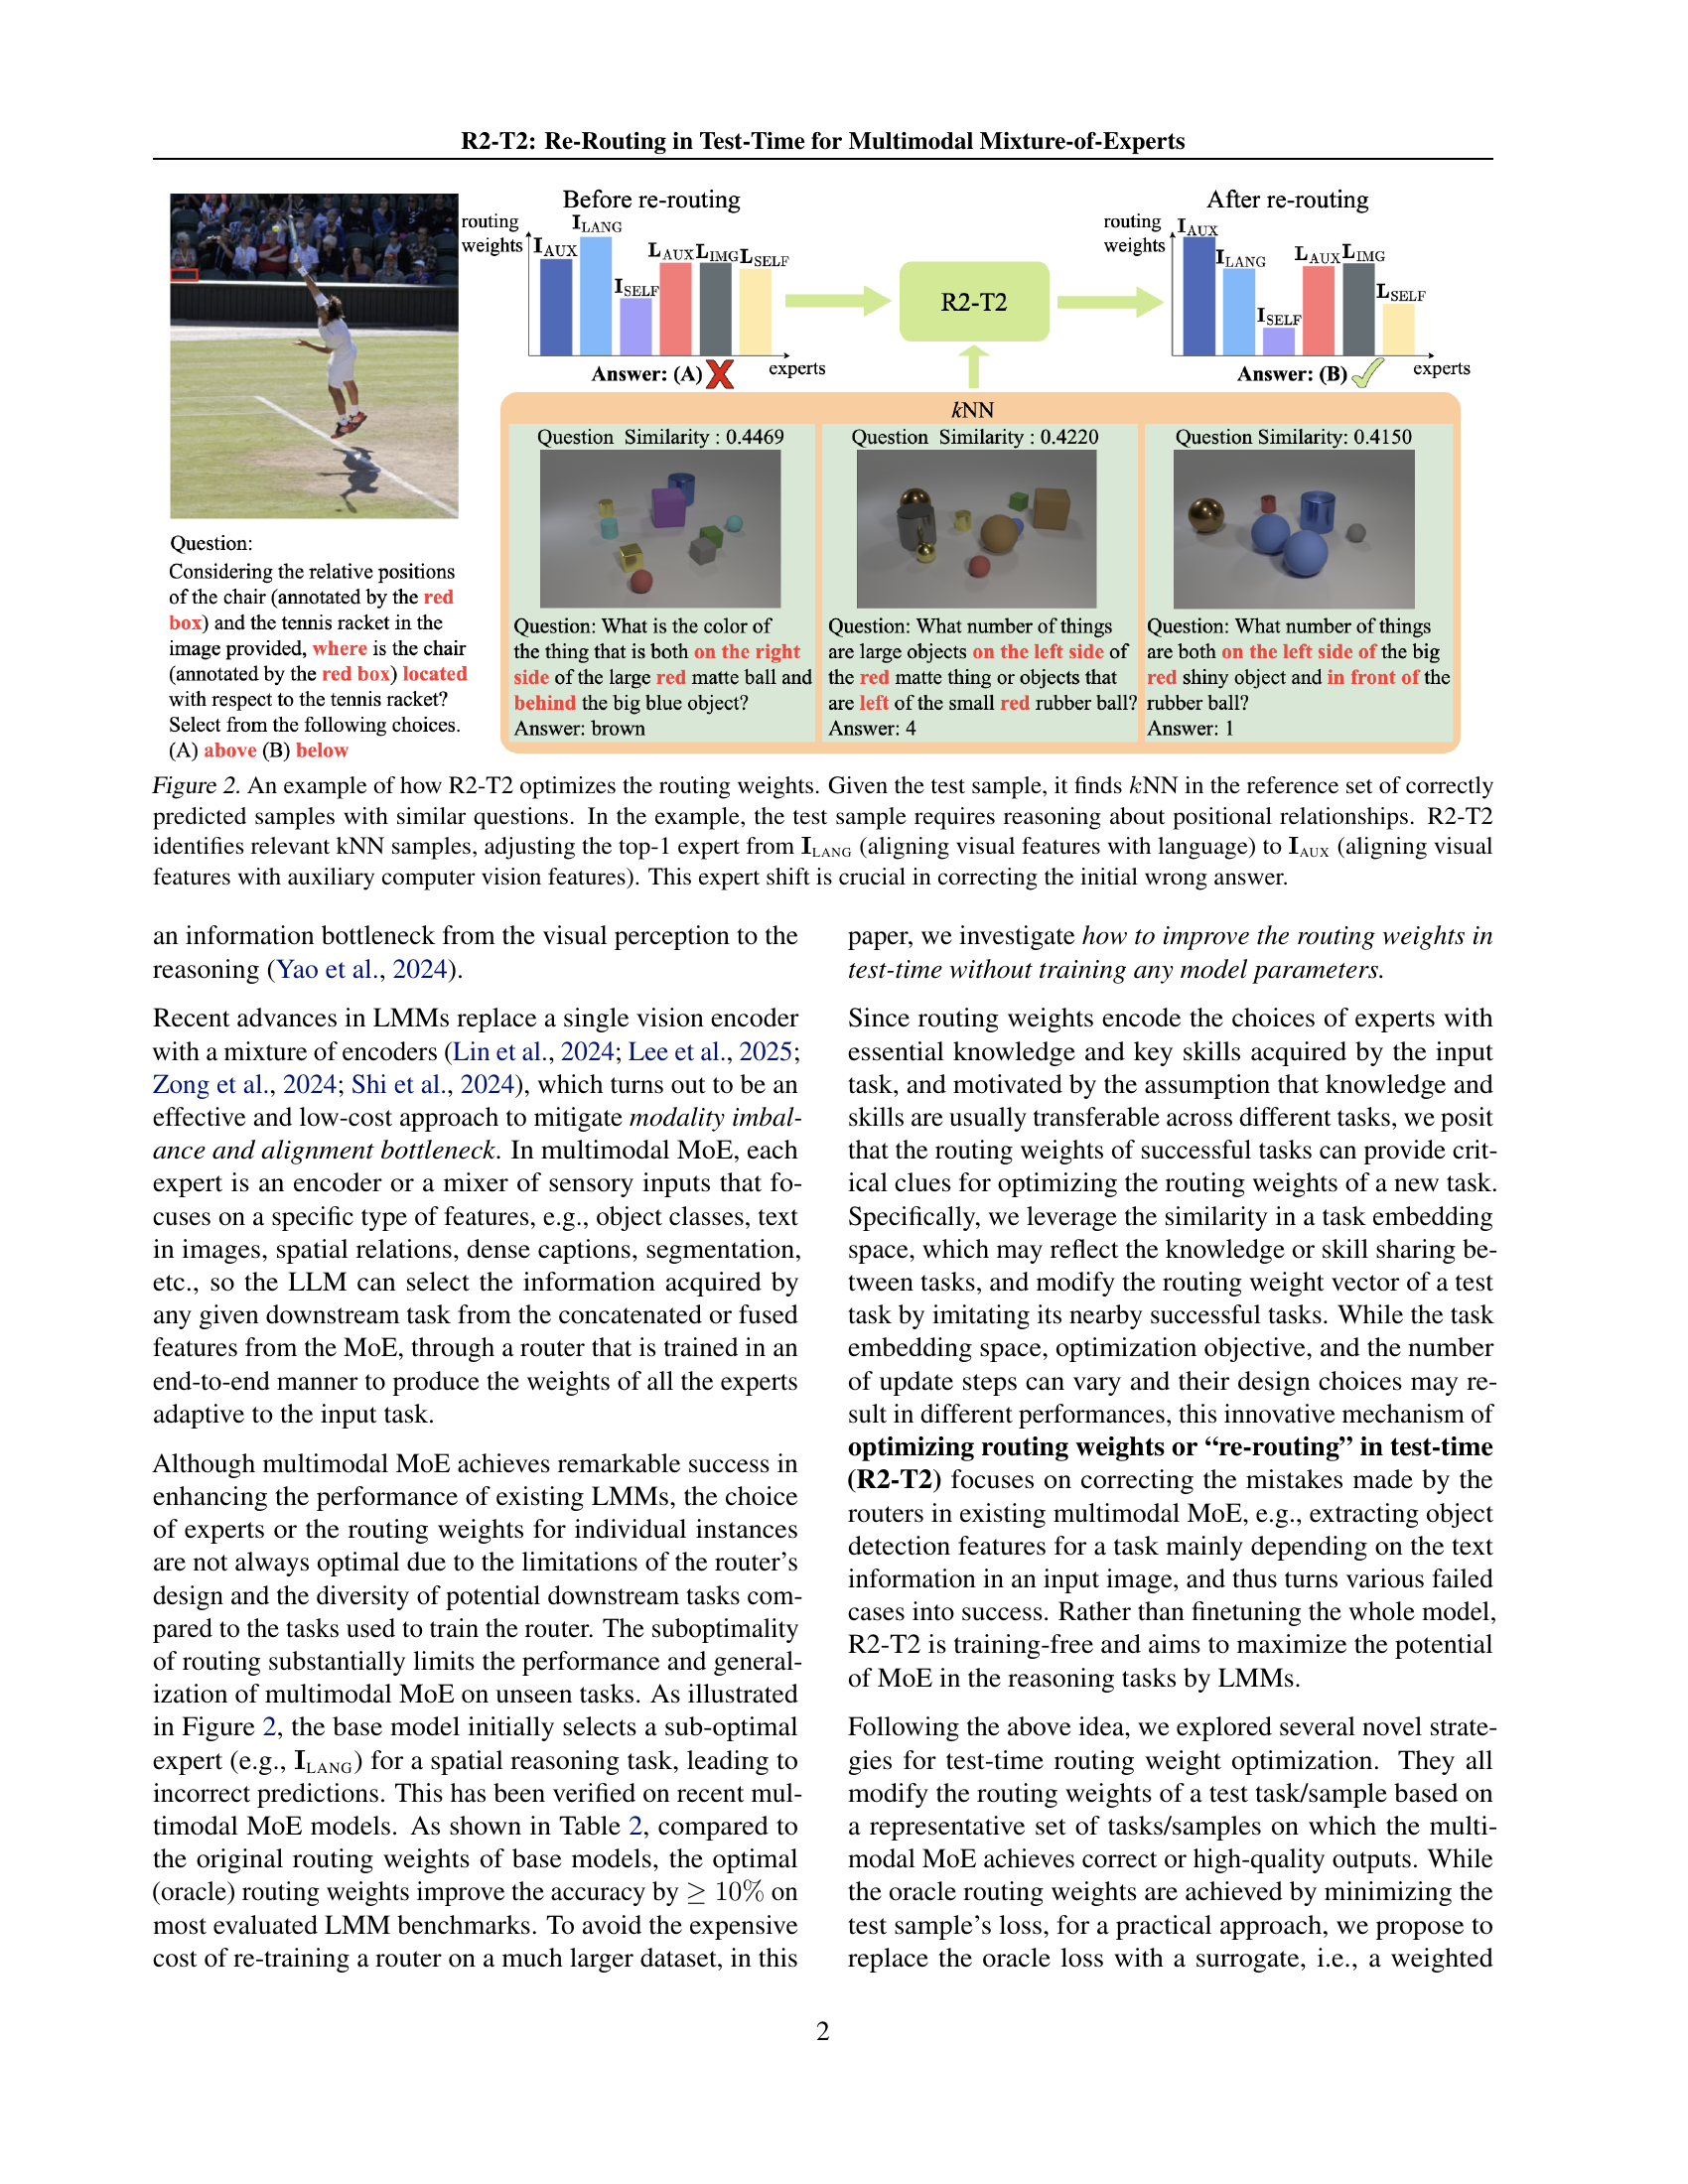
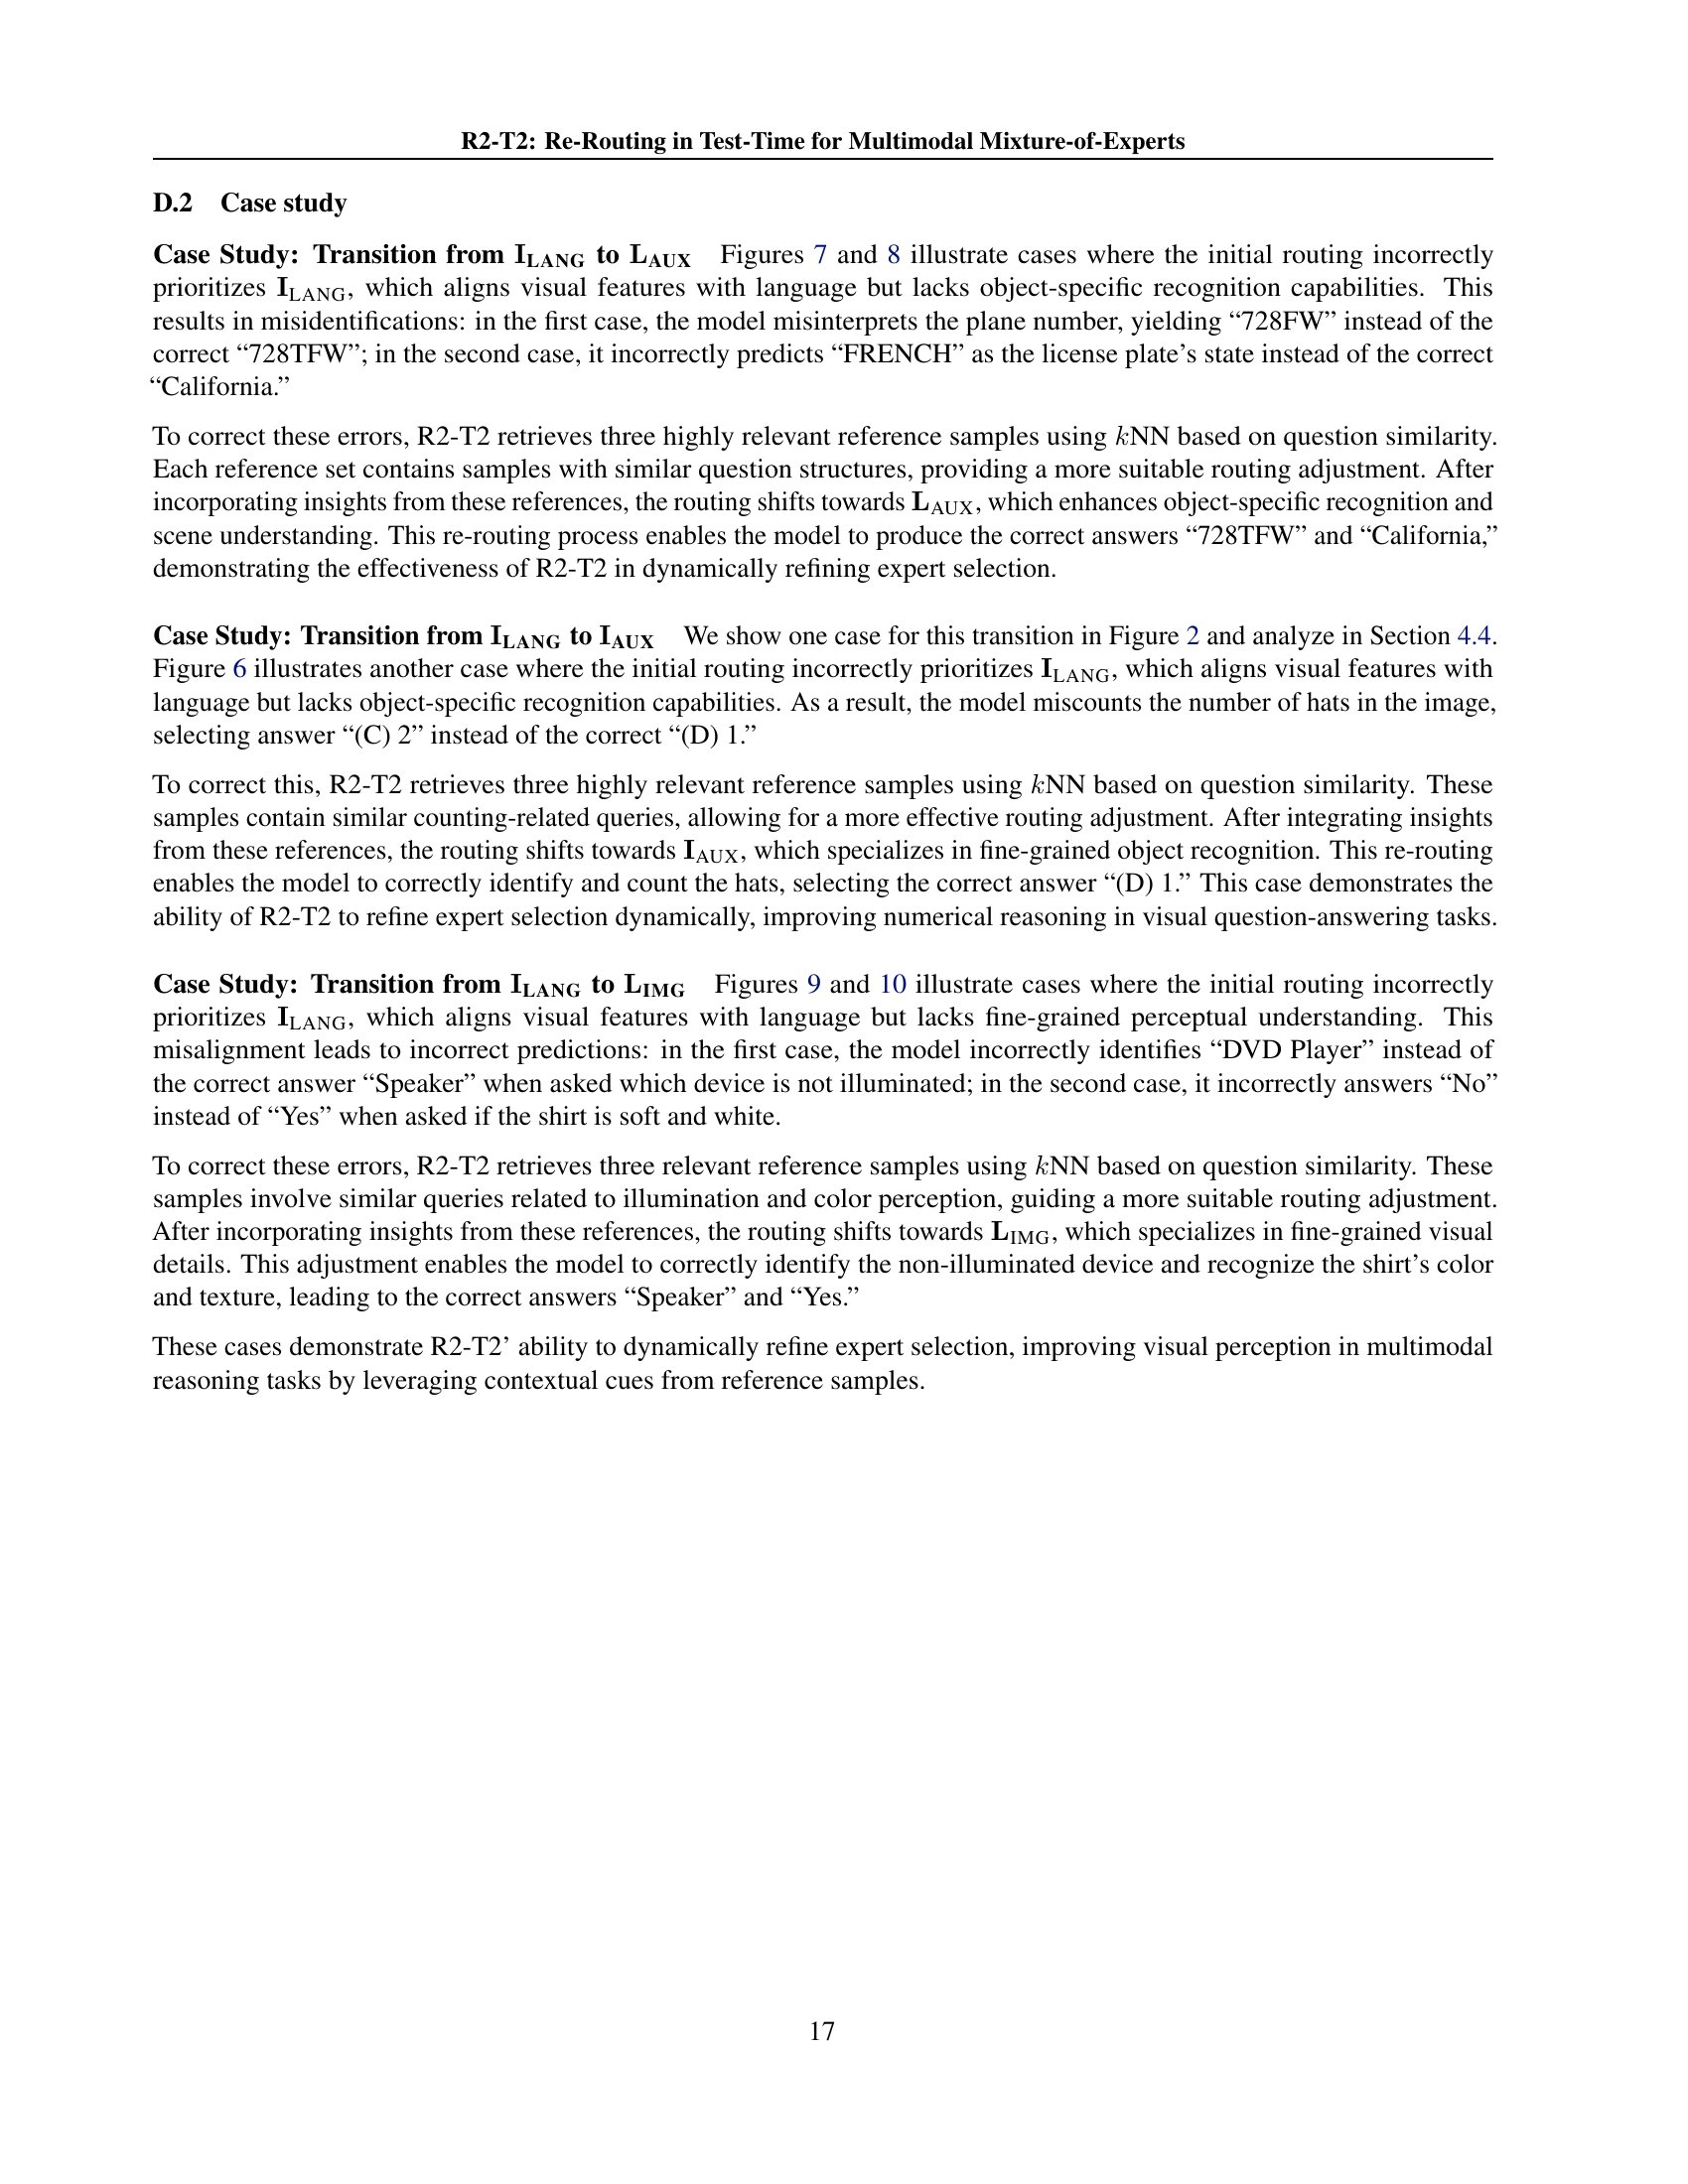
LMM Expert Shifts#
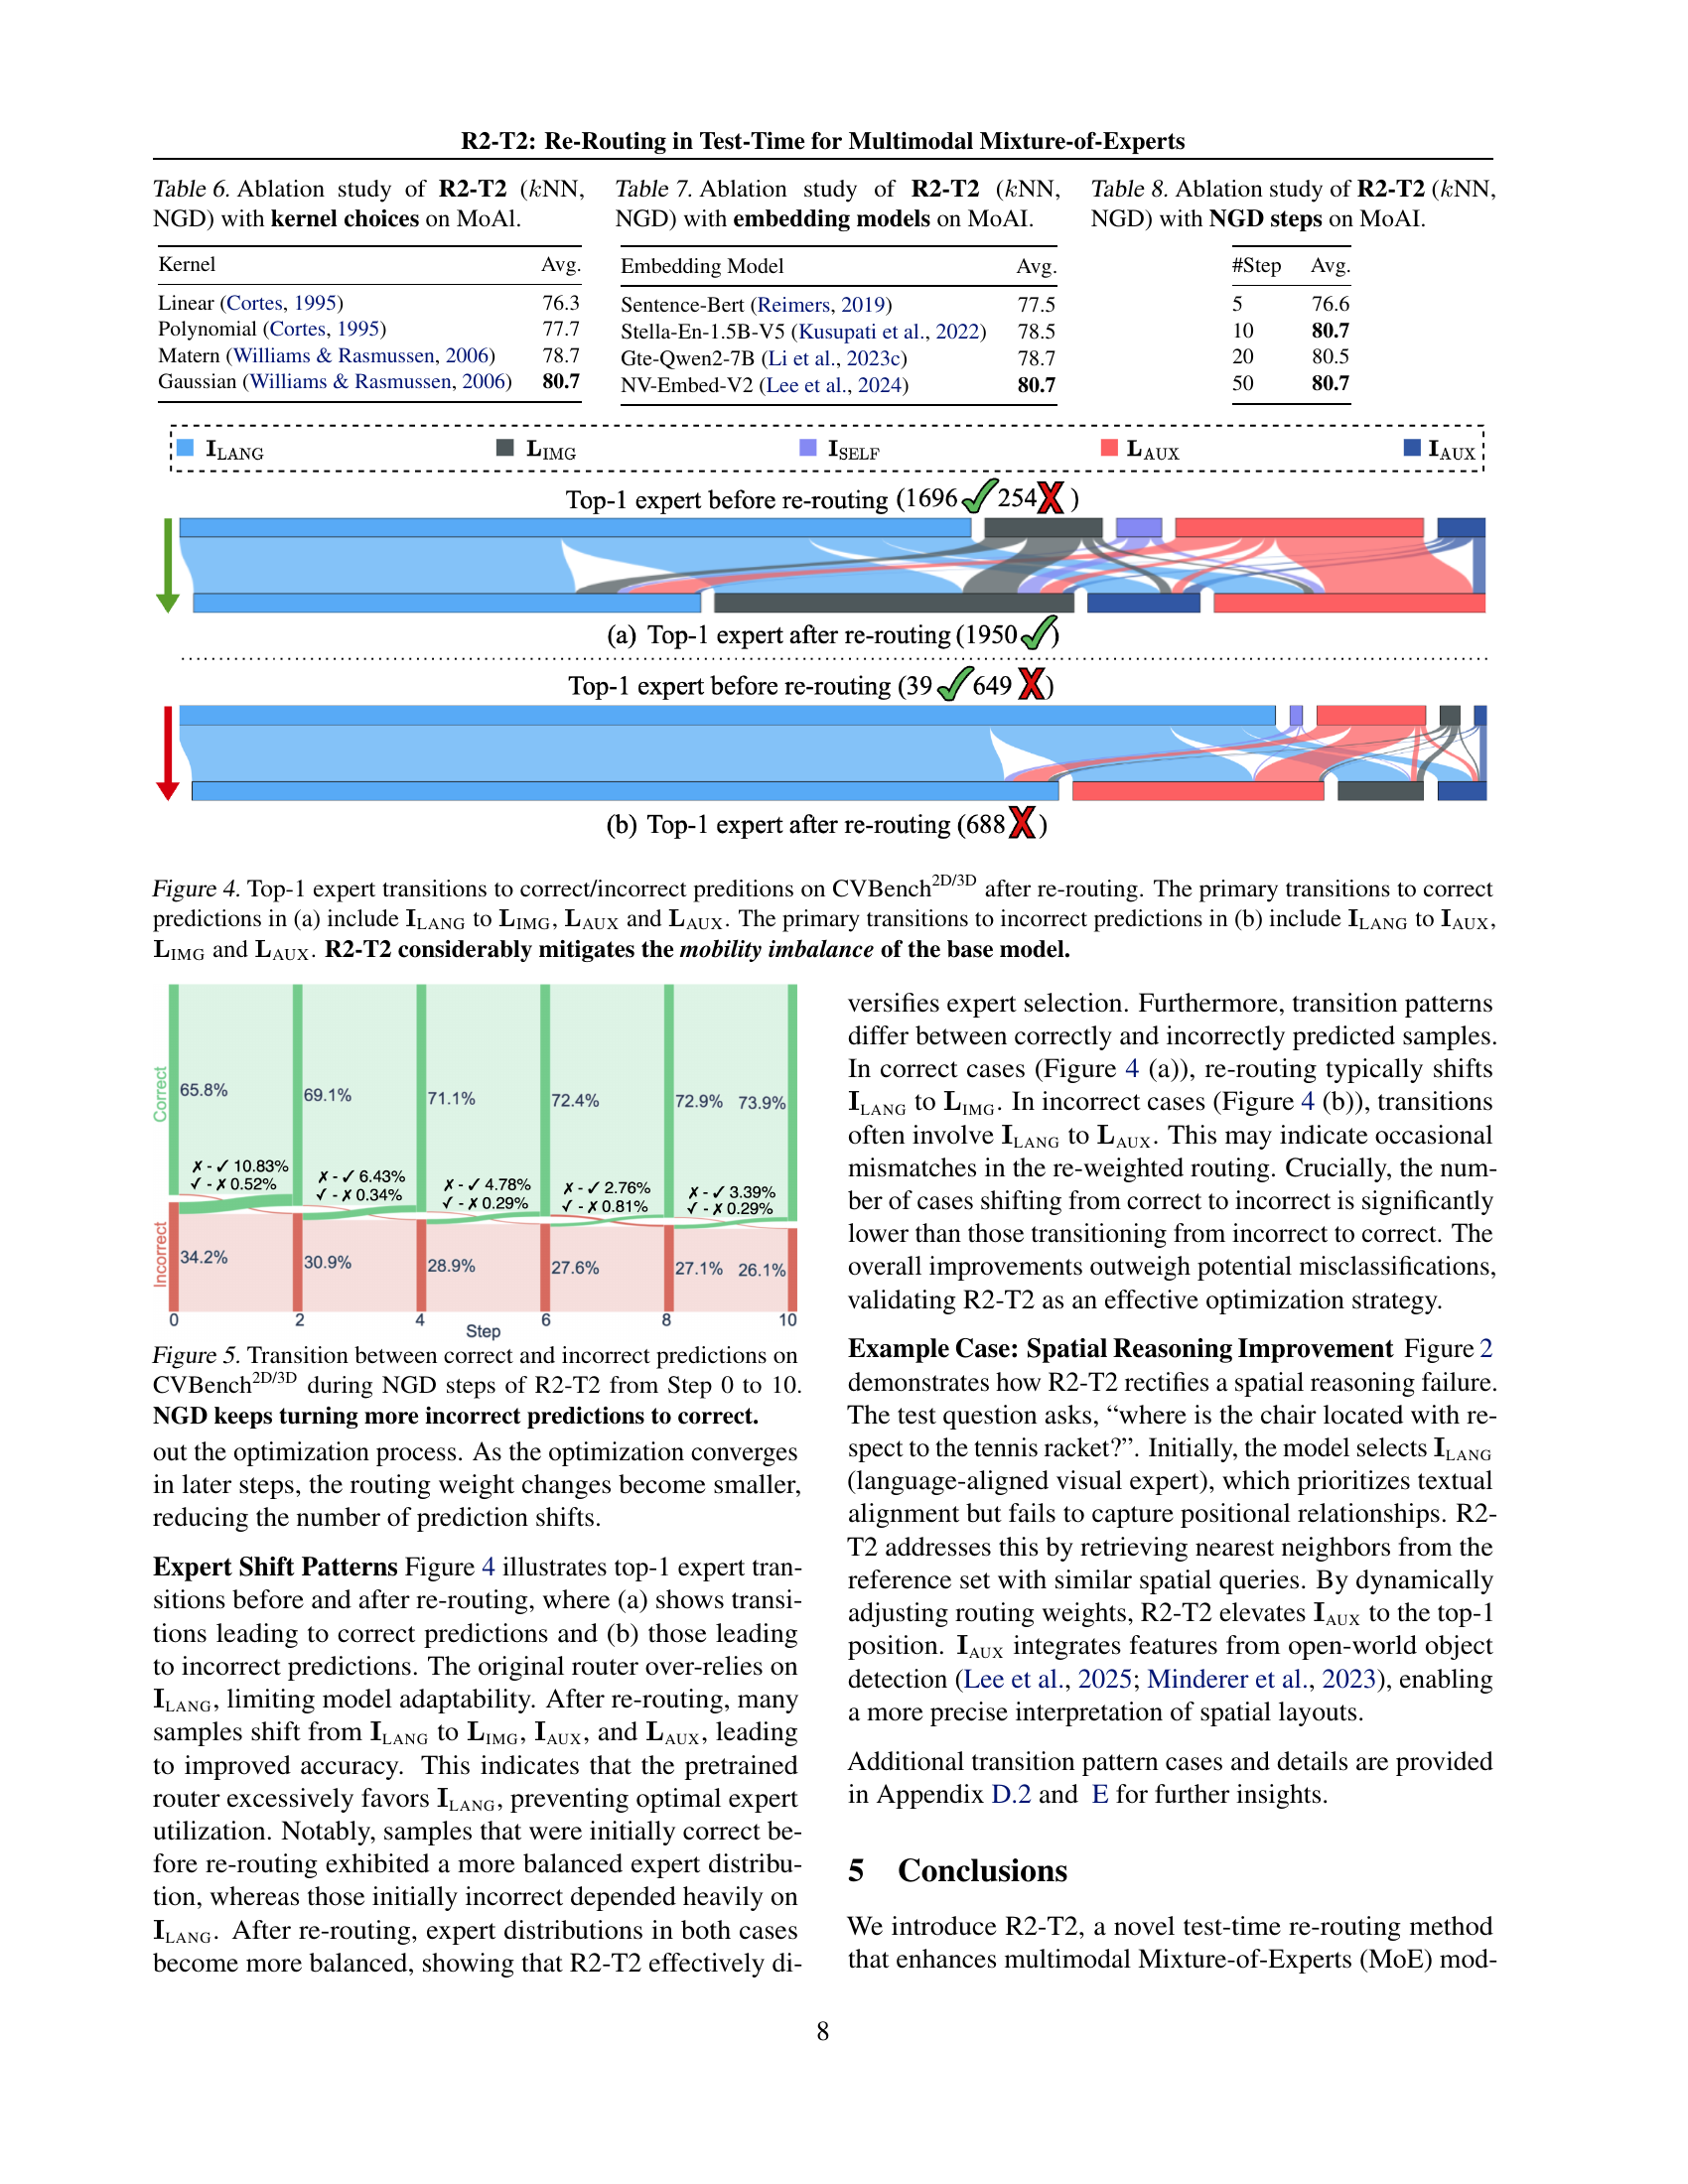
Expert selection shifts within LMMs reveal nuanced adaptation strategies. The initial router often over-relies on certain experts, like ILANG, hindering optimal performance. Re-routing mechanisms, like R2-T2, dynamically diversify expert utilization. Transitions toward experts such as LIMG, IAUX, and LAUX indicates improved reasoning and feature integration. These shifts rectify misalignments and enhance overall model adaptability. Balancing expert contributions leads to improved accuracy and more robust performance across diverse tasks, preventing excessive reliance on a single specialized module. R2-T2 mitigates the mobility imbalance of the base model with more evenly distributed expert decisions. Moreover, the transitions can vary. These dynamics reveal the power of adaptive expert routing in LMMs.
More visual insights#
More on tables
| Method | MMBench | MME-P | SQA-IMG | AI2D | TextVQA | GQA | CVBench2D | CVBench3D | PhysBench |
| MoVA (base model) | 74.3 | 1579.2 | 74.4 | 74.9 | 76.4 | 64.8 | 61.6 | 62.3 | 32.6 |
| Mode Finding | 75.2 | 1587.1 | 74.9 | 75.8 | 77.3 | 65.7 | 62.5 | 63.2 | 33.5 |
| Kernel Regression | 77.9 | 1610.6 | 76.4 | 78.5 | 79.9 | 68.3 | 65.2 | 65.9 | 35.7 |
| NGD | 81.2 | 1645.3 | 79.1 | 81.8 | 83.2 | 71.5 | 68.3 | 68.9 | 37.8 |
| Oracle (upper bound) | 87.6 | 1735.4 | 87.3 | 88.4 | 89.5 | 76.2 | 72.5 | 73.2 | 47.5 |
| MoAI (base model) | 79.3 | 1714.0 | 83.5 | 78.6 | 67.8 | 70.2 | 71.2 | 59.3 | 39.1 |
| Mode Finding | 80.8 | 1725.2 | 84.1 | 79.8 | 66.5 | 71.4 | 70.0 | 60.1 | 40.2 |
| Kernel Regression | 83.7 | 1756.7 | 86.2 | 82.6 | 71.2 | 74.5 | 74.6 | 64.5 | 42.8 |
| NGD | 85.2 | 1785.5 | 88.3 | 85.0 | 73.5 | 77.0 | 77.9 | 69.2 | 44.7 |
| Oracle (upper bound) | 92.1 | 1860.2 | 93.8 | 91.2 | 79.6 | 83.2 | 84.0 | 76.8 | 54.5 |
🔼 This table presents a comparison of three different re-routing strategies (Neighborhood Gradient Descent, Kernel Regression, and Mode Finding) within the R2-T2 framework. The comparison is conducted on two multimodal Mixture-of-Experts models, MoVA and MoAI, across multiple benchmarks. The results are expressed as accuracy percentages for each model and method. A baseline using the original router weights is also provided, as well as an oracle upper bound (achievable only with access to ground truth labels). The table highlights the significant performance improvements achieved using the R2-T2 re-routing strategies, especially the Neighborhood Gradient Descent method, demonstrating its effectiveness in enhancing the accuracy of the multimodal MoE models.
read the caption
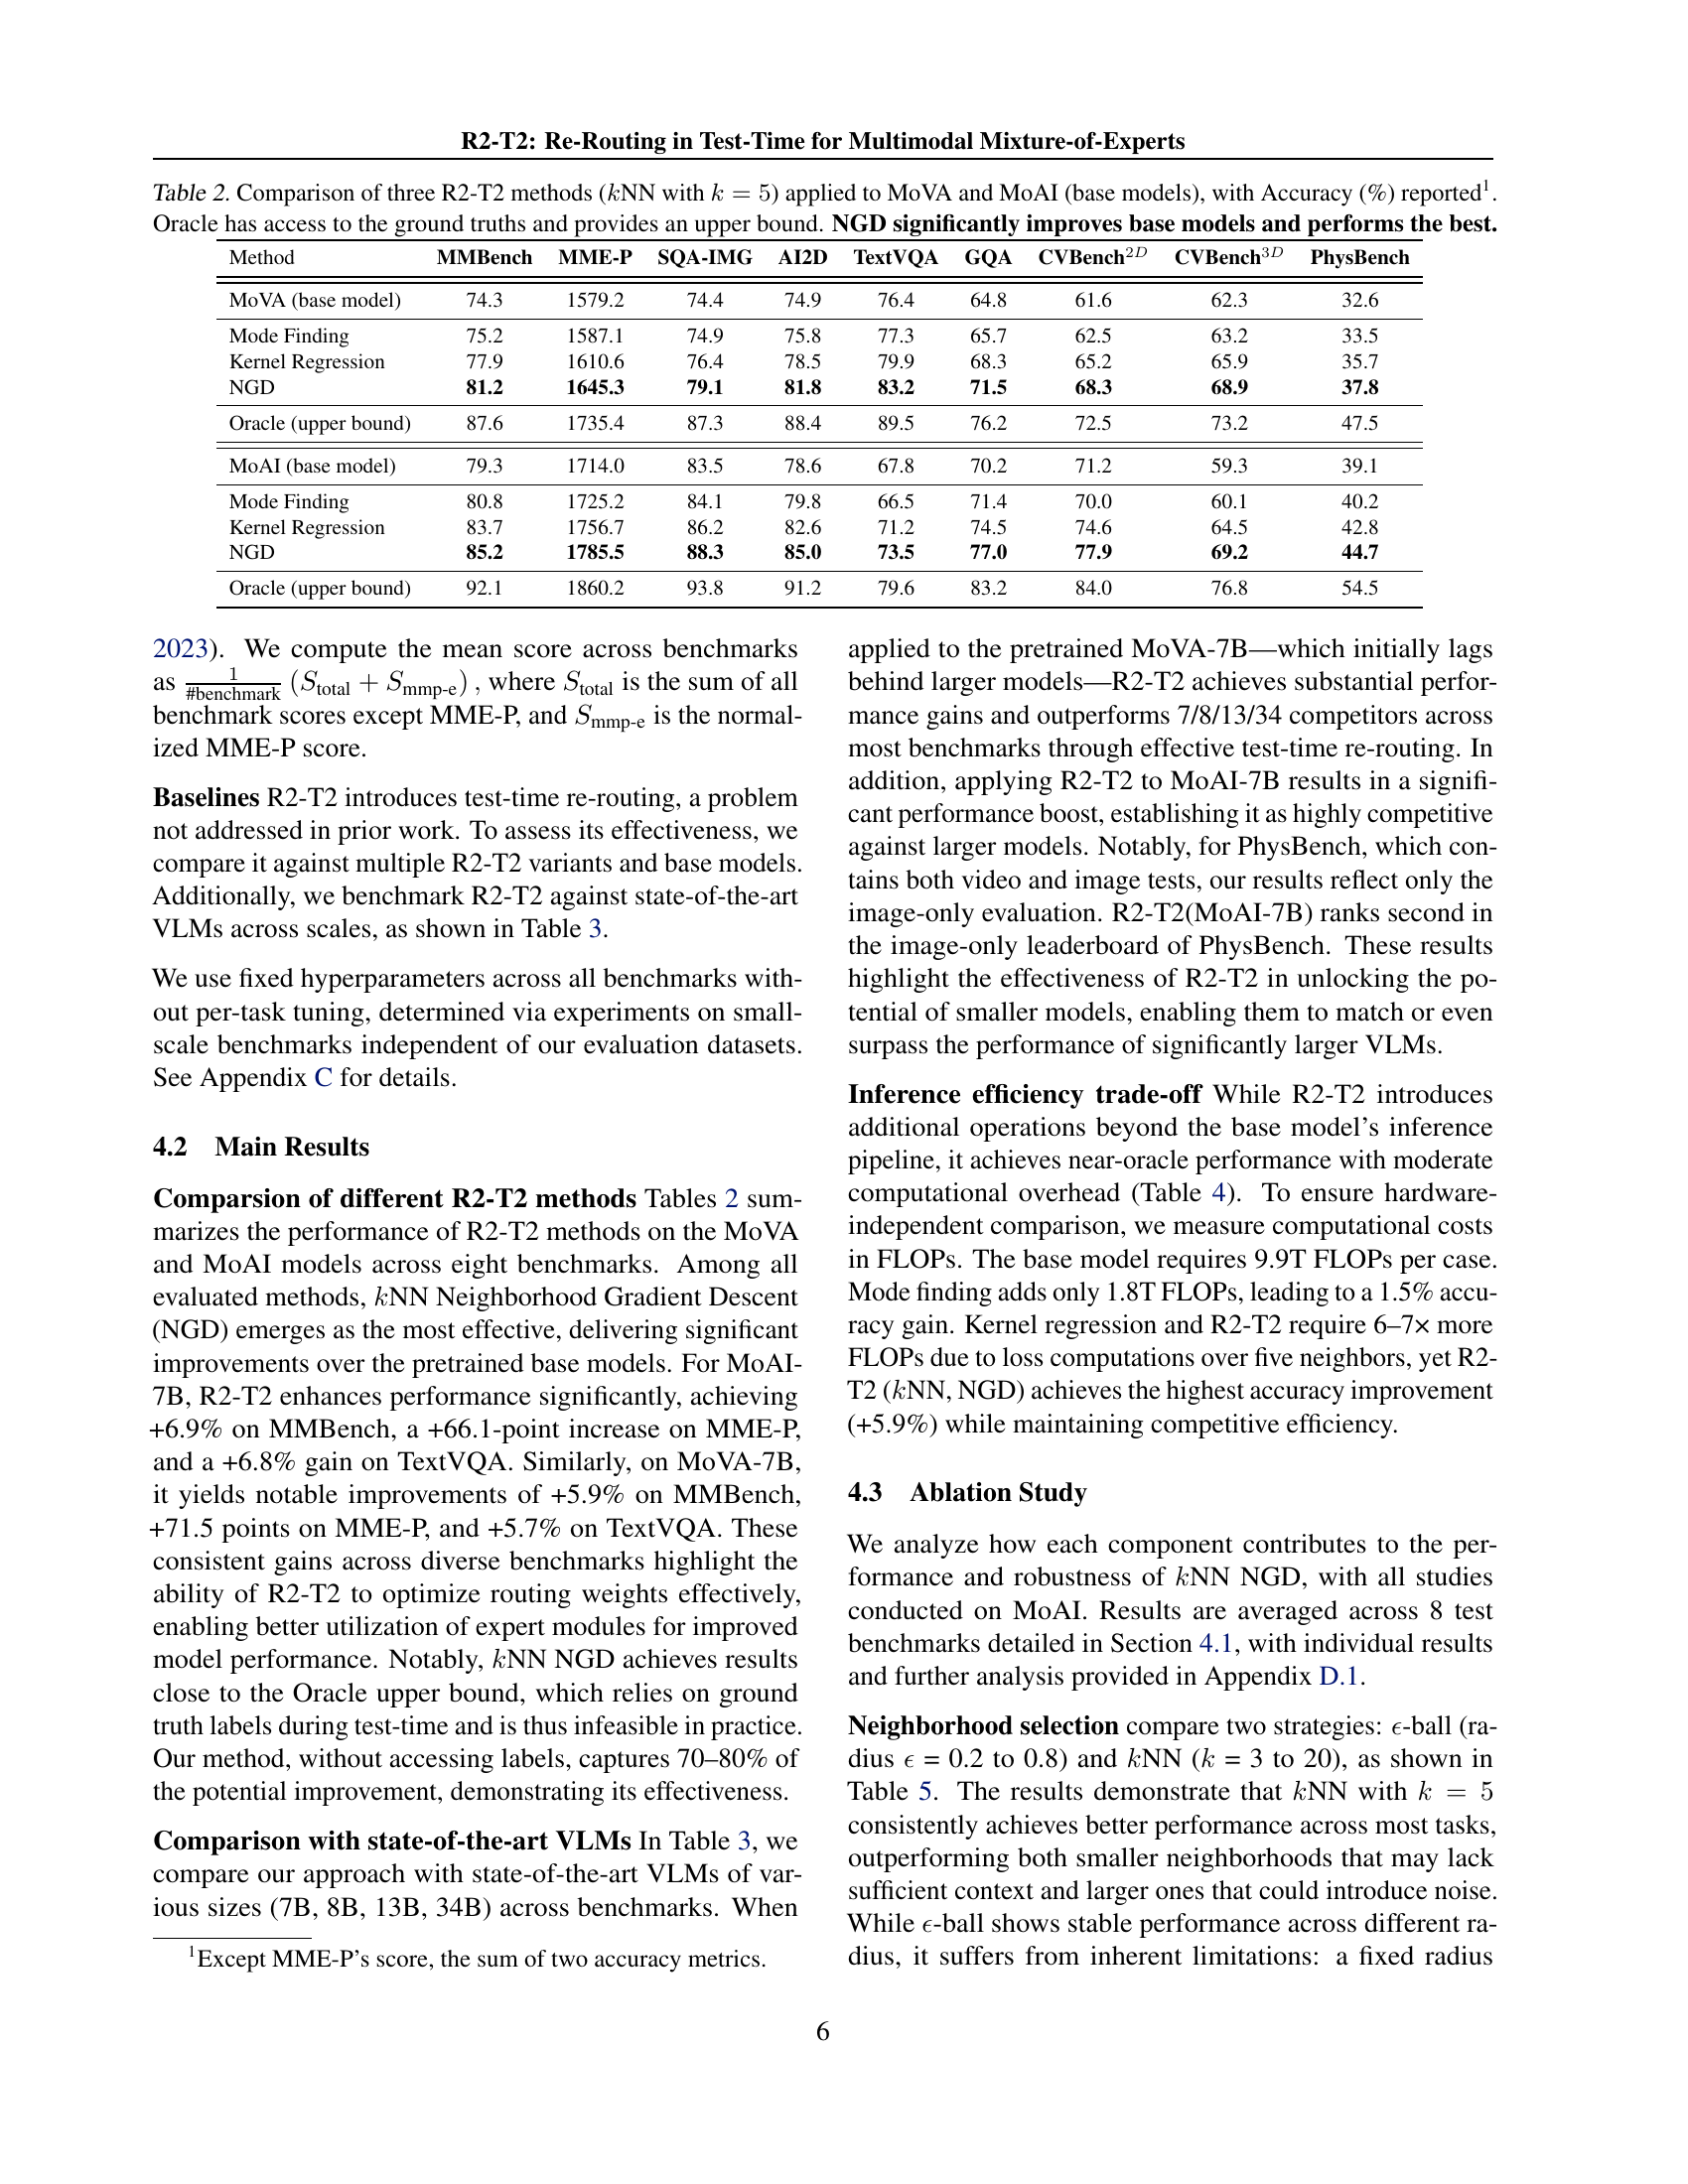
Table 2: Comparison of three R2-T2 methods (k𝑘kitalic_kNN with k=5𝑘5k=5italic_k = 5) applied to MoVA and MoAI (base models), with Accuracy (%) reported111Except MME-P’s score, the sum of two accuracy metrics.. Oracle has access to the ground truths and provides an upper bound. NGD significantly improves base models and performs the best.
| VLM | MMBench | MME-P | SQA-IMG | AI2D | TextVQA | GQA | CVBench2D | CVBench3D | PhysBench |
| 7B Models | |||||||||
| InstructBLIP-7B (Dai et al., 2023) | 36.0 | - | 60.5 | - | 50.1 | 56.7 | - | - | 23.8 |
| Qwen-VL-7B (Bai et al., 2023) | 38.2 | - | 67.1 | 62.3 | 63.8 | 59.4 | - | - | - |
| Qwen-VL-Chat-7B (Bai et al., 2023) | 60.6 | 1488.0 | 68.2 | 57.7 | 61.5 | - | - | - | 35.6 |
| mPLUG-Owl-7B (Ye et al., 2023) | 46.6 | 967.0 | - | - | - | 58.9 | - | - | - |
| mPLUG-Owl2-7B (Ye et al., 2024) | 64.5 | 1450.0 | 68.7 | - | 58.2 | 62.9 | - | - | - |
| ShareGPT4V-7B (Chen et al., 2025) | 68.8 | 1567.4 | 68.4 | 67.3 | 65.8 | 63.4 | 60.2 | 57.5 | 31.3 |
| 8B Models | |||||||||
| Mini-Gemini-HD-8B (Li et al., 2024) | 72.7 | 1606.0 | 75.1 | 73.5 | 70.2 | 64.5 | 62.2 | 63.0 | 34.7 |
| LLaVA-NeXT-8B (Liu et al., 2024) | 72.1 | 1603.7 | 72.8 | 71.6 | 64.6 | 65.2 | 62.2 | 65.3 | - |
| Cambrian1-8B (Tong et al., 2024) | 75.9 | 1647.1 | 74.4 | 73.0 | 68.7 | 64.6 | 72.3 | 65.0 | 24.6 |
| 13B Models | |||||||||
| BLIP2-13B (Li et al., 2023a) | 28.8 | 1294.0 | 61.0 | - | 42.5 | - | - | - | 38.6 |
| InstructBLIP-13B (Dai et al., 2023) | 39.1 | 1213.0 | 63.1 | - | 50.7 | - | - | - | 29.9 |
| Mini-Gemini-HD-13B (Li et al., 2024) | 68.6 | 1597.0 | 71.9 | 70.1 | 70.2 | 63.7 | 53.6 | 67.3 | - |
| LLaVA-NeXT-13B (Liu et al., 2024) | 70.0 | 1575.0 | 73.5 | 70.0 | 67.1 | 65.4 | 62.7 | 65.7 | 40.5 |
| Cambrian1-13B (Tong et al., 2024) | 75.7 | 1610.4 | 79.3 | 73.6 | 72.8 | 64.3 | 72.5 | 71.8 | - |
| 34B Models | |||||||||
| Mini-Gemini-HD-34B (Li et al., 2024) | 80.6 | 1659.0 | 77.7 | 80.5 | 74.1 | 65.8 | 71.5 | 79.2 | - |
| LLaVA-NeXT-34B (Liu et al., 2024) | 79.3 | 1633.2 | 81.8 | 74.9 | 69.5 | 67.1 | 73.0 | 74.8 | - |
| Cambrian1-34B (Tong et al., 2024) | 81.4 | 1689.3 | 85.6 | 79.7 | 76.7 | 65.8 | 74.0 | 79.7 | 30.2 |
| Ours | |||||||||
| MoVA-7B | 74.3 | 1579.2 | 74.4 | 74.9 | 76.4 | 64.8 | 61.6 | 62.3 | 32.6 |
| R2-T2 (MoVA-7B) | 81.2 | 1645.3 | 79.1 | 81.8 | 83.2 | 71.5 | 68.3 | 68.9 | 37.8 |
| MoAI-7B | 79.3 | 1714 | 83.5 | 78.6 | 67.8 | 70.2 | 71.2 | 59.3 | 39.1 |
| R2-T2 (MoAI-7B) | 85.2 | 1785.5 | 88.3 | 85.0 | 73.5 | 77.0 | 77.9 | 69.2 | 44.7 |
🔼 Table 3 presents a comparative analysis of the R2-T2 model’s performance against several state-of-the-art vision-language models. The comparison is based on nine benchmark datasets, each designed to assess different aspects of vision-language capabilities. Higher scores indicate better performance. The table allows readers to quickly gauge the relative improvement achieved by R2-T2 compared to other models, particularly considering the models’ varying parameter scales (7B, 8B, 13B, and 34B parameters). This provides valuable context for understanding the efficiency and effectiveness of R2-T2.
read the caption
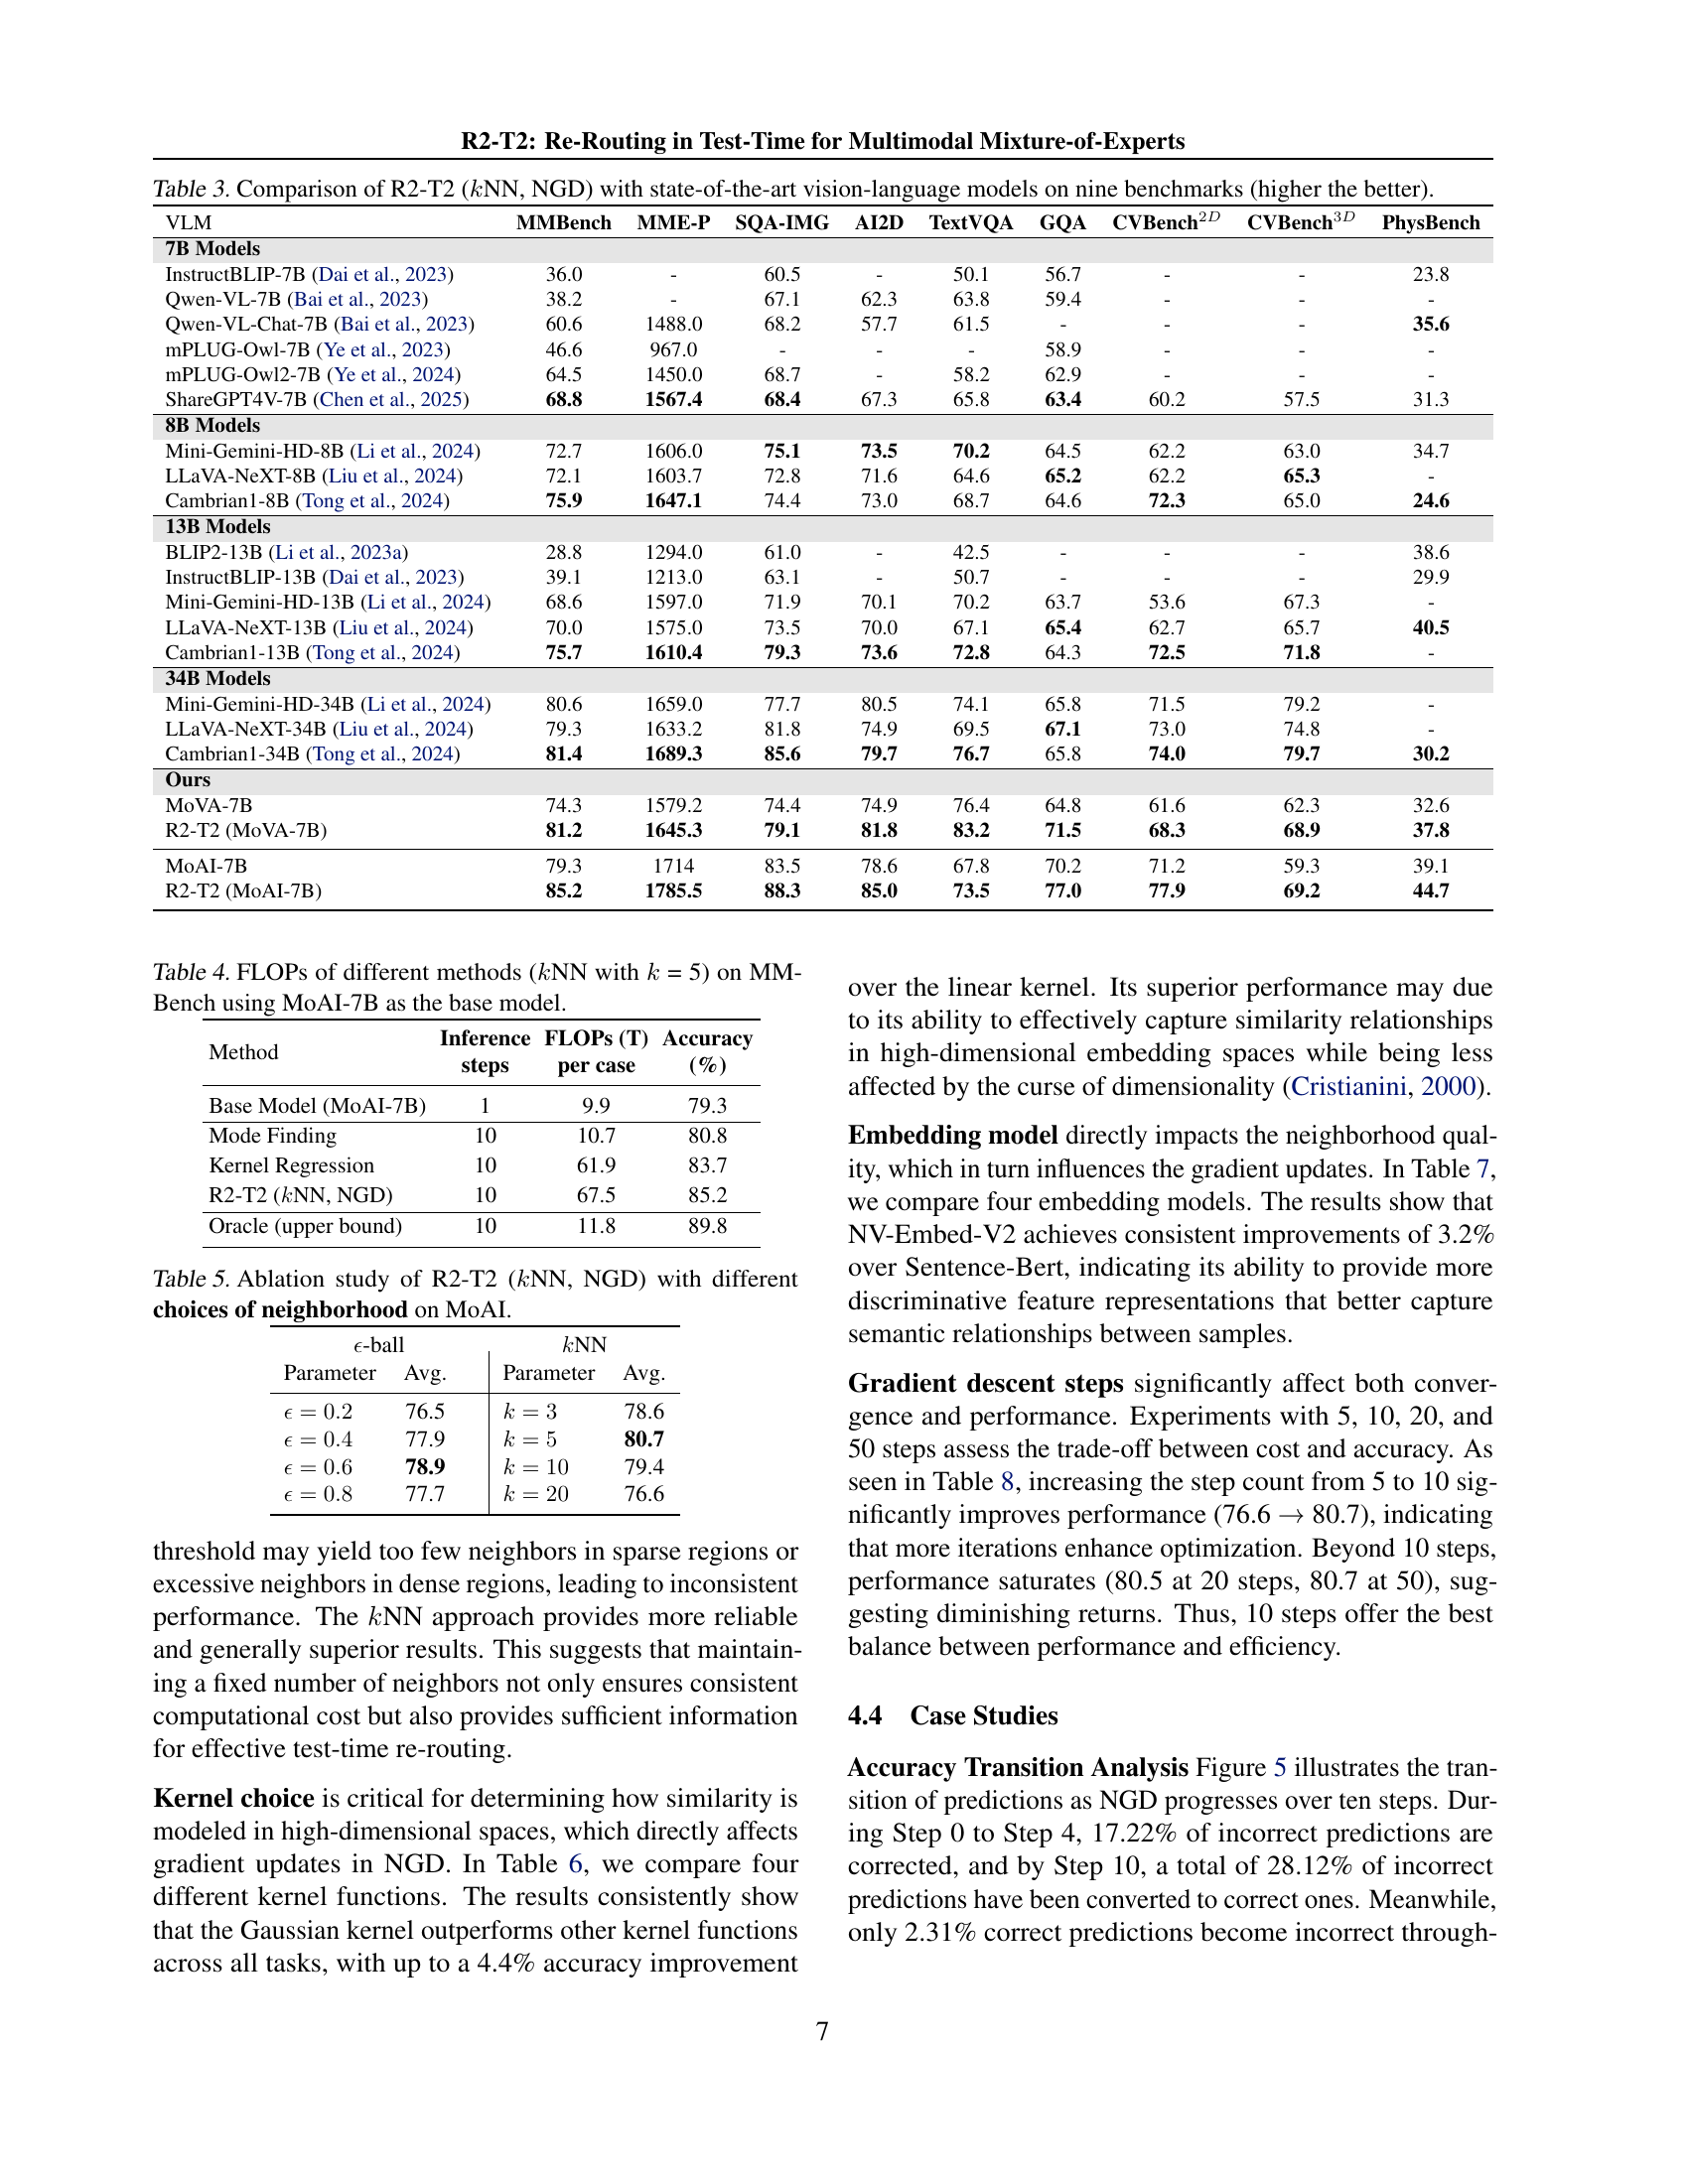
Table 3: Comparison of R2-T2 (k𝑘kitalic_kNN, NGD) with state-of-the-art vision-language models on nine benchmarks (higher the better).
| Method | Inference steps | FLOPs (T) per case | Accuracy (%) |
| Base Model (MoAI-7B) | 1 | 9.9 | 79.3 |
| Mode Finding | 10 | 10.7 | 80.8 |
| Kernel Regression | 10 | 61.9 | 83.7 |
| R2-T2 (NN, NGD) | 10 | 67.5 | 85.2 |
| Oracle (upper bound) | 10 | 11.8 | 89.8 |
🔼 This table presents a comparison of the computational cost (measured in FLOPs) and accuracy for different methods in the R2-T2 framework on the MMBench benchmark. It shows the number of FLOPs required per inference case for the base MoAI-7B model, as well as for variations that use different R2-T2 strategies (Mode Finding, Kernel Regression, and Neighborhood Gradient Descent). The kNN algorithm with k=5 was used for all R2-T2 methods. This allows for an assessment of the trade-off between computational efficiency and accuracy improvement offered by each R2-T2 approach.
read the caption
Table 4: FLOPs of different methods (k𝑘kitalic_kNN with k𝑘kitalic_k = 5) on MMBench using MoAI-7B as the base model.
| -ball | NN | |||
| Parameter | Avg. | Parameter | Avg. | |
| 76.5 | 78.6 | |||
| 77.9 | 80.7 | |||
| 78.9 | 79.4 | |||
| 77.7 | 76.6 | |||
🔼 This table presents the results of an ablation study conducted to evaluate the impact of different neighborhood selection strategies on the performance of the R2-T2 method, specifically using k-Nearest Neighbors (kNN) and Neighborhood Gradient Descent (NGD). The study was performed using the MoAI model. The table compares the performance across various benchmarks using different neighborhood sizes defined by both radius-based (e-ball) and kNN-based approaches. The goal is to determine the optimal neighborhood size and strategy for improving the accuracy of the test-time re-routing process.
read the caption
Table 5: Ablation study of R2-T2 (k𝑘kitalic_kNN, NGD) with different choices of neighborhood on MoAI.
| Kernel | Avg. |
| Linear (Cortes, 1995) | 76.3 |
| Polynomial (Cortes, 1995) | 77.7 |
| Matern (Williams & Rasmussen, 2006) | 78.7 |
| Gaussian (Williams & Rasmussen, 2006) | 80.7 |
🔼 This table presents the results of an ablation study that investigates the impact of different kernel functions on the performance of the R2-T2 method (specifically using k-Nearest Neighbors and Neighborhood Gradient Descent). The study was conducted on the MoAI multimodal model, and it shows how the choice of kernel affects various metrics across multiple benchmarks. The results provide insights into which kernel functions are best suited for the R2-T2 algorithm and its overall performance.
read the caption
Table 6: Ablation study of R2-T2 (k𝑘kitalic_kNN, NGD) with kernel choices on MoAl.
| Embedding Model | Avg. |
| Sentence-Bert (Reimers, 2019) | 77.5 |
| Stella-En-1.5B-V5 (Kusupati et al., 2022) | 78.5 |
| Gte-Qwen2-7B (Li et al., 2023c) | 78.7 |
| NV-Embed-V2 (Lee et al., 2024) | 80.7 |
🔼 This ablation study analyzes the impact of different embedding models on the performance of the R2-T2 method (specifically using k-NN and Neighborhood Gradient Descent). It shows how various embedding models affect the overall accuracy of the multimodal mixture-of-experts (MoE) model across several benchmark tasks. By comparing the accuracy achieved by different embedding models, the study evaluates the effectiveness of each model in capturing relevant information for improved routing weight optimization and enhanced performance.
read the caption
Table 7: Ablation study of R2-T2 (k𝑘kitalic_kNN, NGD) with embedding models on MoAI.
| #Step | Avg. |
| 5 | 76.6 |
| 10 | 80.7 |
| 20 | 80.5 |
| 50 | 80.7 |
🔼 This ablation study investigates the impact of varying the number of Neighborhood Gradient Descent (NGD) steps on the performance of the R2-T2 method (using k-NN and NGD) with the MoAI model. It shows the accuracy of the model on several benchmarks (MMBench, MME-P, SQA-IMG, AI2D, TextVQA, GQA, CVBench2D, CVBench3D) when different numbers of NGD steps are performed (5, 7, 10, 20, 50). The results help determine the optimal balance between accuracy and computational cost by showing how many steps are needed before improvements plateau.
read the caption
Table 8: Ablation study of R2-T2 (k𝑘kitalic_kNN, NGD) with NGD steps on MoAI.
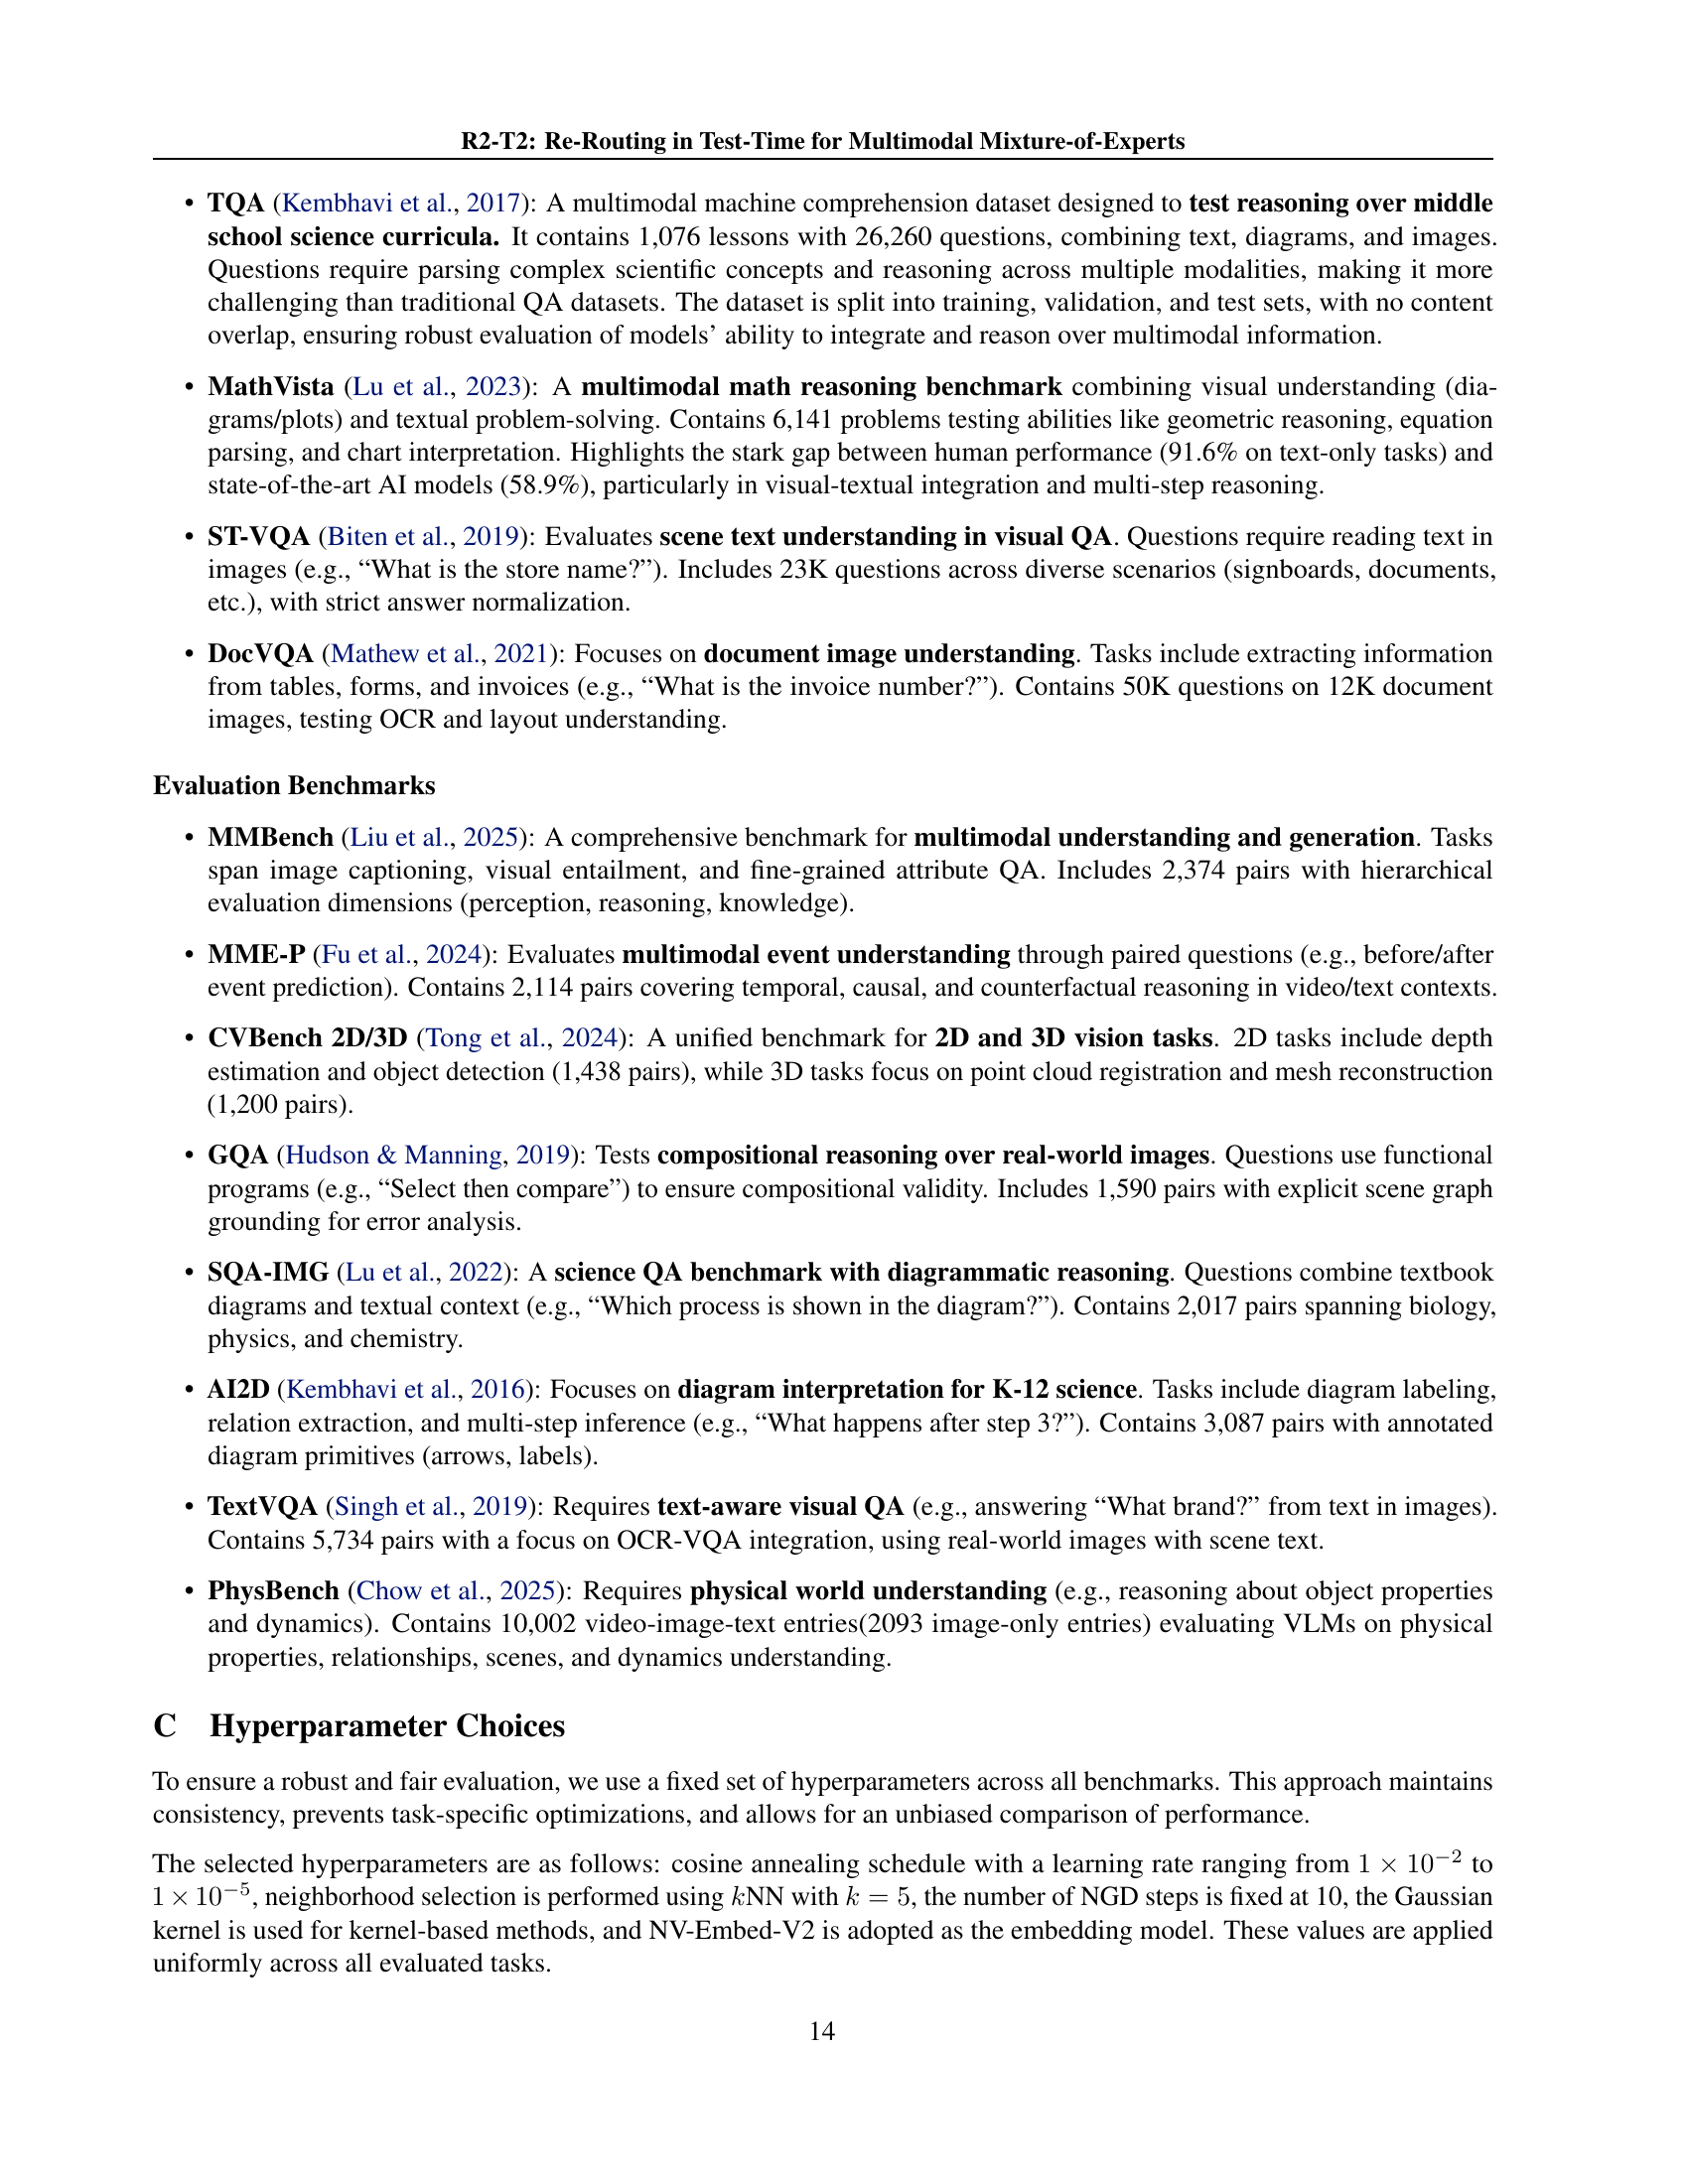
| Schedule | MMBench | MME-P | SQA-IMG | AI2D | TextVQA | GQA | CVBench2D | CVBench3D |
| Fixed () | 71.8 | 1671.2 | 74.3 | 70.9 | 60.4 | 63.1 | 66.8 | 57.2 |
| Fixed () | 75.2 | 1692.5 | 77.8 | 74.5 | 63.9 | 66.5 | 69.9 | 63.3 |
| Step Decay | 82.9 | 1745.4 | 84.2 | 81.8 | 70.5 | 73.8 | 73.5 | 67.2 |
| Cosine | 85.2 | 1785.5 | 88.3 | 85.0 | 73.5 | 77.0 | 77.9 | 69.2 |
🔼 This ablation study analyzes the impact of different learning rate schedules on the performance of the R2-T2 algorithm, specifically using kNN and Neighborhood Gradient Descent (NGD). It compares four different learning rate schedules: a fixed learning rate of 1e-3, a fixed learning rate of 1e-4, a step decay schedule, and a cosine annealing schedule. The performance is evaluated across multiple benchmarks (MMBench, MME-P, SQA-IMG, AI2D, TextVQA, GQA, CVBench2D, and CVBench3D), with accuracy measured for each schedule.
read the caption
Table 9: Ablation study of R2-T2 (k𝑘kitalic_kNN, NGD) with different learning rate schedules.
| Neighbors | Parameter | MMBench | MME-P | SQA-IMG | AI2D | TextVQA | GQA | CVBench2D | CVBench3D |
| -ball | 0.2 | 82.4 | 1733.9 | 84.8 | 81.3 | 69.9 | 73.1 | 67.1 | 66.5 |
| 0.4 | 83.9 | 1758.4 | 86.0 | 83.0 | 71.5 | 74.8 | 68.5 | 67.3 | |
| 0.6 | 85.4 | 1778.8 | 87.2 | 83.8 | 72.4 | 75.9 | 69.6 | 68.0 | |
| 0.8 | 83.7 | 1756.5 | 85.9 | 82.5 | 71.2 | 74.5 | 68.3 | 67.4 | |
| NN | 3 | 83.2 | 1740.9 | 86.1 | 83.1 | 71.3 | 75.1 | 75.8 | 67.4 |
| 5 | 85.2 | 1785.5 | 88.3 | 85.0 | 73.5 | 77.0 | 77.9 | 69.2 | |
| 10 | 84.0 | 1761.3 | 86.8 | 83.5 | 72.8 | 75.3 | 76.6 | 68.1 | |
| 20 | 80.7 | 1693.6 | 83.6 | 80.7 | 70.5 | 73.2 | 73.9 | 65.7 |
🔼 This ablation study investigates the impact of different neighborhood selection strategies on the performance of the R2-T2 method (specifically the kNN-NGD variant) when used with the MoAI model. It compares the effectiveness of using either an epsilon-ball (e-ball) or k-Nearest Neighbors (kNN) to define the neighborhood within the embedding space, and examines how the size of the neighborhood (parameterized by epsilon or k) affects the model’s accuracy across various benchmarks.
read the caption
Table 10: Ablation study of R2-T2 (k𝑘kitalic_kNN, NGD) with different choices of neighborhood on MoAI.
| Kernel | MMBench | MME-P | SQA-IMG | AI2D | TextVQA | GQA | CVBench2D | CVBench3D |
| Linear | 82.1 | 1722.3 | 84.2 | 80.8 | 69.5 | 72.8 | 72.7 | 62.1 |
| Polynomial | 83.2 | 1745.5 | 85.1 | 81.9 | 70.4 | 73.9 | 74.5 | 65.2 |
| Matern | 83.9 | 1752.8 | 85.8 | 82.5 | 71.2 | 74.6 | 76.3 | 67.8 |
| Gaussian | 85.2 | 1785.5 | 88.3 | 85.0 | 73.5 | 77.0 | 77.9 | 69.2 |
🔼 This table presents the ablation study results on the impact of different kernel functions within the R2-T2 method, specifically focusing on the Neighborhood Gradient Descent (NGD) strategy using k-nearest neighbors (kNN). It shows how variations in the kernel choice affect the overall performance of the R2-T2 method across several benchmarks. The benchmarks are likely visual reasoning tasks, and the model used is MoAI (a multimodal mixture-of-experts model). The results are likely presented in terms of accuracy, providing a quantitative measure of the influence of the kernel function selection on the model’s ability to correctly answer questions.
read the caption
Table 11: Ablation study of R2-T2 (k𝑘kitalic_kNN, NGD) with different choices of kernels on MoAI.
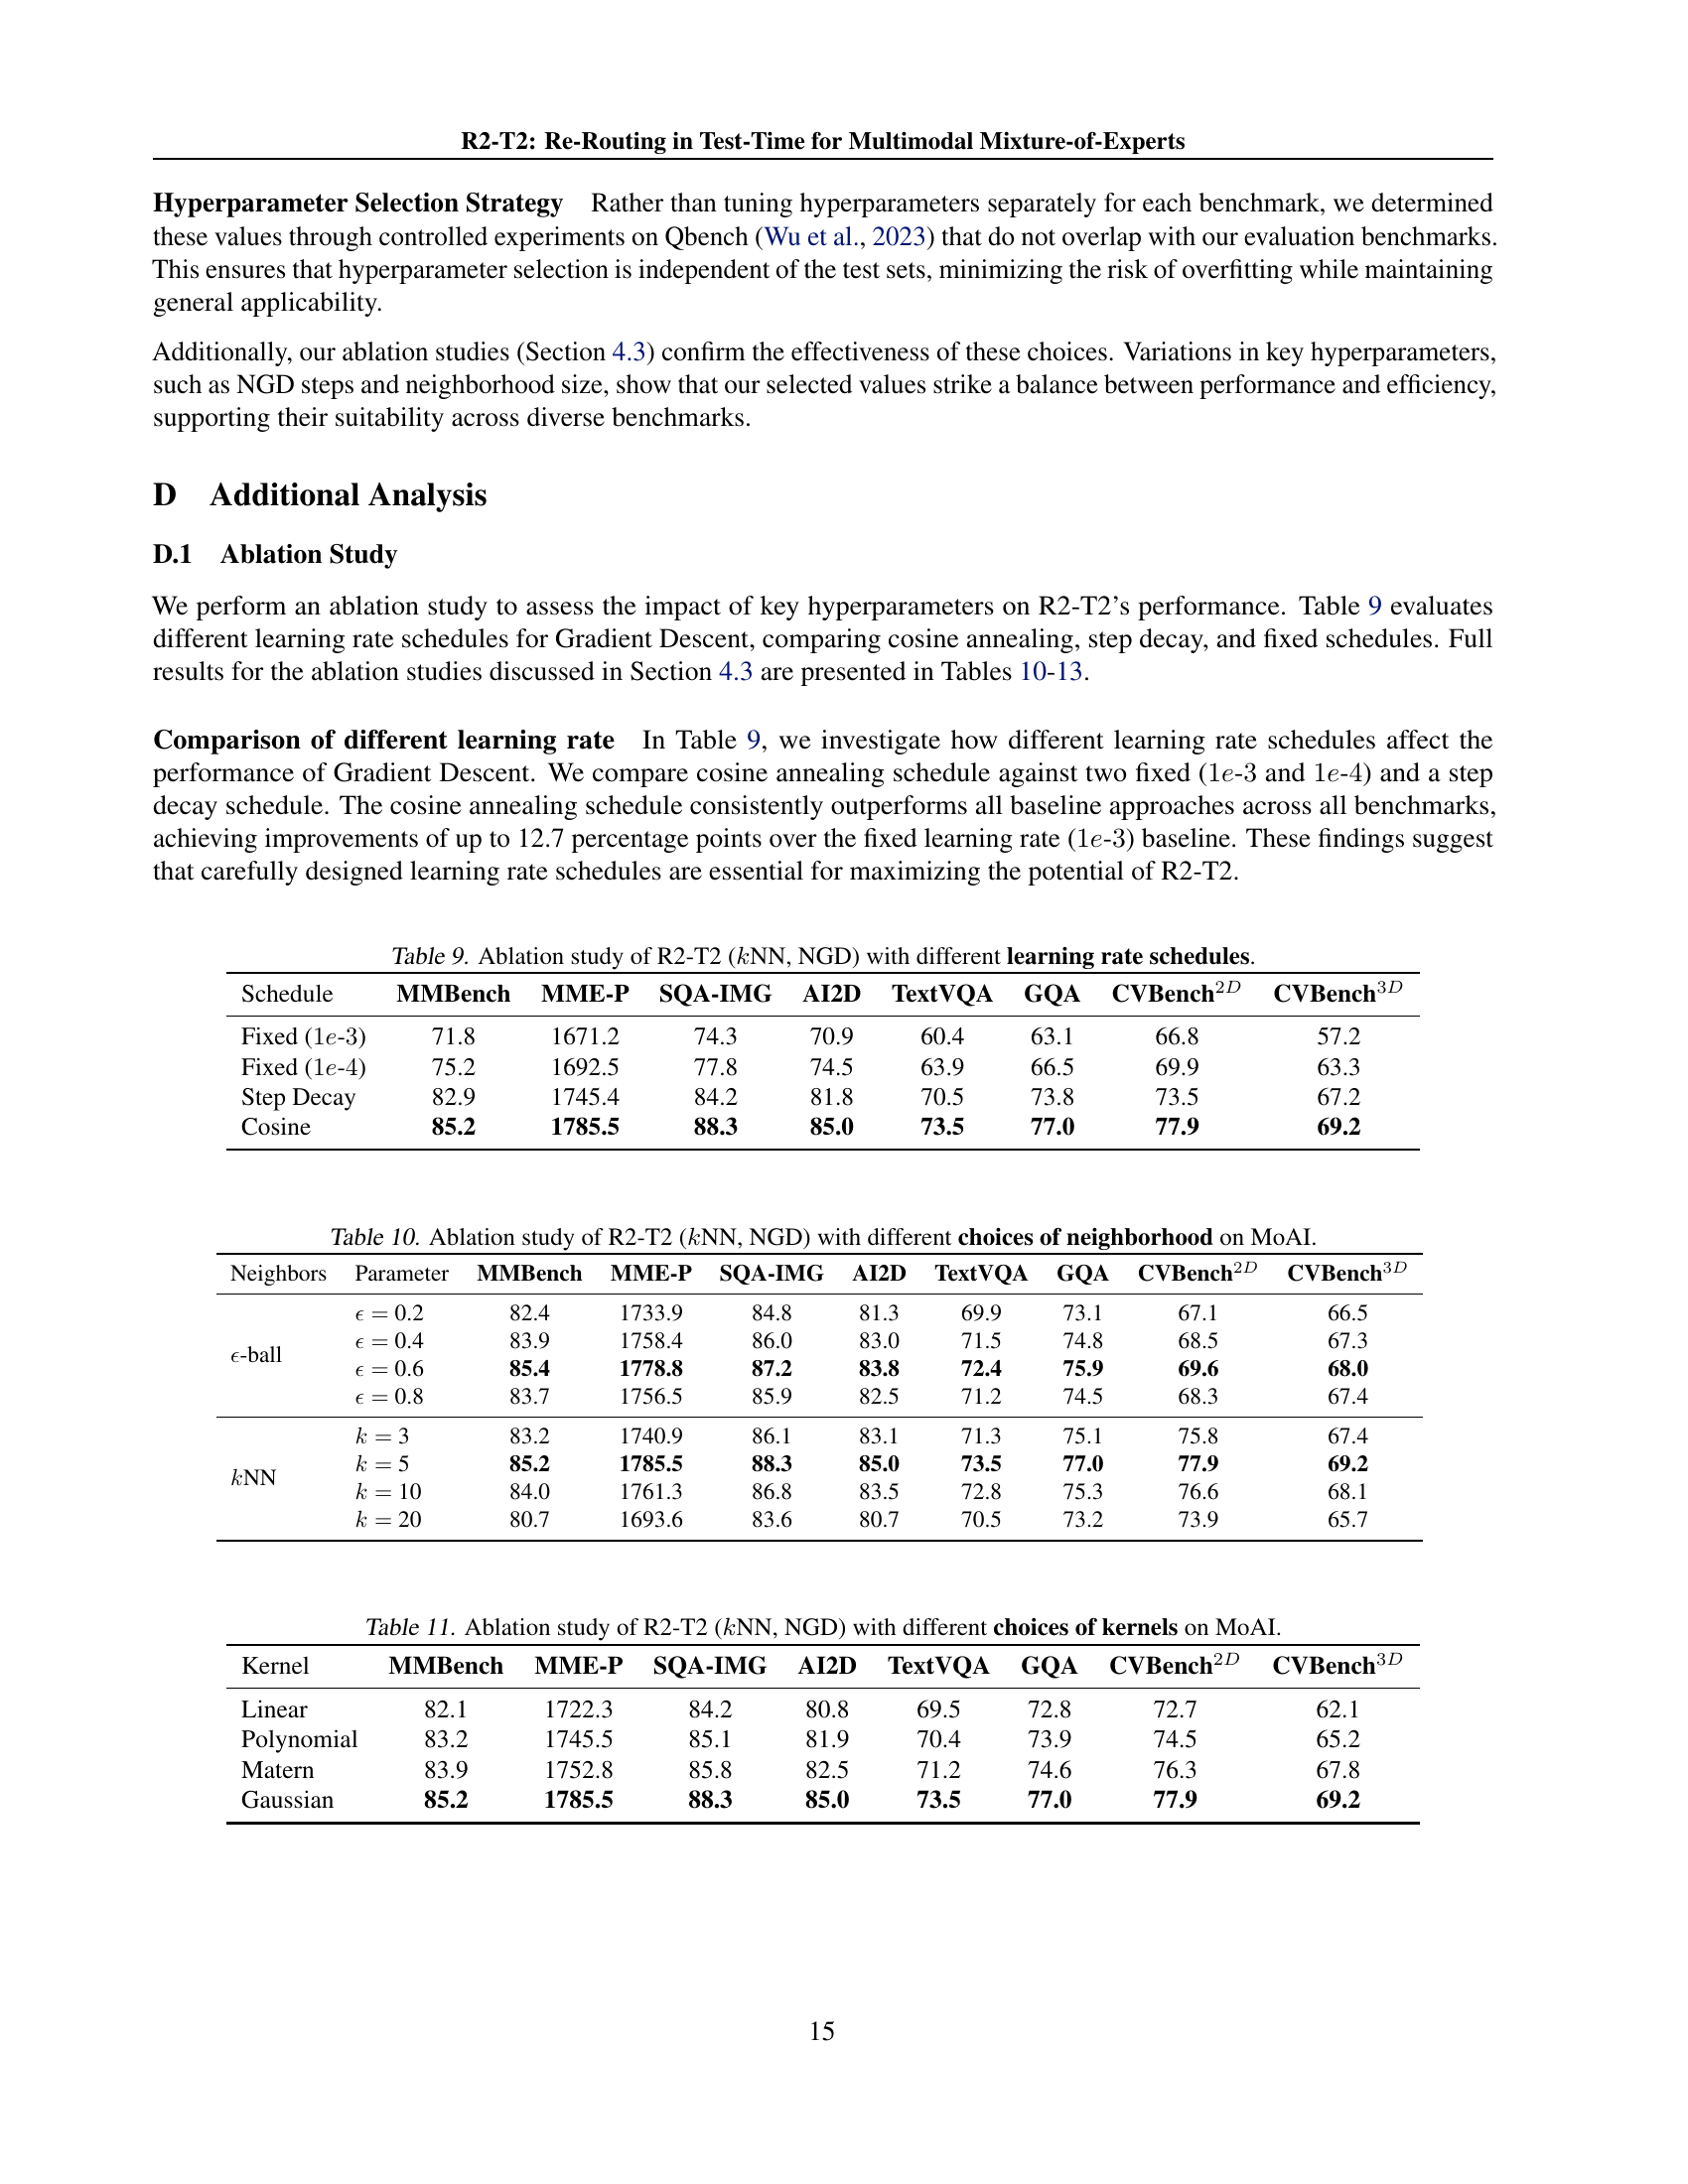
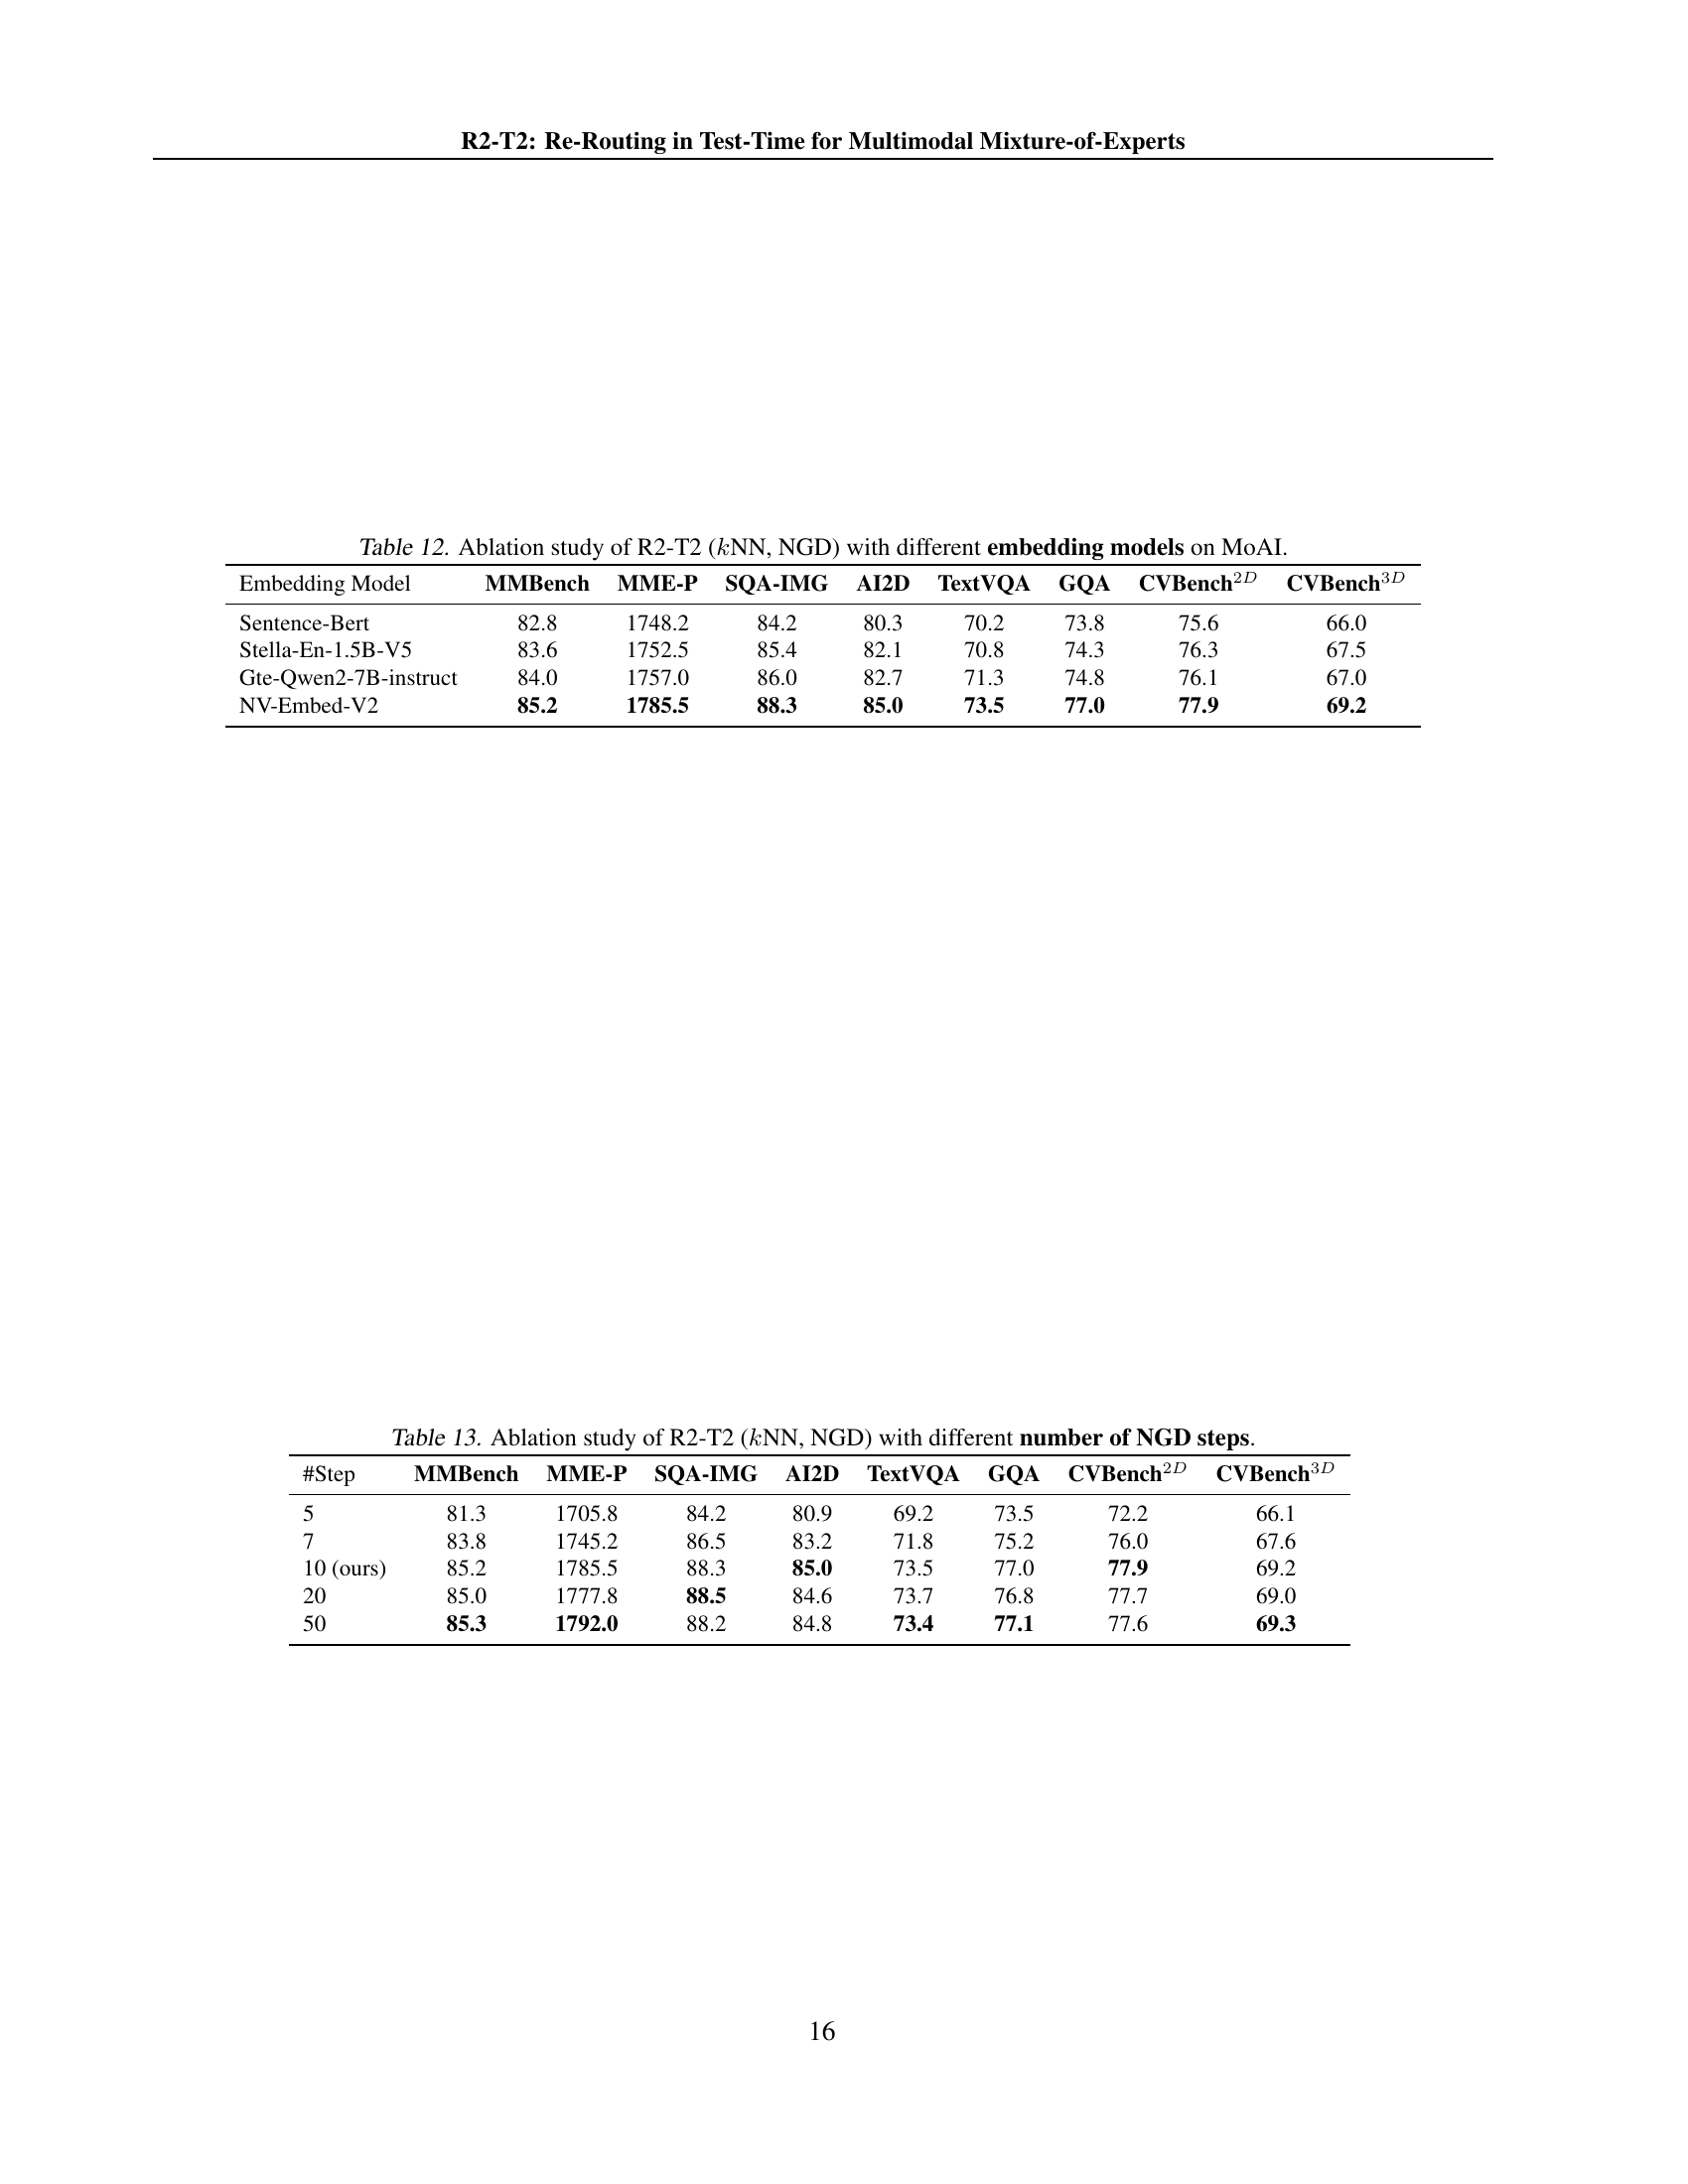
| Embedding Model | MMBench | MME-P | SQA-IMG | AI2D | TextVQA | GQA | CVBench2D | CVBench3D |
| Sentence-Bert | 82.8 | 1748.2 | 84.2 | 80.3 | 70.2 | 73.8 | 75.6 | 66.0 |
| Stella-En-1.5B-V5 | 83.6 | 1752.5 | 85.4 | 82.1 | 70.8 | 74.3 | 76.3 | 67.5 |
| Gte-Qwen2-7B-instruct | 84.0 | 1757.0 | 86.0 | 82.7 | 71.3 | 74.8 | 76.1 | 67.0 |
| NV-Embed-V2 | 85.2 | 1785.5 | 88.3 | 85.0 | 73.5 | 77.0 | 77.9 | 69.2 |
🔼 This ablation study investigates the impact of different embedding models on the performance of the R2-T2 method (specifically using k-Nearest Neighbors and Neighborhood Gradient Descent). It shows how the choice of embedding model affects the accuracy of the model across various benchmark tasks within the multimodal mixture-of-experts framework using the MoAI model.
read the caption
Table 12: Ablation study of R2-T2 (k𝑘kitalic_kNN, NGD) with different embedding models on MoAI.
| #Step | MMBench | MME-P | SQA-IMG | AI2D | TextVQA | GQA | CVBench2D | CVBench3D |
| 5 | 81.3 | 1705.8 | 84.2 | 80.9 | 69.2 | 73.5 | 72.2 | 66.1 |
| 7 | 83.8 | 1745.2 | 86.5 | 83.2 | 71.8 | 75.2 | 76.0 | 67.6 |
| 10 (ours) | 85.2 | 1785.5 | 88.3 | 85.0 | 73.5 | 77.0 | 77.9 | 69.2 |
| 20 | 85.0 | 1777.8 | 88.5 | 84.6 | 73.7 | 76.8 | 77.7 | 69.0 |
| 50 | 85.3 | 1792.0 | 88.2 | 84.8 | 73.4 | 77.1 | 77.6 | 69.3 |
🔼 This table presents the results of an ablation study that investigates the impact of varying the number of Neighborhood Gradient Descent (NGD) steps on the performance of the R2-T2 method. The study uses the k-Nearest Neighbors (kNN) approach and the NGD optimization strategy within the R2-T2 framework. The table shows how changes in the number of NGD steps affect the accuracy of the model across multiple benchmark datasets, allowing for an analysis of the trade-off between computational cost and performance gains. Different numbers of NGD steps (5, 7, 10, 20, and 50) are tested, and the accuracy achieved on several benchmark datasets (MMBench, MME-P, SQA-IMG, AI2D, TextVQA, GQA, CVBench2D, CVBench3D) is reported for each.
read the caption
Table 13: Ablation study of R2-T2 (k𝑘kitalic_kNN, NGD) with different number of NGD steps.
Full paper#