TL;DR#
Video Anomaly Detection (VAD) models often fail to generalize across diverse environments due to their reliance on pre-trained normal patterns, which requires costly retraining. This paper tackles this challenge by introducing Customizable Video Anomaly Detection (C-VAD), a technique that uses user-defined text to identify abnormal events in videos. Unlike traditional methods, C-VAD dynamically adapts to new environments without needing additional training data. This approach aims to improve the practical usability of VAD systems in real-world scenarios.
To realize C-VAD, the authors developed AnyAnomaly, a model that employs context-aware Visual Question Answering (VQA) using Large Vision Language Models (LVLMs). AnyAnomaly uses a key frame selection module and integrates positional and temporal contexts to enhance the analysis of video segments. The model was evaluated on both standard VAD benchmarks and newly created C-VAD datasets, demonstrating competitive performance and superior generalization capabilities. AnyAnomaly achieved state-of-the-art results on the UBnormal dataset and showed improvements across various anomaly types.
Key Takeaways#
Why does it matter?#
This research addresses the critical issue of generalization in VAD and offers a practical solution that can be readily deployed in diverse real-world scenarios. The use of LVLMs and context-aware VQA opens new avenues for VAD research and offers a pathway towards more adaptable and intelligent surveillance systems. The C-VAD technique and the datasets will facilitate further exploration in this area.
Visual Insights#

🔼 This figure compares traditional Video Anomaly Detection (VAD) and the proposed Customizable Video Anomaly Detection (C-VAD). Traditional VAD methods typically train on a specific environment and learn patterns of ’normal’ behavior. When encountering a new environment or scenarios with different normal activities, these models often fail due to poor generalization. This is illustrated in the left side of the figure, showing a traditional VAD model trained in a campus setting incorrectly flagging a car in a road environment as anomalous. In contrast, C-VAD uses user-defined textual descriptions to specify what constitutes an anomaly. This approach removes the need to train on specific normal patterns, offering better generalization across diverse settings, as shown on the right. The AnyAnomaly model is introduced as an example of a C-VAD approach.
read the caption
Figure 1: Comparison of traditional video Anomaly Detection (VAD) and customizable video anomaly detection (C-VAD). Traditional VAD models struggle with generalization, making them hard to apply in diverse environments, while C-VAD can handle various video environments.
| Category | Class | Baseline | +KSM | +KSM/PC | +KSM/TC | Proposed | Improvement (%) |
| Action | Skateboarding | 61.30 | 57.06 | 57.79 | 73.66 | 73.66 | +20.16 |
| Throwing | 91.41 | 72.82 | 88.74 | 82.53 | 90.67 | -0.81 | |
| Running | 53.13 | 51.93 | 53.68 | 59.77 | 60.11 | +13.14 | |
| Loitering | 61.98 | 51.96 | 81.27 | 76.94 | 81.27 | +31.12 | |
| Jumping | 82.84 | 92.89 | 92.91 | 95.31 | 95.31 | +15.05 | |
| Falling | 78.31 | 78.95 | 79.24 | 88.01 | 88.01 | +12.39 | |
| Fighting | 84.48 | 91.18 | 91.18 | 98.06 | 98.06 | +16.07 | |
| Average | 73.35 | 72.00 | 77.83 | 82.04 | 83.87 | +14.34 | |
| Appearance | Car | 88.72 | 90.96 | 91.46 | 90.96 | 91.46 | +3.09 |
| Hand truck | 95.50 | 98.20 | 98.91 | 99.20 | 99.20 | +3.87 | |
| Bicycle | 72.36 | 72.46 | 78.47 | 72.46 | 78.47 | +8.44 | |
| Motorcycle | 88.04 | 86.72 | 86.72 | 86.72 | 86.72 | -1.50 | |
| Average | 86.16 | 87.09 | 88.89 | 87.34 | 88.95 | +3.25 | |
| Overall Average | 78.01 | 77.48 | 81.85 | 83.97 | 85.72 | +9.88 |
🔼 This table presents a performance comparison of different methods for video anomaly detection on the Customizable ShanghaiTech Campus (C-ShT) dataset. It compares the baseline method (frame-level visual question answering) against variations incorporating a key frame selection module (KSM), position context (PC), and temporal context (TC). The table shows the performance (measured as improvement percentage) of each method for various anomaly categories (categorized into Action and Appearance classes), and the overall average.
read the caption
Table 1: Performance comparison on C-ShT dataset
In-depth insights#
Customizable VAD#
Customizable Video Anomaly Detection (VAD) represents a significant advancement over traditional methods by allowing users to define abnormal events through text, offering zero-shot adaptability to diverse environments without retraining. This approach leverages the power of Large Vision Language Models (LVLMs) to dynamically detect anomalies based on user-specified criteria. This contrasts sharply with conventional VAD systems that rely on pre-learned normal patterns, which struggle to generalize across varying scenarios. By enabling users to define anomalies, customizable VAD enhances the practicality and applicability of video analysis in real-world settings, where the definition of ‘abnormal’ can be highly context-dependent. However, challenges exist in balancing accuracy and computational cost, particularly with complex scenarios or multiple simultaneous anomalies. Future research should focus on improving the efficiency and robustness of LVLM-based customizable VAD systems to ensure they can be deployed effectively in real-time applications.
Context-Aware VQA#
Context-aware Visual Question Answering (VQA) is a critical component for advanced image and video understanding. It allows models to not only identify objects but also interpret their relationships and the overall scene context. This is particularly important in scenarios like video anomaly detection, where understanding the environment and temporal dependencies is crucial for accurate predictions. Traditional VQA focuses on answering questions based solely on the visual content, while context-aware VQA incorporates additional information like spatial relationships, scene attributes, and temporal context. This contextual enrichment enhances the model’s ability to reason about the scene and provide more accurate and relevant answers. In video analysis, this could involve understanding the flow of events over time or the typical behavior expected in a given location. By leveraging context, VQA systems can move beyond simple object recognition to a more nuanced understanding of the visual world, leading to better performance in complex tasks.
AnyAnomaly Model#
The AnyAnomaly model pioneers a novel approach to video anomaly detection by ingeniously leveraging large vision language models (LVLMs) without requiring task-specific fine-tuning. This customizable video anomaly detection (C-VAD) technique redefines anomaly detection by considering user-defined textual descriptions of abnormal events, enabling zero-shot adaptability across diverse environments. The architecture likely incorporates a key frame selection module to reduce computational overhead, followed by a context-aware visual question answering (VQA) module enhanced with positional and temporal contexts to improve understanding of surveillance video characteristics. The model’s innovation lies in its ability to dynamically detect anomalies based on user-specified criteria, overcoming the limitations of traditional methods that rely on pre-learned normal patterns. The combination of efficient frame selection and contextual VQA allows the AnyAnomaly model to achieve competitive performance on standard datasets and superior generalization capabilities.
Zero-Shot C-VAD#
Zero-Shot Customizable Video Anomaly Detection (C-VAD) presents a significant leap, moving beyond the constraints of traditional models dependent on extensive training data and predefined normal patterns. Its core strength lies in its adaptability to diverse environments without retraining, achieved by leveraging user-defined textual descriptions of abnormal events. This eliminates the need for specialized AI expertise, high-performance hardware, and extensive data collection. LVLM’s generalization and the context-aware visual question answering technique, enable the system to identify anomalies dynamically based on user-provided descriptions. This flexibility is crucial for real-world applications where anomaly definitions can vary greatly. By considering user input, C-VAD overcomes limitations of fixed normal patterns, promising enhanced anomaly detection across various scenarios.
LVLM for C-VAD#
LVLMs hold immense potential for C-VAD by leveraging their ability to understand both visual and textual information. This can enable zero-shot or few-shot anomaly detection, where the model can identify abnormal events based on user-defined descriptions, without requiring extensive training on specific datasets. Context-awareness is crucial; LVLMs need to understand the scene’s context (location, time, and activity) to accurately identify anomalies. Furthermore, they must be able to handle the complexity of surveillance videos, including occlusions, varying lighting conditions, and camera angles. Temporal reasoning is also essential, as anomalies often manifest as unusual sequences of events rather than isolated incidents. Effective prompt engineering is needed to elicit the desired behavior from LVLMs, guiding them to focus on relevant aspects of the scene and provide accurate anomaly scores. However, challenges remain in addressing the computational cost and latency associated with LVLMs, as well as mitigating biases and ensuring robustness to adversarial attacks. Future research can focus on developing efficient architectures and training strategies to overcome these limitations and unlock the full potential of LVLMs for C-VAD, leading to more accurate, robust, and customizable video surveillance systems.
More visual insights#
More on figures
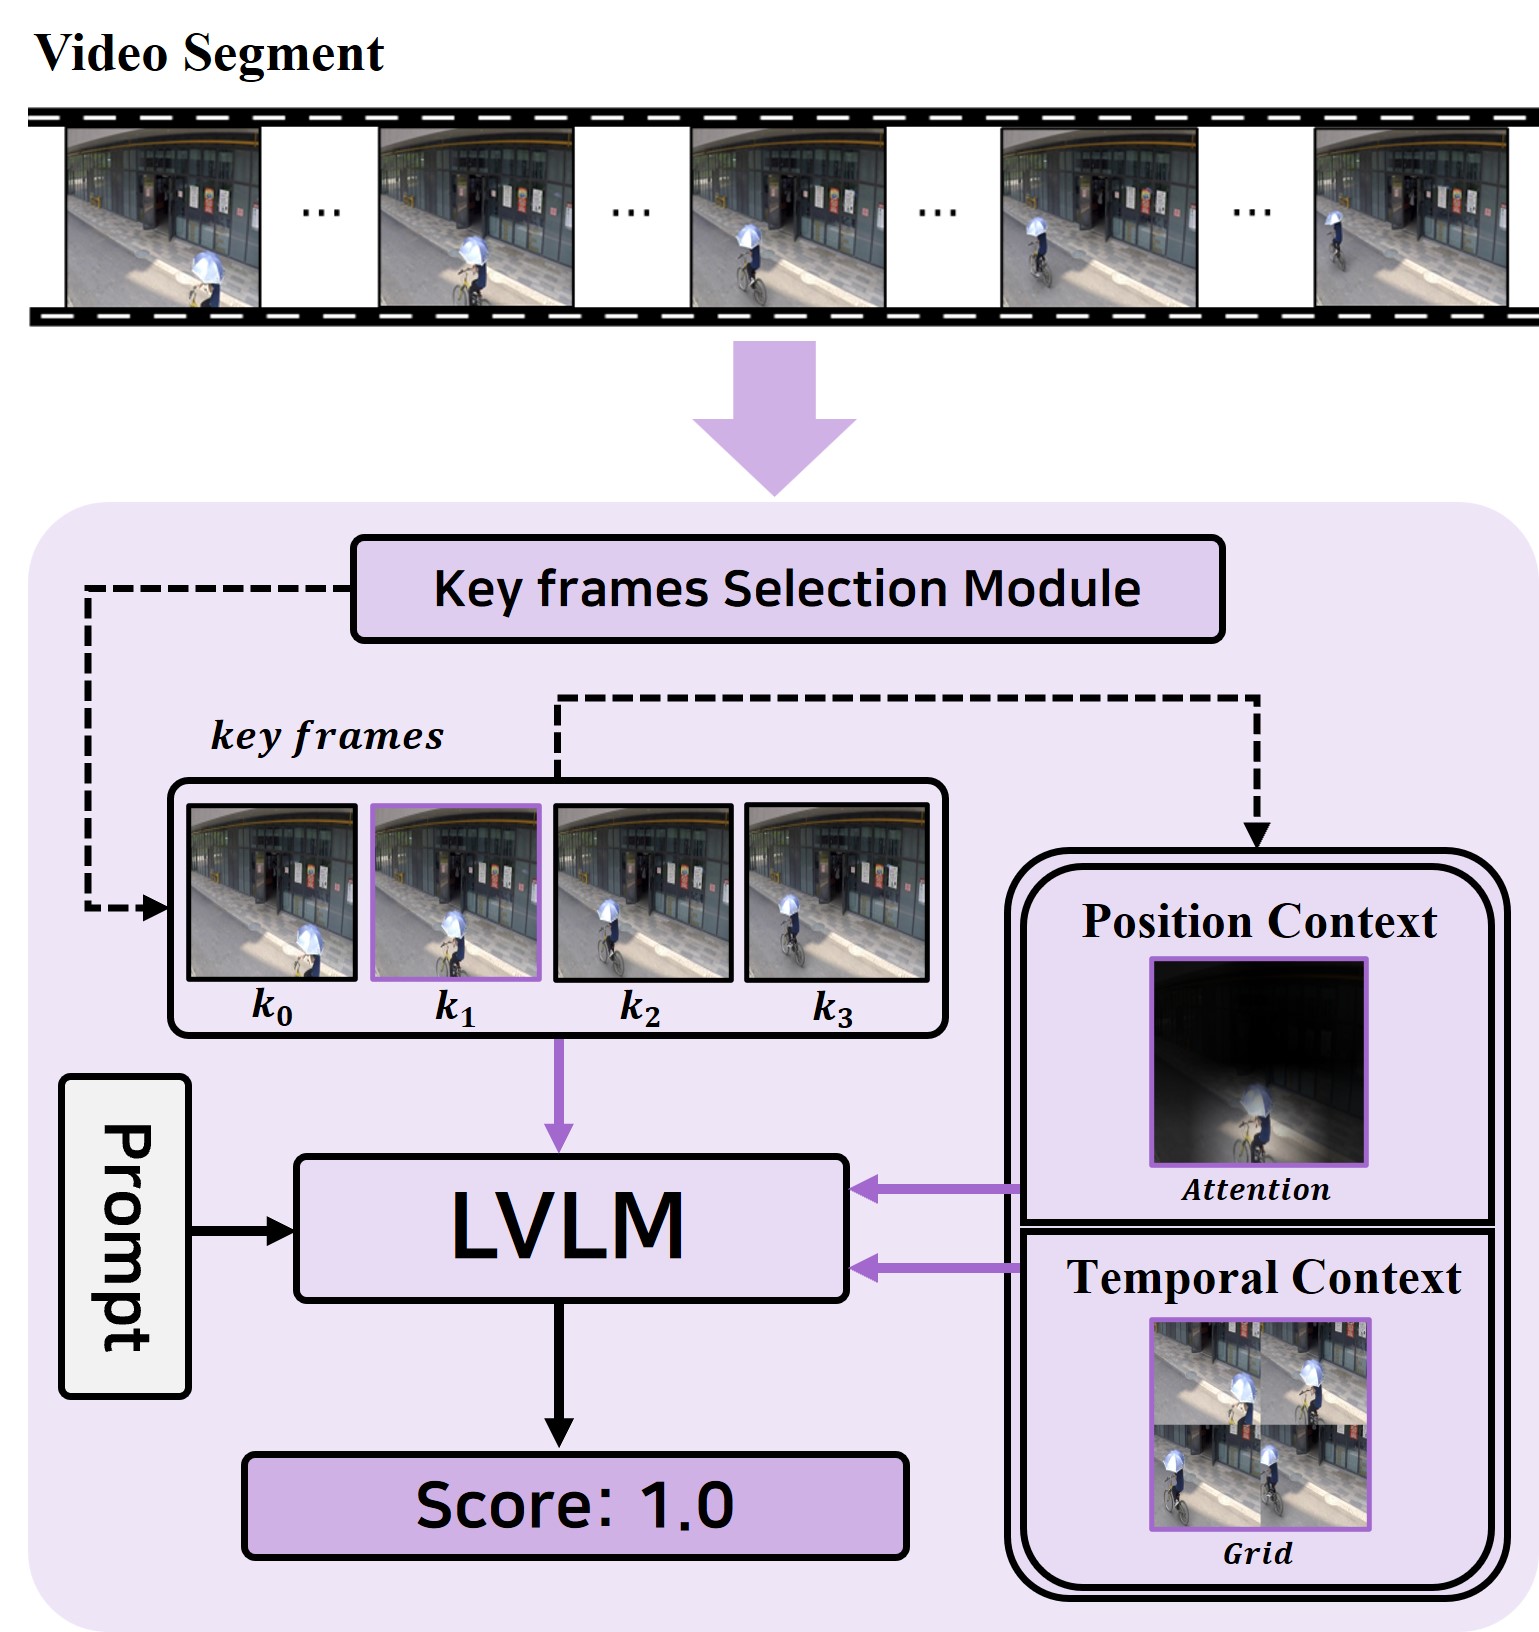
🔼 AnyAnomaly processes a video segment by first using a key frame selection module to choose representative frames. These frames are then used to generate position context (PC) highlighting important locations and temporal context (TC) showing scene changes over time. PC and TC, along with the representative frame, are fed into a large vision language model (LVLM) along with a user-defined text prompt describing the anomalous event. The LVLM outputs an anomaly score indicating the likelihood of the described event being present in the segment.
read the caption
Figure 2: The architecture of AnyAnomaly
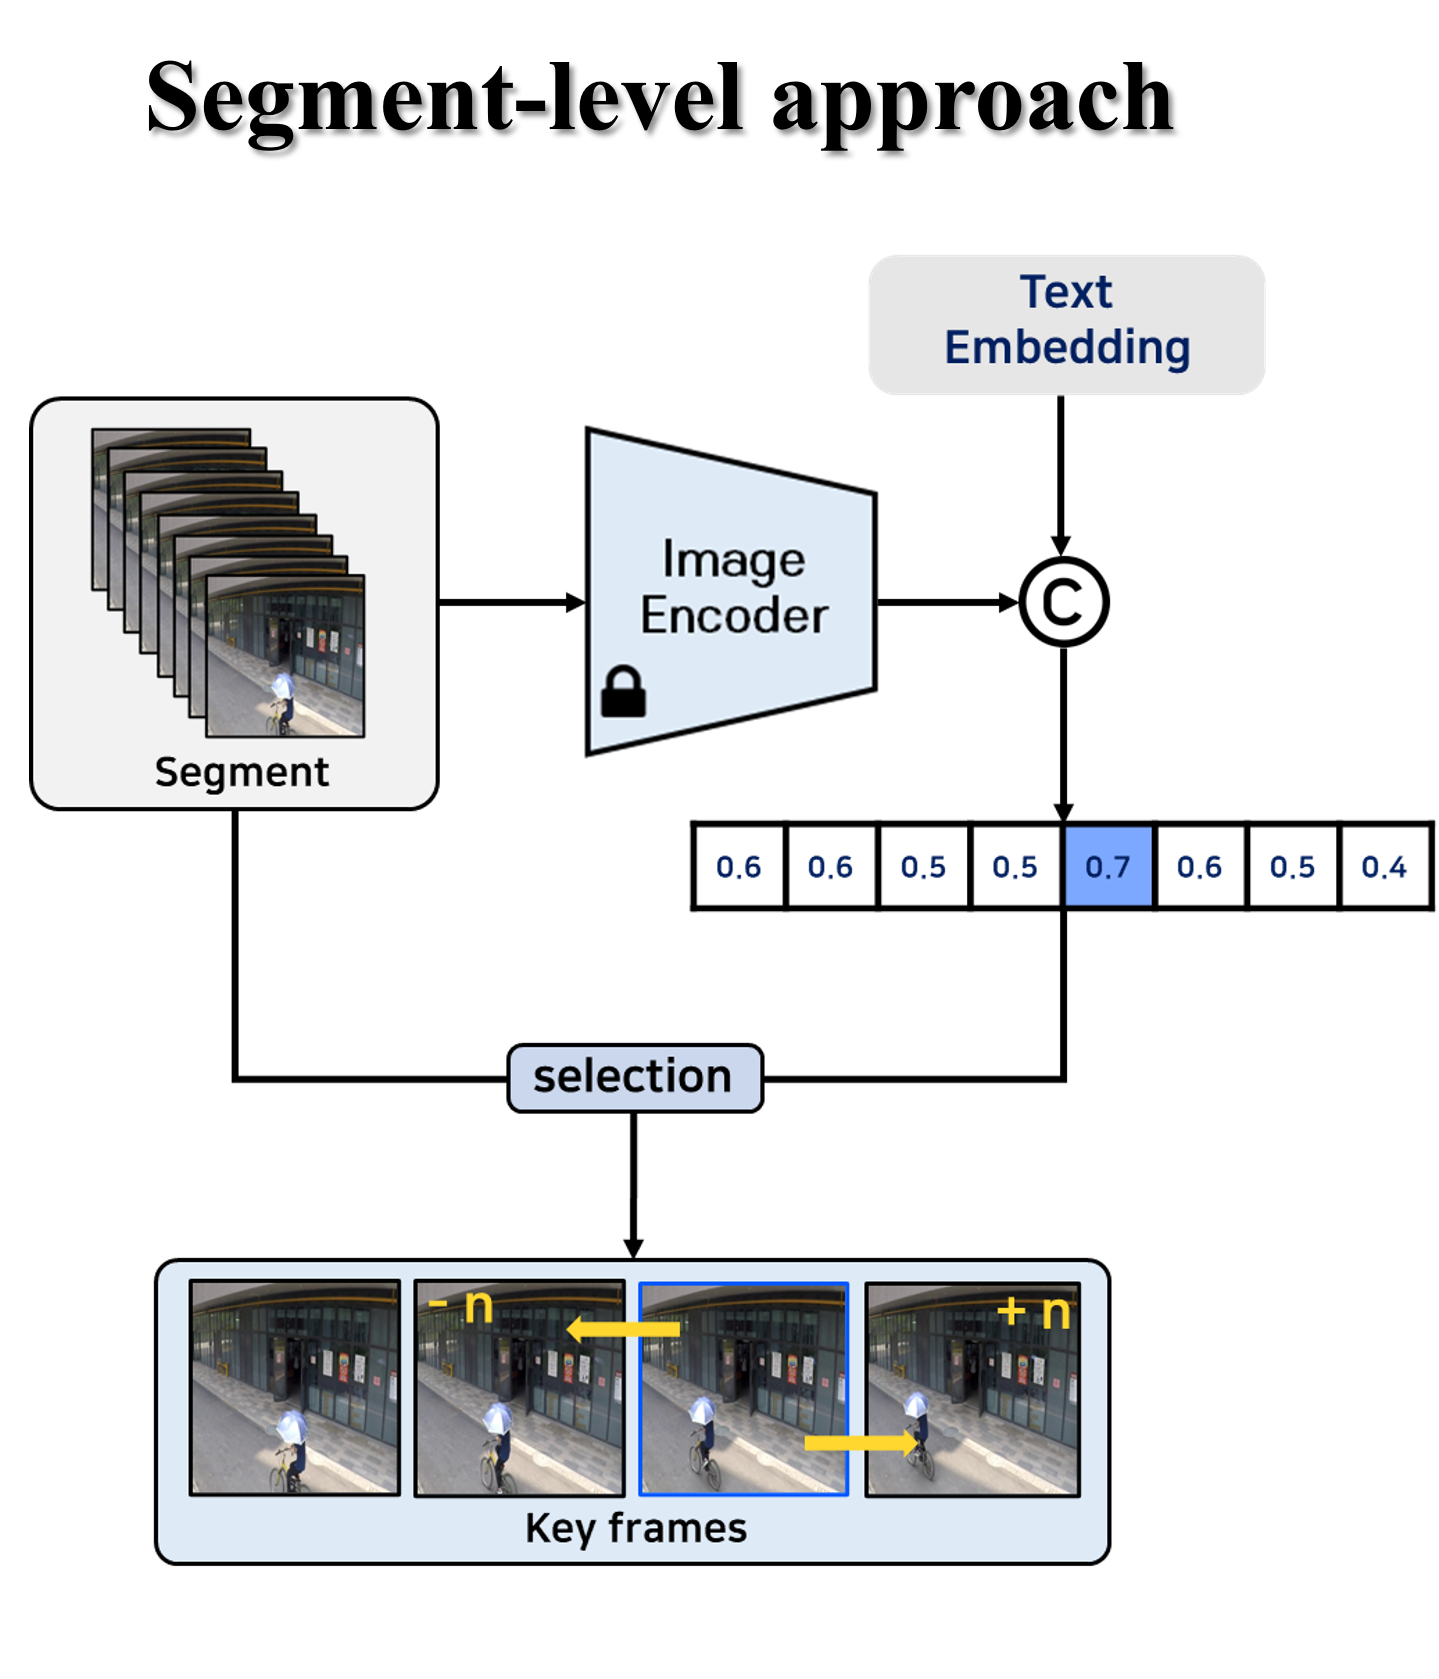
🔼 The Key Frames Selection Module (KSM) is a crucial component in AnyAnomaly’s segment-level approach to video anomaly detection. It efficiently selects four keyframes from a video segment to represent the entire segment for processing. This selection process utilizes the CLIP model to determine the frames most relevant to the user-defined abnormal event. By selecting representative keyframes, KSM significantly reduces computational cost while maintaining effective anomaly detection.
read the caption
(a) Key frames Selection Module (KSM)
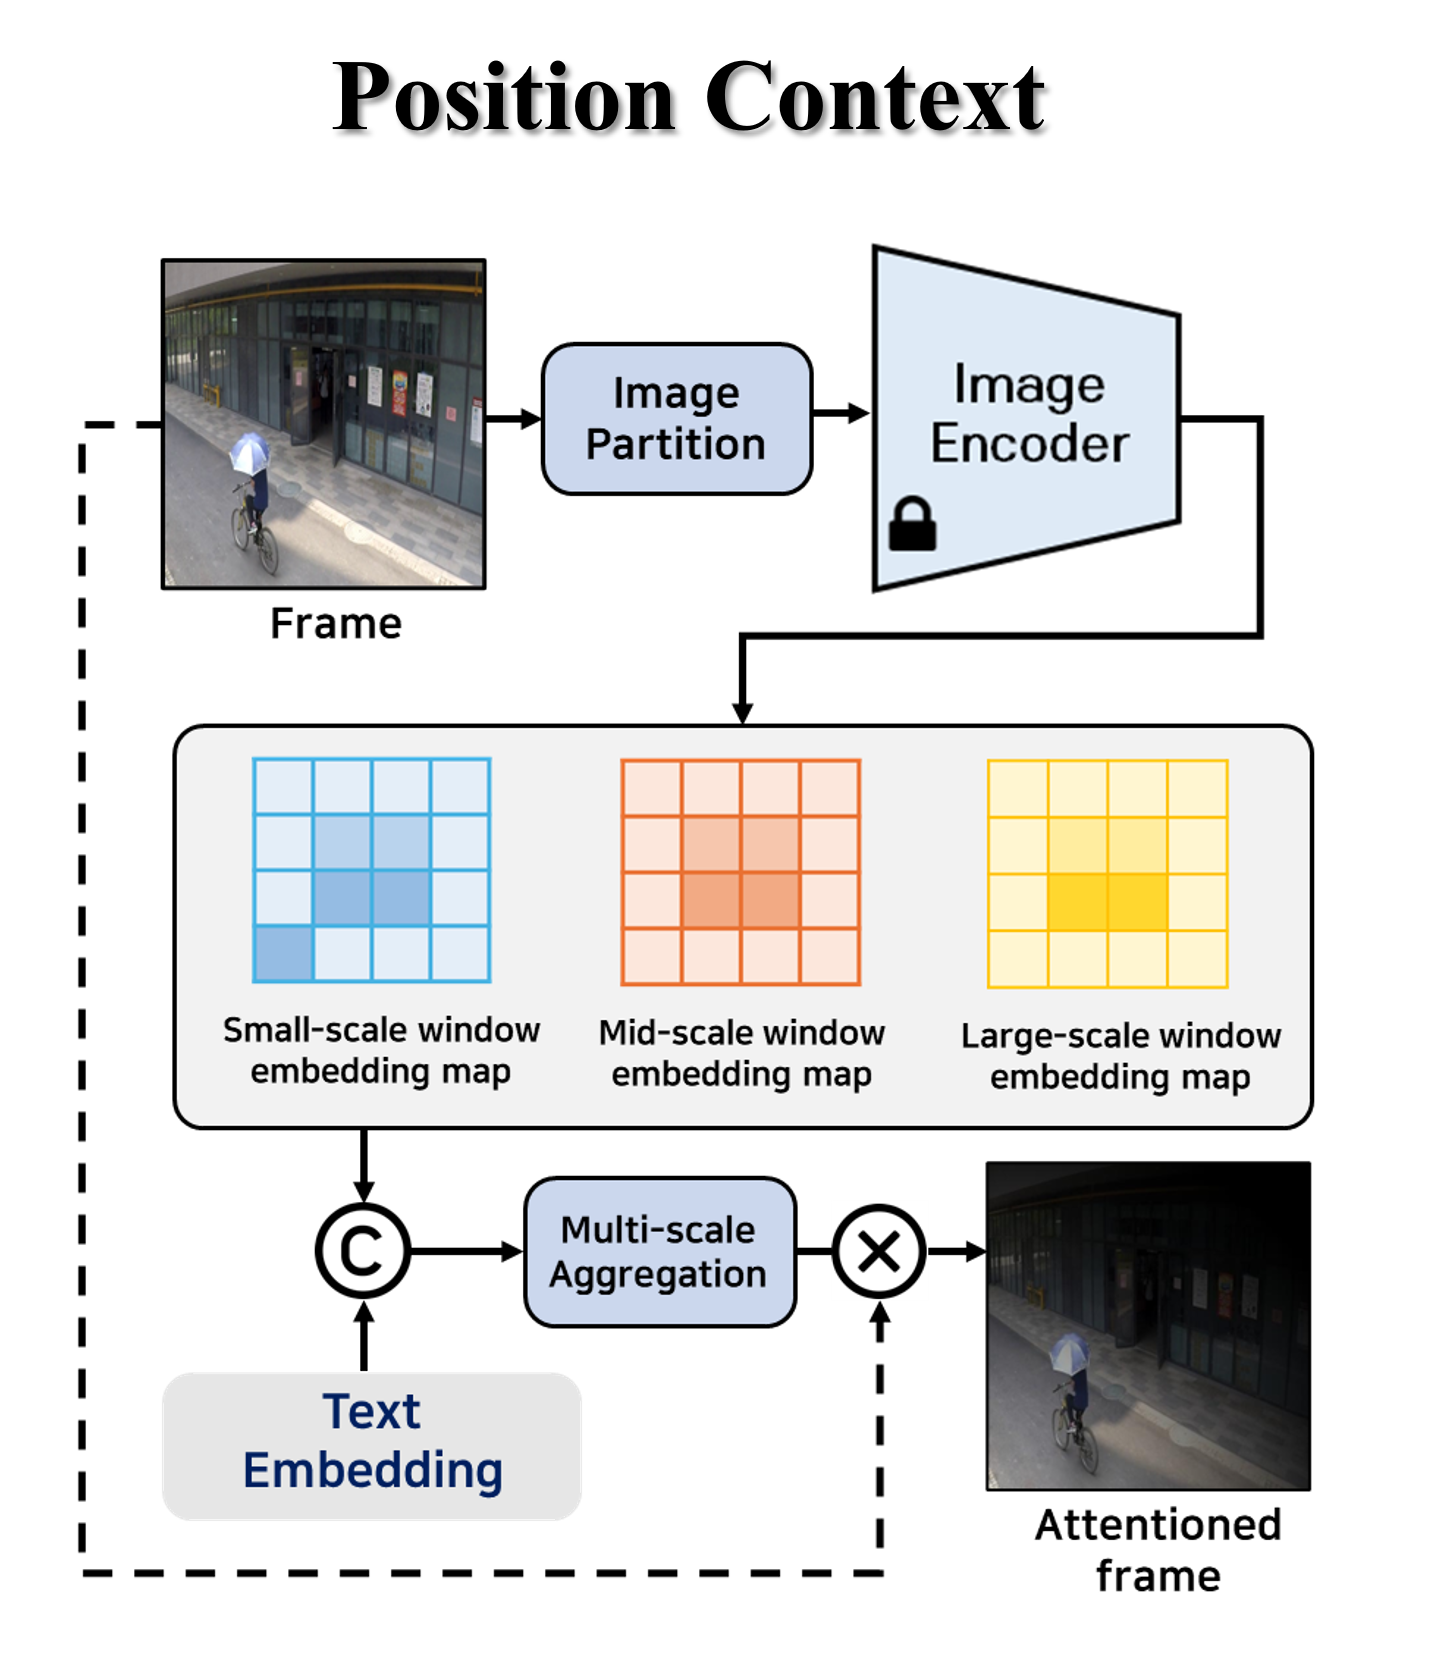
🔼 The WinCLIP-based Attention (WA) module enhances the object analysis capability of the Large Vision Language Model (LVLM) by emphasizing regions related to the user-provided text in the key frame. It uses a multi-scale approach, generating embeddings from small, medium, and large-scale windows of the key frame. These embeddings are compared to the text embedding, generating a similarity map that highlights important regions. This similarity map, combined with the key frame, creates the position context (PC) input for the LVLM.
read the caption
(b) WinCLIP-based Attention (WA)
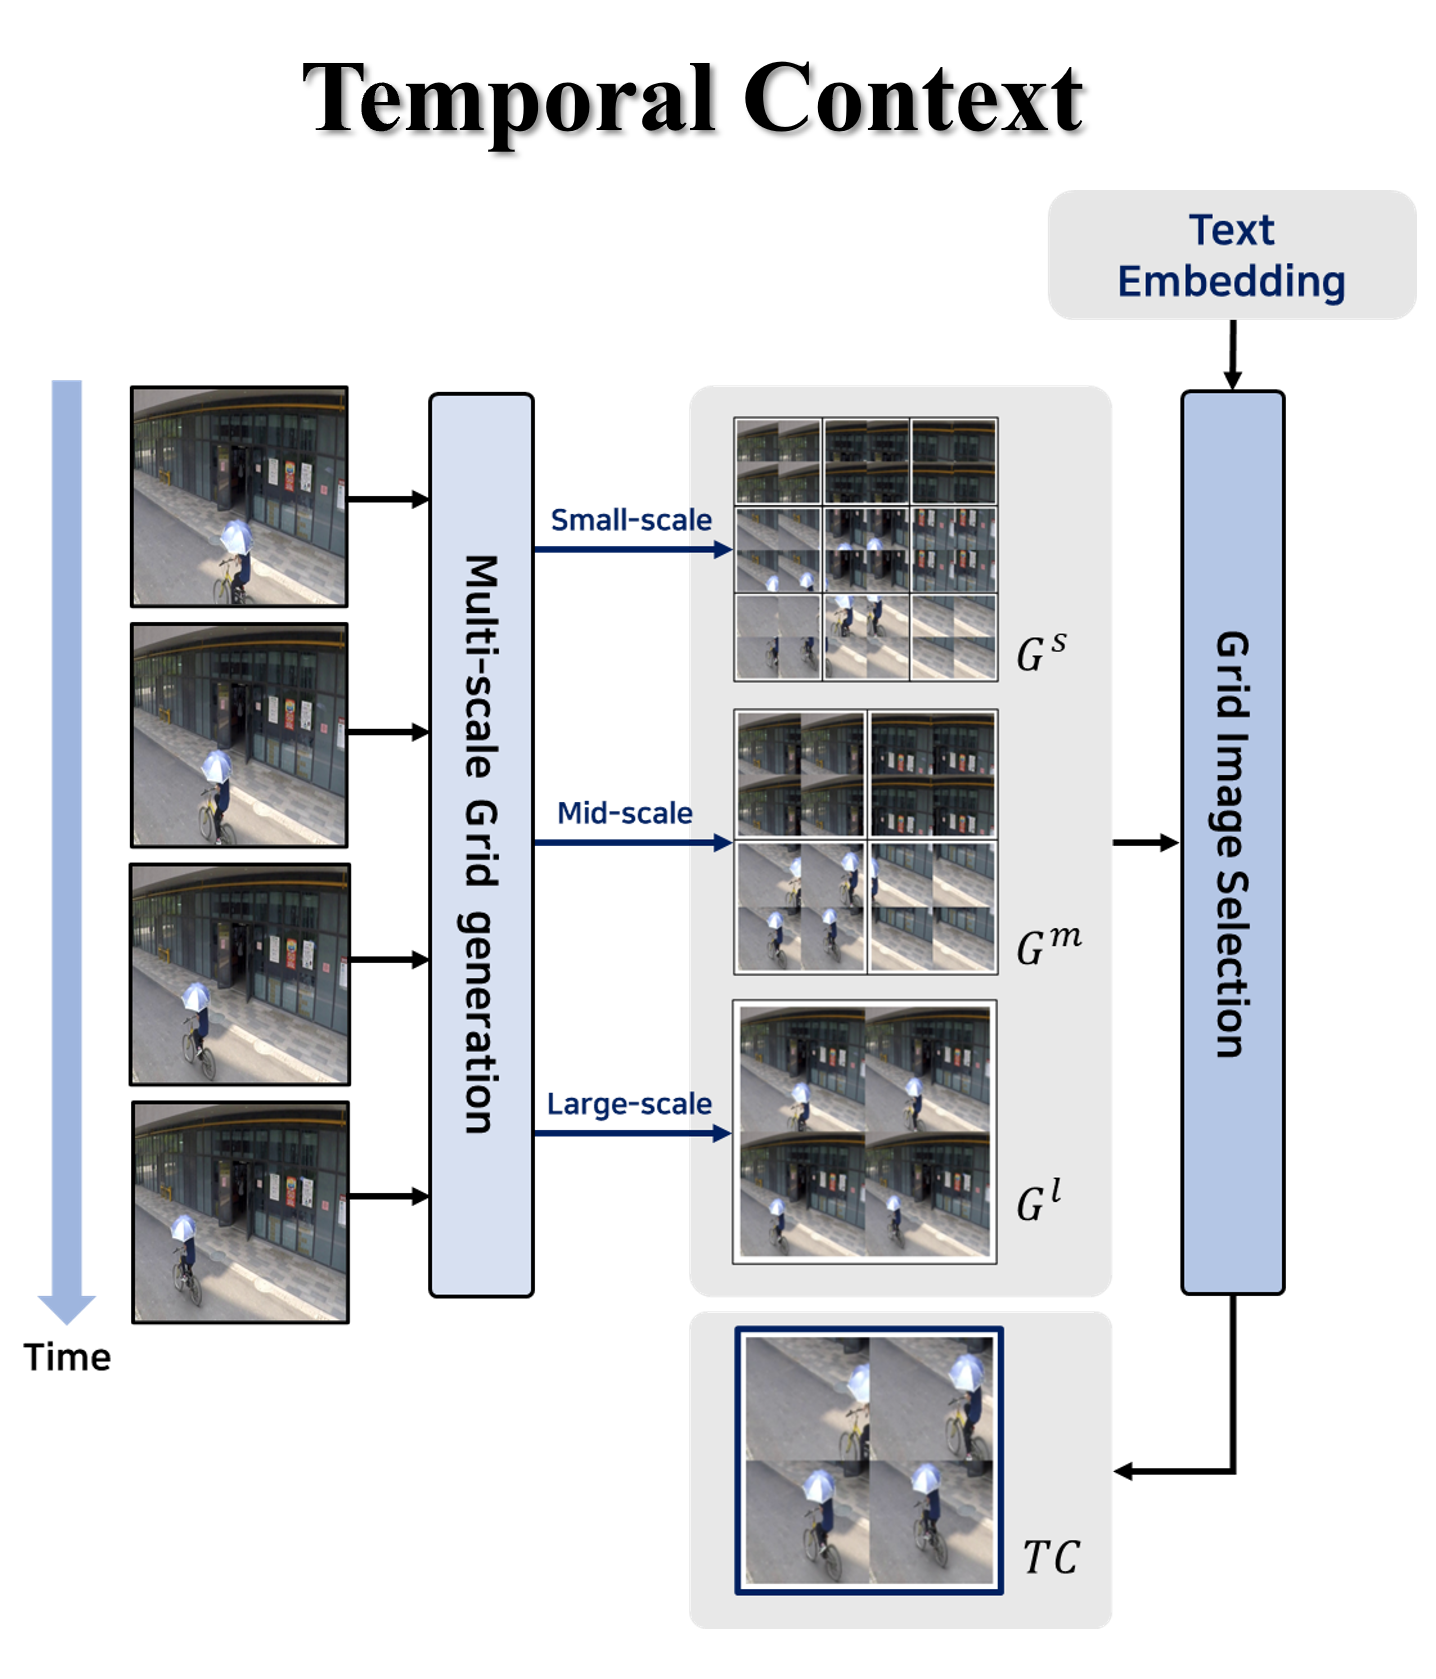
🔼 This module generates temporal context (TC) for context-aware VQA. It takes the key frames selected by the Key Frame Selection Module as input. These frames are divided into multiple windows, and windows at the same position are combined into a 2x2 grid to create grid images at different scales (small, medium, and large). These grid images represent the temporal evolution of the scene across these key frames. Finally, the grid image with the highest similarity to the user-provided text is selected as the temporal context to be fed to the large vision language model.
read the caption
(c) Grid Image Generation (GIG)

🔼 This figure details the architecture of the AnyAnomaly model’s core modules. The Key Frame Selection Module (KSM) is highlighted as fundamental to the model’s segment-level processing, which improves efficiency by analyzing groups of frames instead of individual frames. The figure then illustrates the WinCLIP-based Attention (WA) and Grid Image Generation (GIG) modules. WA refines object analysis by focusing attention on relevant image regions based on textual input. GIG incorporates temporal context by generating grid-based representations from sequences of frames, enhancing the model’s understanding of actions and events over time. The combination of KSM, WA, and GIG enables context-aware visual question answering (VQA), allowing AnyAnomaly to accurately detect anomalies based on user-defined descriptions.
read the caption
Figure 3: Architecture of the proposed modules. KSM is essential for the segment-level approach, and WA and GIG are crucial for context generation.

🔼 This figure shows the detailed prompt engineering used for visual question answering (VQA) in the AnyAnomaly model. The prompt is broken down into three main sections: Task, Consideration, and Output. The ‘Task’ section clearly defines the objective of the VQA task, which is to evaluate the presence of a user-specified textual description (e.g., ‘bicycle’) within a given image on a scale of 0 to 1. The ‘Consideration’ section provides additional instructions to guide the model towards more accurate results. It emphasizes that the presence of the target object, regardless of its visual prominence or central position within the image, should be considered. Finally, the ‘Output’ section specifies the desired format of the model’s response, requiring a numerical score (rounded to one decimal place) along with a concise textual explanation justifying the score. For temporal context, an additional ‘Context’ section was added to describe the temporal sequence shown in the images.
read the caption
Figure 4: Proposed prompt for VQA

🔼 Figure 5 illustrates the key difference in data organization between traditional Video Anomaly Detection (VAD) datasets and the proposed Customizable Video Anomaly Detection (C-VAD) datasets. Traditional VAD datasets contain videos with a mix of normal and abnormal events, without explicitly labeling or categorizing the types of anomalies. In contrast, C-VAD datasets organize videos into categories based on specific abnormal events (e.g., bicycle, car). Each category contains positive examples (videos showcasing the event) and negative examples (videos without the event). This structured approach allows for more precise evaluation of anomaly detection performance for specific anomaly types and is crucial for the zero-shot learning paradigm.
read the caption
Figure 5: Comparison between the VAD and C-VAD datasets

🔼 This figure visualizes the performance of the proposed AnyAnomaly model on two example video segments. The top row shows a segment containing a bicycle, while the bottom row shows a segment with a person jumping. For each segment, it displays the anomaly scores over time (ground truth and prediction) and shows the importance of position context and temporal context in improving the accuracy of anomaly detection. The visualizations demonstrate how including contextual information enhances AnyAnomaly’s ability to correctly identify and classify anomalous events compared to using only the keyframe.
read the caption
Figure 6: Anomaly score comparison and context visualization

🔼 This figure details the design of prompts used for visual question answering (VQA) in the AnyAnomaly model. It shows three prompt variations. The first, a ‘simple version,’ just requests an anomaly score. The second adds a ‘reasoning’ component, requiring a brief explanation along with the score. The third prompt includes a ‘consideration’ section emphasizing that an object’s presence should be given a high score even if it isn’t the main focus of the image. A final version also adds a ‘context’ element to handle temporal data within a video segment, instructing the model to treat the input as a sequence of frames.
read the caption
Figure S1: Prompt details. The content written in the simple version is not utilized when applying reasoning.

🔼 This figure demonstrates how position and temporal context contribute to the accuracy of video anomaly detection. The top example shows a situation where a bicycle is partially visible in a frame. Using only the key frame yields a low anomaly score. However, incorporating position context (PC), which uses attention to highlight the relevant area of the key frame, significantly improves the score, accurately identifying the bicycle. The bottom example shows a person jumping. Again, the key frame alone doesn’t fully capture the action. However, using temporal context (TC), which incorporates information across a sequence of frames to better understand the action, provides a much higher and more accurate anomaly score. This illustrates the complementarity of position and temporal context for effective anomaly detection.
read the caption
Figure S2: Example of complementarity between position and temporal context. The first example highlights the importance of position context and the second example emphasizes the importance of temporal context.

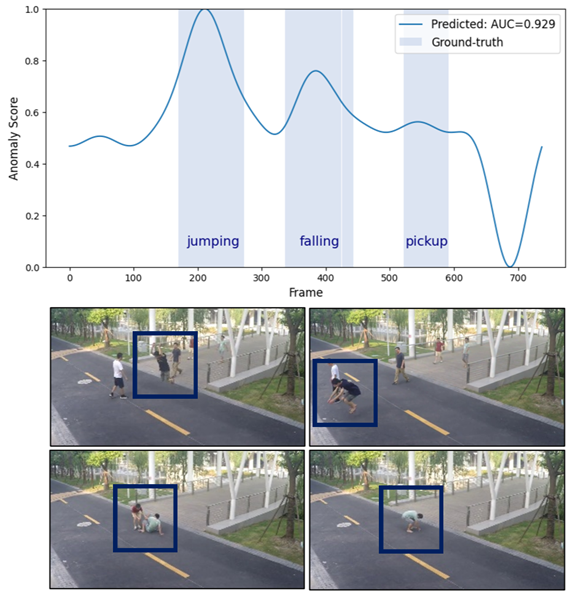
🔼 This figure visualizes the anomaly detection scores for a video segment containing three types of anomalous events: jumping, falling, and a person picking something up. The plot displays the anomaly scores over time, with the ground truth labels indicating the presence and type of anomaly. The high scores in the corresponding regions indicate successful anomaly detection.
read the caption
(a) jumping-falling-pickup
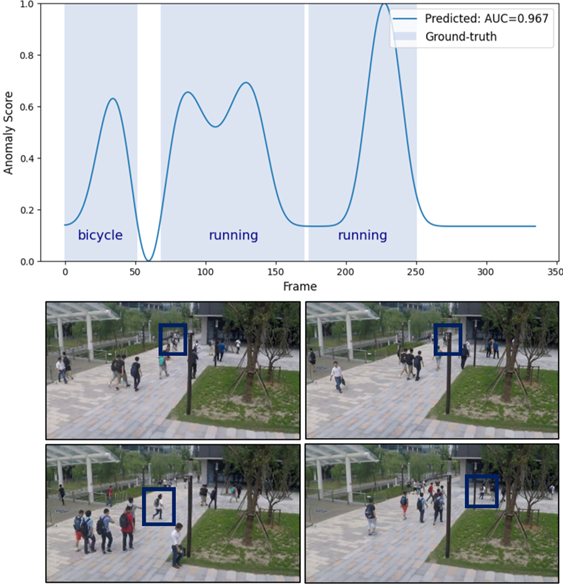
🔼 The figure shows the anomaly detection scores over time for a video segment containing both bicycle and running events. The top graph displays the anomaly scores generated by the model, while the bottom shows the ground truth labels for each frame indicating whether a bicycle or running activity is present. The visualization helps illustrate the model’s ability to detect different types of anomalous events within a single video sequence and highlights the temporal aspects of the detection process.
read the caption
(b) bicycle-running
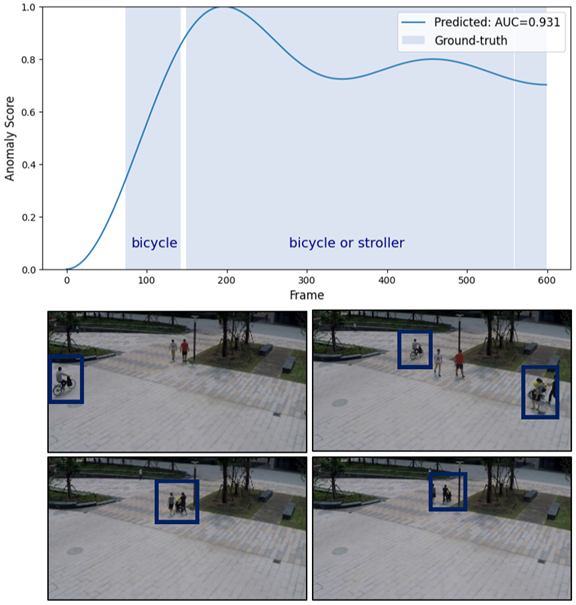
🔼 The figure displays the results of anomaly detection for a video segment containing both bicycles and strollers. The top graph shows the anomaly score over time, with higher scores indicating a higher probability of an anomaly. The bottom row shows key frames from the video segment, illustrating instances where both bicycles and strollers are present, demonstrating the model’s ability to distinguish between user-defined anomalies (‘bicycle’ and ‘stroller’).
read the caption
(c) bicycle-stroller
🔼 Figure S3 showcases the AnyAnomaly model’s ability to detect various types of anomalies in video sequences. Each row displays results for a different anomaly type, visually demonstrating how the model’s anomaly scores change over time, highlighting the temporal aspect of the detection. The scores are generated using the proposed AnyAnomaly model, showing its effectiveness in detecting diverse anomalies.
read the caption
Figure S3: Anomaly detection in diverse scenarios. Various abnormal events can emerge over time.

🔼 The figure shows the results of video anomaly detection applied to a scene where the anomaly event is ‘jaywalking’. It visually demonstrates AnyAnomaly’s performance by displaying the anomaly score over time (as a graph), the key frame, the position context (PC), and the temporal context (TC). The position context highlights relevant image regions using a heatmap that is produced by a WinCLIP-based attention module. The temporal context depicts the temporal progression of the jaywalking event, by using a series of key frames in a grid. The text below the visualization provides a qualitative interpretation of the results, including explanations of why specific scores are assigned. This figure helps illustrate how AnyAnomaly, using context-aware Visual Question Answering (VQA), achieves a more accurate and contextual understanding of abnormal events compared to methods that rely only on key frames.
read the caption
(a) Anomaly event: jaywalking

🔼 The figure visualizes the results of the AnyAnomaly model on a video segment containing the anomaly of a car driving outside its designated lane. The top part shows the anomaly scores over time, generated by the model. The bottom part displays key frames from the video segment along with the position and temporal context information used by the model for its decision. The text under the image describes the model’s reasoning process, indicating a high anomaly score (0.9) due to the observation of the car driving outside its designated lane in multiple frames.
read the caption
(b) Anomaly event: driving outside lane

🔼 This figure visualizes the results of AnyAnomaly on a video segment depicting a car accident involving people. The top graph displays the anomaly scores generated by the model, highlighting the specific frames where an accident is detected. Below the graph, key frames, position context, and temporal context are shown. The key frames provide visual snapshots of the accident, while the position and temporal contexts provide additional information which improves the model’s ability to detect the abnormal event. The text below summarizes the model’s output for the video segment.
read the caption
(c) Anomaly event: people and car accident

🔼 This figure visualizes the results of AnyAnomaly on a video depicting the anomaly event of a person walking while appearing intoxicated. The top graph shows the anomaly score over time, highlighting the model’s detection of the anomalous activity. Below the graph, key frames from the video are displayed, along with visualizations produced by the position context (PC) and temporal context (TC) modules of AnyAnomaly. PC focuses on identifying specific objects of interest within a single frame, while TC analyzes the temporal evolution of events across multiple frames. The text below the image provides a description and reasoning behind AnyAnomaly’s score.
read the caption
(d) Anomaly event: walking drunk
More on tables
| Category | Class | Baseline | +KSM | +KSM/PC | +KSM/TC | Proposed | Improvement (%) |
| Action | Throwing | 78.44 | 80.13 | 89.77 | 82.40 | 89.77 | +14.44 |
| Running | 75.82 | 77.67 | 77.67 | 77.90 | 77.90 | +2.74 | |
| Dancing | 85.65 | 72.28 | 76.64 | 91.92 | 91.92 | +7.32 | |
| Average | 79.97 | 76.69 | 81.36 | 84.07 | 86.53 | +8.2 | |
| Appearance | Too close | 57.23 | 61.48 | 61.48 | 91.78 | 91.78 | +60.37 |
| Bicycle | 99.99 | 99.84 | 99.99 | 99.93 | 100.00 | +0.01 | |
| Average | 78.61 | 80.66 | 80.74 | 95.86 | 95.89 | +21.98 | |
| Overall Average | 79.43 | 78.28 | 81.11 | 88.79 | 90.27 | +13.65 |
🔼 This table presents a performance comparison of different methods on the Customizable-Ave (C-Ave) dataset. It compares the baseline method (frame-level visual question answering) with various enhanced versions that incorporate key frame selection (KSM), position context (PC), and temporal context (TC) for more effective video anomaly detection. The results are broken down by category (Action and Appearance) and class of anomaly, showing the improvement achieved by each enhancement over the baseline.
read the caption
Table 2: Performance comparison on C-Ave dataset
| Segment length | C-ShT | C-Ave | FPS |
| Baseline | 78.01 | 79.43 | 0.96 |
| 8 | 83.83 | 83.96 | 2.67 |
| 16 | 83.45 | 87.45 | 4.49 |
| 24 | 85.72 | 90.27 | 6.67 |
| 32 | 82.50 | 85.94 | 8.45 |
🔼 This table presents the results of an ablation study on the effect of varying segment lengths on the performance of the AnyAnomaly model. It shows the micro-averaged Area Under the Receiver Operating Characteristic Curve (micro AUROC) scores for the Customizable ShanghaiTech Campus (C-ShT) and Customizable CUHK Avenue (C-Ave) datasets, along with the frames per second (FPS) achieved for each segment length. The different segment lengths tested were 8, 16, 24, and 32 frames. The baseline uses a single frame.
read the caption
Table 3: Comparison on segment length
| Key frames | C-ShT | C-Ave | ||||
| Act. | App. | Total | Act. | App. | Total | |
| RD* | 69.9 | 84.0 | 75.0 | 66.4 | 78.8 | 71.3 |
| CP* | 72.0 | 87.1 | 77.5 | 76.7 | 80.7 | 78.3 |
| RD | 80.0 | 89.1 | 83.3 | 79.1 | 92.3 | 84.4 |
| CP | 81.2 | 88.9 | 84.0 | 84.3 | 81.2 | 83.1 |
| Gr. → CP | 82.2 | 88.8 | 84.7 | 83.9 | 92.2 | 87.2 |
| CP → Gr. | 83.9 | 89.0 | 85.7 | 86.5 | 95.9 | 90.3 |
🔼 This table compares the performance of different key frame selection methods for video anomaly detection. Three methods are evaluated: Random (RD), CLIP-based (CP), and Grouping (Gr). The table shows results for both action and appearance classes, with and without contextual information. The results demonstrate that a combined approach using CLIP-based selection followed by grouping achieves the best performance, particularly when contextual information is included. Random selection performs poorly, highlighting the importance of selecting keyframes that are both temporally uniform and relevant to the user-defined anomaly.
read the caption
Table 4: Comparison on key frames selection method. RD, CP and Gr. indicate random, CLIP and grouping, respectively. * indicates testing without context. Act. and App. indicate action and appearance class, respectively.
| Window Size | C-ShT | C-Ave | ||||
| Act. | App. | Total | Act. | App. | Total | |
| small | 78.8 | 90.6 | 83.1 | 84.7 | 87.1 | 85.7 |
| middle | 81.2 | 89.0 | 84.1 | 87.5 | 92.0 | 89.3 |
| large | 82.1 | 89.7 | 84.9 | 86.8 | 86.4 | 86.6 |
| all | 83.9 | 89.0 | 85.7 | 86.5 | 95.9 | 90.3 |
🔼 This table presents the performance of the AnyAnomaly model on two C-VAD datasets (C-ShT and C-Ave) using different window sizes for generating position and temporal context. The results show how different window sizes impact the model’s ability to detect anomalies related to actions (Act.) and appearance (App.). The ‘Total’ column represents the overall performance, combining both action and appearance anomaly detection results.
read the caption
Table 5: Comparison on window size.
| Method | Venue | Training | Ave | ShT | UB |
| AMMC-Net[6] | AAAI 21 | ✓ | 86.6 | 73.7 | - |
| STEAL-Net[5] | ICCV 21 | ✓ | 87.1 | 73.7 | - |
| MPN[19] | CVPR 21 | ✓ | 89.5 | 73.8 | - |
| Zhong et al.[36] | PR 22 | ✓ | 88.9 | 70.7 | - |
| DLAN-AC[32] | ECCV 22 | ✓ | 89.9 | 74.7 | - |
| UBnormal[1] | CVPR 22 | ✓ | - | - | 68.5 |
| FPDM[31] | ICCV 23 | ✓ | 90.1 | 78.6 | 62.7 |
| SLM[28] | ICCV 23 | ✓ | 90.9 | 78.8 | - |
| USTN-DSC[33] | CVPR 23 | ✓ | 89.9 | 73.8 | - |
| MULDE[21] | CVPR 24 | ✓ | - | 81.3 | 72.8 |
| AED-MAE[25] | CVPR 24 | ✓ | 91.3 | 79.1 | 58.5 |
| MA-PDM[37] | AAAI 25 | ✓ | 91.3 | 79.2 | 63.4 |
| AccI-VAD[24] | TMLR 25 | ✓ | - | - | 66.8 |
| AnyAnomaly* | - | ✗ | 81.4 | 77.2 | 73.1 |
| AnyAnomaly | - | ✗ | 87.3 | 79.7 | 74.5 |
🔼 This table compares the performance of the proposed AnyAnomaly model against other state-of-the-art (SOTA) video anomaly detection (VAD) methods on three benchmark datasets: CUHK Avenue, ShanghaiTech Campus, and UBnormal. The results are presented in terms of Area Under the Receiver Operating Characteristic Curve (AUROC) scores for each dataset. The table highlights whether each method used cross-domain training, few-shot learning, or auxiliary datasets to improve performance. A comparison is also shown for the proposed model run both with and without context to illustrate the impact of contextual information.
read the caption
Table 6: Comparison with state-of-the-art VAD methods. * indicates testing without context.
| Method | Tr. | Few. | Aux. | Ave | ShT |
| STEAL-Net[5] | ✓ | ✗ | ✗ | 54.3 | 51.7 |
| Jigsaw[29] | ✓ | ✗ | ✗ | 62.9 | 59.3 |
| rGAN[17] | ✓ | ✓ | ✗ | 76.6 | 77.9* |
| MPN[19] | ✓ | ✓ | ✗ | 78.9 | 73.8* |
| zxVAD[3] | ✓ | ✗ | ✓ | 82.2 | 71.6* |
| Shibao et al.[8] | ✓ | ✗ | ✓ | 86.2 | 78.7 |
| ZS CLIP[22] | ✗ | ✗ | ✗ | 62.3 | 60.9 |
| ZS ImageBind[9] | ✗ | ✗ | ✗ | 64.5 | 61.3 |
| AnyAnomaly | ✗ | ✗ | ✗ | 87.3 | 79.7 |
🔼 This table compares the generalization performance of various video anomaly detection (VAD) methods. It assesses how well models trained on one dataset perform when tested on a different dataset (cross-domain training). It also categorizes methods based on whether they utilize only a few training samples for adaptation, or if they leverage auxiliary datasets to improve performance. Because some competing methods did not originally report cross-domain results on the ShanghaiTech Campus (ShT) dataset, their same-domain results are shown instead for a fair comparison.
read the caption
Table 7: Generalization performance comparison. Tr.: cross-domain training where models trained on one VAD dataset are evaluated on another. Few.: methods that adapt to the target domain using only a few training samples, Aux.: methods that utilize auxiliary datasets, *: since competitors did not perform cross-domain evaluations on ShT, we present their same-domain results instead.
| Prompt Tuning | C-ShT | C-Ave |
| Baseline (simple) | 70.38 | 67.58 |
| Baseline (+reasoning) | 71.58 | 72.79 |
| Baseline (+reasoning, consideration) | 78.01 | 79.43 |
| Proposed (simple) | 79.29 | 74.01 |
| Proposed (+reasoning) | 79.79 | 82.09 |
| Proposed (+reasoning, consideration) | 85.72 | 90.27 |
🔼 This table presents a comparison of the performance achieved using different prompt designs within the AnyAnomaly model. The prompts are categorized by complexity: simple, simple plus reasoning, and fully detailed (with reasoning and consideration). The results are shown for two C-VAD datasets, C-ShT and C-Ave, demonstrating how the inclusion of reasoning and consideration elements in the prompt affects the model’s accuracy.
read the caption
Table S1: Comparison on prompt tuning
| Dataset | Method | Value | AUC |
| Ave | w/o context | - | 81.4 |
| w/o tuning | 1.0, 1.0, 1.0 | 84.4 | |
| w/ tuning | 0.6, 0.3, 0.1 | 87.3 | |
| ShT | w/o context | - | 77.2 |
| w/o tuning | 1.0, 1.0, 1.0 | 79.4 | |
| w/ tuning | 0.5, 0.3, 0.2 | 79.7 | |
| UB | w/o context | - | 73.1 |
| w/o tuning | 1.0, 1.0, 1.0 | 73.8 | |
| w/ tuning | 0.6, 0.1, 0.3 | 74.5 |
🔼 This table presents a comparison of different anomaly detection methods applied to various datasets (Ave, ShT, UB). It shows the Area Under the Receiver Operating Characteristic curve (AUC) scores achieved by each method under different conditions. Specifically, it compares results with and without the use of contextual information and with and without hyperparameter tuning. This allows for an assessment of the impact of contextual data and optimized parameter settings on the overall performance of each model.
read the caption
Table S2: Comparison of different methods on various datasets
| LVLM | Pre-trained | C-ShT | C-Ave | FPS | ||
| w/o context | Proposed | w/o context | Proposed | |||
| Chat-UniVi[13] | Chat-UniVi-7B | 77.5 | 85.7 | 78.3 | 90.3 | 6.67 |
| MiniGPT-4[38] | LLaMA-2 Chat 7B | 54.0 | 67.4 | 53.9 | 55.3 | 1.26 |
| MiniCPM-V[34] | MiniCPM-Llama3-V-2_5 (8B) | 87.7 | 90.1 | 86.3 | 91.0 | 1.36 |
| LLAVA++[23] | LLaVA-Meta-Llama-3-8B-Instruct-FT | 73.3 | 82.8 | 59.0 | 69.4 | 7.25 |
🔼 This table compares the performance of different Large Vision Language Models (LVLMs) on the Customizable Video Anomaly Detection (C-VAD) task. The models are evaluated using two datasets (C-ShT and C-Ave), measuring their Area Under the Curve (AUC) scores with and without contextual information. The table highlights the most efficient model (blue) based on Frames Per Second (FPS) and the most effective model (purple) based on overall AUC score. It provides a quantitative comparison of various LVLMs’ suitability for C-VAD, allowing readers to assess trade-offs between efficiency and accuracy.
read the caption
Table S3: Comparison of diverse LVLMs. The model highlighted in blue represents the most efficient model for the C-VAD task, while the one highlighted in purple indicates the most effective model.
Full paper#


