TL;DR#
Survey papers are vital for researchers, but creating them is tough due to the flood of publications. Automated tools using LLMs exist, yet they often lack quality, especially in outlines and citations. This work introduces SURVEYFORGE to solve these issues. It improves outline generation by studying human-written outlines and using domain-related articles. The system then retrieves and refines content using high-quality papers found via a scholar navigation agent. Also a new benchmark, SurveyBench, offers a comprehensive evaluation across reference, outline, and content quality.
SURVEYFORGE uses a two-stage process: first, it creates outlines by learning from existing human-written outlines and relevant literature. Then, it uses a scholar navigation agent to fetch high-quality papers for each subsection, generating and refining content accordingly. The paper also introduces SurveyBench, a new evaluation tool. Experiments show that this approach outperforms previous methods like AutoSurvey. The authors highlight the tool’s ability to generate well-structured outlines and retrieve high-quality references.
Key Takeaways#
Why does it matter?#
SURVEYFORGE enhances automated survey writing by improving outline quality, reference accuracy, and offering a new evaluation benchmark, boosting research efficiency and opening new research avenues.
Visual Insights#

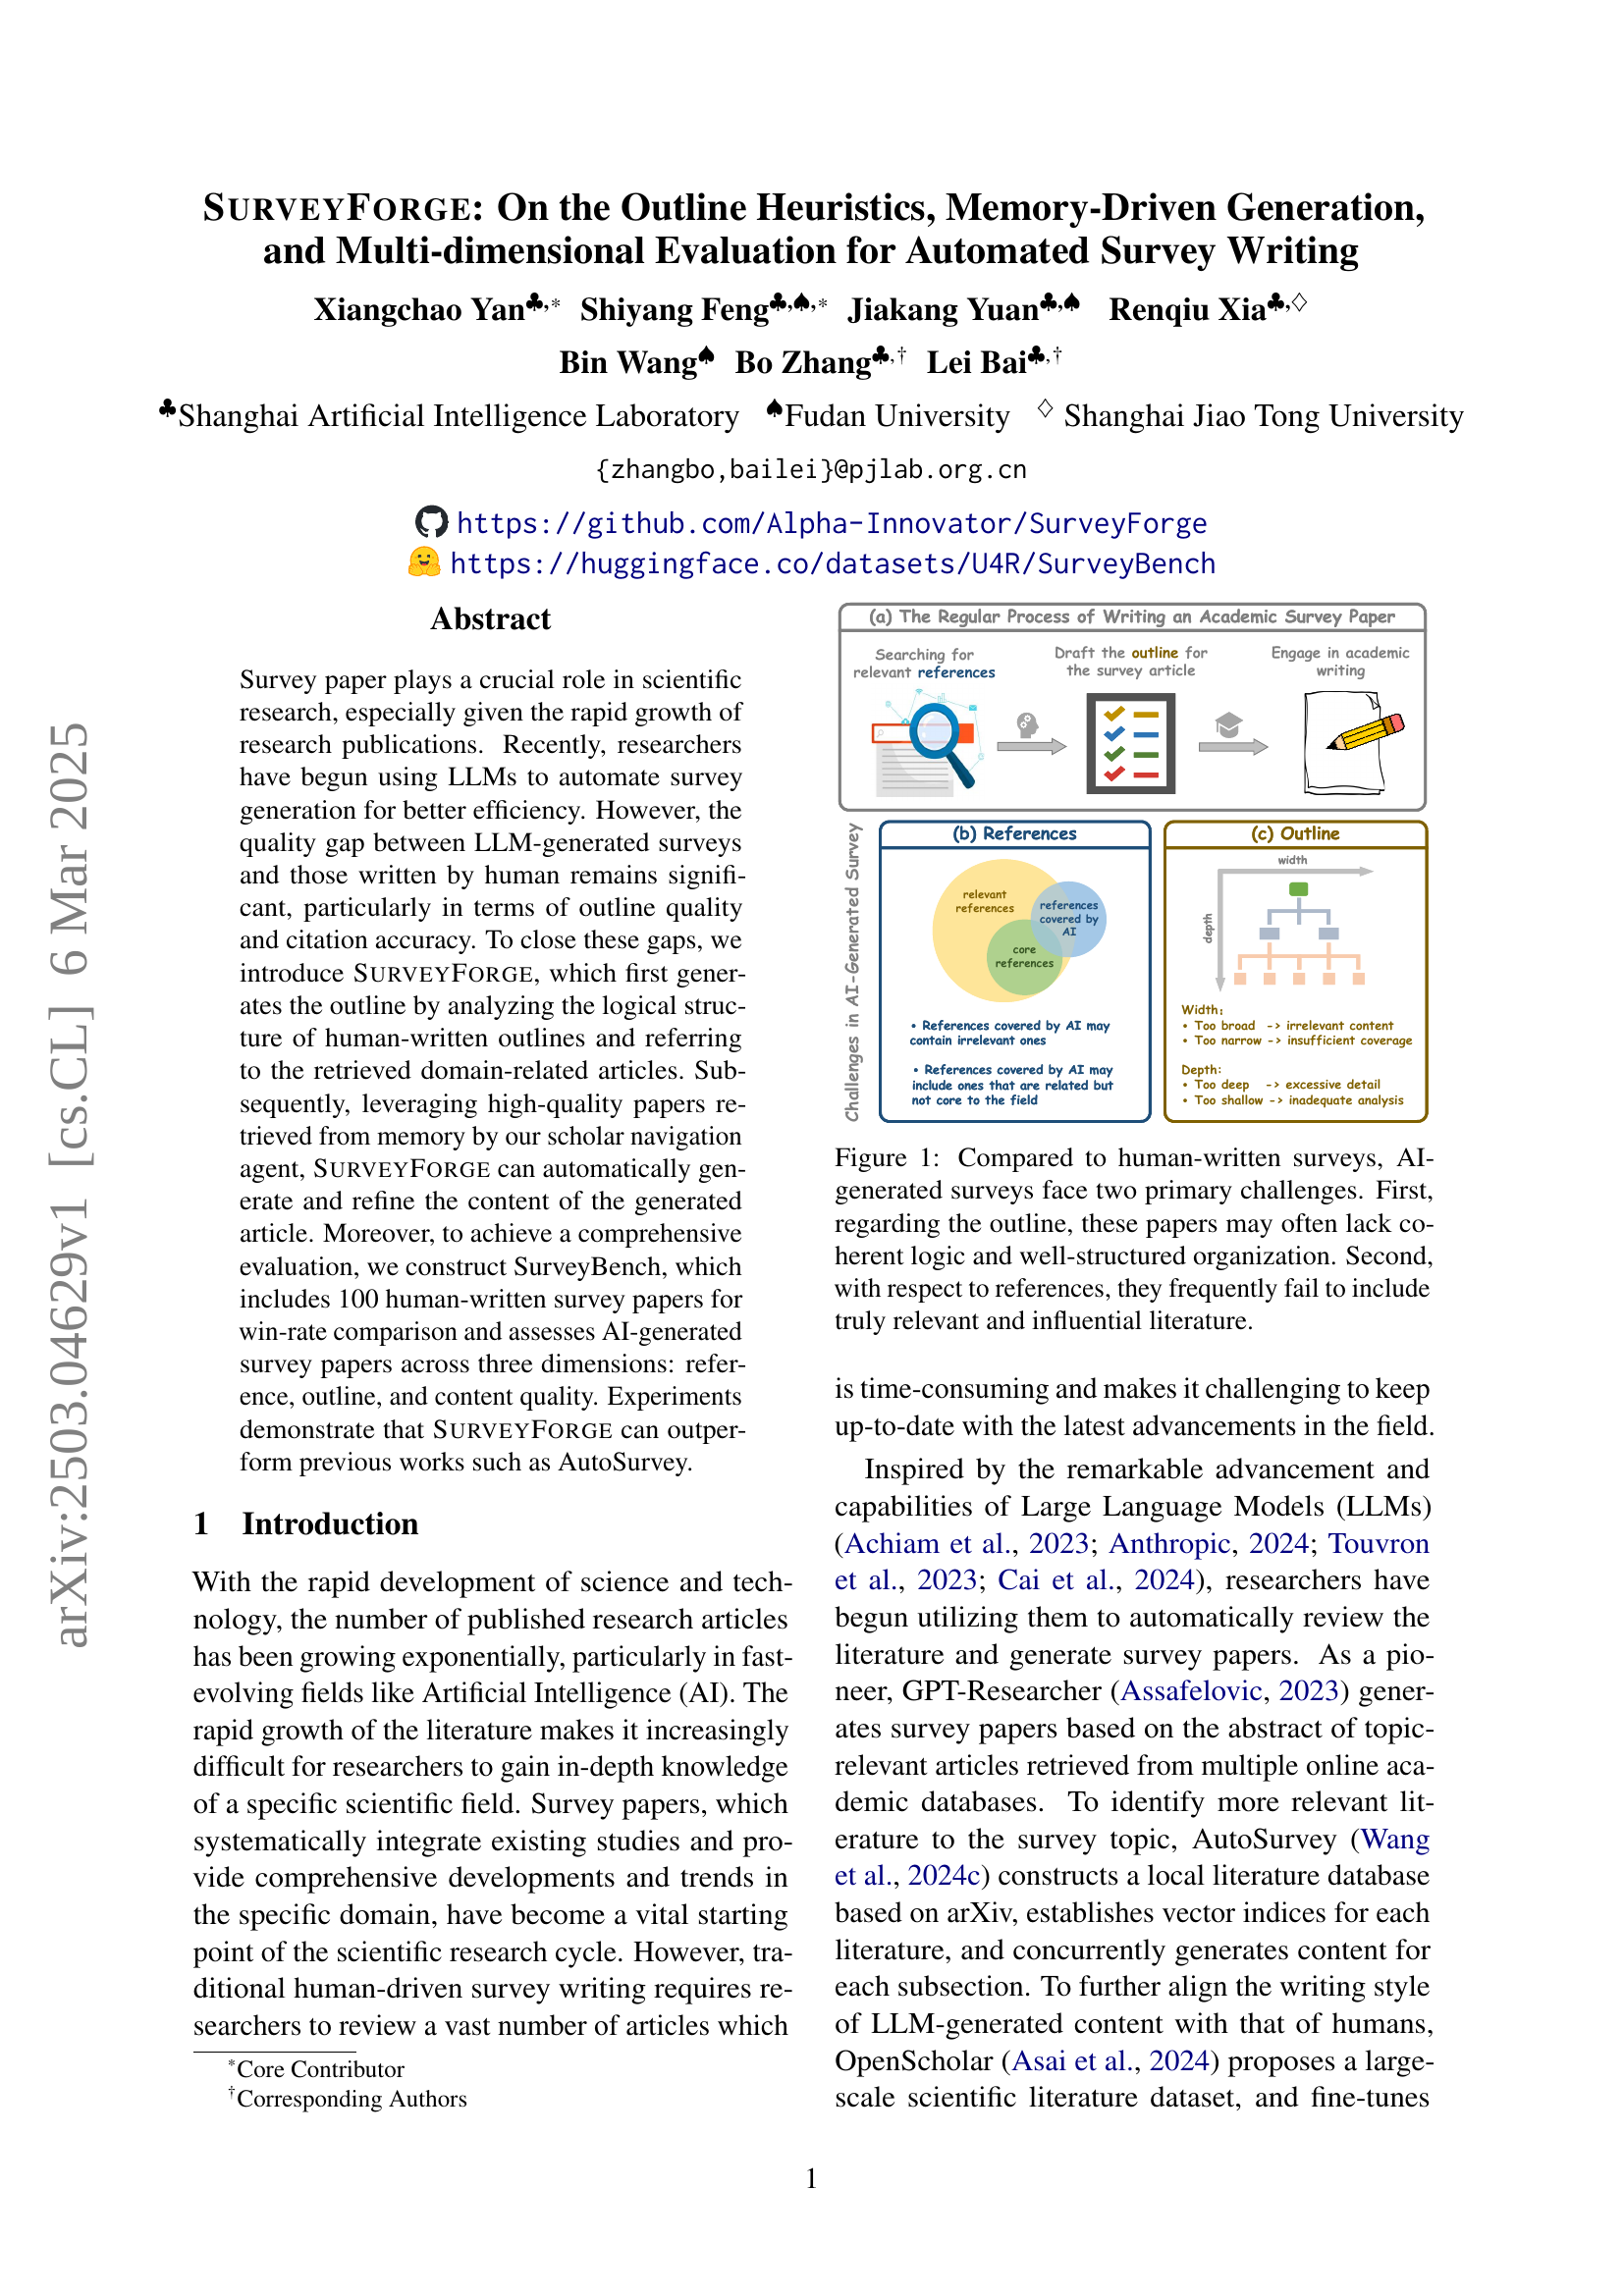
🔼 AI-generated survey papers often have two main issues: poor outlines (lacking logical flow and structure) and inadequate references (missing key, influential works).
read the caption
Figure 1: Compared to human-written surveys, AI-generated surveys face two primary challenges. First, regarding the outline, these papers may often lack coherent logic and well-structured organization. Second, with respect to references, they frequently fail to include truly relevant and influential literature.
| Methods | Model | Reference Quality | Outline Quality | Content Quality | ||||
| Input Cov. | Reference Cov. | Structure | Relevance | Coverage | Avg | |||
| Human-Written | - | - | 0.6294 | 87.62 | - | - | - | - |
| AutoSurvey | Claude-3-Haiku | 0.1153 | 0.2341 | 82.18 | 72.83 | 76.44 | 72.35 | 73.87 |
| SurveyForge | Claude-3-Haiku | 0.2231 | 0.3960 | 86.85 | 73.82 | 79.62 | 75.59 | 76.34 |
| AutoSurvey | GPT-4o mini | 0.0665 | 0.2035 | 83.10 | 74.66 | 74.16 | 76.33 | 75.05 |
| SurveyForge | GPT-4o mini | 0.2018 | 0.4236 | 86.62 | 77.10 | 76.94 | 77.15 | 77.06 |
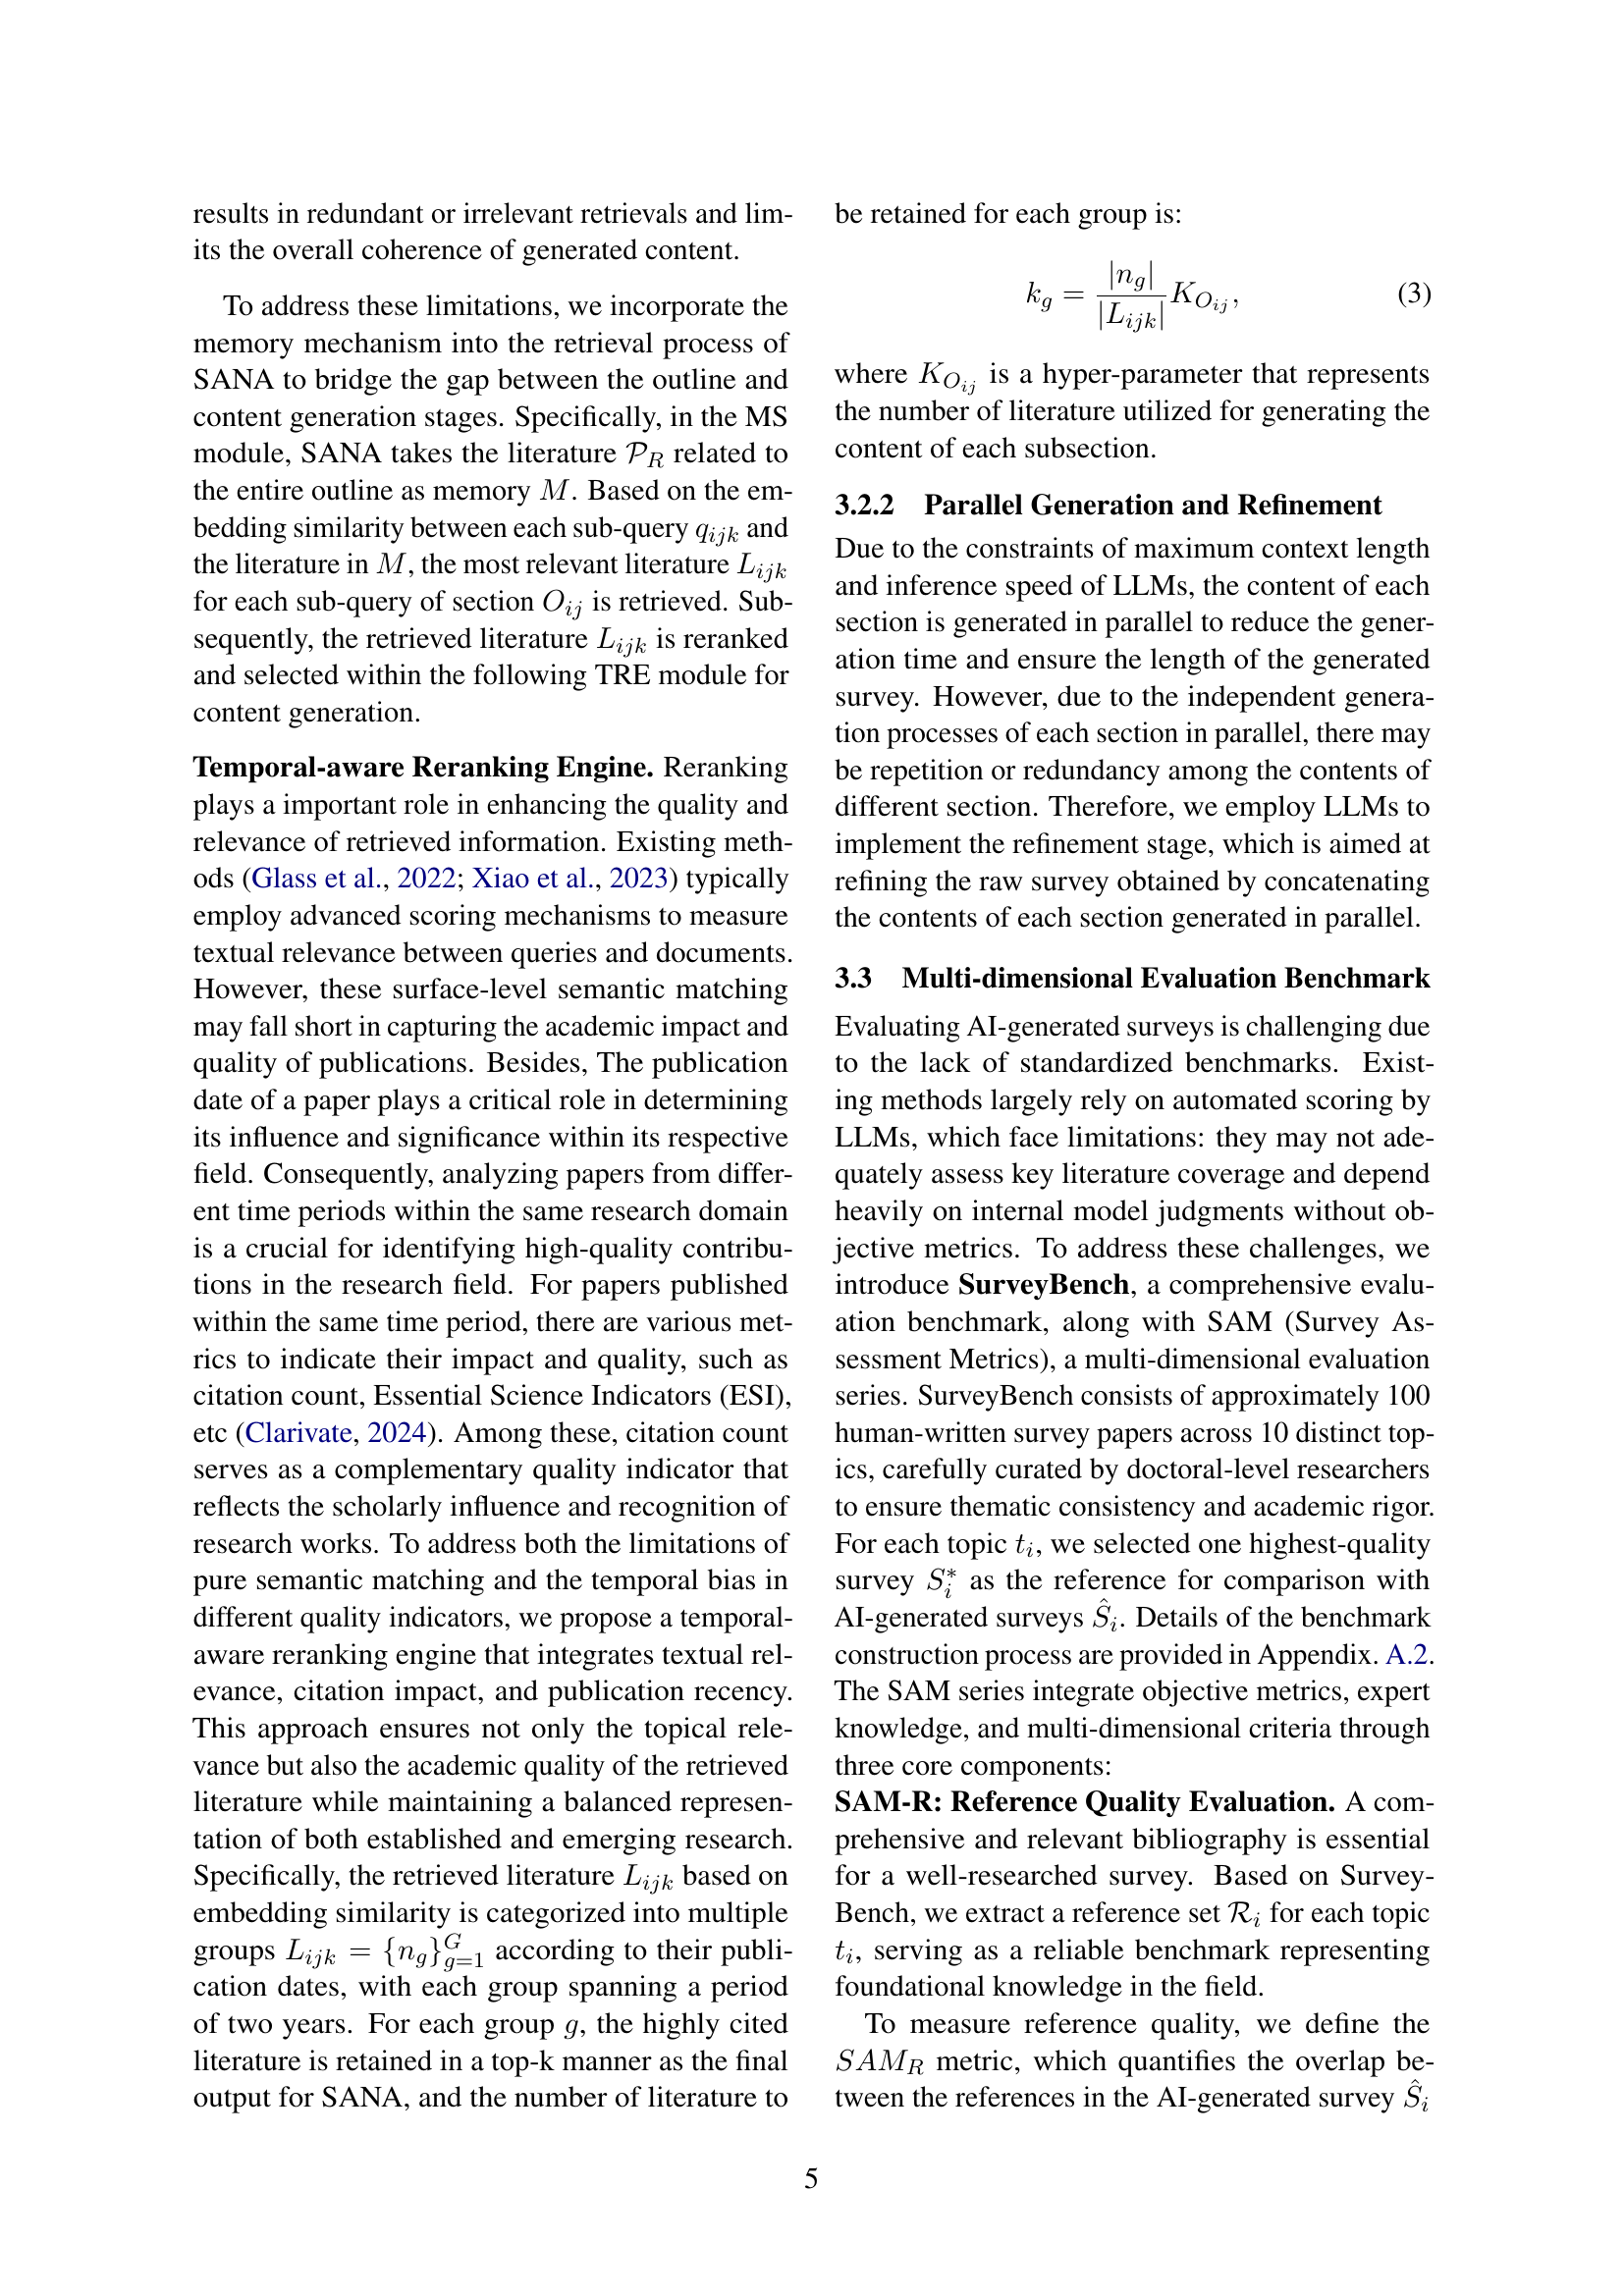
🔼 Table 1 presents a comparative analysis of the performance of SurveyForge and AutoSurvey (Wang et al., 2024c) in automated survey generation. The comparison uses three key metrics from the Survey Assessment Metrics (SAM) framework: Reference Quality (SAM-R), Outline Quality (SAM-O), and Content Quality (SAM-C). Reference Quality is further broken down into Input Coverage (the overlap between retrieved papers and benchmark references) and Reference Coverage (the alignment between cited references in the generated survey and the benchmark). The table highlights the relative strengths and weaknesses of each approach across these dimensions.
read the caption
Table 1: Comparison of SurveyForge and AutoSurvey (Wang et al., 2024c) using Survey Assessment Metrics (SAM) from three aspects: Reference (SAM-R), Outline (SAM-O) and Content quality (SAM-C). 'Input Cov.' means the coverage of input papers, measuring the overlap between retrieved papers and benchmark references, while 'Reference Cov.' means the coverage of reference, evaluating the alignment between cited references of the survey and benchmark references.
In-depth insights#
Outline Heuristics#
Outline heuristics are crucial for survey papers. They involve using expert knowledge to structure content logically. Effective heuristics address the limited understanding of LLMs, ensuring relevant sections. Domain-specific heuristics refine structure and enhance the framework. By guiding content organization, these heuristics ensure coherence in the writing process, supporting the credibility and usability.
Memory Navigator#
I imagine a ‘Memory Navigator’ as a system component designed to efficiently retrieve and utilize information from a vast store of knowledge. It would likely involve sophisticated indexing and search algorithms, allowing the system to quickly locate relevant data based on specific queries. A crucial aspect would be the ability to handle diverse data types and formats, ensuring compatibility across different information sources. Furthermore, the Memory Navigator would need to prioritize relevance and accuracy, filtering out irrelevant or outdated information to provide the most useful results. The design would consider efficient storage and retrieval, perhaps employing techniques like data compression and caching to optimize performance. The system may also employ a semantic understanding of the data, enabling it to connect related concepts and provide a more complete picture to the user. This component would enable a more organized approach to efficiently retrieving information for a specific task.
SurveyBench#
SurveyBench is a crucial element for objectively evaluating AI-generated surveys. It’s a comprehensive benchmark, addressing the lack of standardized evaluation in this field. SurveyBench features quantifiable metrics to assess outline quality, reference relevance, and content quality. It helps researchers rigorously compare different methods. SurveyBench consists of human-written survey papers across diverse topics. The benchmark has objective metrics, expert knowledge, and multi-dimensional criteria through core components like SAM-R, SAM-O, and SAM-C.
Heuristic Learn#
Heuristic learning, in the context of automated survey generation, likely involves leveraging rules of thumb or experiential knowledge to guide the outline creation process. Instead of relying solely on complex algorithms or deep learning models, a heuristic approach would prioritize simpler, more intuitive strategies that have proven effective in human-written surveys. For instance, the system might learn that certain topics are typically structured in a specific way, with particular sections and subsections appearing in a predictable order. The advantages of heuristic learning may include increased interpretability, reduced computational cost, and improved robustness to noisy or incomplete data. However, it is important to be aware of the potential for bias or limitations in the learned heuristics, and to combine the approach with other techniques to ensure comprehensive and high-quality survey generation. This can offer an initial framework before refining with more complex models.
Auto-Survey Gap#
AutoSurvey’s limitations highlight the ongoing challenges in automated survey generation. While showing promise, it faces hurdles in mimicking human writing nuances. There is scope for improvement in logical structure and citation accuracy. Automated methods may struggle with comprehensive knowledge and original insights. Also, the accuracy of content is an area needing attention. Thus, there’s a demand for methods enhancing the quality, relevance, and structure, alongside bridging AI-generated and human surveys for reliable research automation.
More visual insights#
More on figures

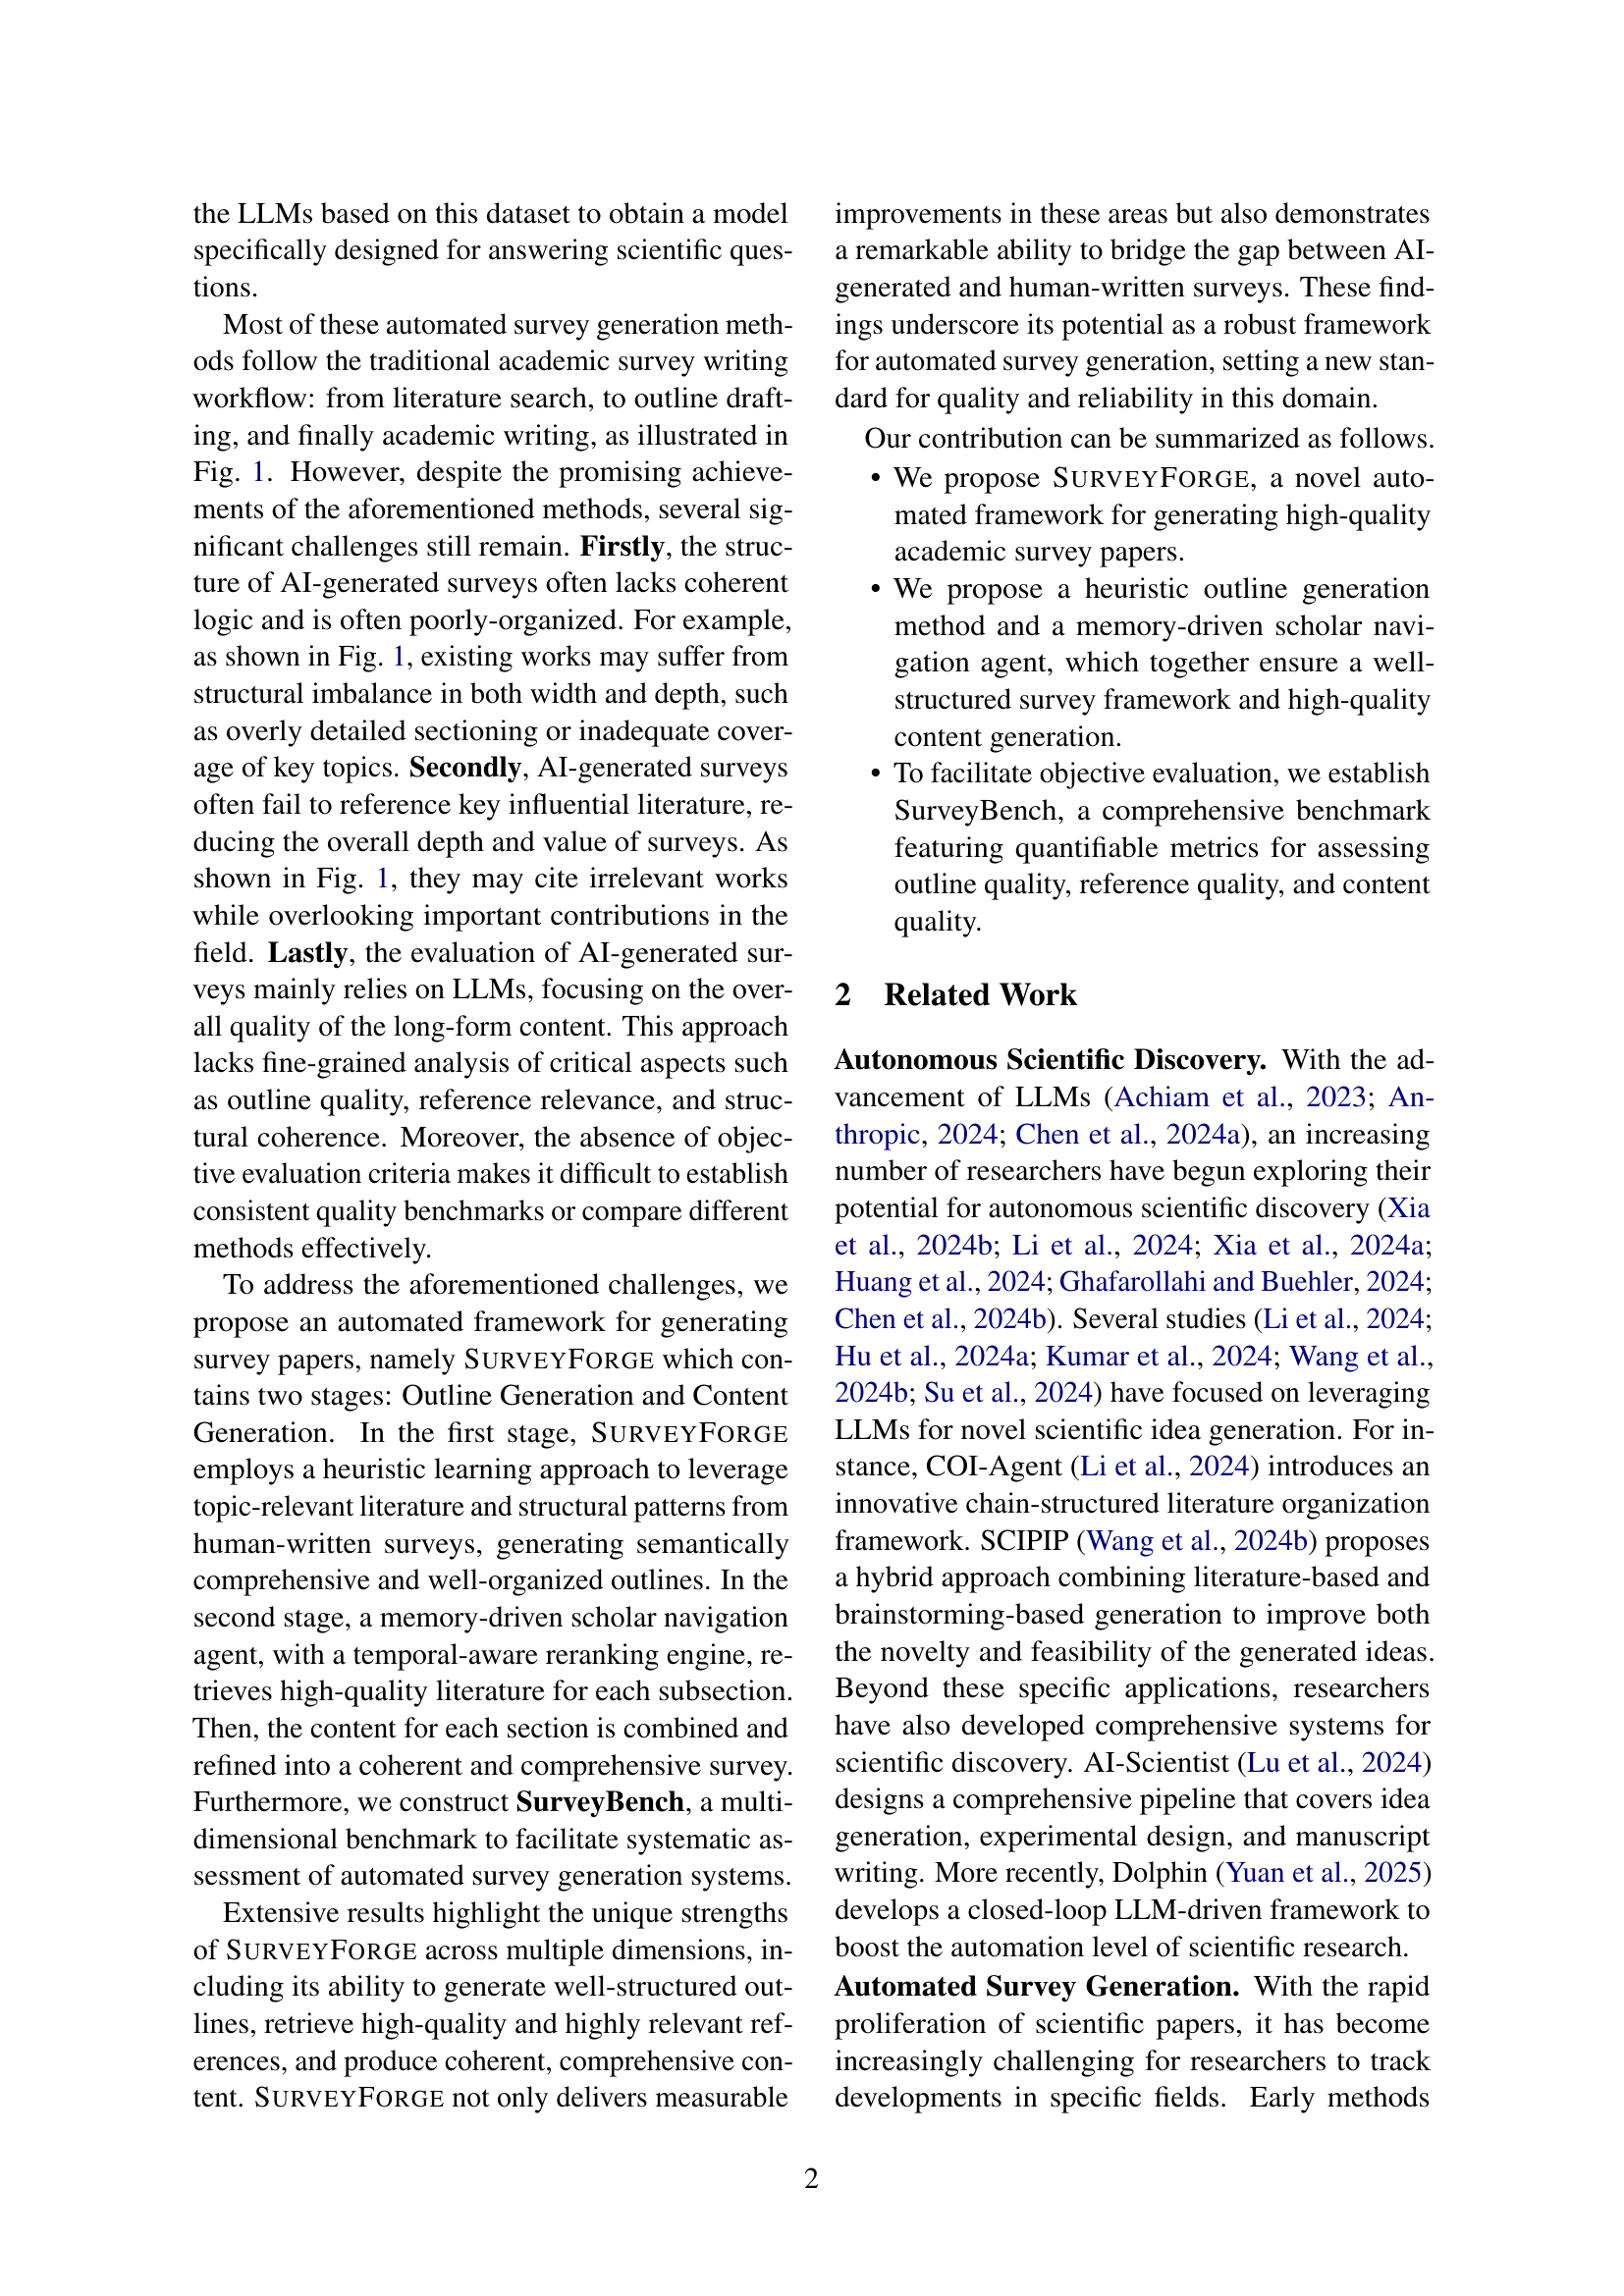
🔼 SurveyForge’s architecture is a two-stage process. The first, Outline Generation, uses heuristic learning and relevant literature to create a well-structured outline. The second, Content Writing, uses a Scholar Navigation Agent (SANA) to find high-quality literature for each section. An LLM then generates the content for each section, which is subsequently combined and refined into a complete survey.
read the caption
Figure 2: The overview of SurveyForge. The framework consists of two main stages: Outline Generation and Content Writing. In the Outline Generation stage, SurveyForge utilizes heuristic learning to generate well-structured outlines by leveraging topic-relevant literature and structural patterns from existing surveys. In the Content Writing stage, a memory-driven Scholar Navigation Agent (SANA) retrieves high-quality literature for each subsection and LLM generates the content of each subsection. Finally, the content is synthesized and refined into a coherent and comprehensive survey.

🔼 This figure illustrates the regular process of writing an academic survey paper. It involves searching for relevant references, drafting the outline, and engaging in academic writing. The figure also highlights the challenges AI-generated survey papers face, particularly in terms of outline quality and reference relevance. AI-generated outlines may lack coherent logic and well-structured organization, while AI-generated references may include irrelevant literature or omit important contributions.
read the caption
(a)

🔼 The figure shows the challenges of AI-generated survey papers compared to human-written surveys. Specifically, it highlights problems with the outline and references. AI-generated outlines may lack coherent logic and well-structured organization (too broad, too narrow, too deep, too shallow, irrelevant content, insufficient coverage, excessive detail, inadequate analysis). AI-generated references may contain irrelevant ones or miss core, influential literature.
read the caption
(b)

🔼 This figure compares the outline quality of AI-generated surveys versus human-written surveys. It shows that AI-generated surveys often lack coherent logic and well-structured organization (too broad, too narrow, insufficient coverage, excessive detail, etc.), while also struggling to include truly relevant and influential literature in their references.
read the caption
(c)

🔼 This figure shows the evaluation results on the SurveyBench dataset, specifically focusing on Content Quality. It’s a radar chart comparing the performance of SURVEYFORGE and AutoSurvey, as well as a human-written survey, across three dimensions of content quality: Structure, Relevance, and Coverage. The chart visually represents the relative strengths and weaknesses of each approach in achieving high-quality content generation for survey papers. Higher scores indicate better performance in each dimension.
read the caption
(d)
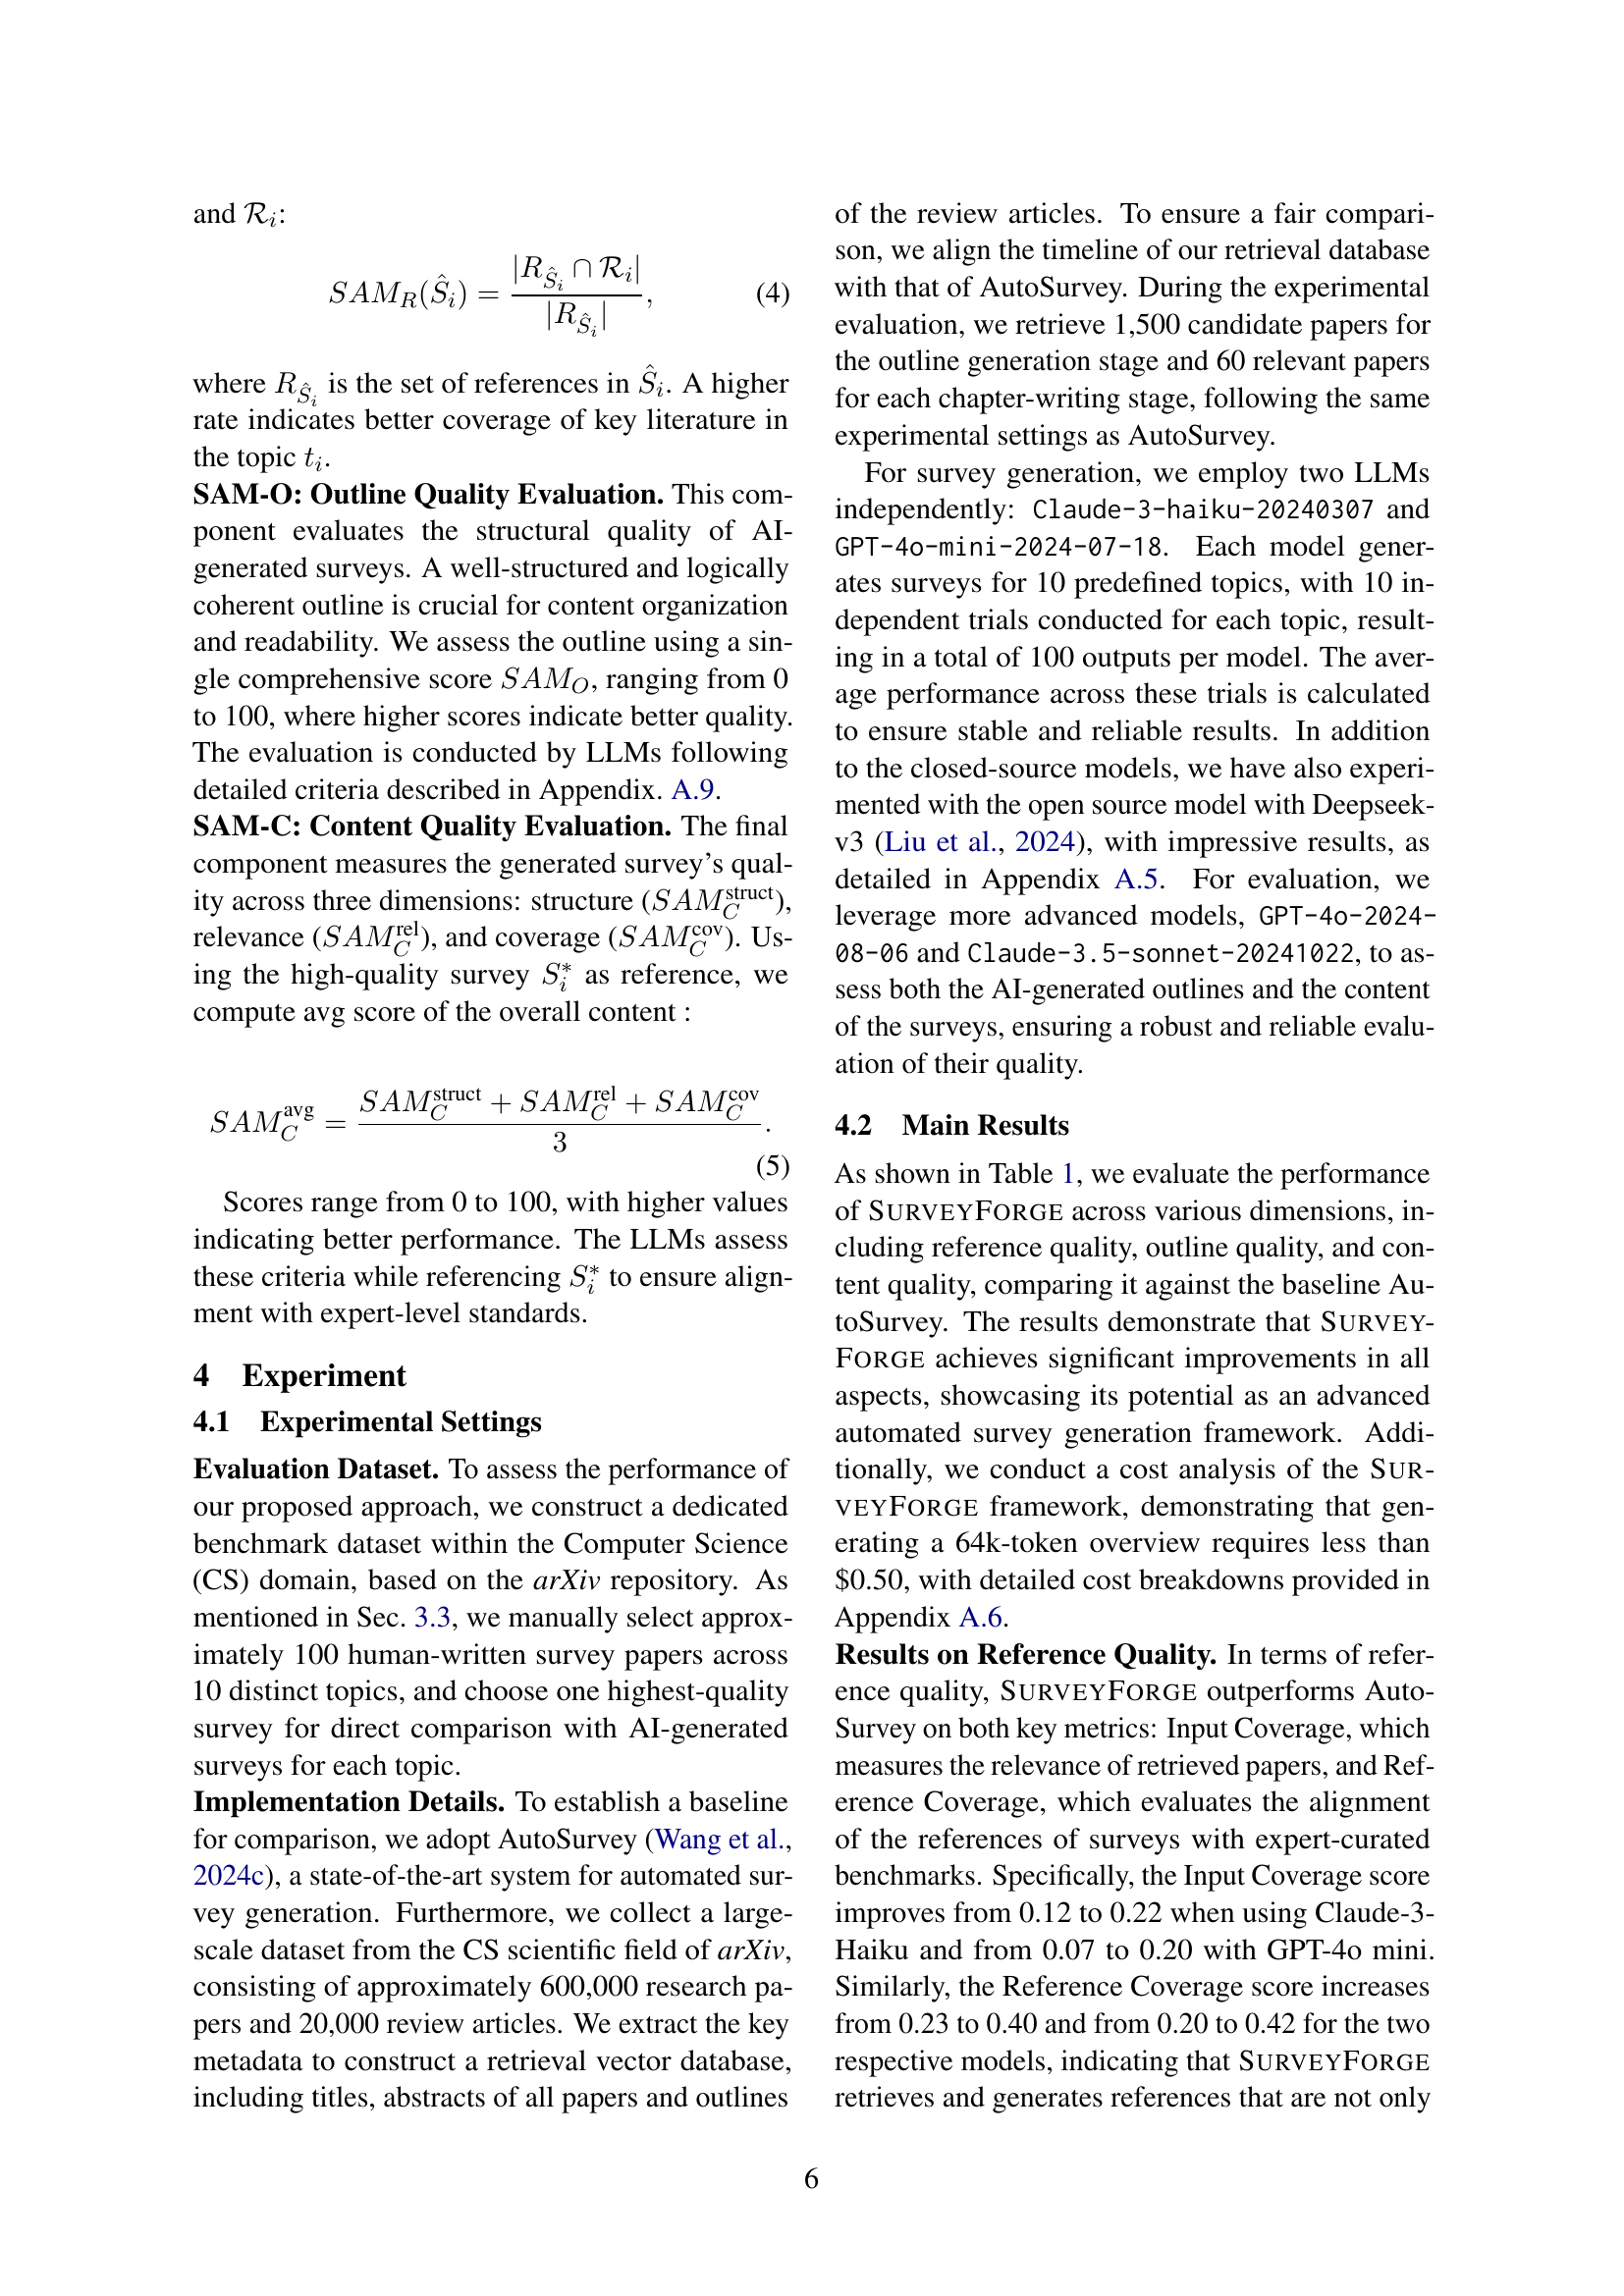
🔼 Figure 3 presents a comprehensive evaluation of the SURVEYFORGE model’s performance on the SurveyBench dataset. The figure consists of four sub-figures, each illustrating a key aspect of survey generation quality: (a) Input Coverage shows the proportion of relevant papers retrieved during the initial literature search; (b) Reference Coverage displays the percentage of relevant and influential papers included in the generated survey’s bibliography; (c) Outline Quality evaluates the structure and organization of the generated survey’s outline; and (d) Content Quality assesses the overall coherence and comprehensiveness of the generated survey’s content. Each sub-figure visually compares the performance of SURVEYFORGE against the baseline AutoSurvey and human-generated surveys, providing a detailed analysis of the model’s strengths and limitations in each dimension.
read the caption
Figure 3: Evaluation results on SurveyBench. Evaluation results of (a) Input Coverage, (b) Reference Coverage, (c) Outline Quality, and (d) Content Quality.

🔼 This figure compares the survey outlines generated using two different methods: a baseline method and the proposed SURVEYFORGE framework. The left side shows the outline generated by the baseline method, which is characterized by a fragmented structure with a lack of clear organization and logical flow between sections. In contrast, the right side shows the outline produced by SURVEYFORGE, which demonstrates a more comprehensive and systematically organized structure with clear connections between sections.
read the caption
Figure 4: Comparisons of survey outlines generated by the baseline method (left) and our proposed framework (right). The baseline displays a fragmented structure, whereas our method yields a more comprehensive, systematically organized outline.

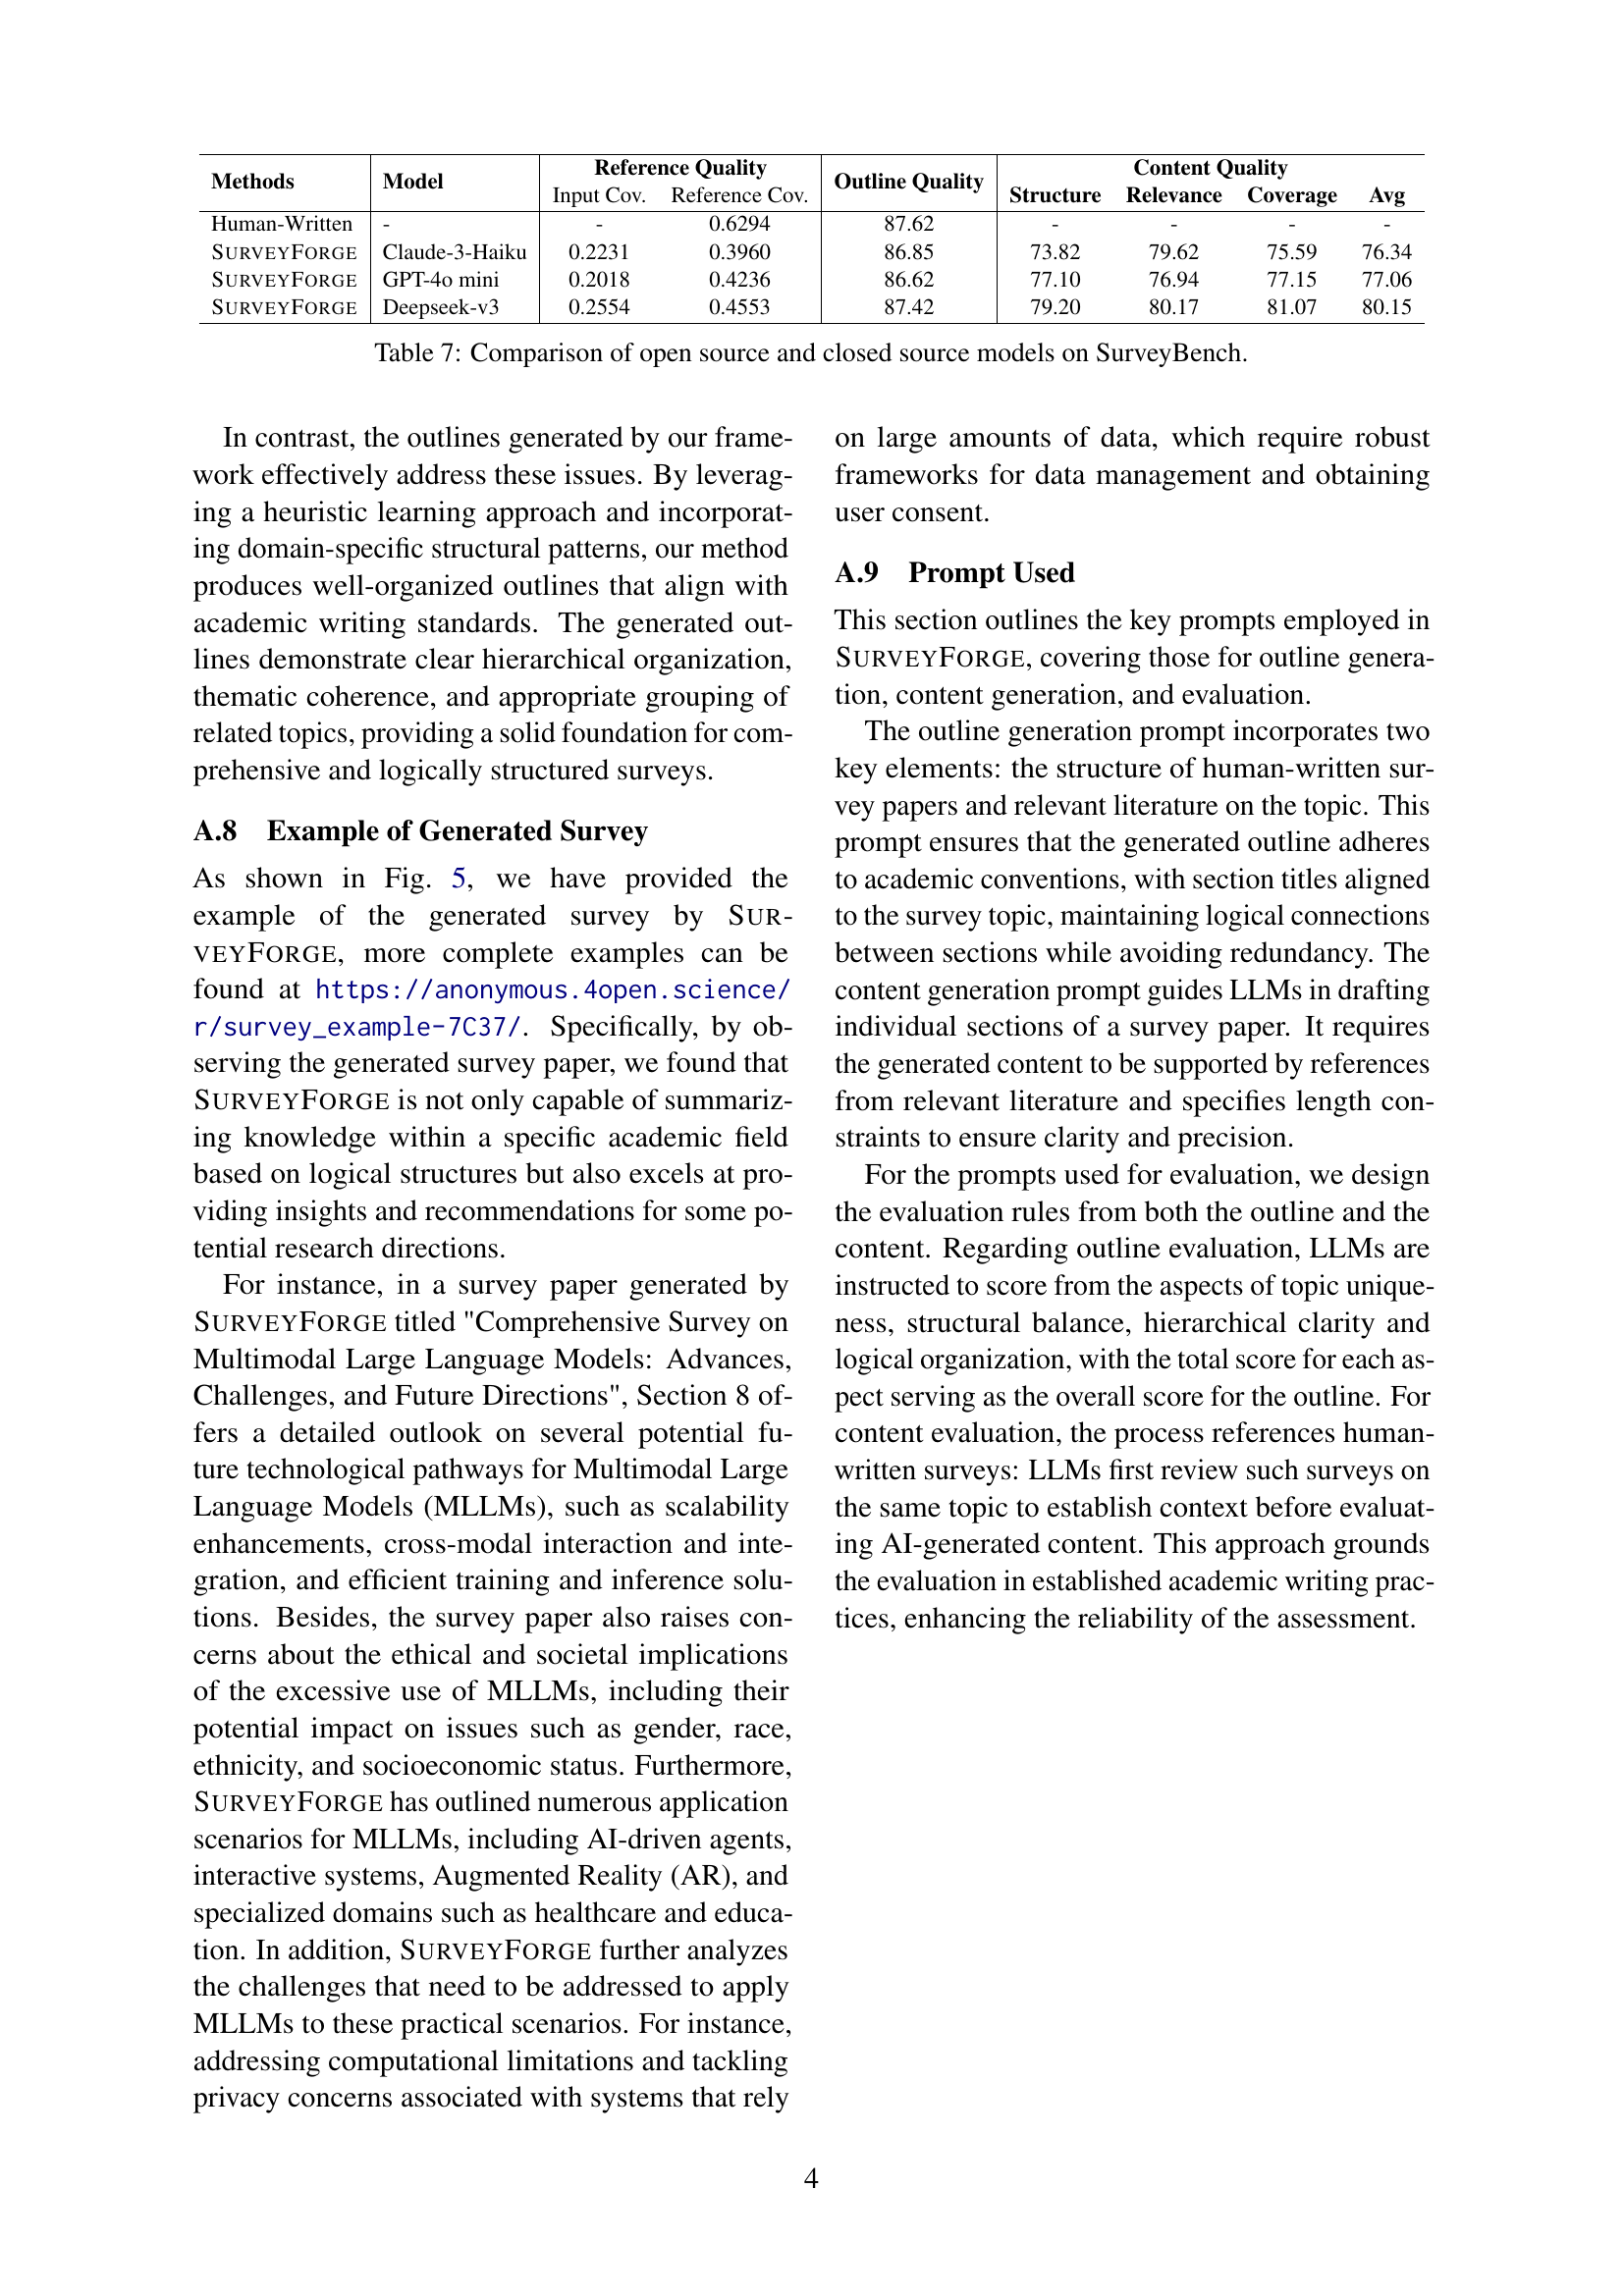
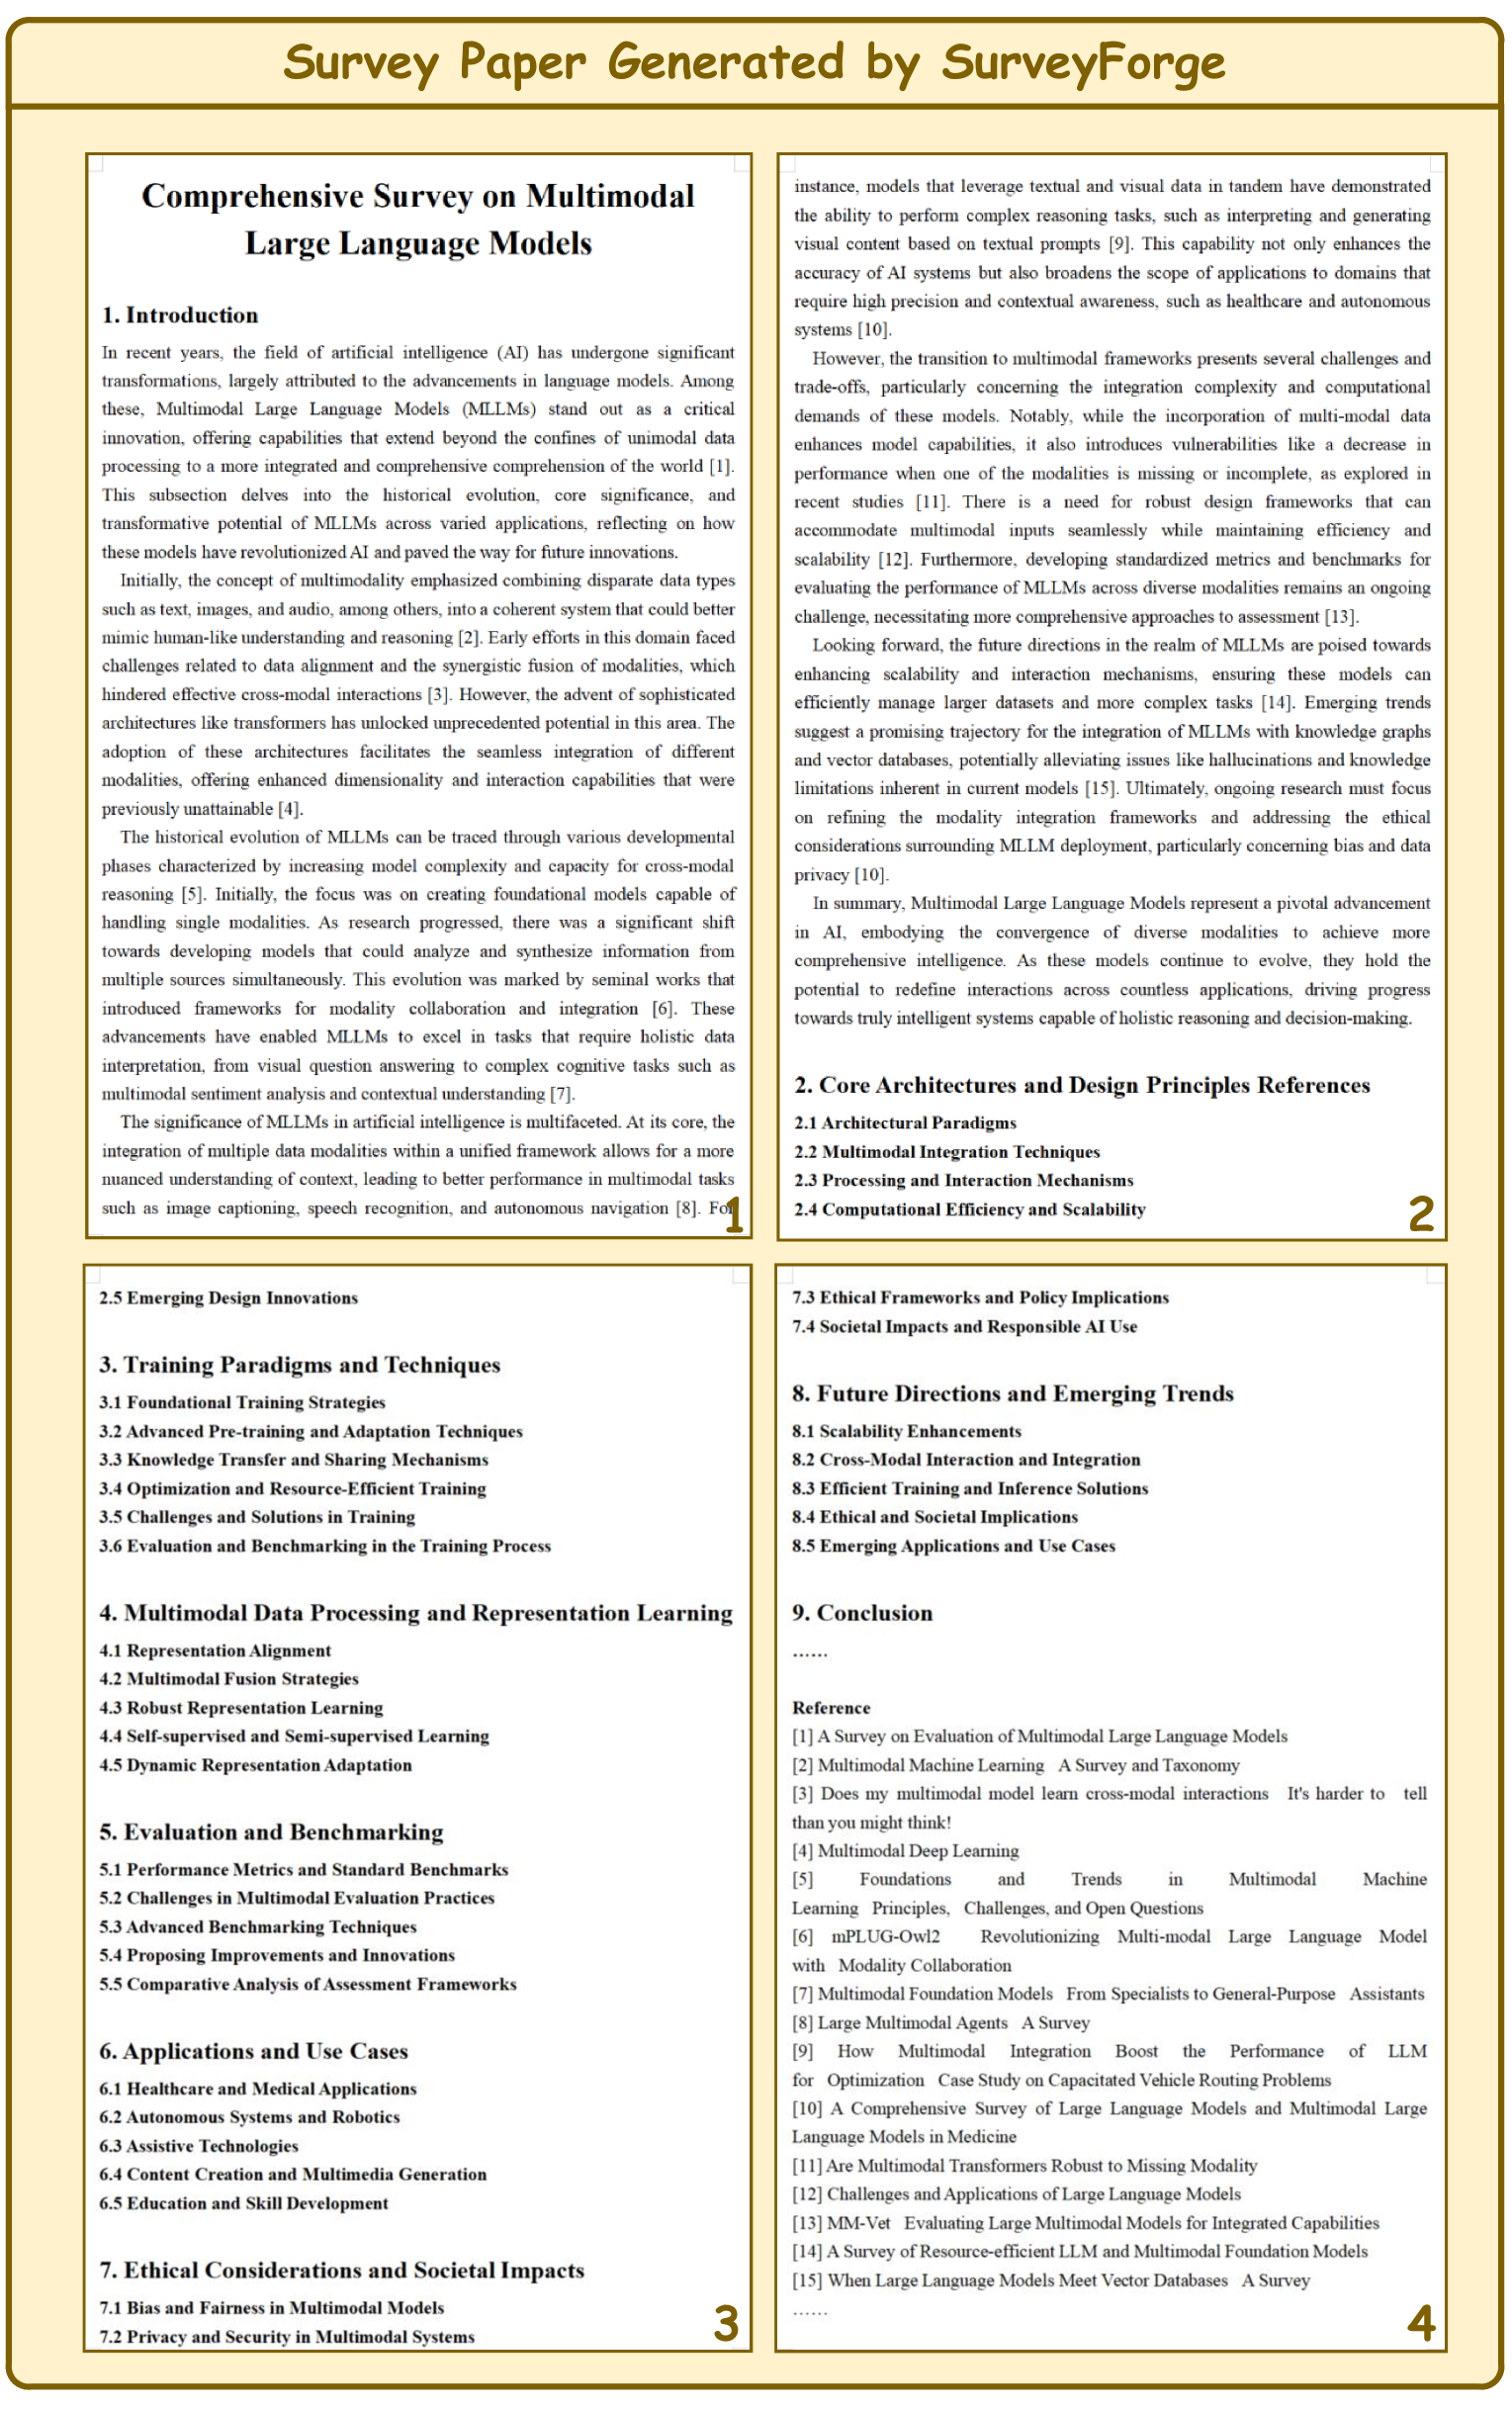
🔼 Figure 5 showcases an example of a survey paper automatically generated by the SURVEYFORGE framework. The figure displays a portion of the generated survey, highlighting its well-structured outline, comprehensive content, and detailed referencing. To view the complete survey paper, including the detailed contents of all sections, the caption directs readers to a URL, https://anonymous.4open.science/r/survey_example-7C37/. This URL provides access to additional auto-generated results, illustrating the system’s capabilities in generating full-length academic survey papers.
read the caption
Figure 5: Example of the survey generated by SurveyForge. Please refer to https://anonymous.4open.science/r/survey_example-7C37/ for more auto-generated results.
More on tables
| Methods | Outline Comparison | Content Comparison | |||
| Score Win Rate | Comparative Win Rate | Human Eval | Score Win Rate | Human Eval | |
| AutoSurvey (Wang et al., 2024c) | 27.00% | 25.00% | 26.00% | 31.00% | 30.00% |
| SurveyForge | 73.00% | 75.00% | 74.00% | 69.00% | 70.00% |
🔼 This table compares the performance of automatically generated and human-written survey papers in terms of outline and content quality. Three win rate metrics are presented: 1) ‘Score Win Rate’ shows the percentage of times the automated system’s LLM-assigned score was higher; 2) ‘Comparative Win Rate’ presents the win rate when the LLM directly compared pairs of papers; 3) ‘Human Eval’ shows the human expert evaluation win rate. This allows for a multifaceted comparison of the automated system’s quality, considering both direct scoring and head-to-head comparisons.
read the caption
Table 2: Win-rate comparison of automatic and human evaluations on outline and content quality. 'Score Win Rate' reflects the win rate based on individual LLM-scores, where the LLM assigns separate score to each survey paper before determining the higher-scoring one. 'Comparative Win Rate' is derived from LLM pairwise comparisons, where the LLM directly compares two articles side-by-side and decides which one is superior. 'Human Eval' represents the win rate derived from expert human evaluations.
| Method | Heuristic Learning | Demonstration Outline | Outline Quality |
| AutoSurvey | - | 81.78 | |
| SurveyForge | ✓ | From random surveys | 84.58 |
| SurveyForge | ✓ | From related surveys | 86.67 |
🔼 This ablation study investigates the impact of different outline sources used for heuristic learning within the outline generation stage of the SURVEYFORGE framework. It shows how using outlines from related surveys, rather than random ones, leads to better-structured AI-generated survey outlines. The improvement is further enhanced by employing outlines directly related to the target survey topic.
read the caption
Table 3: Ablation study for outline generation. 'Demonstration Outline' means the source of outlines used for heuristic learning.
| Components | Reference Quality | |||
| MR | MS | TRE | Input Cov. | Reference Cov. |
| - | - | - | 0.1119 | 0.2340 |
| ✓ | - | - | 0.1694 | 0.2730 |
| ✓ | ✓ | - | 0.1781 | 0.2984 |
| ✓ | - | ✓ | 0.1997 | 0.3542 |
| ✓ | ✓ | ✓ | 0.2224 | 0.3971 |
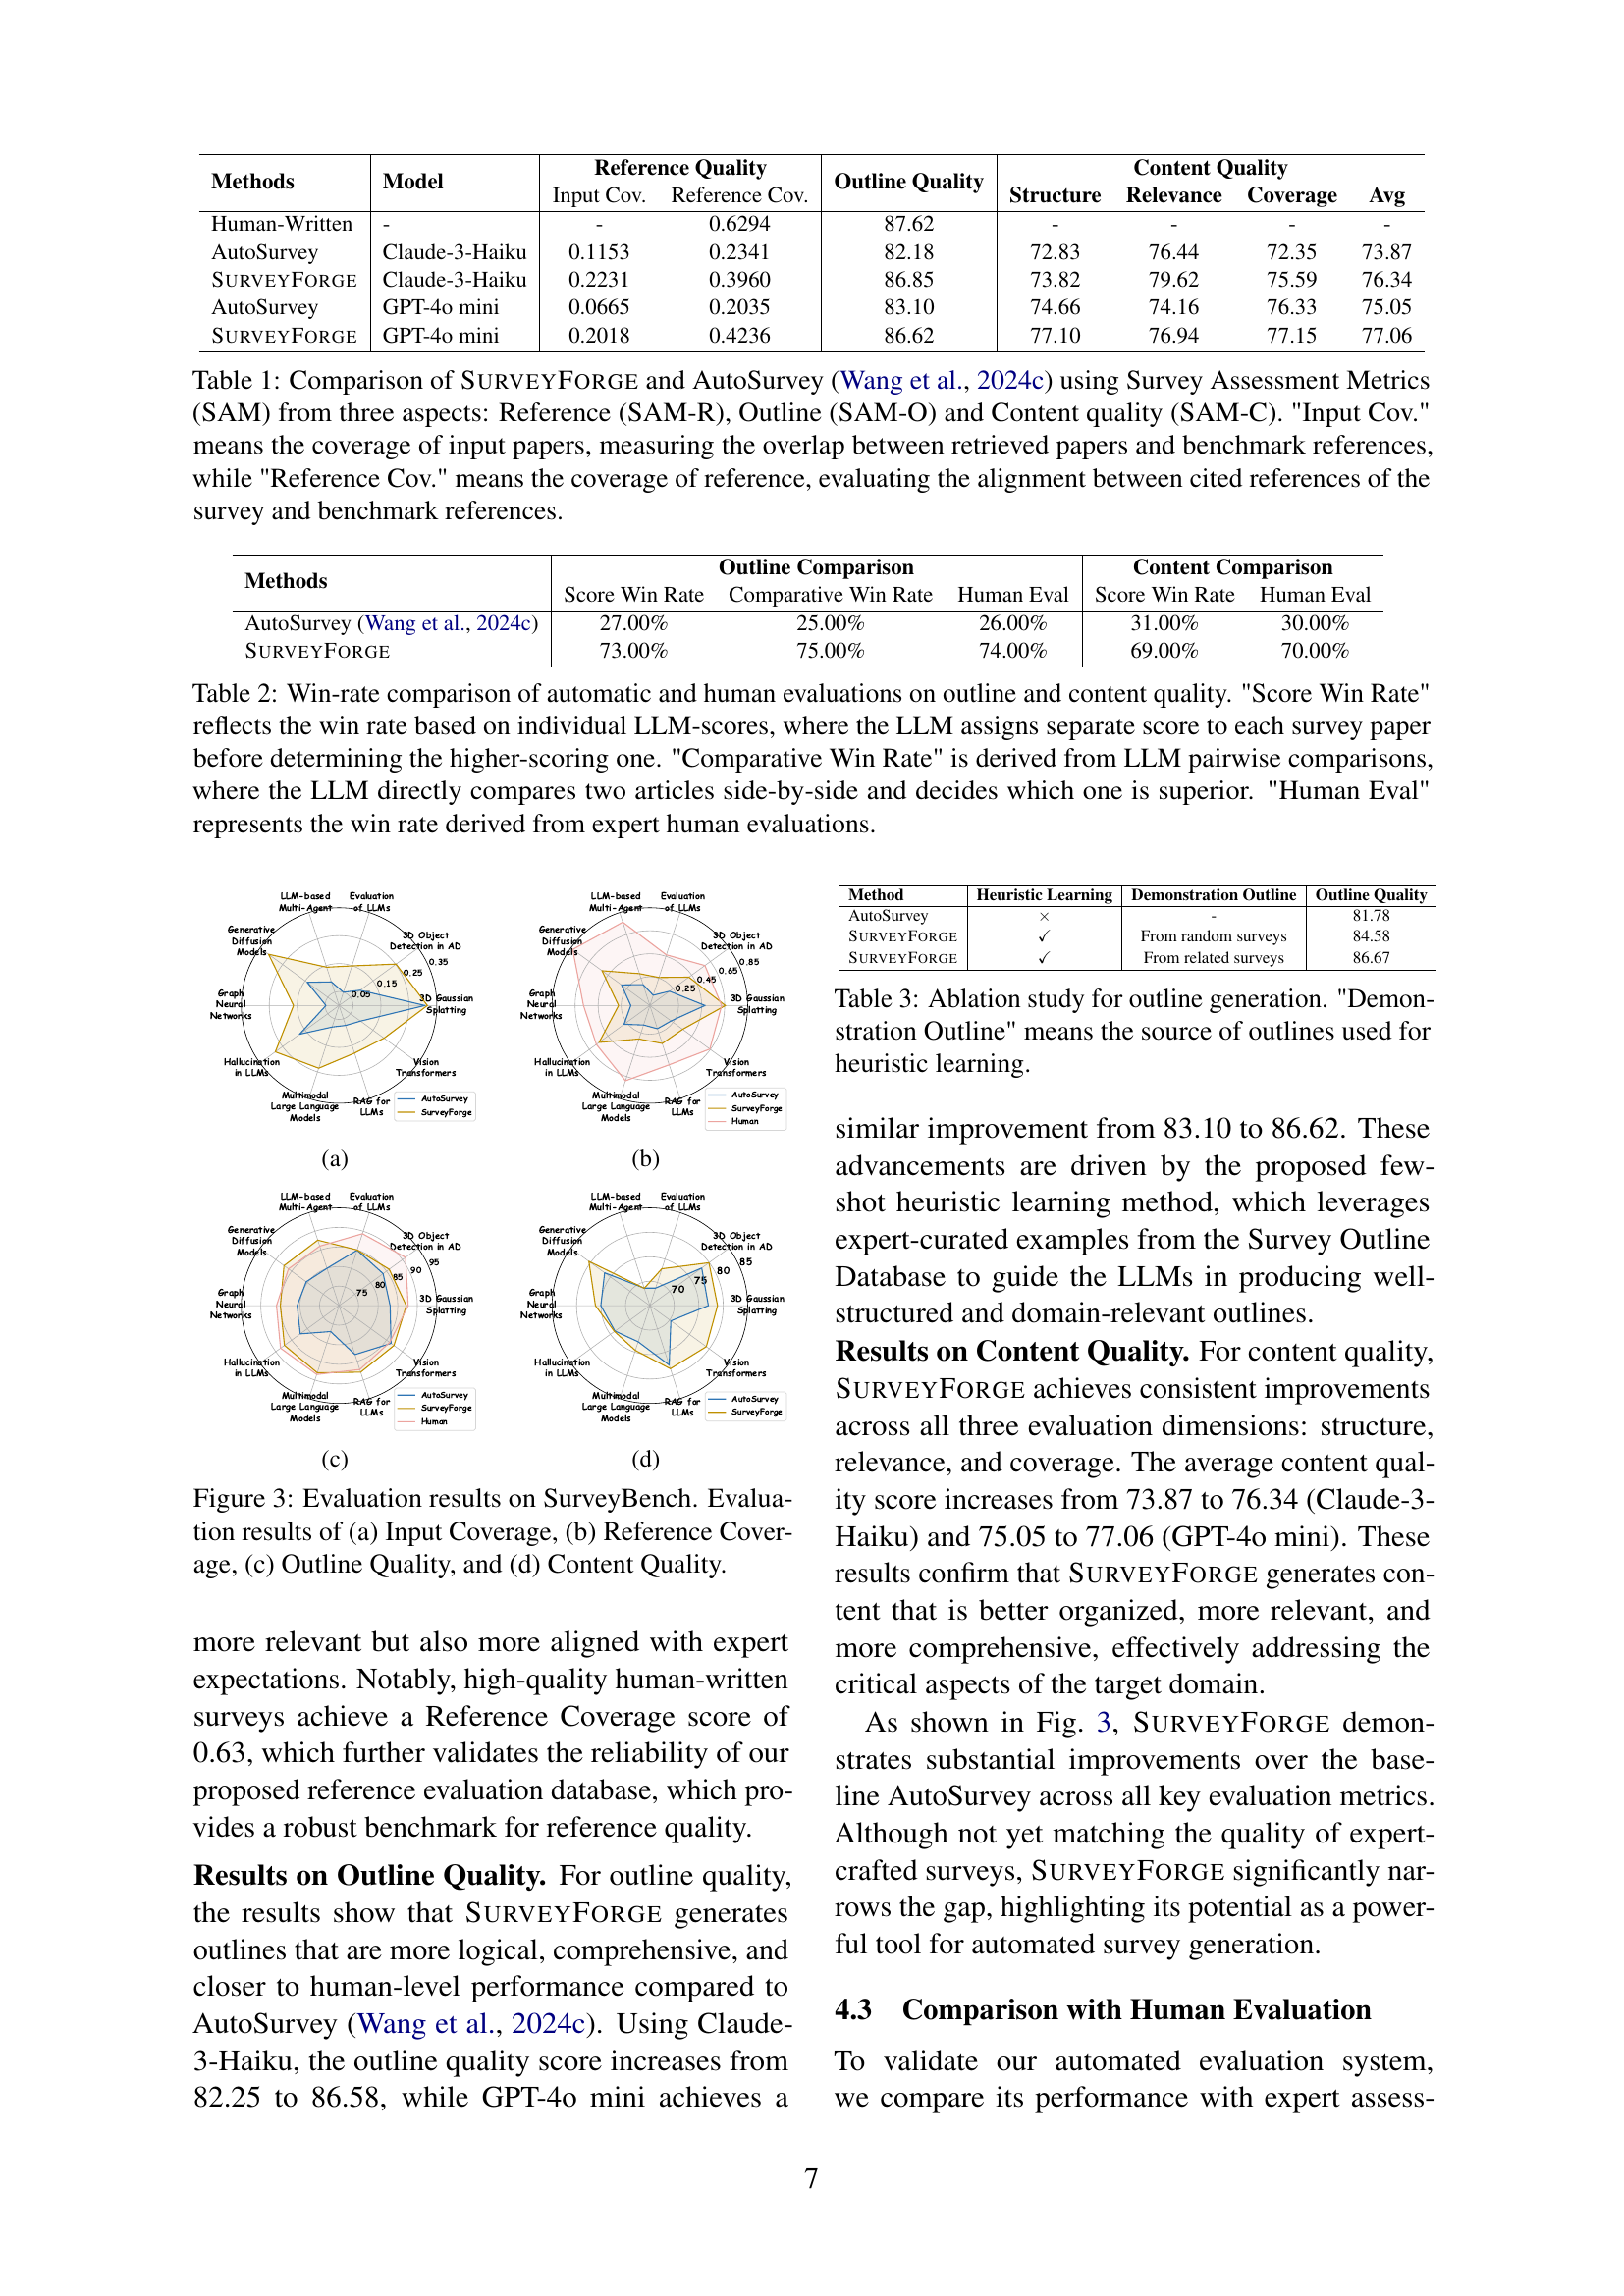
🔼 This ablation study investigates the impact of each component within the Scholar Navigation Agent (SANA) module on the content generation process. The SANA module consists of three main parts: Memory for Retrieval (MR), Memory for Sub-query (MS), and Temporal-aware Reranking Engine (TRE). The table shows how the removal of each component affects the Input Coverage and Reference Coverage metrics, which measure the quality of references retrieved by the system. This helps determine the relative importance and contribution of each component to the overall system performance.
read the caption
Table 4: Ablation study for content generation. We perform ablation on three components of SANA module: MR represents Memory for Retrieval, MS represents Memory for Sub-query, and TRE represents Temporal-aware Reranking Engine.
| Topic | Ref Num | Selected Survey Title | Citation |
| Multimodal Large Language Models | 912 | A Survey on Multimodal Large Language Models | 979 |
| Evaluation of Large Language Models | 714 | A Survey on Evaluation of Large Language Models | 1690 |
| 3D Object Detection in Autonomous Driving | 441 | 3D Object Detection for Autonomous Driving: A Comprehensive Survey | 172 |
| Vision Transformers | 563 | A Survey of Visual Transformers | 405 |
| Hallucination in Large Language Models | 500 | Siren’s Song in the AI Ocean: A Survey on Hallucination in Large Language Models | 808 |
| Generative Diffusion Models | 994 | A Survey on Generative Diffusion Models | 367 |
| 3D Gaussian Splatting | 330 | A Survey on 3D Gaussian Splatting | 128 |
| LLM-based Multi-Agent | 823 | A Survey on Large Language Model Based Autonomous Agents | 765 |
| Graph Neural Networks | 670 | Graph Neural Networks: Taxonomy, Advances, and Trends | 129 |
| Retrieval-Augmented Generation for Large Language Models | 608 | Retrieval-Augmented Generation for Large Language Models: A Survey | 953 |
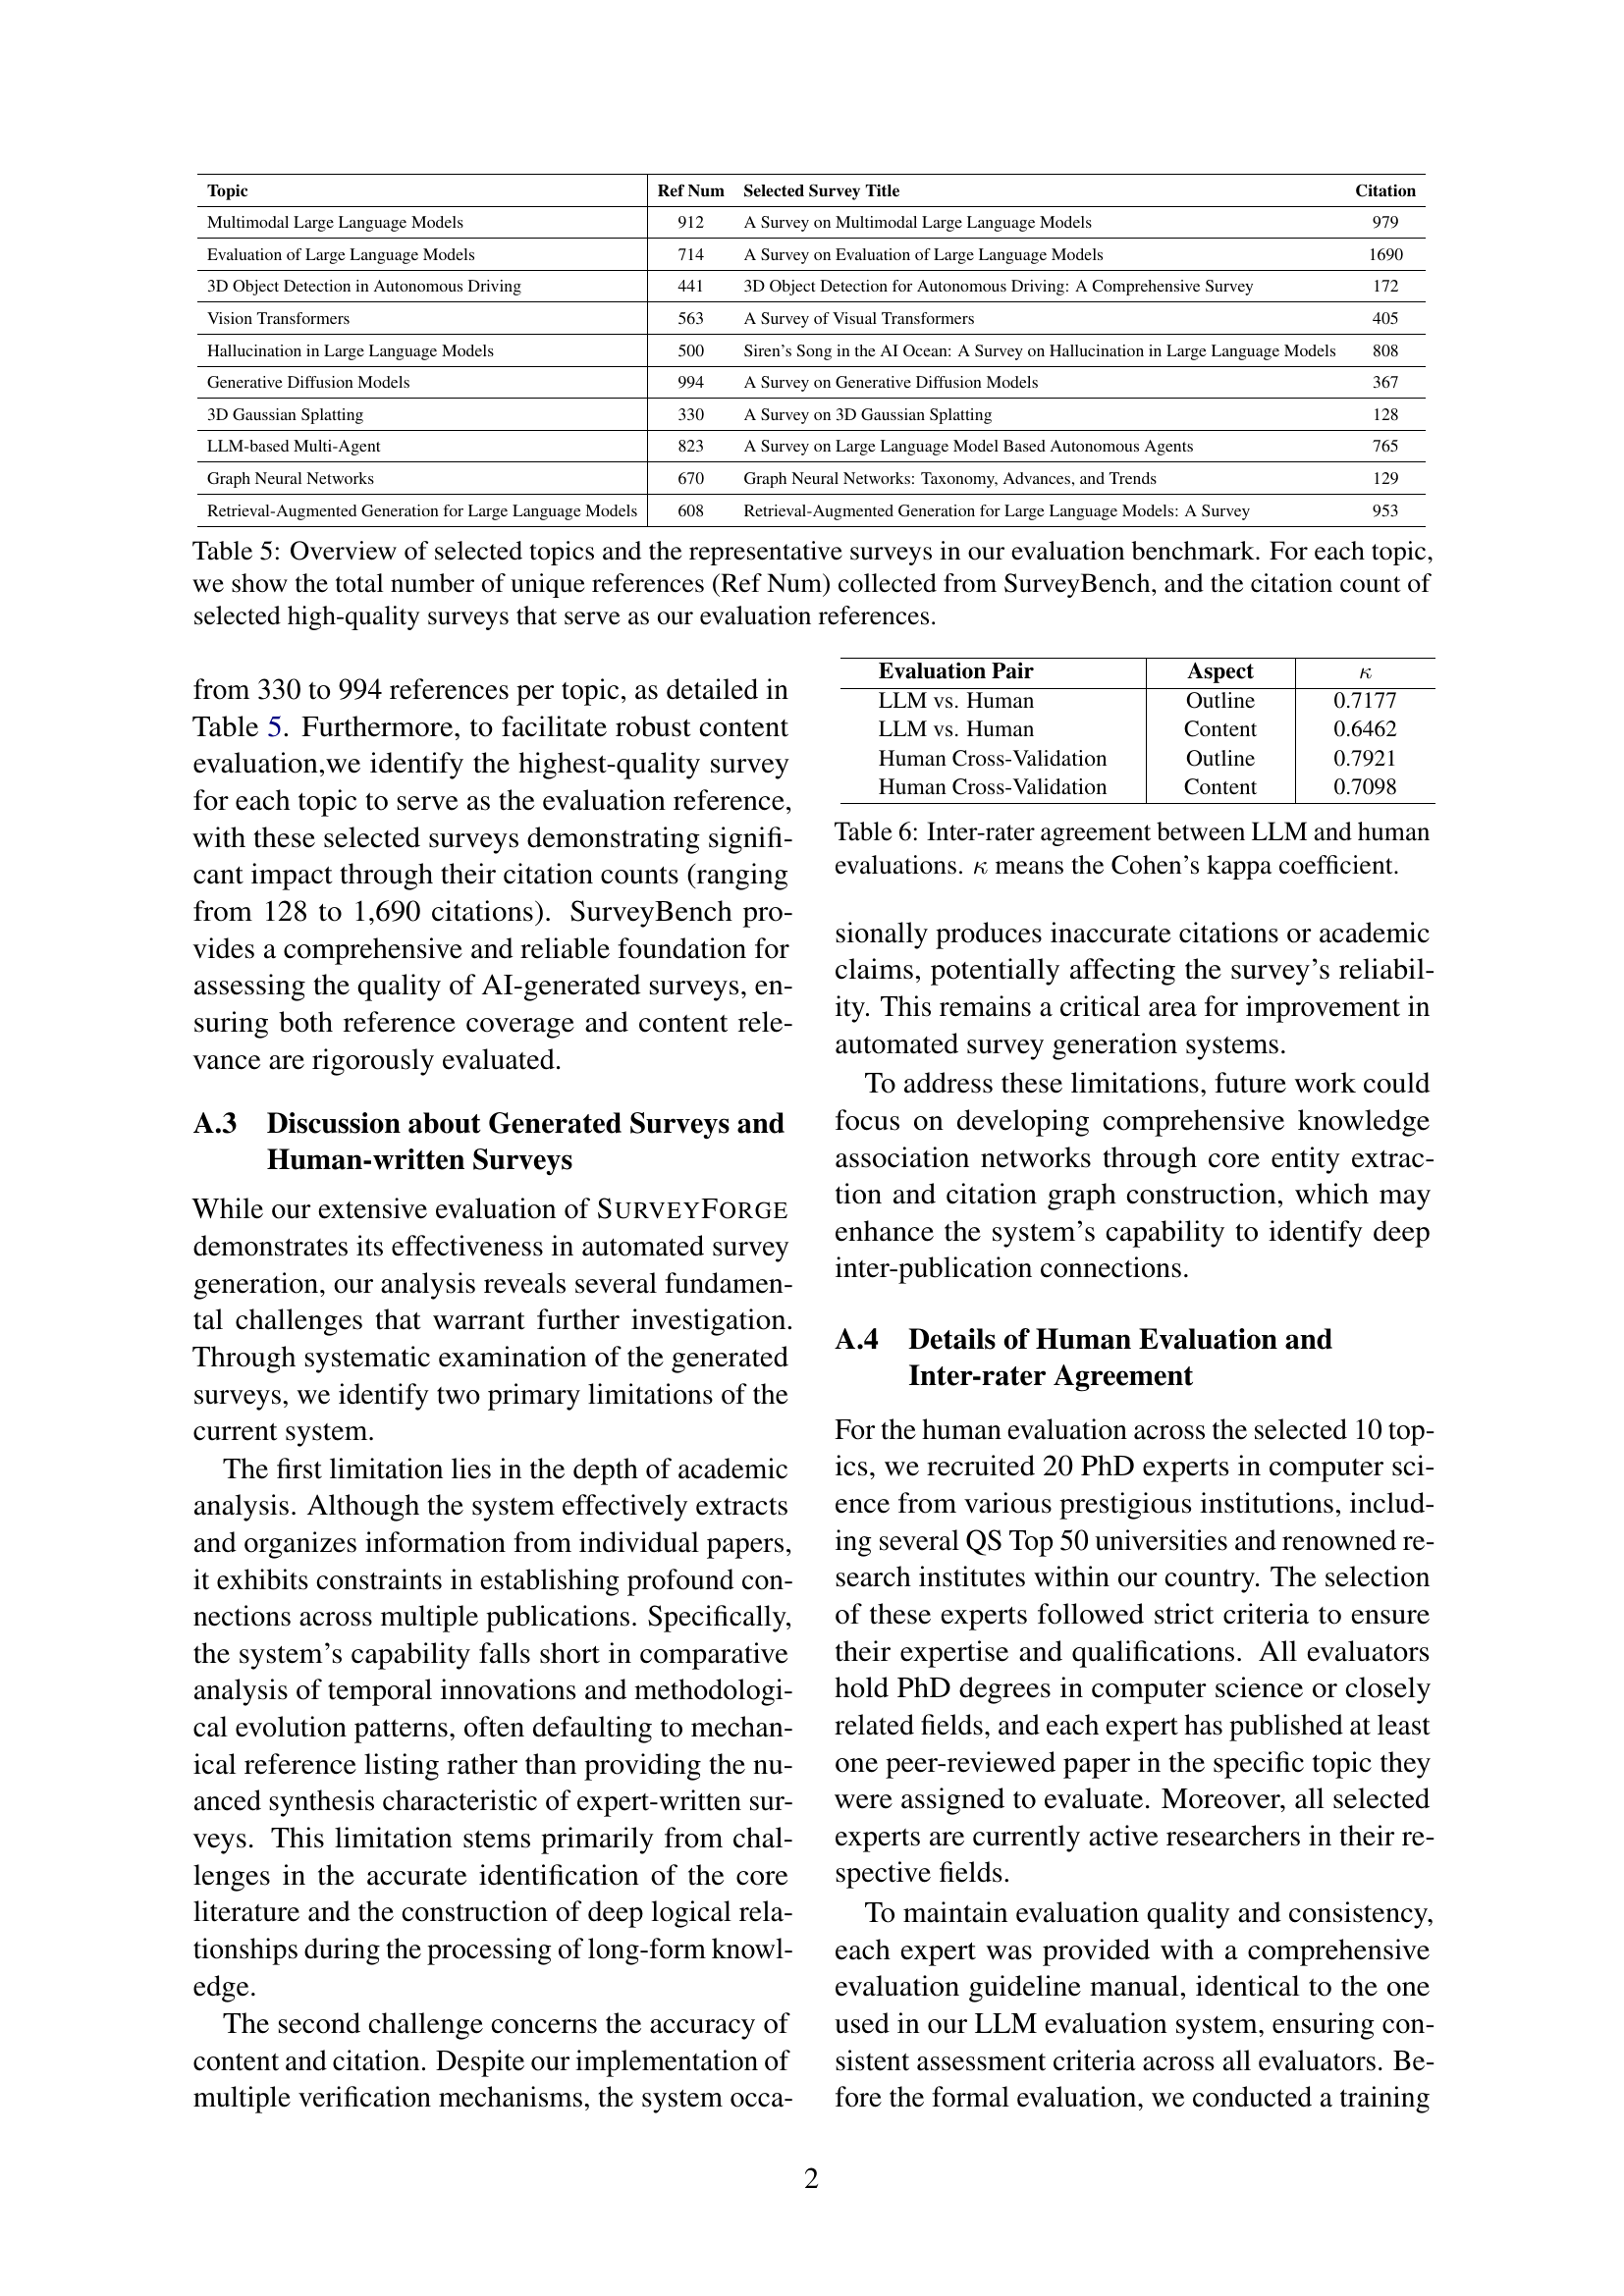
🔼 This table presents the 10 topics selected for the SurveyBench benchmark, along with the number of unique references associated with each topic and the citation counts for high-quality survey papers used as evaluation references. The data provides context on the scope and relevance of the chosen topics within the field of computer science.
read the caption
Table 5: Overview of selected topics and the representative surveys in our evaluation benchmark. For each topic, we show the total number of unique references (Ref Num) collected from SurveyBench, and the citation count of selected high-quality surveys that serve as our evaluation references.
| Evaluation Pair | Aspect | |
| LLM vs. Human | Outline | 0.7177 |
| LLM vs. Human | Content | 0.6462 |
| Human Cross-Validation | Outline | 0.7921 |
| Human Cross-Validation | Content | 0.7098 |
🔼 This table presents the results of a reliability analysis comparing the agreement between evaluations performed by Large Language Models (LLMs) and human experts. The Cohen’s kappa coefficient (κ) is used to quantify the level of agreement between the two evaluation methods. A higher kappa value indicates stronger agreement, suggesting that the LLM evaluations are consistent with human expert assessments. The table likely breaks down the Kappa score by specific evaluation tasks or dimensions, allowing for a more nuanced analysis of the LLM’s performance.
read the caption
Table 6: Inter-rater agreement between LLM and human evaluations. κ𝜅\kappaitalic_κ means the Cohen’s kappa coefficient.
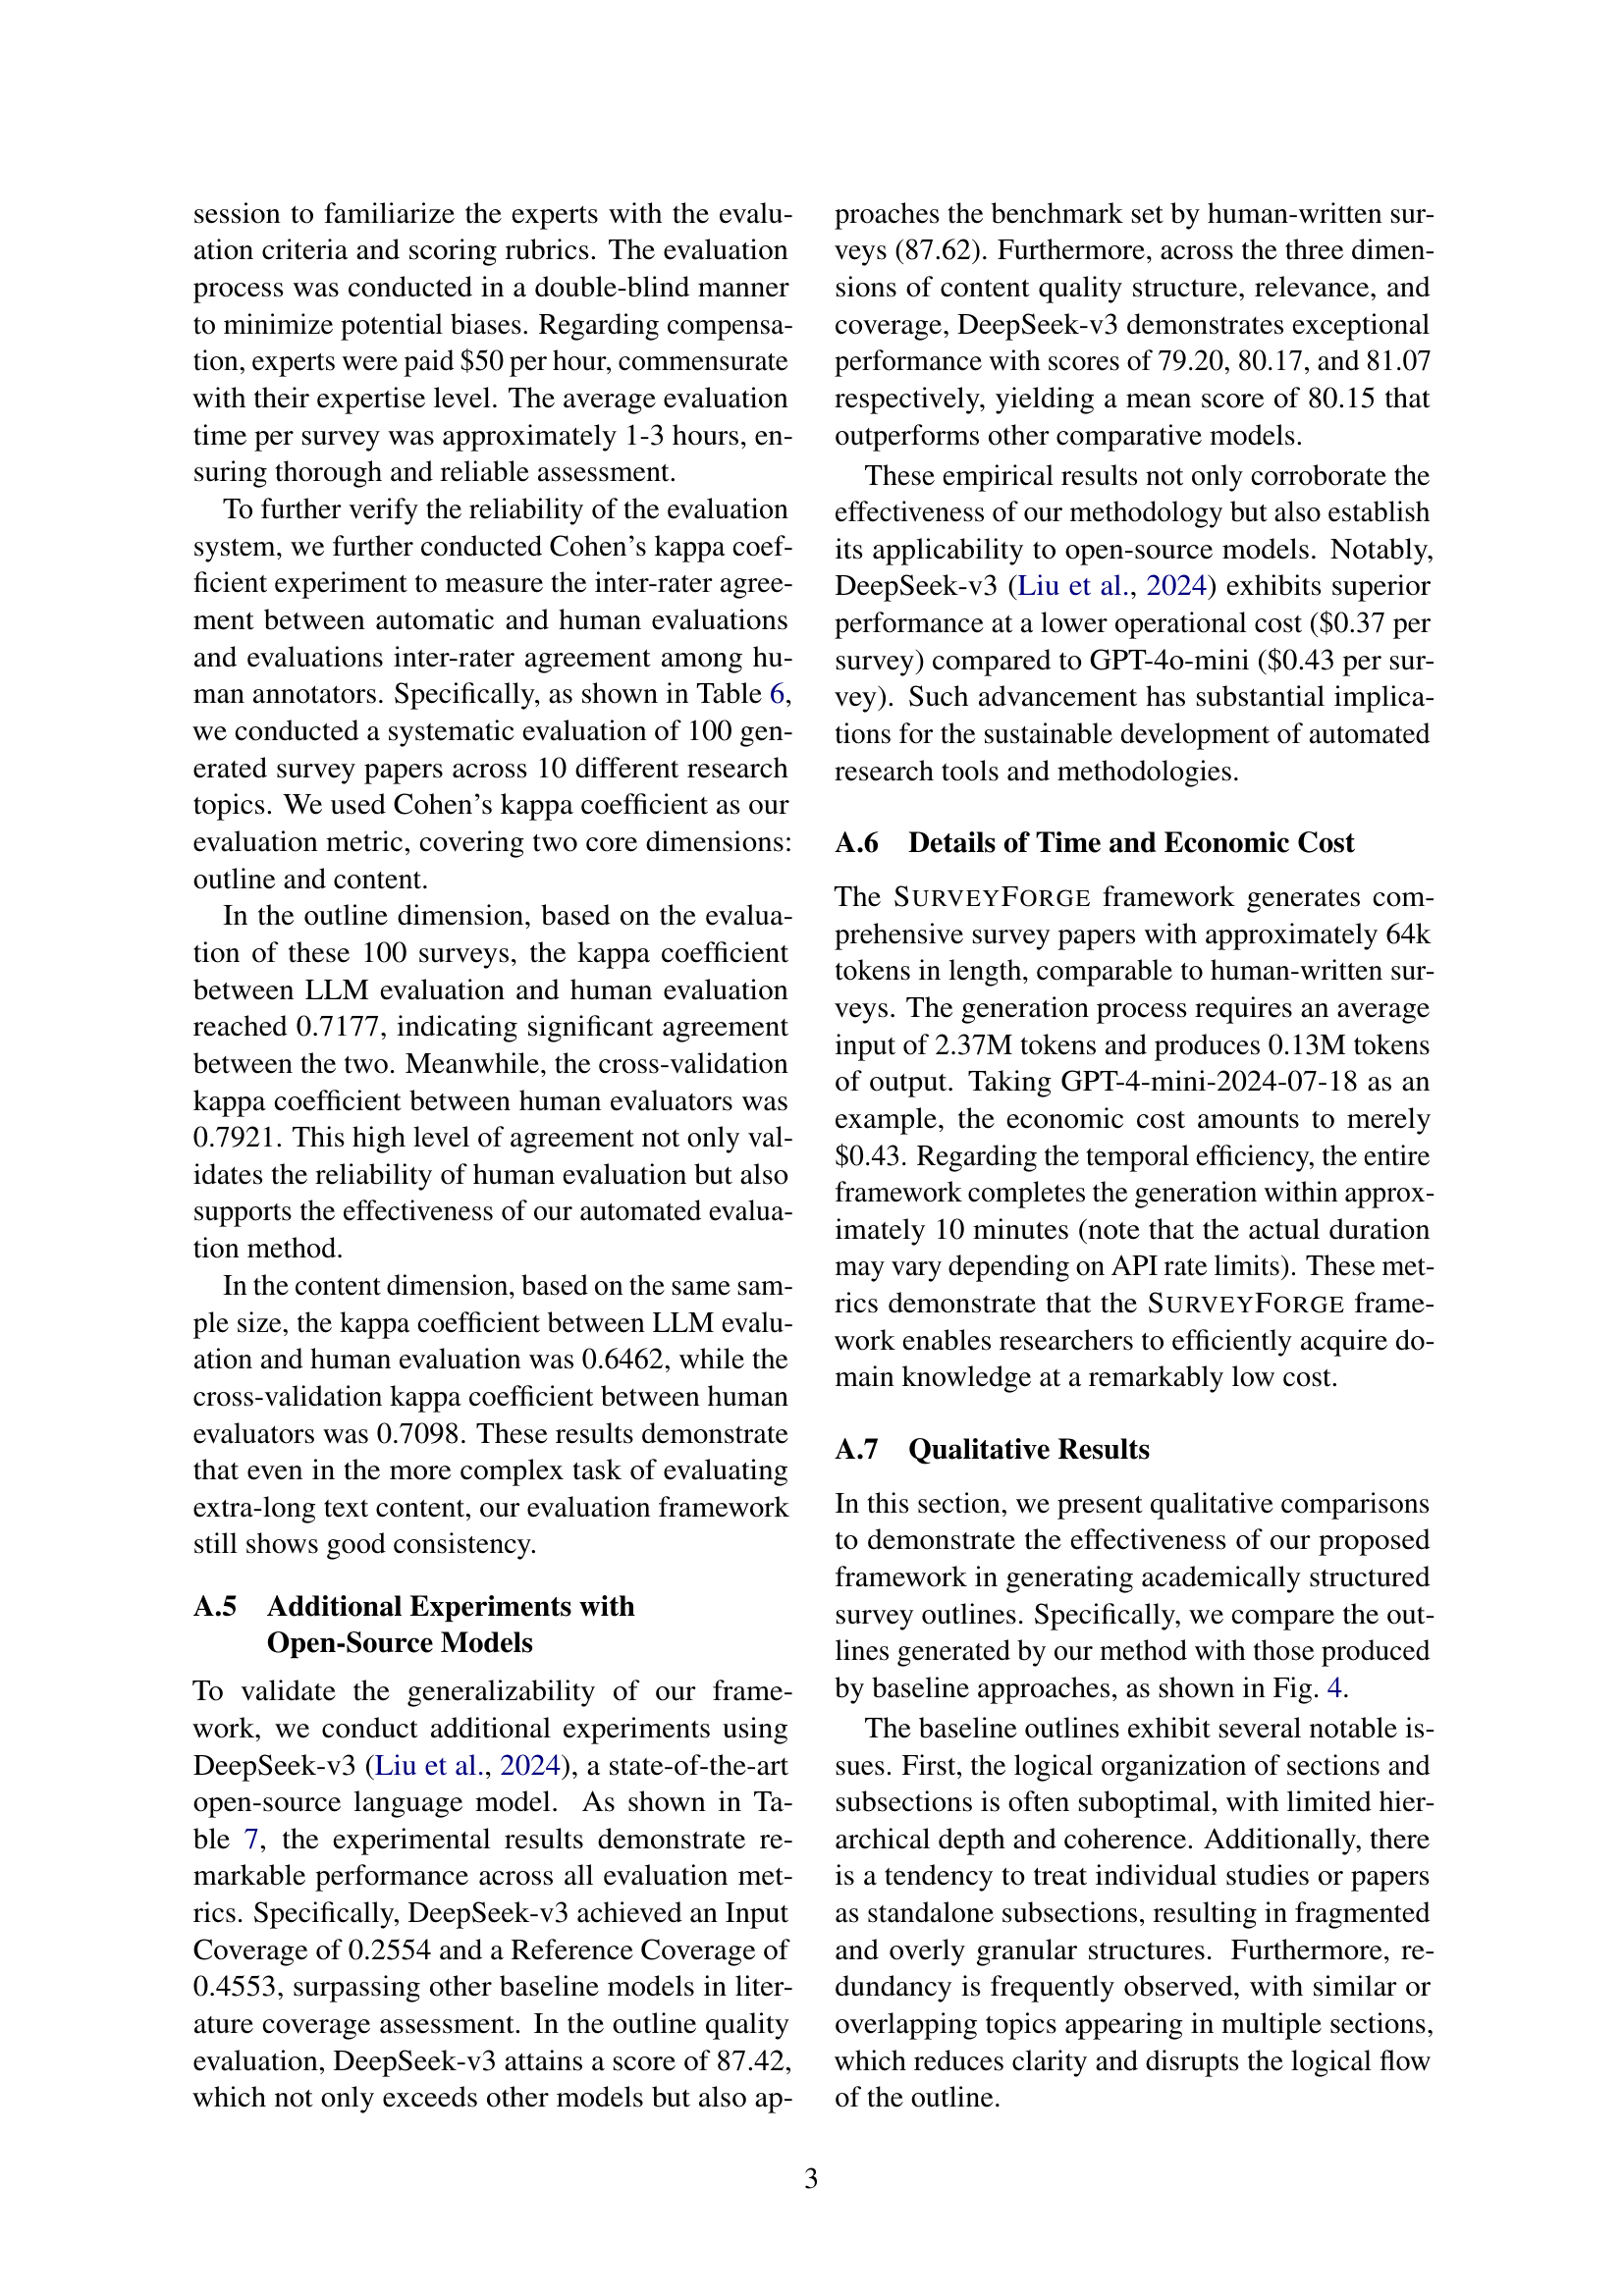
| Methods | Model | Reference Quality | Outline Quality | Content Quality | ||||
| Input Cov. | Reference Cov. | Structure | Relevance | Coverage | Avg | |||
| Human-Written | - | - | 0.6294 | 87.62 | - | - | - | - |
| SurveyForge | Claude-3-Haiku | 0.2231 | 0.3960 | 86.85 | 73.82 | 79.62 | 75.59 | 76.34 |
| SurveyForge | GPT-4o mini | 0.2018 | 0.4236 | 86.62 | 77.10 | 76.94 | 77.15 | 77.06 |
| SurveyForge | Deepseek-v3 | 0.2554 | 0.4553 | 87.42 | 79.20 | 80.17 | 81.07 | 80.15 |
🔼 This table compares the performance of SURVEYFORGE using three different language models: Claude-3-Haiku, GPT-4 mini, and DeepSeek-v3. It evaluates the models across multiple dimensions of survey quality, including reference quality (input coverage and reference coverage), outline quality (structure), and content quality (relevance and coverage). The results illustrate the relative strengths and weaknesses of open-source versus closed-source models in automated survey generation.
read the caption
Table 7: Comparison of open source and closed source models on SurveyBench.
Full paper#