TL;DR#
Existing Large Reasoning Models often struggle with open-ended tasks due to their reliance on internal knowledge, leading to inaccuracies. To address this, the paper proposed a two-stage outcome-based Reinforcement Learning approach designed to enhance the search capabilities of Large Language Models. This allows LLMs to autonomously invoke external search systems to access additional knowledge during the reasoning process.
The framework uses Retrieve-Reward to incentivize retrieval operations and Answer-Reward to encourage models to utilize external systems effectively. The R1-Searcher significantly outperforms previous methods, even compared to GPT-4o-mini. It demonstrated great results on the HotpotQA and 2Wiki datasets. Also, the model achieves great generalization on the Bamboogle dataset compared to the Search-o1.
Key Takeaways#
Why does it matter?#
This paper introduces a novel RL framework to enhance LLMs’ search capabilities, addressing limitations in knowledge-intensive tasks. The significant performance gains over existing methods, including closed-source models, highlight the potential of RL for improving RAG systems and opening new research avenues.
Visual Insights#

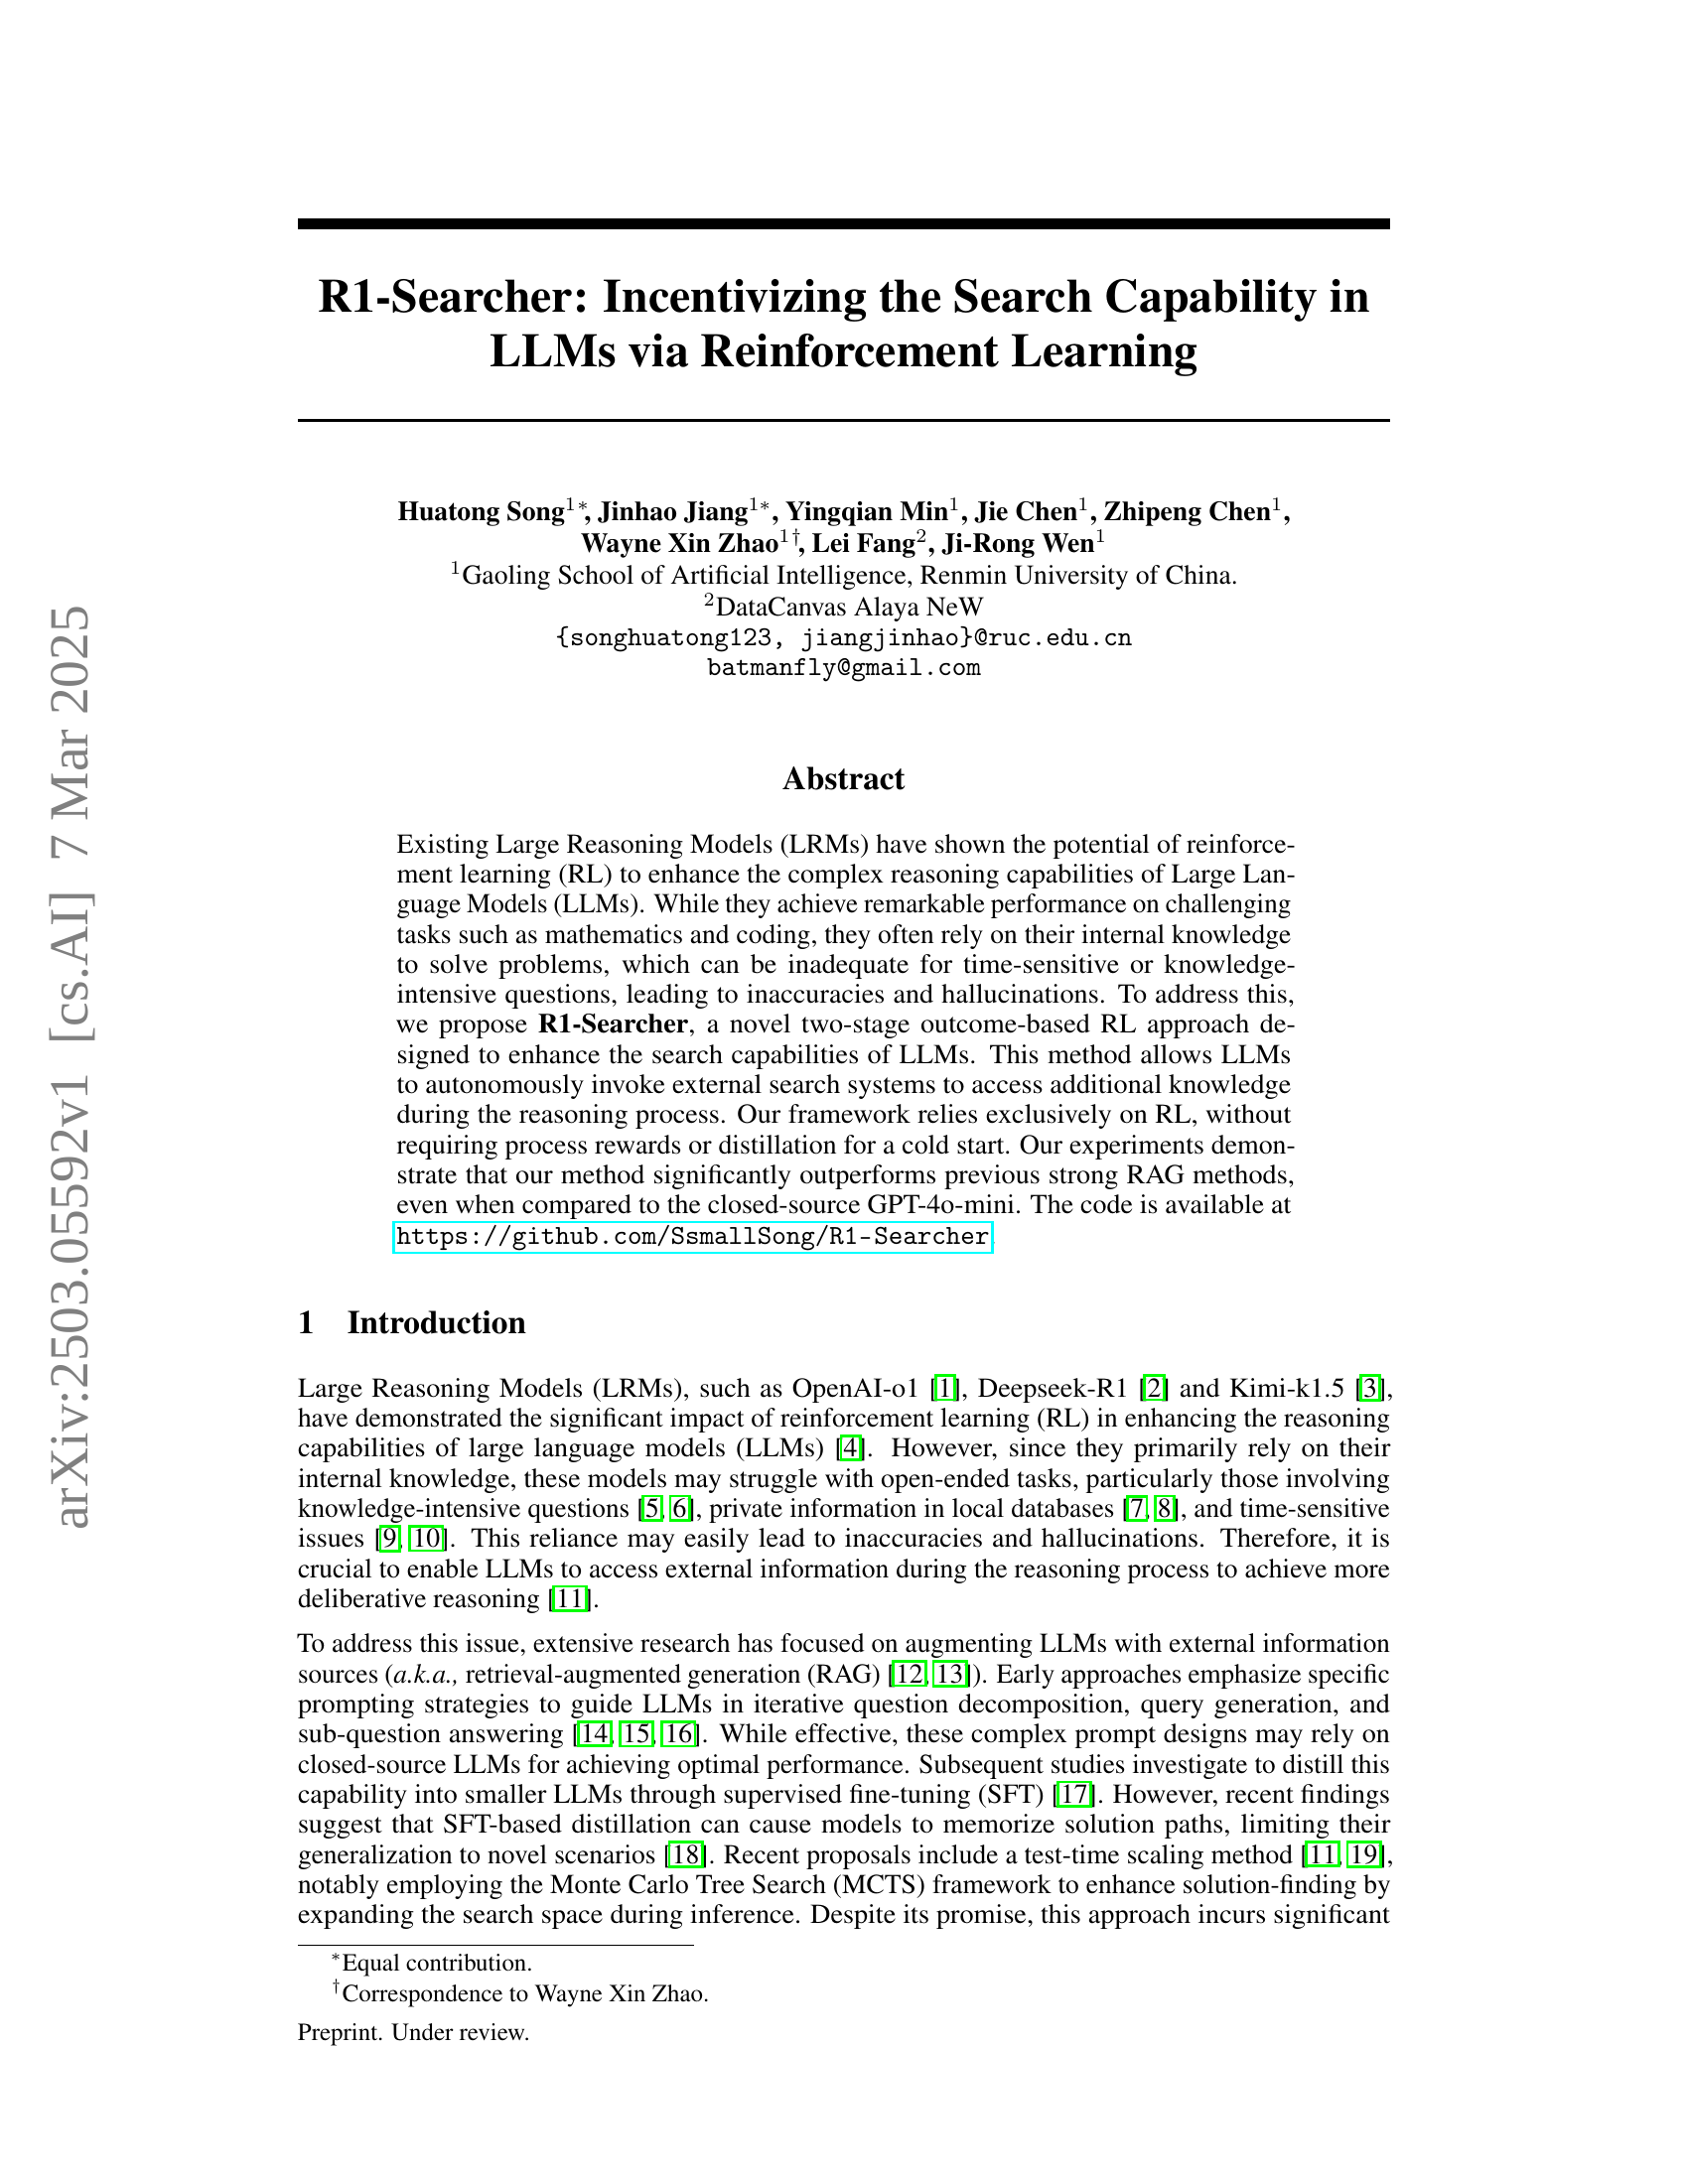
🔼 Figure 1 presents a bar chart comparing the performance of R1-Searcher against several other methods across four distinct multi-hop question answering (QA) benchmark datasets: HotpotQA, 2WikiMultiHopQA, Bamboogle, and Musique. The chart displays the accuracy or percentile achieved by each method on each dataset. R1-Searcher consistently outperforms the other models, demonstrating its state-of-the-art performance on all four benchmarks.
read the caption
Figure 1: Performance comparisons between R1-Searcher and other methods on four multi-hop QA benchmarks. R1-Searcher achieves state-of-the-art performance on each dataset.
| Stage | Dataset | Easy | Medium | Difficult |
| Stage-1 | HotpotQA | - | 200 | - |
| 2WikiMultiHopQA | - | 150 | - | |
| Stage-2 | HotpotQA | - | 2561 | 2000 |
| 2WikiMultiHopQA | - | 1087 | 2500 |
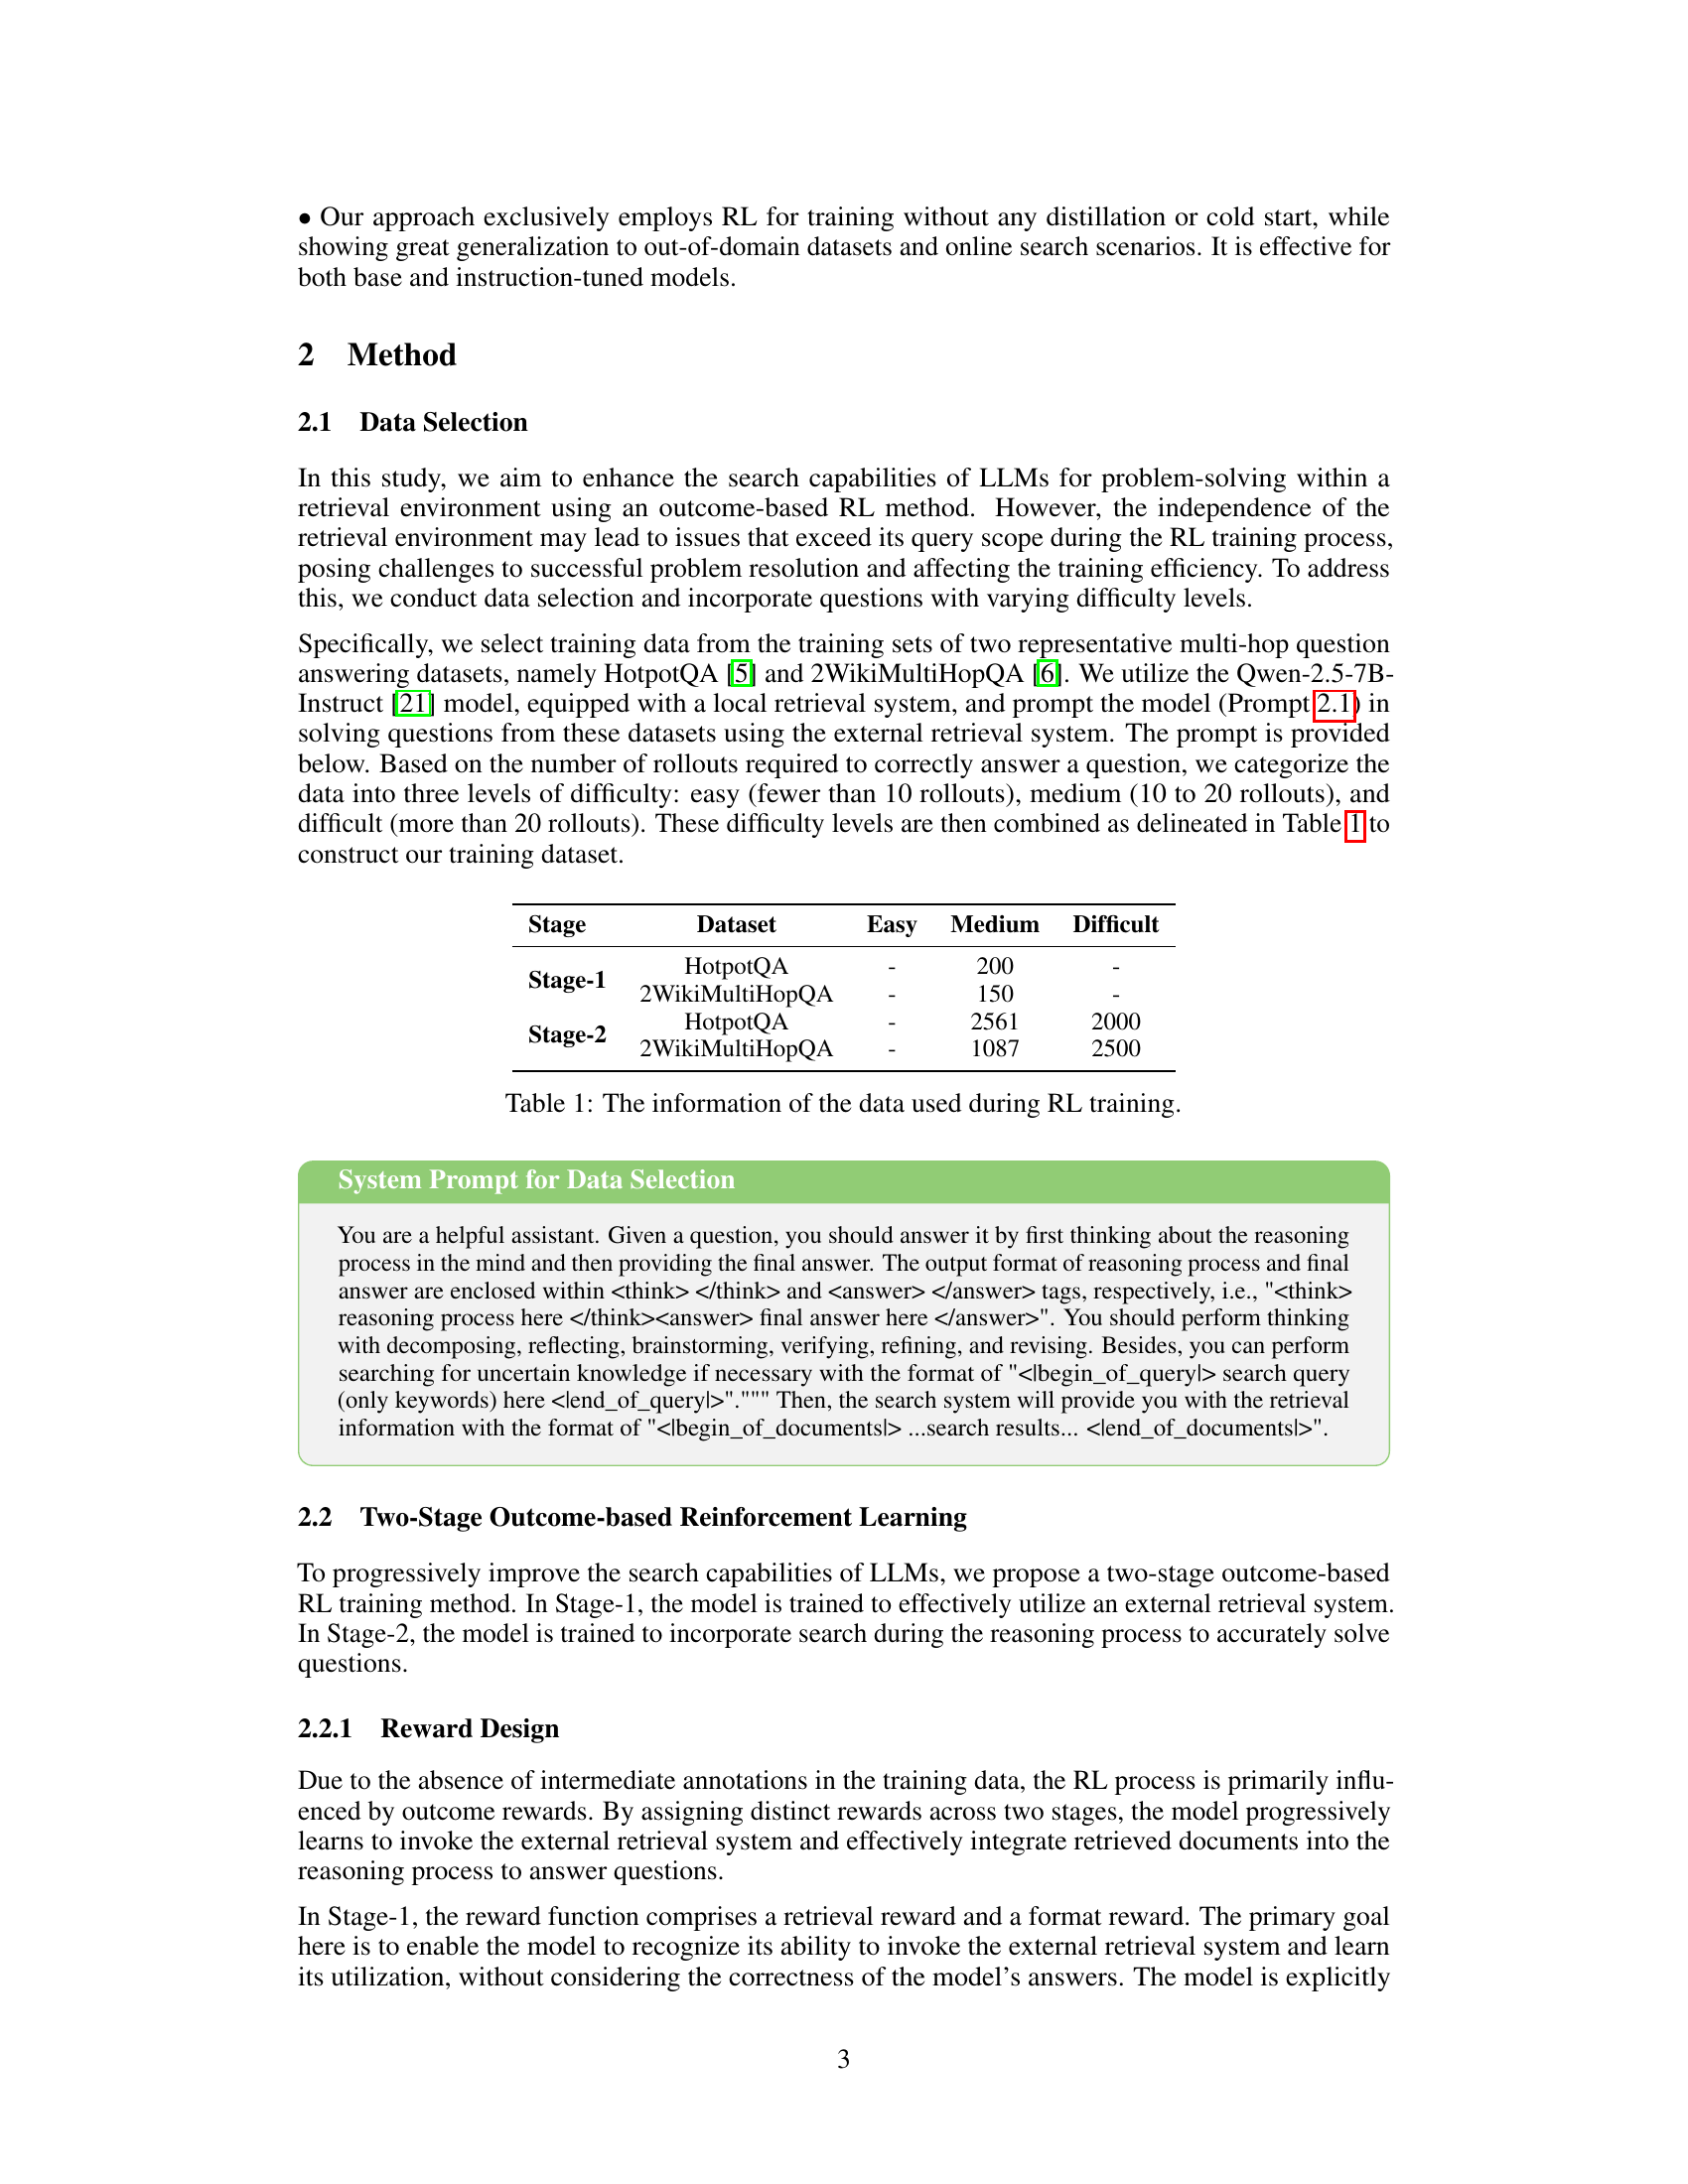
🔼 This table presents the dataset used for training the R1-Searcher model. It shows the breakdown of the data by stage (Stage-1 and Stage-2), dataset (HotpotQA and 2WikiMultiHopQA), and difficulty level (Easy, Medium, Difficult). The number of samples for each category in each stage is detailed, providing a complete overview of the training data distribution across difficulty levels and datasets.
read the caption
Table 1: The information of the data used during RL training.
In-depth insights#
RL for Search#
Reinforcement Learning (RL) for Search presents a promising avenue for enhancing the capabilities of Language Models (LLMs), particularly in scenarios demanding external knowledge integration. This approach addresses limitations of LLMs that primarily rely on internal knowledge. By incentivizing LLMs to autonomously engage external search systems, RL offers a pathway to overcome inaccuracies and hallucinations, crucial for time-sensitive and knowledge-intensive tasks. The key is to train LLMs to effectively use the search tool and integrate it into the reasoning. By carefully design the reward function we can progressively enable the model to invoke the external retrieval system and integrate retrieved documents into reasoning.
R1-Searcher#
R1-Searcher is presented as a novel two-stage outcome-based reinforcement learning (RL) approach designed to enhance search capabilities in Large Language Models (LLMs). It addresses the challenge of LLMs relying heavily on internal knowledge, which can lead to inaccuracies, especially in time-sensitive or knowledge-intensive tasks. The framework enables LLMs to autonomously invoke external search systems to access additional knowledge during reasoning. A key feature is its reliance exclusively on RL, eliminating the need for process rewards or distillation for a cold start, potentially streamlining the training process and improving efficiency. The two-stage approach likely involves an initial phase focused on learning the mechanics of external search integration, followed by a refinement stage that optimizes the use of retrieved information for accurate problem-solving, it represents a significant step towards more deliberative reasoning in LLMs. The method significantly outperforms previous strong RAG methods.
Two-Stage RL#
Two-stage RL is a crucial strategy for complex problem-solving. It allows for a phased approach, where initial stages focus on exploration and learning basic skills, and subsequent stages refine these skills towards a specific goal. This mimics human learning, starting with broad understanding and moving towards specialized expertise. The first stage could involve pre-training, imitation learning, or unsupervised exploration to establish a foundational policy. The second stage involves finetuning with reinforcement learning, guiding the policy towards optimal performance. This approach prevents premature convergence to suboptimal policies and improves sample efficiency. The design of the reward function is critical, as it will influence the model to take certain actions based on the reward it gets. Moreover, it can be designed so that the model may consider a different reward at different stages.
RAG-based Rollout#
RAG-based rollout aims to improve how language models use external knowledge. By strategically inserting special tags like <begin_of_query> and <end_of_query>, the model is prompted to use the search tool during generation. When the model generates the <end_of_query> tag, the process pauses so that the query can be extracted and used for retrieval. The retrieved documents, surrounded by <begin_of_documents> and <end_of_documents> tags, are then incorporated into the model’s reasoning process. This method helps ensure that retrieval is a seamless part of the reasoning, enabling the model to make decisions based on retrieved knowledge without disrupting its flow.
Online Search#
Online search represents a crucial frontier for enhancing LLMs, moving beyond static knowledge to real-time information access. Integrating LLMs with online search capabilities holds the potential to address knowledge-intensive tasks, time-sensitive queries, and personalized information needs more effectively. A key challenge lies in enabling LLMs to formulate effective search queries, understand the retrieved information, and synthesize it into coherent and accurate responses. Another challenge is to design training methodologies that allow LLMs to effectively leverage online search without overfitting or memorizing specific search results. There is also a need to ensure the ethical use of online search within LLMs, mitigating the risk of biased information and promoting reliable answers.
More visual insights#
More on figures

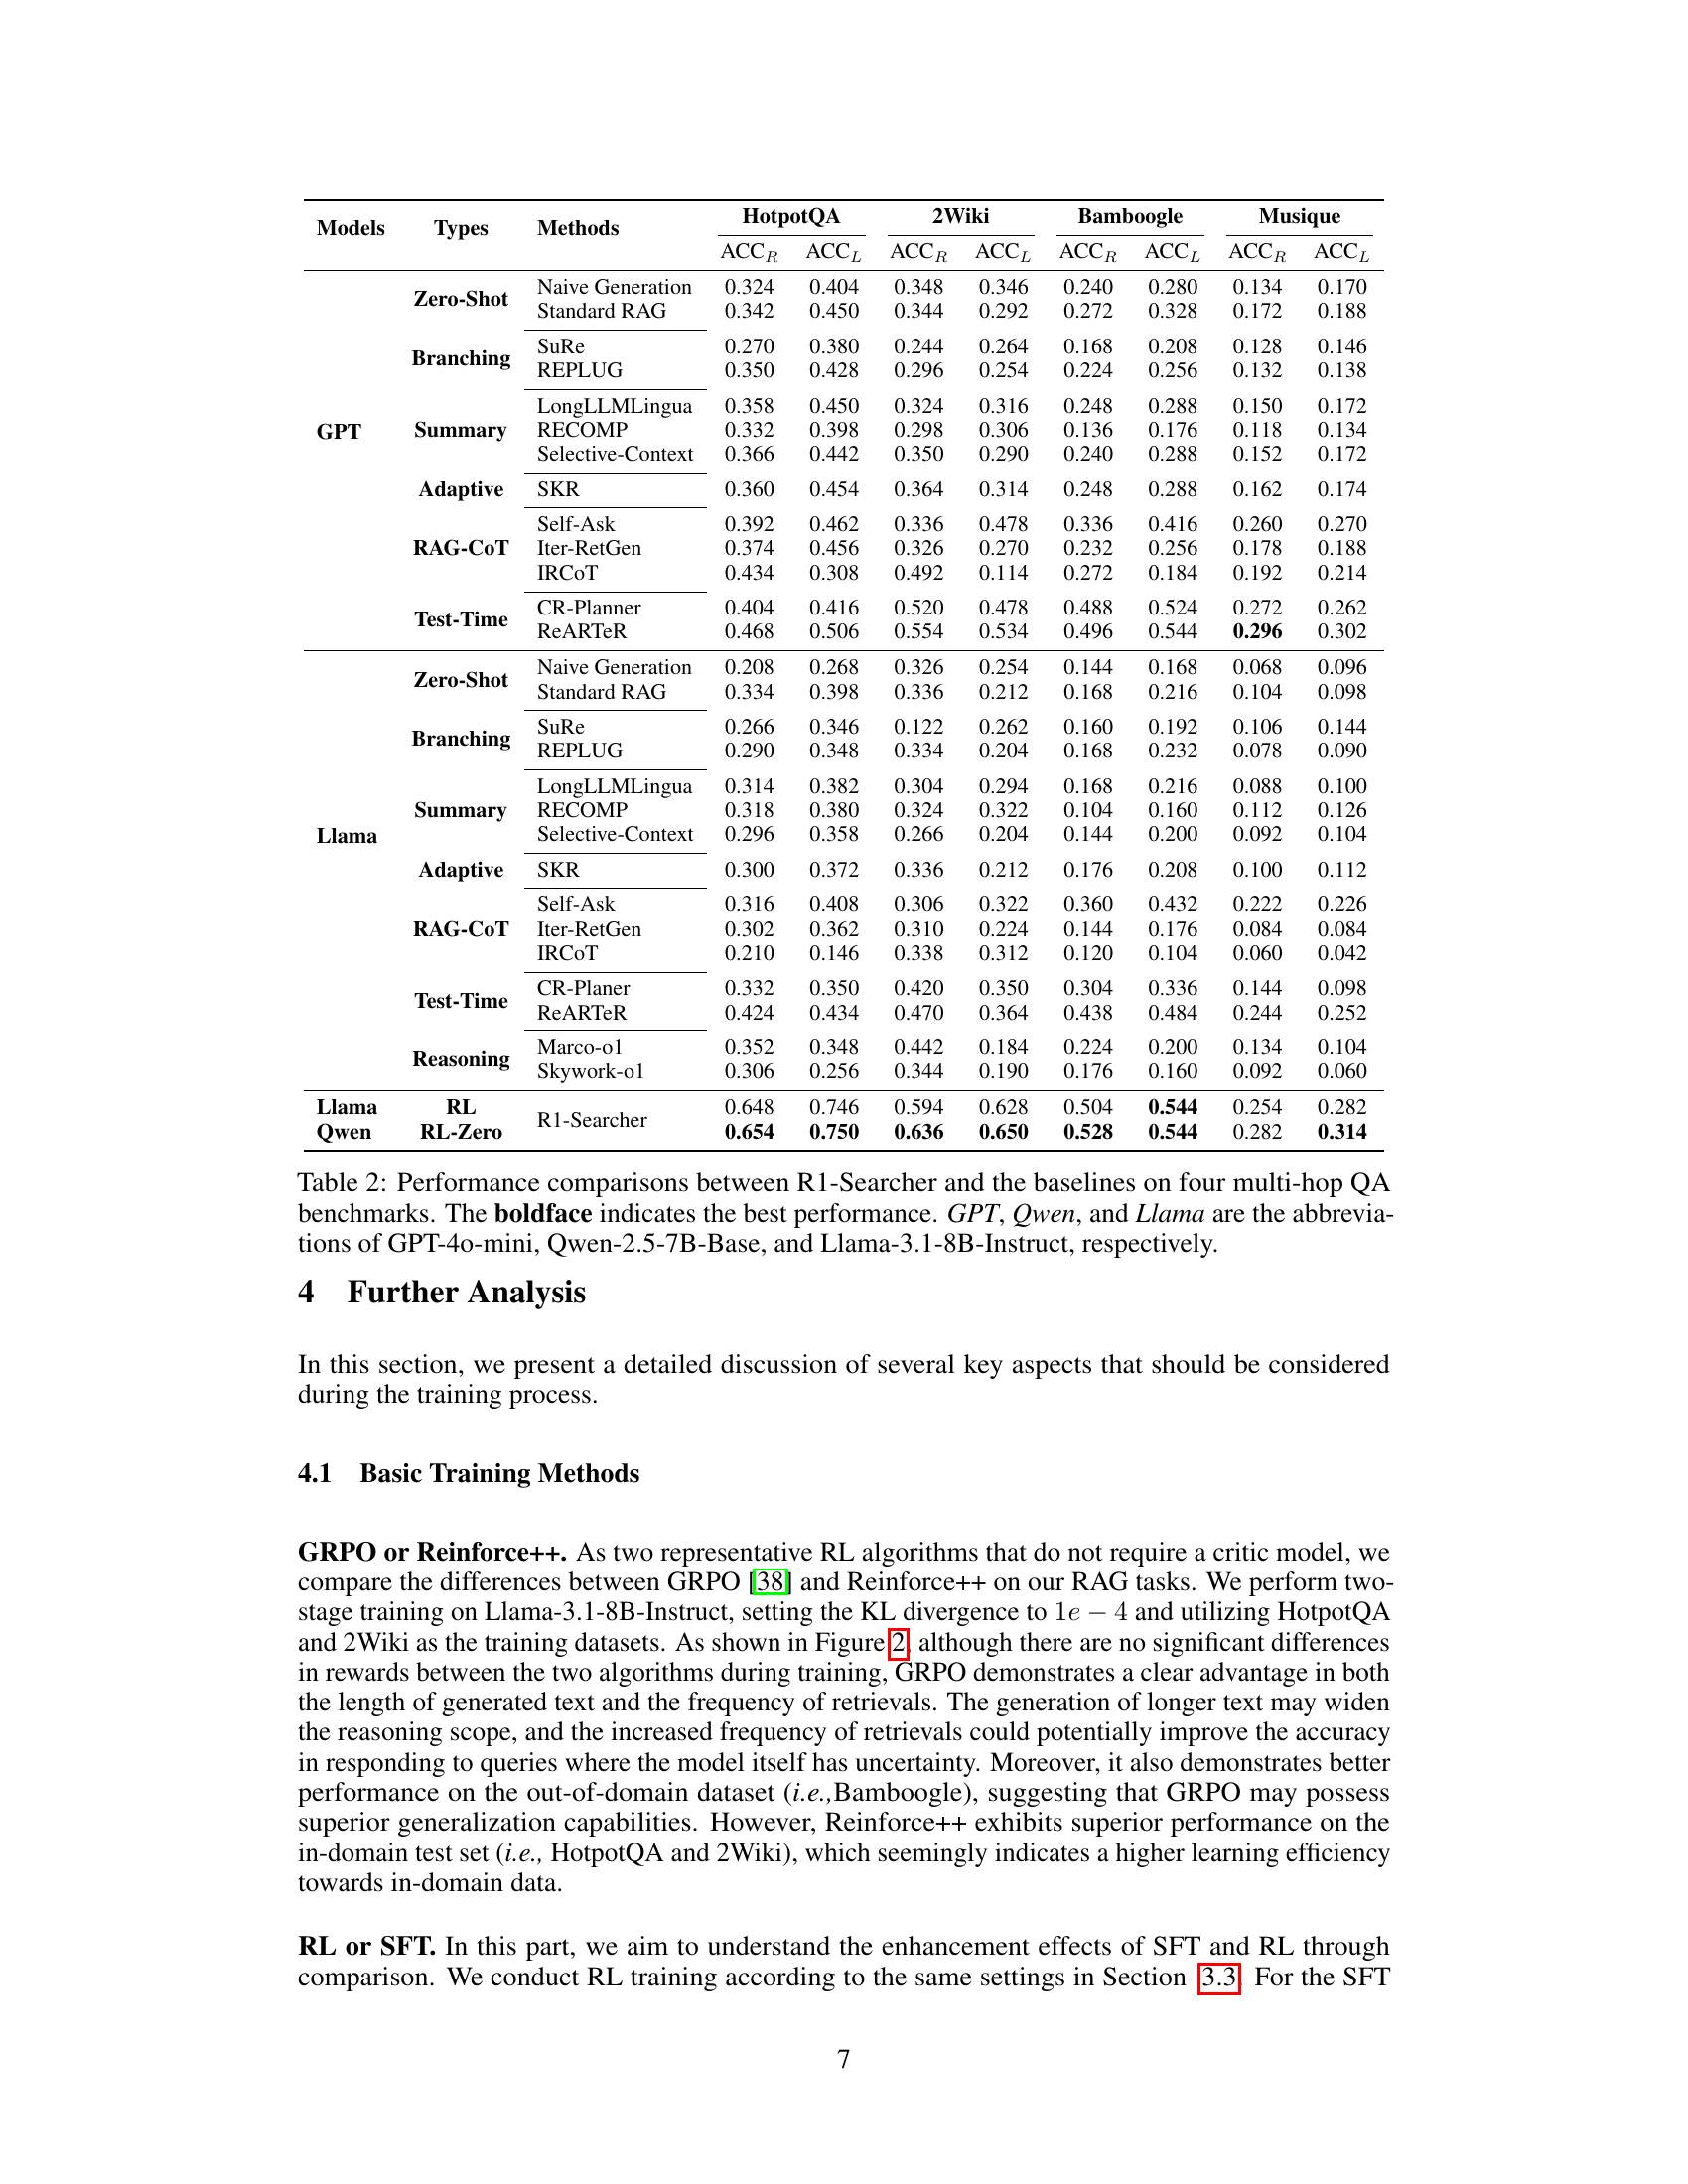
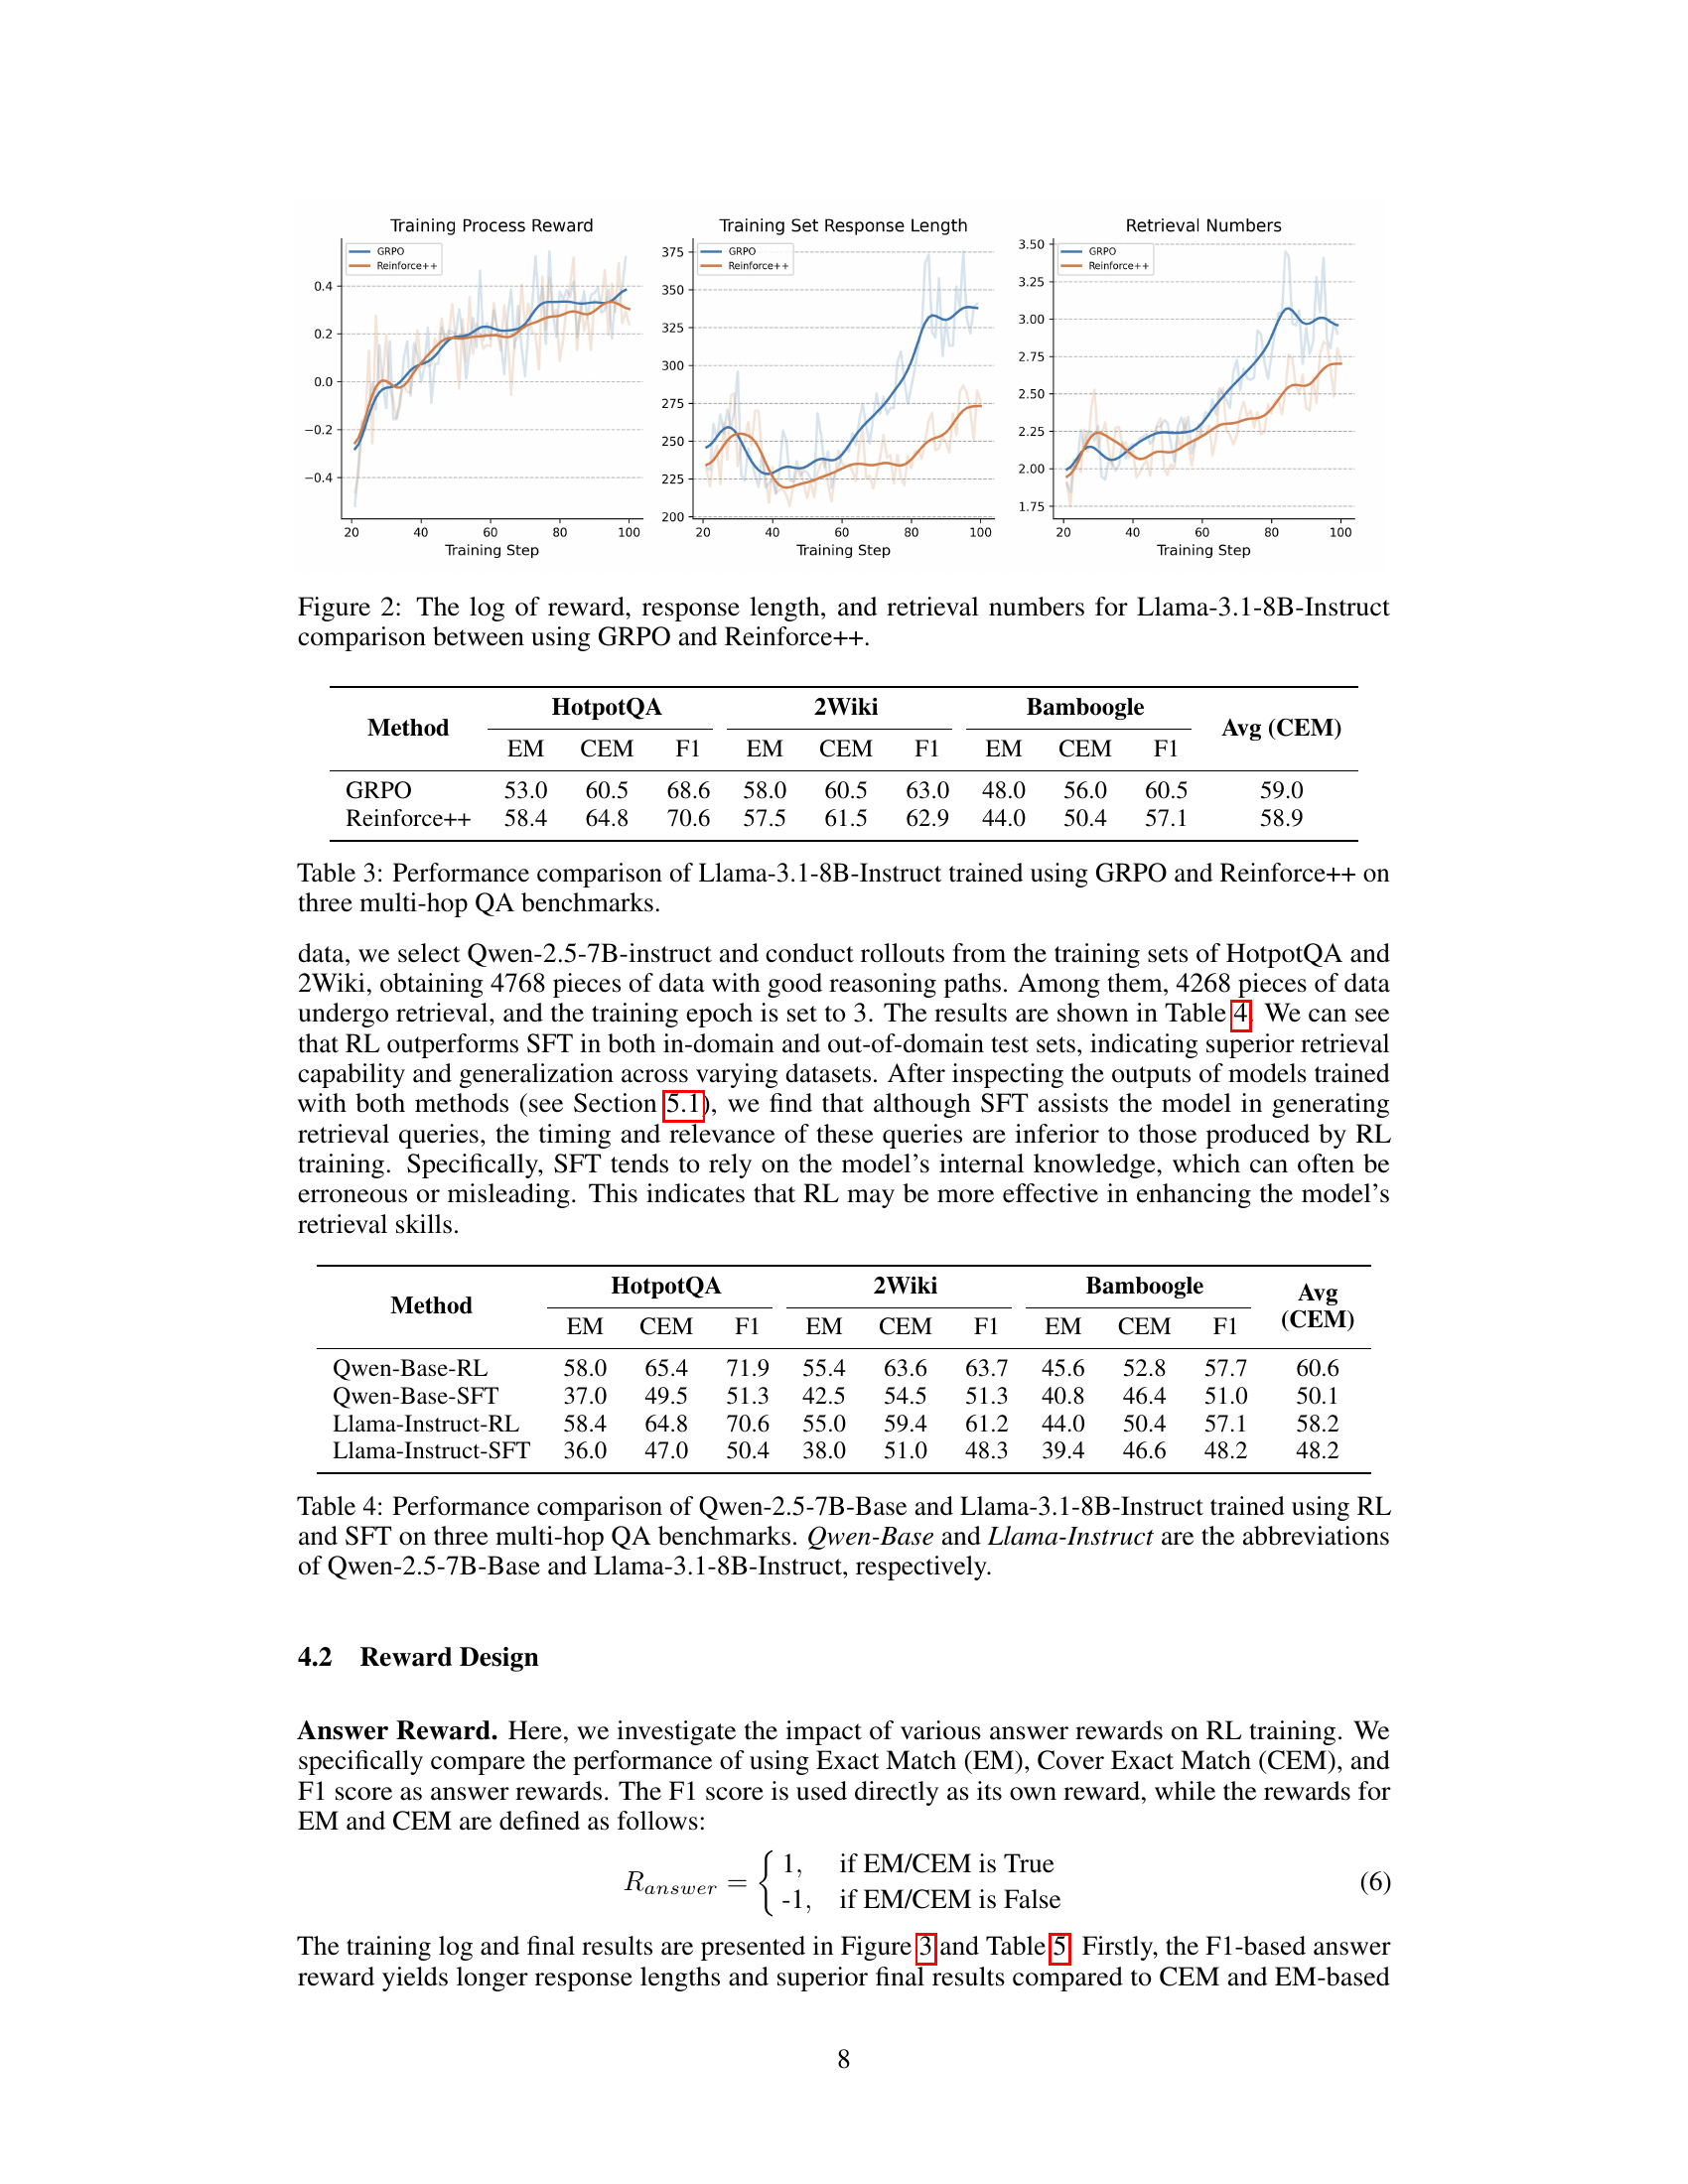
🔼 This figure compares the performance of two reinforcement learning algorithms, GRPO and Reinforce++, when training the Llama-3.1-8B-Instruct large language model. It shows the log of the reward, the length of the generated response, and the number of retrievals performed during training for each algorithm. This allows for a visual comparison of the training process and the impact of each algorithm on different aspects of the model’s behavior.
read the caption
Figure 2: The log of reward, response length, and retrieval numbers for Llama-3.1-8B-Instruct comparison between using GRPO and Reinforce++.

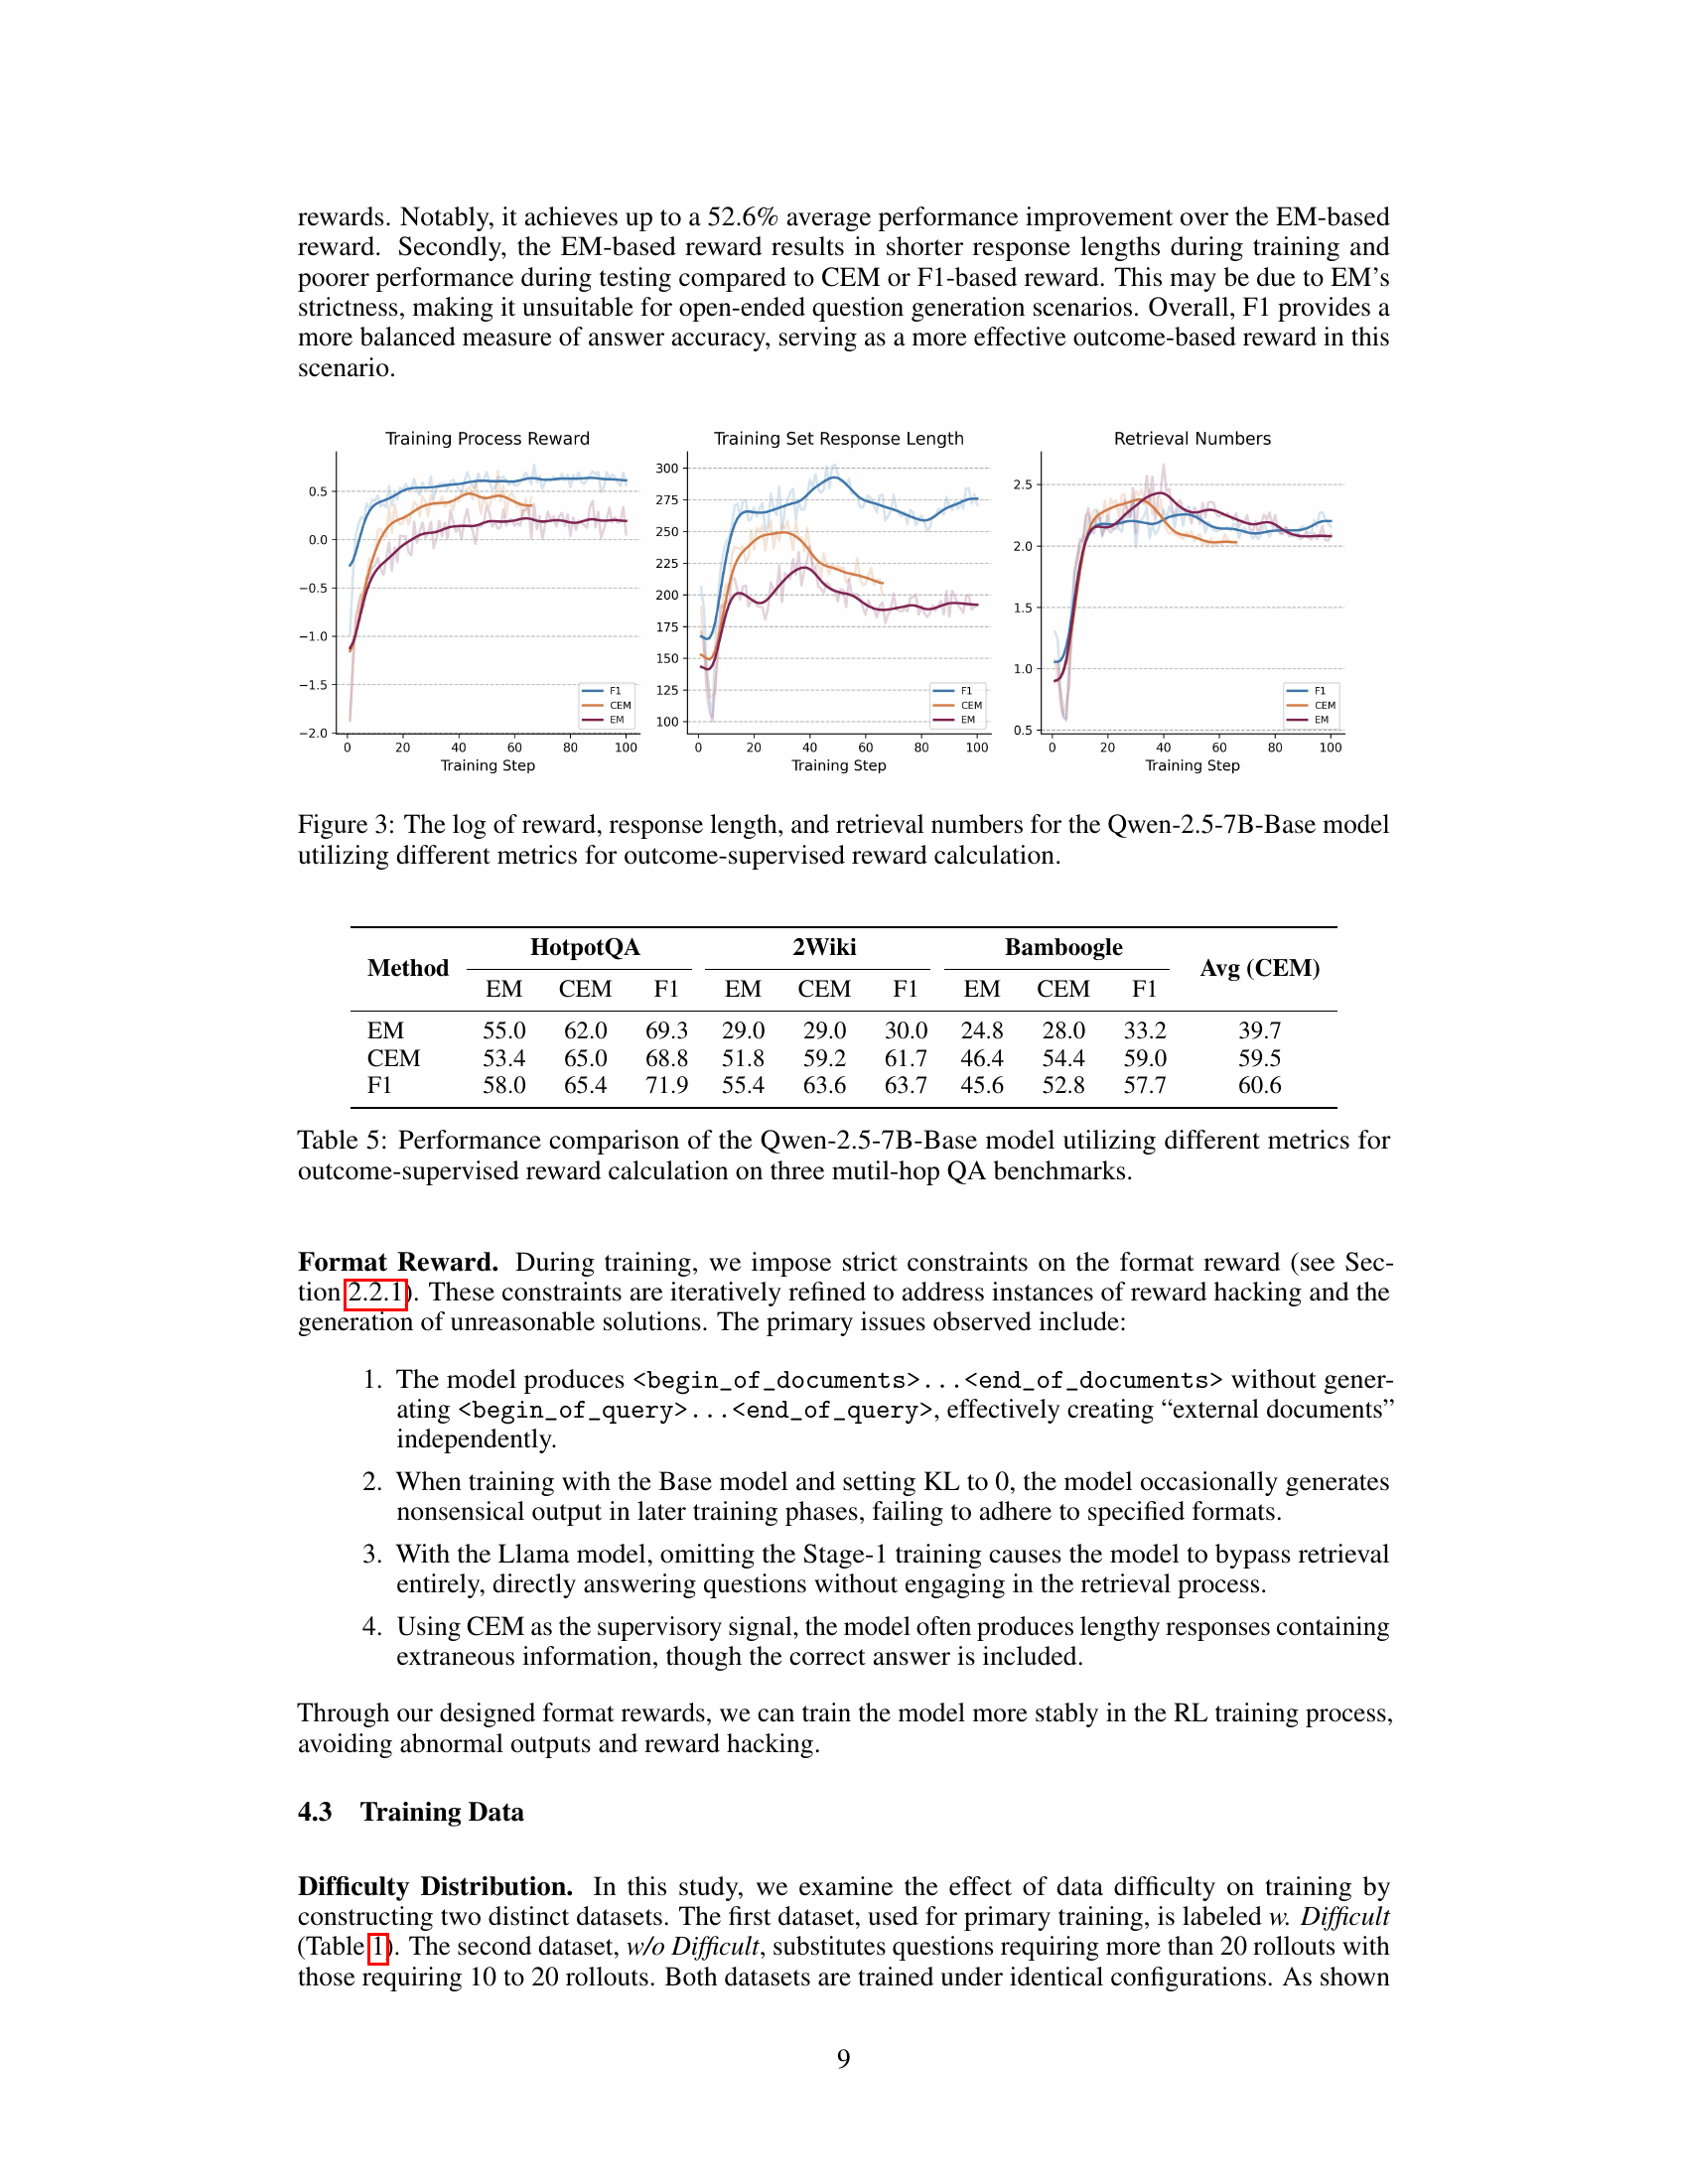
🔼 This figure displays three graphs showing the training progress of the Qwen-2.5-7B-Base language model using different reward metrics for outcome-supervised reinforcement learning. Each graph plots a different aspect of the training process against the training step: the first shows the log of the reward received, the second shows the length of the model’s generated responses, and the third shows the number of retrievals performed. Different line colors represent different reward metrics: EM (Exact Match), CEM (Cover Exact Match), and F1 (F1-score). Analyzing these graphs allows one to see how the choice of reward metric impacts training efficiency and the model’s behavior.
read the caption
Figure 3: The log of reward, response length, and retrieval numbers for the Qwen-2.5-7B-Base model utilizing different metrics for outcome-supervised reward calculation.

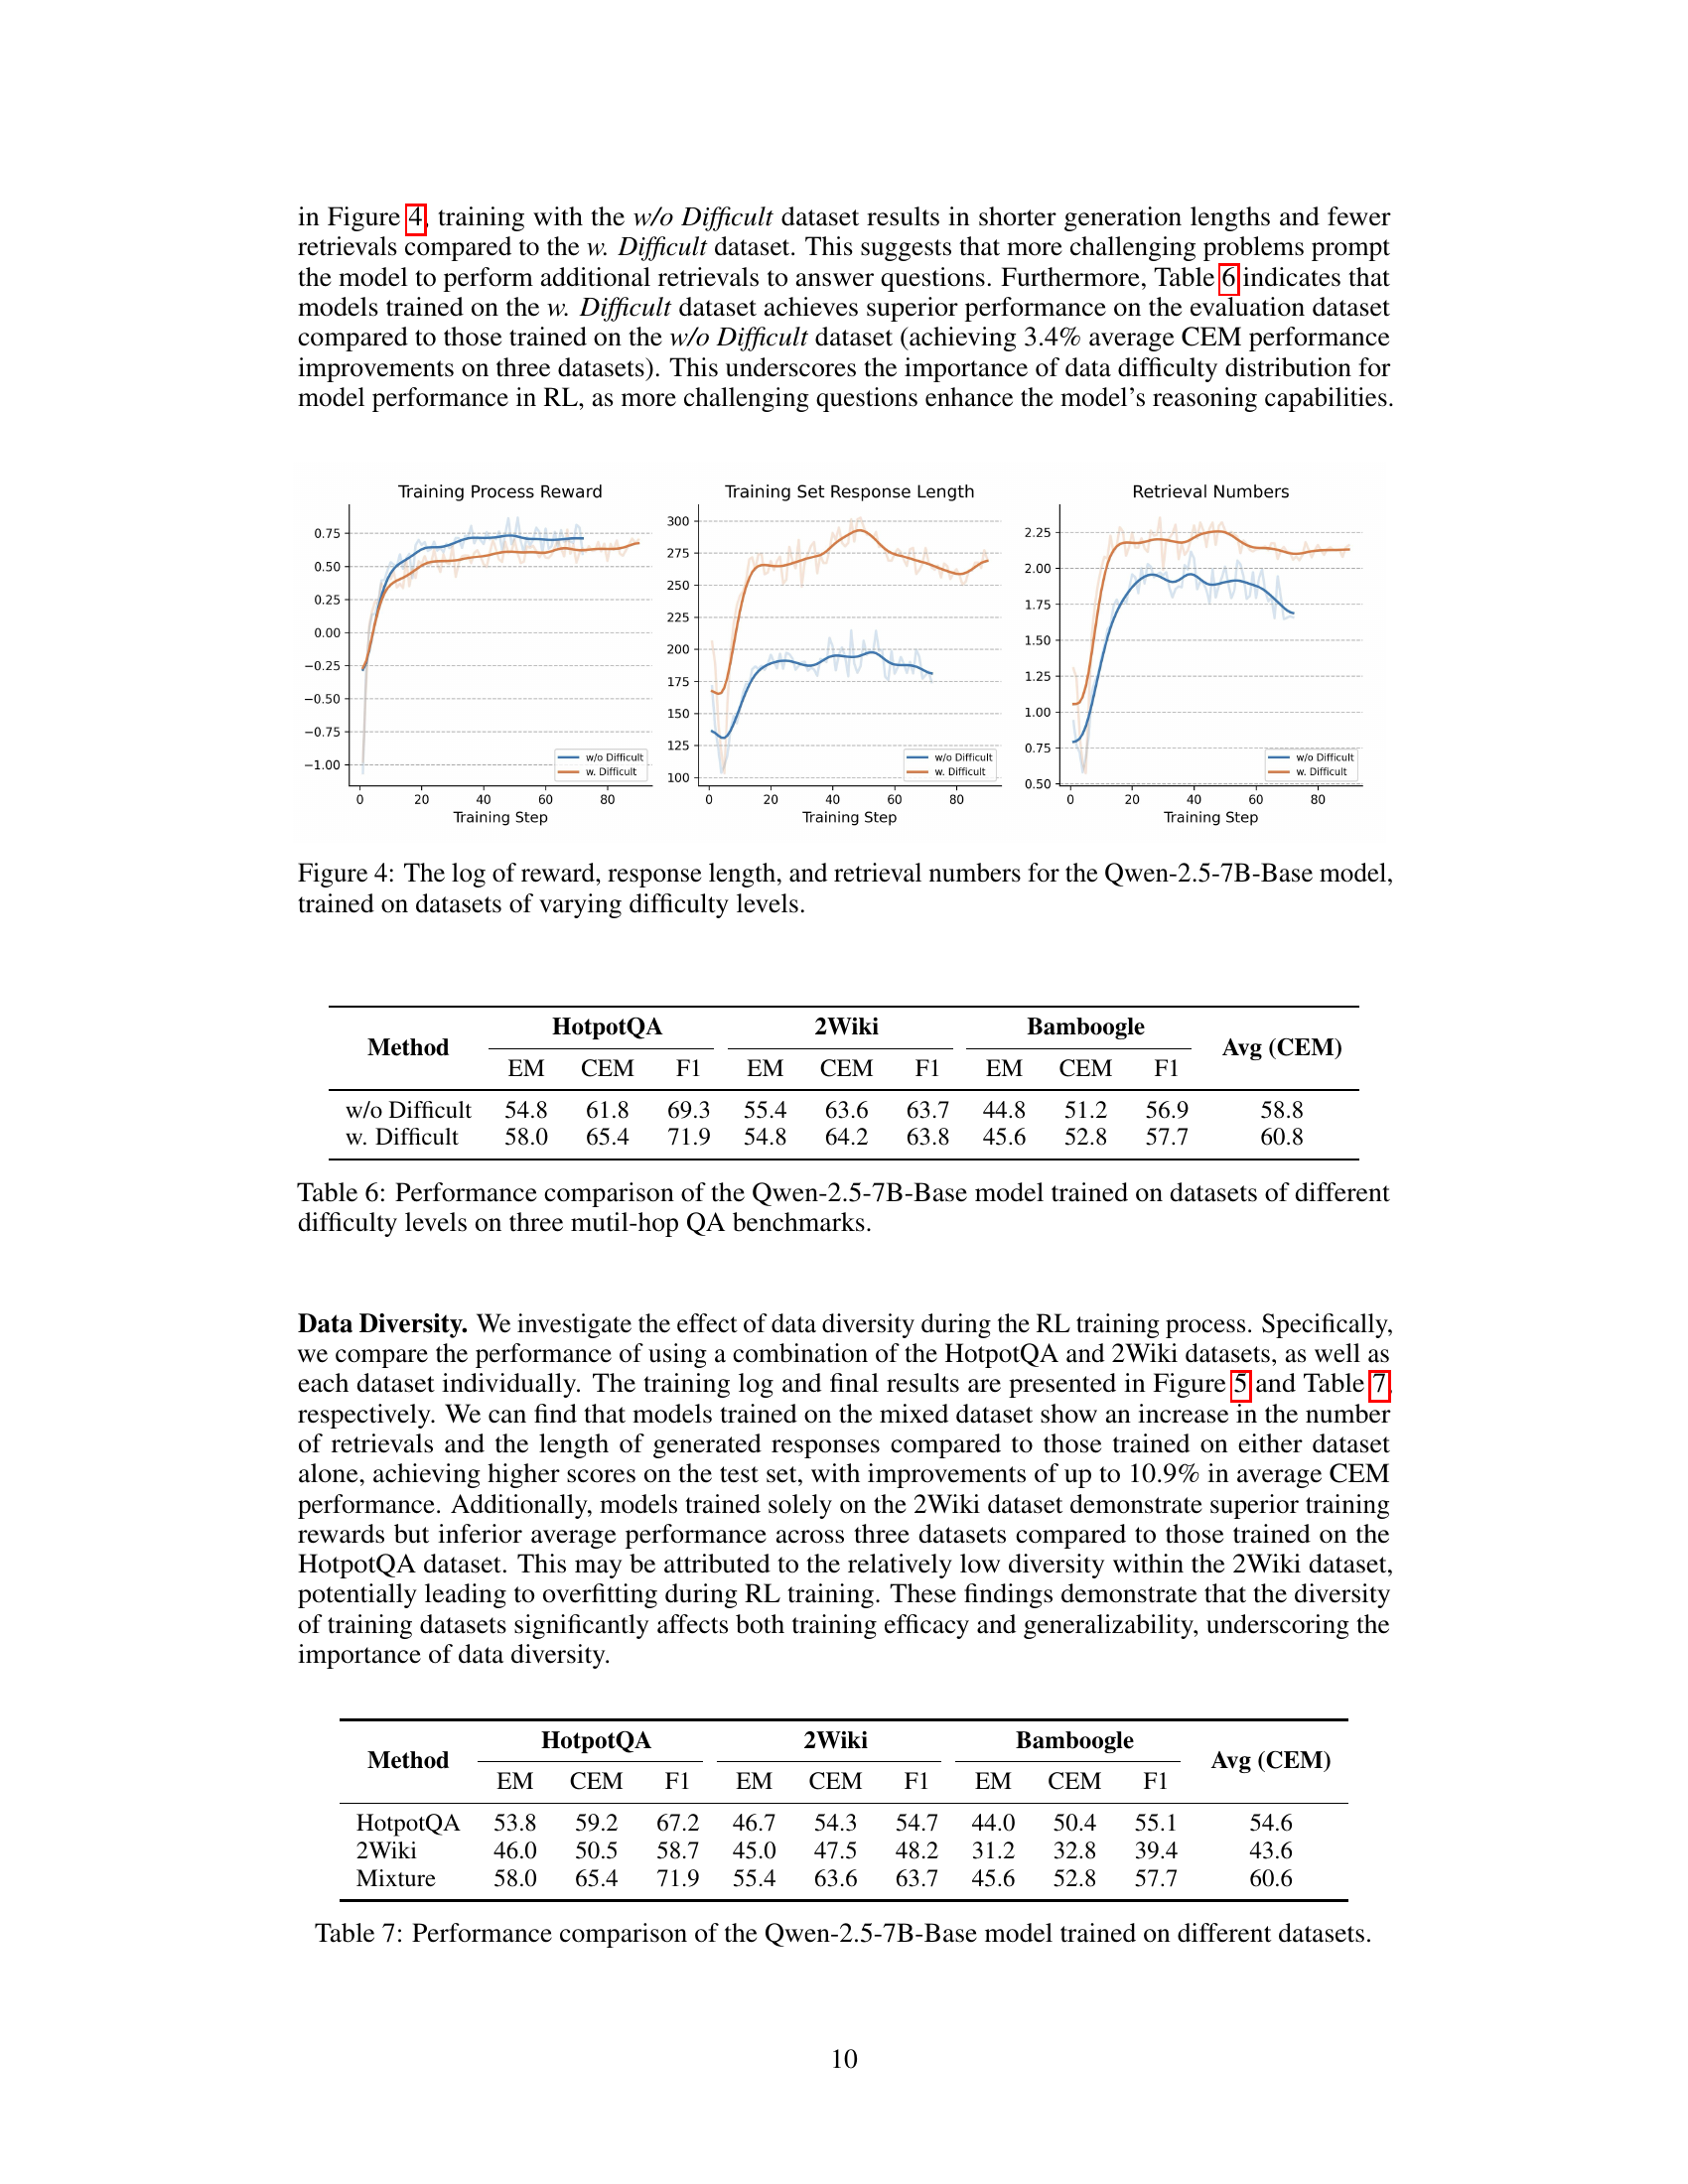
🔼 This figure displays three graphs showing the training process of the Qwen-2.5-7B-Base language model using reinforcement learning. The graphs track the log of reward, response length, and retrieval numbers over training steps. Two different training datasets are used: one with varying difficulty levels (w. Difficult), and another without the most difficult questions (w/o Difficult). The figure aims to illustrate how the difficulty of the training data influences the model’s learning behavior and its reliance on external search (retrieval).
read the caption
Figure 4: The log of reward, response length, and retrieval numbers for the Qwen-2.5-7B-Base model, trained on datasets of varying difficulty levels.

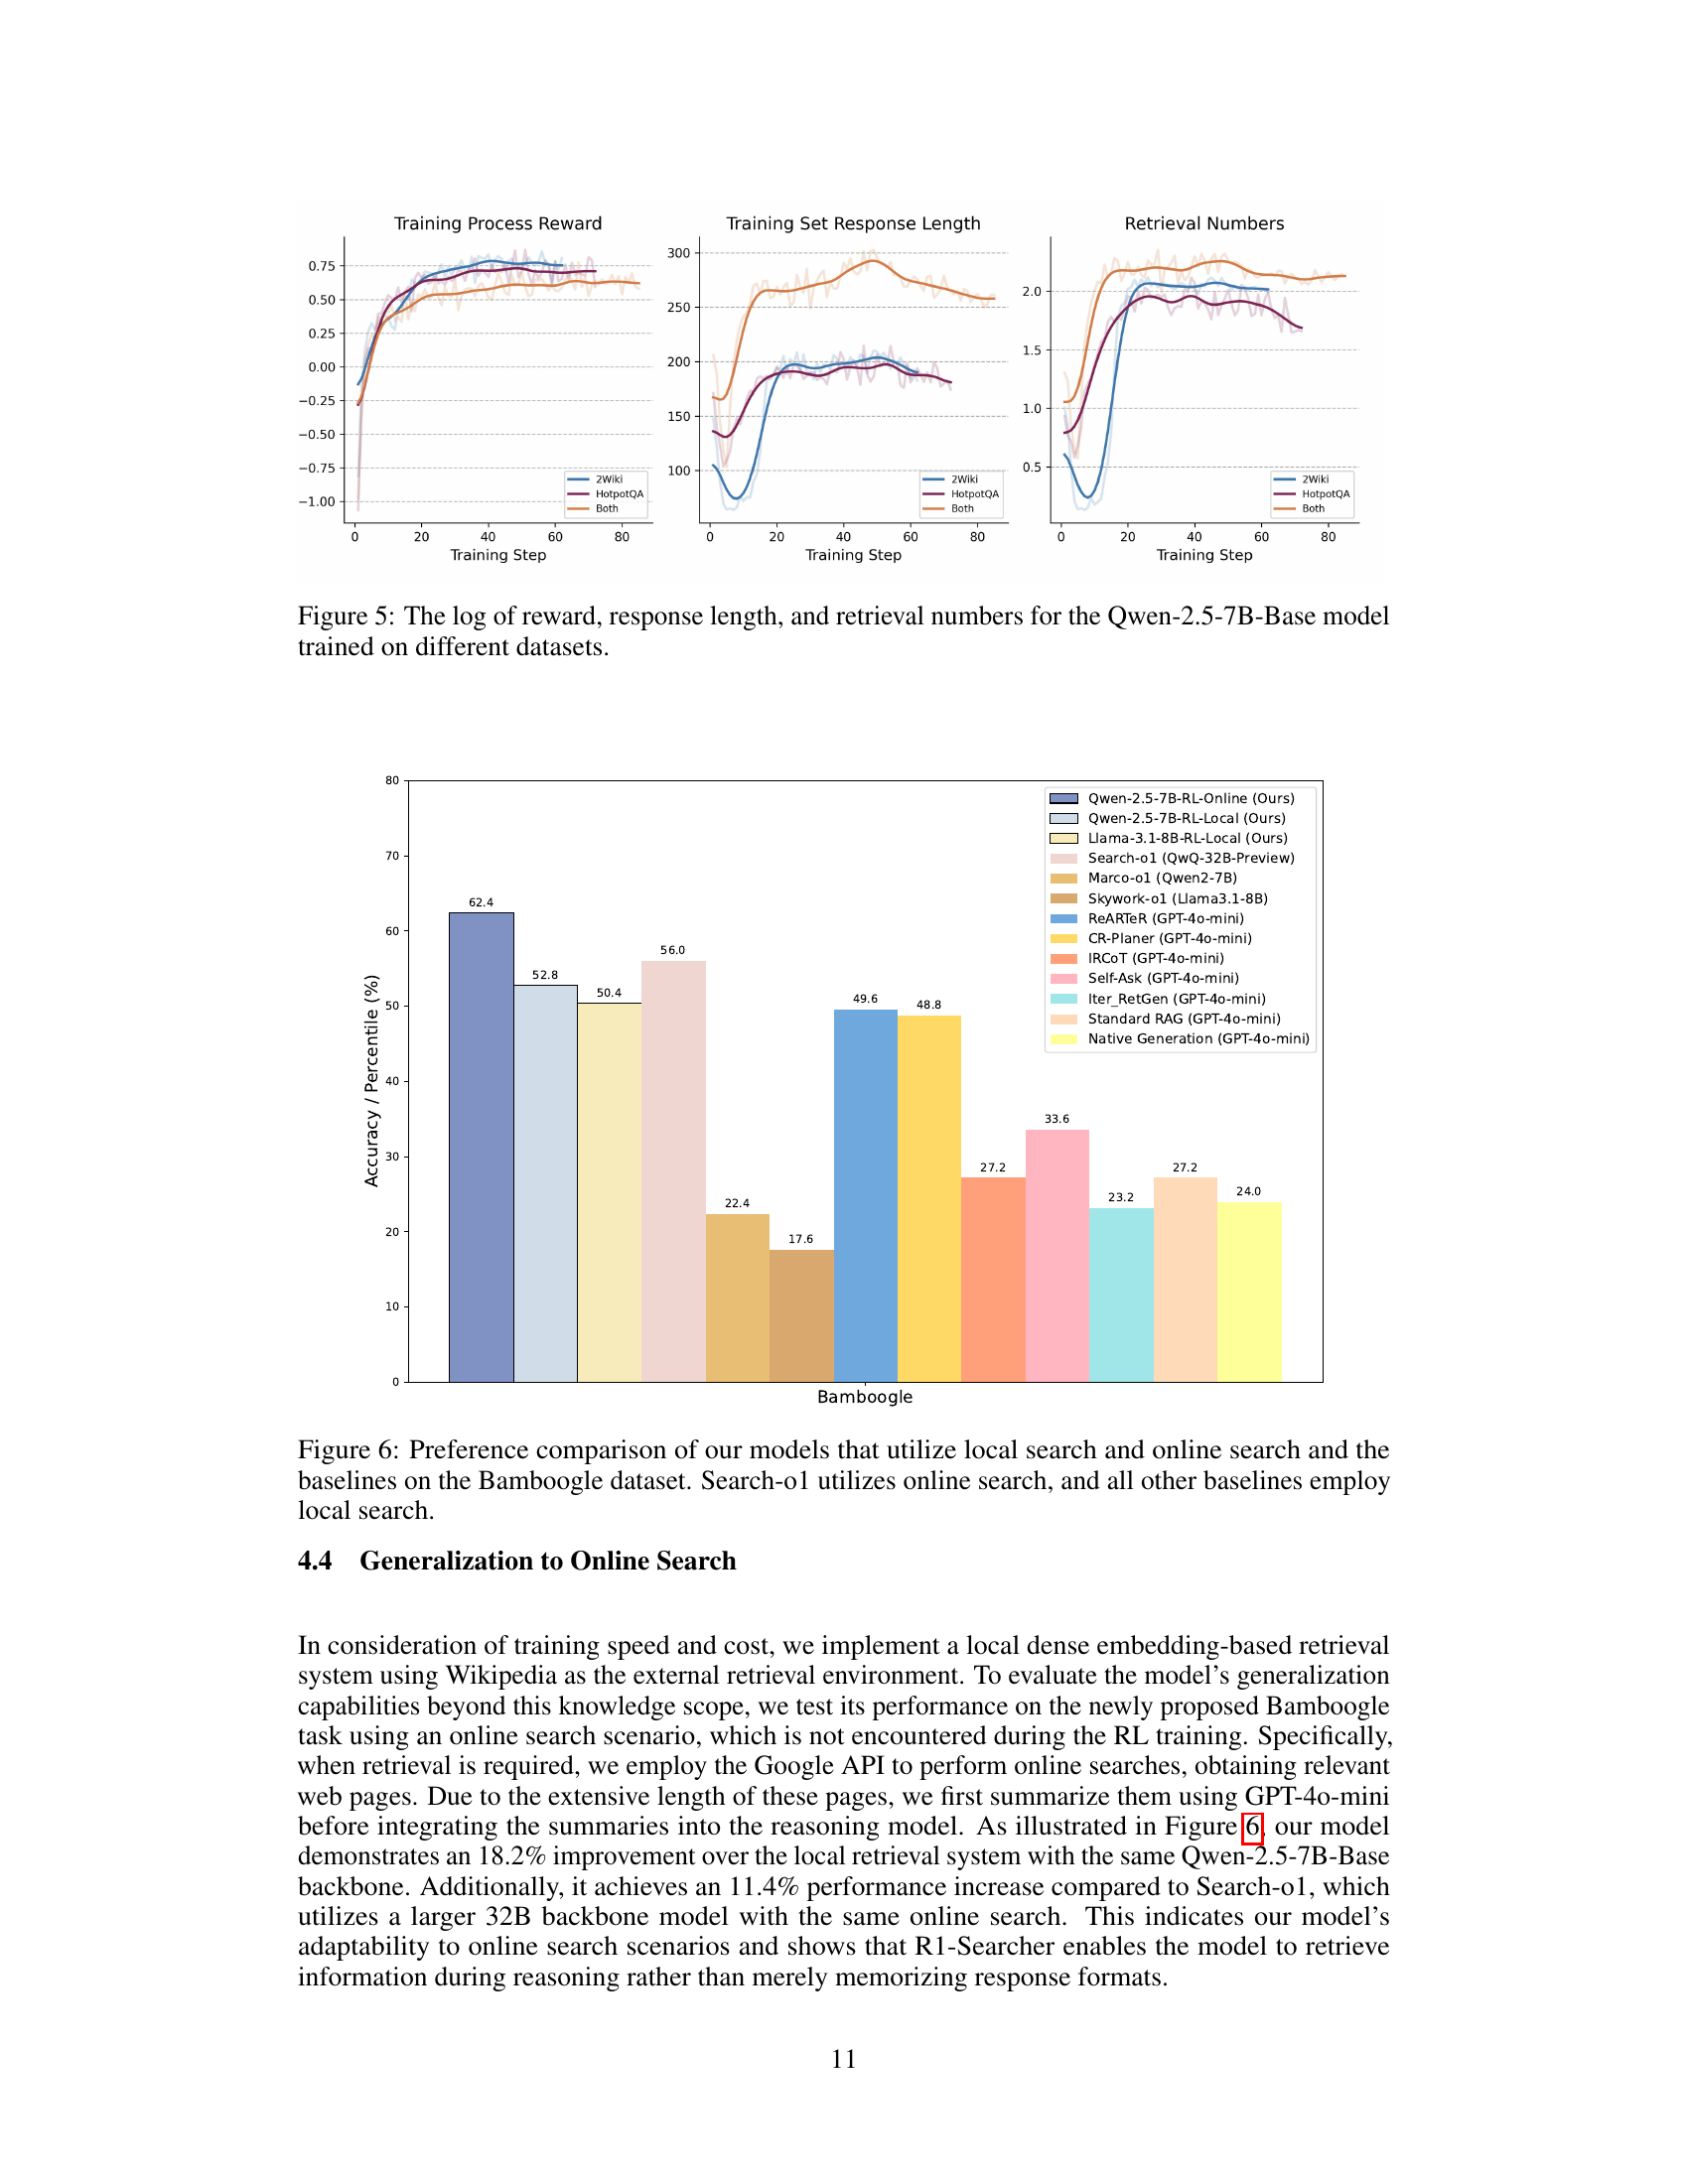
🔼 This figure presents a comparison of training results for the Qwen-2.5-7B-Base language model using three different training datasets: HotpotQA, 2Wiki, and a mixture of both. It displays graphs showing the change in training reward, response length (number of tokens in the model’s output), and retrieval count (number of times external knowledge was accessed) over the course of training. This visualization allows for the analysis of how different data sources impact the training dynamics and the model’s performance. Differences in reward curves, response length, and retrieval counts across the three datasets indicate varying learning behavior and model efficiency under different conditions.
read the caption
Figure 5: The log of reward, response length, and retrieval numbers for the Qwen-2.5-7B-Base model trained on different datasets.

🔼 Figure 6 presents a performance comparison on the Bamboogle dataset between models using local search (R1-Searcher with different LLMs as backbones and other baselines) and online search (R1-Searcher and Search-01). The graph displays the accuracy or percentile achieved by each method on the Bamboogle dataset. This comparison highlights the generalization capability of R1-Searcher when adapting to different search environments (local vs. online). Search-01, a strong baseline, is included in the comparison to showcase R1-Searcher’s performance relative to a model specifically designed for online search.
read the caption
Figure 6: Preference comparison of our models that utilize local search and online search and the baselines on the Bamboogle dataset. Search-o1 utilizes online search, and all other baselines employ local search.
More on tables
| Models | Types | Methods | HotpotQA | 2Wiki | Bamboogle | Musique | ||||
| GPT | Zero-Shot | Naive Generation | 0.324 | 0.404 | 0.348 | 0.346 | 0.240 | 0.280 | 0.134 | 0.170 |
| Standard RAG | 0.342 | 0.450 | 0.344 | 0.292 | 0.272 | 0.328 | 0.172 | 0.188 | ||
| Branching | SuRe | 0.270 | 0.380 | 0.244 | 0.264 | 0.168 | 0.208 | 0.128 | 0.146 | |
| REPLUG | 0.350 | 0.428 | 0.296 | 0.254 | 0.224 | 0.256 | 0.132 | 0.138 | ||
| Summary | LongLLMLingua | 0.358 | 0.450 | 0.324 | 0.316 | 0.248 | 0.288 | 0.150 | 0.172 | |
| RECOMP | 0.332 | 0.398 | 0.298 | 0.306 | 0.136 | 0.176 | 0.118 | 0.134 | ||
| Selective-Context | 0.366 | 0.442 | 0.350 | 0.290 | 0.240 | 0.288 | 0.152 | 0.172 | ||
| Adaptive | SKR | 0.360 | 0.454 | 0.364 | 0.314 | 0.248 | 0.288 | 0.162 | 0.174 | |
| RAG-CoT | Self-Ask | 0.392 | 0.462 | 0.336 | 0.478 | 0.336 | 0.416 | 0.260 | 0.270 | |
| Iter-RetGen | 0.374 | 0.456 | 0.326 | 0.270 | 0.232 | 0.256 | 0.178 | 0.188 | ||
| IRCoT | 0.434 | 0.308 | 0.492 | 0.114 | 0.272 | 0.184 | 0.192 | 0.214 | ||
| Test-Time | CR-Planner | 0.404 | 0.416 | 0.520 | 0.478 | 0.488 | 0.524 | 0.272 | 0.262 | |
| ReARTeR | 0.468 | 0.506 | 0.554 | 0.534 | 0.496 | 0.544 | 0.296 | 0.302 | ||
| Llama | Zero-Shot | Naive Generation | 0.208 | 0.268 | 0.326 | 0.254 | 0.144 | 0.168 | 0.068 | 0.096 |
| Standard RAG | 0.334 | 0.398 | 0.336 | 0.212 | 0.168 | 0.216 | 0.104 | 0.098 | ||
| Branching | SuRe | 0.266 | 0.346 | 0.122 | 0.262 | 0.160 | 0.192 | 0.106 | 0.144 | |
| REPLUG | 0.290 | 0.348 | 0.334 | 0.204 | 0.168 | 0.232 | 0.078 | 0.090 | ||
| Summary | LongLLMLingua | 0.314 | 0.382 | 0.304 | 0.294 | 0.168 | 0.216 | 0.088 | 0.100 | |
| RECOMP | 0.318 | 0.380 | 0.324 | 0.322 | 0.104 | 0.160 | 0.112 | 0.126 | ||
| Selective-Context | 0.296 | 0.358 | 0.266 | 0.204 | 0.144 | 0.200 | 0.092 | 0.104 | ||
| Adaptive | SKR | 0.300 | 0.372 | 0.336 | 0.212 | 0.176 | 0.208 | 0.100 | 0.112 | |
| RAG-CoT | Self-Ask | 0.316 | 0.408 | 0.306 | 0.322 | 0.360 | 0.432 | 0.222 | 0.226 | |
| Iter-RetGen | 0.302 | 0.362 | 0.310 | 0.224 | 0.144 | 0.176 | 0.084 | 0.084 | ||
| IRCoT | 0.210 | 0.146 | 0.338 | 0.312 | 0.120 | 0.104 | 0.060 | 0.042 | ||
| Test-Time | CR-Planer | 0.332 | 0.350 | 0.420 | 0.350 | 0.304 | 0.336 | 0.144 | 0.098 | |
| ReARTeR | 0.424 | 0.434 | 0.470 | 0.364 | 0.438 | 0.484 | 0.244 | 0.252 | ||
| Reasoning | Marco-o1 | 0.352 | 0.348 | 0.442 | 0.184 | 0.224 | 0.200 | 0.134 | 0.104 | |
| Skywork-o1 | 0.306 | 0.256 | 0.344 | 0.190 | 0.176 | 0.160 | 0.092 | 0.060 | ||
| Llama | RL | R1-Searcher | 0.648 | 0.746 | 0.594 | 0.628 | 0.504 | 0.544 | 0.254 | 0.282 |
| Qwen | RL-Zero | 0.654 | 0.750 | 0.636 | 0.650 | 0.528 | 0.544 | 0.282 | 0.314 | |
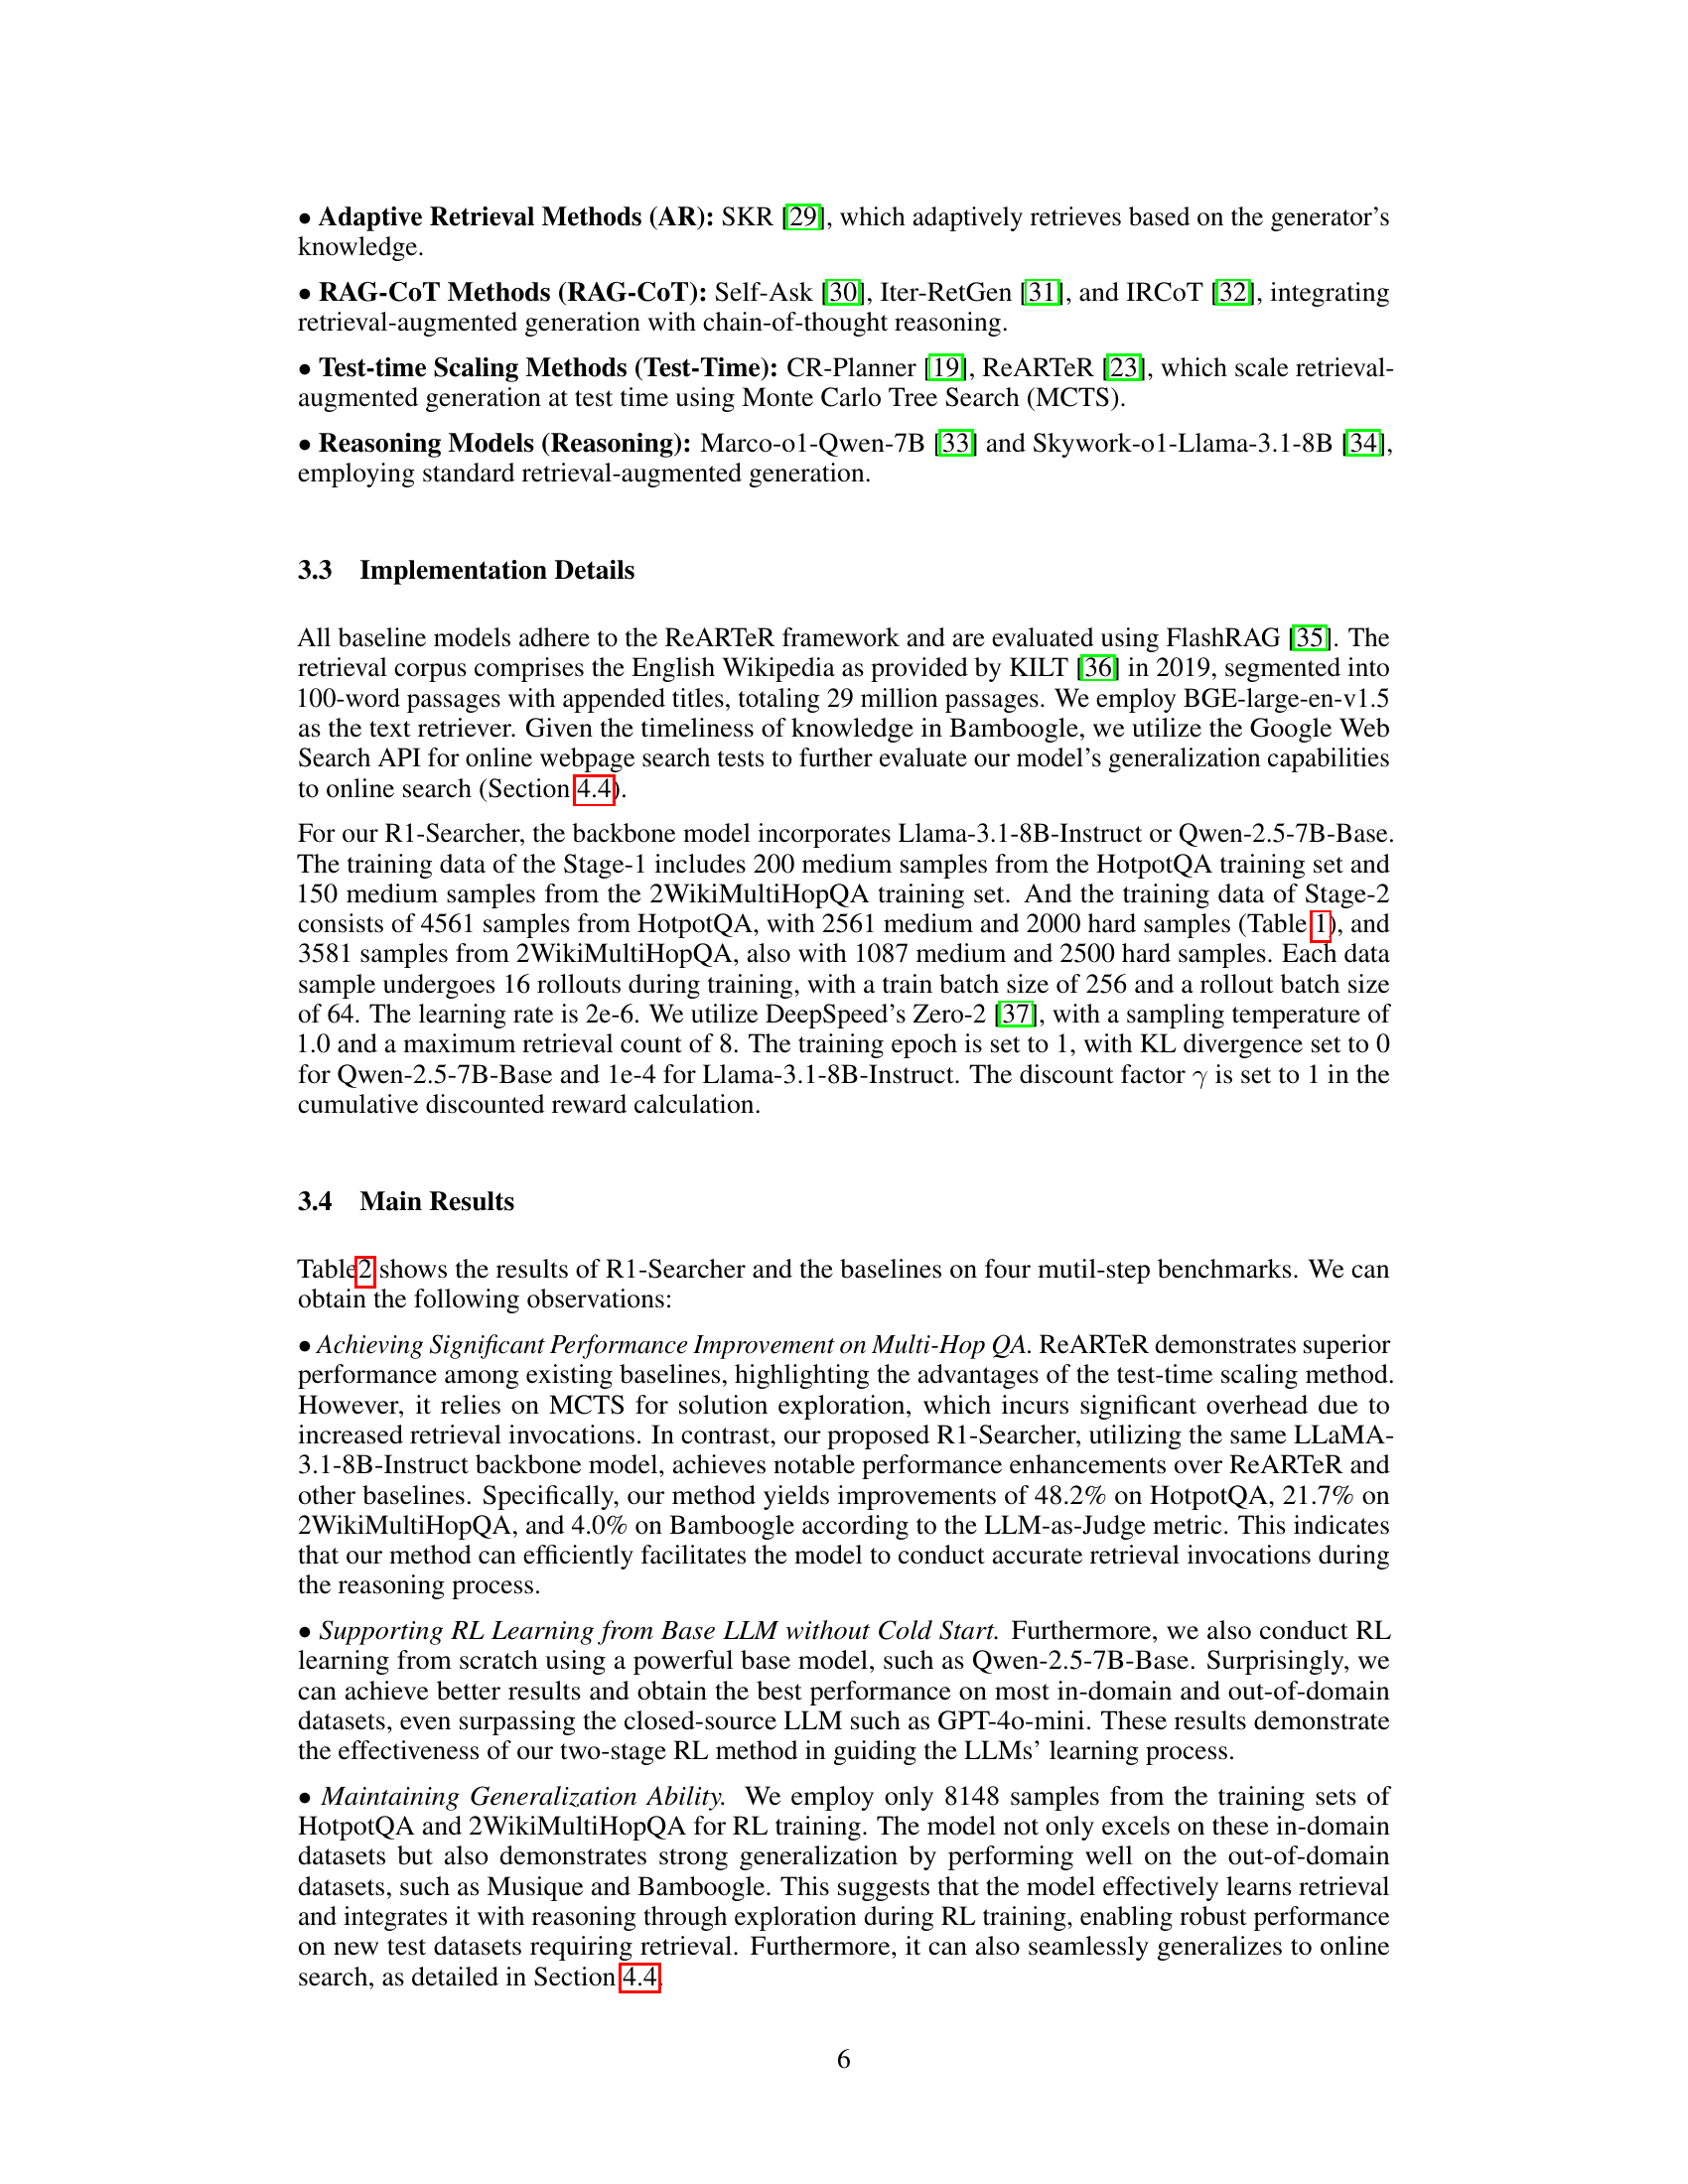
🔼 This table presents a performance comparison of the R1-Searcher model against various baselines on four distinct multi-hop question answering (QA) benchmarks. The results are shown in terms of accuracy metrics (Cover Exact Match (ACC_R) and LLM-as-Judge (ACC_L)). Baselines include zero-shot methods, retrieval-augmented generation (RAG) methods using different techniques, and test-time scaling methods. The table highlights the superior performance of R1-Searcher across all benchmarks, demonstrating the effectiveness of its approach in enhancing the search capabilities of large language models (LLMs). The abbreviations GPT, Qwen, and Llama refer to specific LLMs used in the baselines.
read the caption
Table 2: Performance comparisons between R1-Searcher and the baselines on four multi-hop QA benchmarks. The boldface indicates the best performance. GPT, Qwen, and Llama are the abbreviations of GPT-4o-mini, Qwen-2.5-7B-Base, and Llama-3.1-8B-Instruct, respectively.
| Method | HotpotQA | 2Wiki | Bamboogle | Avg (CEM) | ||||||
| EM | CEM | F1 | EM | CEM | F1 | EM | CEM | F1 | ||
| GRPO | 53.0 | 60.5 | 68.6 | 58.0 | 60.5 | 63.0 | 48.0 | 56.0 | 60.5 | 59.0 |
| Reinforce++ | 58.4 | 64.8 | 70.6 | 57.5 | 61.5 | 62.9 | 44.0 | 50.4 | 57.1 | 58.9 |
🔼 This table presents a comparison of the performance achieved by two different reinforcement learning algorithms, GRPO and Reinforce++, when used to train the Llama-3.1-8B-Instruct language model on three distinct multi-hop question answering (QA) benchmark datasets. It evaluates the effectiveness of each algorithm in improving the model’s ability to answer complex, multi-step questions, showcasing differences in performance metrics across the chosen benchmarks.
read the caption
Table 3: Performance comparison of Llama-3.1-8B-Instruct trained using GRPO and Reinforce++ on three multi-hop QA benchmarks.
| Method | HotpotQA | 2Wiki | Bamboogle | Avg (CEM) | ||||||
| EM | CEM | F1 | EM | CEM | F1 | EM | CEM | F1 | ||
| Qwen-Base-RL | 58.0 | 65.4 | 71.9 | 55.4 | 63.6 | 63.7 | 45.6 | 52.8 | 57.7 | 60.6 |
| Qwen-Base-SFT | 37.0 | 49.5 | 51.3 | 42.5 | 54.5 | 51.3 | 40.8 | 46.4 | 51.0 | 50.1 |
| Llama-Instruct-RL | 58.4 | 64.8 | 70.6 | 55.0 | 59.4 | 61.2 | 44.0 | 50.4 | 57.1 | 58.2 |
| Llama-Instruct-SFT | 36.0 | 47.0 | 50.4 | 38.0 | 51.0 | 48.3 | 39.4 | 46.6 | 48.2 | 48.2 |
🔼 This table presents a performance comparison between models trained using Reinforcement Learning (RL) and Supervised Fine-tuning (SFT). It shows the results of both Qwen-2.5-7B-Base and Llama-3.1-8B-Instruct models on three multi-hop question answering (QA) benchmarks: HotpotQA, 2Wiki, and Bamboogle. The metrics used to evaluate performance are Exact Match (EM), Cover Exact Match (CEM), and F1 score. The table highlights the superior performance of RL-trained models, demonstrating better generalization and retrieval capabilities compared to SFT-trained models.
read the caption
Table 4: Performance comparison of Qwen-2.5-7B-Base and Llama-3.1-8B-Instruct trained using RL and SFT on three multi-hop QA benchmarks. Qwen-Base and Llama-Instruct are the abbreviations of Qwen-2.5-7B-Base and Llama-3.1-8B-Instruct, respectively.
| Method | HotpotQA | 2Wiki | Bamboogle | Avg (CEM) | ||||||
| EM | CEM | F1 | EM | CEM | F1 | EM | CEM | F1 | ||
| EM | 55.0 | 62.0 | 69.3 | 29.0 | 29.0 | 30.0 | 24.8 | 28.0 | 33.2 | 39.7 |
| CEM | 53.4 | 65.0 | 68.8 | 51.8 | 59.2 | 61.7 | 46.4 | 54.4 | 59.0 | 59.5 |
| F1 | 58.0 | 65.4 | 71.9 | 55.4 | 63.6 | 63.7 | 45.6 | 52.8 | 57.7 | 60.6 |
🔼 This table presents a comparison of the performance of the Qwen-2.5-7B-Base language model trained using reinforcement learning with different reward metrics for outcome supervision. The reward metrics compared are Exact Match (EM), Cover Exact Match (CEM), and F1 score, which are common evaluation metrics in question answering tasks. The performance is evaluated on three multi-hop question answering (QA) benchmarks: HotpotQA, 2Wiki, and Bamboogle. The table shows the performance of the model in terms of EM, CEM, and F1 scores on each benchmark. This allows for an assessment of how different reward functions influence the model’s ability to generate accurate answers and the effect they have on various metrics.
read the caption
Table 5: Performance comparison of the Qwen-2.5-7B-Base model utilizing different metrics for outcome-supervised reward calculation on three mutil-hop QA benchmarks.
| Method | HotpotQA | 2Wiki | Bamboogle | Avg (CEM) | ||||||
| EM | CEM | F1 | EM | CEM | F1 | EM | CEM | F1 | ||
| w/o Difficult | 54.8 | 61.8 | 69.3 | 55.4 | 63.6 | 63.7 | 44.8 | 51.2 | 56.9 | 58.8 |
| w. Difficult | 58.0 | 65.4 | 71.9 | 54.8 | 64.2 | 63.8 | 45.6 | 52.8 | 57.7 | 60.8 |
🔼 This table presents a performance comparison of the Qwen-2.5-7B-Base language model trained on datasets with varying difficulty levels. It assesses the model’s performance on three multi-hop question answering benchmarks (HotpotQA, 2Wiki, and Bamboogle). The comparison focuses on evaluating the impact of training data difficulty (easy, medium, hard questions) on the model’s ability to answer complex questions across different datasets.
read the caption
Table 6: Performance comparison of the Qwen-2.5-7B-Base model trained on datasets of different difficulty levels on three mutil-hop QA benchmarks.
| Method | HotpotQA | 2Wiki | Bamboogle | Avg (CEM) | ||||||
| EM | CEM | F1 | EM | CEM | F1 | EM | CEM | F1 | ||
| HotpotQA | 53.8 | 59.2 | 67.2 | 46.7 | 54.3 | 54.7 | 44.0 | 50.4 | 55.1 | 54.6 |
| 2Wiki | 46.0 | 50.5 | 58.7 | 45.0 | 47.5 | 48.2 | 31.2 | 32.8 | 39.4 | 43.6 |
| Mixture | 58.0 | 65.4 | 71.9 | 55.4 | 63.6 | 63.7 | 45.6 | 52.8 | 57.7 | 60.6 |
🔼 This table presents a performance comparison of the Qwen-2.5-7B-Base language model trained using reinforcement learning (RL) on different datasets. It shows the impact of data diversity and difficulty on the model’s performance across three multi-hop question answering benchmarks: HotpotQA, 2WikiMultiHopQA, and Bamboogle. The table compares the model’s performance using different training dataset configurations: trained on HotpotQA only, 2WikiMultiHopQA only, and a mixture of both datasets. The performance metrics used are Exact Match (EM), Cover Exact Match (CEM), and F1 score, providing a comprehensive evaluation of the model’s accuracy and ability to retrieve relevant information.
read the caption
Table 7: Performance comparison of the Qwen-2.5-7B-Base model trained on different datasets.
| Question: |
| When did the last king from Britain’s House of Hanover die? |
| Answer: |
| 20 June 1837 |
| Response (RL) (True): To solve this question, I need to find out when the last king from Britain’s House of Hanover died. Step 1: Identify the name of the last king from the House of Hanover. Step 2: Determine the date of the last king’s death. **Step 1: Identify the name of the last king from the House of Hanover.** I’ll use a search query to find out: <|begin_of_query|> last king from Britain’s House of Hanover<|end_of_query|> <|begin_of_documents|> … |
| <|end_of_documents|> From the search results, I can see that the last British monarch who reigned in Hanover was William IV. **Step 2: Determine the date of the last king’s death.** I’ll use a search query to find out when William IV died: <|begin_of_query|> William IV of Hanover death date<|end_of_query|> <|begin_of_documents|> … |
| <|end_of_documents|> From the search results, I can see that William IV died on 20 June 1837. Therefore, the last king from Britain’s House of Hanover died on 20 June 1837.</think> <answer> 20 June 1837 </answer> |
| Response (SFT) (False): To answer this question, I need to recall the British monarchs who belonged to the House of Hanover and identify the last one. The House of Hanover includes kings like George I, George II, and George III. I need to find out when George III, the last Hanoverian king, passed away. George III ruled from 1760 to 1820. After his death, the throne passed to his son, George IV, who was from the House of Hanover’s successor, the House of Saxe-Coburg and Gotha. I will verify the date of George III’s death to provide the correct answer. <|begin_of_query|> George III death date<|end_of_query|> <|begin_of_documents|> … |
| <|end_of_documents|> George III died on 29 January 1820. This confirms that he was the last king from Britain’s House of Hanover, and there was no Hanoverian king after him. The answer is 29 January 1820. </think> <answer> 29 January 1820 </answer> |
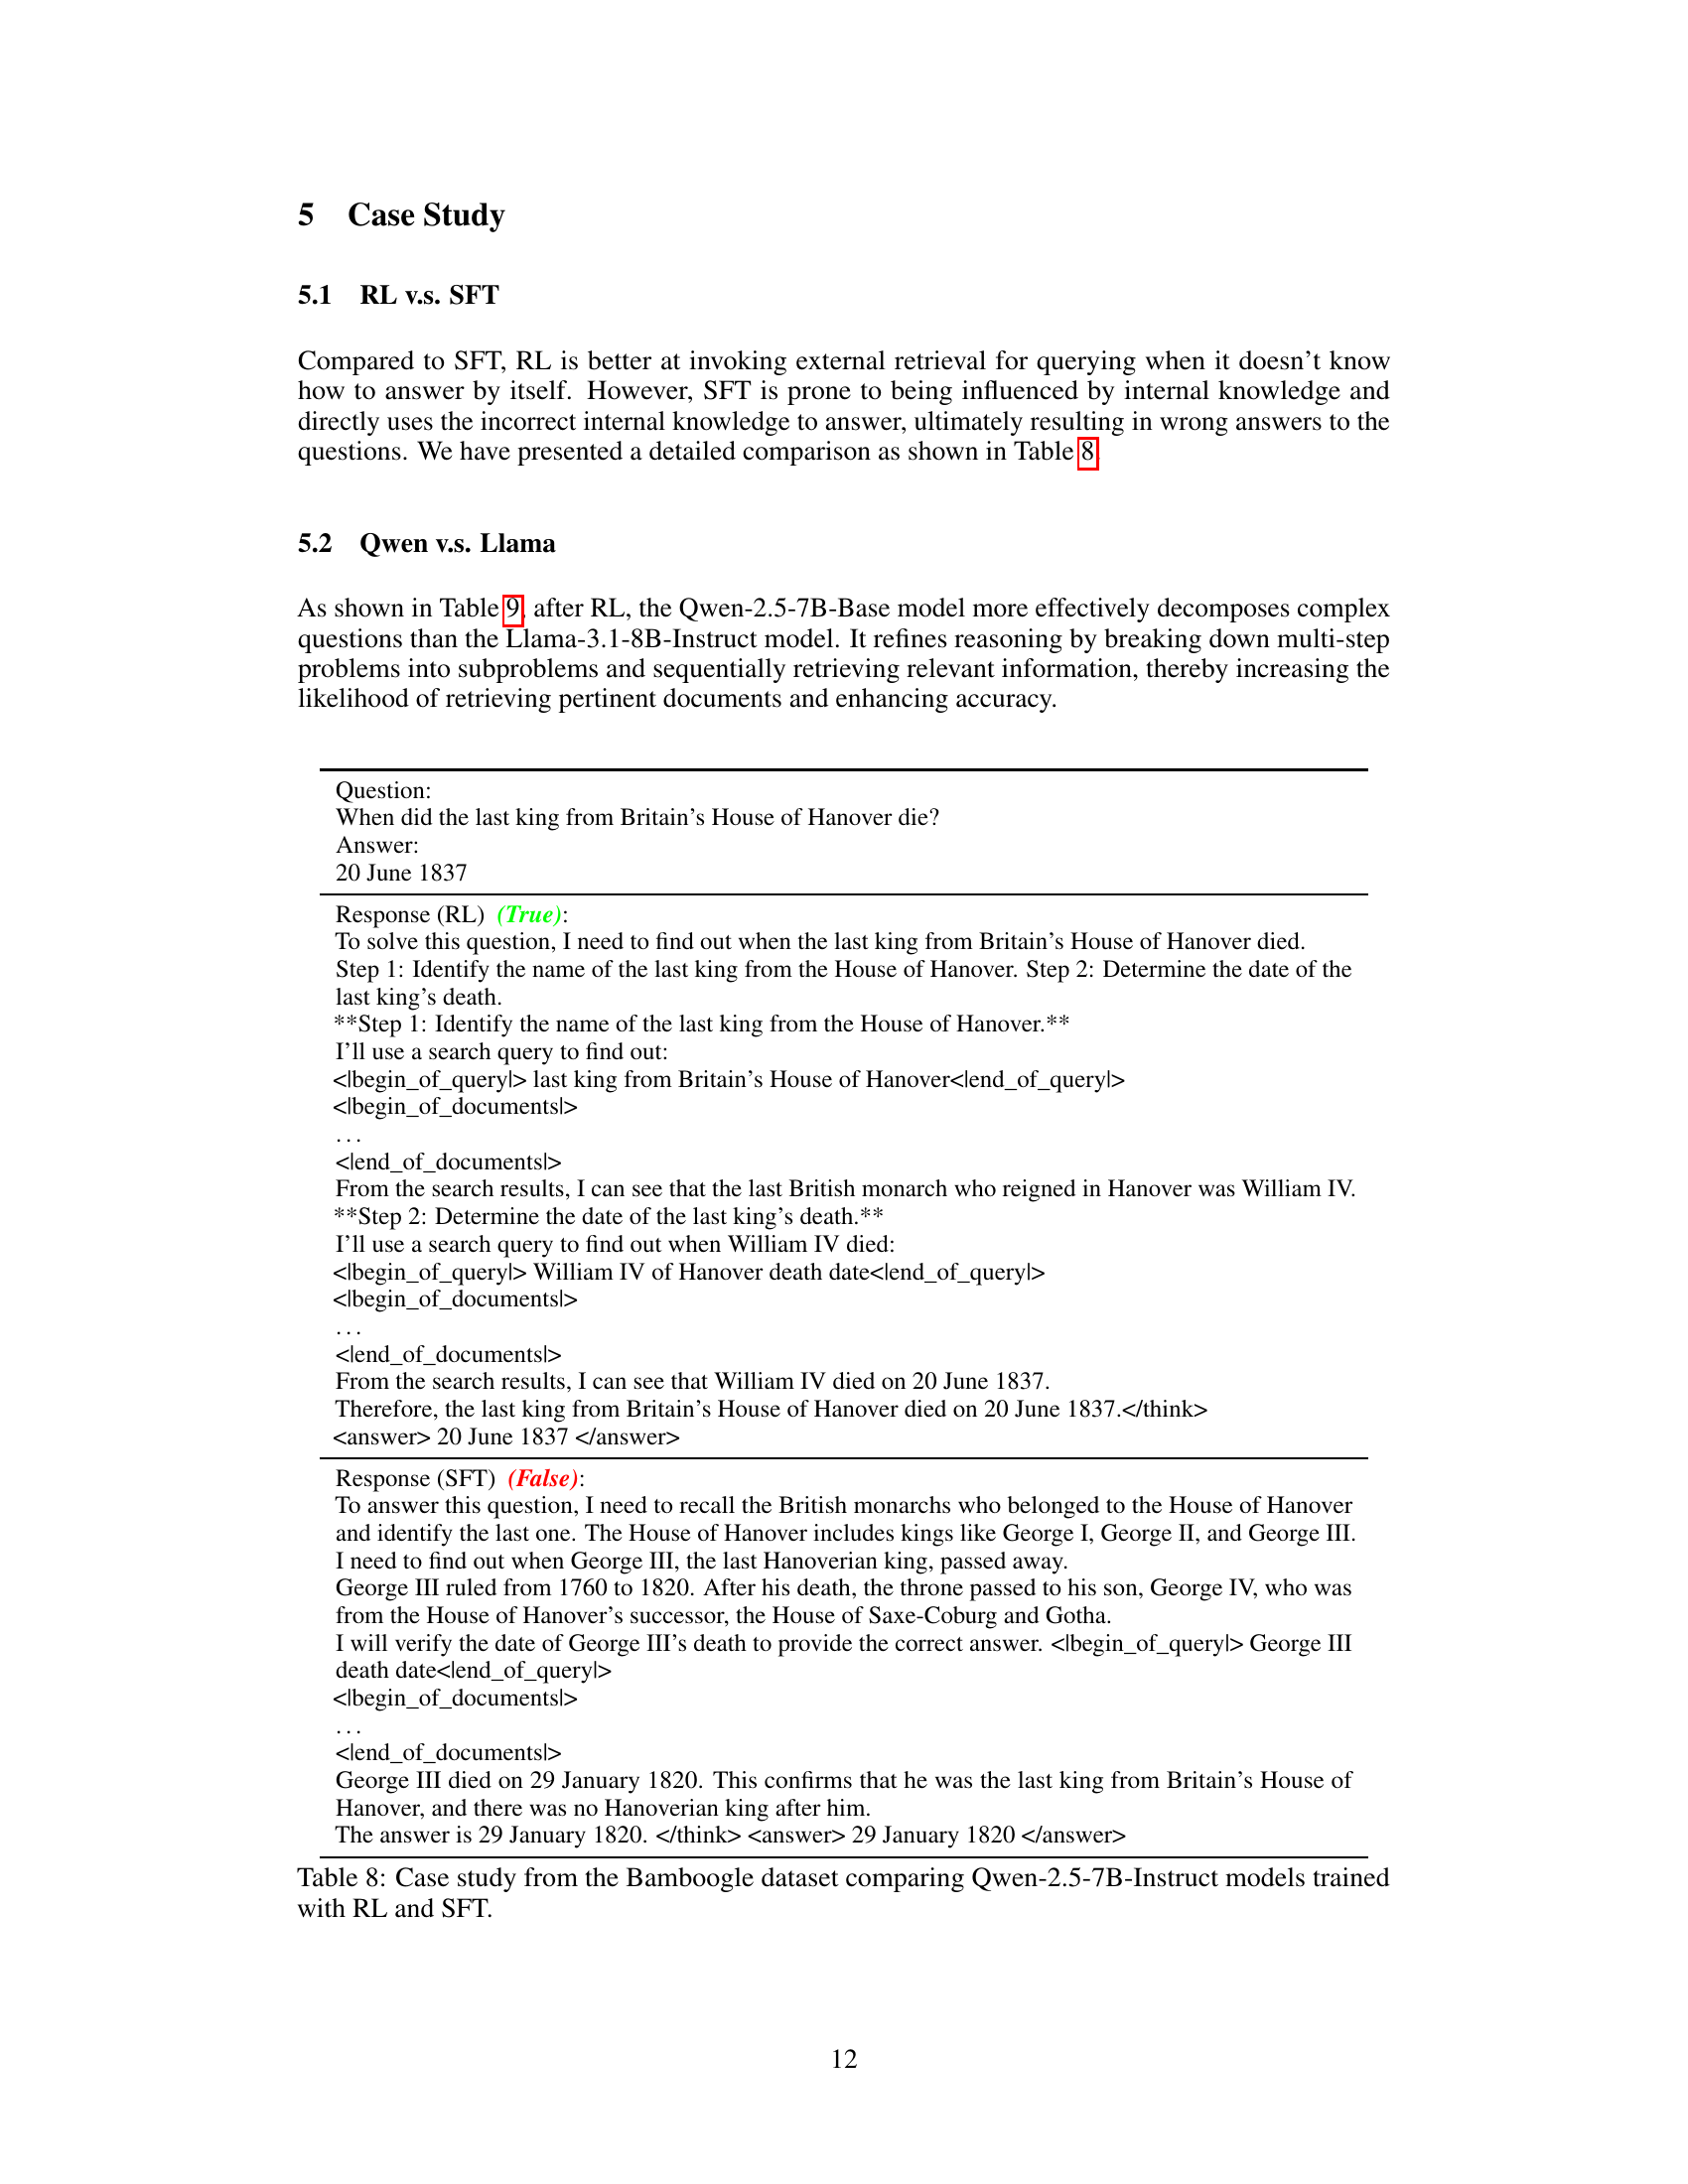
🔼 This table presents a case study using the Bamboogle dataset to compare the performance of two Qwen-2.5-7B-Instruct models trained using reinforcement learning (RL) and supervised fine-tuning (SFT). It highlights the differences in their reasoning processes and ability to answer complex, multi-hop questions requiring external information retrieval. The example question, answer, and the reasoning processes of both models are provided, illustrating how the RL-trained model effectively decomposes the question into subproblems, retrieves relevant information, and arrives at the correct answer, while the SFT-trained model struggles with similar processes, relying more heavily on internal knowledge and potentially resulting in an incorrect answer.
read the caption
Table 8: Case study from the Bamboogle dataset comparing Qwen-2.5-7B-Instruct models trained with RL and SFT.
| Question: |
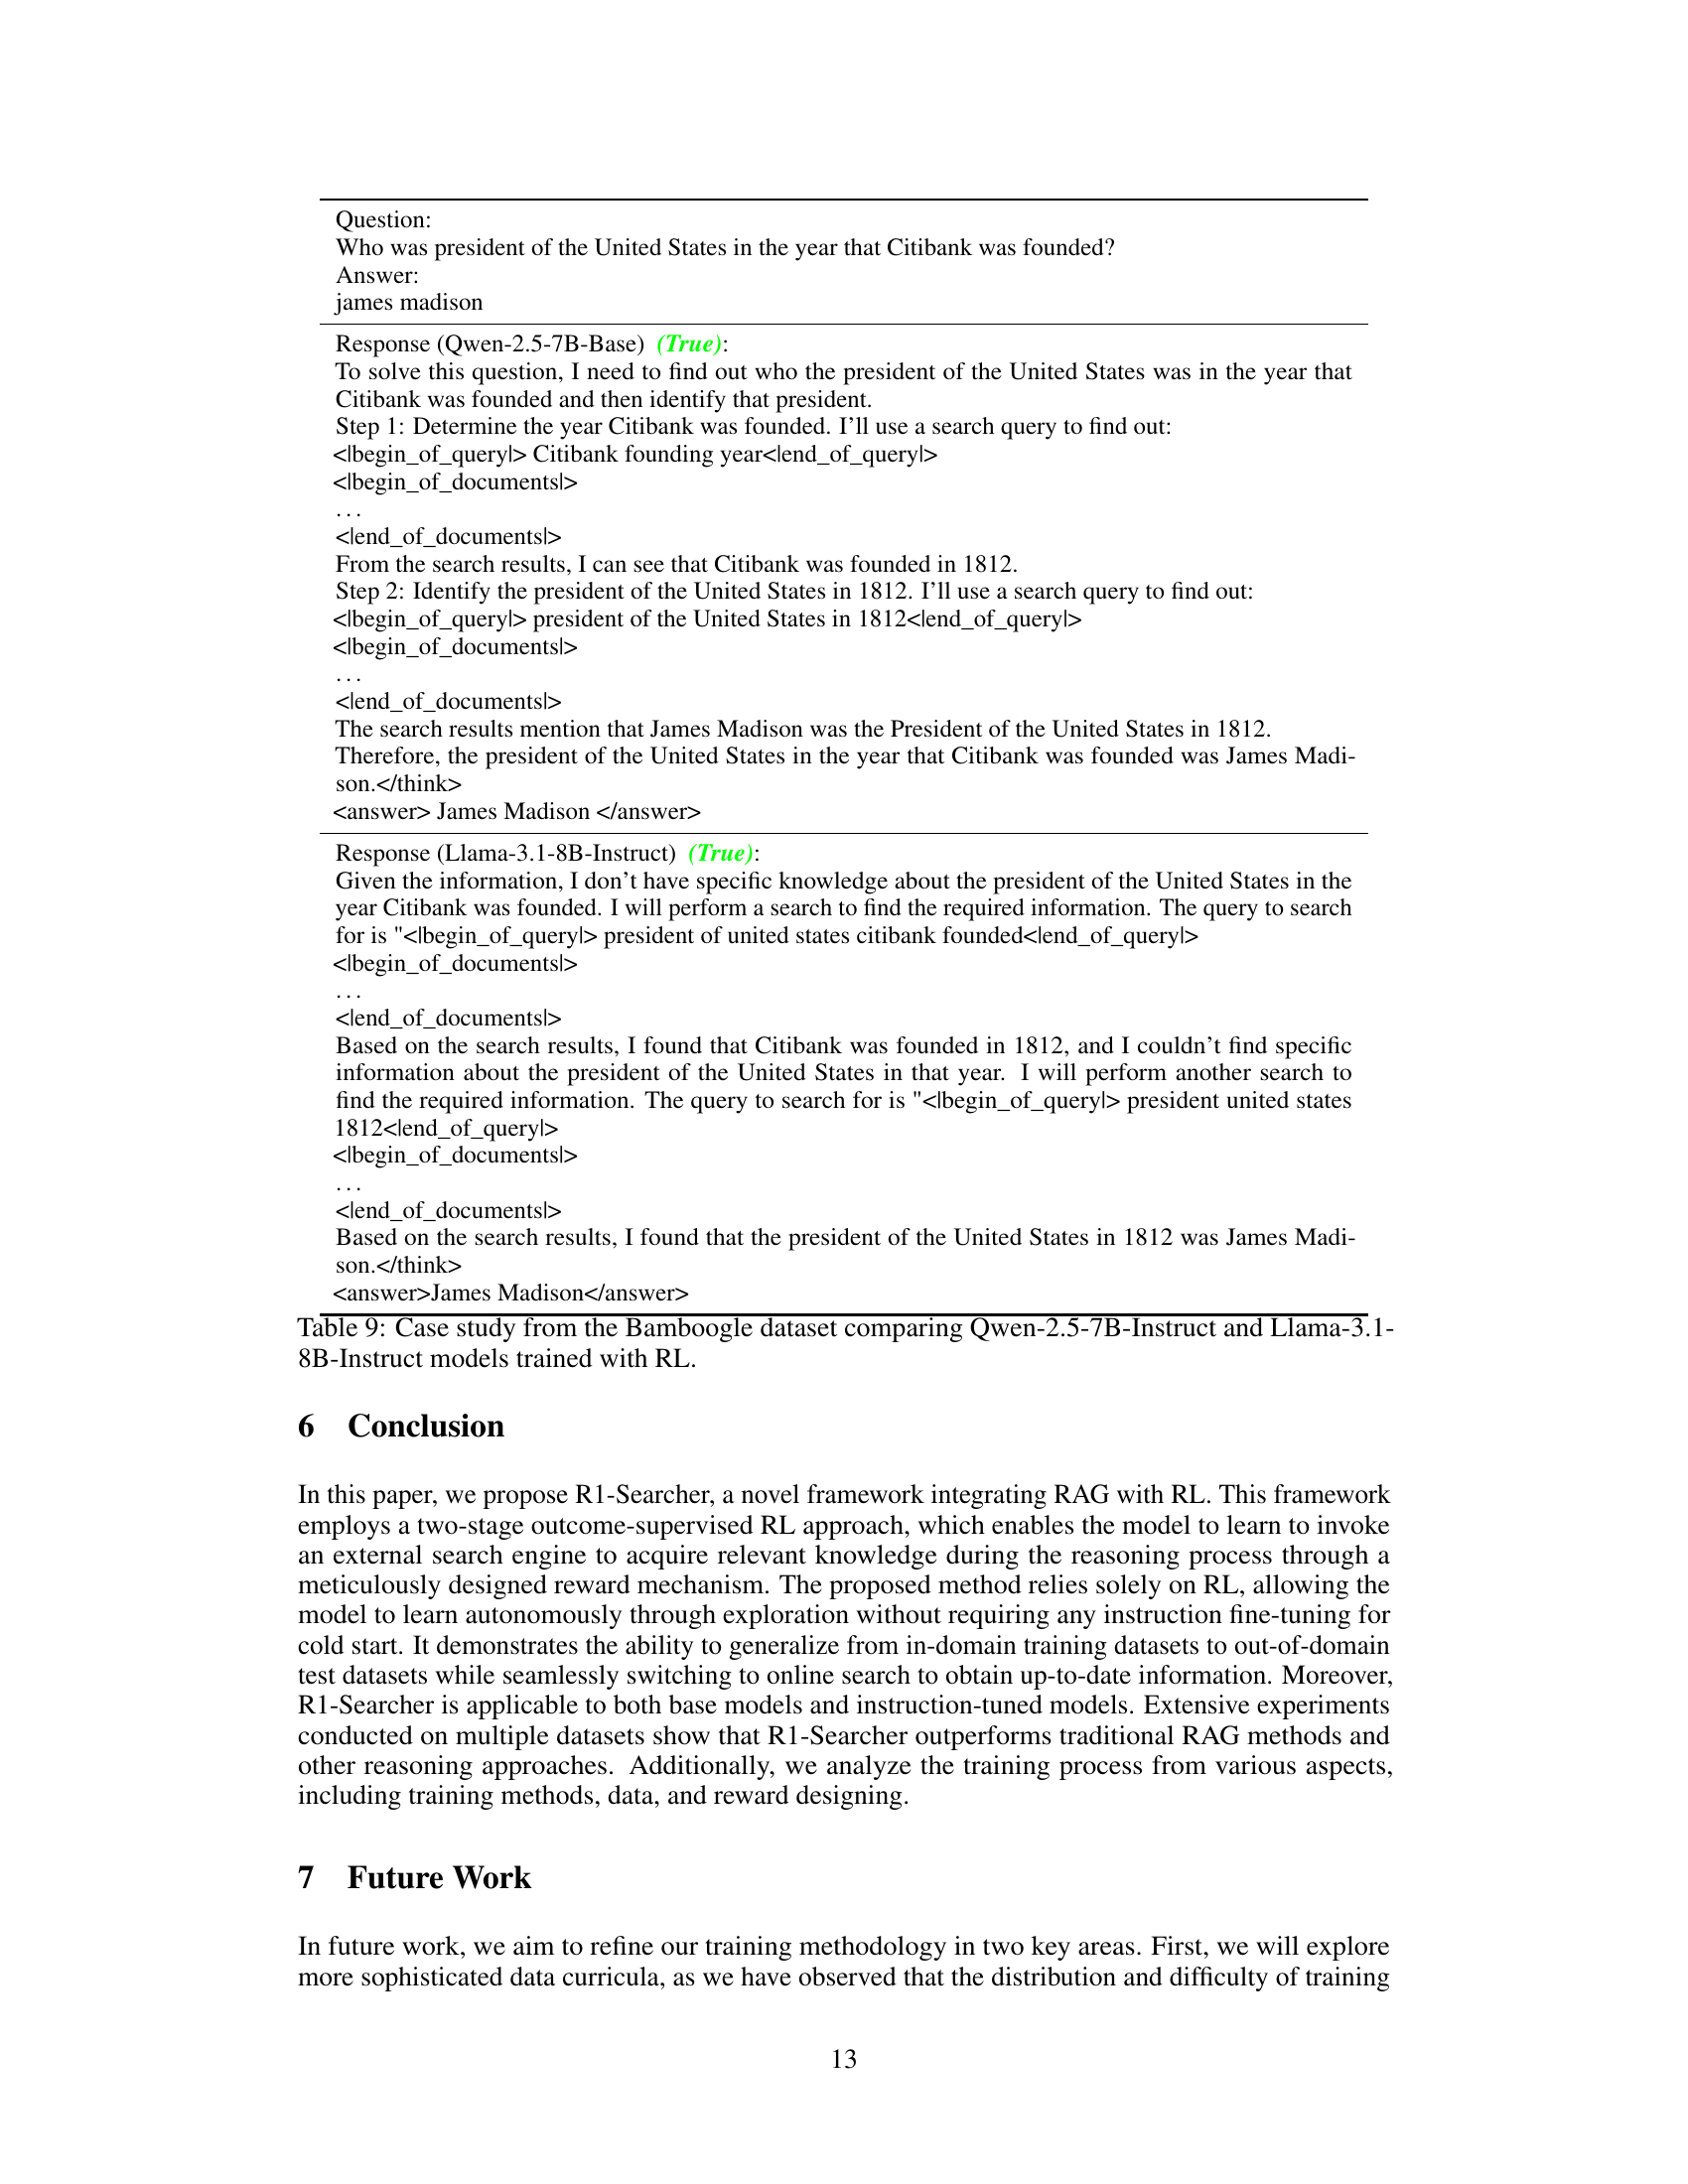
| Who was president of the United States in the year that Citibank was founded? |
| Answer: |
| james madison |
| Response (Qwen-2.5-7B-Base) (True): To solve this question, I need to find out who the president of the United States was in the year that Citibank was founded and then identify that president. Step 1: Determine the year Citibank was founded. I’ll use a search query to find out: <|begin_of_query|> Citibank founding year<|end_of_query|> <|begin_of_documents|> … |
| <|end_of_documents|> From the search results, I can see that Citibank was founded in 1812. Step 2: Identify the president of the United States in 1812. I’ll use a search query to find out: <|begin_of_query|> president of the United States in 1812<|end_of_query|> <|begin_of_documents|> … |
| <|end_of_documents|> The search results mention that James Madison was the President of the United States in 1812. Therefore, the president of the United States in the year that Citibank was founded was James Madison.</think> <answer> James Madison </answer> |
| Response (Llama-3.1-8B-Instruct) (True): Given the information, I don’t have specific knowledge about the president of the United States in the year Citibank was founded. I will perform a search to find the required information. The query to search for is "<|begin_of_query|> president of united states citibank founded<|end_of_query|> <|begin_of_documents|> … |
| <|end_of_documents|> Based on the search results, I found that Citibank was founded in 1812, and I couldn’t find specific information about the president of the United States in that year. I will perform another search to find the required information. The query to search for is "<|begin_of_query|> president united states 1812<|end_of_query|> <|begin_of_documents|> … |
| <|end_of_documents|> Based on the search results, I found that the president of the United States in 1812 was James Madison.</think> <answer>James Madison</answer> |
🔼 This table presents a comparative case study of two large language models (LLMs), Qwen-2.5-7B-Instruct and Llama-3.1-8B-Instruct, both trained using reinforcement learning (RL). The models are evaluated on their ability to answer a complex question from the Bamboogle dataset. The table shows the different reasoning processes employed by each model, along with the final answers, highlighting the differences in their approaches to problem-solving and demonstrating how RL affects their ability to decompose complex tasks, access external information through search, and arrive at a correct solution.
read the caption
Table 9: Case study from the Bamboogle dataset comparing Qwen-2.5-7B-Instruct and Llama-3.1-8B-Instruct models trained with RL.
Full paper#