TL;DR#
Large Vision-Language Models(LVLMs) are not perfect, often giving incorrect answers in question answering. Existing tests mainly check the final answer, not how each part (vision, language) performs. This limits improvement in specific areas. So, there is a need for better tests that can pinpoint where models struggle, leading to more effective advancements in these AI systems.
To solve this, VisualSimpleQA is introduced. It has two main features: First, it lets you easily test the vision and language parts of LVLMs separately. Second, it uses clear difficulty levels to help create tricky questions. Tests on 15 LVLMs showed even the best models like GPT-40 only got around 60% correct, and just 30% on the hardest questions. This new test shows big improvements are possible in both seeing and understanding.
Key Takeaways#
Why does it matter?#
This paper introduces a new benchmark that enables a more detailed evaluation of LVLMs, which can help researchers to identify and address the specific weaknesses of these models. It offers insights into both visual and linguistic capabilities for further research.
Visual Insights#

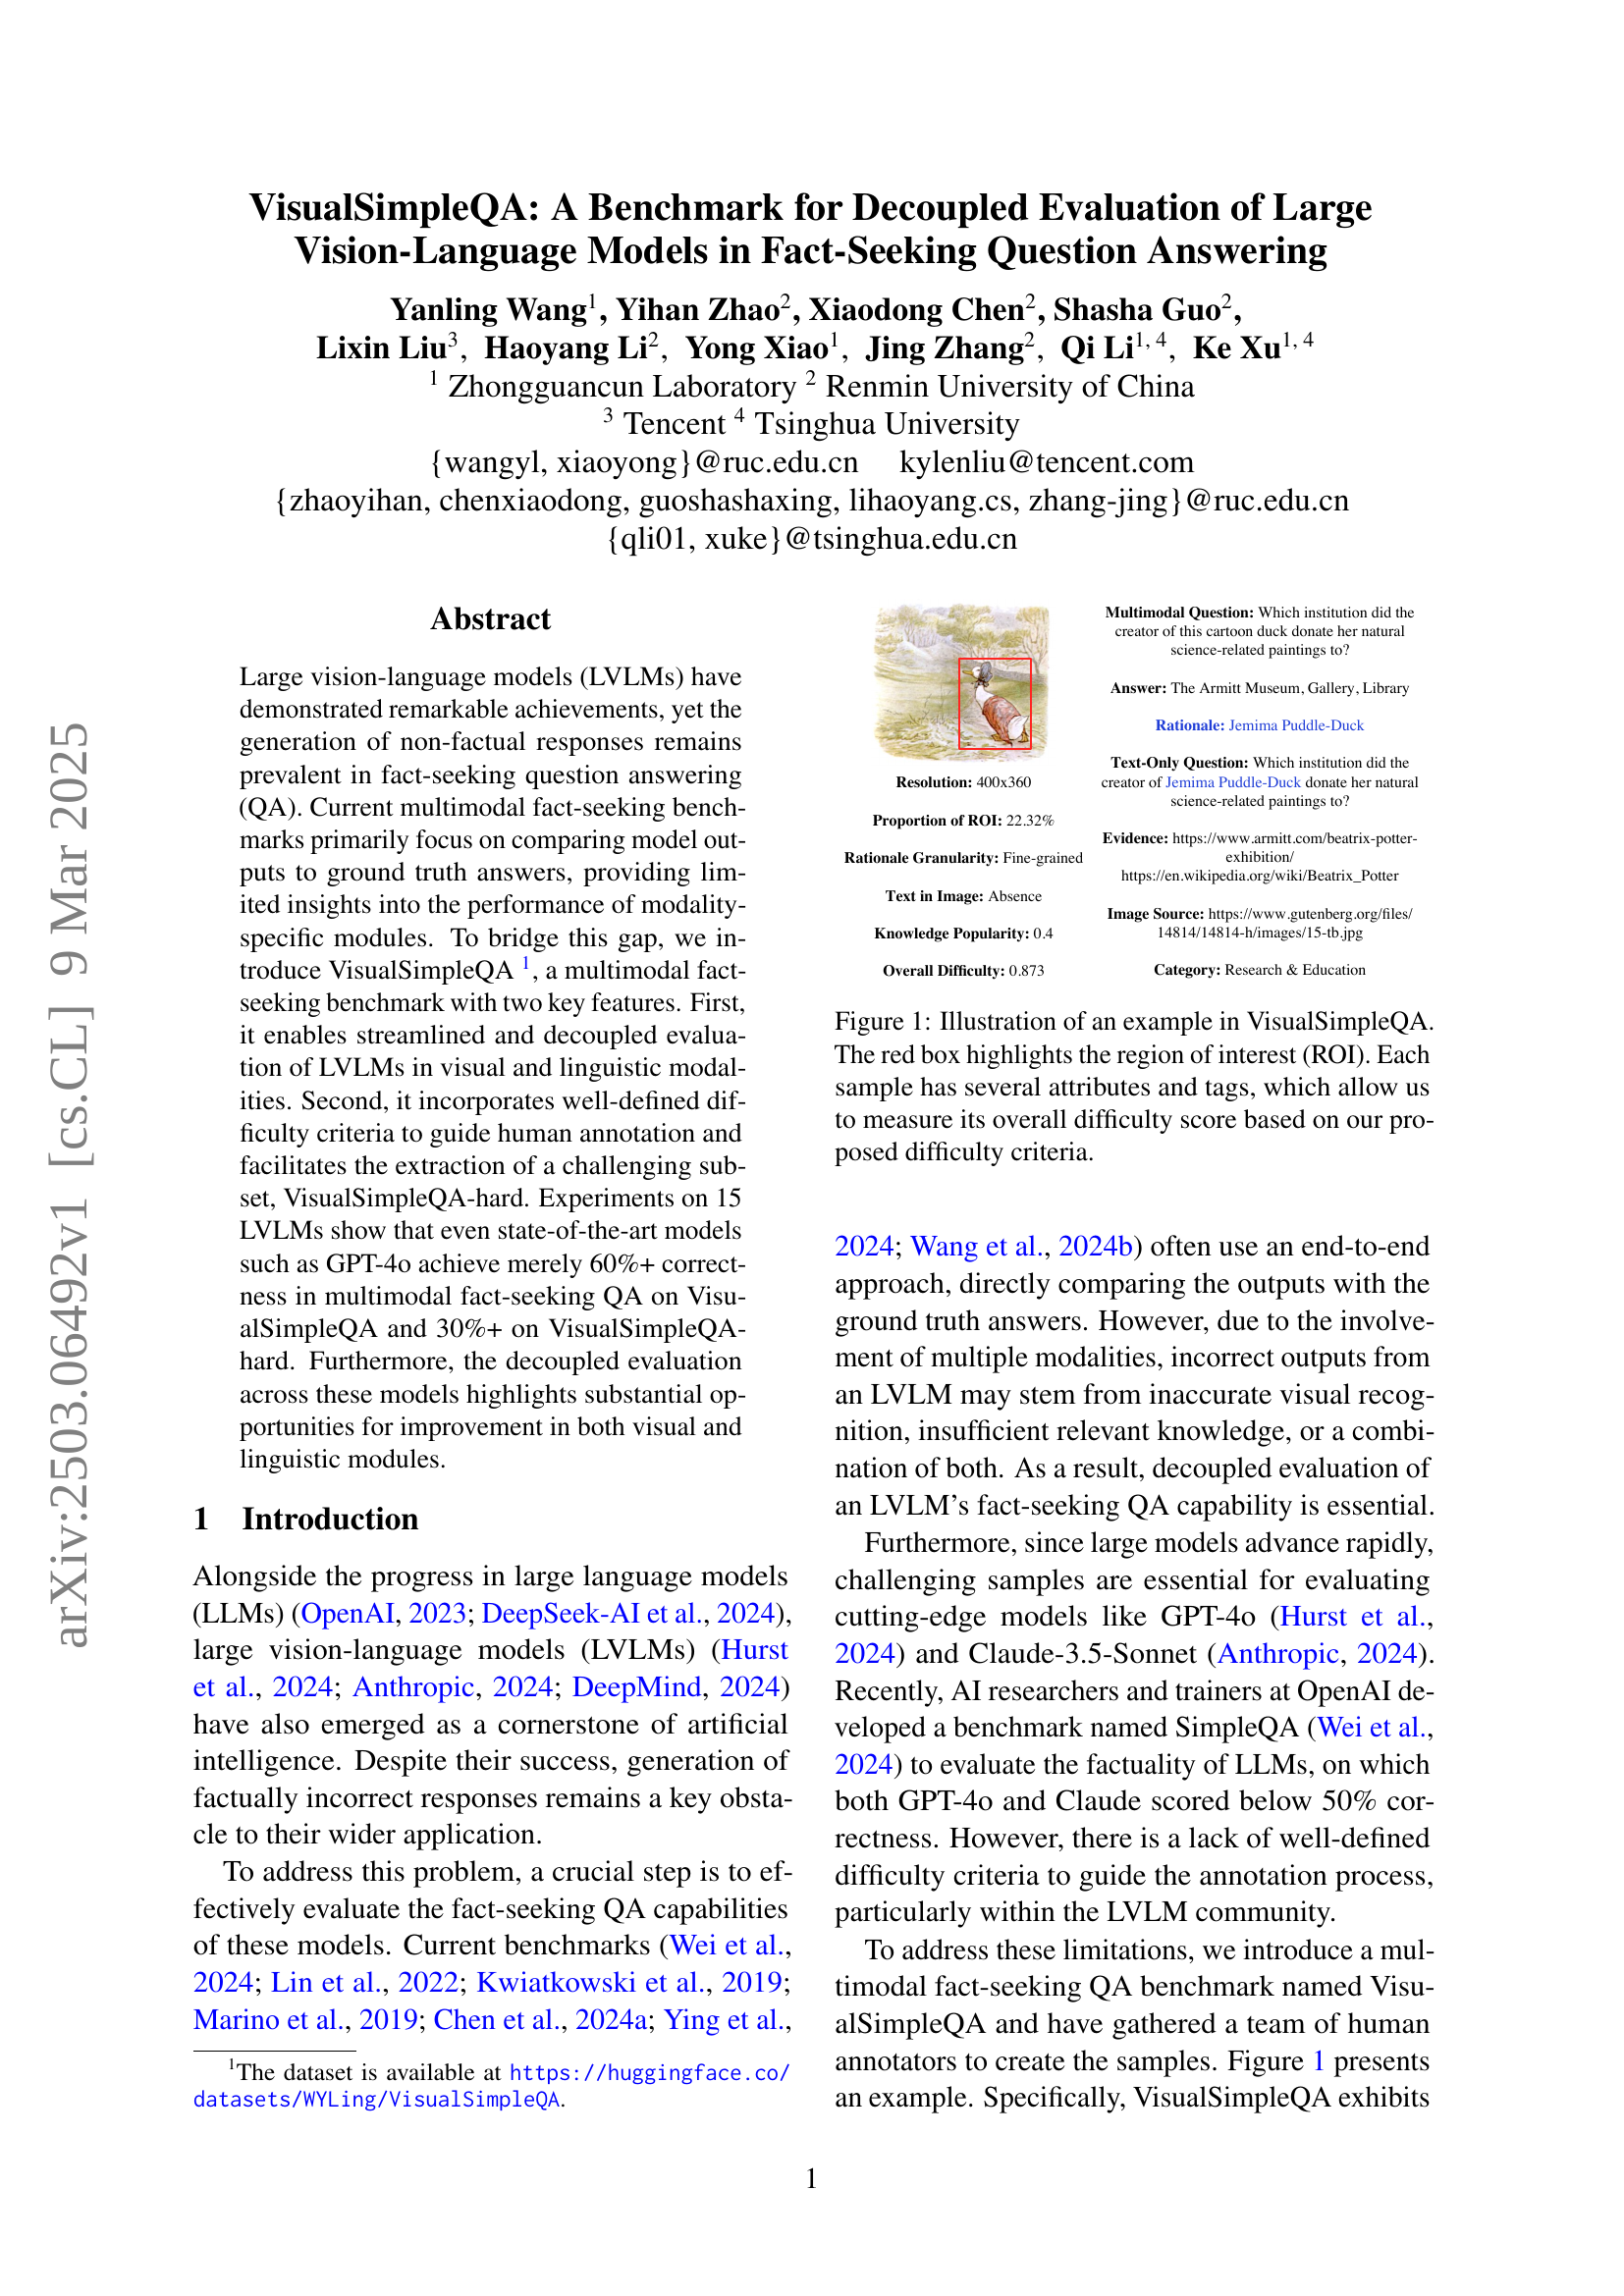
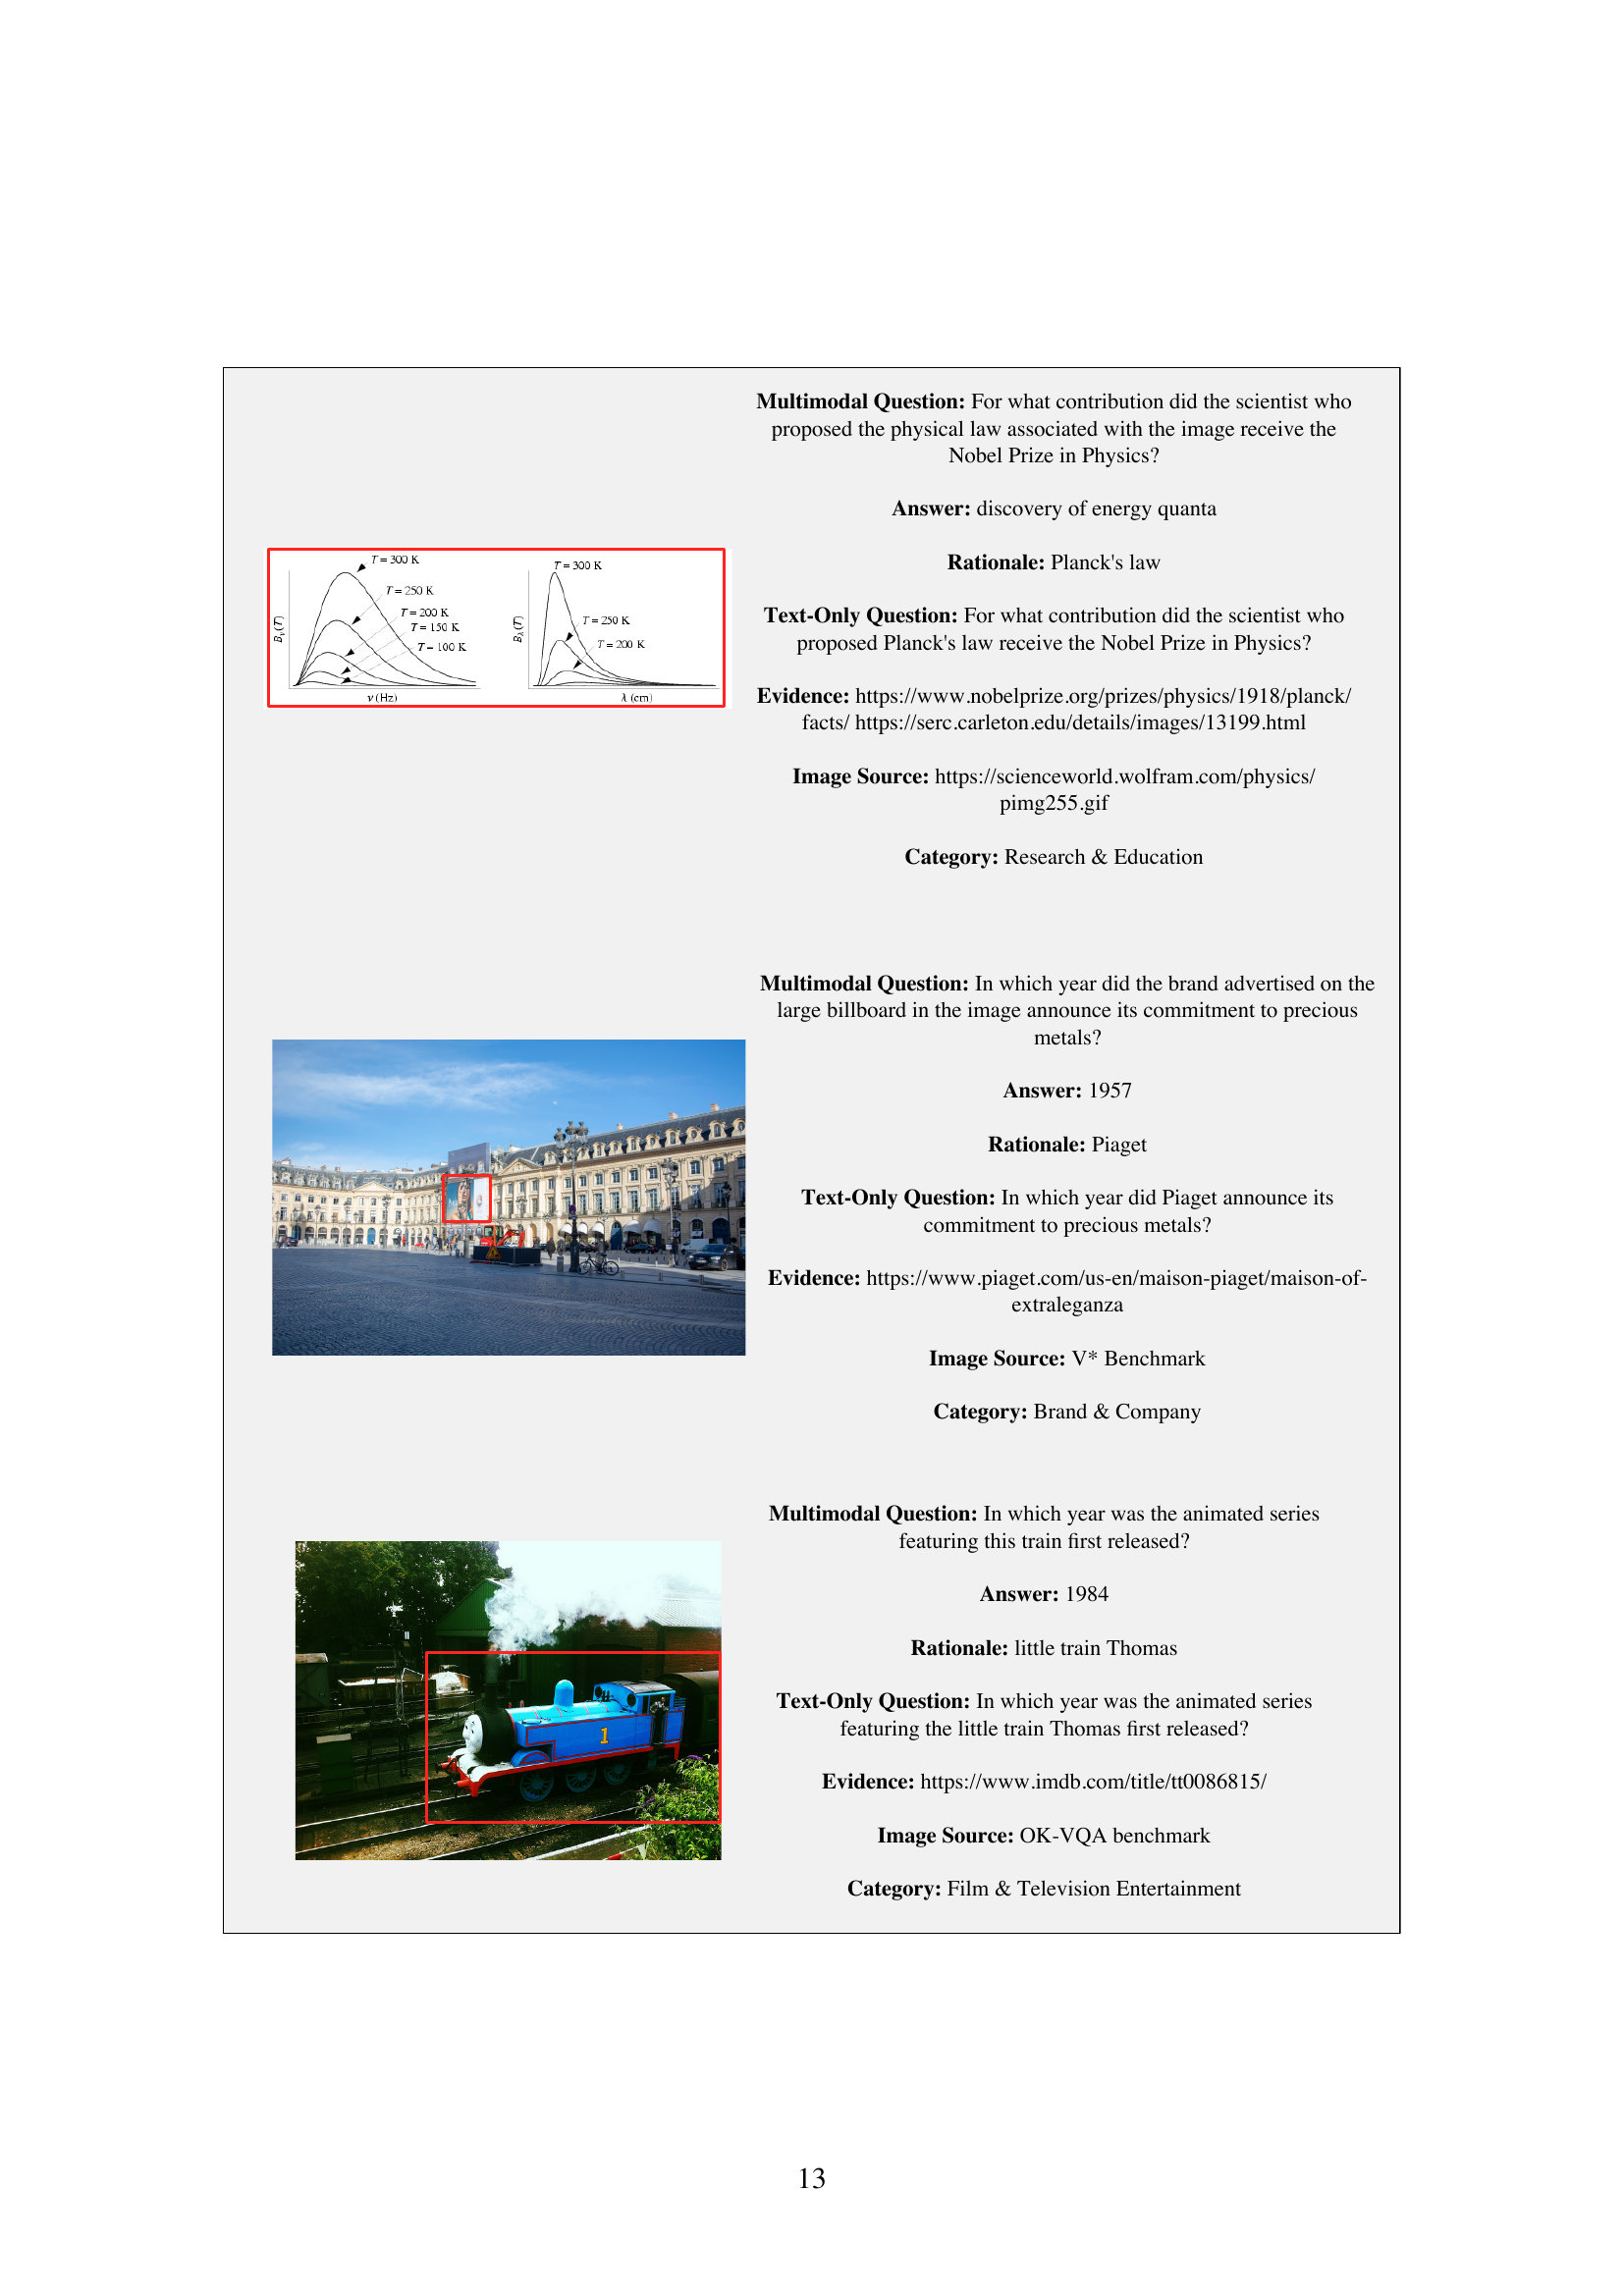
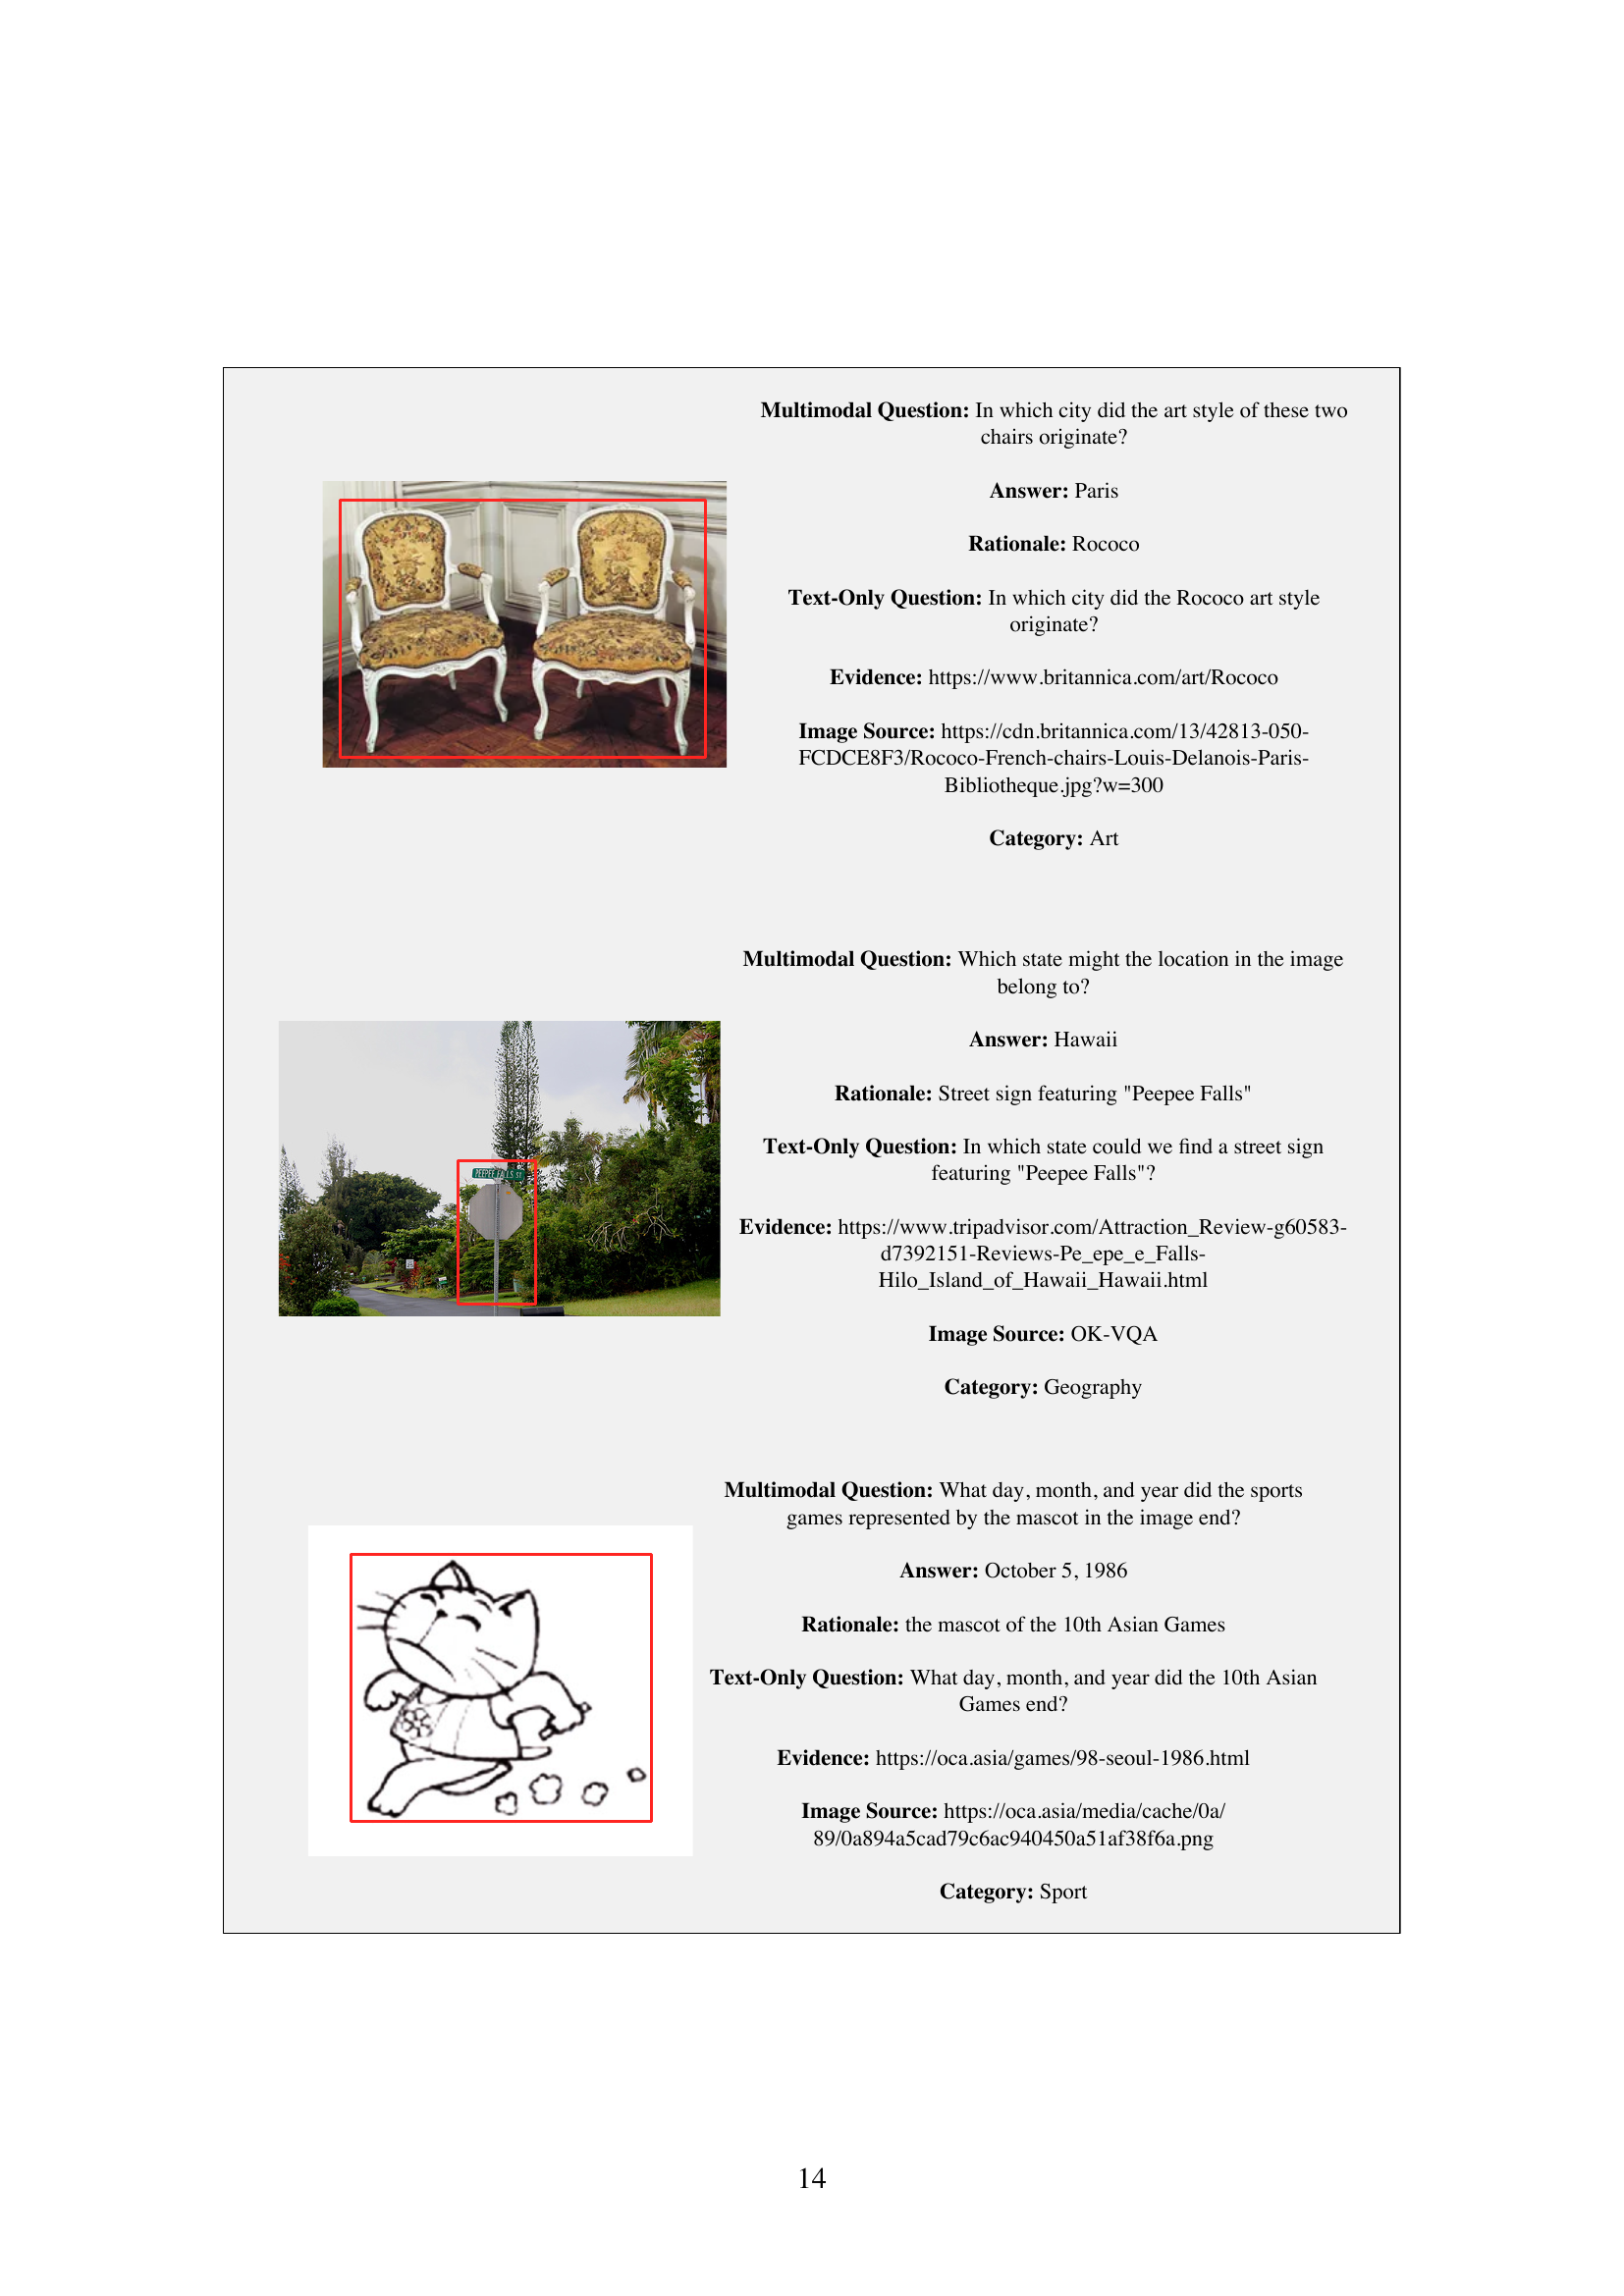
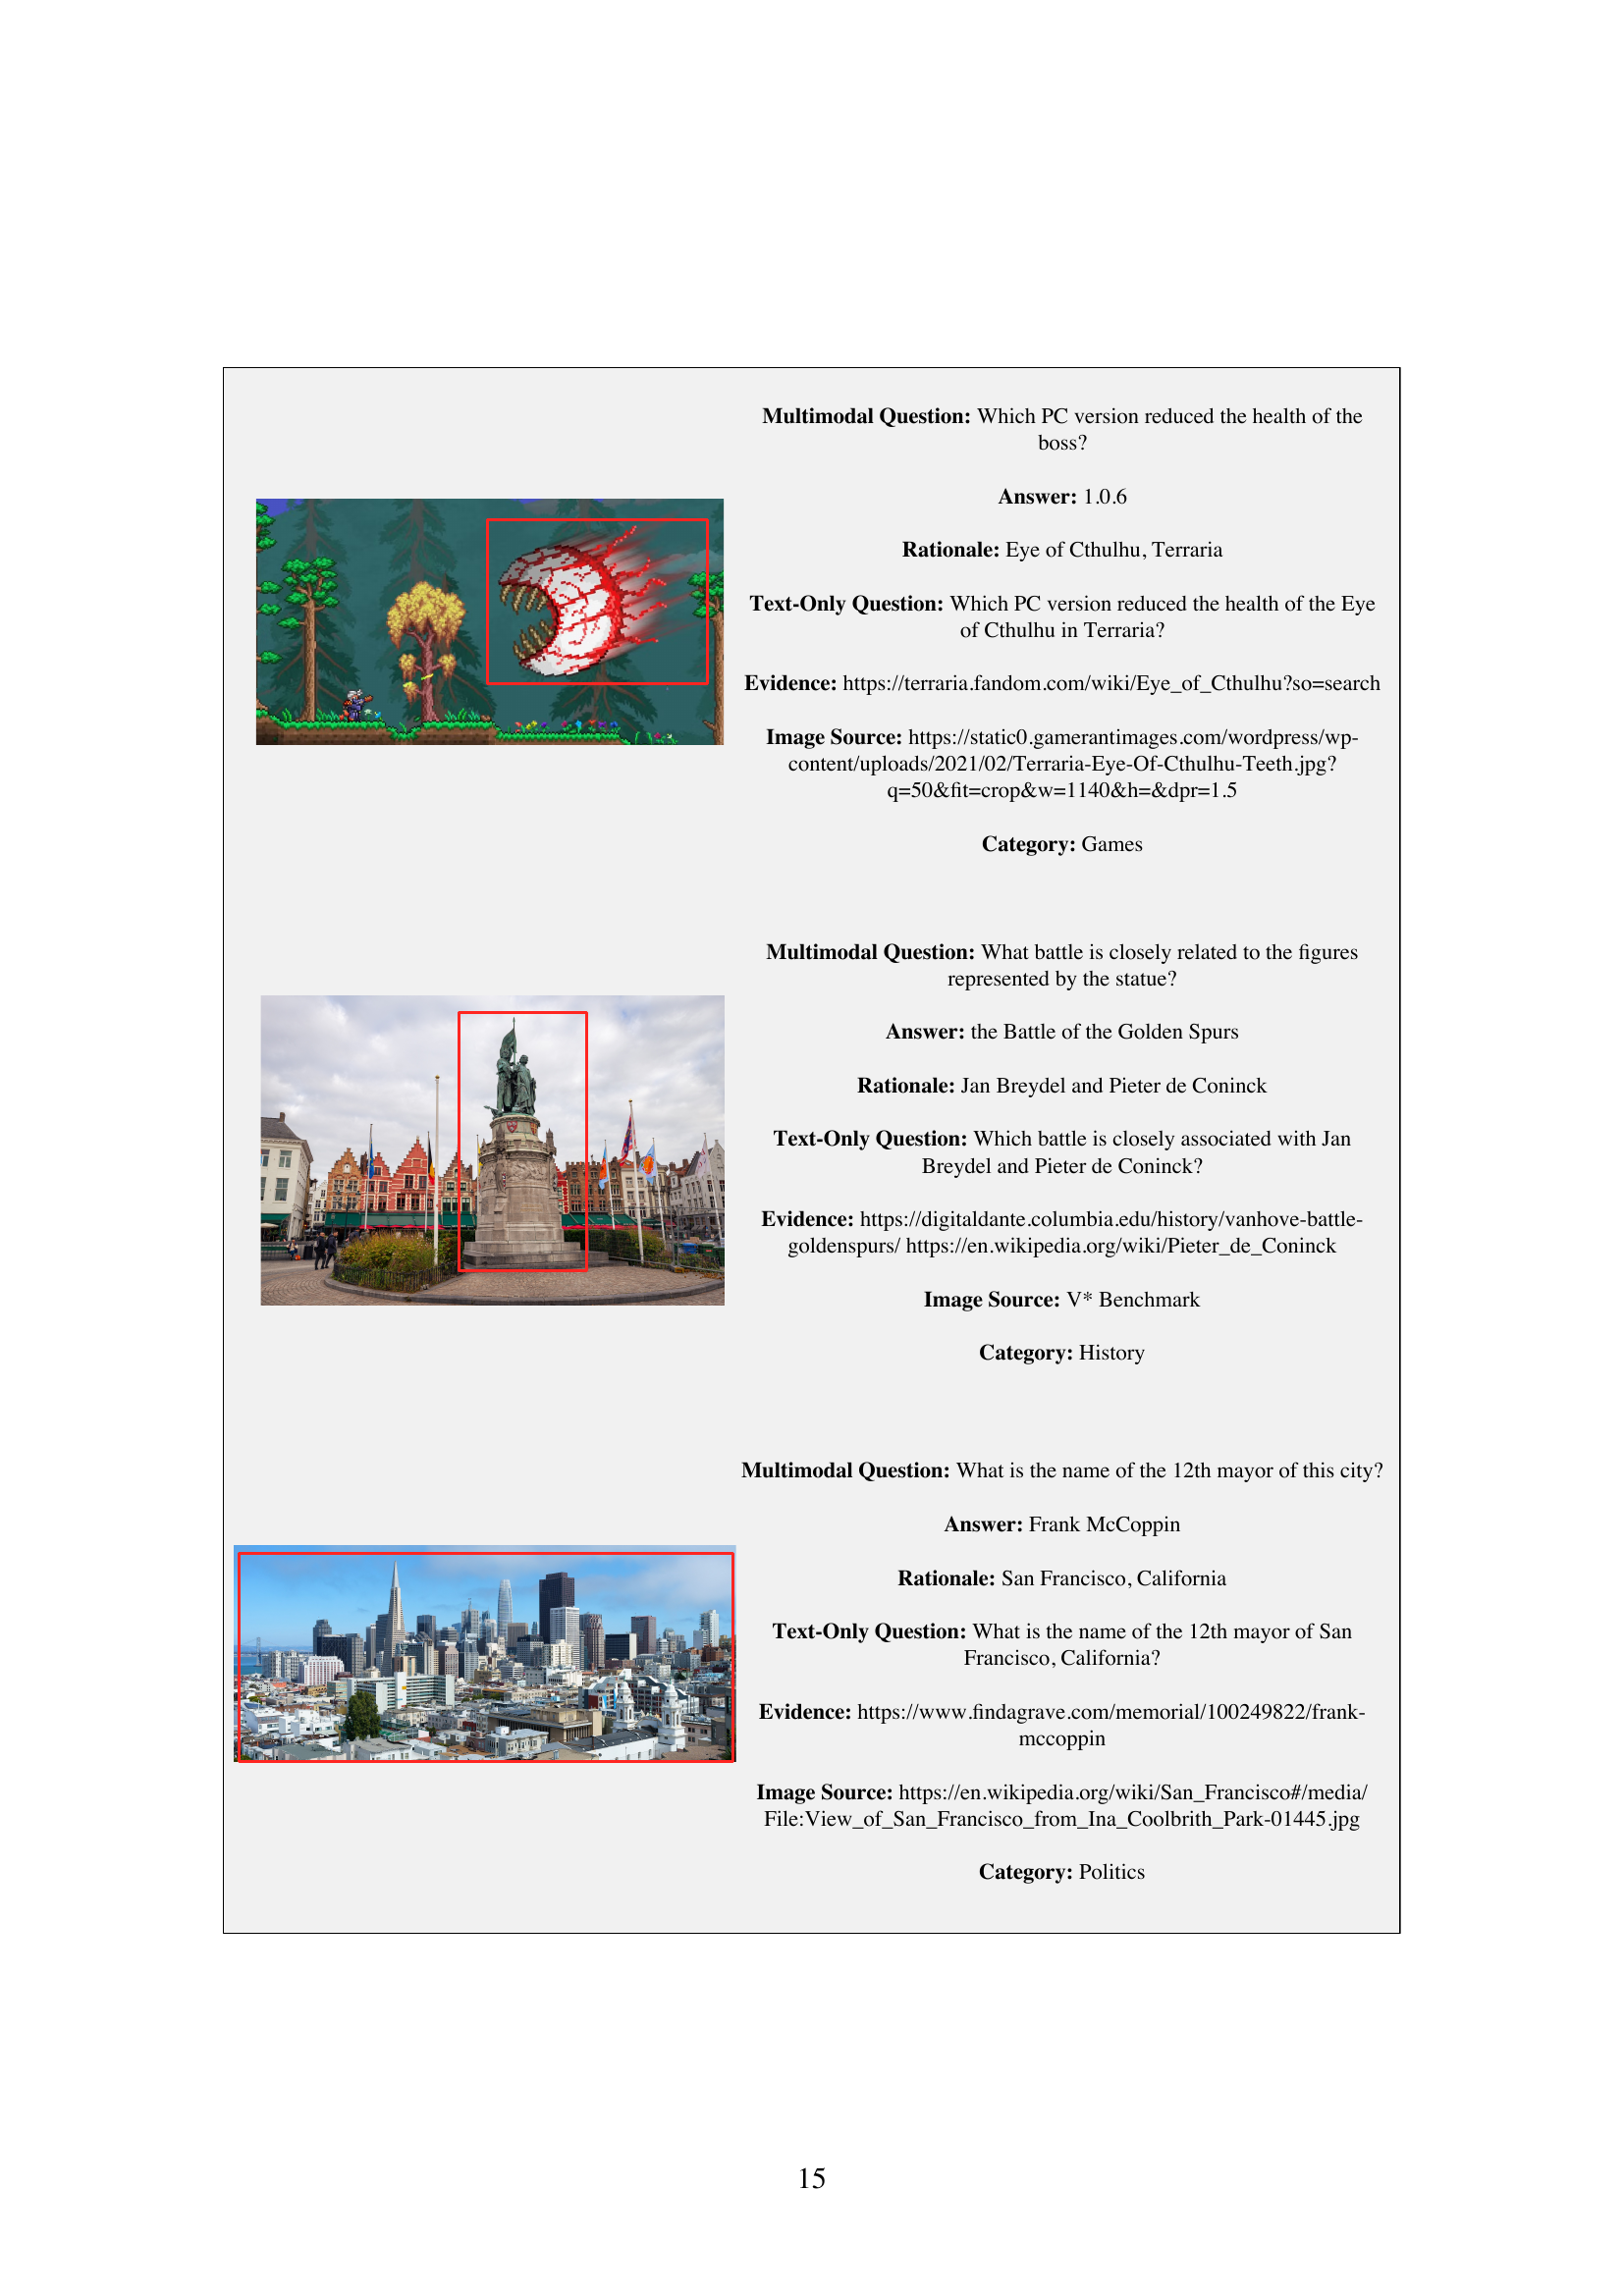
🔼 VisualSimpleQA is a multimodal fact-seeking QA benchmark. This figure shows an example from the benchmark. A multimodal question is posed, along with an image containing a region of interest (ROI, highlighted by a red box). The ROI is crucial for answering the question. The figure also displays attributes and tags associated with the example. These attributes and tags (such as image resolution, rationale granularity, etc.) are used to compute a difficulty score for each sample in the benchmark, helping researchers understand model performance on more challenging questions.
read the caption
Figure 1: Illustration of an example in VisualSimpleQA. The red box highlights the region of interest (ROI). Each sample has several attributes and tags, which allow us to measure its overall difficulty score based on our proposed difficulty criteria.
| Factuality- aware | Decoupled Evaluation | Difficulty Criteria | |
| OK-VQA | All | No | No |
| A-OKVQA | All | No | No |
| MMBench | Partial | No | No |
| MMStar | Partial | No | No |
| MMT-Bench | Partial | No | No |
| MFC-Bench | Partial | No | No |
| Prism | – | Yes | No |
| HallusionBench | Partial | Yes | No |
| VisualSimpleQA | All | Yes | Yes |
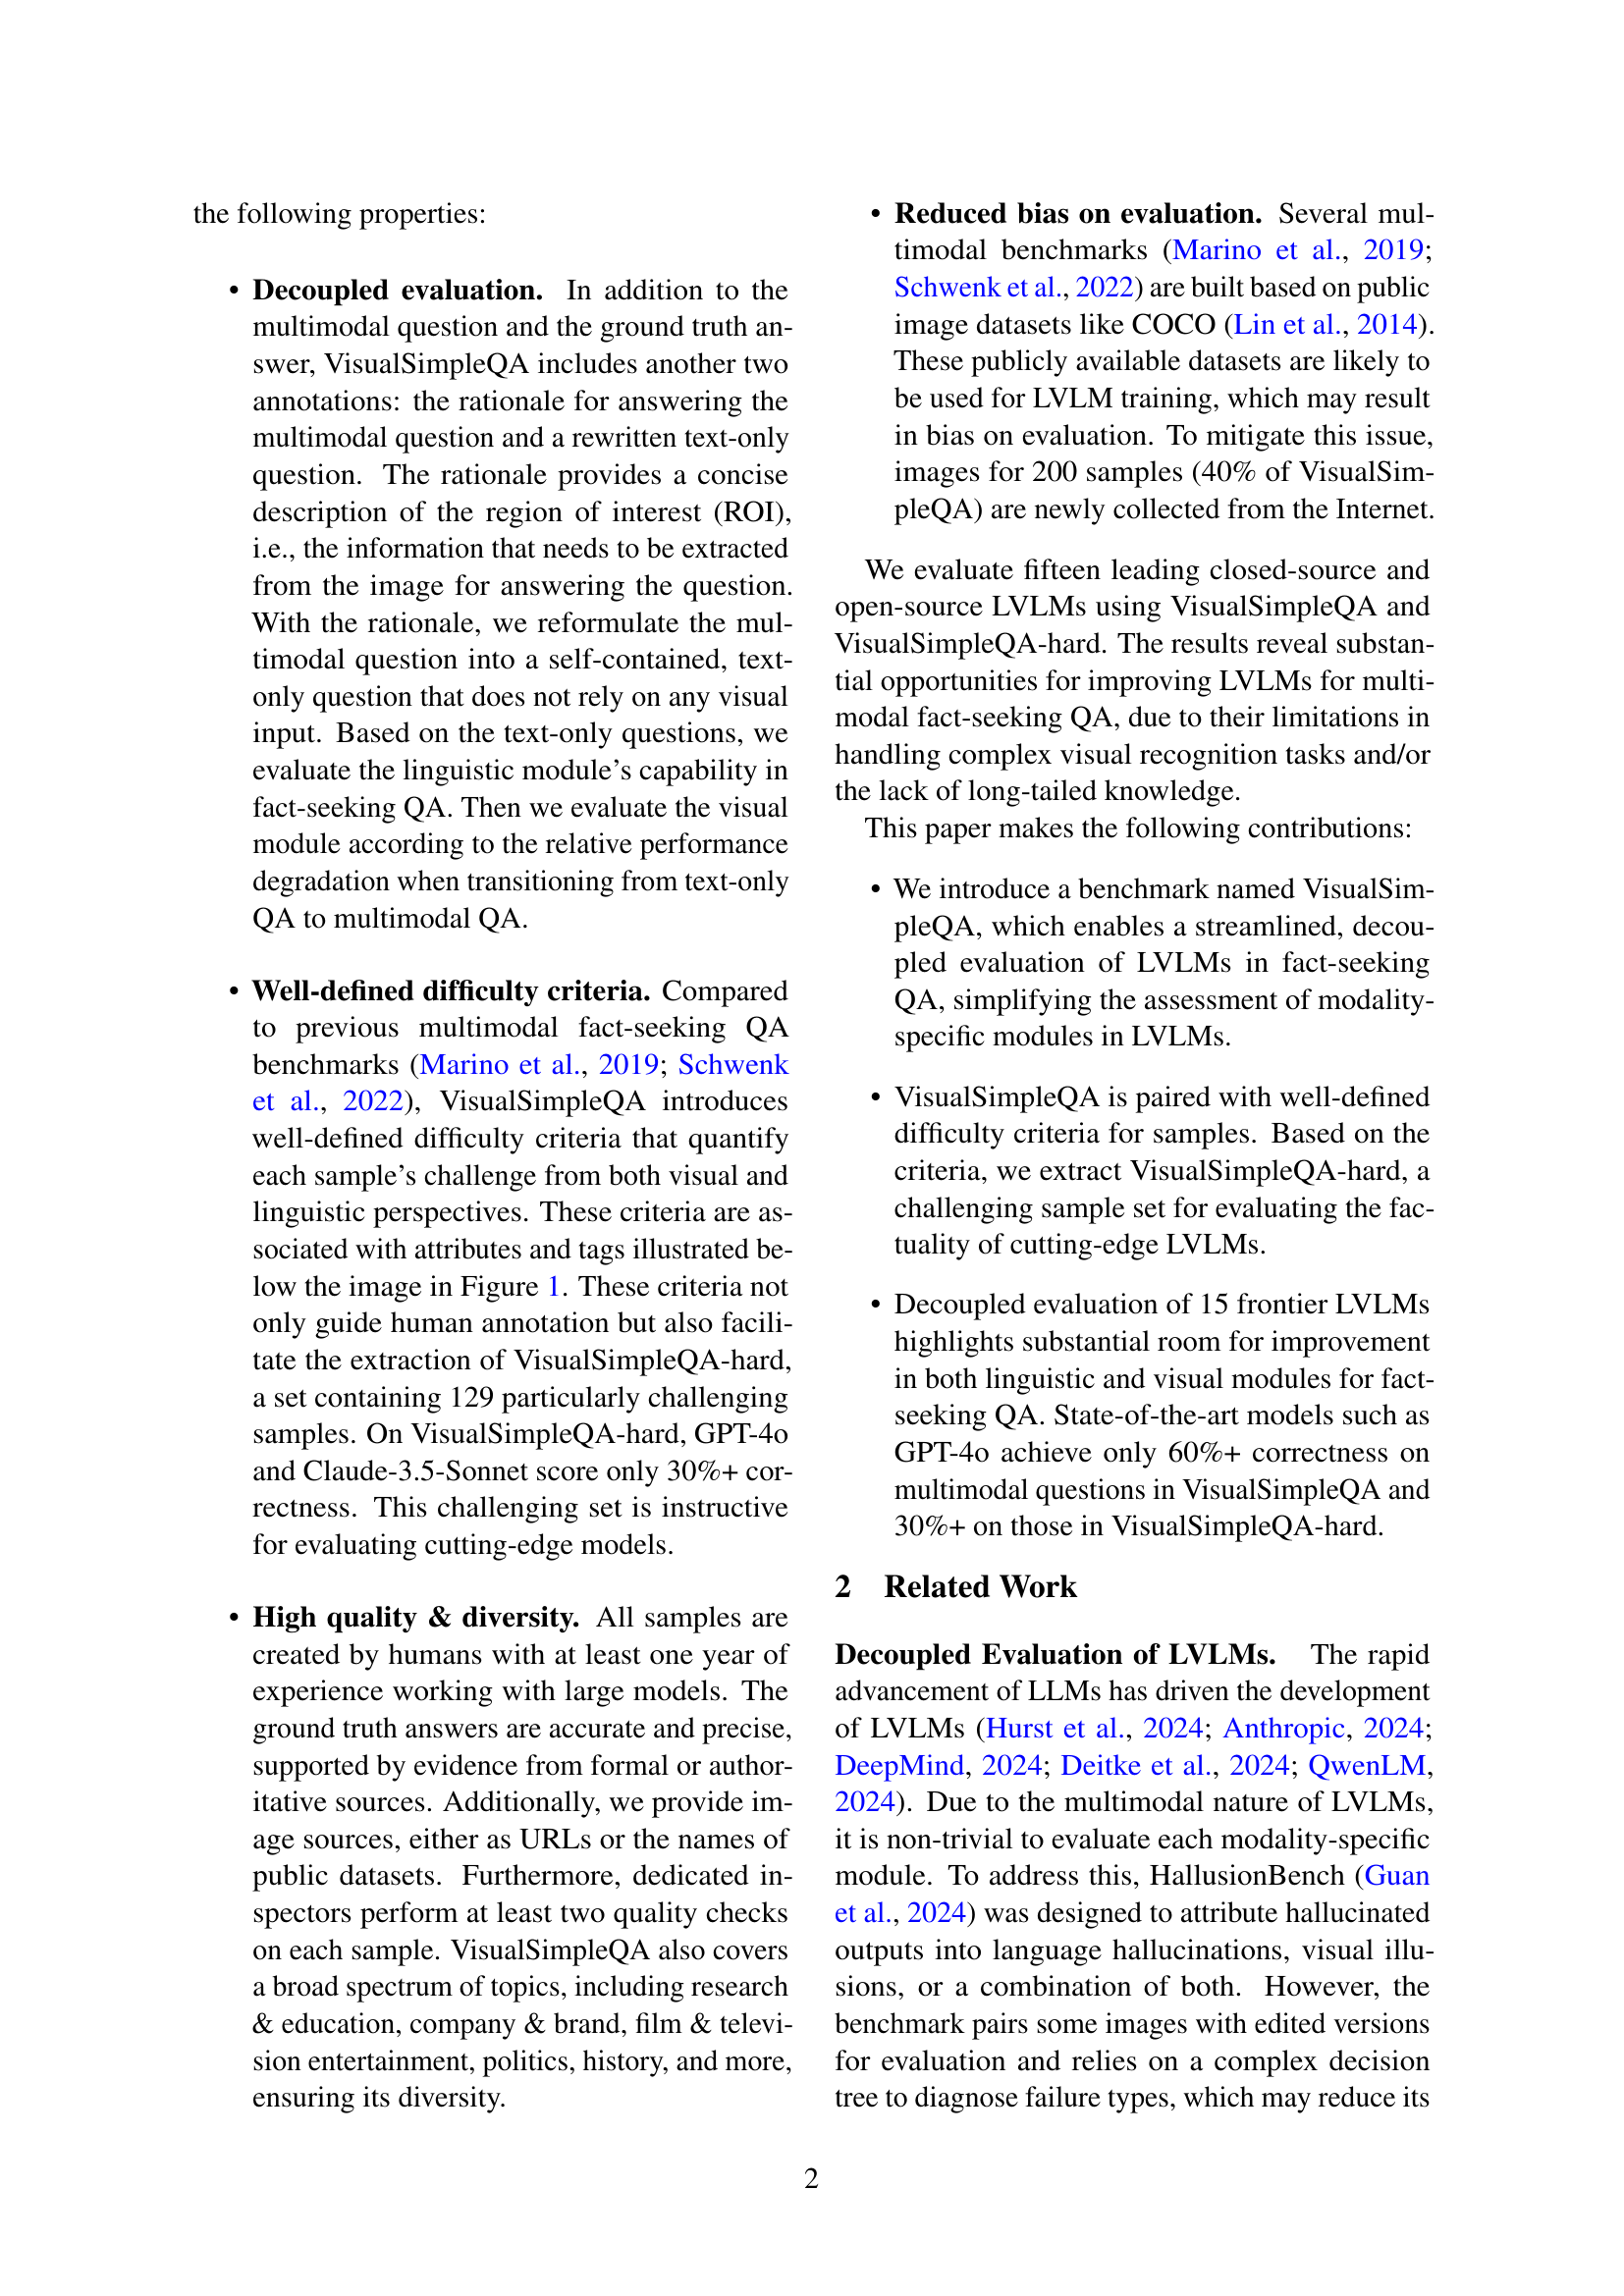
🔼 This table compares VisualSimpleQA with other relevant multimodal benchmarks across several key properties. These properties include whether the benchmark is factuality-aware, if it supports decoupled evaluation of visual and linguistic modules, and whether it incorporates well-defined difficulty criteria for the samples. This allows for a comprehensive comparison of the strengths and weaknesses of VisualSimpleQA relative to existing methods in the field of multimodal fact-seeking question answering.
read the caption
Table 1: Comparison of properties between VisualSimpleQA and relevant multimodal benchmarks.
In-depth insights#
Decoupled QA Eval#
Decoupled QA evaluation is a critical approach for assessing vision-language models (VLMs). Traditional end-to-end QA benchmarks offer limited insights into the performance of individual modules. By isolating and evaluating visual perception, knowledge retrieval, and reasoning components, decoupled evaluation allows for a more granular understanding of model strengths and weaknesses. This involves creating paired questions, where one version requires visual input and the other relies solely on text, enabling comparative analysis of model performance across modalities. Such evaluation provides valuable guidance for targeted model improvement, focusing on specific areas such as enhancing visual recognition or knowledge integration, ultimately leading to more robust and reliable VLM systems.
VisualSimpleQA#
VisualSimpleQA presents a new benchmark designed to decouple evaluation in large vision-language models for fact-seeking QA. It uniquely enables evaluation of modality-specific modules, highlighting performance differences. Incorporating well-defined difficulty criteria assists in the creation of the benchmark and is used to generate challenging subsets, like VisualSimpleQA-hard. Experiments on multiple LVLMs demonstrate the benchmark’s ability to reveal improvement opportunities in both visual and linguistic modules. This is important because it can pinpoint specific areas for improvement. Most importantly, the focus on factuality can improve response accuracy, and the decoupled evaluation can provide insights into different models.
Difficulty Criteria#
Assessing the difficulty of questions in vision-language models (LVLMs) is a complex but crucial task. Difficulty arises from both visual understanding (e.g., resolution, ROI size, granularity of the rationale) and linguistic knowledge (e.g., knowledge popularity). The smaller the object of interest is in the image, the more difficult the task is. High-resolution images make it easier to identify the visual features, while it is challenging with low-resolution images. Models may struggle to identify the ROI. Using datasets for training result in bias on evaluation. It is easier to identify the answer to questions related to popular knowledge than to long-tail knowledge.
LVLM Factual Limits#
LVLMs face limitations in factual accuracy despite advancements. Factuality issues stem from challenges in visual recognition, knowledge retrieval, and multimodal integration. Current benchmarks often lack nuanced evaluation of modality-specific contributions. Decoupled evaluation is crucial to isolate weaknesses in visual or linguistic modules. Addressing long-tailed knowledge gaps and improving robustness to complex visual scenes are key areas for improvement. Well-defined difficulty criteria are needed to create more challenging and informative benchmarks. The generation of non-factual content restricts the broader applicability of these models. Future studies should focus on enhancing the reliability and factual consistency of LVLMs across diverse tasks and contexts.
Beyond Fact QA#
Beyond Fact QA delves into the realm of questions where answers aren’t simple retrieval, but require synthesis or inference. It addresses limitations of current QA systems, which mainly focus on fact verification by exploring deeper aspects, where understanding context and reasoning are essential. This includes tasks like visual description and content creation. The field involves more complex ground truth assessments, moving beyond simple answers towards understanding nuanced, long-form evaluations. The non-unique nature of answers introduces benchmark development and model evaluation challenges, demanding a move beyond short-form and easily verifiable responses.
More visual insights#
More on figures

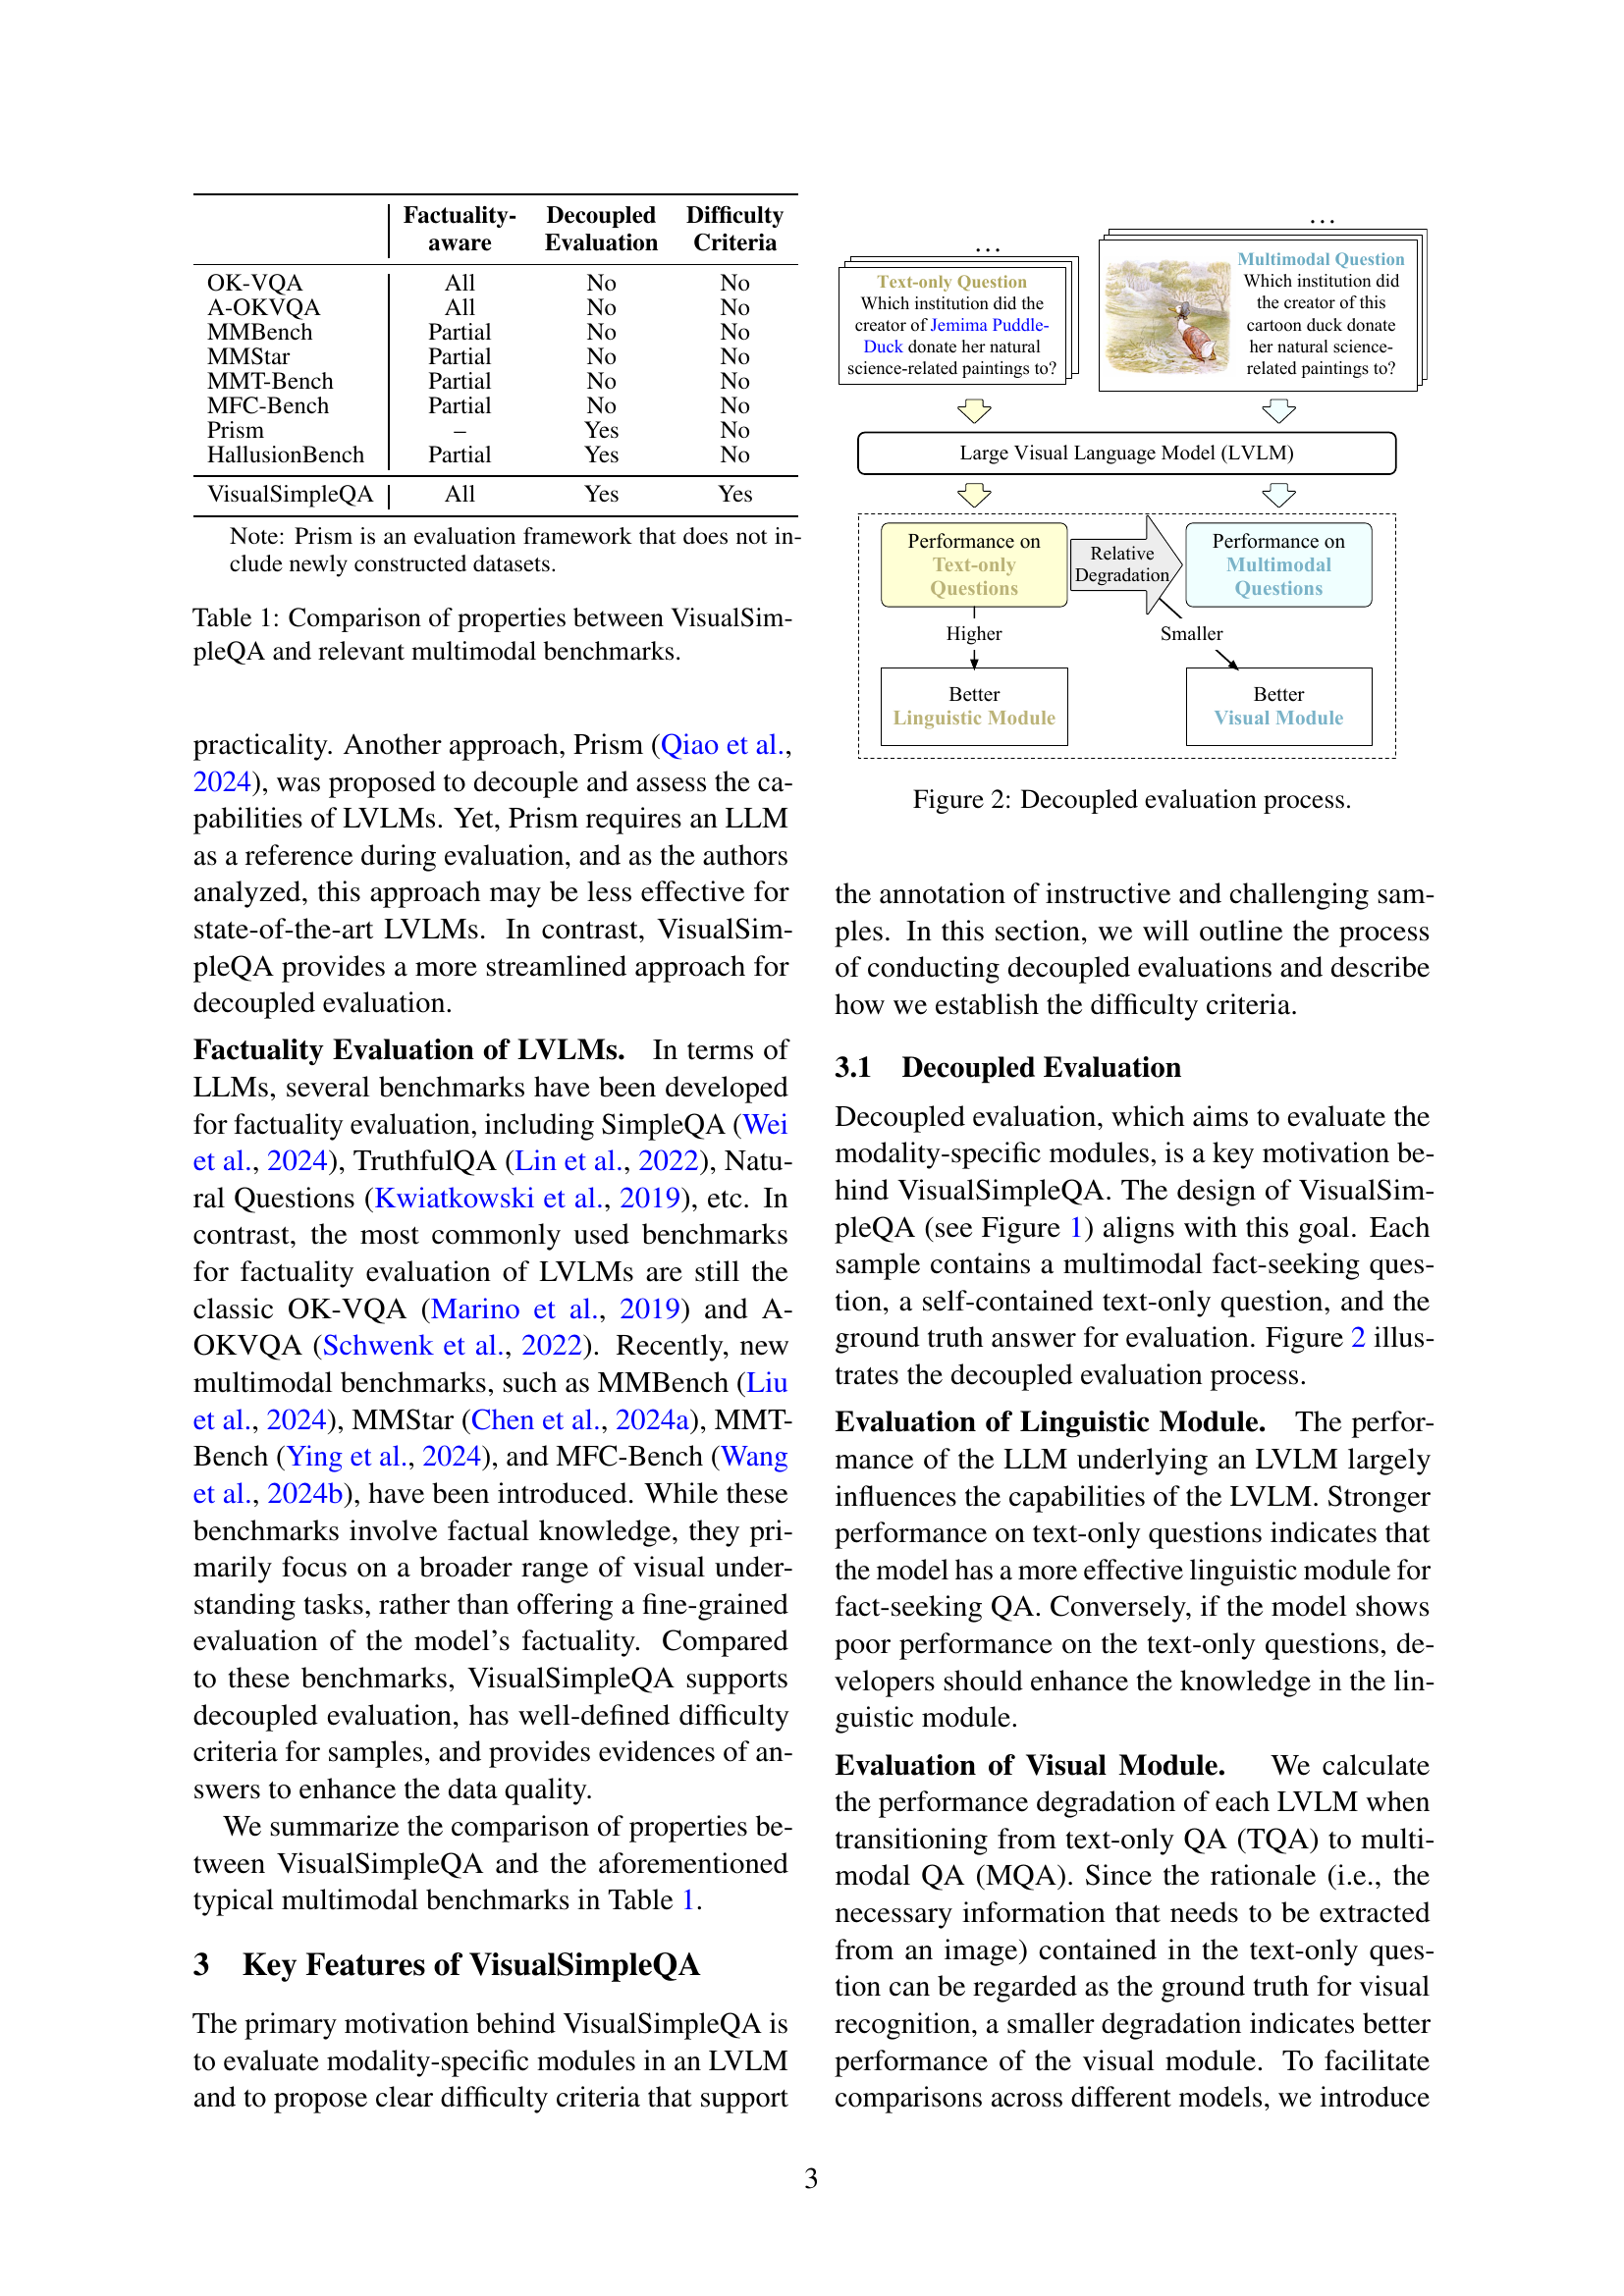
🔼 This figure illustrates the decoupled evaluation process used in the VisualSimpleQA benchmark. It shows how the benchmark separates the evaluation of the linguistic and visual modules of large vision-language models (LVLMs). The linguistic module is assessed using text-only questions, while the visual module is evaluated by comparing the performance on multimodal questions (which include visual input) against the performance on the corresponding text-only questions. A smaller performance difference between text-only and multimodal question answering indicates a stronger visual module. This decoupled approach allows for a more fine-grained analysis of LVLMs’ strengths and weaknesses.
read the caption
Figure 2: Decoupled evaluation process.

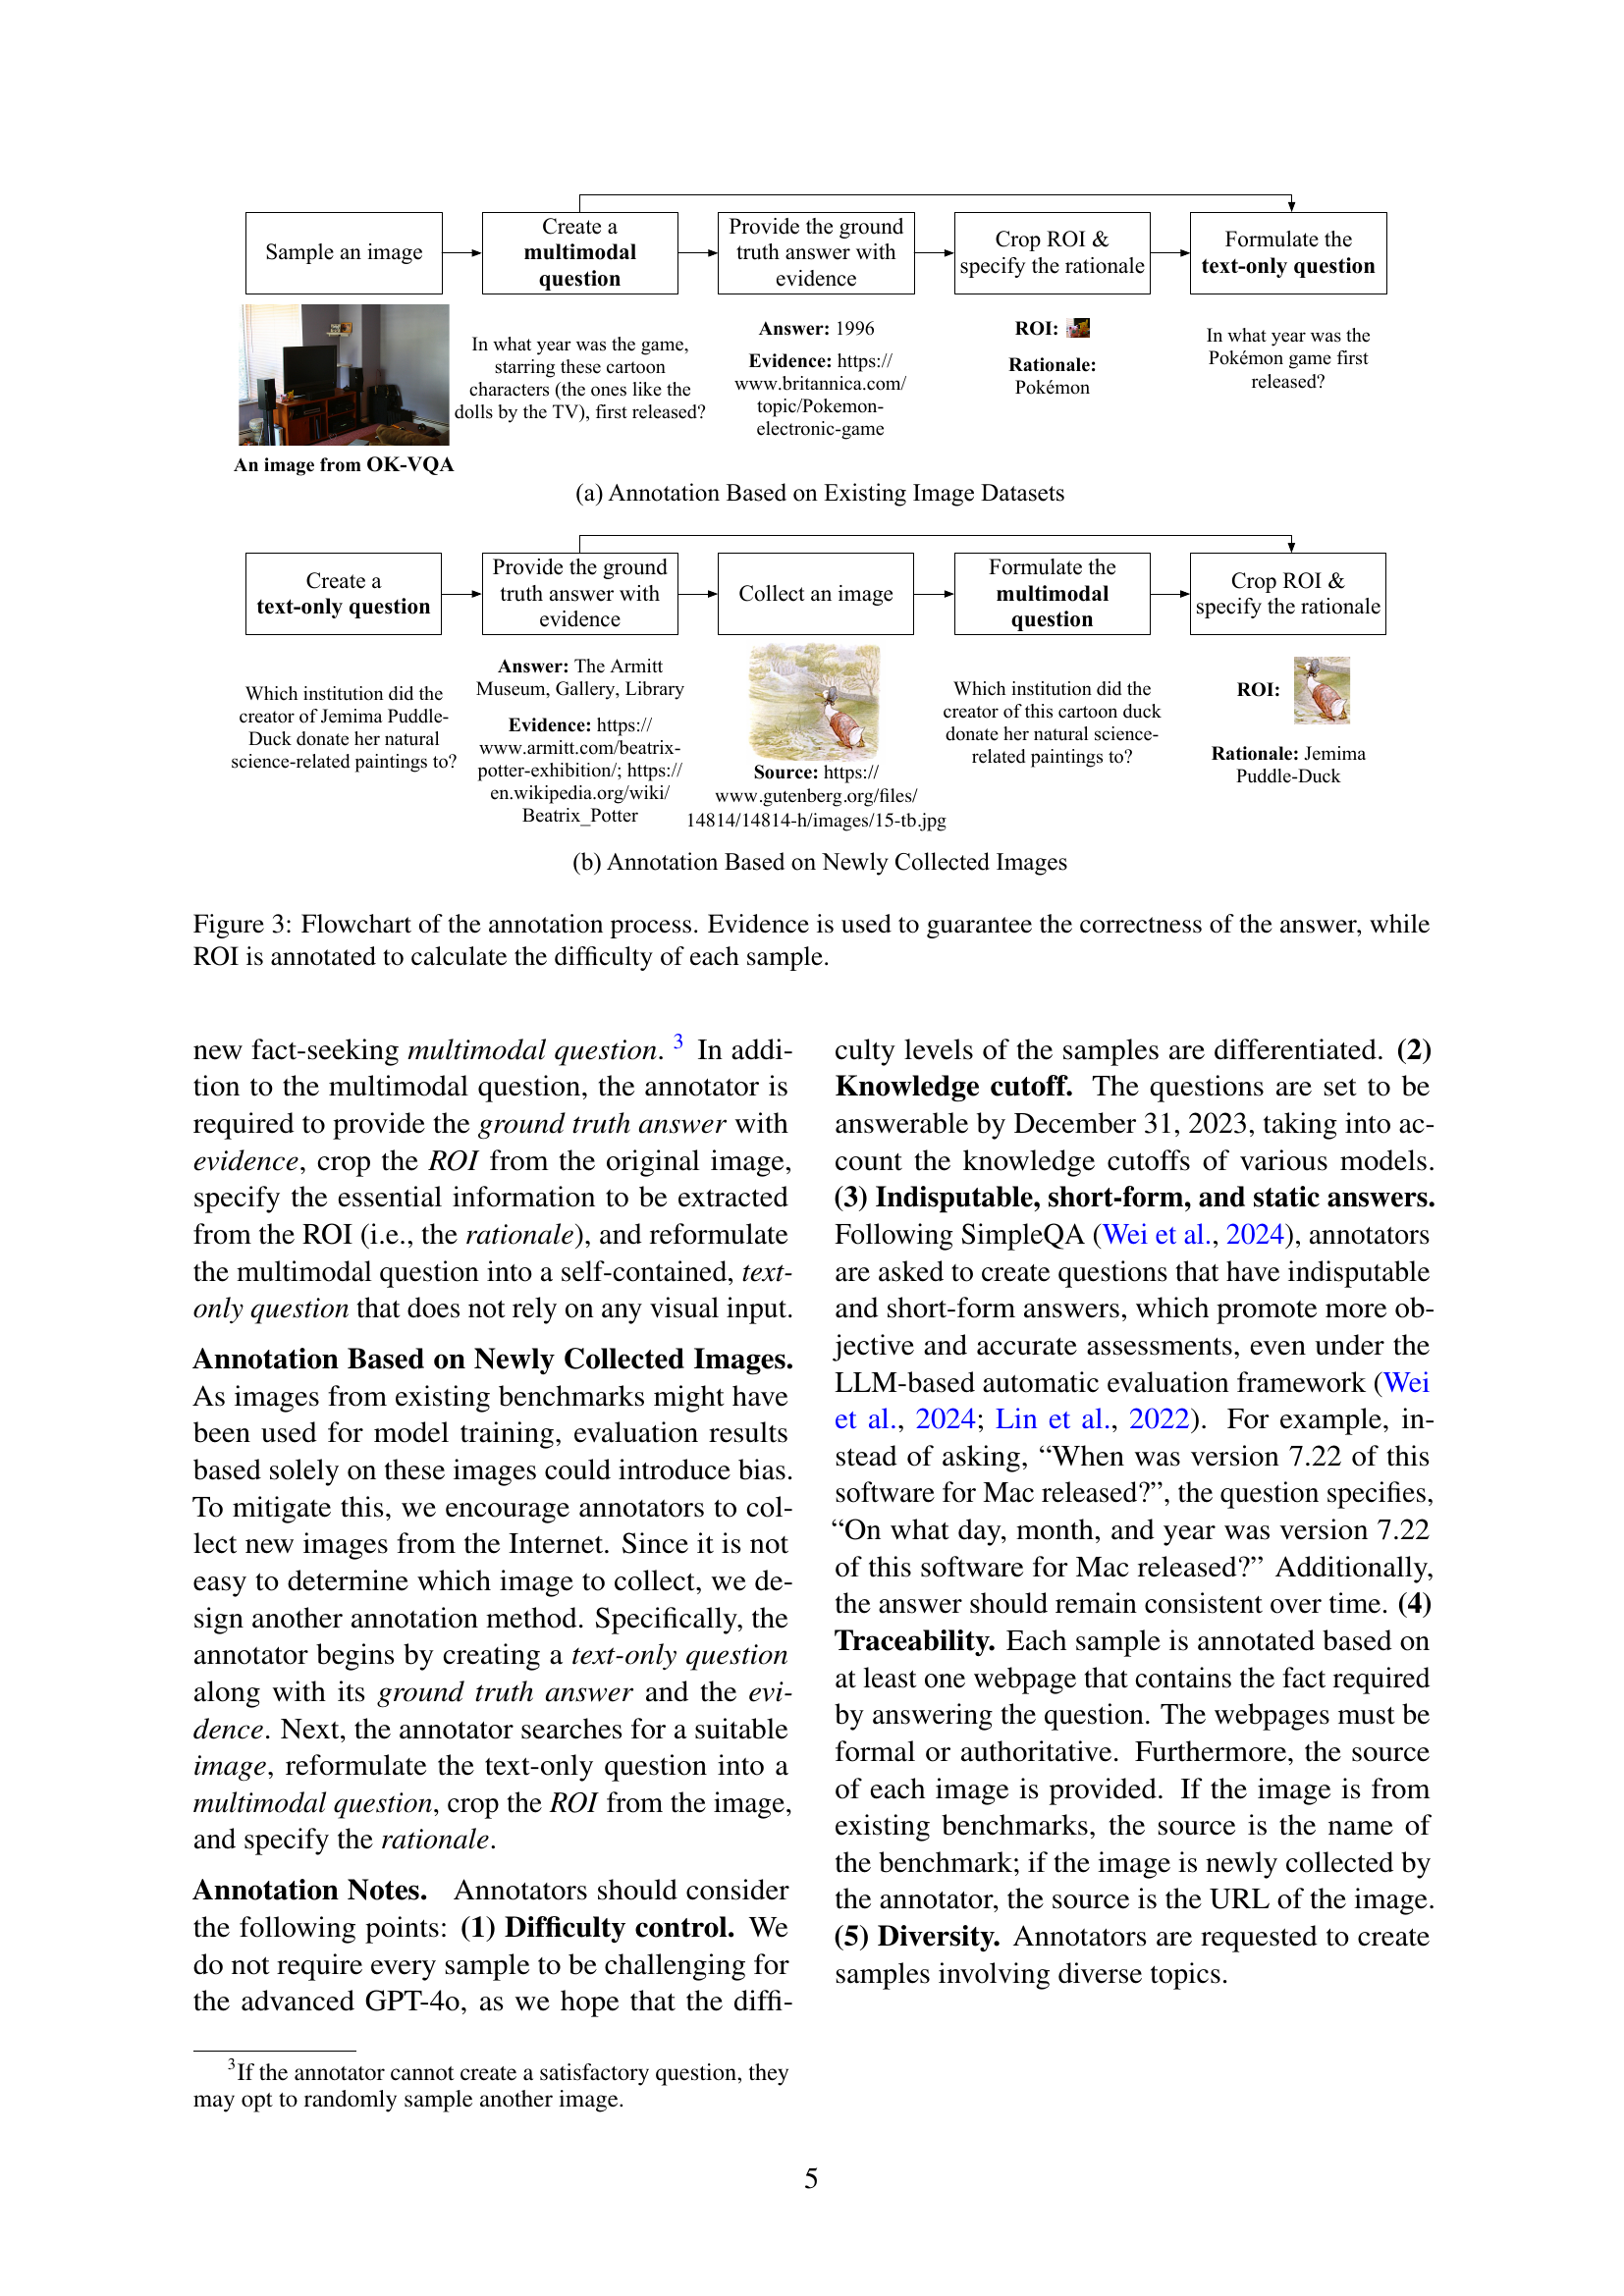
🔼 This flowchart illustrates the two main annotation processes used in creating the VisualSimpleQA dataset. The first process starts with existing image datasets (like OK-VQA or V*), where annotators create multimodal questions based on the image, provide the ground truth answer with evidence, specify the region of interest (ROI) and its rationale (the key information needed to answer the question), and formulate a corresponding text-only question. The second process begins with creating a text-only question, finding a suitable image online, and then following the same steps as the first process to complete the annotation for the multimodal question. Both processes ensure that the answers are accurate and verifiable, and that difficulty is carefully considered through the selection of images and the definition of the ROI and rationale.
read the caption
Figure 3: Flowchart of the annotation process. Evidence is used to guarantee the correctness of the answer, while ROI is annotated to calculate the difficulty of each sample.

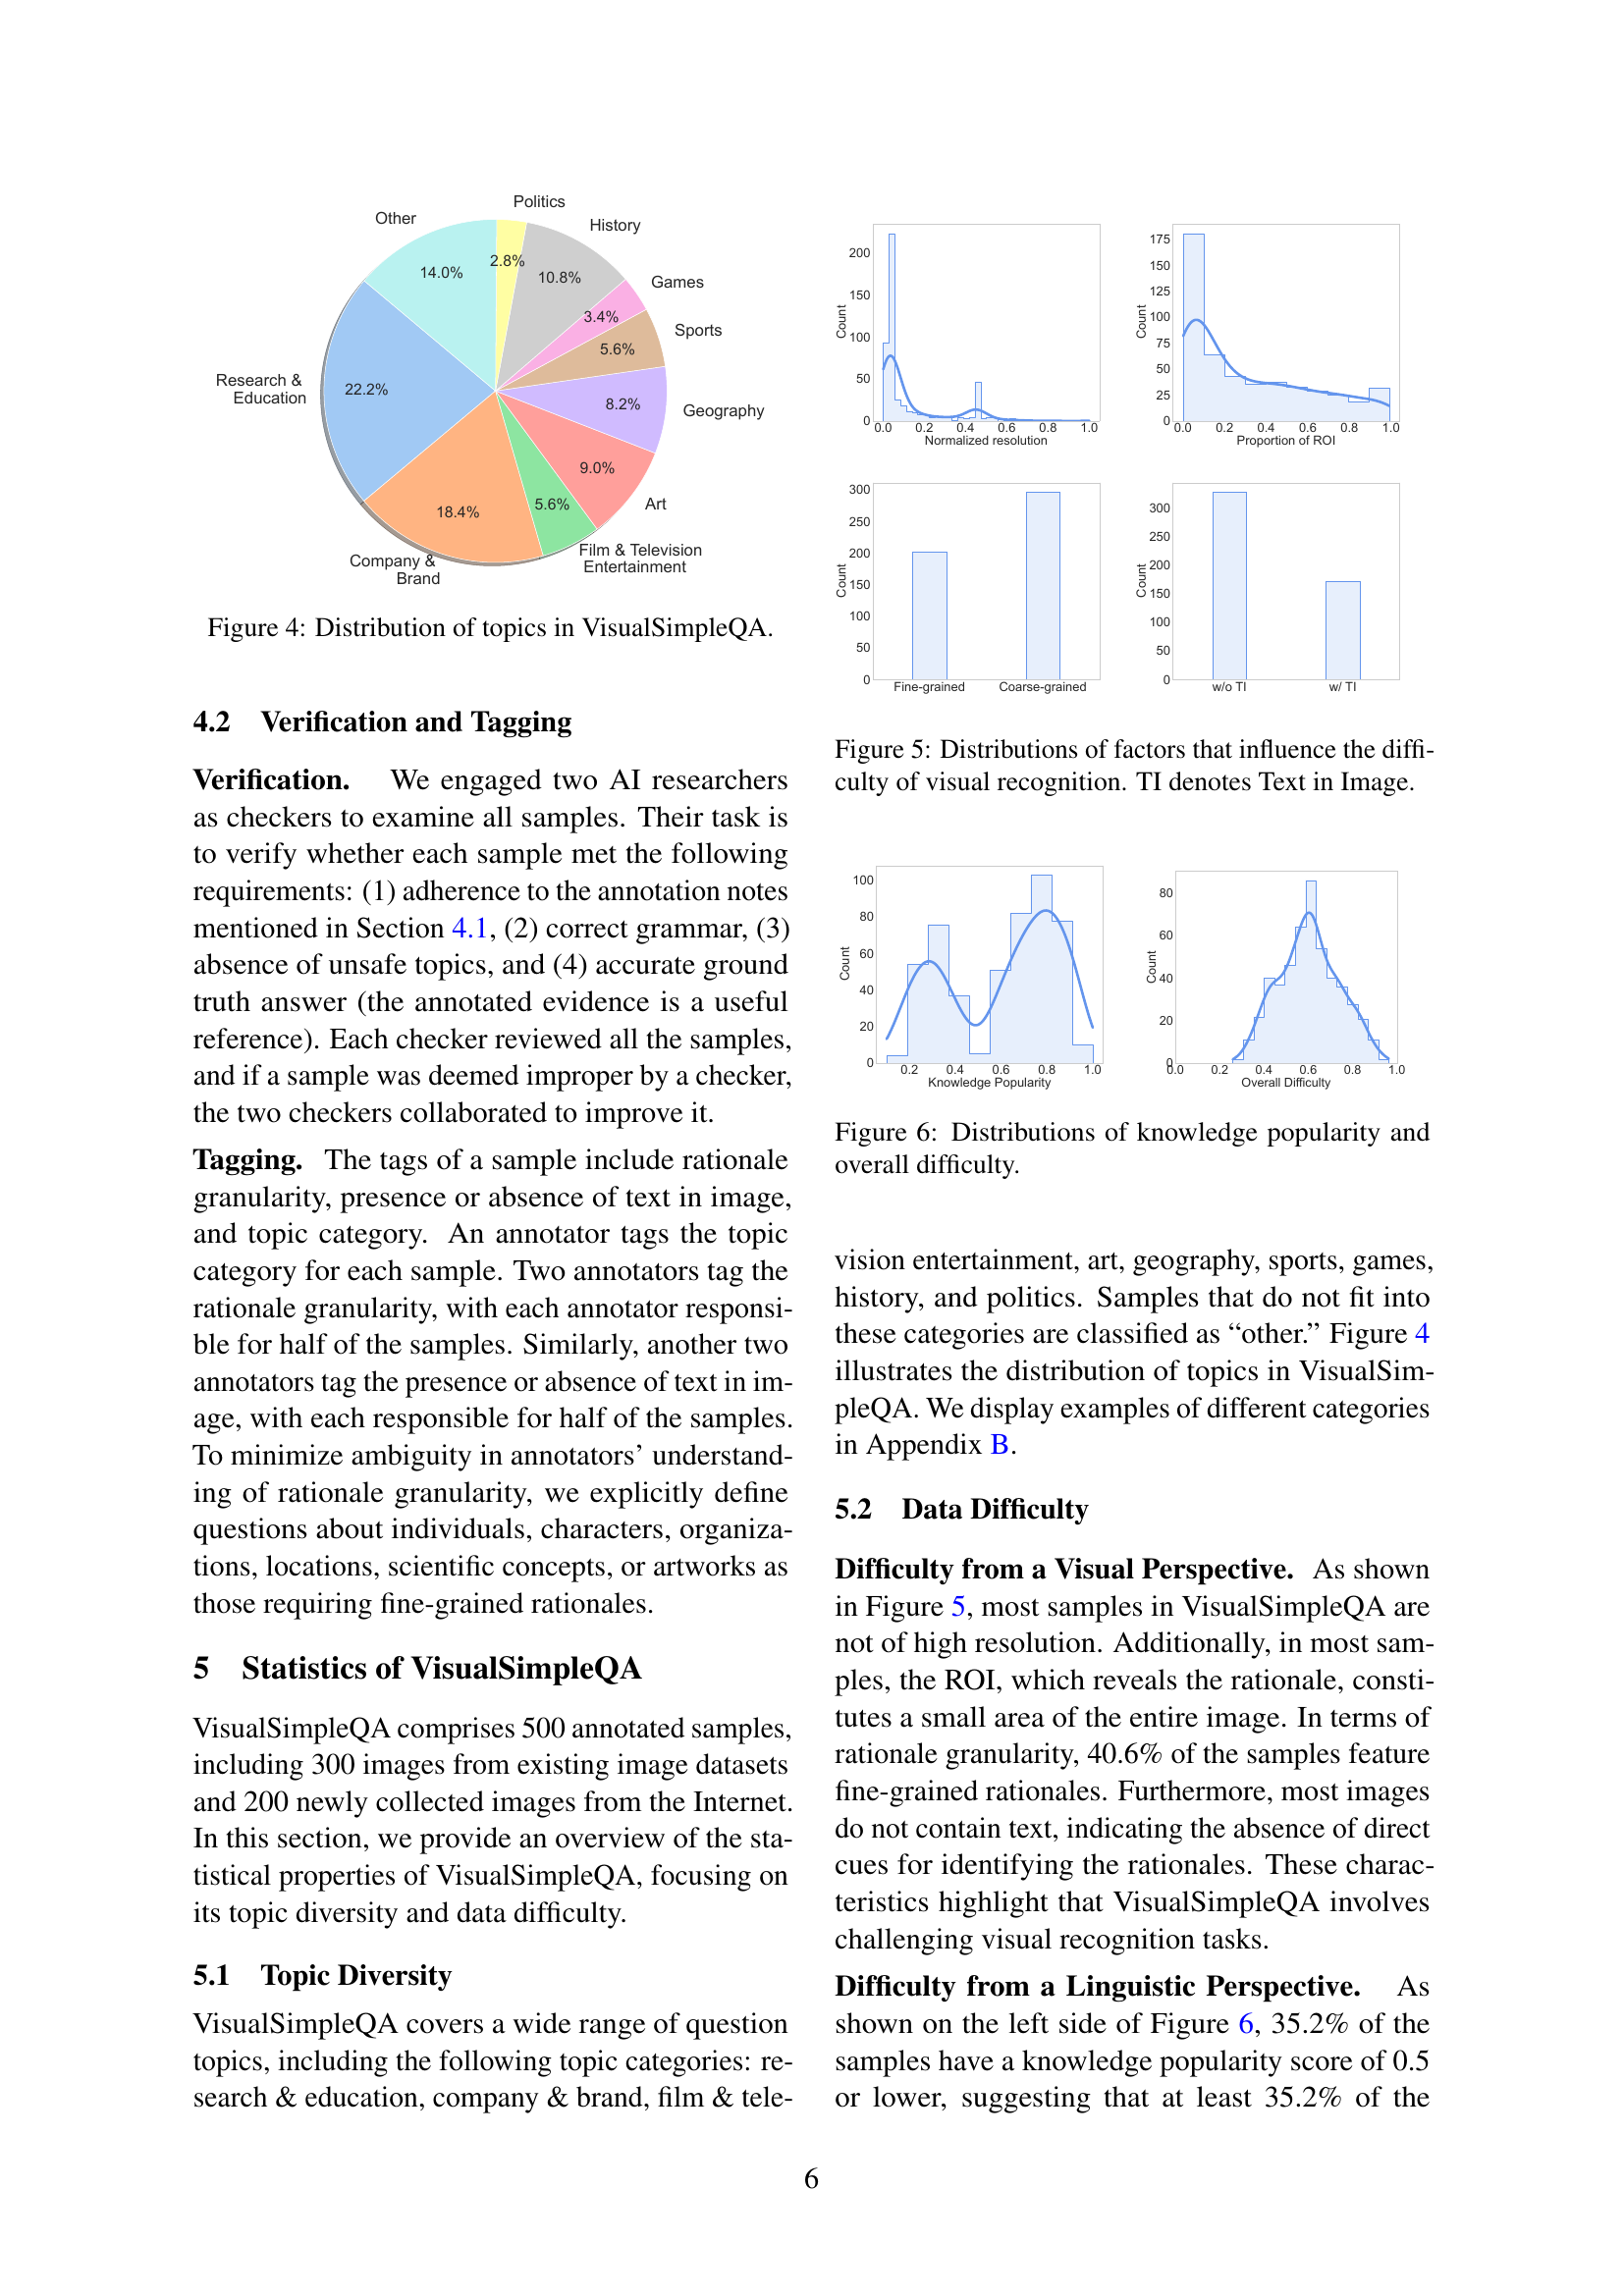
🔼 This figure shows a pie chart that visualizes the distribution of topics in the VisualSimpleQA dataset. Each slice represents a different category of question topics, with its size proportional to the percentage of questions belonging to that category. The categories are Research & Education, Company & Brand, Film & Television Entertainment, Politics, History, Geography, Art, Sports, Games, and Other. This provides a visual representation of the diversity of topics covered in the benchmark dataset.
read the caption
Figure 4: Distribution of topics in VisualSimpleQA.

🔼 Figure 5 presents four subfigures, each showing the distribution of a factor influencing visual recognition difficulty in the VisualSimpleQA dataset. The top row displays histograms for Normalized Resolution, Proportion of ROI, and the presence or absence of text within the image (TI). The bottom row presents a histogram showing the distribution of Rationale Granularity. These visualizations illustrate the frequency of different values for each feature, providing insight into how these elements contribute to a sample’s visual difficulty level.
read the caption
Figure 5: Distributions of factors that influence the difficulty of visual recognition. TI denotes Text in Image.

🔼 This figure presents two histograms visualizing the distributions of knowledge popularity and overall difficulty scores within the VisualSimpleQA dataset. The knowledge popularity score, determined by GPT-40, reflects the prevalence of the required knowledge in large language model training corpora (with higher scores indicating higher popularity). The overall difficulty score combines visual and linguistic factors, quantifying the challenge of each question for large vision-language models. The histograms show the frequency of different score ranges for both metrics, allowing for analysis of the dataset’s balance between easier and harder questions.
read the caption
Figure 6: Distributions of knowledge popularity and overall difficulty.

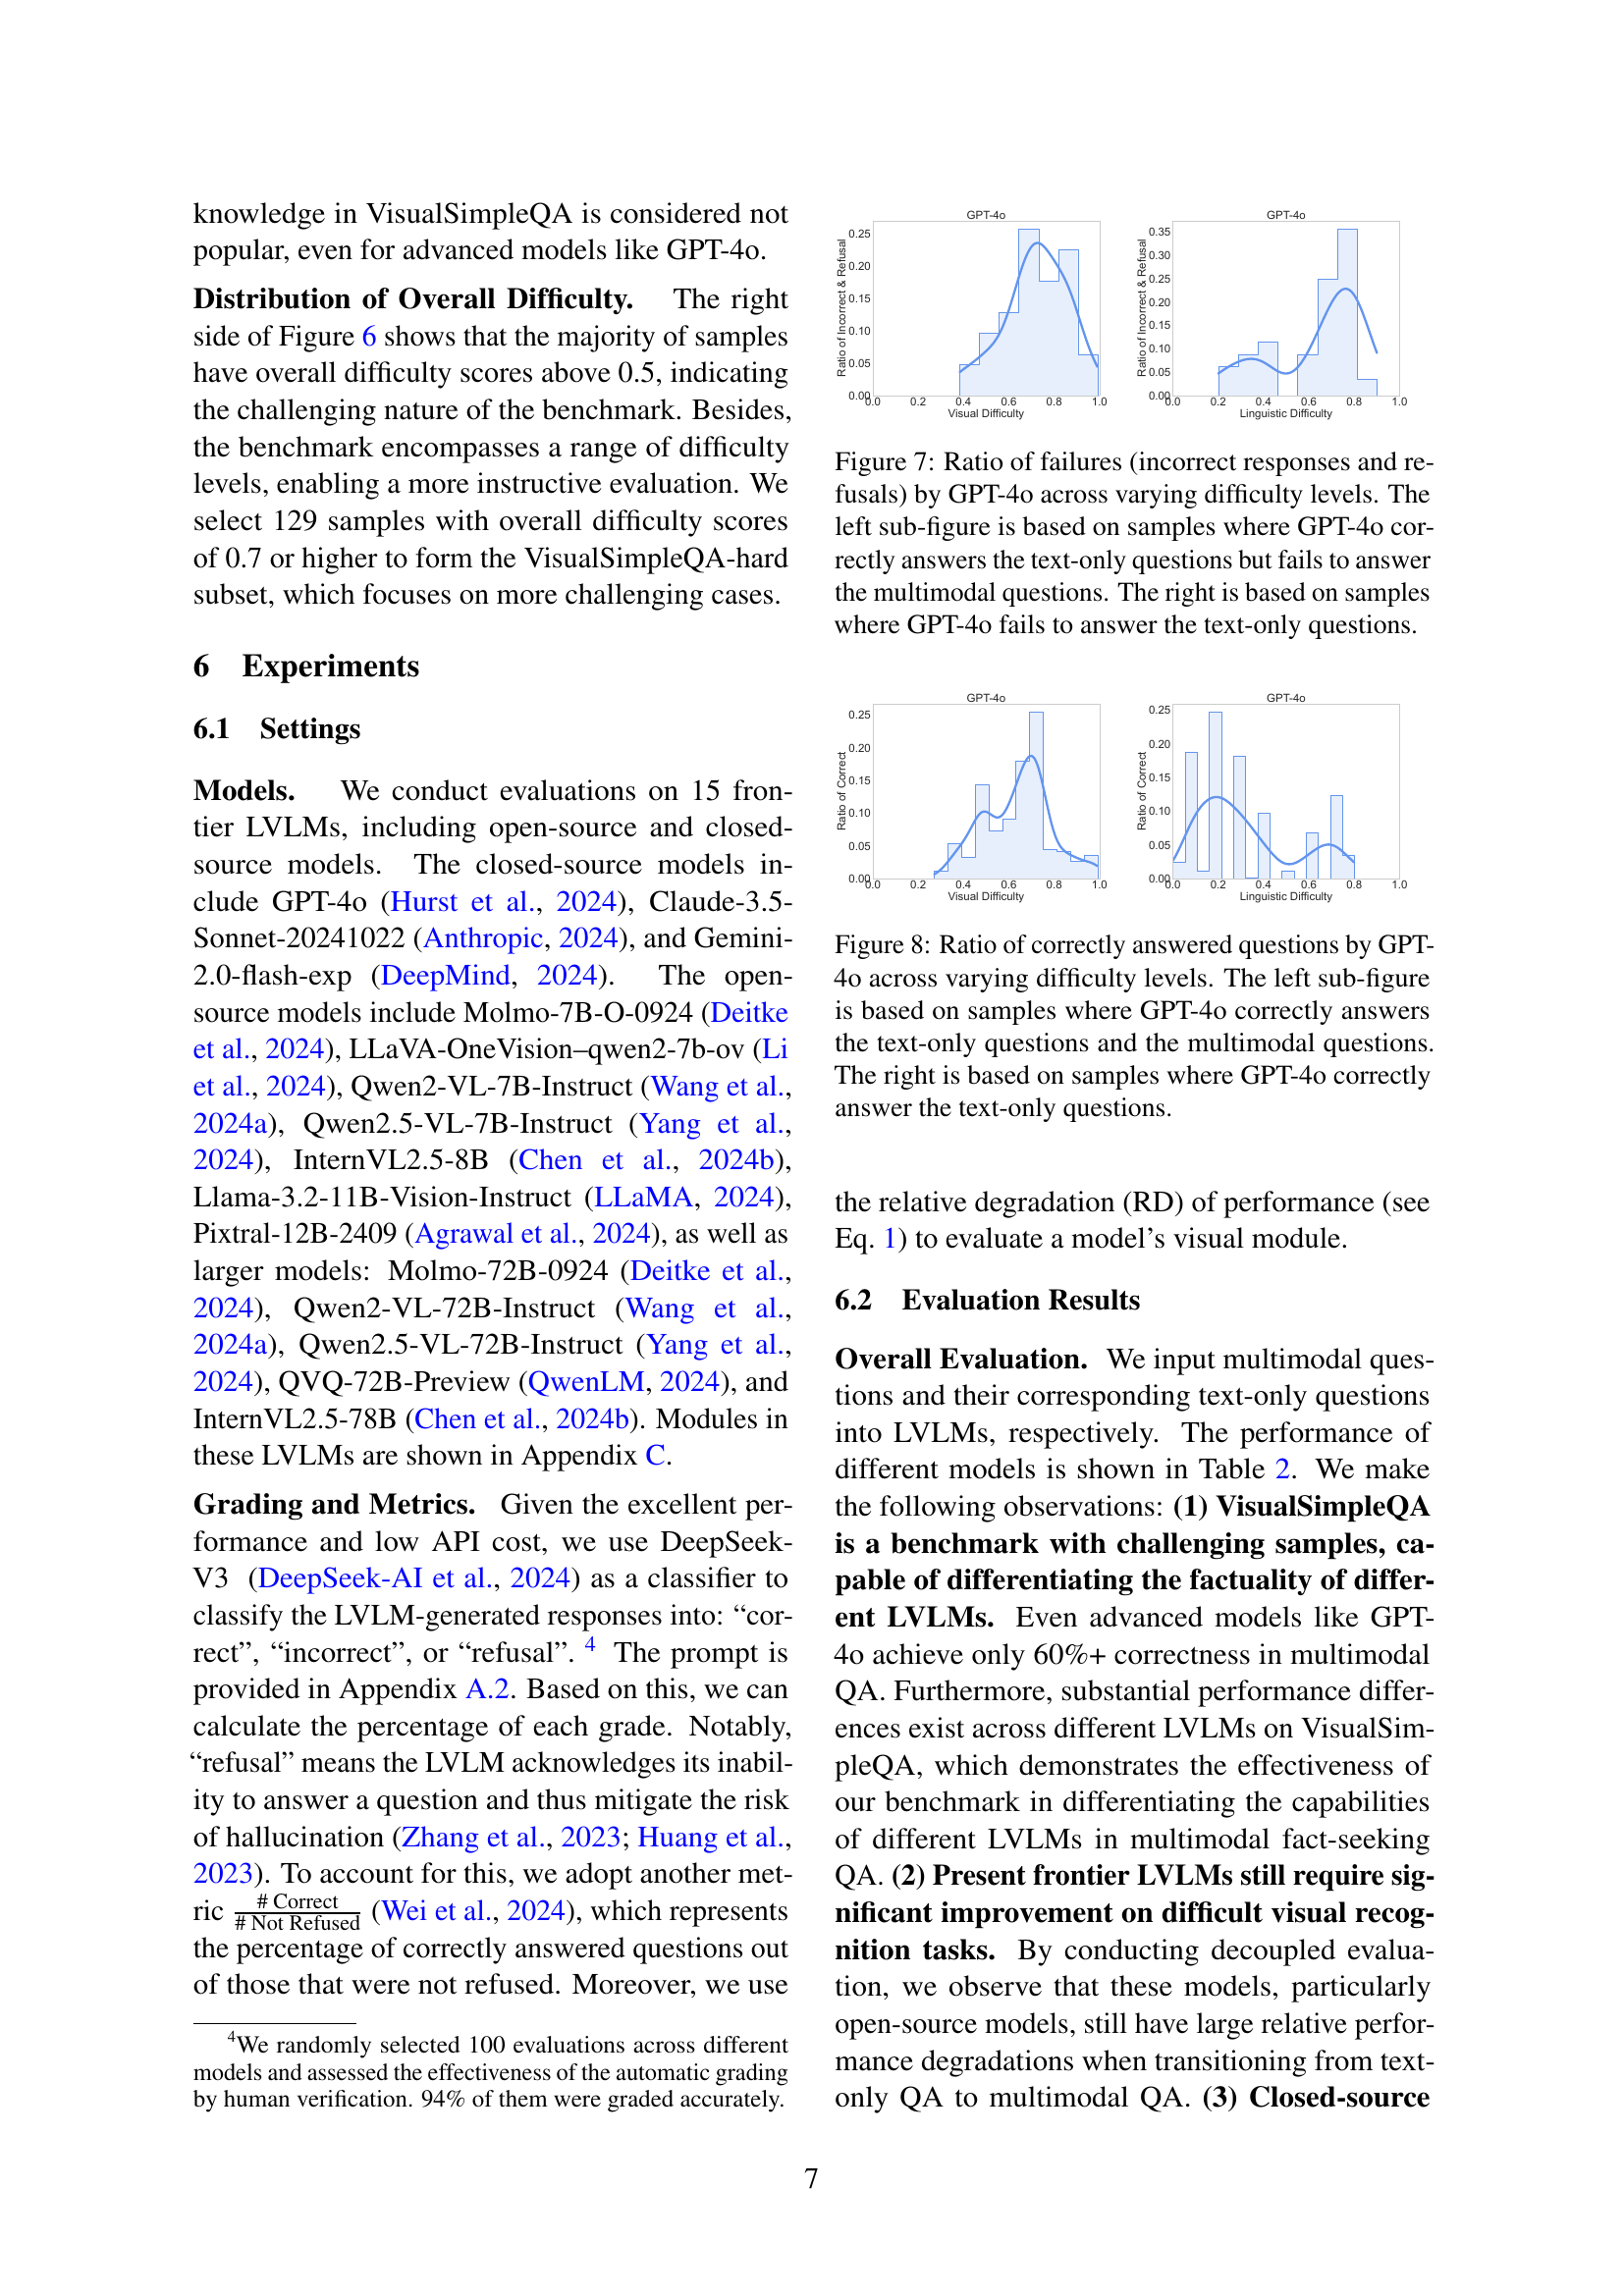
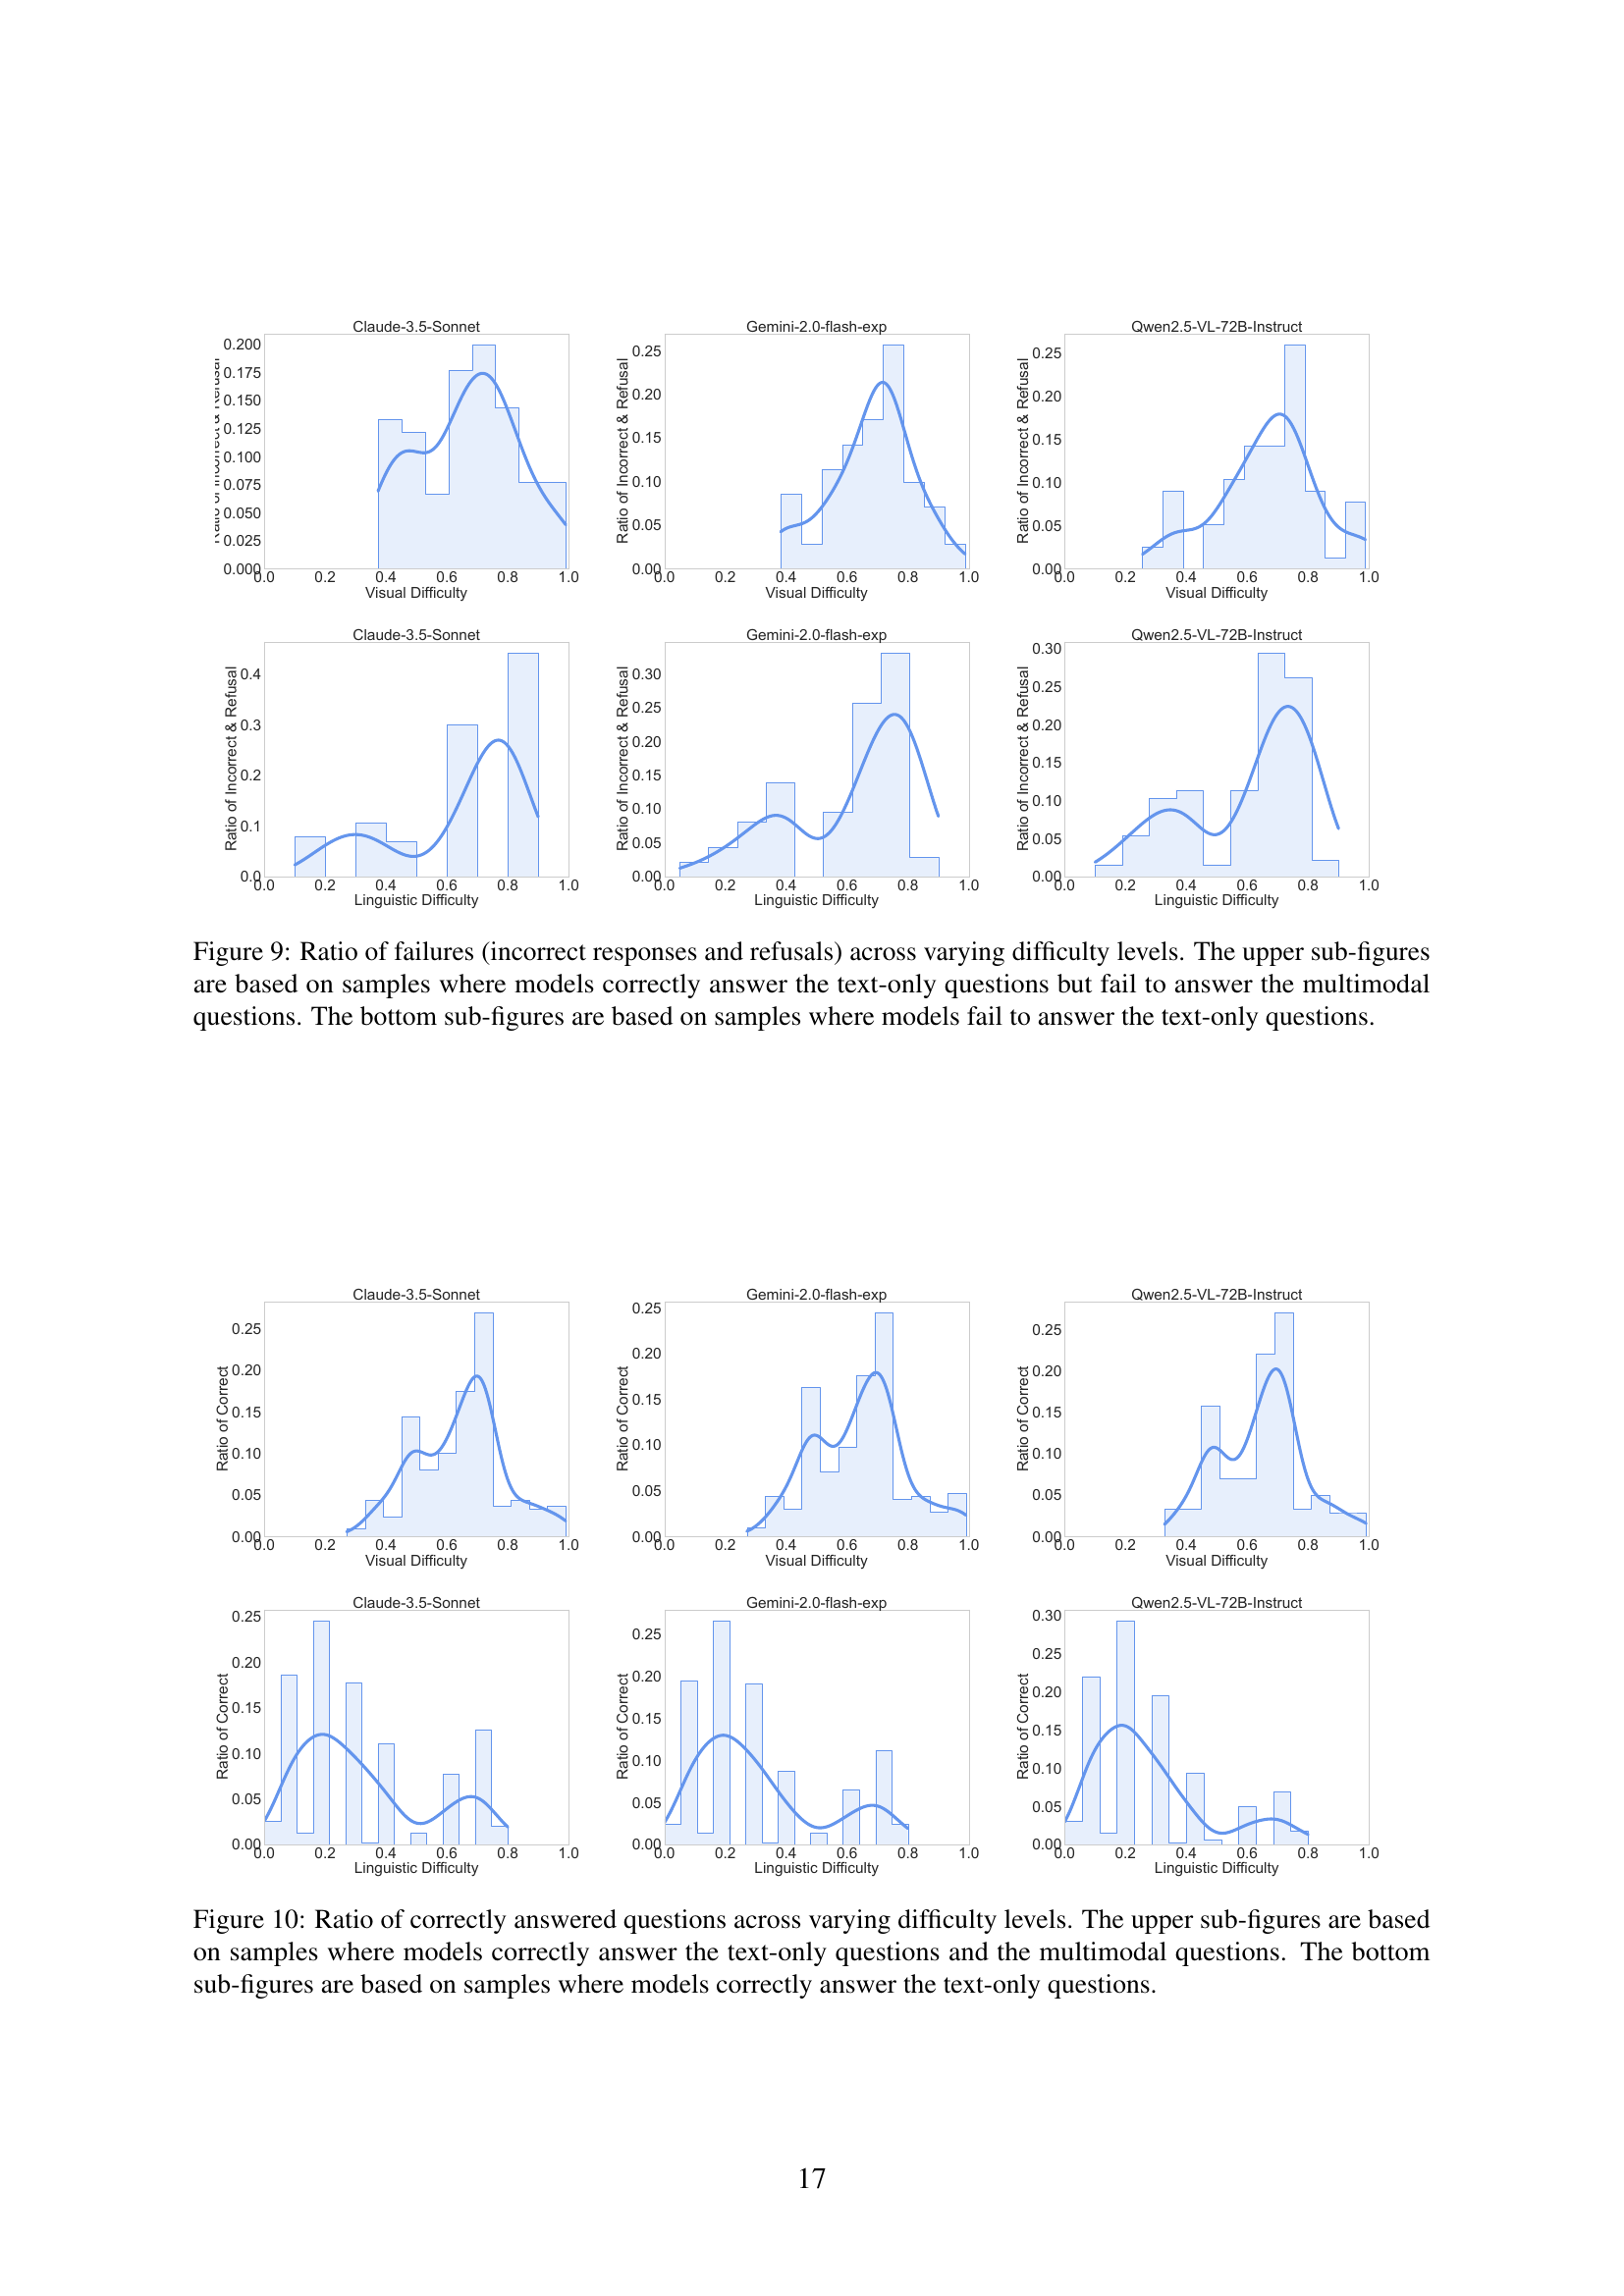
🔼 This figure displays the ratio of failed responses (incorrect answers and refusals) given by the GPT-40 model across different difficulty levels. The left graph focuses on instances where GPT-40 successfully answered the text-only question but failed on the multimodal question. This helps isolate the impact of visual information processing on the model’s accuracy. The right graph examines cases where GPT-40 failed at the text-only question, indicating limitations in the model’s linguistic understanding, regardless of the visual component.
read the caption
Figure 7: Ratio of failures (incorrect responses and refusals) by GPT-4o across varying difficulty levels. The left sub-figure is based on samples where GPT-4o correctly answers the text-only questions but fails to answer the multimodal questions. The right is based on samples where GPT-4o fails to answer the text-only questions.
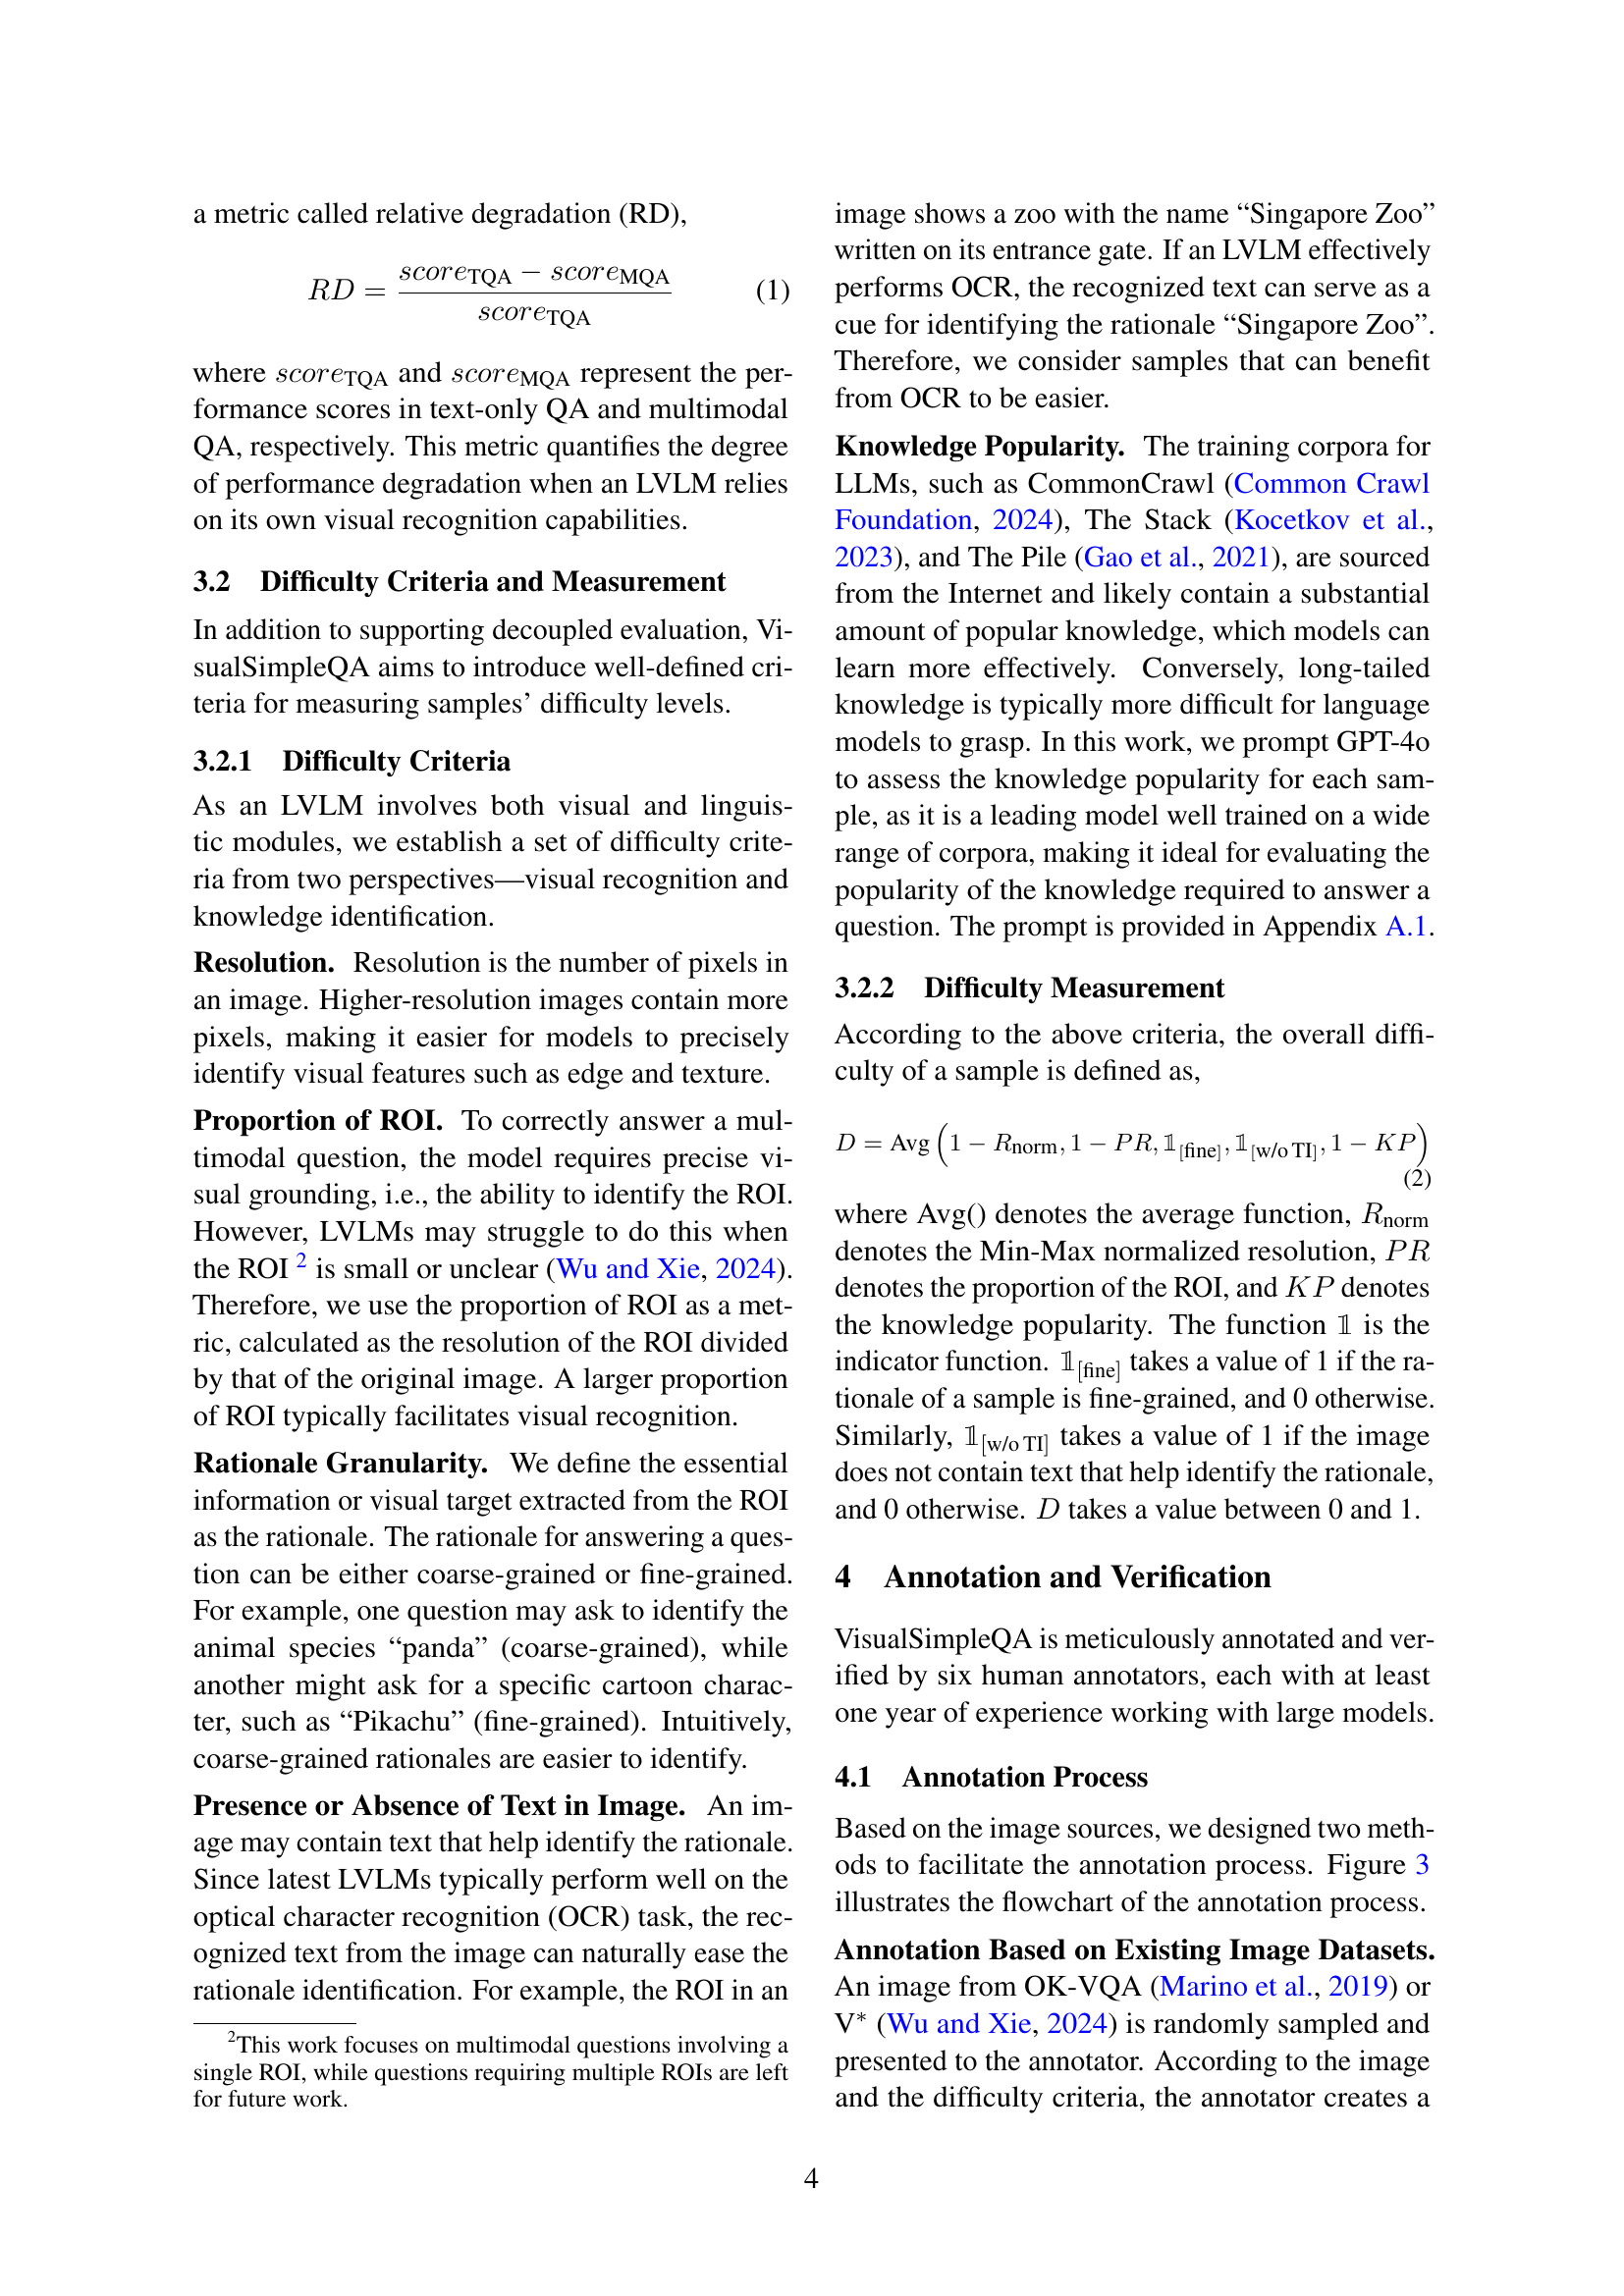
More on tables
| Text-only QA | Multimodal QA | ||||||||
| Correct | Incorrect | Refusal | Correct | Incorrect | Refusal | RD | |||
| GPT-4o | 77.6 | 22.4 | 0.0 | 77.6 | 67.6 | 29.4 | 3.0 | 69.7 | 12.9 |
| Claude-3.5-Sonnet-20241022 | 77.4 | 15.0 | 7.6 | 83.8 | 61.4 | 26.0 | 12.6 | 70.3 | 20.7 |
| Gemini-2.0-flash-exp | 72.8 | 27.0 | 0.2 | 72.9 | 64.0 | 30.8 | 5.2 | 67.5 | 12.1 |
| LLaVA-OneVision-qwen2-7b-ov | 43.2 | 56.8 | 0.0 | 43.2 | 24.8 | 61.0 | 14.2 | 28.9 | 42.6 |
| Molmo-7B-O-0924 | 42.4 | 57.6 | 0.0 | 42.4 | 32.4 | 66.8 | 0.8 | 32.7 | 23.6 |
| Qwen2-VL-7B-Instruct | 51.0 | 43.2 | 5.8 | 54.1 | 32.2 | 64.4 | 3.4 | 33.3 | 36.9 |
| Qwen2.5-VL-7B-Instruct | 48.6 | 50.8 | 0.6 | 48.9 | 38.4 | 54.0 | 7.6 | 41.6 | 21.0 |
| InternVL2.5-8B | 37.2 | 53.6 | 9.2 | 41.0 | 26.8 | 66.4 | 6.8 | 28.8 | 28.0 |
| Llama-3.2-11B-Vision-Instruct | 50.0 | 24.0 | 26.0 | 67.6 | 40.8 | 45.4 | 13.8 | 47.3 | 18.4 |
| Pixtral-12B-2409 | 53.2 | 44.6 | 2.2 | 54.4 | 34.6 | 63.4 | 2.0 | 35.3 | 35.0 |
| Molmo-72B-0924 | 64.4 | 35.6 | 0.0 | 64.4 | 46.6 | 52.0 | 1.4 | 47.3 | 27.6 |
| Qwen2-VL-72B-Instruct | 62.0 | 31.4 | 6.6 | 66.4 | 37.0 | 59.6 | 3.4 | 38.3 | 40.3 |
| Qwen2.5-VL-72B-Instruct | 63.4 | 30.8 | 5.8 | 67.3 | 51.2 | 42.8 | 6.0 | 54.5 | 19.2 |
| QVQ-72B-Preview | 42.2 | 13.0 | 44.8 | 76.4 | 46.2 | 53.6 | 0.2 | 46.3 | – |
| InternVL2.5-78B | 52.4 | 40.8 | 6.8 | 56.2 | 37.4 | 50.8 | 11.8 | 42.4 | 28.6 |
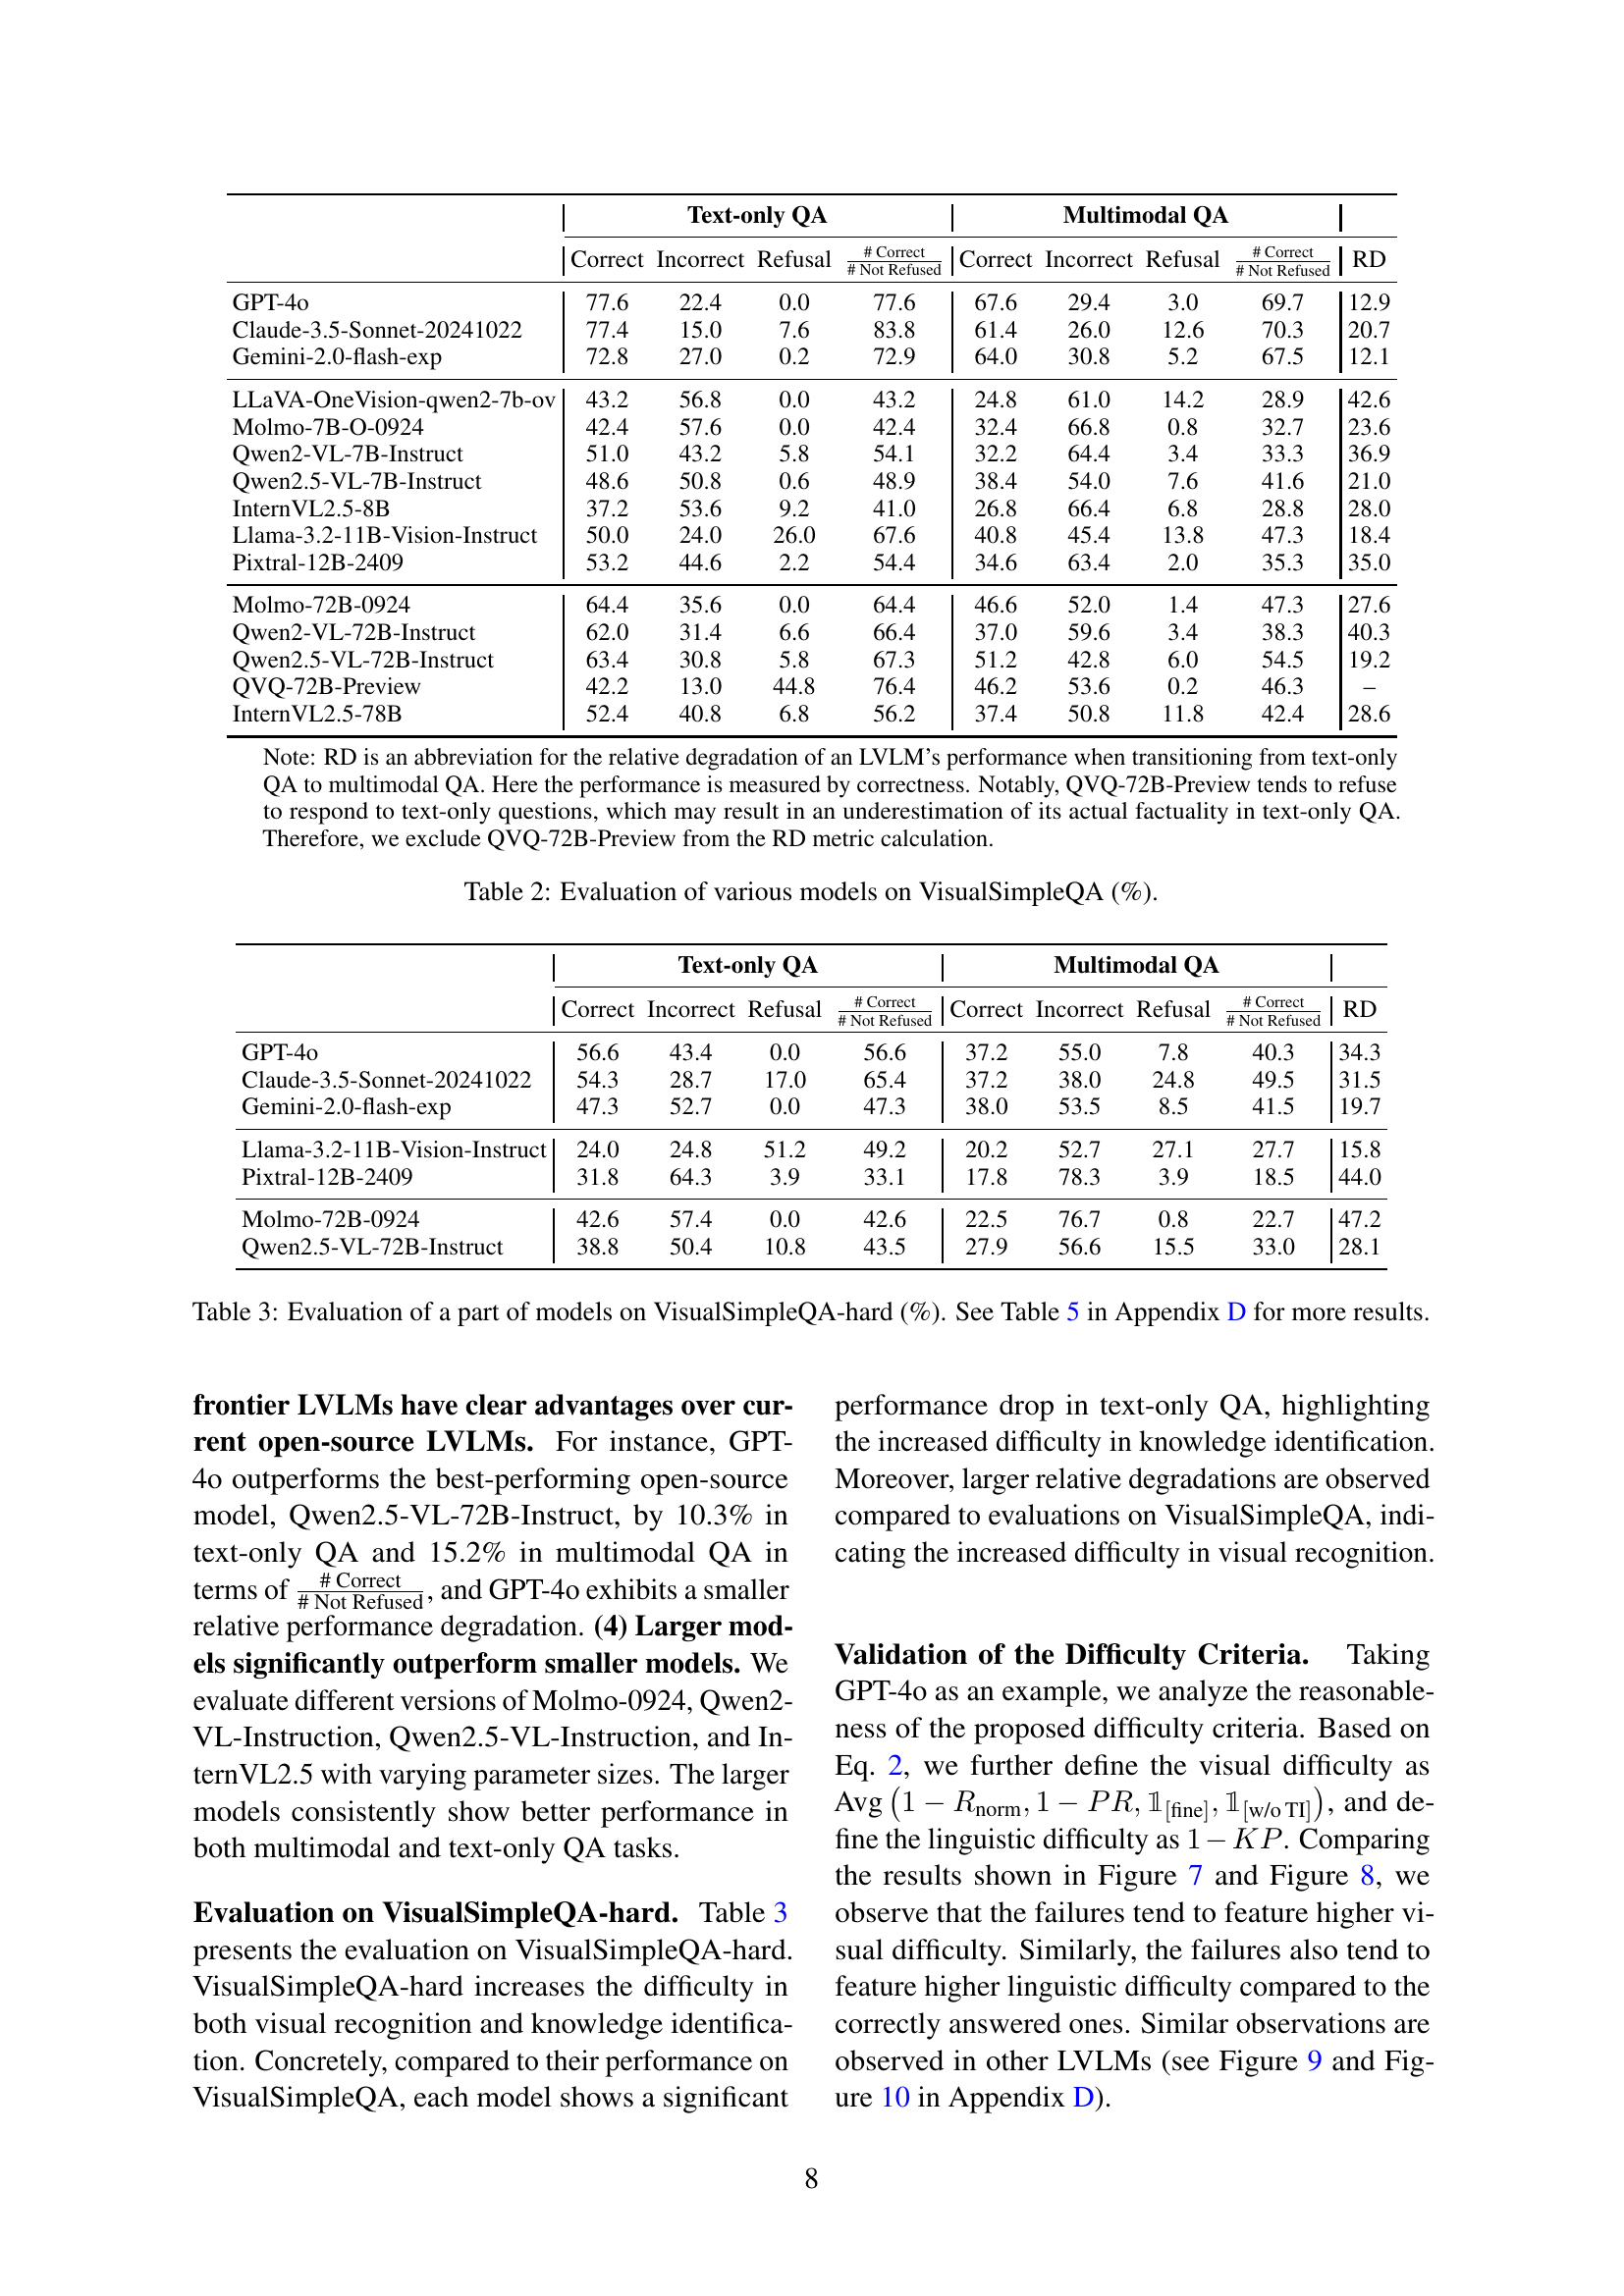
🔼 This table presents the results of evaluating 15 different large vision-language models (LVLMs) on the VisualSimpleQA benchmark. The models are categorized as either open-source or closed-source. For each model, the table shows its performance on both text-only and multimodal question answering tasks, reporting the percentage of correct, incorrect, and refused responses. It also includes the number of correctly answered questions out of those not refused, and the relative degradation (RD) in performance when transitioning from text-only to multimodal questions. The RD metric helps evaluate the effectiveness of the visual module in each LVLM.
read the caption
Table 2: Evaluation of various models on VisualSimpleQA (%).
| Text-only QA | Multimodal QA | ||||||||
| Correct | Incorrect | Refusal | Correct | Incorrect | Refusal | RD | |||
| GPT-4o | 56.6 | 43.4 | 0.0 | 56.6 | 37.2 | 55.0 | 7.8 | 40.3 | 34.3 |
| Claude-3.5-Sonnet-20241022 | 54.3 | 28.7 | 17.0 | 65.4 | 37.2 | 38.0 | 24.8 | 49.5 | 31.5 |
| Gemini-2.0-flash-exp | 47.3 | 52.7 | 0.0 | 47.3 | 38.0 | 53.5 | 8.5 | 41.5 | 19.7 |
| Llama-3.2-11B-Vision-Instruct | 24.0 | 24.8 | 51.2 | 49.2 | 20.2 | 52.7 | 27.1 | 27.7 | 15.8 |
| Pixtral-12B-2409 | 31.8 | 64.3 | 3.9 | 33.1 | 17.8 | 78.3 | 3.9 | 18.5 | 44.0 |
| Molmo-72B-0924 | 42.6 | 57.4 | 0.0 | 42.6 | 22.5 | 76.7 | 0.8 | 22.7 | 47.2 |
| Qwen2.5-VL-72B-Instruct | 38.8 | 50.4 | 10.8 | 43.5 | 27.9 | 56.6 | 15.5 | 33.0 | 28.1 |
🔼 This table presents the results of evaluating a subset of large vision-language models (LVLMs) on the VisualSimpleQA-hard benchmark. VisualSimpleQA-hard is a more challenging subset of the VisualSimpleQA benchmark, focusing on questions with higher difficulty levels. The evaluation measures the models’ performance in both text-only question answering and multimodal question answering. Specifically, it shows the percentage of correct, incorrect, and refused responses for each model in both settings, as well as the relative degradation (RD) in performance when transitioning from text-only to multimodal questions. This relative degradation highlights the models’ challenges in visual recognition and knowledge integration. Appendix D contains additional results for a more comprehensive evaluation.
read the caption
Table 3: Evaluation of a part of models on VisualSimpleQA-hard (%). See Table 5 in Appendix D for more results.
| Linguistic Module | Visual Module | |
| GPT-4o | unknown | unknown |
| Claude-3.5-Sonnet-20241022 | unknown | unknown |
| Gemini-2.0-flash-exp | unknown | unknown |
| LLaVA-OneVision-qwen2-7b-ov | Qwen2-7B | SigLIP-SO400M |
| Molmo-7B-O-0924 | OLMo-7B-1024-preview | OpenAI’s ViT-L/14 336px |
| Qwen2-VL-7B-Instruct | Qwen2-7B | Qwen2-ViT-675M |
| InternVL2.5-8B | InternLM2.5-7B-Chat | InternViT-300M-448px-V2.5 |
| Qwen2.5-VL-7B-Instruct | Qwen2.5-7B | Qwen2.5-ViT w/ window attention |
| Llama-3.2-11B-Vision-Instruct | Llama-3.1-8B | ViT-H/14 |
| Pixtral-12B-2409 | Mistral-NeMo-12B | Pixtral-ViT-400M |
| Molmo-72B-0924 | Qwen2-72B | OpenAI’s ViT-L/14 336px |
| Qwen2-VL-72B-Instruct | Qwen2-72B | Qwen2-ViT-675M |
| QVQ-72B-Preview | Qwen2-72B | ViT-675M |
| InternVL2.5-78B | Qwen2.5-72B-Instruct | InternViT-6B-448px-V2.5 |
| Qwen2.5-VL-72B-Instruct | Qwen2.5-72B | Qwen2.5-ViT w/ window attention |
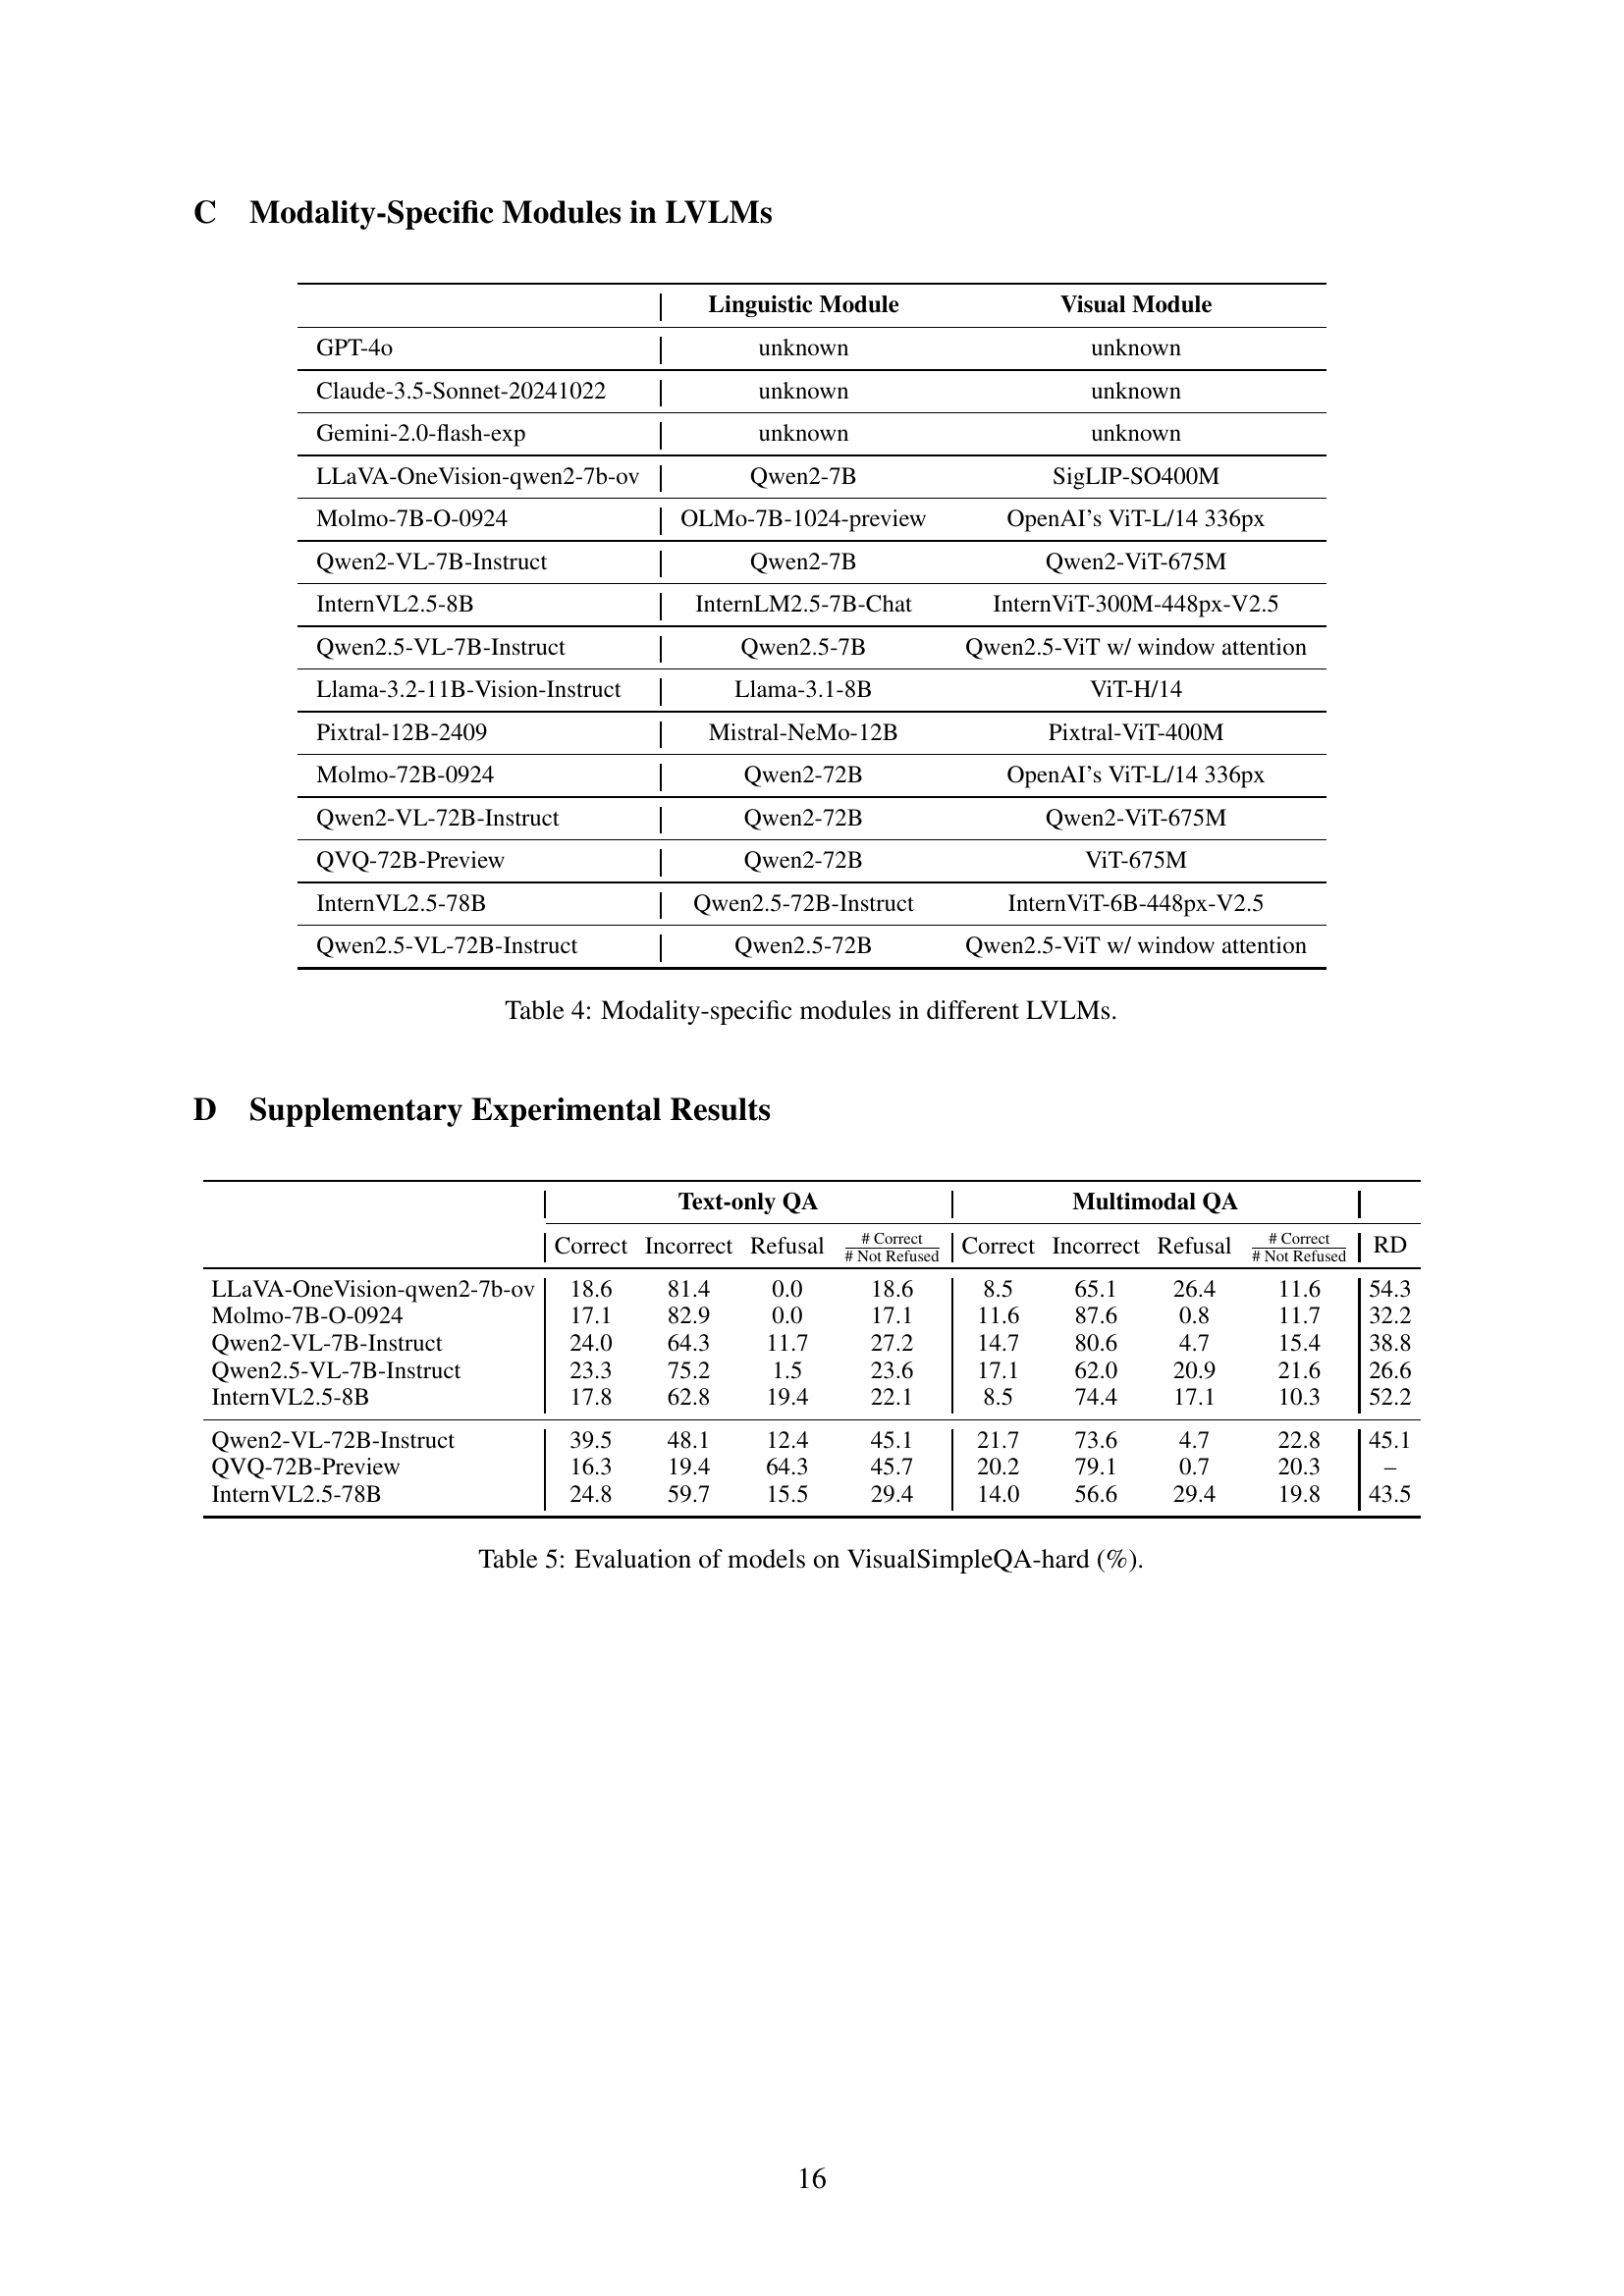
🔼 This table details the specific visual and linguistic modules used in 15 different large vision-language models (LVLMs). For each model, it lists the names of the modules responsible for processing textual and visual information, providing a clear view of the architecture variations across different LVLMs. This is valuable in understanding the strengths and weaknesses of various models and how their architectural choices may impact their performance in multimodal tasks.
read the caption
Table 4: Modality-specific modules in different LVLMs.
| Text-only QA | Multimodal QA | ||||||||
| Correct | Incorrect | Refusal | Correct | Incorrect | Refusal | RD | |||
| LLaVA-OneVision-qwen2-7b-ov | 18.6 | 81.4 | 0.0 | 18.6 | 8.5 | 65.1 | 26.4 | 11.6 | 54.3 |
| Molmo-7B-O-0924 | 17.1 | 82.9 | 0.0 | 17.1 | 11.6 | 87.6 | 0.8 | 11.7 | 32.2 |
| Qwen2-VL-7B-Instruct | 24.0 | 64.3 | 11.7 | 27.2 | 14.7 | 80.6 | 4.7 | 15.4 | 38.8 |
| Qwen2.5-VL-7B-Instruct | 23.3 | 75.2 | 1.5 | 23.6 | 17.1 | 62.0 | 20.9 | 21.6 | 26.6 |
| InternVL2.5-8B | 17.8 | 62.8 | 19.4 | 22.1 | 8.5 | 74.4 | 17.1 | 10.3 | 52.2 |
| Qwen2-VL-72B-Instruct | 39.5 | 48.1 | 12.4 | 45.1 | 21.7 | 73.6 | 4.7 | 22.8 | 45.1 |
| QVQ-72B-Preview | 16.3 | 19.4 | 64.3 | 45.7 | 20.2 | 79.1 | 0.7 | 20.3 | – |
| InternVL2.5-78B | 24.8 | 59.7 | 15.5 | 29.4 | 14.0 | 56.6 | 29.4 | 19.8 | 43.5 |
🔼 This table presents the performance of 15 large vision-language models (LVLMs) on the VisualSimpleQA-hard benchmark. VisualSimpleQA-hard is a subset of the VisualSimpleQA benchmark containing particularly challenging samples for evaluating fact-seeking QA capabilities. The table shows the models’ performance in terms of correctness, and refusal rates, for both text-only questions (TQA) and multimodal questions (MQA). Additionally, the table includes the relative degradation (RD) metric which quantifies the difference in performance between text-only and multimodal questions, highlighting the models’ visual reasoning capabilities. The results reveal that even state-of-the-art models struggle with the challenging samples in VisualSimpleQA-hard.
read the caption
Table 5: Evaluation of models on VisualSimpleQA-hard (%).
Full paper#