TL;DR#
Accelerating diffusion model sampling is vital for AIGC. Existing methods based on distribution matching or trajectory matching face limitations: distribution matching lacks flexibility for multi-step sampling, while trajectory matching yields suboptimal image quality. Few-step generation strikes a better balance between speed and image quality, but existing approaches face a persistent trade-off. To improve the current SOTA, this paper proposes learning few-step diffusion models by Trajectory Distribution Matching.
The paper introduces Trajectory Distribution Matching (TDM), a novel framework combining trajectory distillation and distribution matching. TDM aligns the student’s trajectory with the teacher’s at the distribution level using a data-free score distillation objective. It supports deterministic sampling for superior image quality and flexible multi-step adaptation. TDM outperforms existing methods on backbones like SDXL and PixArt-a. Notably, TDM can outperform its teacher model (CogVideoX-2B) by using only 4 NFE on VBench.
Key Takeaways#
Why does it matter?#
This research significantly reduces the cost of diffusion model training, enabling faster AIGC deployment. It offers a new way to combine trajectory distillation and distribution matching, setting a new standard for efficiency and performance in few-step generation and potentially reshaping future research directions.
Visual Insights#

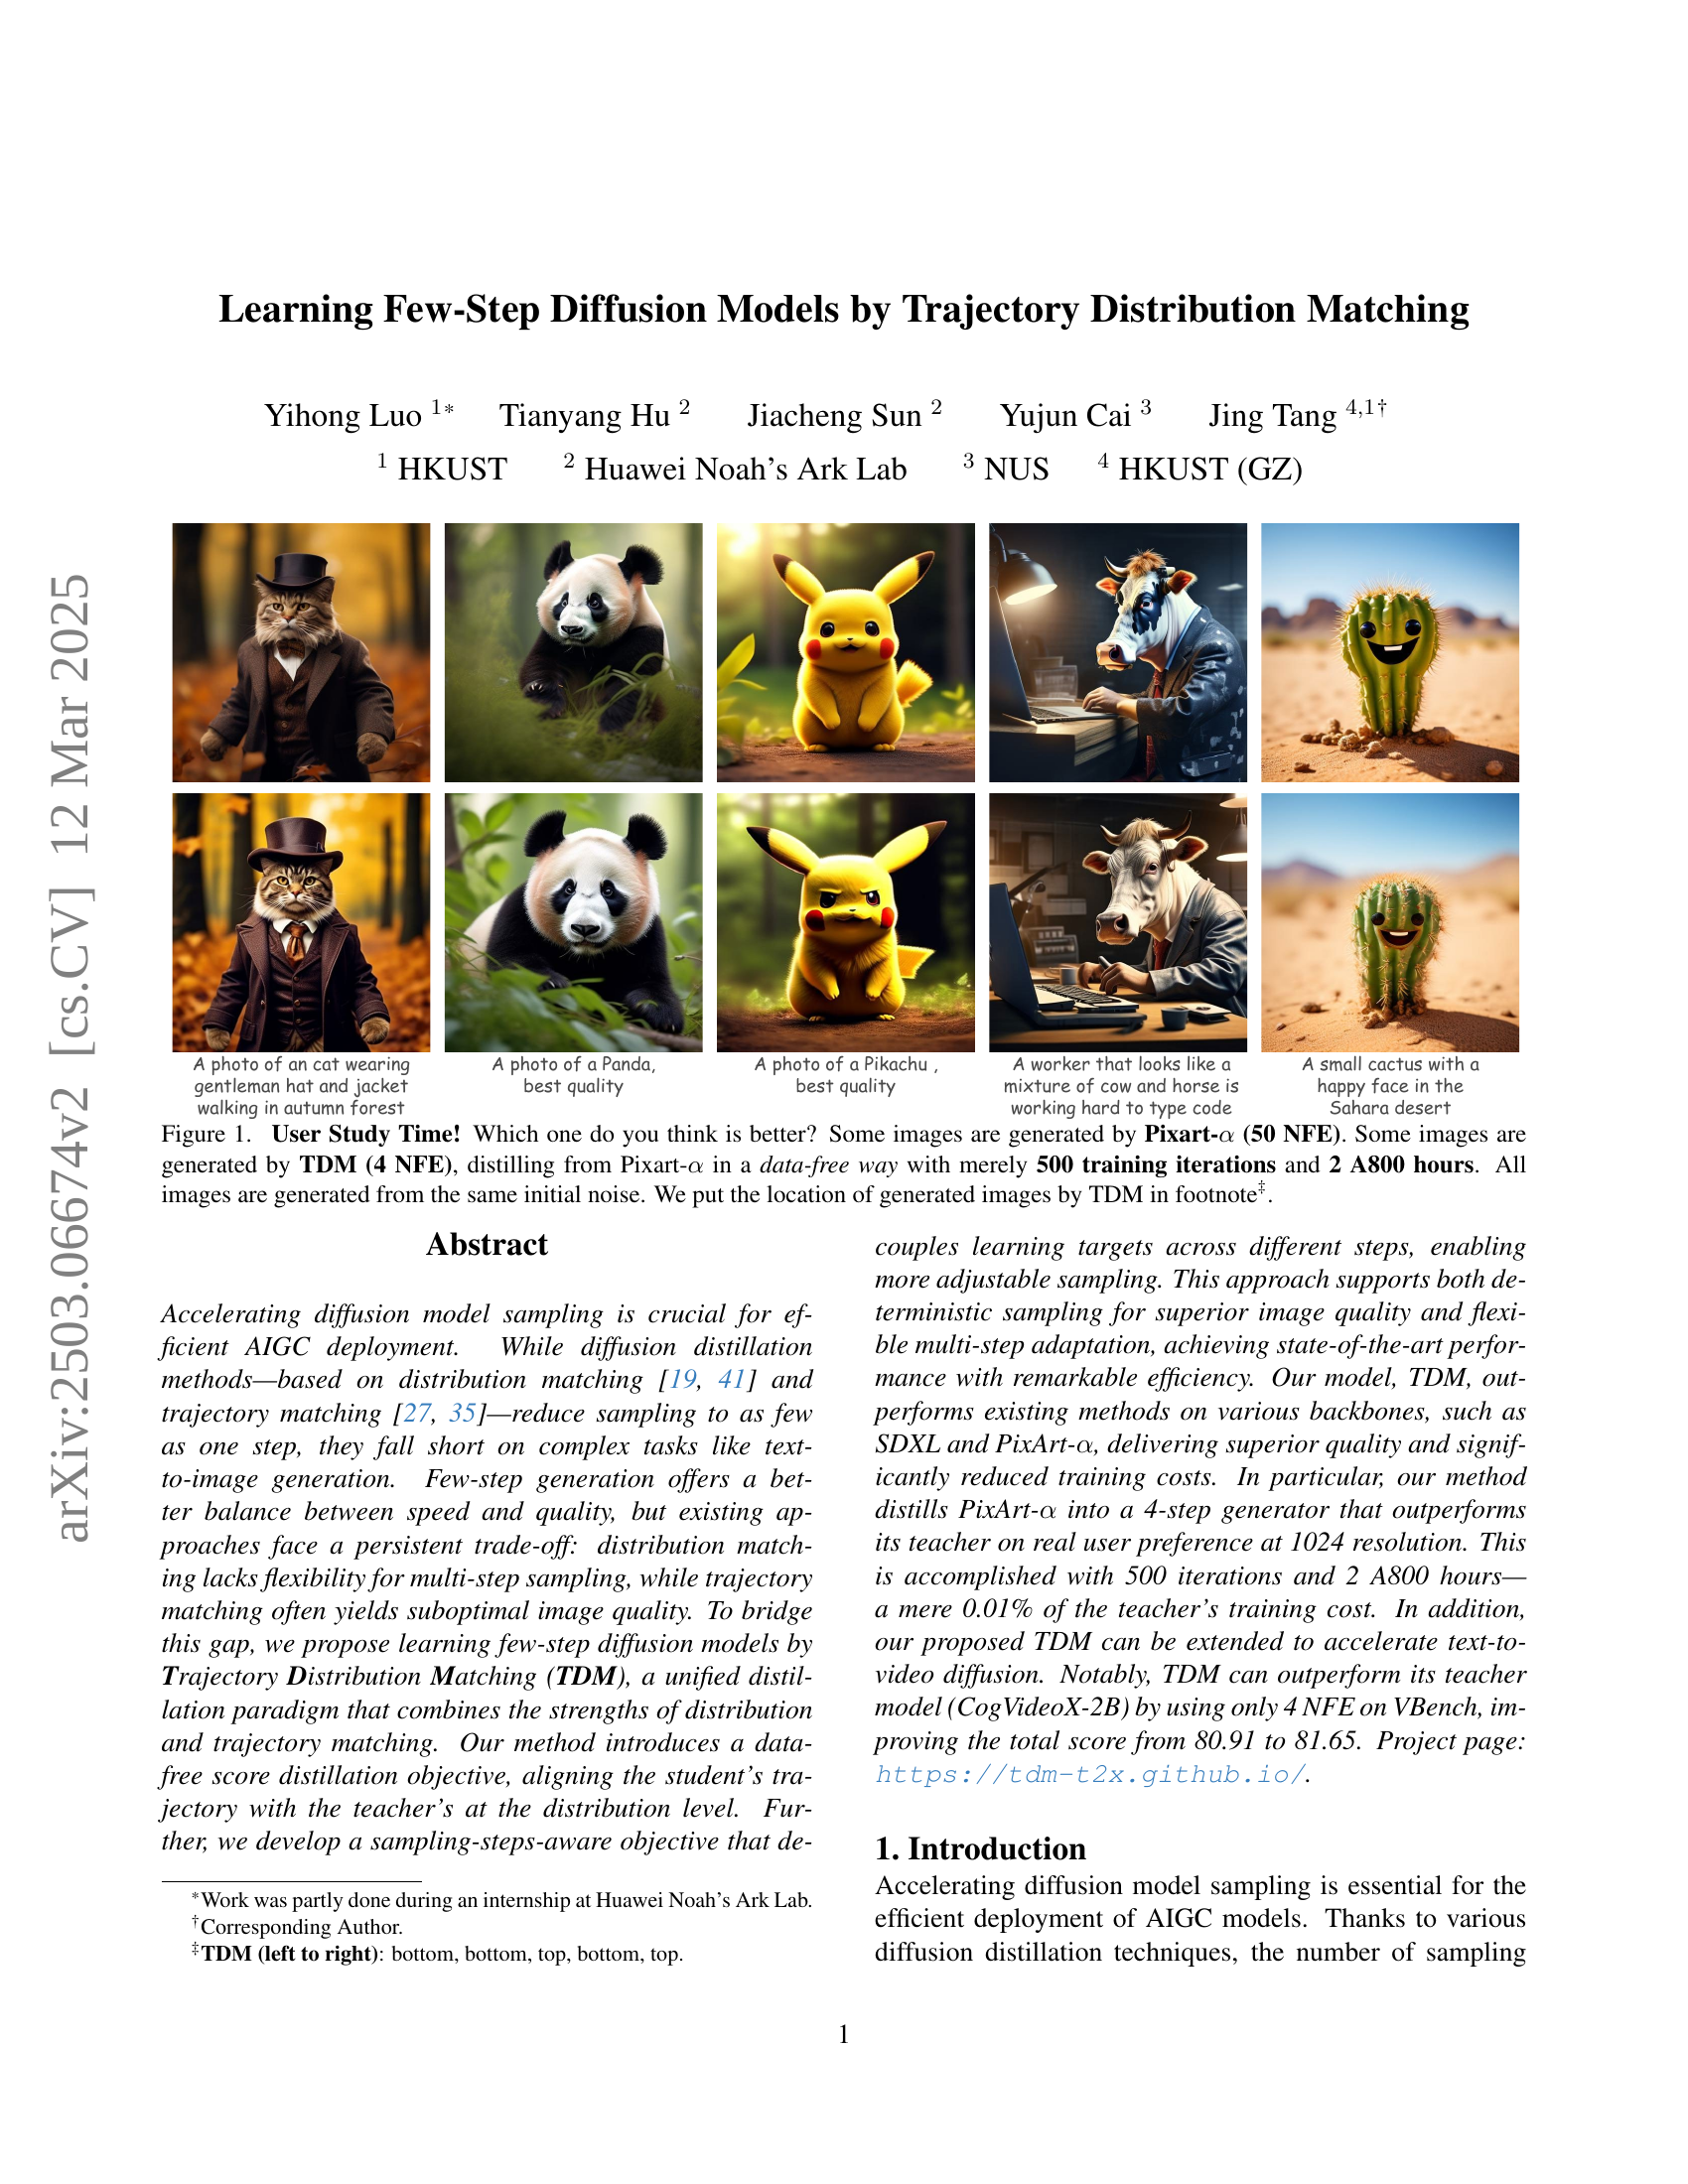
🔼 This figure presents a user study comparing image generation quality between Pixart-α and TDM. Five pairs of images are shown, each pair depicting the same subject generated by both models. Pixart-α, a high-quality model, used 50 NFE (number of forward Euler steps) for generation, while TDM, a distilled model from Pixart-α, used only 4 NFE. TDM achieved its results via data-free distillation with 500 training iterations and 2 A800 hours. The caption indicates which image in each pair was generated by TDM.
read the caption
Figure 1: User Study Time! Which one do you think is better? Some images are generated by Pixart-α𝛼\alphaitalic_α (50 NFE). Some images are generated by TDM (4 NFE), distilling from Pixart-α𝛼\alphaitalic_α in a data-free way with merely 500 training iterations and 2 A800 hours. All images are generated from the same initial noise. We put the location of generated images by TDM in footnote333TDM (left to right): bottom, bottom, top, bottom, top..
| Model | Backbone | HFL | Steps | HPS | Aes | CS | Image-Free? | ||||
| Animation | Concept-Art | Painting | Photo | Average | |||||||
| Base Model (CFG = 3.5) | SD-v1.5 | No | 25 | 26.29 | 24.85 | 24.87 | 26.01 | 25.50 | 5.49 | 33.03 | |
| Base Model + Fine-tuning (CFG = 3.5) | SD-v1.5 | No | 25 | 31.10 | 29.88 | 29.53 | 28.94 | 29.86 | 5.85 | 33.68 | |
| InstaFlow [12] | SD-v1.5 | No | 1 | 23.17 | 23.04 | 22.73 | 22.97 | 22.98 | 5.27 | 30.04 | ✗ |
| PeRFlow [39] | SD-v1.5 | No | 1 | 12.37 | 13.50 | 13.64 | 11.53 | 12.76 | 4.47 | 15.49 | ✗ |
| PeRFlow [39] | SD-v1.5 | No | 2 | 19.75 | 19.43 | 19.41 | 18.40 | 19.25 | 4.91 | 25.83 | ✗ |
| Hyper-SD [25] | SD-v1.5 | Yes | 1 | 28.65 | 28.16 | 28.41 | 26.90 | 28.01 | 5.64 | 30.87 | ✗ |
| TDM-unify-GAN (Ours) | SD-v1.5 | No | 1 | 29.80 | 28.66 | 28.82 | 26.80 | 28.54 | 5.97 | 31.89 | ✗ |
| TDM-unify-SFT (Ours) | SD-v1.5 | No | 1 | 29.85 | 28.90 | 29.22 | 27.62 | 28.90 | 6.02 | 32.12 | ✗ |
| LCM-dreamshaper [18] | SD-v1.5 | No | 4 | 26.51 | 26.40 | 25.96 | 24.32 | 25.80 | 5.94 | 31.55 | ✗ |
| PeRFlow [39] | SD-v1.5 | No | 4 | 22.79 | 22.17 | 21.28 | 23.50 | 22.43 | 5.35 | 30.77 | ✗ |
| TCD [43] | SD-v1.5 | No | 4 | 23.14 | 21.11 | 21.08 | 23.62 | 22.24 | 5.43 | 29.07 | ✗ |
| Hyper-SD [25] | SD-v1.5 | Yes | 4 | 31.06 | 30.01 | 30.47 | 28.97 | 30.24 | 5.78 | 31.49 | ✗ |
| DMD2 [42] | SD-v1.5 | No | 4 | 30.69 | 29.43 | 29.75 | 28.07 | 29.49 | 5.91 | 31.53 | ✗ |
| TDM-unify-GAN (Ours) | SD-v1.5 | No | 4 | 32.04 | 30.86 | 31.06 | 29.35 | 30.83 | 6.07 | 32.40 | ✗ |
| TDM-unify-SFT (Ours) | SD-v1.5 | No | 4 | 32.40 | 31.65 | 31.35 | 29.86 | 31.31 | 6.08 | 32.77 | ✗ |
| Base Model-1024 (CFG=7.5) | SDXL | No | 25 | 34.66 | 33.70 | 33.43 | 30.95 | 33.19 | 6.17 | 36.28 | |
| TCD [43] | SDXL | No | 4 | 29.65 | 27.50 | 27.98 | 26.13 | 27.81 | 5.88 | 33.42 | ✗ |
| LCM [18] | SDXL | No | 4 | 30.79 | 29.38 | 29.60 | 27.87 | 29.41 | 5.84 | 34.84 | ✗ |
| SDXL-Turbo-512 [29] | SDXL | No | 4 | 32.54 | 31.03 | 31.04 | 28.60 | 30.80 | 5.81 | 35.03 | ✗ |
| SDXL-Lighting [11] | SDXL | No | 4 | 34.20 | 32.97 | 33.15 | 30.52 | 32.71 | 6.23 | 34.62 | ✗ |
| Hyper-SD [25] | SDXL | Yes | 4 | 35.58 | 34.54 | 34.54 | 31.90 | 34.14 | 6.18 | 34.27 | ✗ |
| DMD2 [42] | SDXL | No | 4 | 32.87 | 31.56 | 31.01 | 30.39 | 31.46 | 5.88 | 35.51 | ✗ |
| TDM (Ours) | SDXL | No | 4 | 36.42 | 35.34 | 35.51 | 32.25 | 34.88 | 6.28 | 36.08 | ✓ |
| Base Model-1024 (CFG=3.5) | PixArt- | No | 25 | 33.54 | 32.35 | 32.00 | 30.93 | 32.21 | 6.23 | 34.11 | |
| YOSO-512 [20] | PixArt- | No | 4 | 31.40 | 31.18 | 31.26 | 28.15 | 30.60 | 6.23 | 31.83 | ✗ |
| LCM-1024 [17] | PixArt- | No | 4 | 31.96 | 30.60 | 30.70 | 28.92 | 30.55 | 6.17 | 33.49 | ✗ |
| TDM-1024 (Ours) | PixArt- | No | 4 | 34.61 | 33.54 | 33.45 | 31.23 | 33.21 | 6.42 | 33.66 | ✓ |
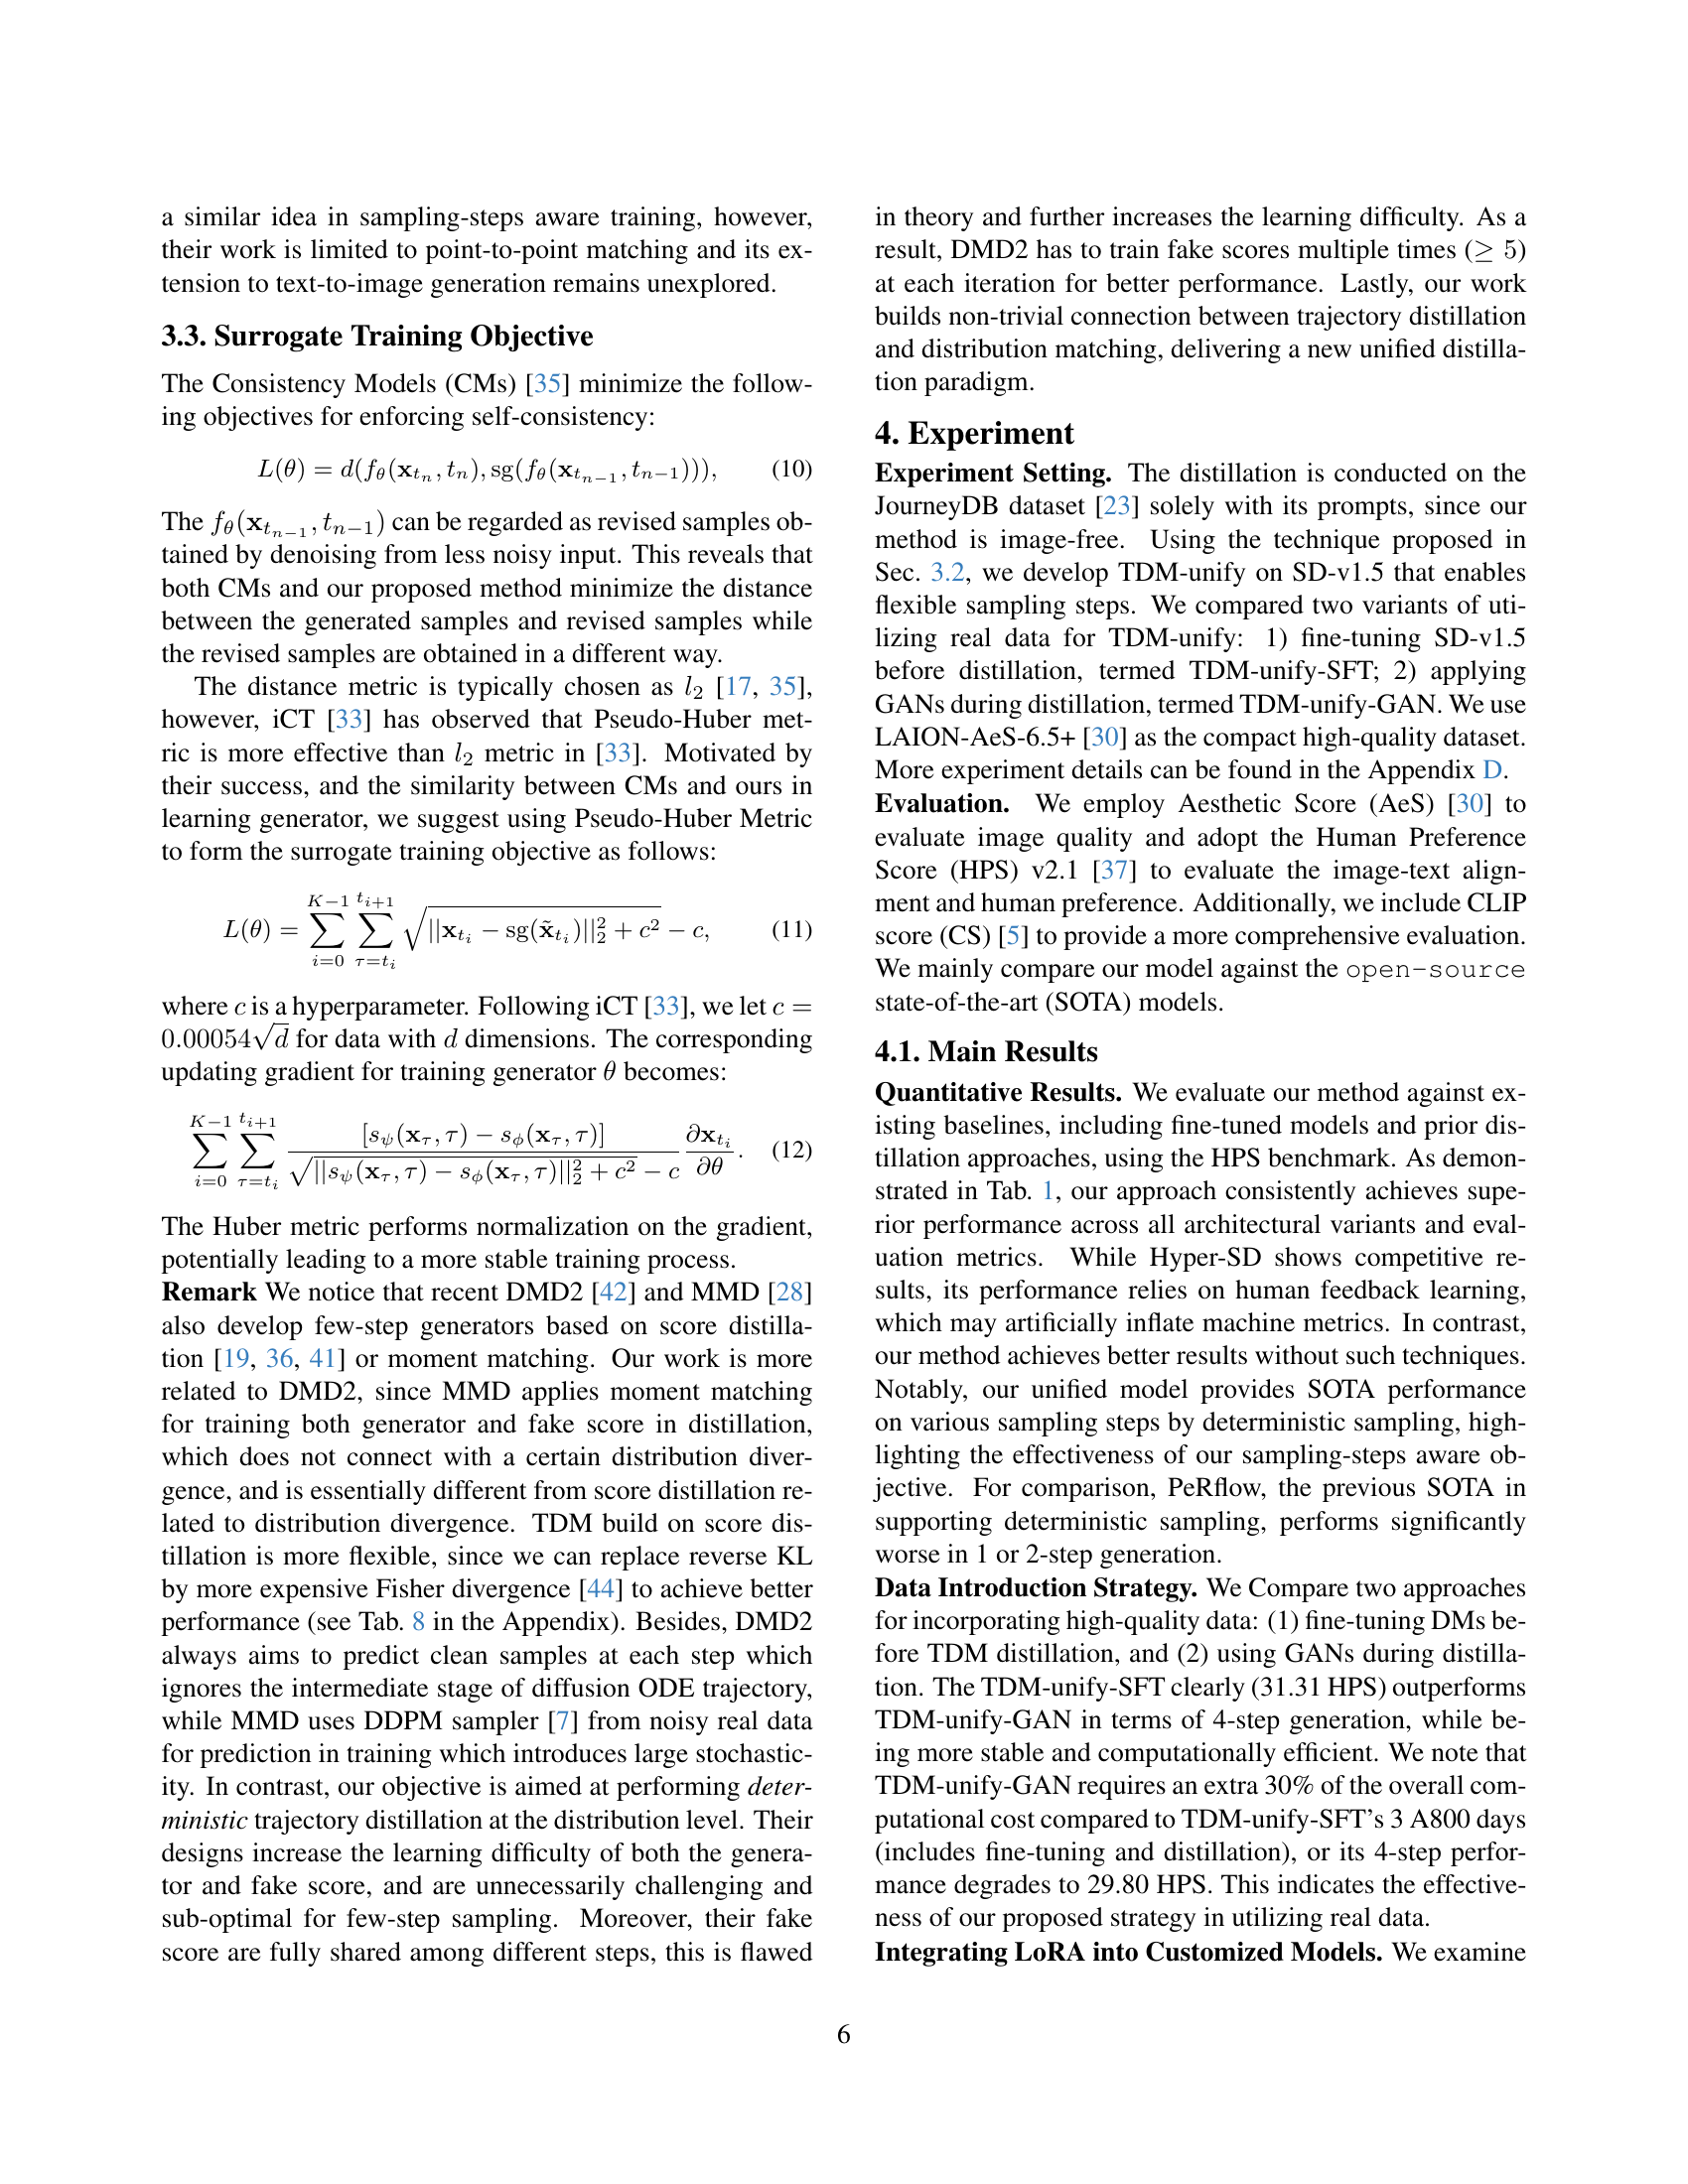
🔼 This table compares the performance of various text-to-image generation models, including several state-of-the-art methods and the authors’ proposed method (TDM). Metrics evaluated include Human Preference Score (HPS), Aesthetic Score (AeS), CLIP Score (CS), and whether the method uses human feedback learning (HFL). Two variants of TDM are shown: TDM-unify-SFT (initialized with a fine-tuned Stable Diffusion v1.5 model) and TDM-unify-GAN (initialized with the original SD-v1.5 model). The table highlights the best-performing distillation method for each metric and sampling step.
read the caption
Table 1: Comparison of machine metrics on text-to-to-image generation across state-of-the-art methods. TDM-unify-SFT is initialized from fine-tuned SD-v1.5 and TDM-unify-GAN is initialized from original SD-v1.5. HFL denotes human feedback learning which might hack the machine metrics. We highlight the best among distillation methods.
In-depth insights#
TDM Unifies Distillation#
The concept of ‘TDM Unifies Distillation’ suggests a novel approach to knowledge transfer in machine learning, likely within the context of model compression or acceleration. It hints at a framework where Trajectory Distribution Matching (TDM) serves as a unifying principle for different distillation techniques. Instead of treating distillation as a singular process, TDM likely integrates multiple methodologies, like knowledge distillation, data distillation and feature distillation, into one cohesive framework. This integration could involve leveraging the strengths of each individual method while mitigating their weaknesses, potentially leading to more efficient and effective knowledge transfer from a large ’teacher’ model to a smaller ‘student’ model. The ‘unification’ aspect further suggests a modular design, where different distillation strategies can be combined or swapped out depending on the specific task and model architecture. TDM framework may focus on aligning the ‘student’ model’s trajectory through the learning process with that of the ’teacher’, enabling the student to learn not just the final result, but also the intermediate representations and decision-making processes of the teacher.
Faster Trajectory Convergence#
The notion of ‘Faster Trajectory Convergence’ in the context of diffusion models and generative AI highlights a crucial objective: accelerating the sampling process without sacrificing the quality of the generated output. Achieving this involves techniques that enable models to reach a stable and realistic result in fewer steps. This is important because efficient sampling is vital for real-world deployment, reducing computational costs and latency. Methods aimed at faster convergence often involve distillation, where a smaller student model learns to mimic a larger teacher model’s trajectory, or improved optimization strategies that allow models to quickly navigate the latent space to find high-quality samples. Faster convergence can also be achieved by better initialization strategies or more effective loss functions that guide the model towards realistic solutions more directly, sidestepping issues such as mode collapse or unrealistic artifacts.
Data-Free Strategy Boost#
A data-free strategy boost is an intriguing concept, particularly in scenarios where accessing or curating large datasets is challenging. It allows models to be trained and improved without relying on real-world data, leveraging instead synthetic or self-generated data. This can be achieved through techniques like knowledge distillation, where a smaller, more efficient student model learns from a larger, pre-trained teacher model without direct access to the original data. It can also be achieved through GANs which create synthetic data. The advantages are multifaceted: protecting sensitive data, reducing data storage costs, mitigating bias, and accelerating development. However, the success relies heavily on the teacher model’s quality and the effectiveness of the data generation process. If the teacher is flawed or the generated data is unrealistic, the student model may inherit these deficiencies. Addressing this could involve carefully designing the synthetic data generation, incorporating domain knowledge, or using more advanced generative models. Further research into these areas holds immense potential for advancing model training and adaptation in data-scarce environments.
Flexible Step Control#
Flexible step control in diffusion models is crucial for adapting to diverse computational constraints and quality needs. Methods enabling dynamic adjustment of sampling steps offer a significant advantage. Such control allows users to trade off between generation speed and output fidelity, optimizing for specific applications. Techniques might involve step size modulation, early stopping mechanisms, or adaptive refinement strategies. Ensuring stability and visual coherence across varying step counts is a key challenge. Flexible schemes should also maintain semantic consistency, preventing abrupt shifts in image content as the number of steps changes. Developing robust and controllable diffusion models will broaden their applicability in real-world scenarios, accommodating resource-limited environments and high-quality demands.
LoRA & Style Fidelity#
LoRA (Low-Rank Adaptation), a parameter-efficient fine-tuning technique, is a powerful method to adapt pre-trained diffusion models to specific styles. The ‘style fidelity’ refers to the ability of LoRA to maintain or replicate the stylistic elements of the original training data or a target dataset. Applying LoRA for custom style generation can introduce trade-offs. A crucial challenge is ensuring that the LoRA-adapted model accurately captures and faithfully reproduces the desired stylistic features without compromising the overall quality or diversity of the generated images. Assessing style fidelity often involves subjective human evaluations and quantitative metrics like FID. Ensuring high style fidelity requires careful selection of training data, appropriate LoRA configuration, and potentially regularization techniques to prevent overfitting to the target style. The right balance is needed.
More visual insights#
More on figures

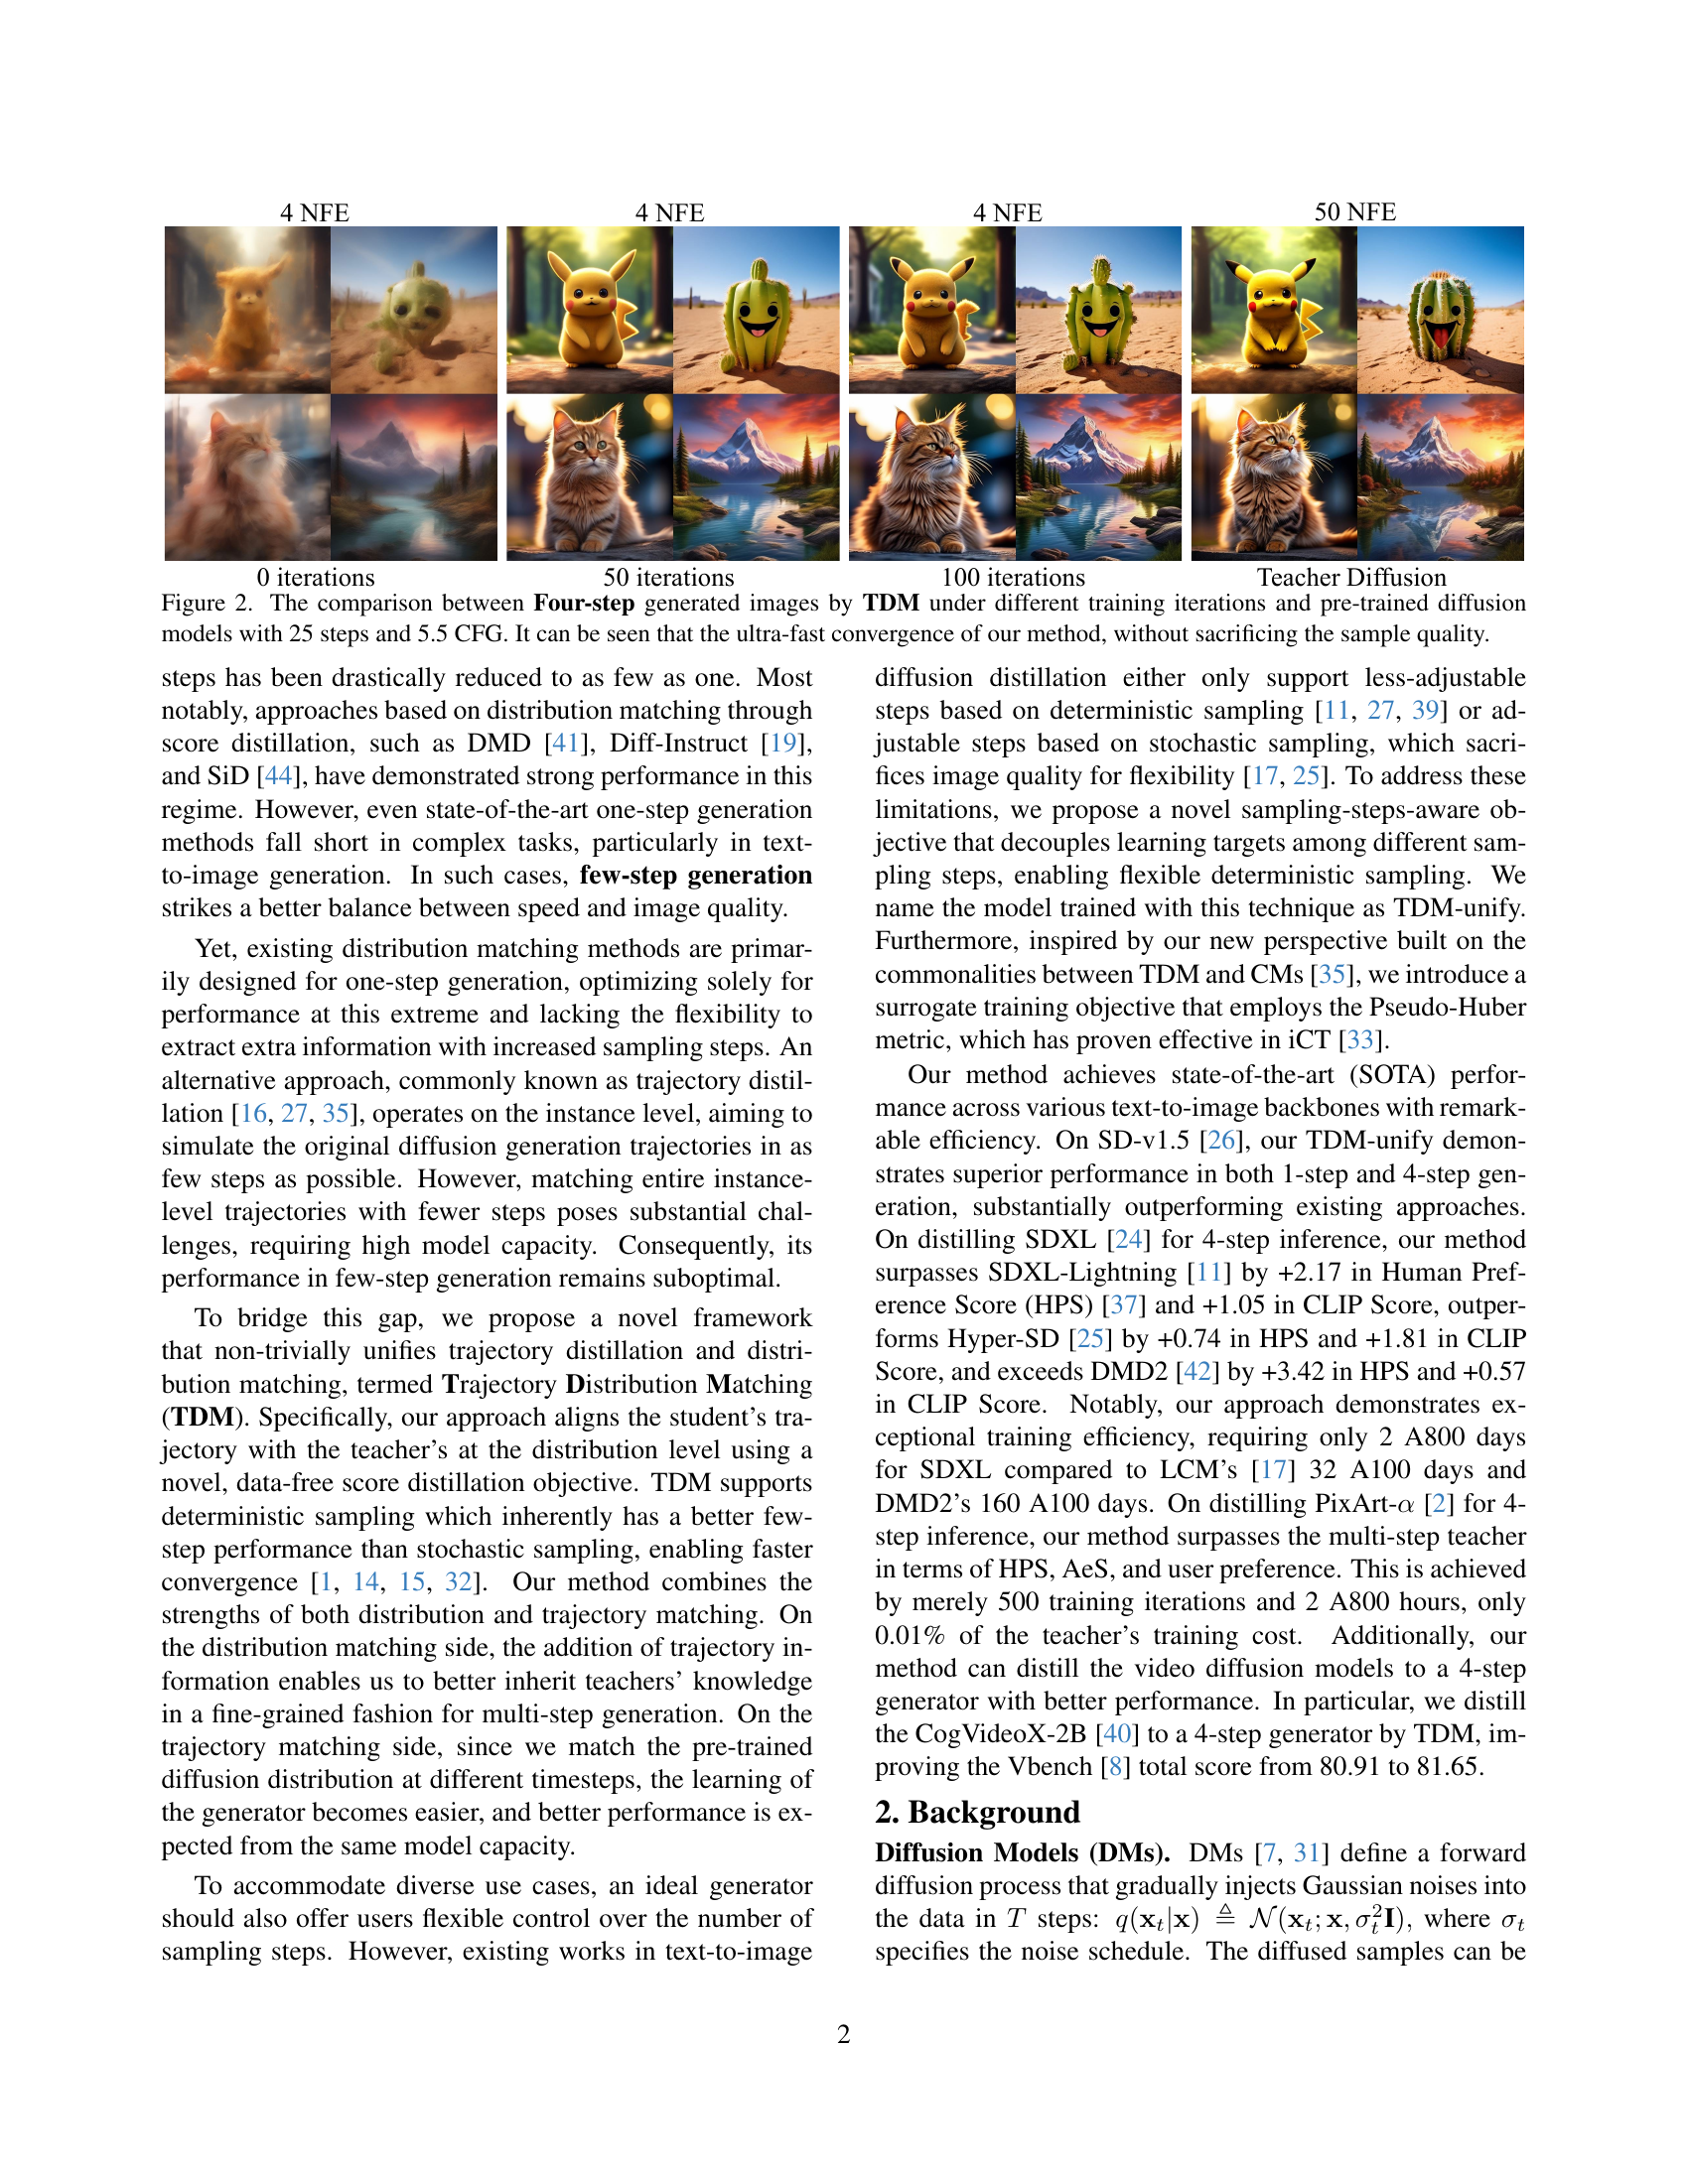
🔼 This figure compares images generated by the Trajectory Distribution Matching (TDM) method after different numbers of training iterations with those from a pre-trained diffusion model. The pre-trained model uses 25 sampling steps and a classifier-free guidance (CFG) scale of 5.5. TDM, in contrast, generates images with only 4 sampling steps. The figure demonstrates that TDM achieves high-quality image generation very quickly, even with a significantly reduced number of sampling steps.
read the caption
Figure 2: The comparison between Four-step generated images by TDM under different training iterations and pre-trained diffusion models with 25 steps and 5.5 CFG. It can be seen that the ultra-fast convergence of our method, without sacrificing the sample quality.
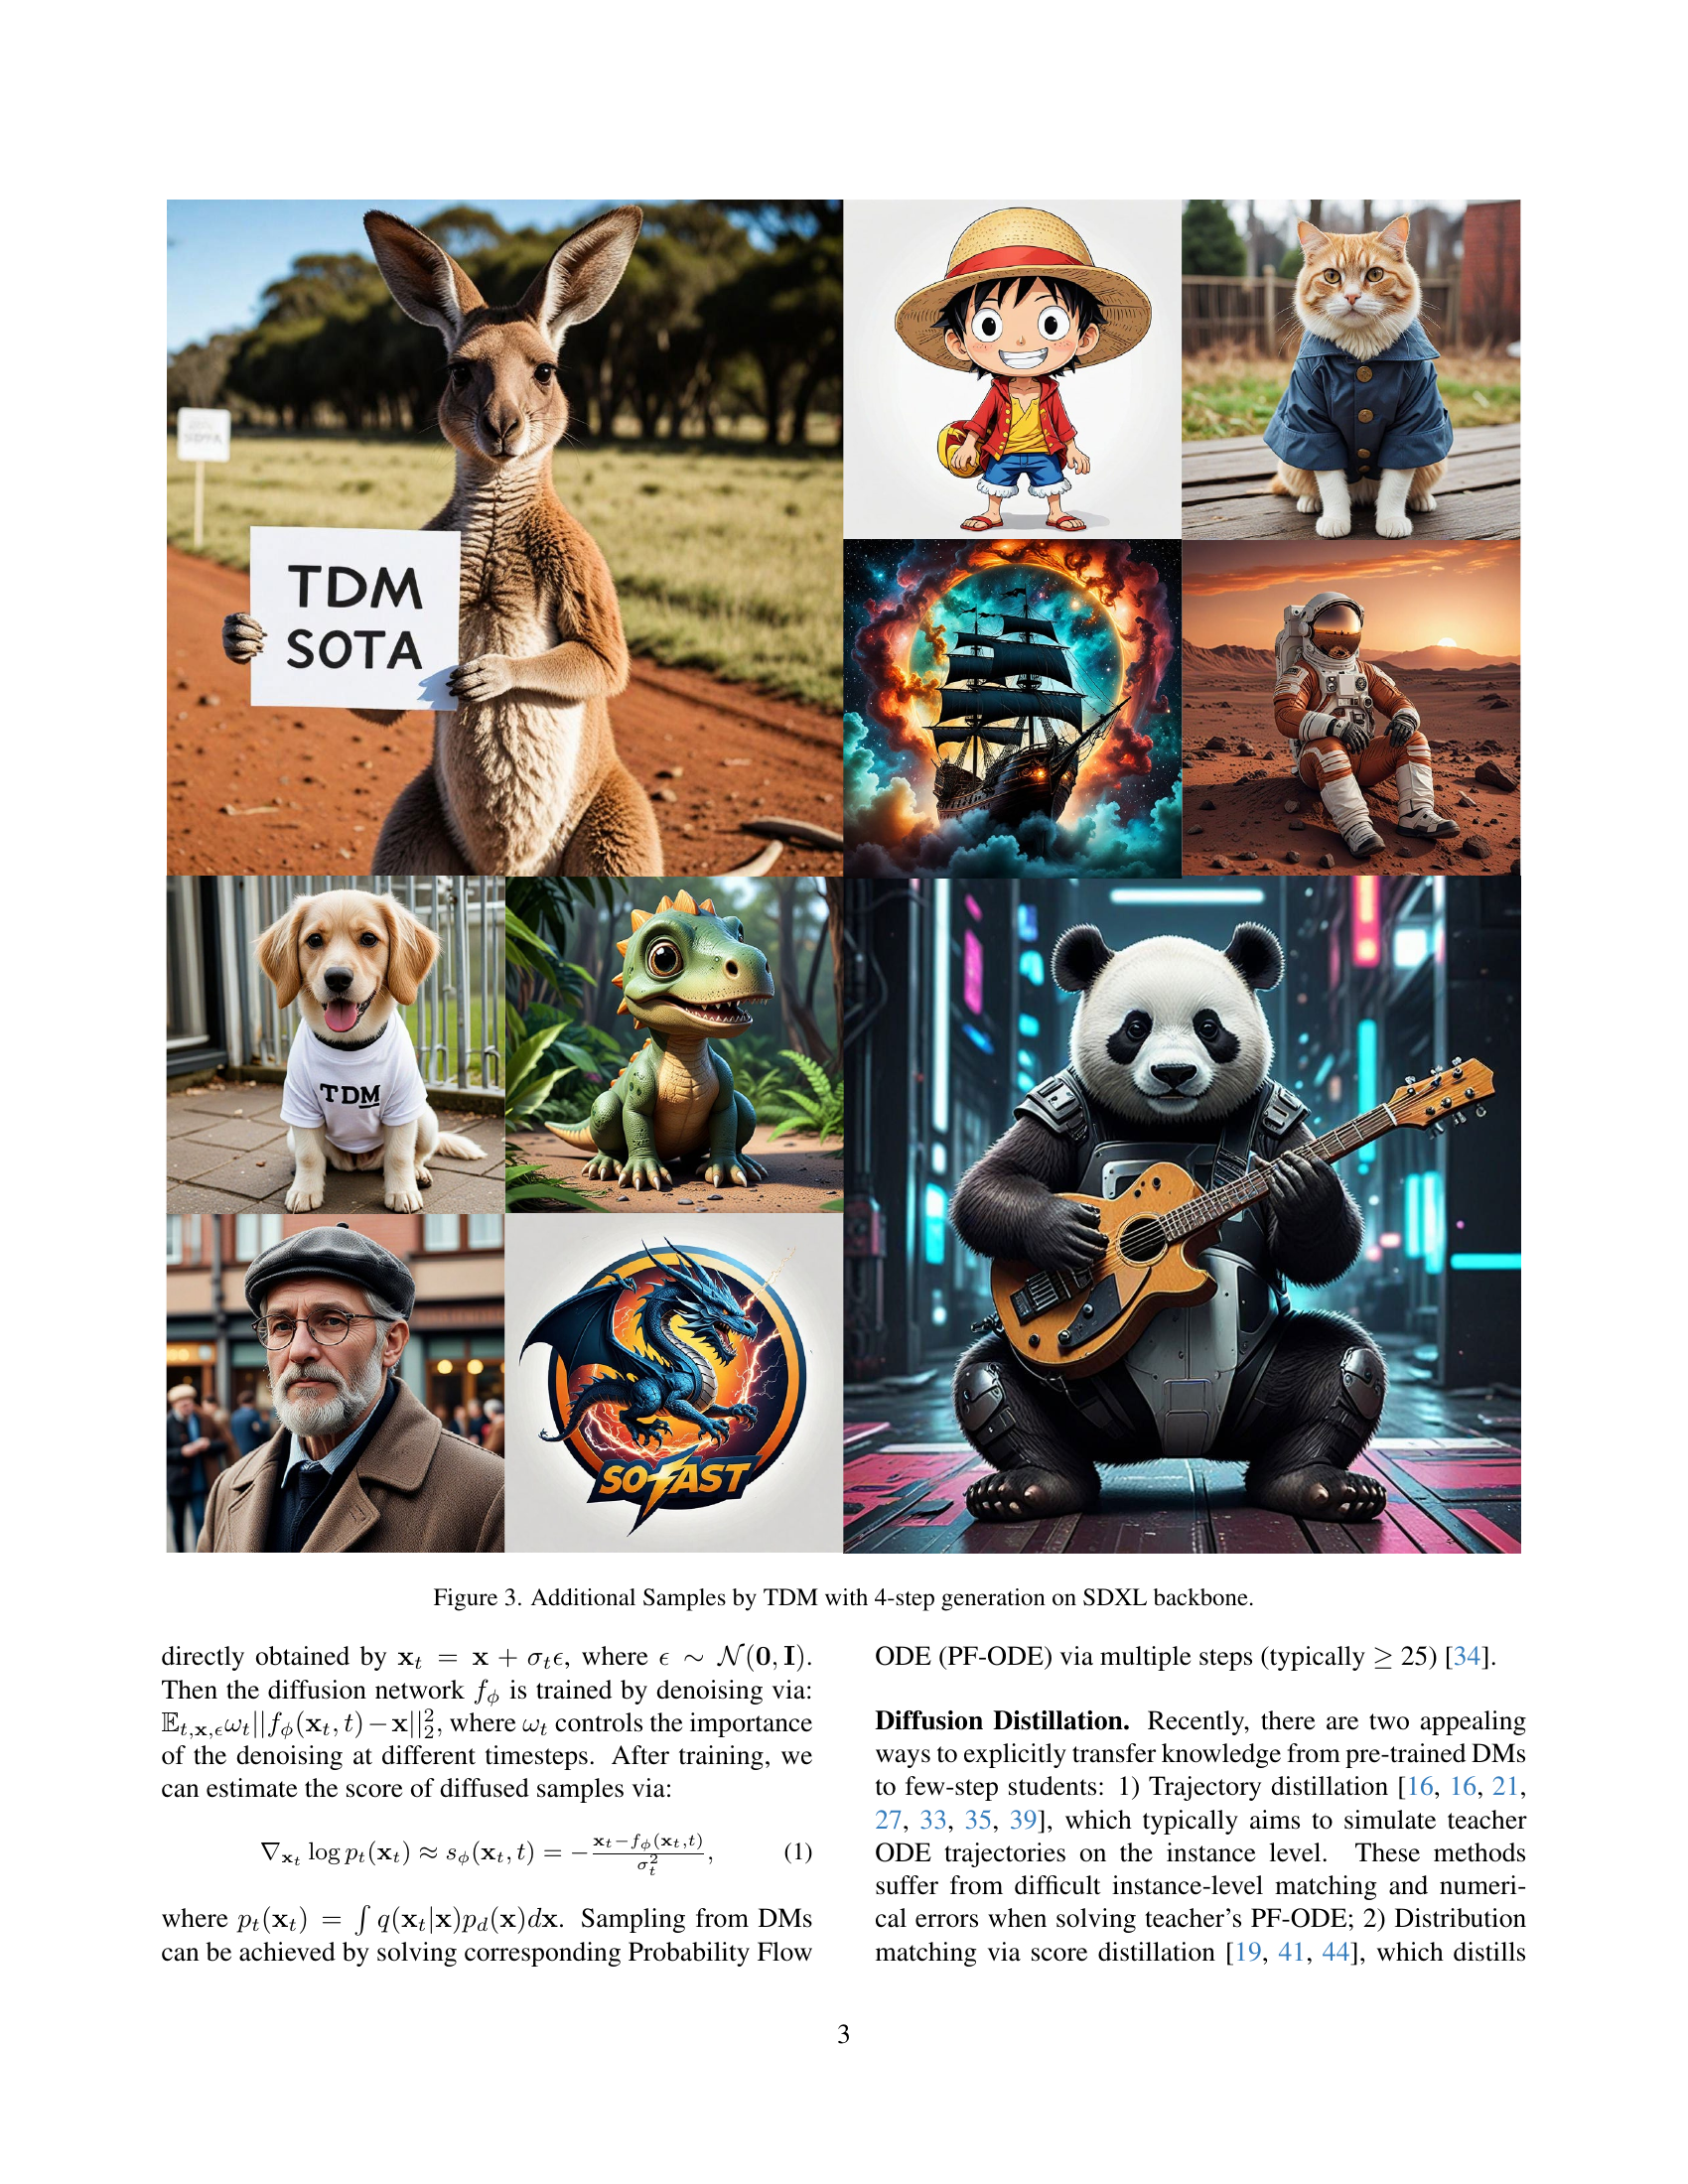
🔼 This figure showcases additional examples of images generated using the Trajectory Distribution Matching (TDM) method. Specifically, it demonstrates the model’s performance with 4-step generation using the SDXL (Stable Diffusion XL) model as the backbone. The images exemplify the high quality and diversity achievable with the TDM method, even with a significantly reduced number of sampling steps compared to traditional methods.
read the caption
Figure 3: Additional Samples by TDM with 4-step generation on SDXL backbone.

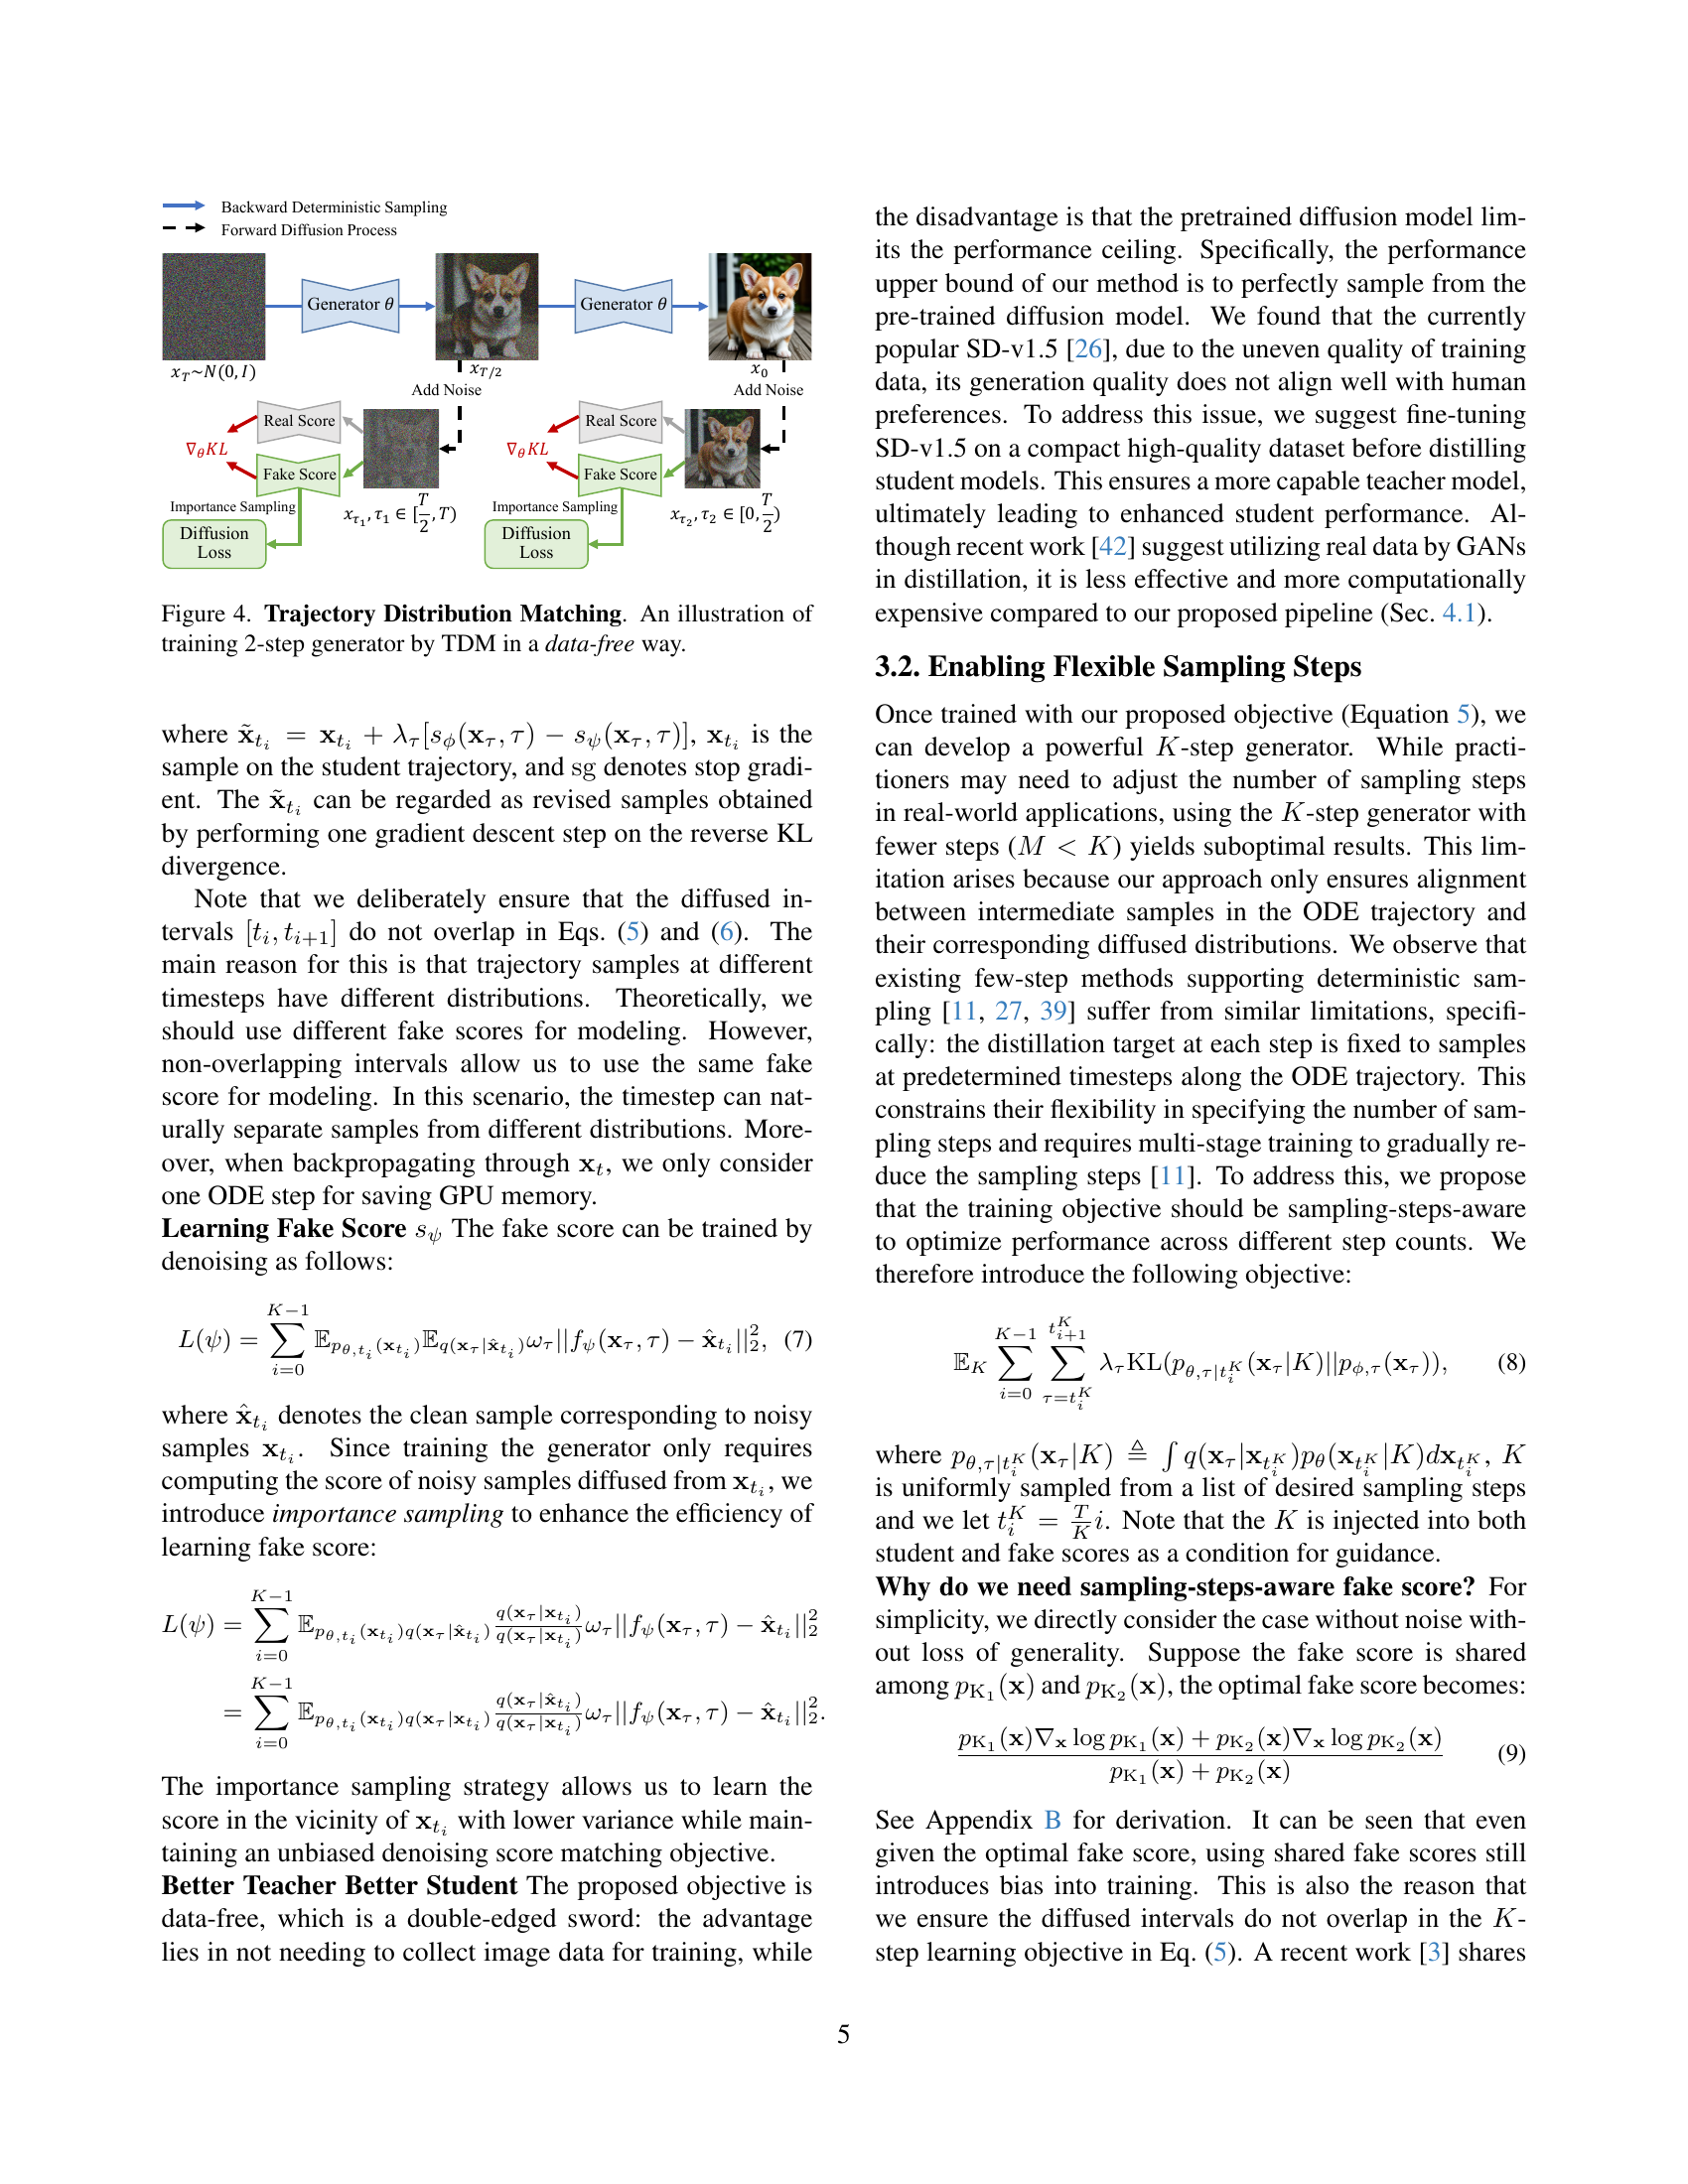
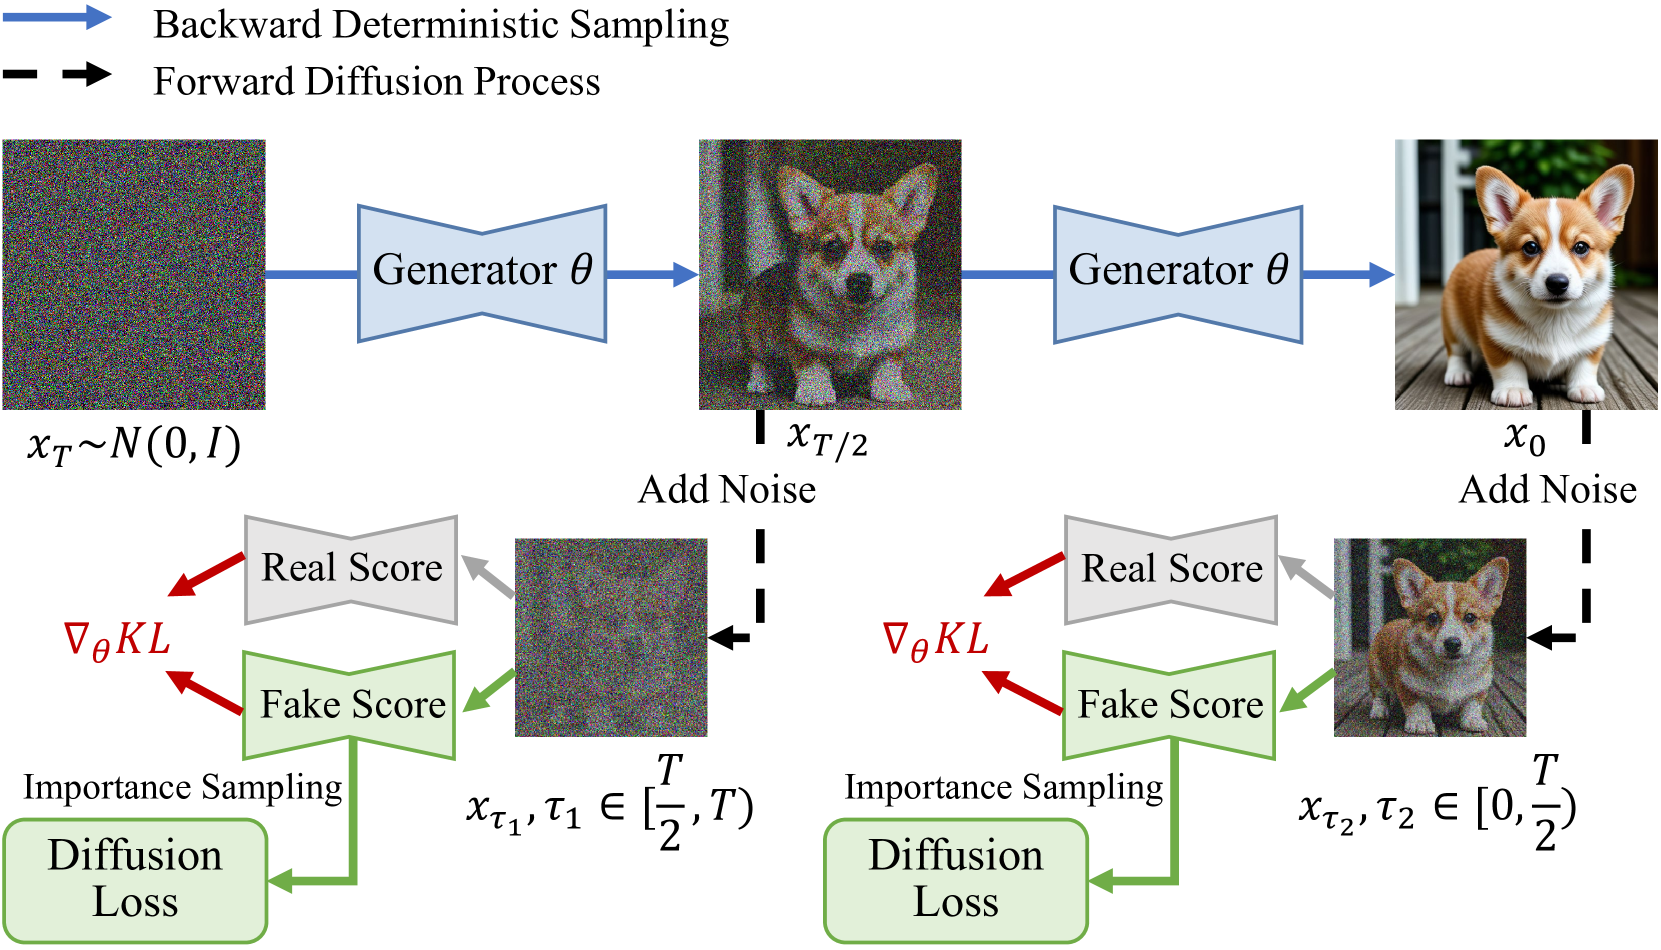
🔼 This figure illustrates the data-free training process of a two-step generator using the Trajectory Distribution Matching (TDM) method. It shows how the TDM framework aligns the student model’s trajectory with that of the teacher model at the distribution level, enabling efficient knowledge transfer without needing real data for training. The process involves using a novel data-free score distillation objective and a sampling-steps-aware objective. The figure depicts the forward diffusion process, backward deterministic sampling, the generator, the computation of the real score and fake score, and the use of importance sampling to optimize the training process. This data-free approach is key to TDM’s efficiency and effectiveness.
read the caption
Figure 4: Trajectory Distribution Matching. An illustration of training 2-step generator by TDM in a data-free way.

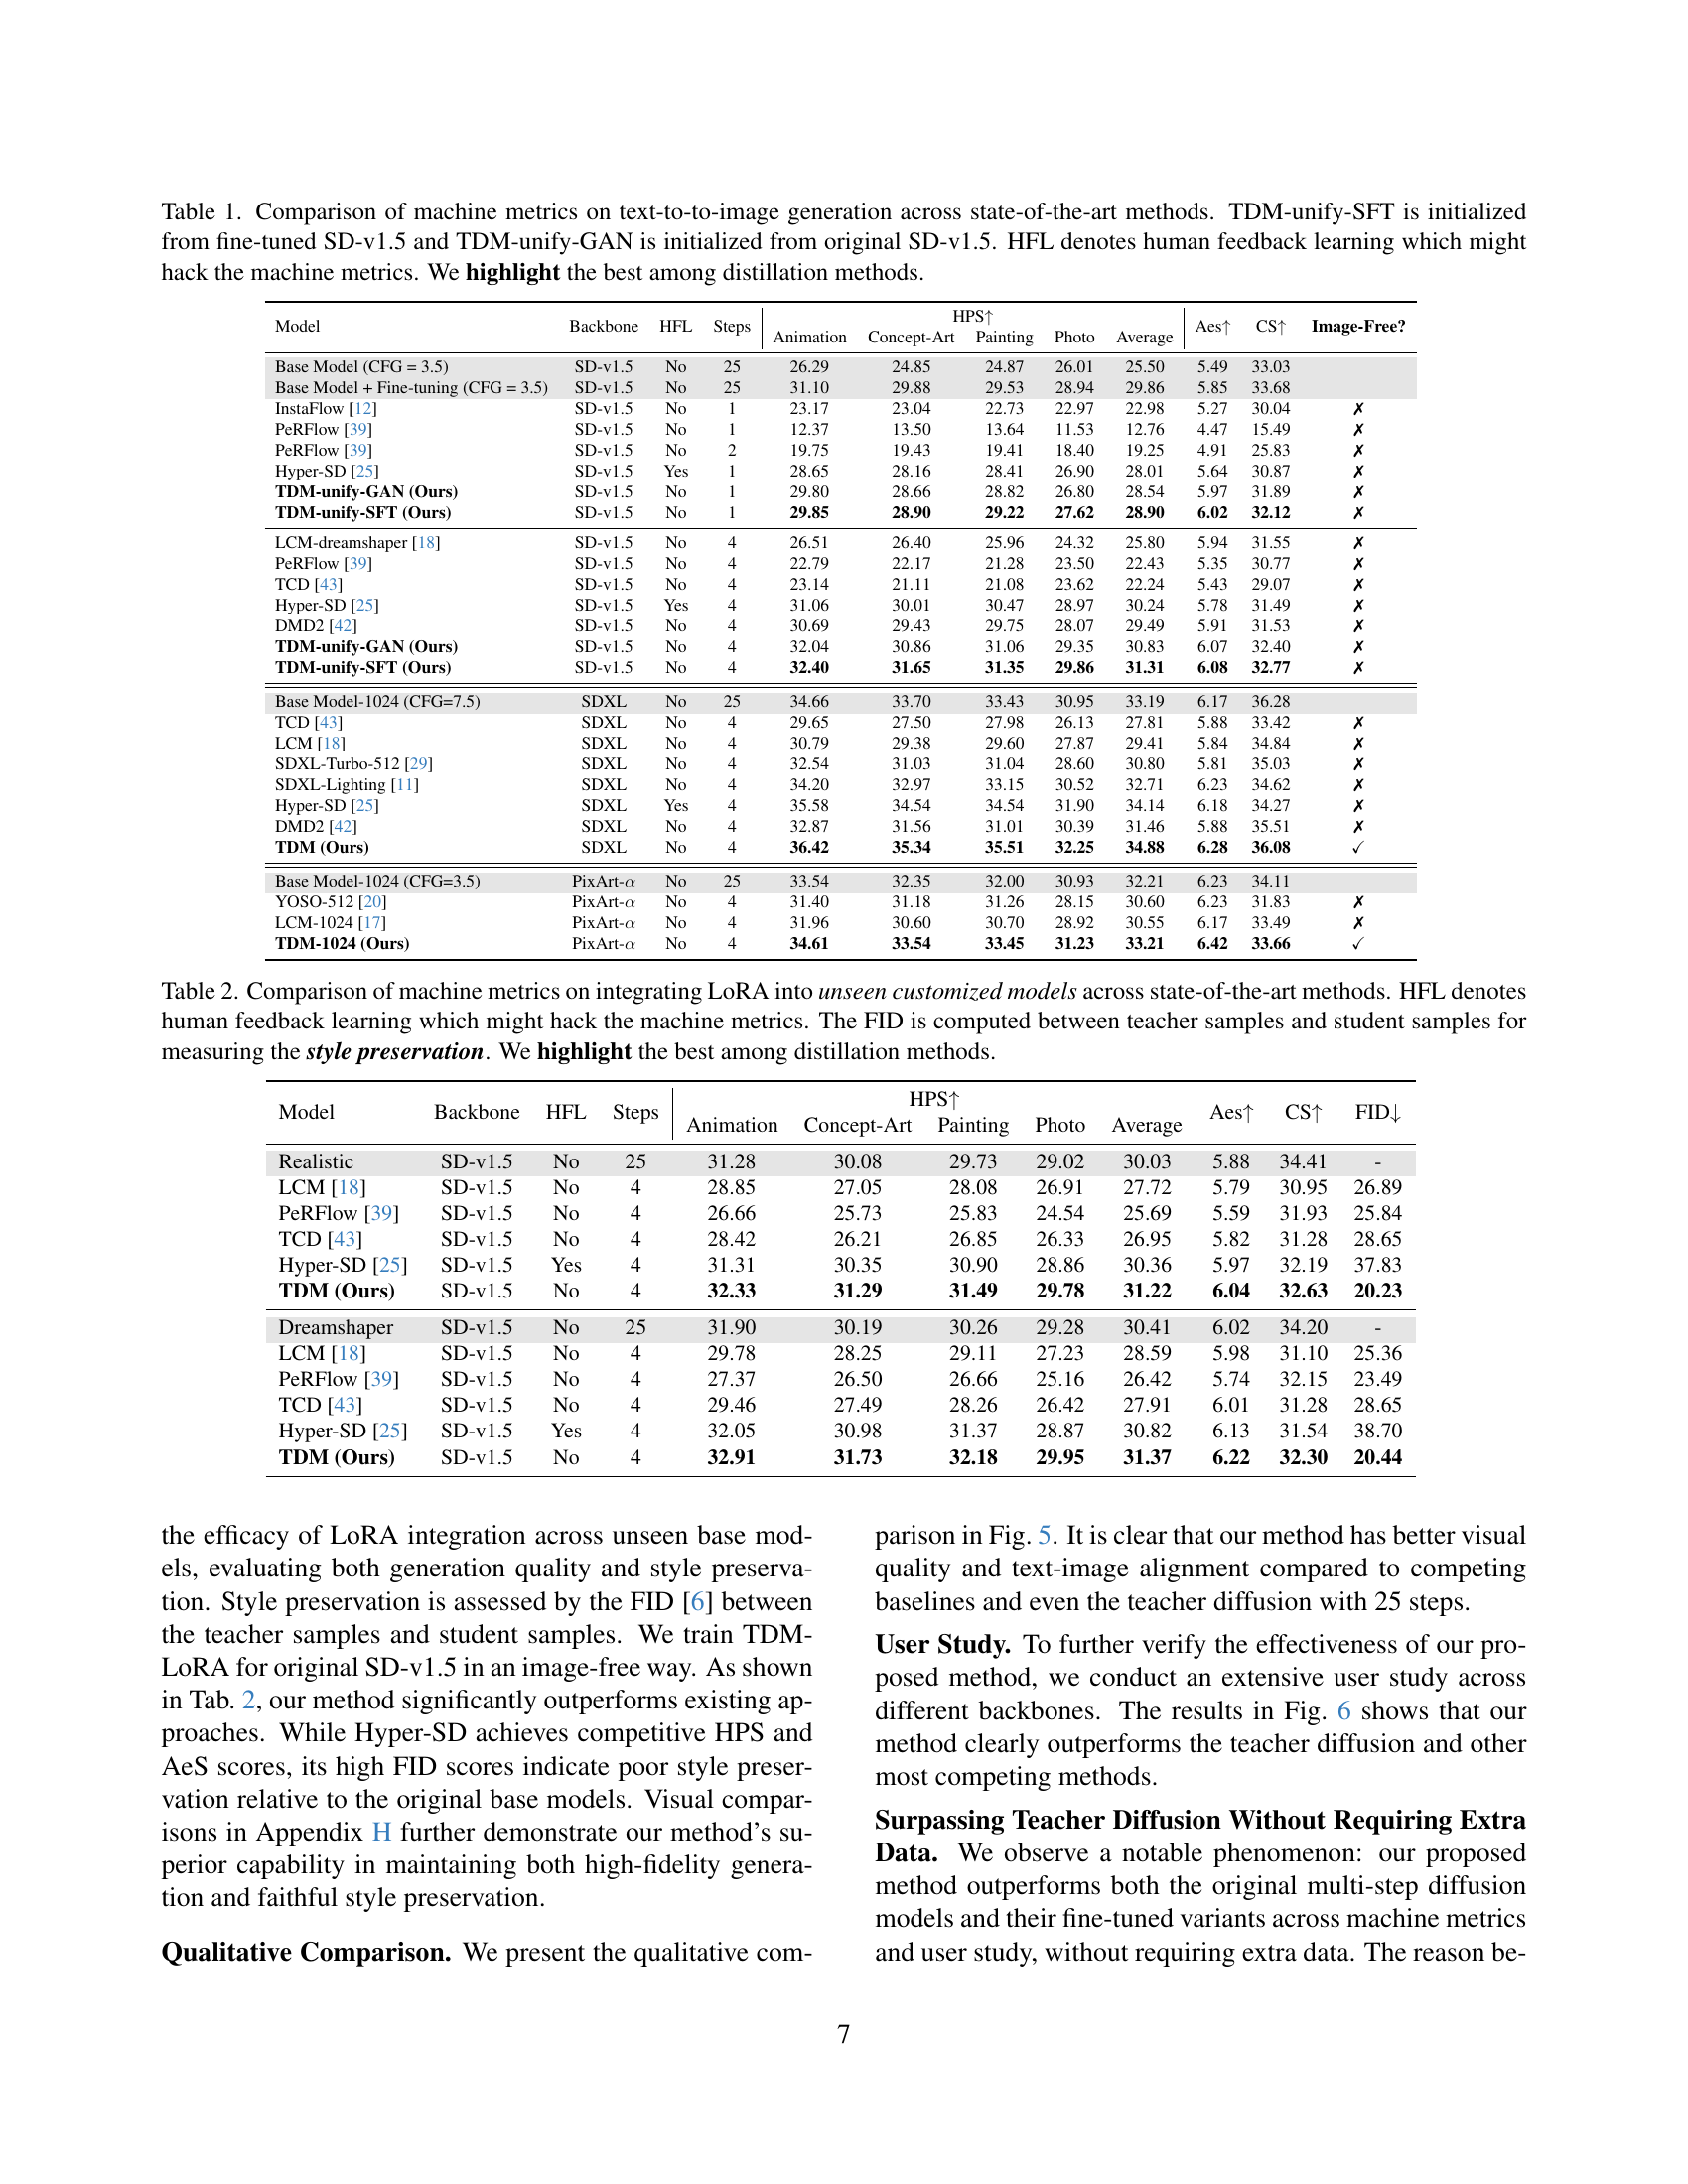
🔼 This figure displays a qualitative comparison of image generation results from different diffusion models, all starting from the same initial noise. The models compared include SDXL (a baseline with 50 noise-removing steps), LCM (4 steps), TCD (4 steps), Lighting (4 steps), Hyper (4 steps), DMD2 (4 steps), and TDM (the authors’ model, also with 4 steps). The comparison showcases various image prompts and highlights the visual differences in the quality and details of the generated images across the different models. The goal is to visually demonstrate the performance of the authors’ TDM model against existing state-of-the-art methods, emphasizing its ability to produce high-quality images with a significantly reduced number of sampling steps.
read the caption
Figure 5: Qualitative comparisons of TDM against most competing methods on SDXL. All images are generated by the same initial noise.

🔼 This figure presents the results of a user study comparing the image quality of images generated by the proposed Trajectory Distribution Matching (TDM) method against several state-of-the-art competing methods. The user study was conducted by showing participants pairs of images and asking which one is better based on overall image quality and how well it aligns with the provided prompt. The figure visually displays the percentage of times each method was chosen as better by the participants, offering a direct comparison of user preference for image quality generated by different methods.
read the caption
Figure 6: The user study about the comparison between our method and the most competing methods.

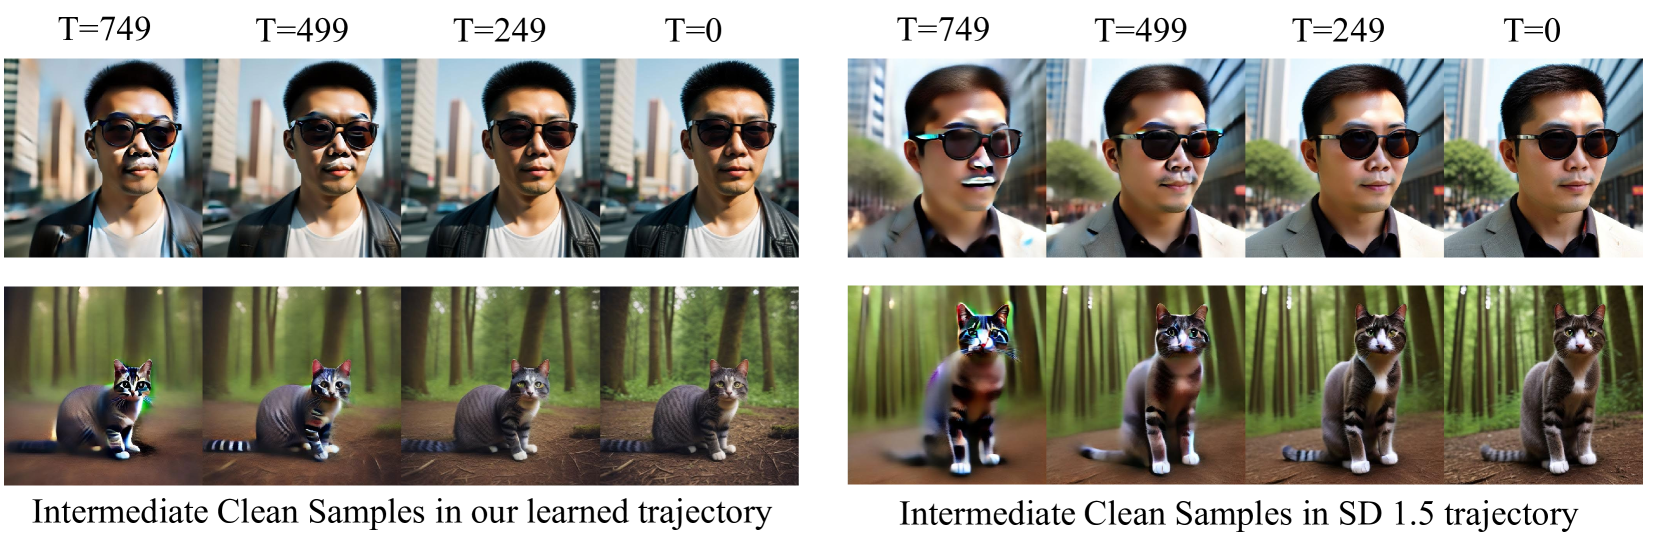
🔼 Figure 7 visualizes the intermediate clean samples generated during the denoising process of a diffusion model, illustrating the model’s trajectory across different timesteps. The figure compares the trajectory generated by the proposed Trajectory Distribution Matching (TDM) method with that of a standard diffusion model. The comparison highlights that TDM produces cleaner samples with less of the CFG (classifier-free guidance) artifact, resulting in better visual quality. The input prompt for generating these images was “A dog reading a book.” Additional visualizations are available in Appendix H of the paper.
read the caption
Figure 7: The visualization of ODE trajectory with clean samples at different timesteps. It is clear that our method suffers less from the CFG artifact and has better visual quality. The prompt is “A dog reading a book”. See Appendix H for more visualizations.

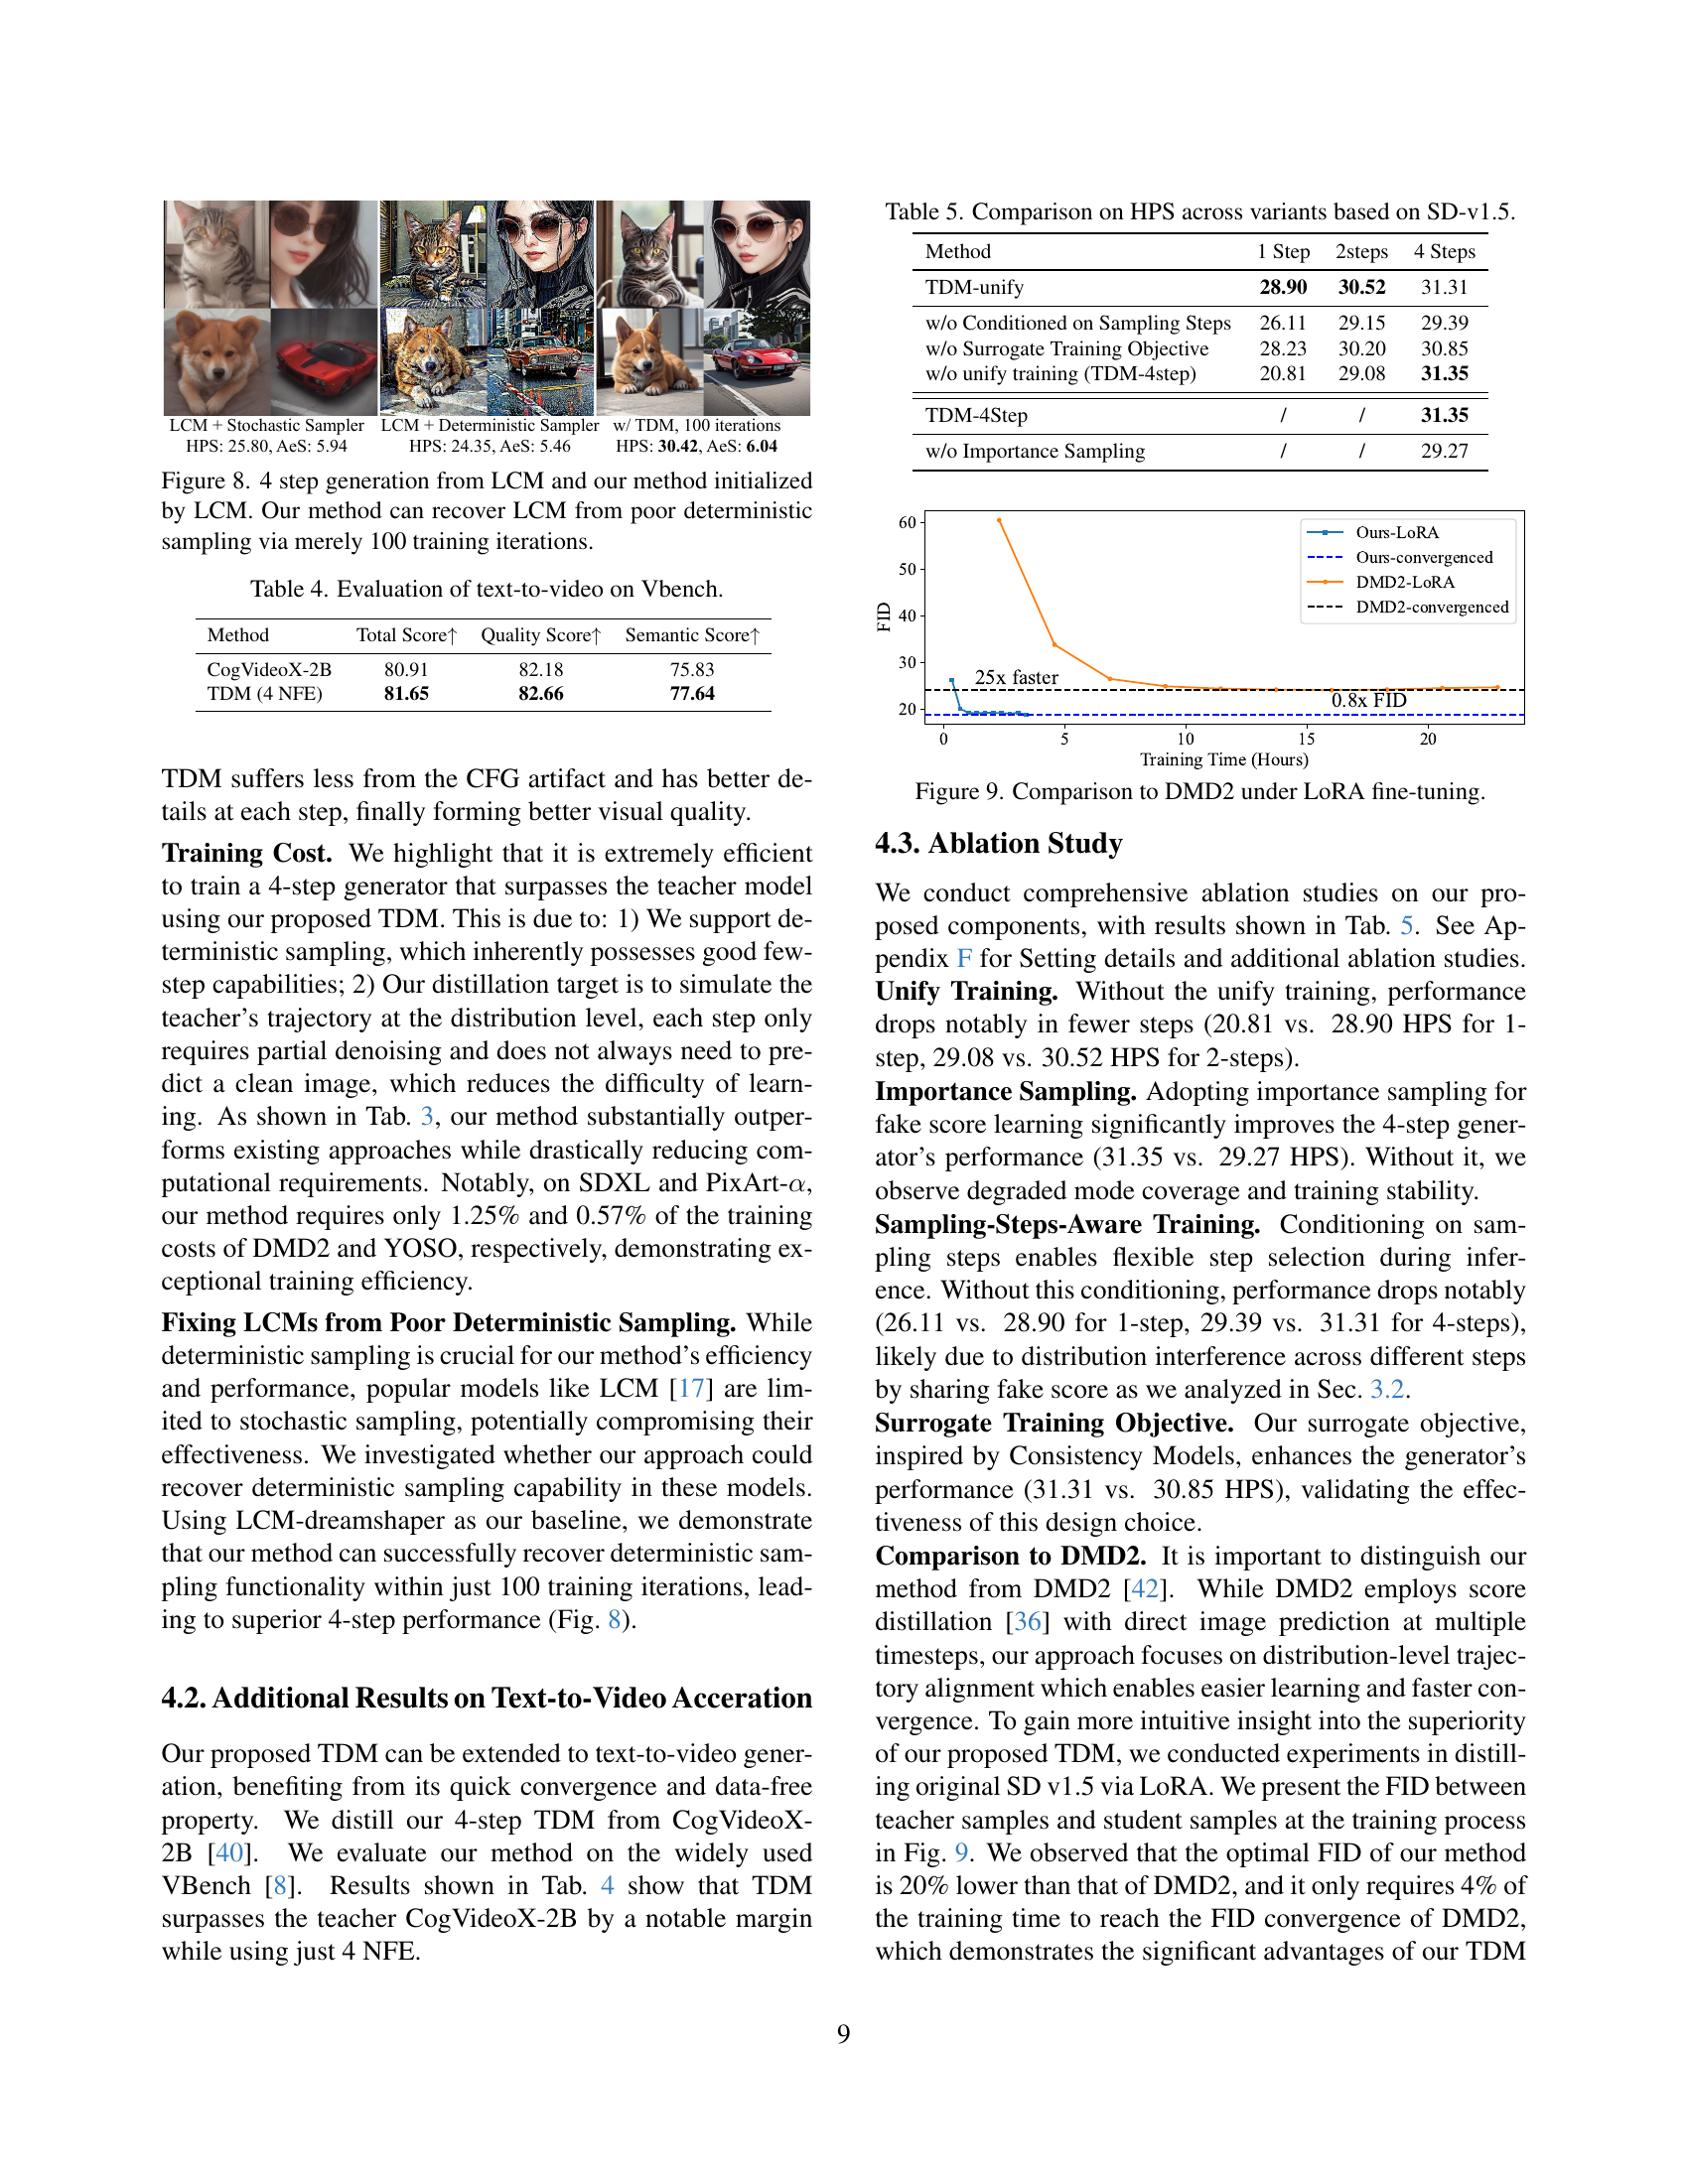
🔼 This figure compares the image generation results of LCM (Latent Consistency Model) and the proposed TDM (Trajectory Distribution Matching) method, both initialized using LCM. The left two columns show the results from LCM using stochastic and deterministic sampling, respectively. Stochastic sampling shows better results but is computationally expensive. Deterministic sampling in LCM produces poor quality images. The right two columns show the results obtained using TDM after 100 training iterations. TDM achieves significantly improved image quality comparable to that of LCM with stochastic sampling, demonstrating its ability to recover high-quality results from a poorly performing deterministic sampling baseline within very few training iterations.
read the caption
Figure 8: 4 step generation from LCM and our method initialized by LCM. Our method can recover LCM from poor deterministic sampling via merely 100 training iterations.

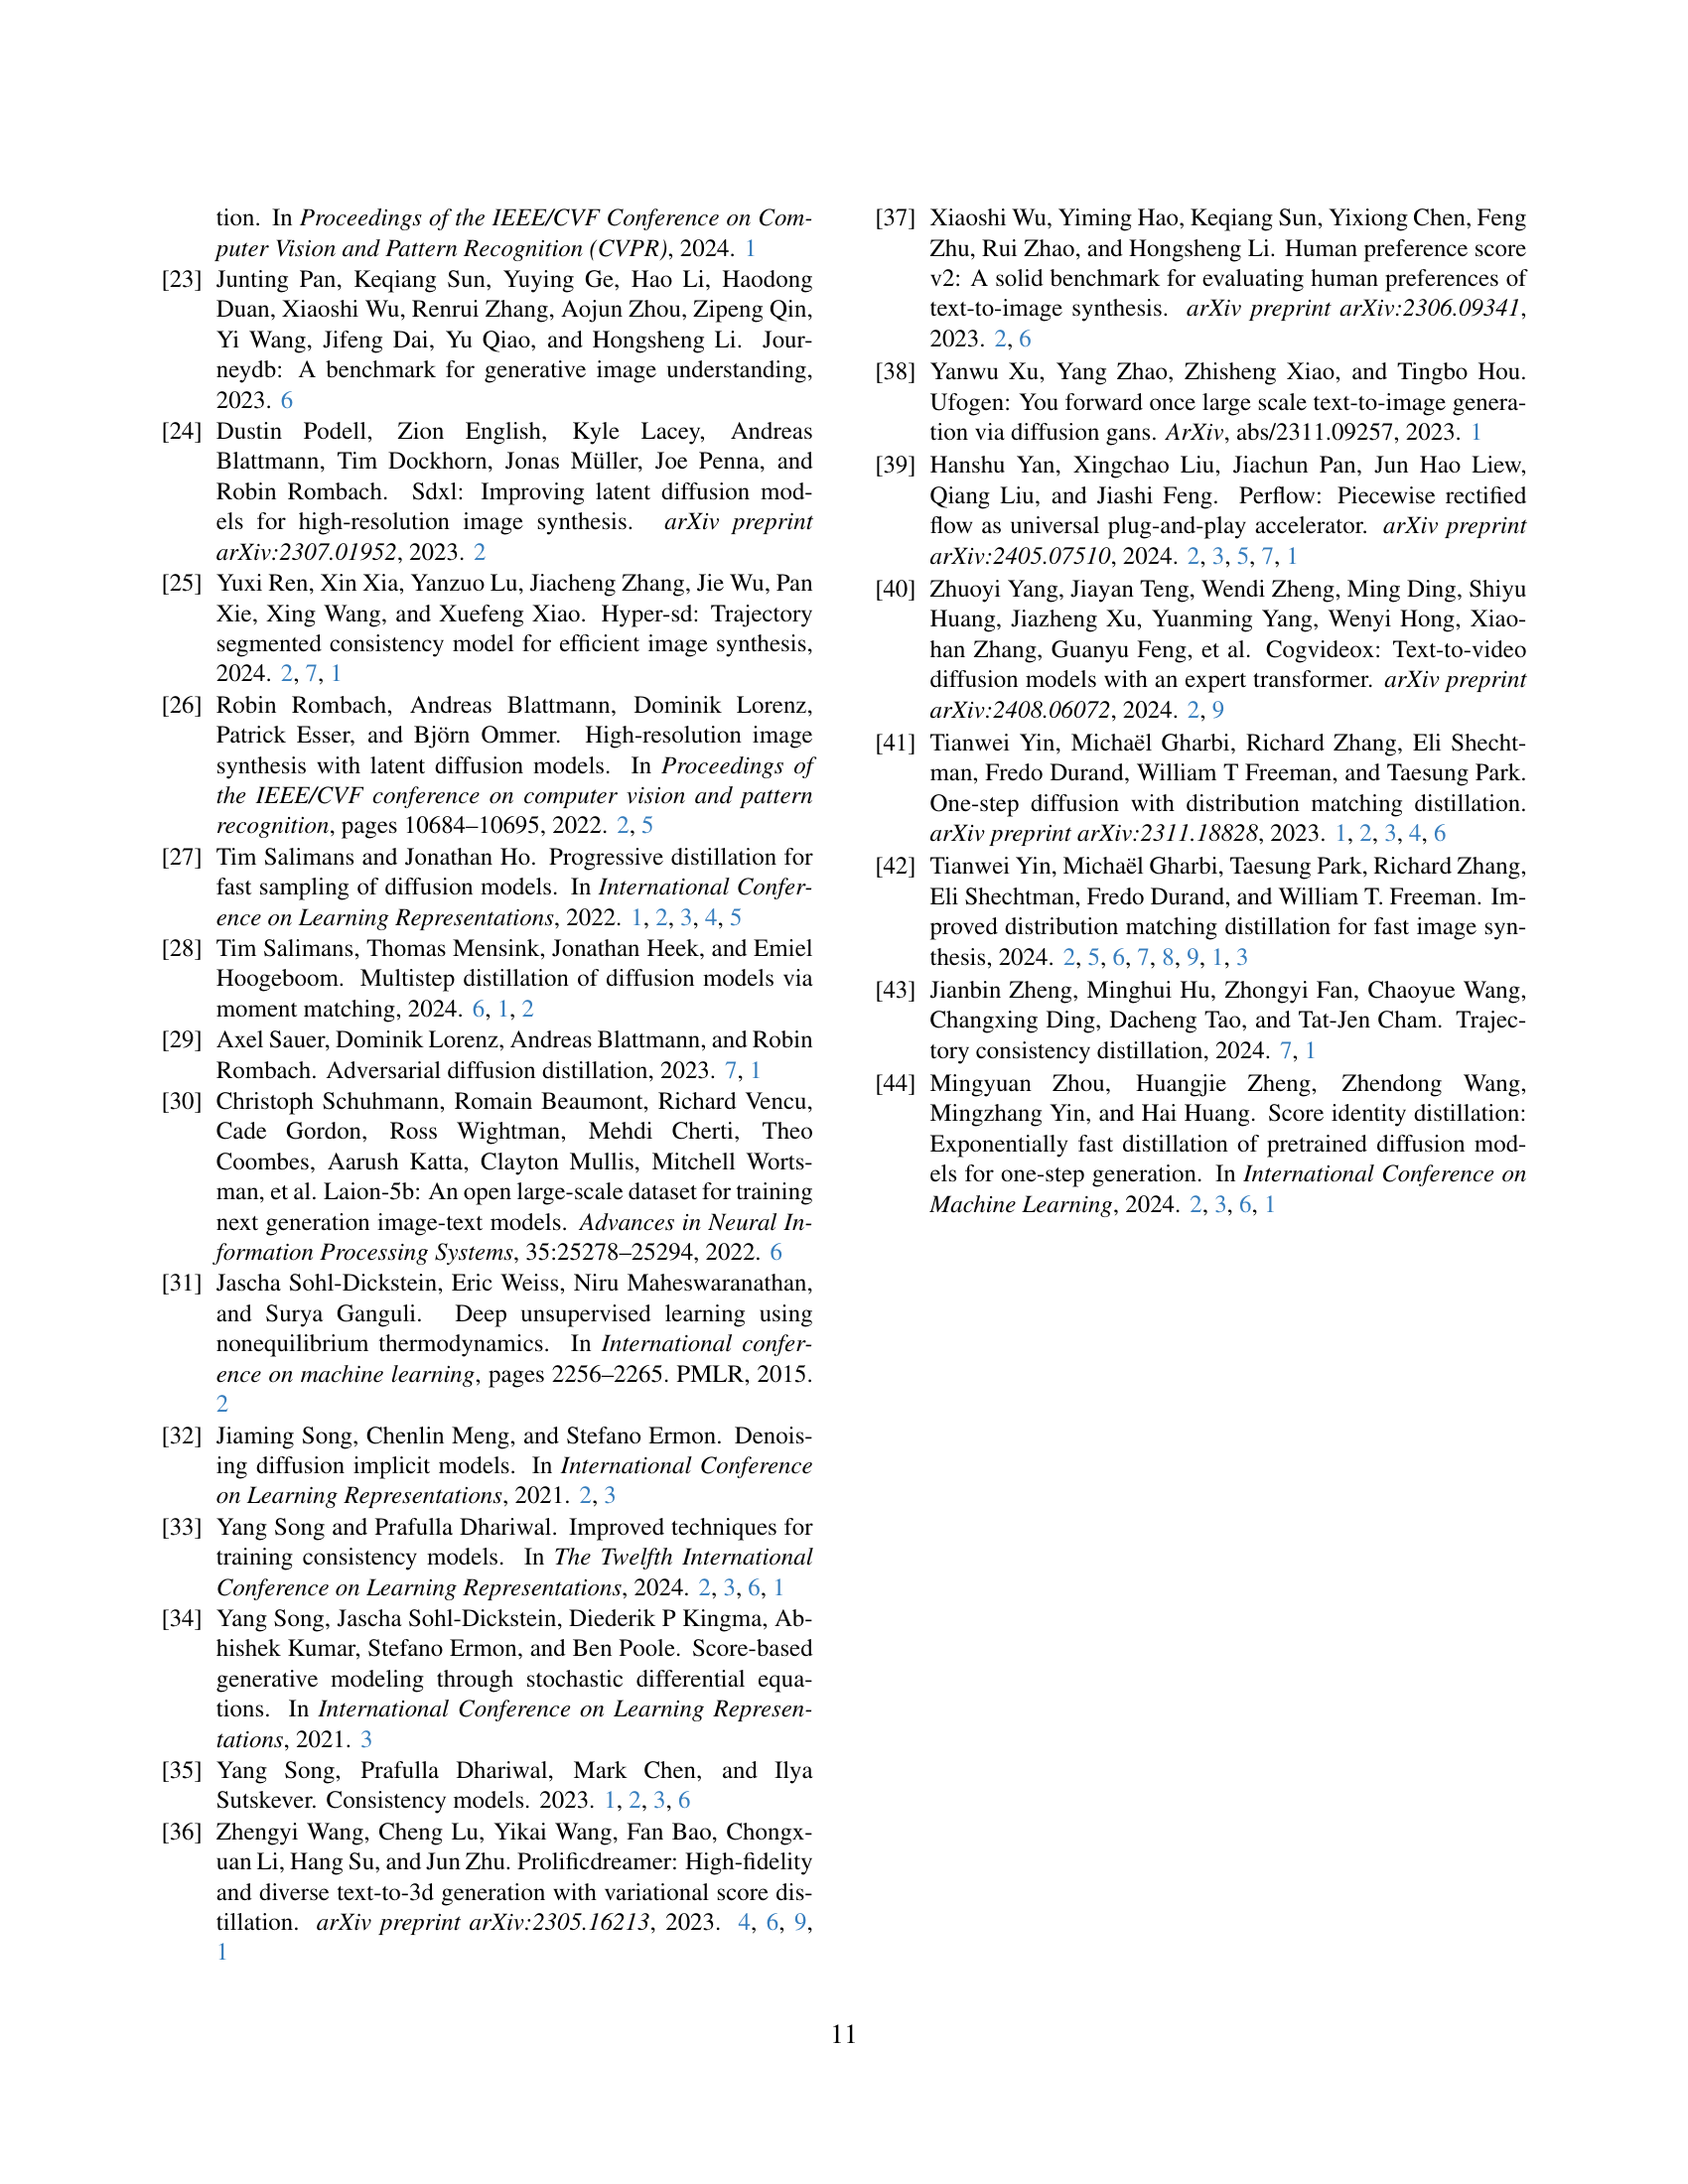
🔼 This figure shows a comparison of the performance of TDM and DMD2 when fine-tuned using LoRA. It compares training time (in hours) and FID (Fréchet Inception Distance) scores, a metric assessing the quality of generated images. The graph illustrates that TDM achieves comparable FID scores to DMD2 but in a significantly shorter training time.
read the caption
Figure 9: Comparison to DMD2 under LoRA fine-tuning.

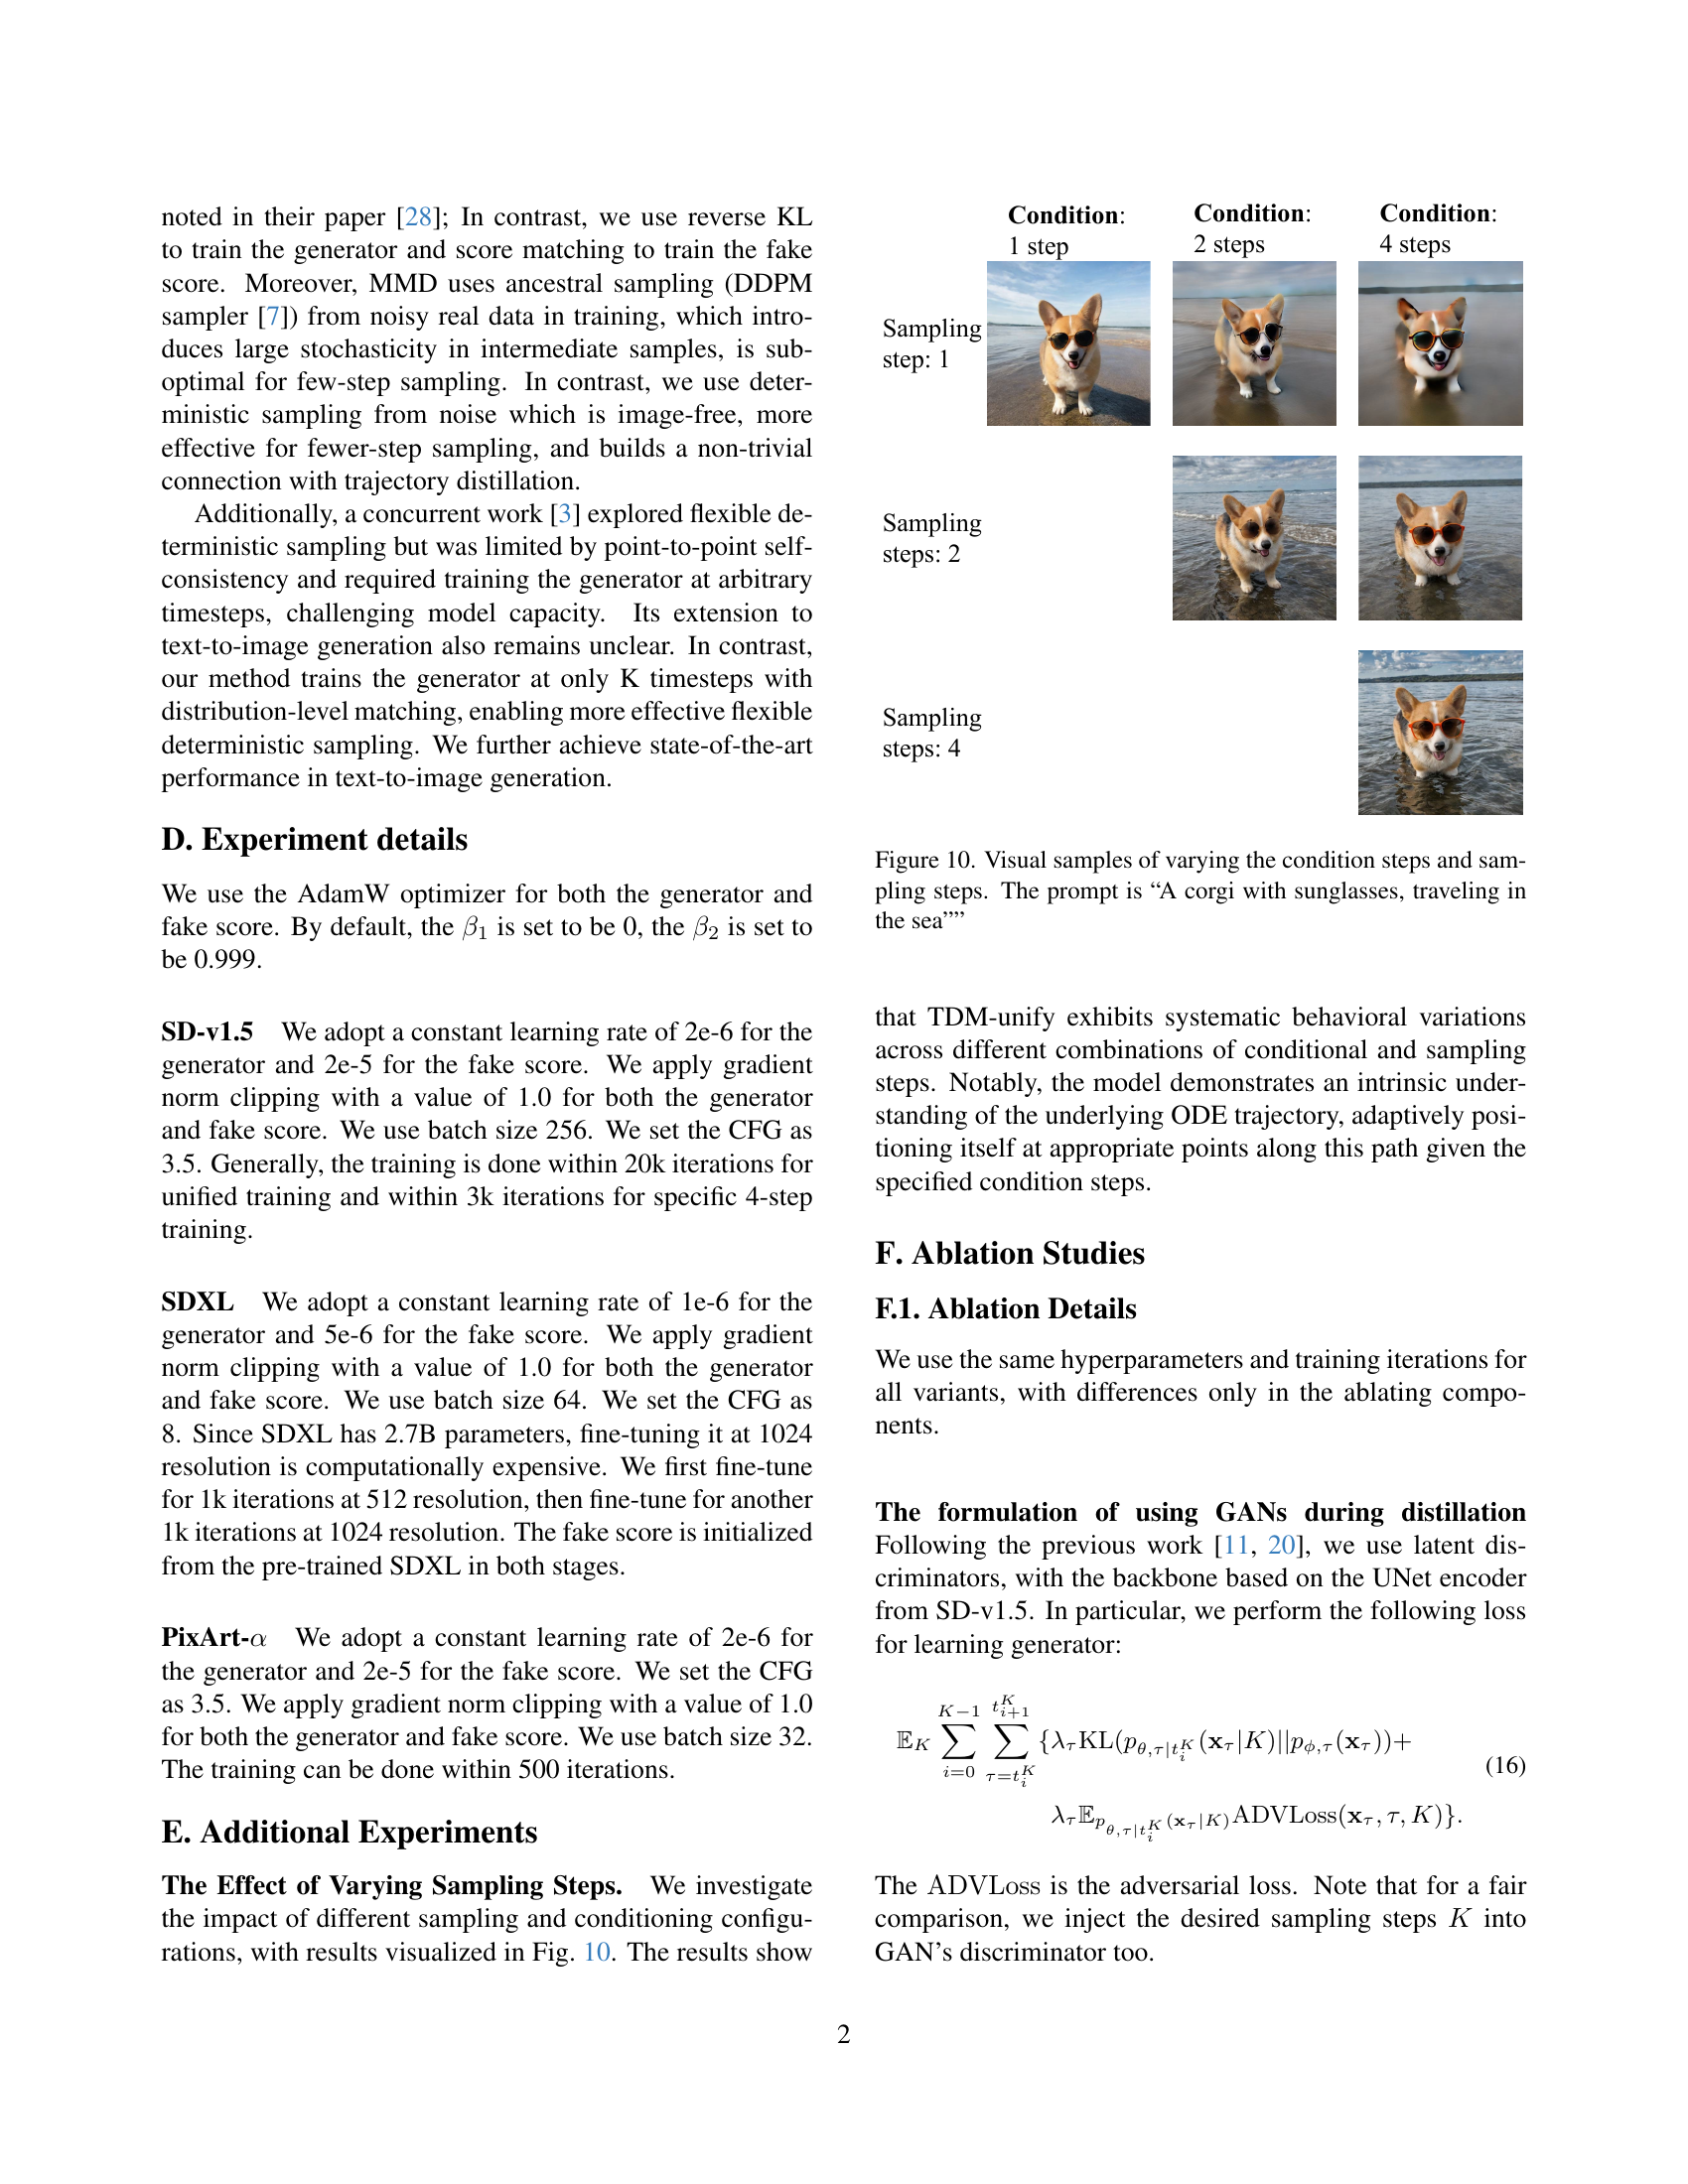
🔼 This figure shows the results of varying both the number of conditioning steps and the number of sampling steps used to generate images with the text prompt, “A corgi with sunglasses, traveling in the sea.” It demonstrates the flexibility of the proposed model (TDM-unify) and its ability to adapt to different numbers of steps while maintaining image quality. Each row represents a different number of sampling steps, while each column represents a different number of conditioning steps. This illustrates how TDM-unify can generate images with consistent results under different settings.
read the caption
Figure 10: Visual samples of varying the condition steps and sampling steps. The prompt is “A corgi with sunglasses, traveling in the sea””

🔼 This figure shows a comparison of images generated by different methods under various training iterations. The goal is to illustrate the rapid convergence of the proposed Trajectory Distribution Matching (TDM) method, which achieves high-quality image generation even with very few training iterations. The images are generated from the same initial noise, allowing for a direct comparison of image quality and showing how TDM quickly approaches the quality of a fully-trained teacher model with minimal training time and resources.
read the caption
(a)

🔼 This figure shows a comparison of generated images by different methods, including the proposed TDM method and several baselines, under different training iterations. The images are generated from the same initial noise to highlight the differences in sample quality and convergence speed. The objective is to visualize how the proposed method (TDM) quickly achieves high-quality samples with only a small number of training iterations, outperforming other methods even with far fewer steps in the sampling process.
read the caption
(b)

🔼 The figure shows qualitative comparisons of four-step generation images by TDM against several competing methods on the SDXL backbone. All images are generated from the same initial noise. The results demonstrate TDM’s superior performance in terms of image quality and adherence to the prompt.
read the caption
(c)

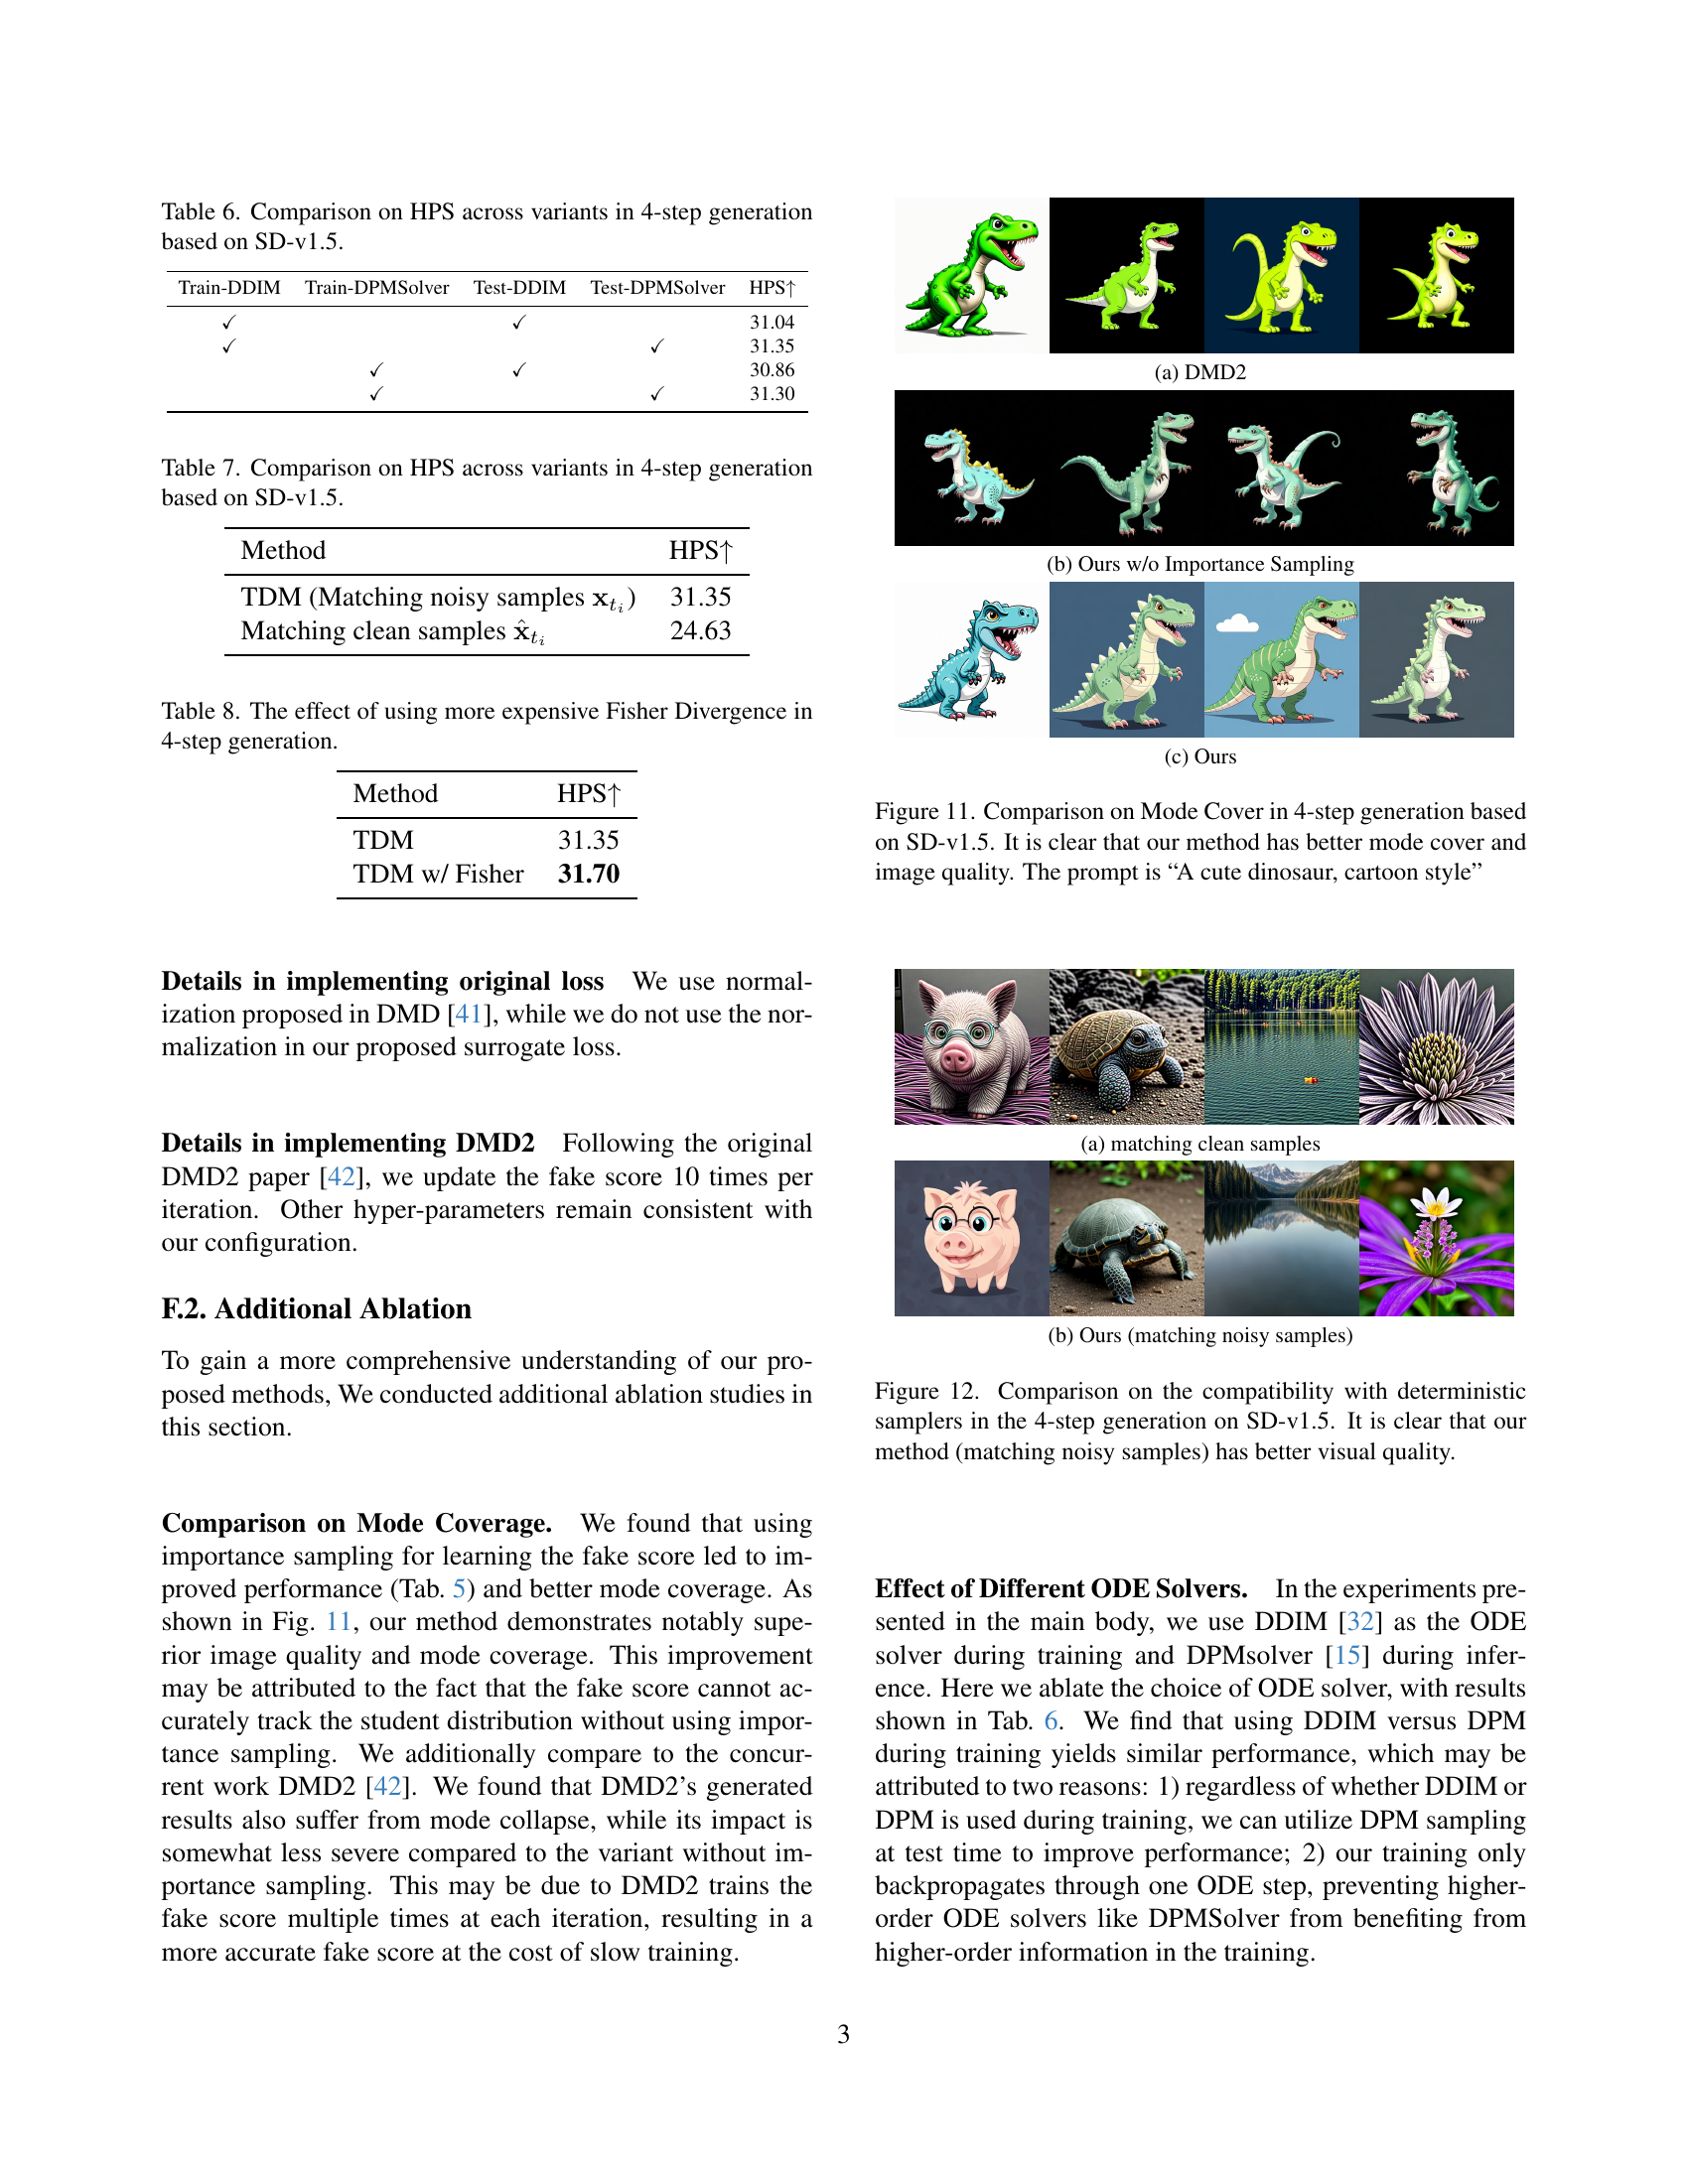
🔼 This figure compares the mode coverage and image quality of 4-step generation using different methods based on the Stable Diffusion v1.5 model. The prompt used is “A cute dinosaur, cartoon style”. The results show that the proposed Trajectory Distribution Matching (TDM) method outperforms other methods, achieving both better mode coverage (representing the diversity of generated images) and improved image quality.
read the caption
Figure 11: Comparison on Mode Cover in 4-step generation based on SD-v1.5. It is clear that our method has better mode cover and image quality. The prompt is “A cute dinosaur, cartoon style”

🔼 This figure shows a comparison of images generated by different methods under various numbers of function evaluations (NFEs). The goal is to demonstrate the impact of the proposed method (TDM) on accelerating diffusion models, particularly in generating high-quality images with only a few steps. The images generated using 50 NFEs serve as a baseline for quality comparison. The remaining images, produced with 4 NFEs by different methods, illustrate the trade-off between speed and quality. The methods compared include LCM, TCD, Lightning, Hyper, and DMD2. The figure showcases the superior quality achieved by TDM even with a significantly reduced number of NFEs.
read the caption
(a)

🔼 This figure shows the comparison between four-step generated images by the proposed Trajectory Distribution Matching (TDM) method under different training iterations and pre-trained diffusion models with 25 steps and 5.5 CFG. It demonstrates the fast convergence of the method without sacrificing image quality.
read the caption
(b)
🔼 This figure compares the results of two different approaches for 4-step image generation using the Stable Diffusion v1.5 model. One approach matches clean samples, while the other matches noisy samples. The image shows that matching noisy samples (the authors’ method) produces significantly higher quality images. This demonstrates the superiority of the authors’ technique when using deterministic samplers in few-step generation.
read the caption
Figure 12: Comparison on the compatibility with deterministic samplers in the 4-step generation on SD-v1.5. It is clear that our method (matching noisy samples) has better visual quality.
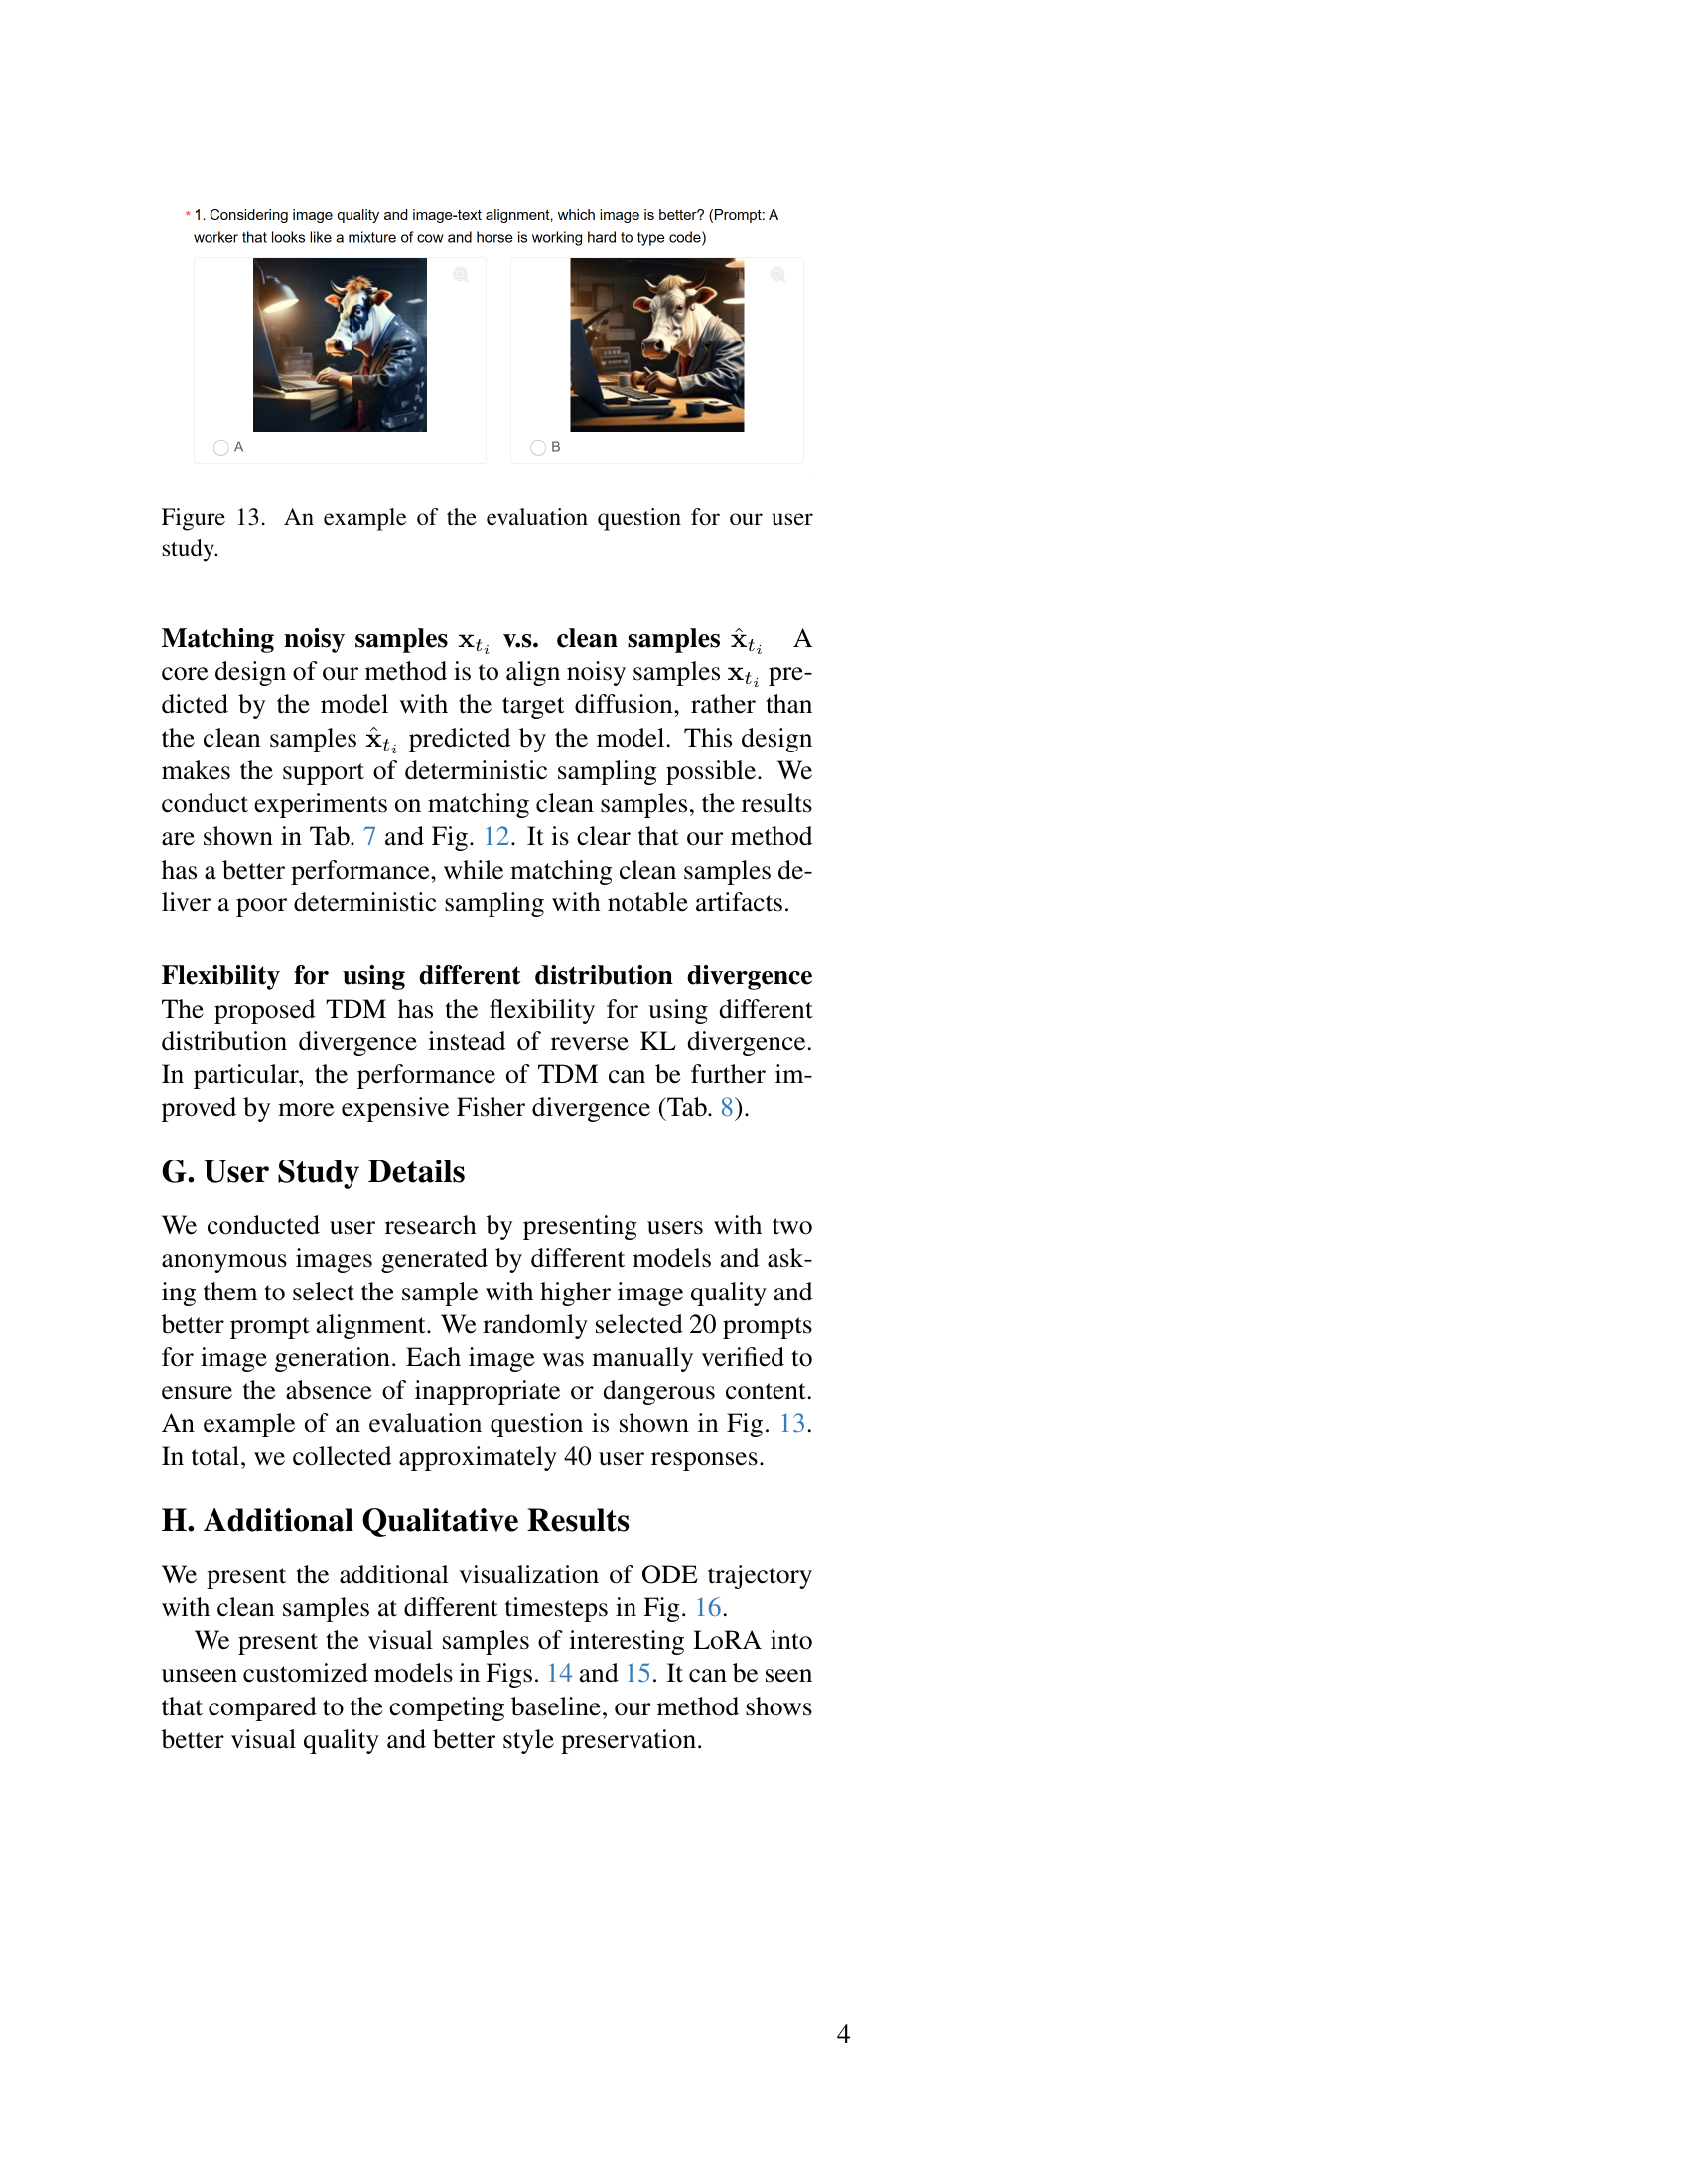
🔼 This figure shows an example question used in the user study to compare image quality and image-text alignment. Two images generated by different methods are shown side-by-side. Users were asked to select the image with better quality and alignment to the prompt. This provides a human-centric evaluation of the generated images from different methods, supplementing machine-based metrics.
read the caption
Figure 13: An example of the evaluation question for our user study.
More on tables
| Model | Backbone | HFL | Steps | HPS | Aes | CS | FID | ||||
|---|---|---|---|---|---|---|---|---|---|---|---|
| Animation | Concept-Art | Painting | Photo | Average | |||||||
| Realistic | SD-v1.5 | No | 25 | 31.28 | 30.08 | 29.73 | 29.02 | 30.03 | 5.88 | 34.41 | - |
| LCM [18] | SD-v1.5 | No | 4 | 28.85 | 27.05 | 28.08 | 26.91 | 27.72 | 5.79 | 30.95 | 26.89 |
| PeRFlow [39] | SD-v1.5 | No | 4 | 26.66 | 25.73 | 25.83 | 24.54 | 25.69 | 5.59 | 31.93 | 25.84 |
| TCD [43] | SD-v1.5 | No | 4 | 28.42 | 26.21 | 26.85 | 26.33 | 26.95 | 5.82 | 31.28 | 28.65 |
| Hyper-SD [25] | SD-v1.5 | Yes | 4 | 31.31 | 30.35 | 30.90 | 28.86 | 30.36 | 5.97 | 32.19 | 37.83 |
| TDM (Ours) | SD-v1.5 | No | 4 | 32.33 | 31.29 | 31.49 | 29.78 | 31.22 | 6.04 | 32.63 | 20.23 |
| Dreamshaper | SD-v1.5 | No | 25 | 31.90 | 30.19 | 30.26 | 29.28 | 30.41 | 6.02 | 34.20 | - |
| LCM [18] | SD-v1.5 | No | 4 | 29.78 | 28.25 | 29.11 | 27.23 | 28.59 | 5.98 | 31.10 | 25.36 |
| PeRFlow [39] | SD-v1.5 | No | 4 | 27.37 | 26.50 | 26.66 | 25.16 | 26.42 | 5.74 | 32.15 | 23.49 |
| TCD [43] | SD-v1.5 | No | 4 | 29.46 | 27.49 | 28.26 | 26.42 | 27.91 | 6.01 | 31.28 | 28.65 |
| Hyper-SD [25] | SD-v1.5 | Yes | 4 | 32.05 | 30.98 | 31.37 | 28.87 | 30.82 | 6.13 | 31.54 | 38.70 |
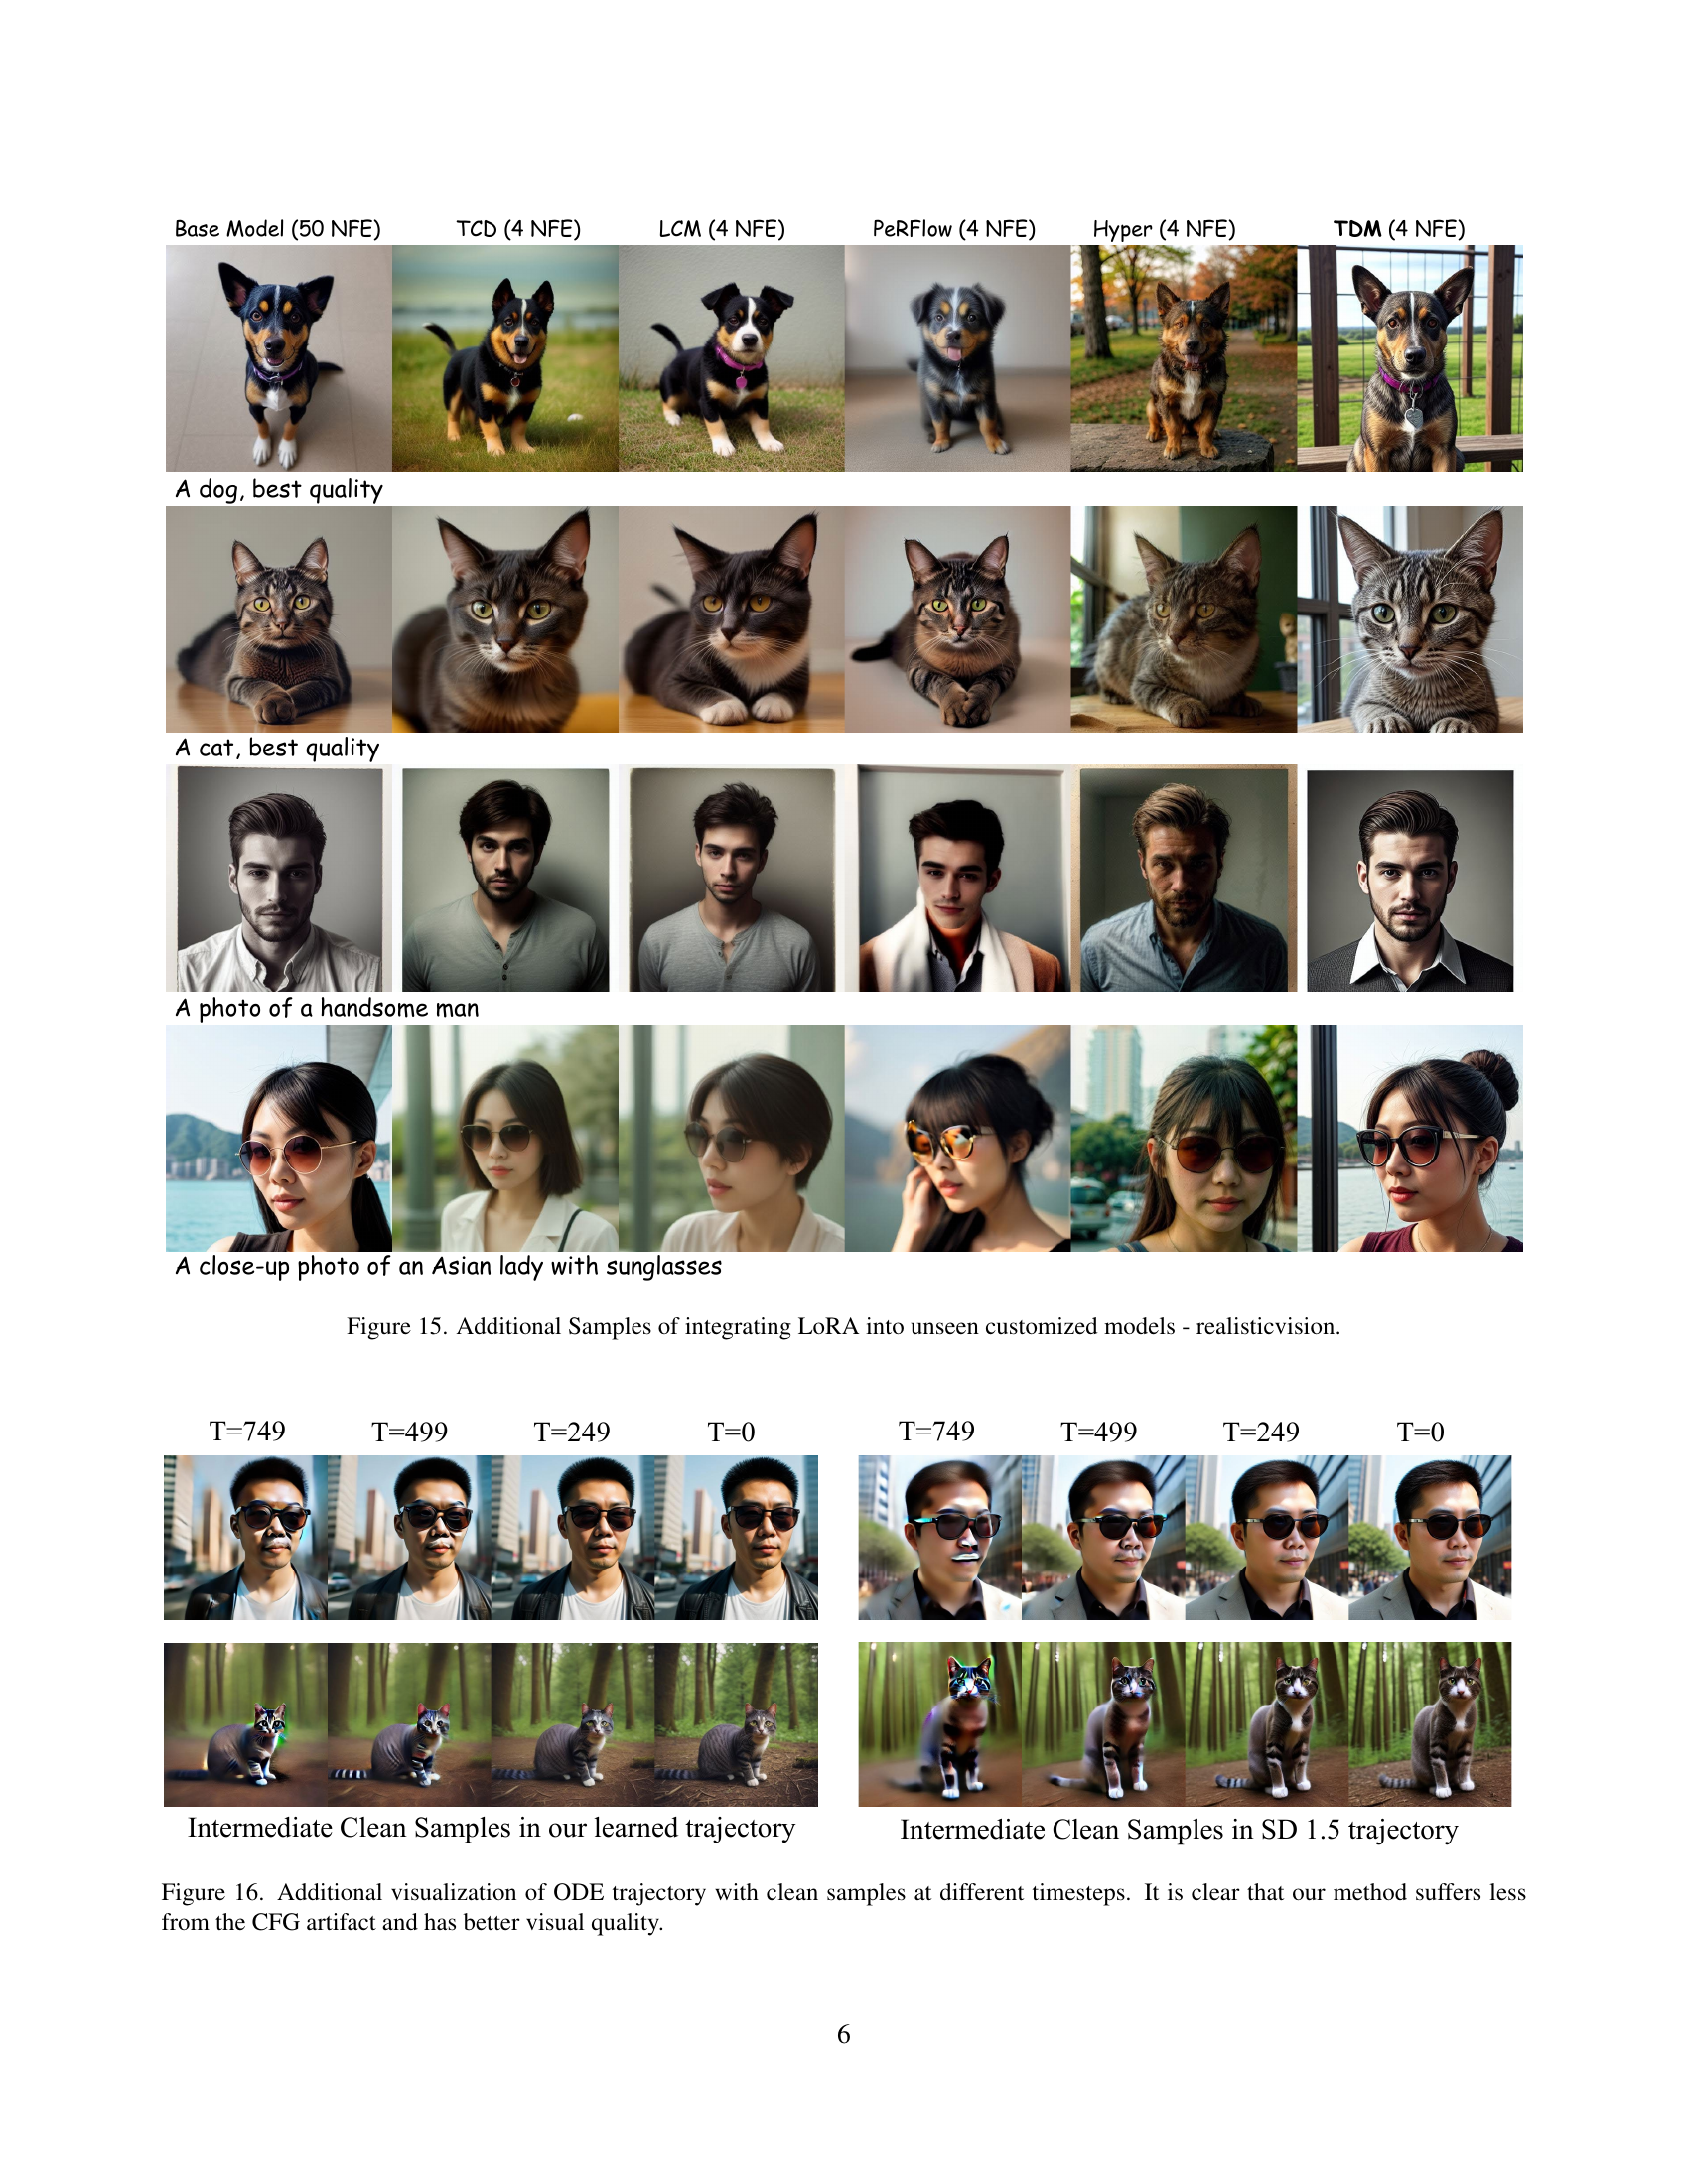
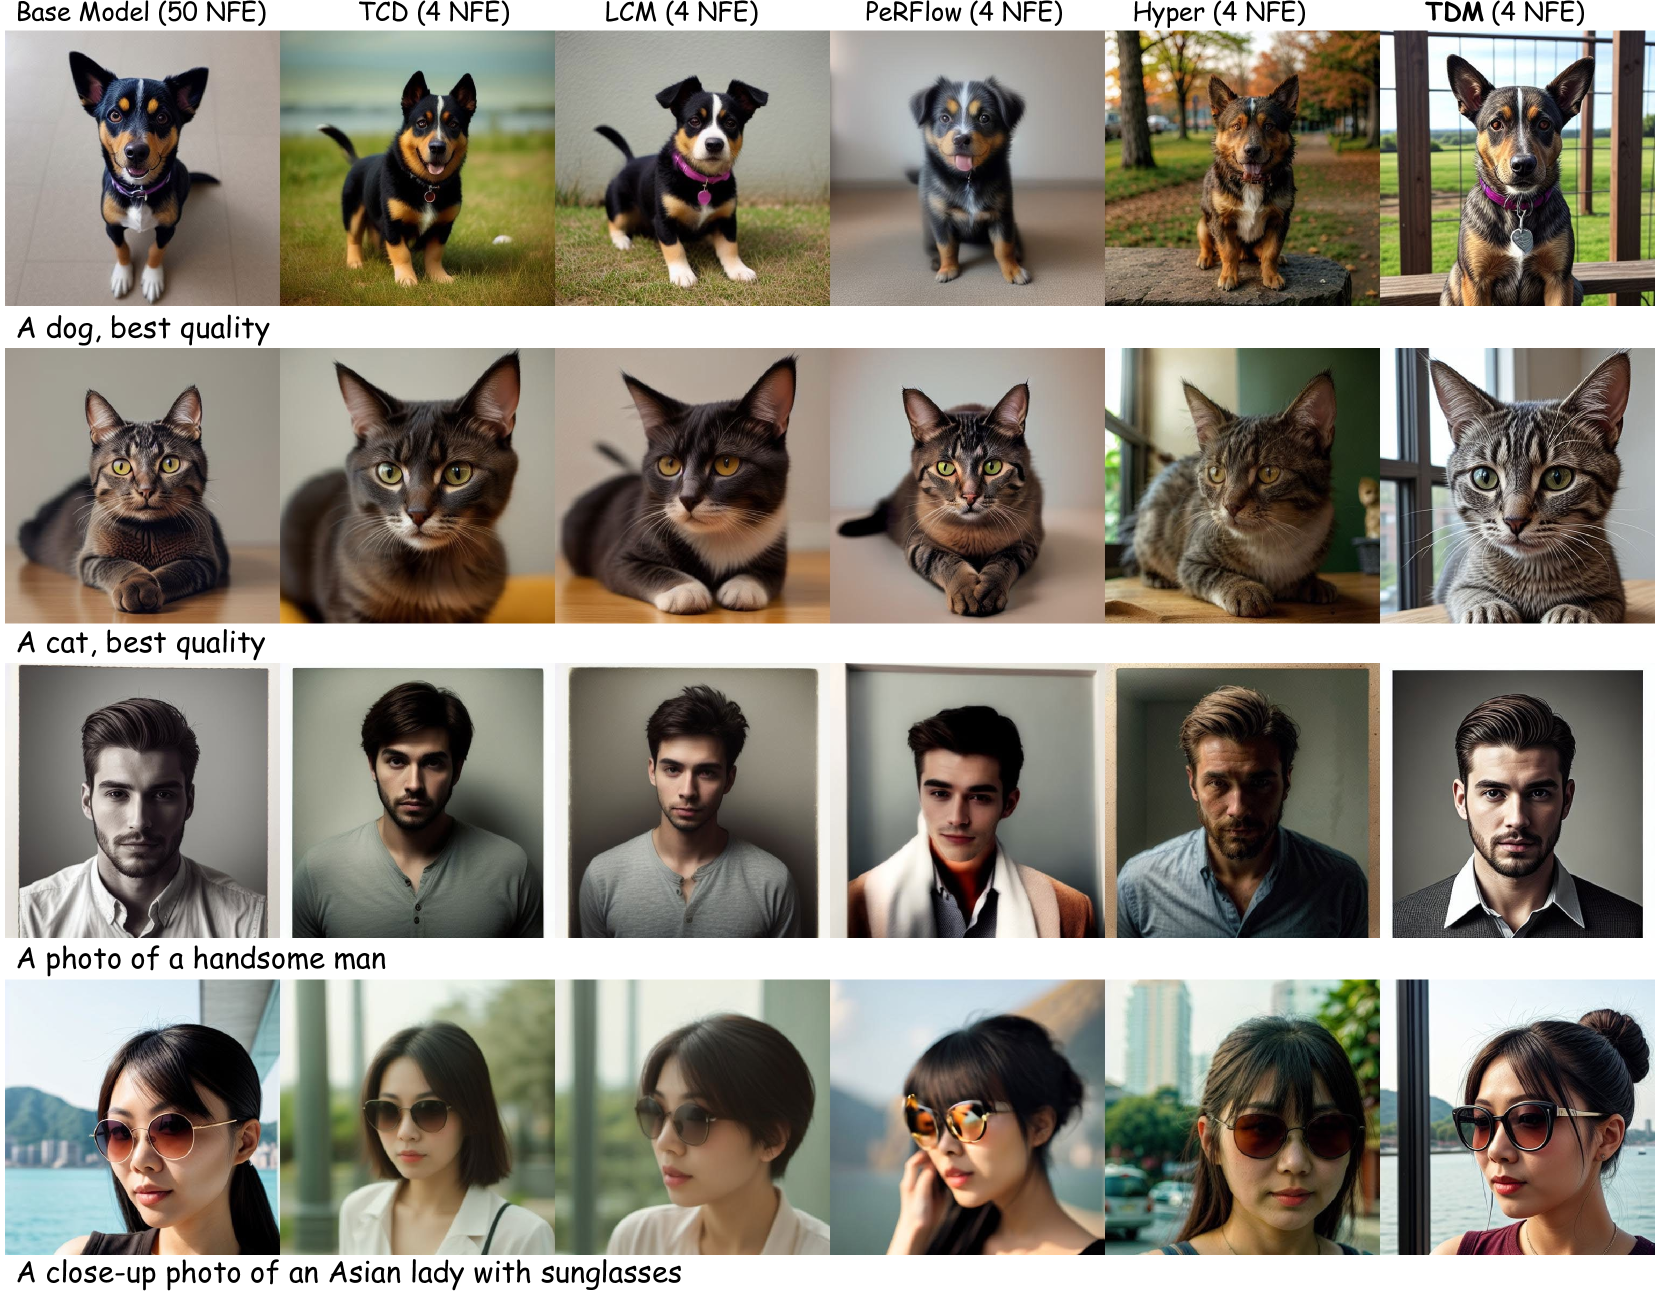
| TDM (Ours) | SD-v1.5 | No | 4 | 32.91 | 31.73 | 32.18 | 29.95 | 31.37 | 6.22 | 32.30 | 20.44 |
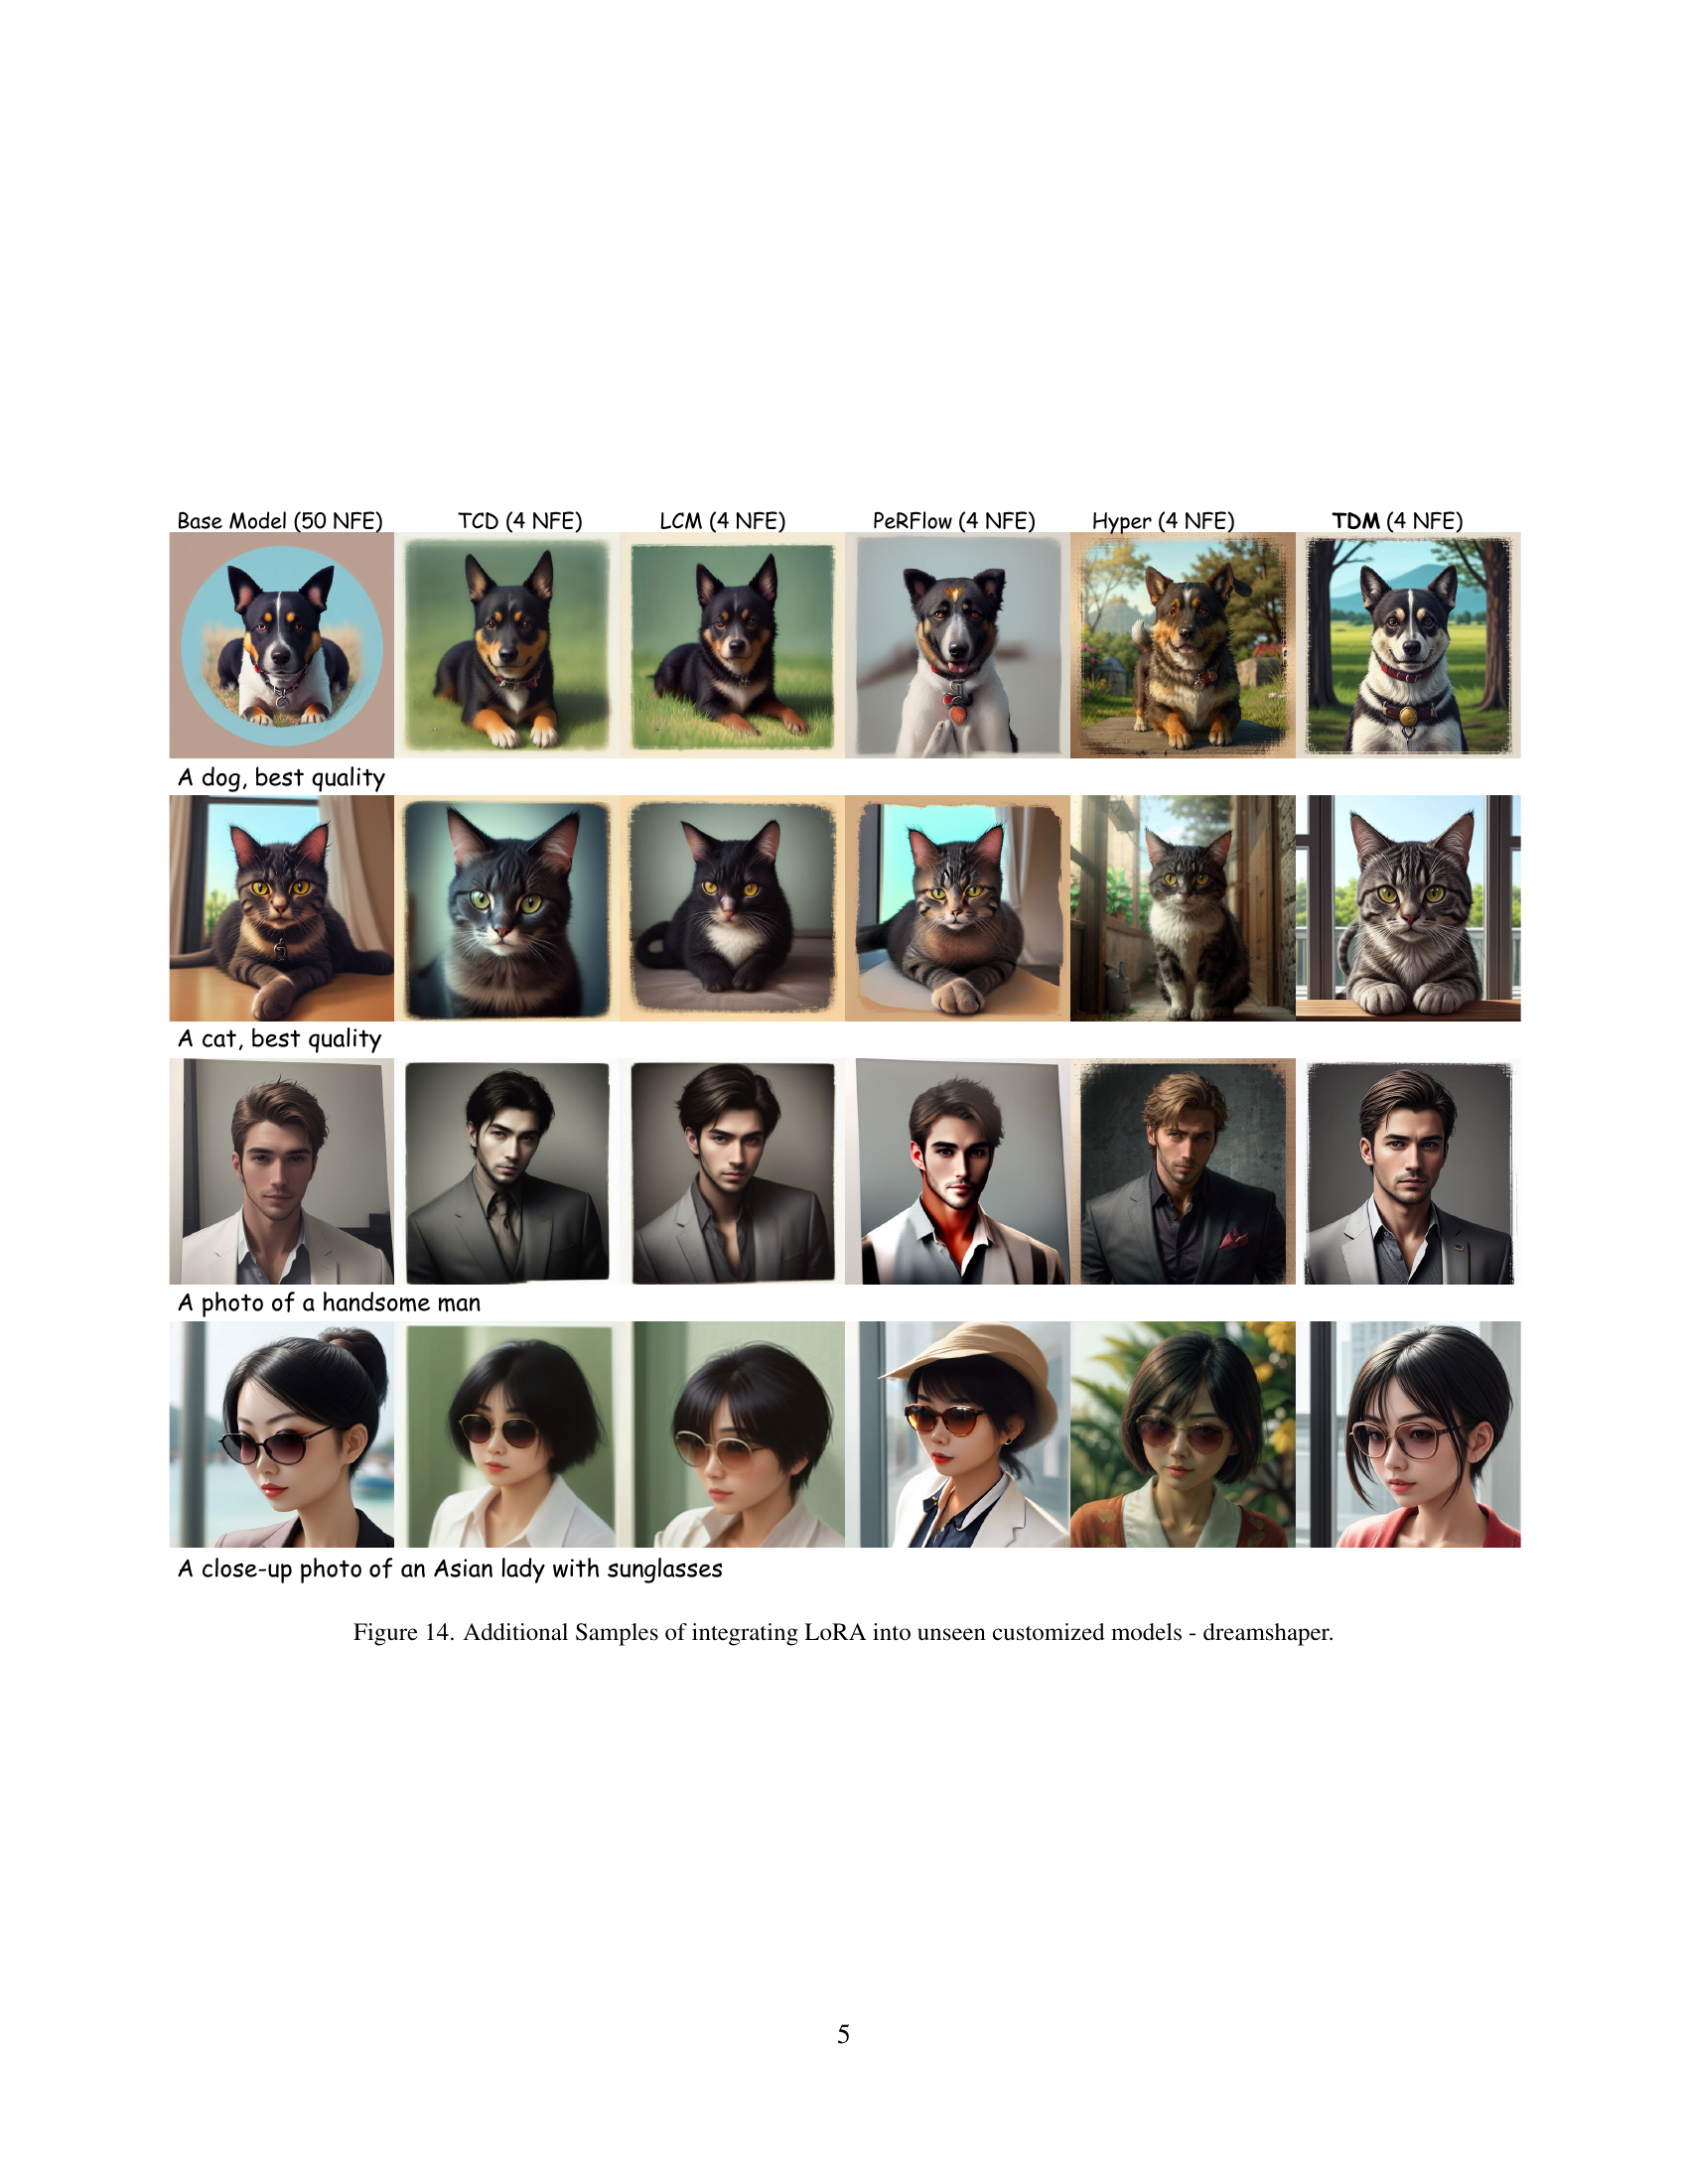
🔼 This table compares the performance of various diffusion model distillation methods when integrating LoRA (Low-Rank Adaptation) into unseen, customized models. Metrics include the Human Preference Score (HPS), which measures user preference for generated images; the Aesthetic Score (AeS), which quantifies image quality; the CLIP Score (CS), evaluating both image quality and text-image alignment; and the Fréchet Inception Distance (FID), which assesses style preservation by comparing the generated images to the original model’s output. The results are presented for different model backbones and numbers of sampling steps. The presence or absence of human feedback learning (HFL), which can artificially inflate metrics, is also noted. The table highlights the best-performing distillation method in each category.
read the caption
Table 2: Comparison of machine metrics on integrating LoRA into unseen customized models across state-of-the-art methods. HFL denotes human feedback learning which might hack the machine metrics. The FID is computed between teacher samples and student samples for measuring the style preservation. We highlight the best among distillation methods.
| Method | Backbone | NFE | HPS | Training Cost |
|---|---|---|---|---|
| DMD2 [42] | SD-v1.5 | 4 | 31.53 | 30+ A800 Days |
| TDM-unify-GAN | SD-v1.5 | 4 | 32.40 | 4 A800 Days |
| TDM-unify-SFT | SD-v1.5 | 4 | 32.77 | 3 A800 Days |
| LCM [18] | SDXL | 4 | 29.41 | 32 A100 Days |
| DMD2 [42] | SDXL | 4 | 31.46 | 160 A100 Days |
| TDM | SDXL | 4 | 34.88 | 2 A800 Days |
| LCM [18] | PixArt- | 4 | 30.55 | 14.5 A100 Days |
| YOSO [20] | PixArt- | 4 | 30.60 | 10 A800 Days |
| TDM | PixArt- | 4 | 32.01 | 2 A800 Hours |
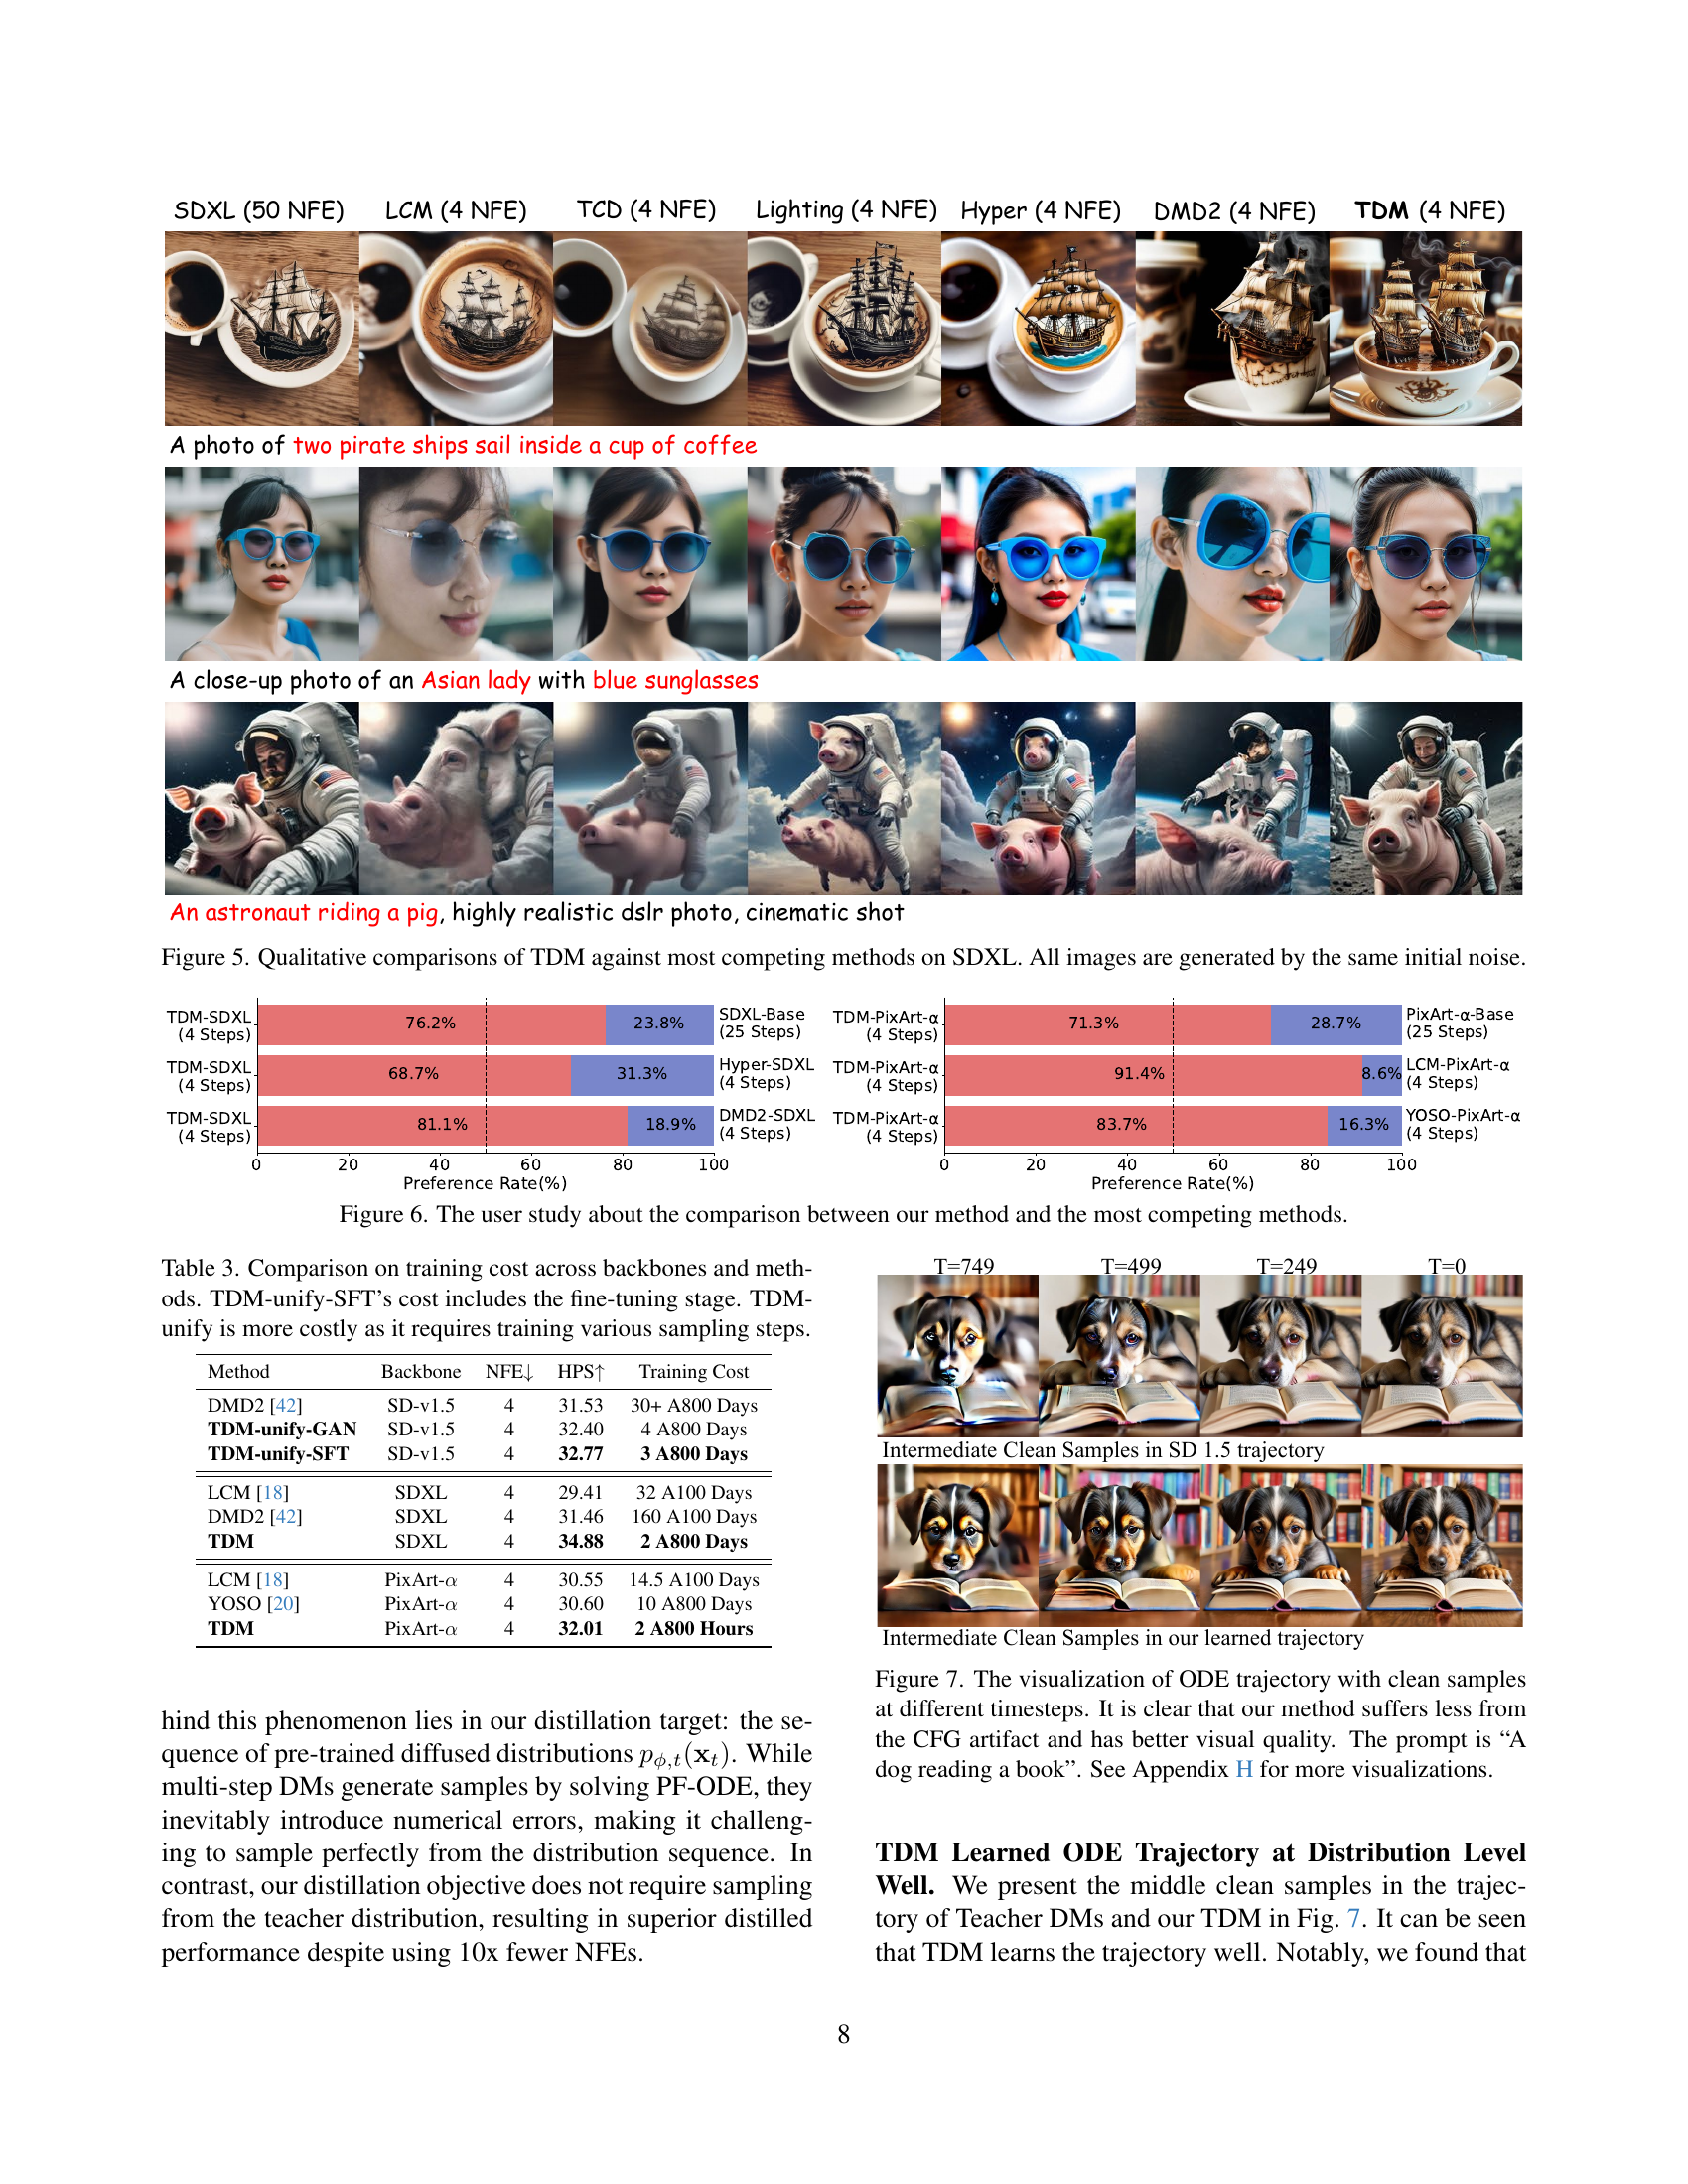
🔼 This table compares the training costs of various diffusion models across different backbones (SD-v1.5, SDXL, PixArt-a). It shows the number of network function evaluations (NFEs), the Human Preference Score (HPS), and the training cost in terms of A100 or A800 GPU days. Note that TDM-unify-SFT’s cost includes a pre-training fine-tuning step, and that TDM-unify has a higher cost because it trains for multiple sampling steps.
read the caption
Table 3: Comparison on training cost across backbones and methods. TDM-unify-SFT’s cost includes the fine-tuning stage. TDM-unify is more costly as it requires training various sampling steps.
| Method | Total Score | Quality Score | Semantic Score |
|---|---|---|---|
| CogVideoX-2B | 80.91 | 82.18 | 75.83 |
| TDM (4 NFE) | 81.65 | 82.66 | 77.64 |
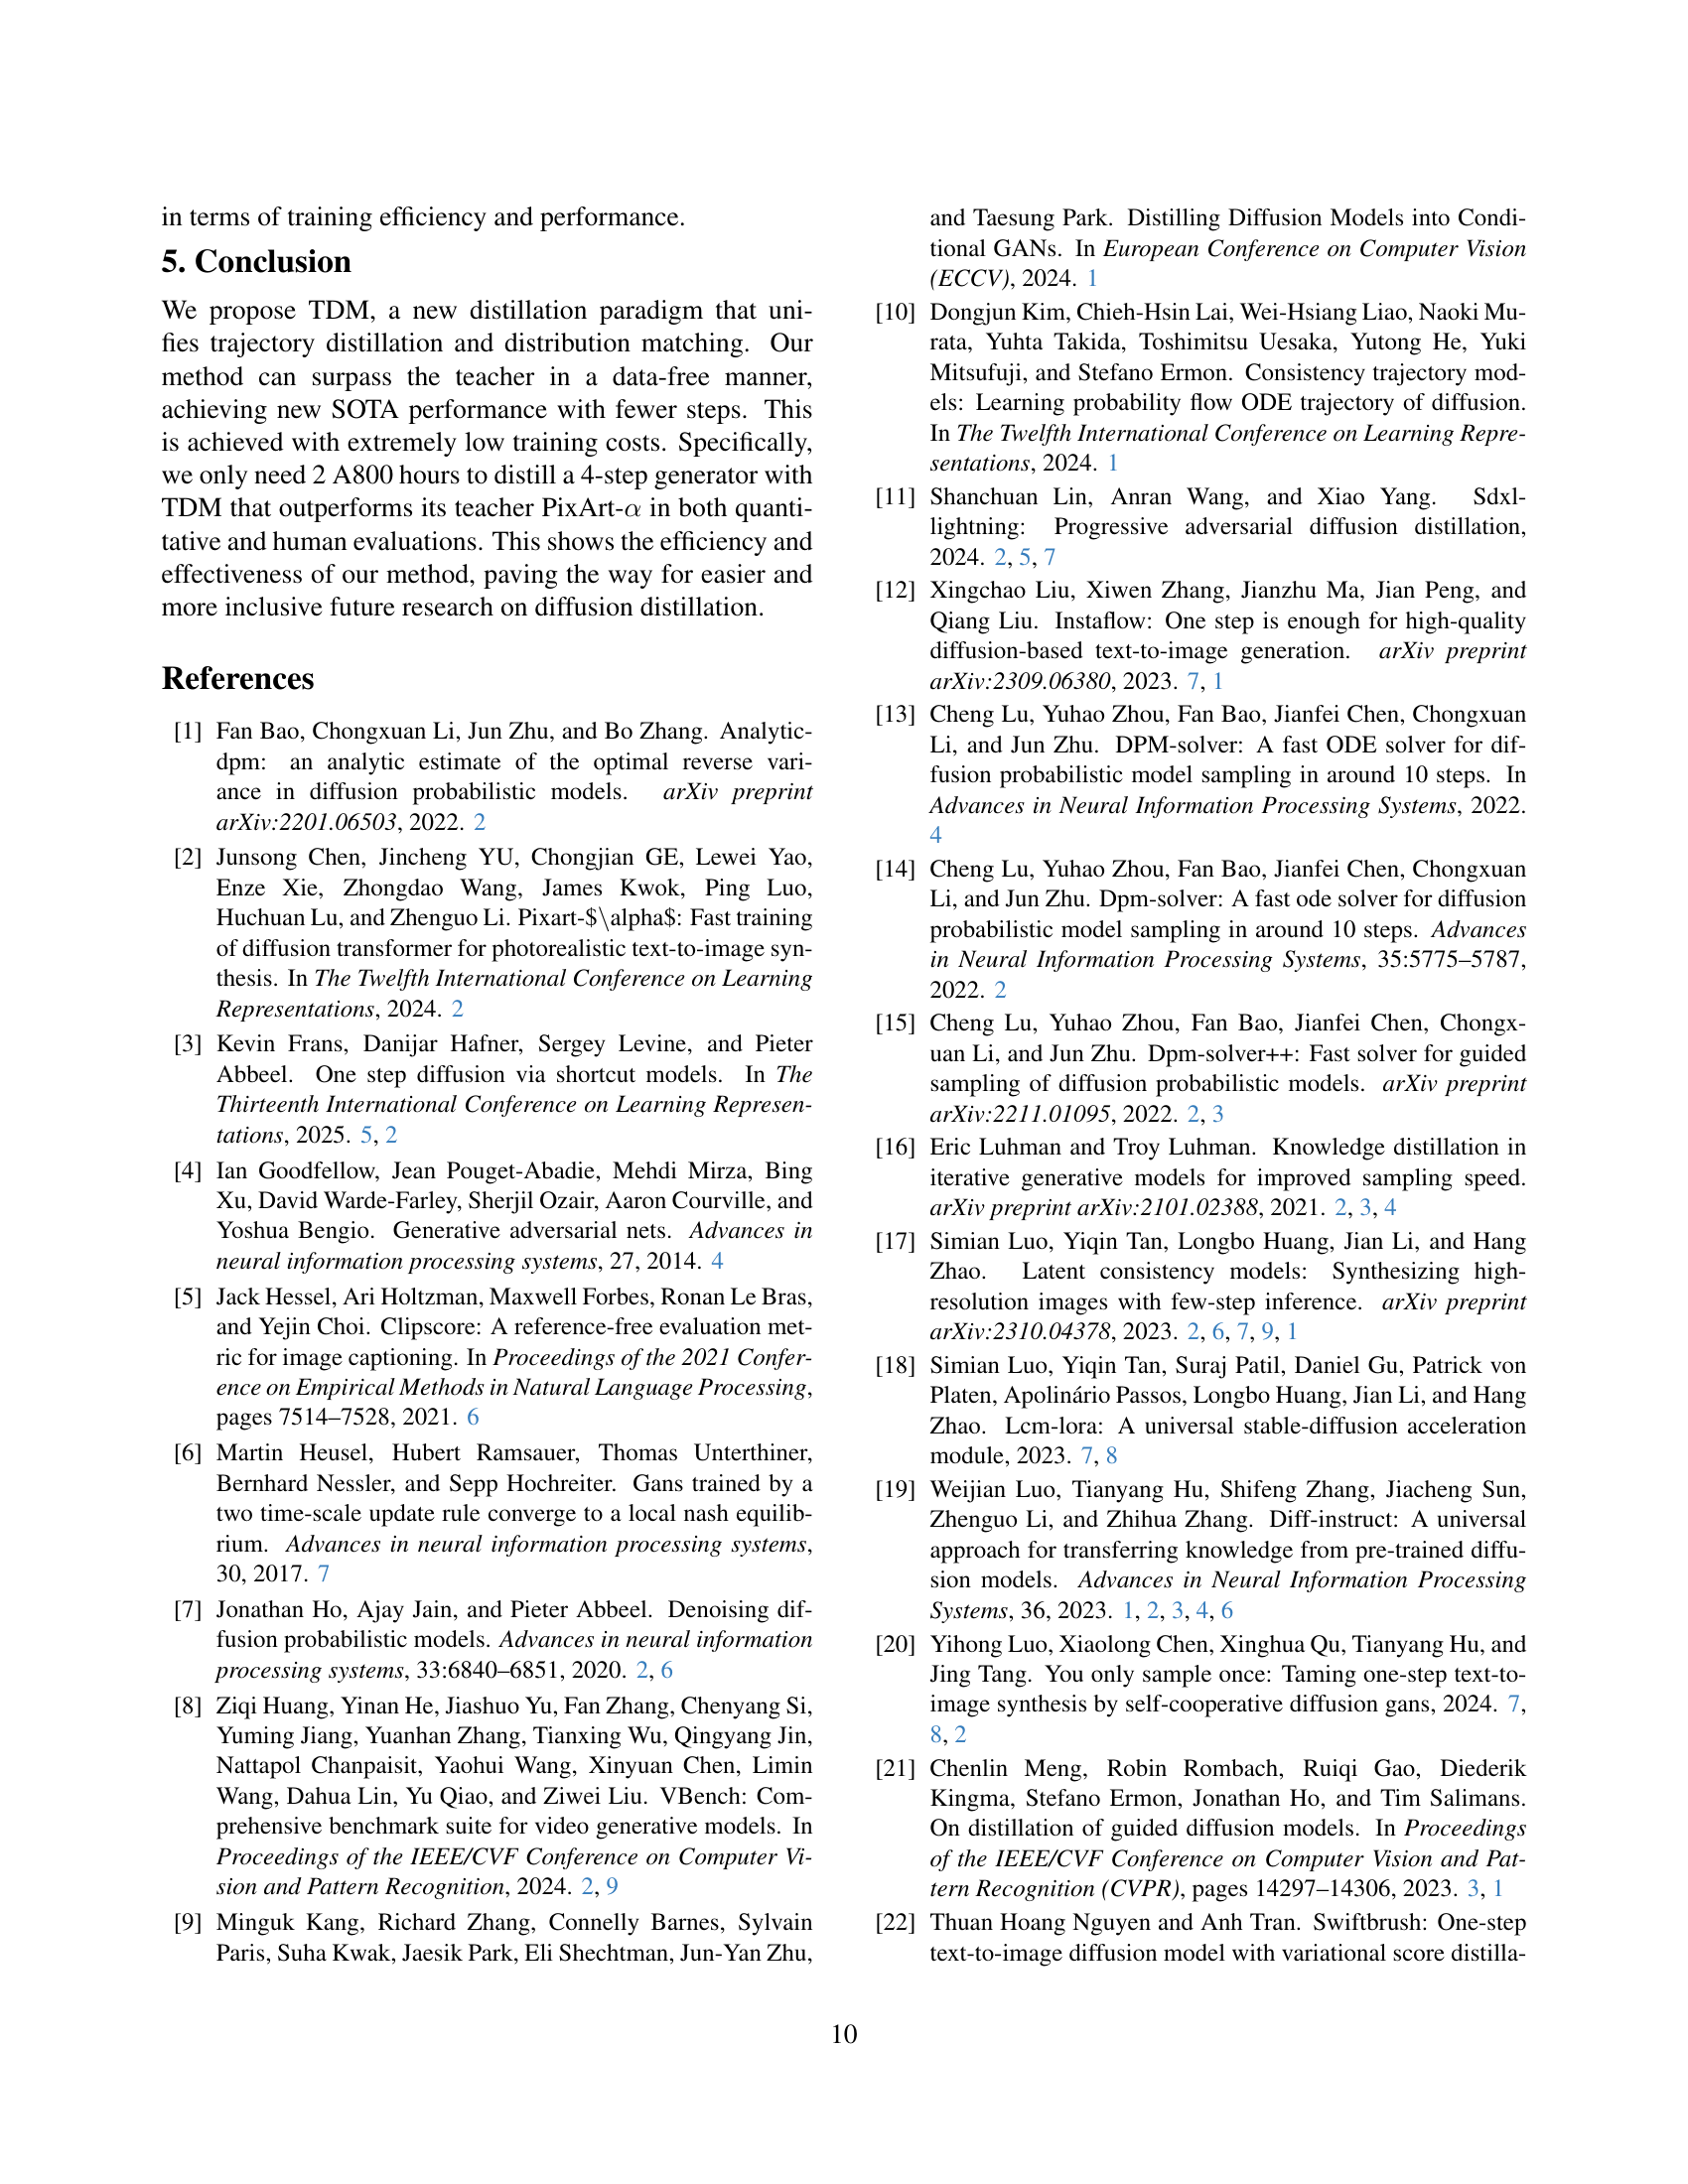
🔼 This table presents a quantitative evaluation of the TDM model’s performance on text-to-video generation, using the VBench benchmark. It compares the overall score, quality score, and semantic score achieved by the CogVideoX-2B model (the teacher model) against the scores obtained by the TDM model (the student model) which uses only 4 noise-free evaluations (NFE) during sampling. This comparison highlights the significant improvement achieved by TDM in terms of efficiency and quality.
read the caption
Table 4: Evaluation of text-to-video on Vbench.
| Method | 1 Step | 2steps | 4 Steps |
|---|---|---|---|
| TDM-unify | 28.90 | 30.52 | 31.31 |
| w/o Conditioned on Sampling Steps | 26.11 | 29.15 | 29.39 |
| w/o Surrogate Training Objective | 28.23 | 30.20 | 30.85 |
| w/o unify training (TDM-4step) | 20.81 | 29.08 | 31.35 |
| TDM-4Step | / | / | 31.35 |
| w/o Importance Sampling | / | / | 29.27 |
🔼 This table presents a comparison of Human Preference Scores (HPS) for different variations of the Trajectory Distribution Matching (TDM) model, all based on the Stable Diffusion v1.5 model. It shows the impact of removing or modifying different components of the TDM method (e.g., removing the conditioned sampling steps, removing the surrogate training objective, removing importance sampling, and using the basic TDM 4-step model). This allows for an evaluation of the individual contributions of these elements to the overall performance.
read the caption
Table 5: Comparison on HPS across variants based on SD-v1.5.
| Train-DDIM | Train-DPMSolver | Test-DDIM | Test-DPMSolver | HPS |
| ✓ | ✓ | 31.04 | ||
| ✓ | ✓ | 31.35 | ||
| ✓ | ✓ | 30.86 | ||
| ✓ | ✓ | 31.30 |
🔼 This table presents a comparison of Human Preference Scores (HPS) achieved by different methods for 4-step image generation using the Stable Diffusion v1.5 model. It shows the impact of various training techniques and solver choices on the final quality of the generated images, as judged by human evaluators.
read the caption
Table 6: Comparison on HPS across variants in 4-step generation based on SD-v1.5.
| Method | HPS |
|---|---|
| TDM (Matching noisy samples ) | 31.35 |
| Matching clean samples | 24.63 |
🔼 This table presents a comparison of Human Preference Scores (HPS) for different variations of a 4-step image generation model based on the Stable Diffusion v1.5 (SD-v1.5) architecture. It shows the impact of the method used for matching samples (noisy samples versus clean samples) during the training process on the overall quality of generated images as measured by human evaluation.
read the caption
Table 7: Comparison on HPS across variants in 4-step generation based on SD-v1.5.
| Method | HPS |
|---|---|
| TDM | 31.35 |
| TDM w/ Fisher | 31.70 |
🔼 This table presents the results of an ablation study evaluating the impact of using the Fisher divergence, a more computationally expensive metric than the Kullback-Leibler (KL) divergence, as the loss function in the Trajectory Distribution Matching (TDM) model for 4-step image generation. It compares the performance, specifically the Human Preference Score (HPS), achieved using the standard KL divergence against that achieved when employing the Fisher divergence.
read the caption
Table 8: The effect of using more expensive Fisher Divergence in 4-step generation.
Full paper#