TL;DR#
Large Language Models (LLMs) have shown great performance on medical question-answering, but it’s hard to meaningfully evaluate them and distinguish advanced methods. Current evaluations have limitations such as many straight-forward questions, inconsistent sampling/evaluation, and lack of analysis between performance, cost, and time. Because of these issues, advanced LLMs need a better way to test their medical reasoning capabilities.
This paper introduces the MEDAGENTSBENCH, a new benchmark that focuses on complex medical questions requiring multi-step clinical reasoning, diagnosis, and treatment planning. The benchmark addresses the issues of previous tests using seven established medical datasets. Experiments show that thinking models (DEEPSEEK R1 and OPENAI 03) do better and search-based methods offer good performance-to-cost ratios. This analysis finds gaps between model families on complex questions and identifies optimal model choices based on computational constraints.
Key Takeaways#
Why does it matter?#
This paper is important because it addresses the critical need for more rigorous evaluation in medical AI by providing a new benchmark focusing on complex reasoning. The MEDAGENTSBENCH allows researchers to identify performance gaps in current models and provides insights into cost-effective strategies. It allows for better benchmarking for medical AI methods.
Visual Insights#

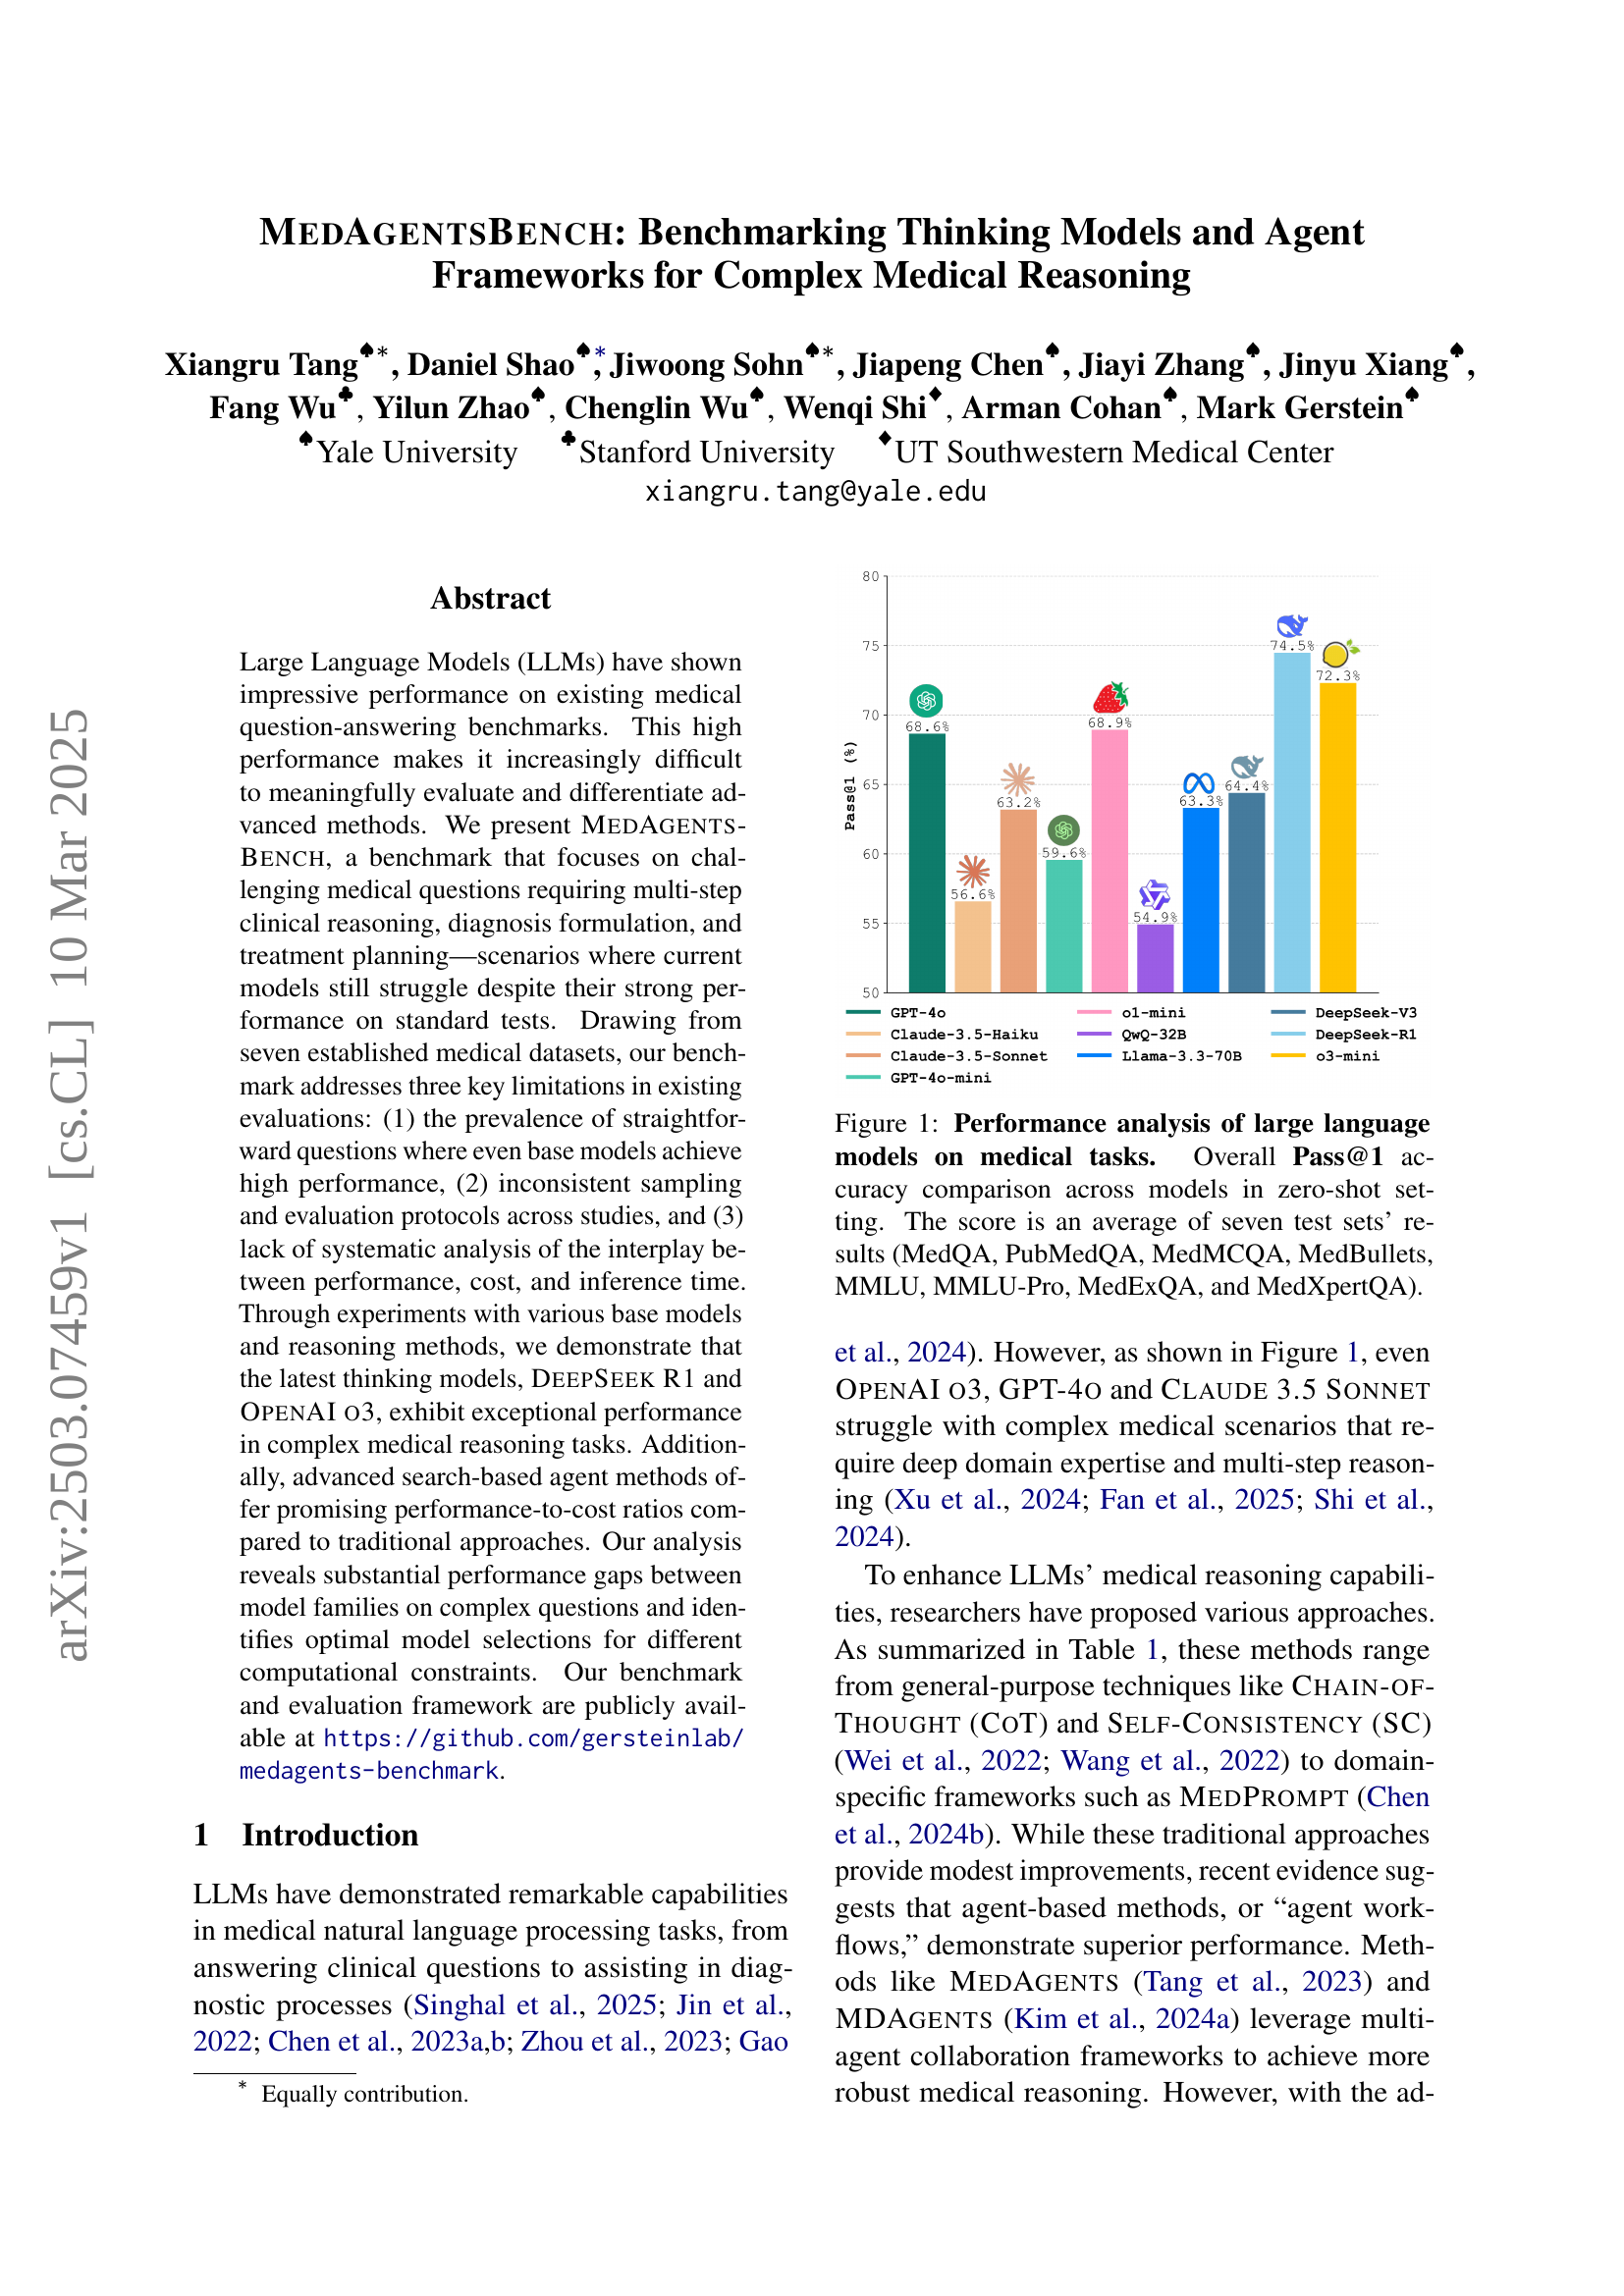
🔼 This figure compares the zero-shot performance of various large language models (LLMs) on seven medical question answering datasets: MedQA, PubMedQA, MedMCQA, MedBullets, MMLU, MMLU-Pro, MedExQA, and MedXpertQA. The y-axis represents the overall Pass@1 accuracy, which is the percentage of questions correctly answered by the model with the highest probability. The x-axis shows the different LLMs tested. Each bar represents the average Pass@1 accuracy across all seven datasets. This visualization helps to benchmark the performance of different LLMs on complex medical reasoning tasks.
read the caption
Figure 1: Performance analysis of large language models on medical tasks. Overall Pass@1 accuracy comparison across models in zero-shot setting. The score is an average of seven test sets’ results (MedQA, PubMedQA, MedMCQA, MedBullets, MMLU, MMLU-Pro, MedExQA, and MedXpertQA).
| Method | Description |
| Chain-of-Thought Wei et al. (2022) | Elicits reasoning in large language models |
| Self-Consistency Wang et al. (2022) | Improves chain of thought reasoning through sampling diverse reasoning paths |
| MedPrompt Chen et al. (2024b) | Multi-round prompting with ensemble voting for medical question answering |
| Multi-Persona Wang et al. (2023) | Task-solving agent through multi-persona self-collaboration |
| Self-Refine Madaan et al. (2024) | Iterative refinement with self-feedback |
| MedAgents Tang et al. (2023) | Collaborative multi-agent framework for zero-shot medical decision making |
| MDAgents Kim et al. (2024a) | Dynamic multi-agent collaboration framework for medical reasoning |
| AFlow Zhang et al. (2024) | Automating agentic workflow generation |
| SPO Xiang et al. (2025) | Self-supervised prompt optimization |
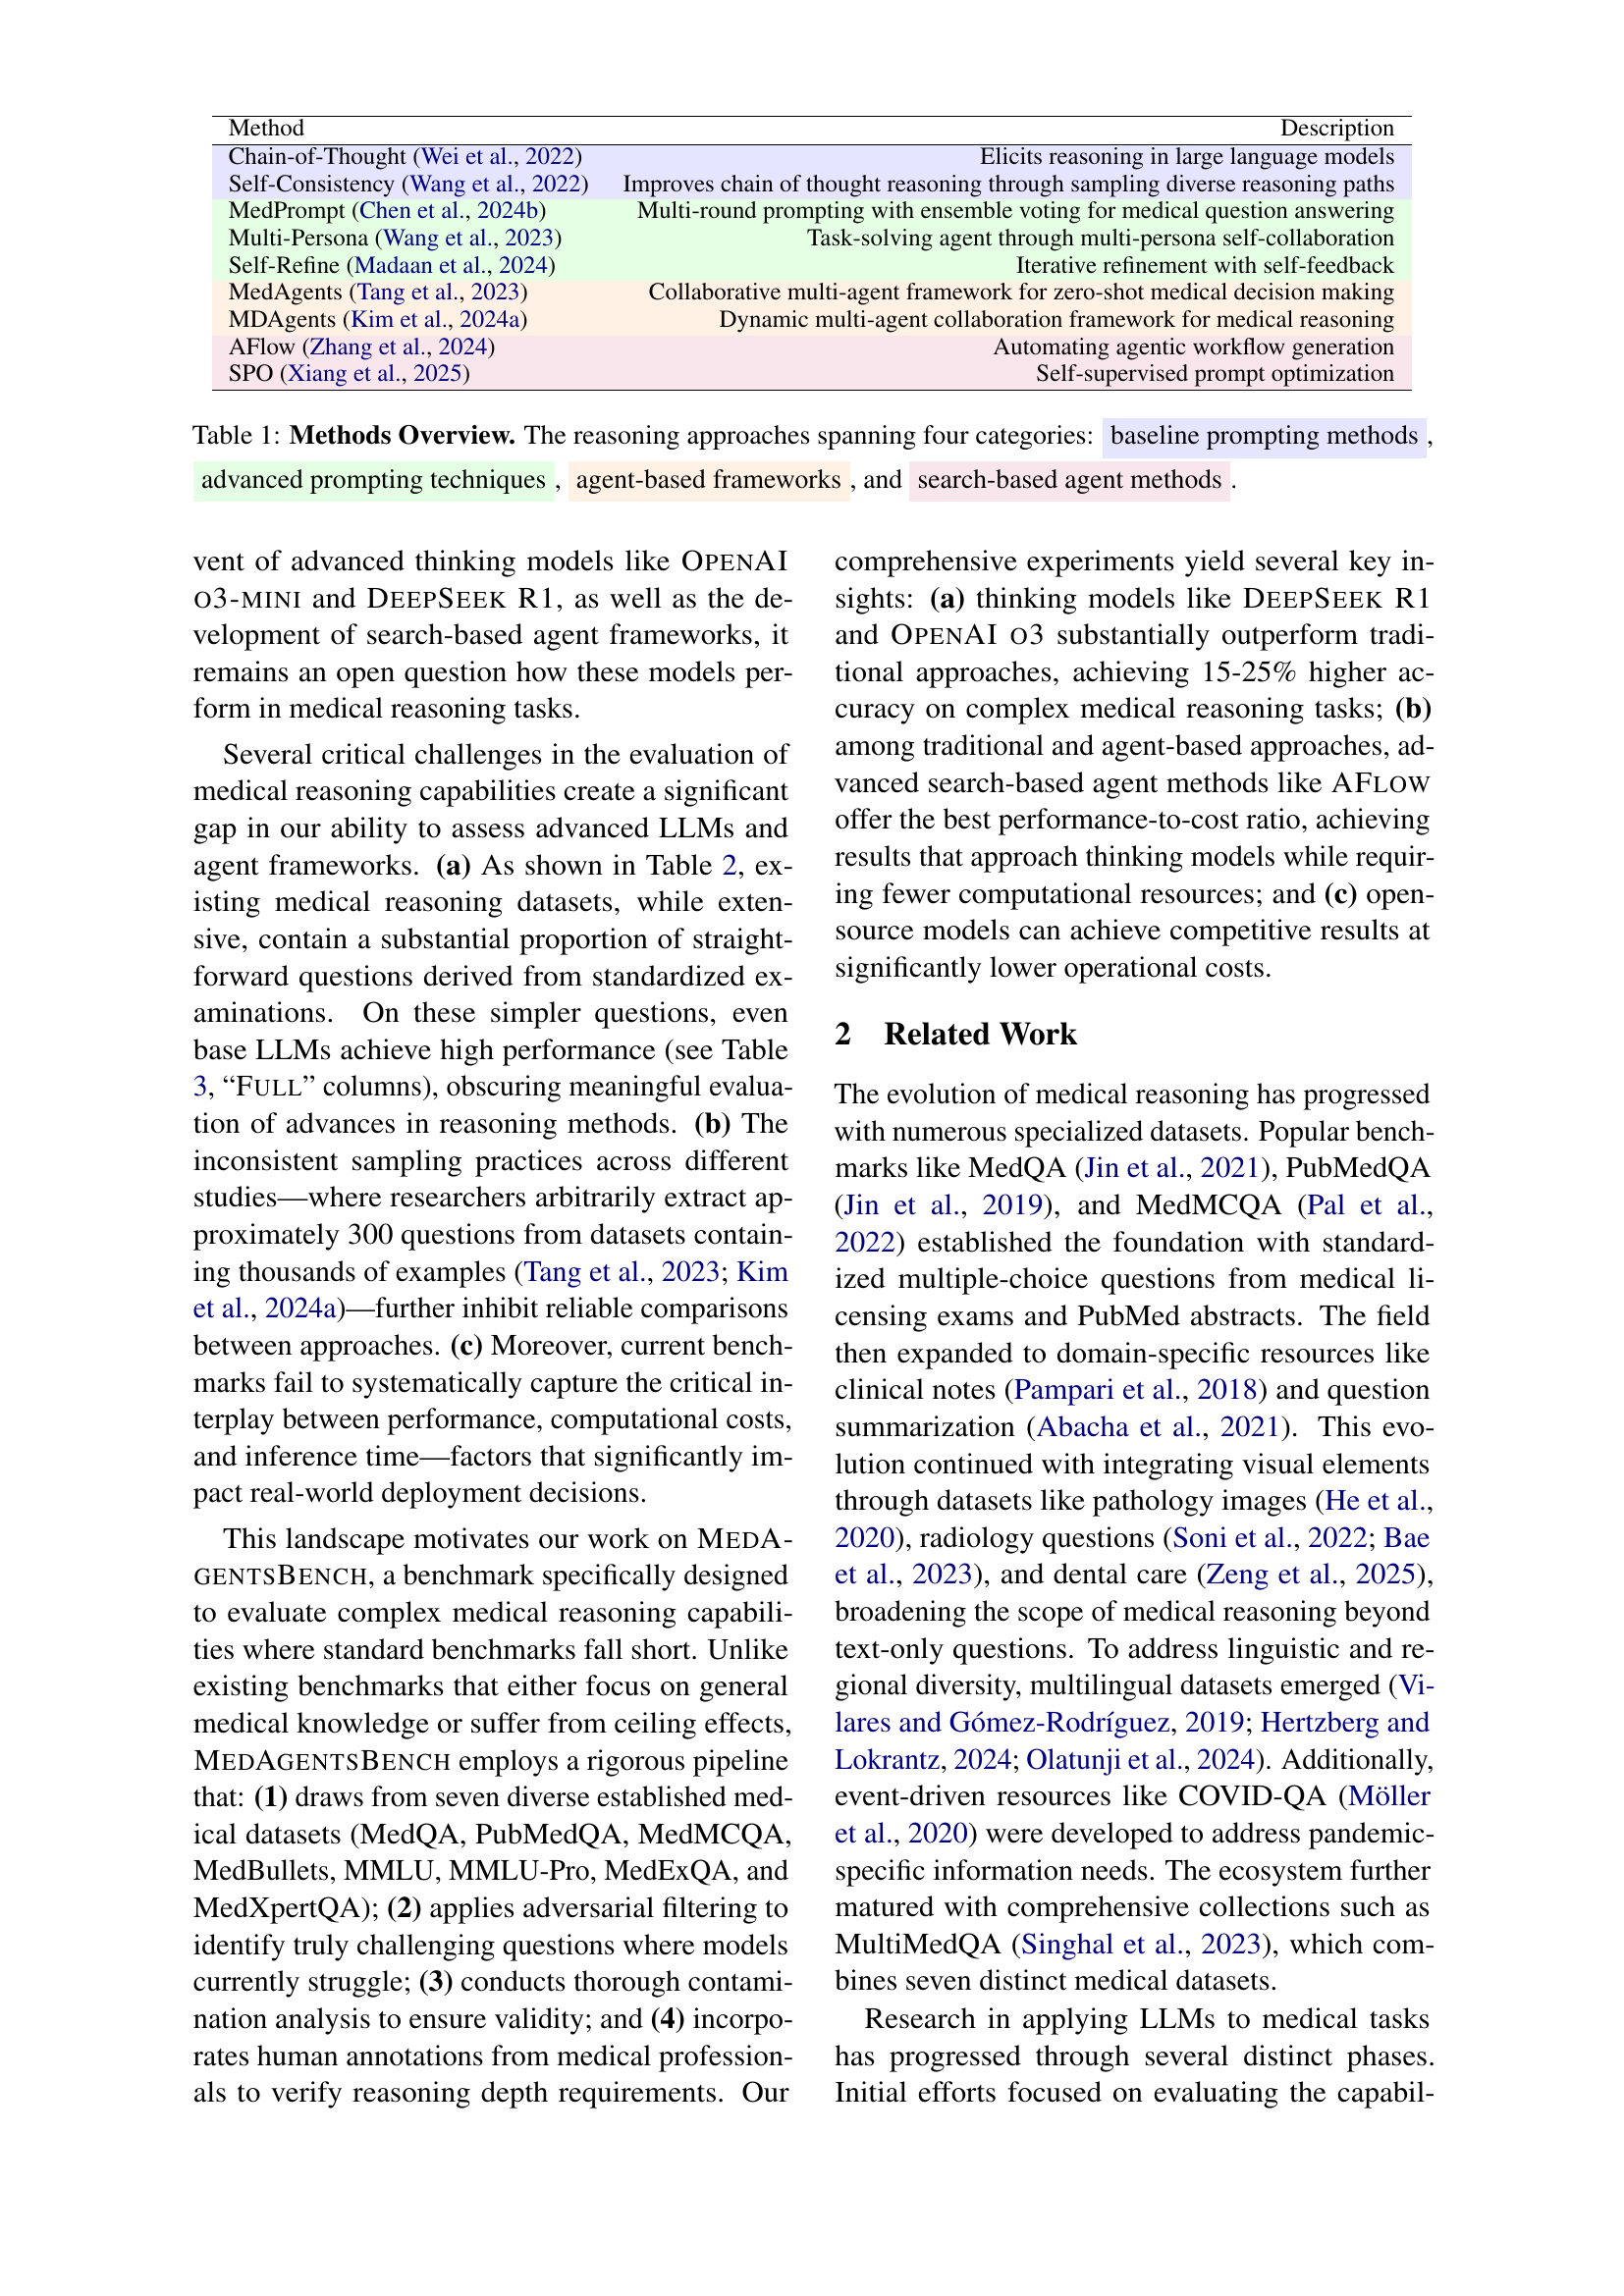
🔼 This table provides an overview of various reasoning approaches used in the paper, categorized into four groups: baseline prompting methods (simple prompting techniques), advanced prompting techniques (more complex prompting strategies), agent-based frameworks (using multiple agents to collaboratively solve problems), and search-based agent methods (combining agents with search algorithms). For each method, the table lists the name of the method and a brief description explaining its functionality or key characteristics.
read the caption
Table 1: Methods Overview. The reasoning approaches spanning four categories: baseline prompting methods, advanced prompting techniques, agent-based frameworks, and search-based agent methods.
In-depth insights#
Complex Med QA#
Complex Medical Question Answering (MedQA) presents a significant challenge in AI due to the nuanced reasoning and deep medical knowledge required. Unlike standard QA tasks, complex MedQA necessitates multi-step inference, diagnostic formulation, and treatment planning, pushing the limits of even the most advanced models. High performance on existing benchmarks doesn’t always translate to success with intricate medical scenarios, highlighting a gap in current evaluation methods. Factors such as the prevalence of straightforward questions in existing datasets and inconsistent evaluation protocols contribute to this discrepancy. Effective complex MedQA requires models to synthesize information from various sources, understand intricate relationships between symptoms, diagnoses, and treatments, and handle uncertainty and ambiguity inherent in medical practice. Future research should focus on developing benchmarks that accurately reflect the complexities of real-world medical reasoning and evaluation metrics that go beyond simple accuracy, assessing the quality of reasoning and explainability of model decisions. Addressing data contamination is also critical for reliable benchmarking.
Agent Workflows#
Agent workflows represent a paradigm shift in problem-solving, especially in complex domains like medicine. Instead of relying on a single, monolithic model, agent workflows decompose intricate tasks into smaller, manageable steps handled by specialized agents. Each agent can focus on a specific aspect of the problem, such as information retrieval, diagnosis formulation, or treatment planning. The collaborative nature of these workflows allows for a more nuanced and robust solution compared to traditional approaches. Key advantages include improved accuracy, enhanced explainability, and the ability to adapt to evolving information. The design of effective agent workflows requires careful consideration of agent roles, communication protocols, and task delegation strategies. The integration of diverse expertise and the ability to handle uncertainty are also critical factors for success.
Cost Analysis#
The analysis of cost is crucial. Computational resources needed by advanced models often lead to higher inference costs, with multi-agent frameworks needing multiple API calls and increased cost and inference time. Cost-performance trade-offs are explored with a standardized protocol, with cost calculated using token usage and platform rates. For open-source, estimations are based on platforms like Together AI. Evaluation included wall-clock time per sample and complete interaction cycles for agent-based approaches. The Pareto frontier highlights models for optimal performance. DEEPSEEK-R1 and 03-MINI are Pareto-optimal, indicating efficiency. Domain-specific patterns varied; MedQA showed performance improvements, and PubMedQA showed diminishing returns. Thinking models outperformed with a 5-10% difference on complex tasks. A hierarchy of efficiency existed, where some models were optimal for resource-constrained deployments.
MELD Analysis#
The MELD analysis, employing a memorization effects detector, is a crucial step in ensuring benchmark reliability. It quantifies potential data contamination by assessing how well models reproduce question text, highlighting the risk of verbatim memorization over genuine reasoning. The analysis spans various models, revealing distinctions in memorization patterns. OpenAI models demonstrate lower similarity scores, indicating less memorization, while some open-source models exhibit higher scores. This underscores the importance of MELD in identifying and mitigating contamination risks.
Hybrid Approach#
While the paper doesn’t explicitly discuss a ‘Hybrid Approach’ under a dedicated heading, the essence of such a methodology is interwoven throughout the research. A hybrid approach in this context could signify the integration of diverse techniques to optimize medical reasoning. This involves combining the strengths of various models, such as closed-source and open-source LLMs, and augmenting them with distinct reasoning methods such as baseline prompting, advanced prompting, and agent-based frameworks. Furthermore, a hybrid strategy might encompass the selective deployment of specific models and methods depending on computational constraints, prioritizing either high performance or cost-effectiveness. This blending of architectural and reasoning strategy choices could lead to synergistic gains, potentially unlocking superior performance and resource utilization compared to singular approaches.
More visual insights#
More on figures

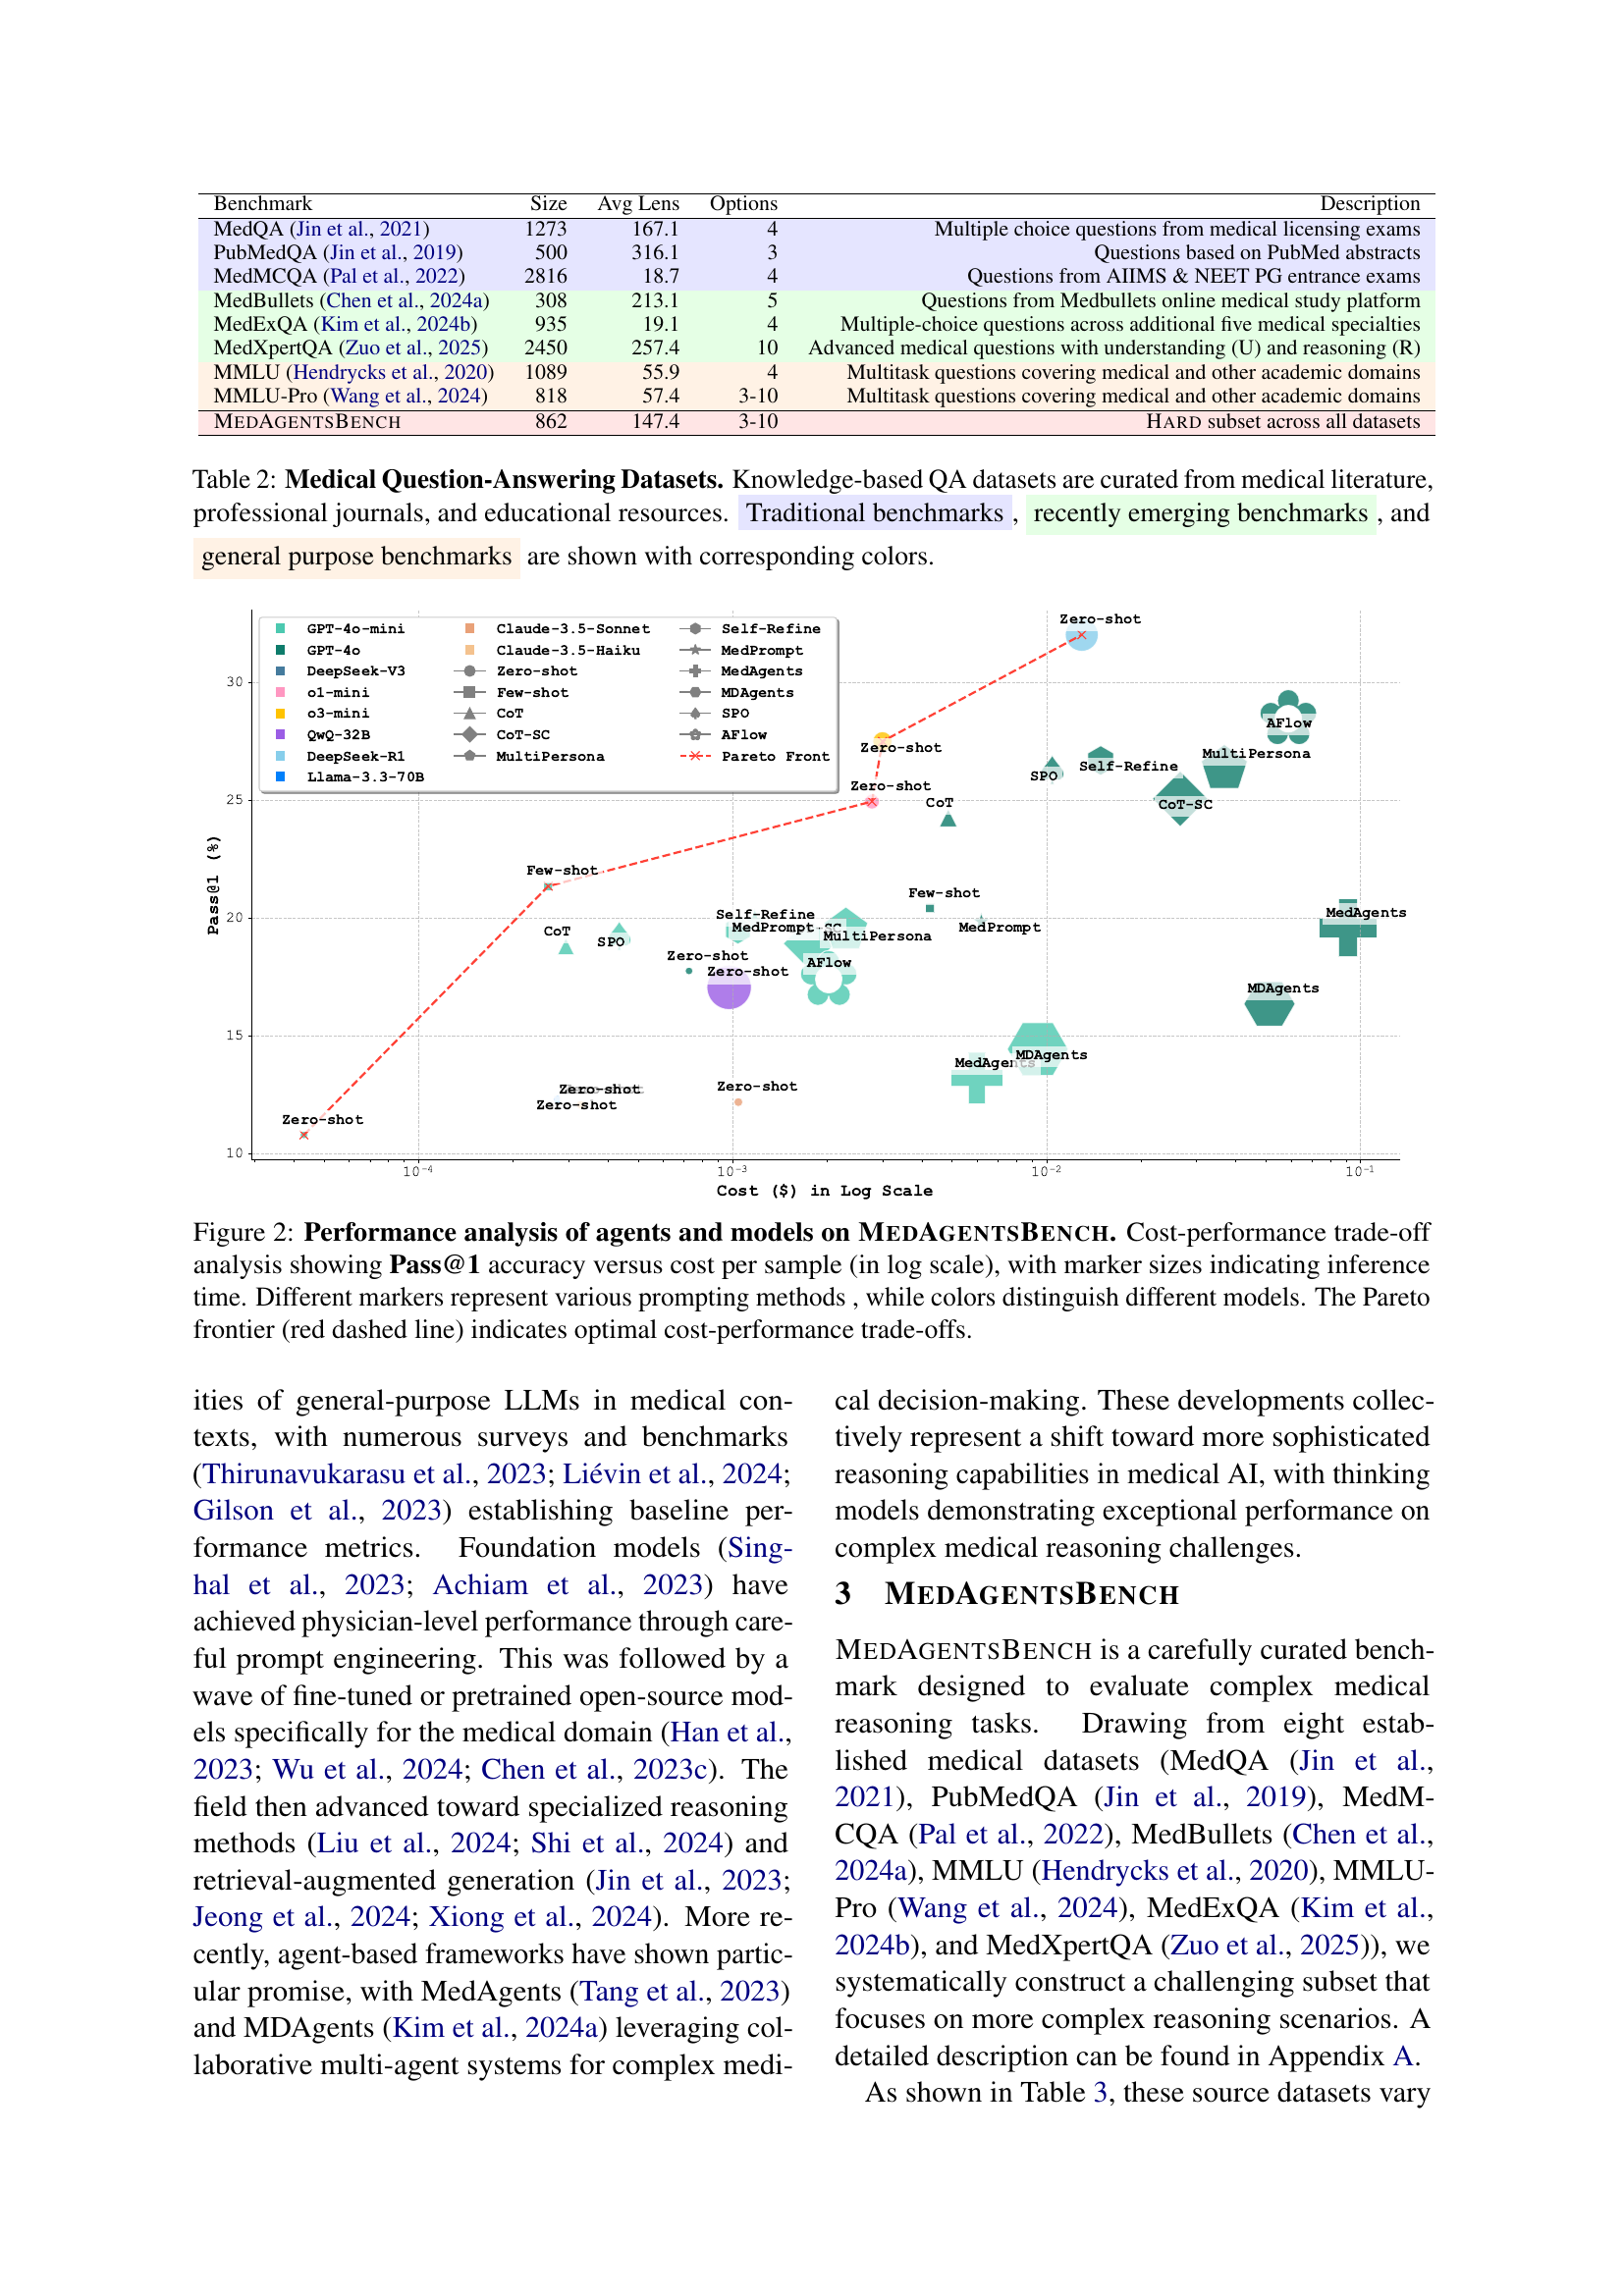
🔼 This figure presents a cost-performance trade-off analysis for various large language models (LLMs) and reasoning methods evaluated on the MedAgentsBench benchmark. The x-axis represents the cost per sample (log scale), while the y-axis shows the Pass@1 accuracy (the percentage of times the model correctly identifies the top answer). The size of each marker indicates the inference time for that model and method. Different markers represent different prompting methods (e.g., zero-shot, few-shot, chain-of-thought, etc.), and different colors distinguish between different LLMs. The red dashed line highlights the Pareto frontier, which represents the optimal trade-off between cost and performance—points on or above this line indicate models that provide the best performance for a given cost or the lowest cost for a given level of performance.
read the caption
Figure 2: Performance analysis of agents and models on MedAgentsBench. Cost-performance trade-off analysis showing Pass@1 accuracy versus cost per sample (in log scale), with marker sizes indicating inference time. Different markers represent various prompting methods , while colors distinguish different models. The Pareto frontier (red dashed line) indicates optimal cost-performance trade-offs.

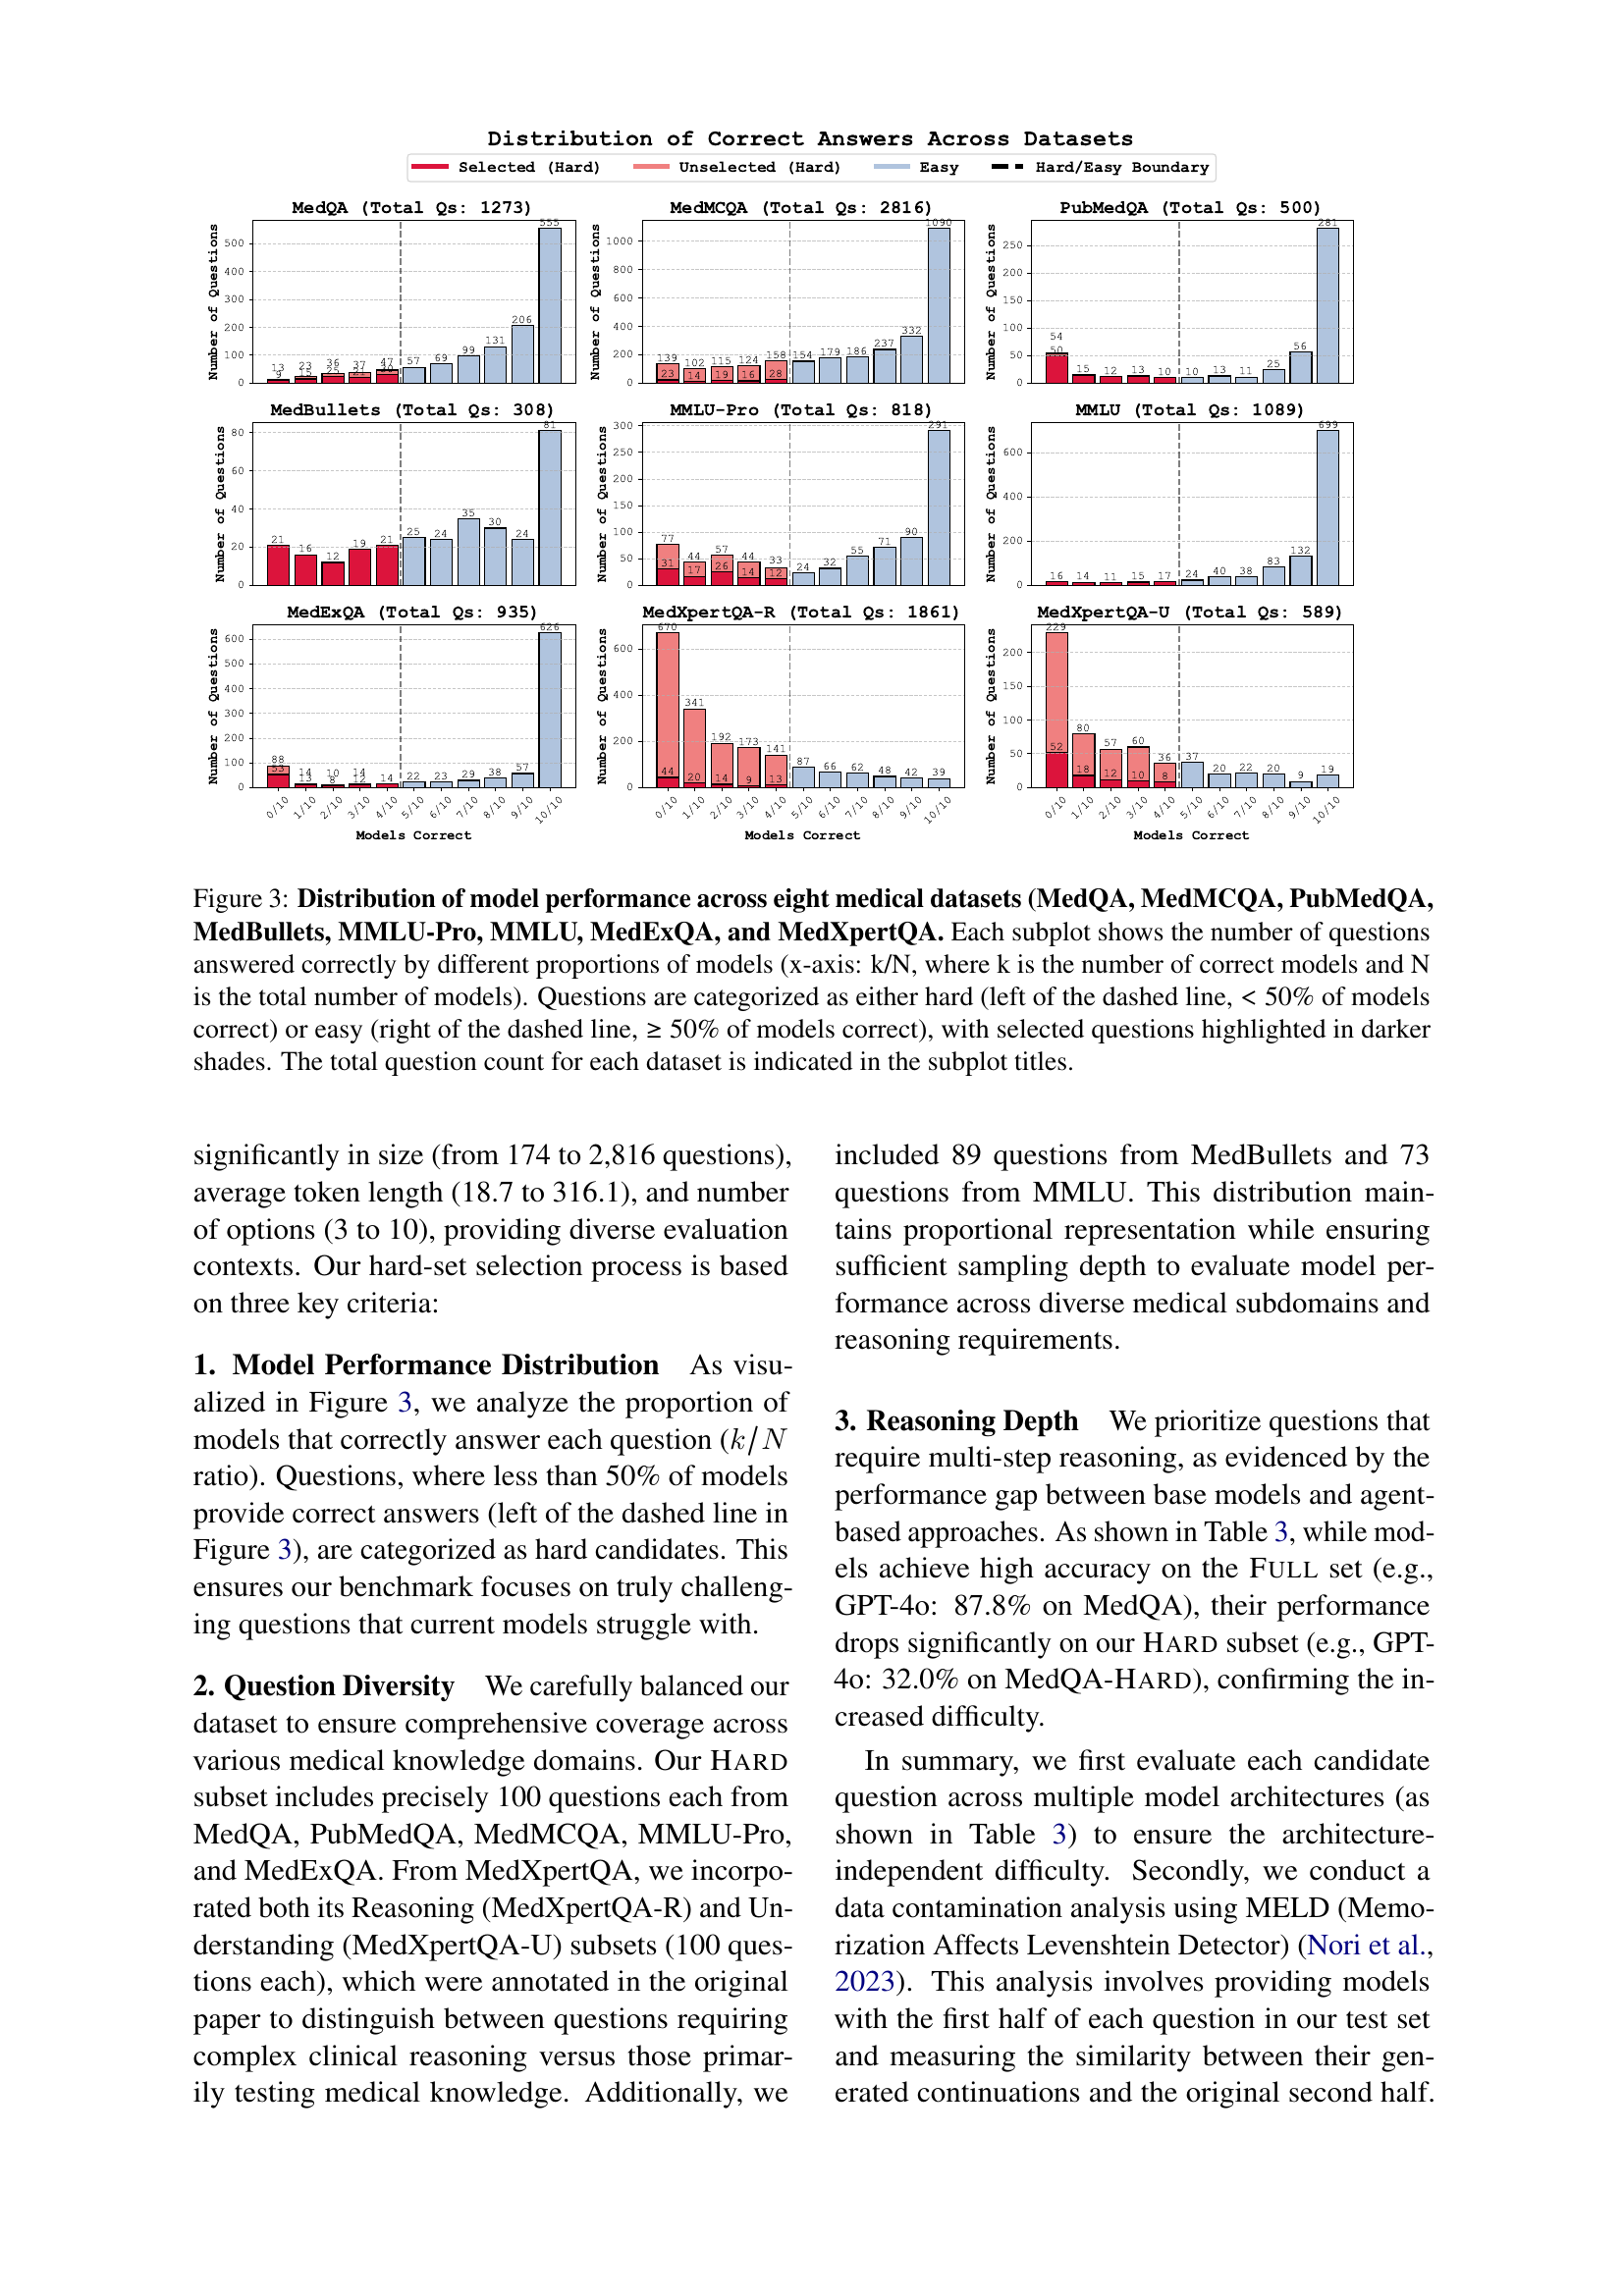
🔼 Figure 3 analyzes the performance of various models on eight medical datasets (MedQA, MedMCQA, PubMedQA, MedBullets, MMLU-Pro, MMLU, MedExQA, and MedXpertQA). Each subplot displays the distribution of correct answers for each dataset, showing the number of questions answered correctly by different percentages of models. The x-axis represents the proportion of models that answered correctly (k/N, where k is the number of correctly answering models and N is the total number of models). A dashed line separates questions categorized as ‘hard’ (less than 50% of models answered correctly) from ’easy’ (50% or more answered correctly). Questions selected for a subset are highlighted in darker shades. The total number of questions in each dataset is shown in the subplot title.
read the caption
Figure 3: Distribution of model performance across eight medical datasets (MedQA, MedMCQA, PubMedQA, MedBullets, MMLU-Pro, MMLU, MedExQA, and MedXpertQA. Each subplot shows the number of questions answered correctly by different proportions of models (x-axis: k/N, where k is the number of correct models and N is the total number of models). Questions are categorized as either hard (left of the dashed line, <<< 50% of models correct) or easy (right of the dashed line, ≥\geq≥ 50% of models correct), with selected questions highlighted in darker shades. The total question count for each dataset is indicated in the subplot titles.

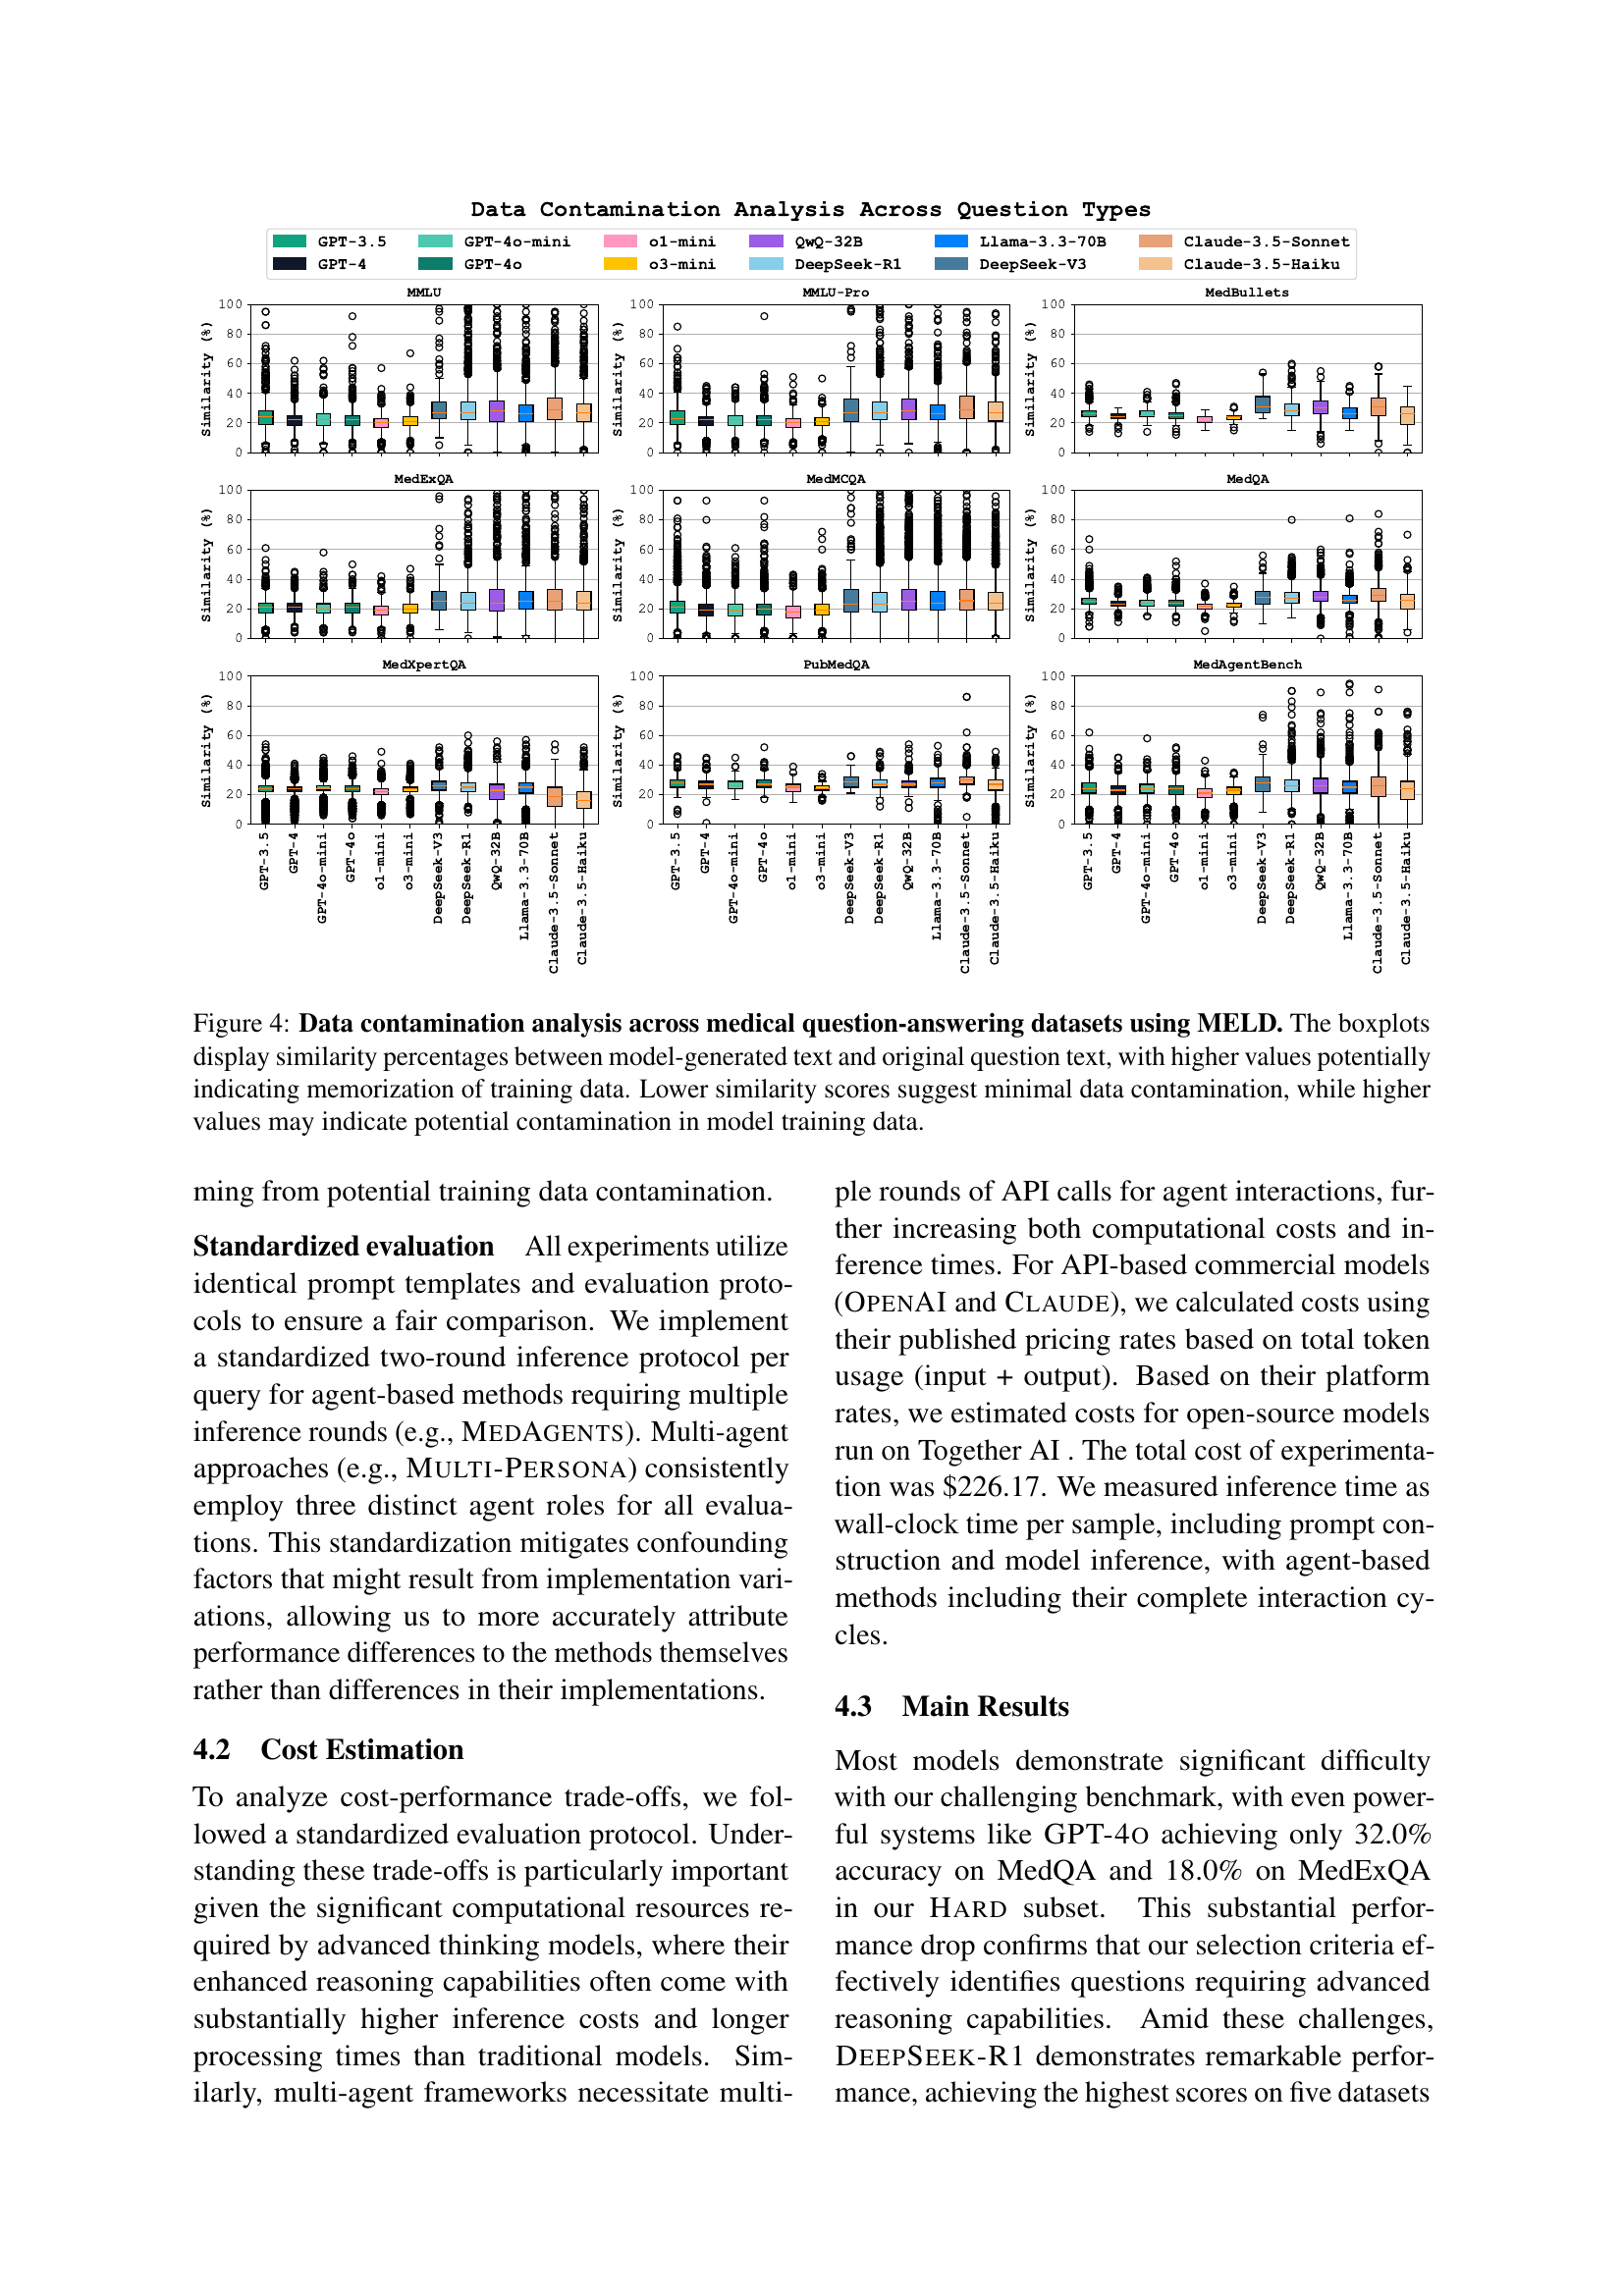
🔼 Figure 4 presents a comprehensive analysis of data contamination across various medical question-answering datasets. The analysis leverages the MELD (Memorization Effects Levenshtein Detector) technique to quantify the extent to which models memorize training data rather than genuinely reasoning. The figure employs box plots to visually represent the similarity scores (Levenshtein distance ratios) between model-generated text continuations and the original, unseen portions of the questions. Higher similarity scores indicate a greater likelihood of memorization, suggesting potential contamination of the training data. Lower scores, conversely, imply less memorization and stronger evidence of true reasoning ability. Each box plot corresponds to a specific dataset, allowing for a direct comparison of memorization across different benchmarks.
read the caption
Figure 4: Data contamination analysis across medical question-answering datasets using MELD. The boxplots display similarity percentages between model-generated text and original question text, with higher values potentially indicating memorization of training data. Lower similarity scores suggest minimal data contamination, while higher values may indicate potential contamination in model training data.
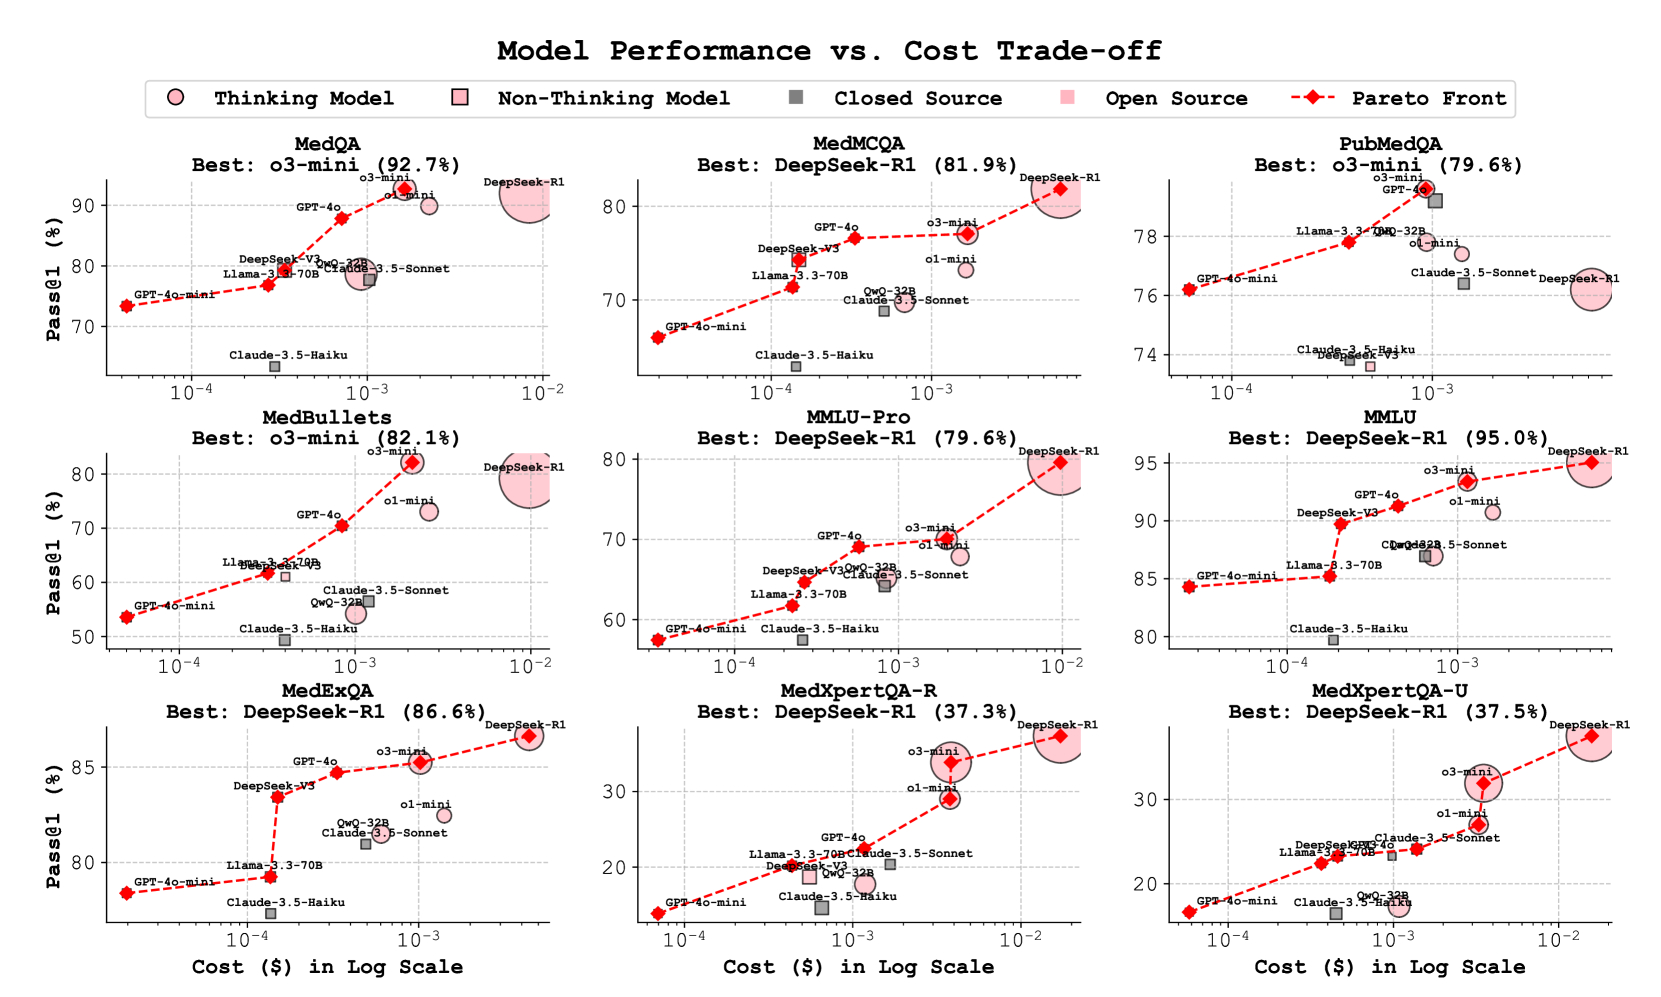
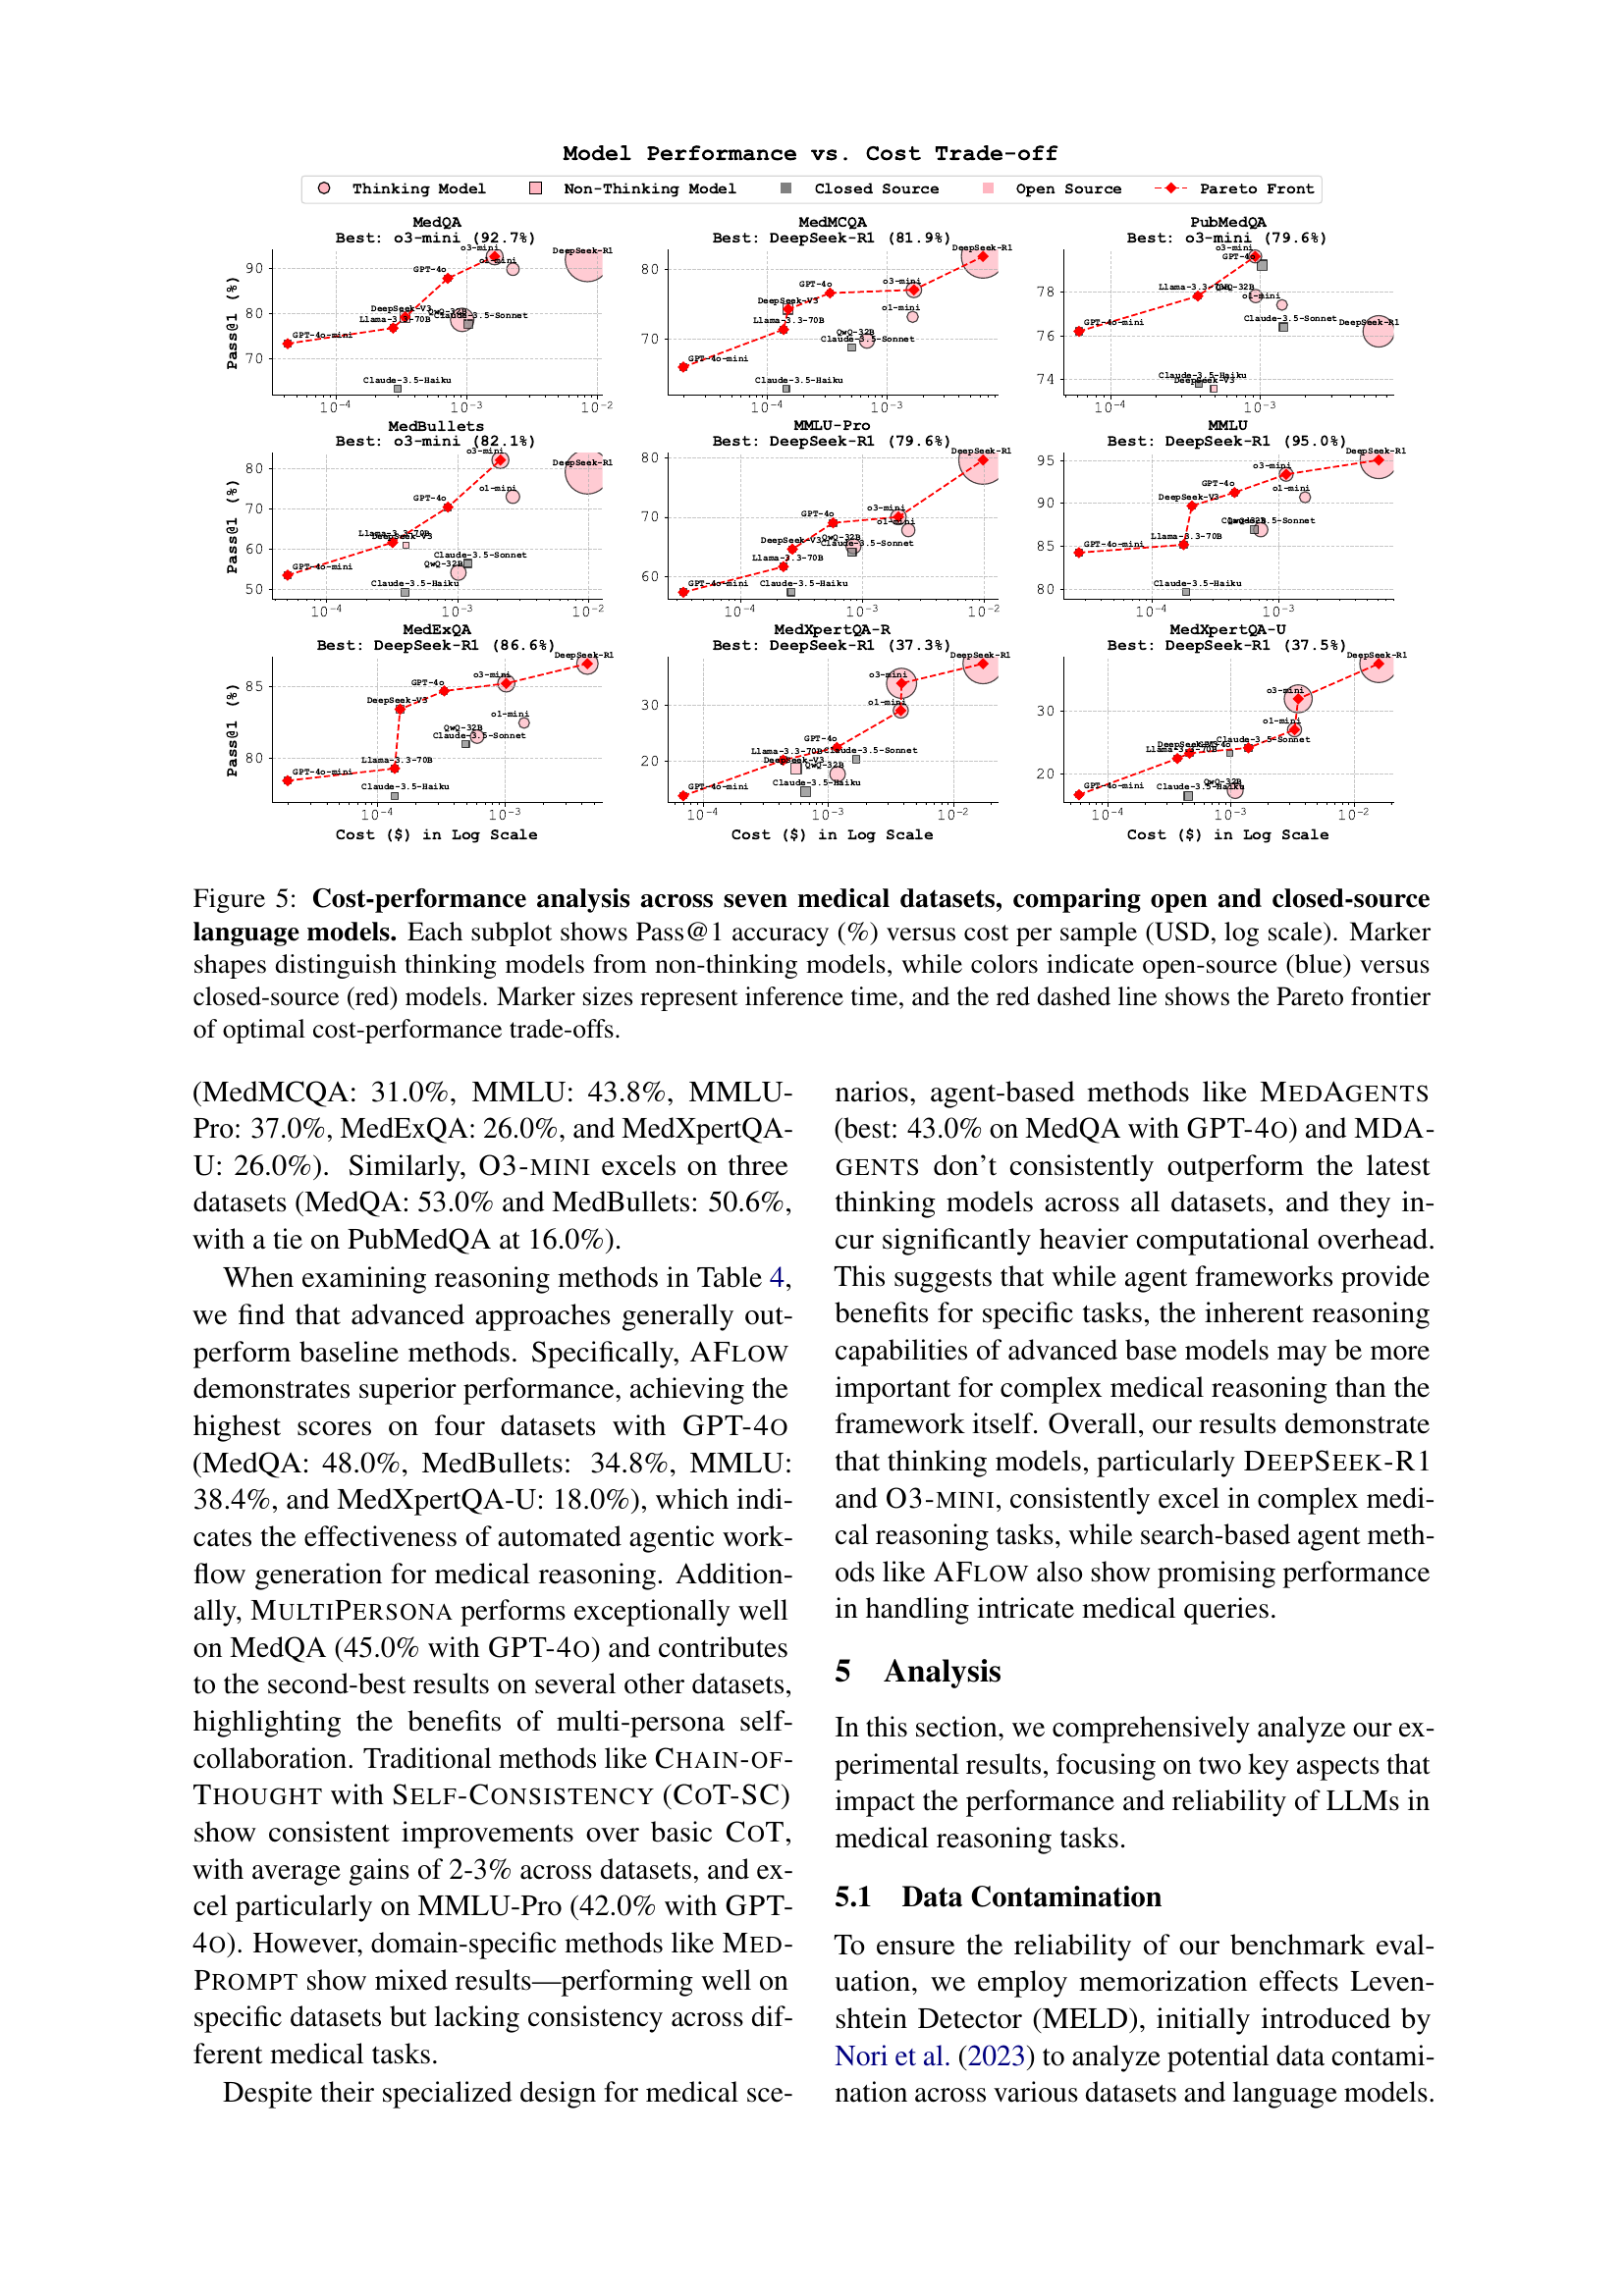
🔼 Figure 5 presents a comprehensive cost-performance analysis of various language models on seven medical datasets. Each dataset is represented by a separate subplot, showing the trade-off between Pass@1 accuracy (the percentage of correctly answered questions) and the cost per sample (in USD, displayed on a logarithmic scale). The plot visually distinguishes between different types of language models: ’thinking models’ (those exhibiting complex reasoning capabilities) are depicted with distinct marker shapes compared to ’non-thinking models’. Model source (open-source vs. closed-source) is represented by different colors (blue for open-source, red for closed-source). Marker size is proportional to the model’s inference time. Finally, the Pareto frontier is overlaid as a red dashed line, representing the optimal combinations of accuracy and cost.
read the caption
Figure 5: Cost-performance analysis across seven medical datasets, comparing open and closed-source language models. Each subplot shows Pass@1 accuracy (%) versus cost per sample (USD, log scale). Marker shapes distinguish thinking models from non-thinking models, while colors indicate open-source (blue) versus closed-source (red) models. Marker sizes represent inference time, and the red dashed line shows the Pareto frontier of optimal cost-performance trade-offs.
More on tables
| Benchmark | Size | Avg Lens | Options | Description |
| MedQA Jin et al. (2021) | 1273 | 167.1 | 4 | Multiple choice questions from medical licensing exams |
| PubMedQA Jin et al. (2019) | 500 | 316.1 | 3 | Questions based on PubMed abstracts |
| MedMCQA Pal et al. (2022) | 2816 | 18.7 | 4 | Questions from AIIMS & NEET PG entrance exams |
| MedBullets Chen et al. (2024a) | 308 | 213.1 | 5 | Questions from Medbullets online medical study platform |
| MedExQA Kim et al. (2024b) | 935 | 19.1 | 4 | Multiple-choice questions across additional five medical specialties |
| MedXpertQA Zuo et al. (2025) | 2450 | 257.4 | 10 | Advanced medical questions with understanding (U) and reasoning (R) |
| MMLU Hendrycks et al. (2020) | 1089 | 55.9 | 4 | Multitask questions covering medical and other academic domains |
| MMLU-Pro Wang et al. (2024) | 818 | 57.4 | 3-10 | Multitask questions covering medical and other academic domains |
| MedAgentsBench | 862 | 147.4 | 3-10 | Hard subset across all datasets |
🔼 Table 2 presents a comparative overview of eight medical question-answering (QA) datasets. It details the size (number of questions), average question length (in tokens), and the number of answer options for each dataset. The datasets are categorized and color-coded to show their origin: knowledge-based datasets (curated from medical literature, journals, and educational resources), traditional benchmarks, recently developed benchmarks, and general-purpose benchmarks. This categorization helps to understand the evolution and diversity of available resources for evaluating medical reasoning in AI models.
read the caption
Table 2: Medical Question-Answering Datasets. Knowledge-based QA datasets are curated from medical literature, professional journals, and educational resources. Traditional benchmarks, recently emerging benchmarks, and general purpose benchmarks are shown with corresponding colors.
| Model | MedQA | PubMedQA | MedMCQA | MedBullets | MMLU | MMLU-Pro | MedExQA | MedXpert-R | MedXpert-U | |||||||||
| Full | Hard | Full | Hard | Full | Hard | Full | Hard | Full | Hard | Full | Hard | Full | Hard | Full | Hard | Full | Hard | |
| GPT-4o-mini | 73.4 | 22.0 | 76.2 | 10.0 | 66.0 | 17.0 | 53.6 | 10.1 | 84.3 | 12.3 | 57.5 | 11.0 | 78.4 | 4.0 | 13.9 | 6.0 | 16.6 | 5.0 |
| GPT-4o | 87.8 | 32.0 | 79.2 | 9.0 | 76.6 | 25.0 | 70.5 | 19.1 | 91.3 | 24.7 | 69.1 | 21.0 | 84.7 | 18.0 | 22.5 | 7.0 | 23.3 | 6.0 |
| DeepSeek-V3 | 79.3 | 16.0 | 73.6 | 12.0 | 74.3 | 19.0 | 61.0 | 13.5 | 89.7 | 15.1 | 64.7 | 12.0 | 83.4 | 7.0 | 18.7 | 6.0 | 23.3 | 9.0 |
| o1-mini | 89.9 | 49.0 | 77.4 | 11.0 | 73.2 | 21.0 | 73.1 | 38.2 | 90.7 | 31.5 | 67.8 | 19.0 | 82.5 | 15.0 | 29.0 | 29.0 | 27.0 | 14.0 |
| o3-mini | 92.7 | 53.0 | 79.6 | 16.0 | 77.1 | 24.0 | 82.1 | 50.6 | 93.4 | 35.6 | 70.0 | 15.0 | 85.2 | 18.0 | 33.9 | 25.0 | 31.9 | 15.0 |
| QwQ-32B | 78.6 | 29.0 | 77.8 | 16.0 | 69.7 | 24.0 | 54.2 | 12.4 | 87.0 | 19.2 | 65.2 | 28.0 | 81.5 | 10.0 | 17.7 | 9.0 | 17.3 | 6.0 |
| DeepSeek-R1 | 92.0 | 47.0 | 76.2 | 13.0 | 81.9 | 31.0 | 79.2 | 43.8 | 95.0 | 43.8 | 79.6 | 37.0 | 86.6 | 26.0 | 37.3 | 25.0 | 37.5 | 26.0 |
| Llama-3.3-70B | 76.8 | 14.0 | 77.8 | 13.0 | 71.4 | 20.0 | 61.7 | 16.9 | 85.2 | 12.3 | 61.7 | 10.0 | 79.3 | 7.0 | 20.2 | 9.0 | 22.4 | 9.0 |
| Claude-3.5-S | 77.7 | 18.0 | 76.4 | 10.0 | 68.8 | 10.0 | 56.5 | 9.0 | 86.9 | 16.4 | 64.2 | 14.0 | 81.0 | 13.0 | 20.4 | 9.0 | 24.1 | 11.0 |
| Claude-3.5-H | 63.4 | 13.0 | 73.8 | 12.0 | 62.9 | 23.0 | 49.4 | 10.1 | 79.7 | 11.0 | 57.5 | 12.0 | 77.3 | 13.0 | 14.6 | 8.0 | 16.5 | 6.0 |
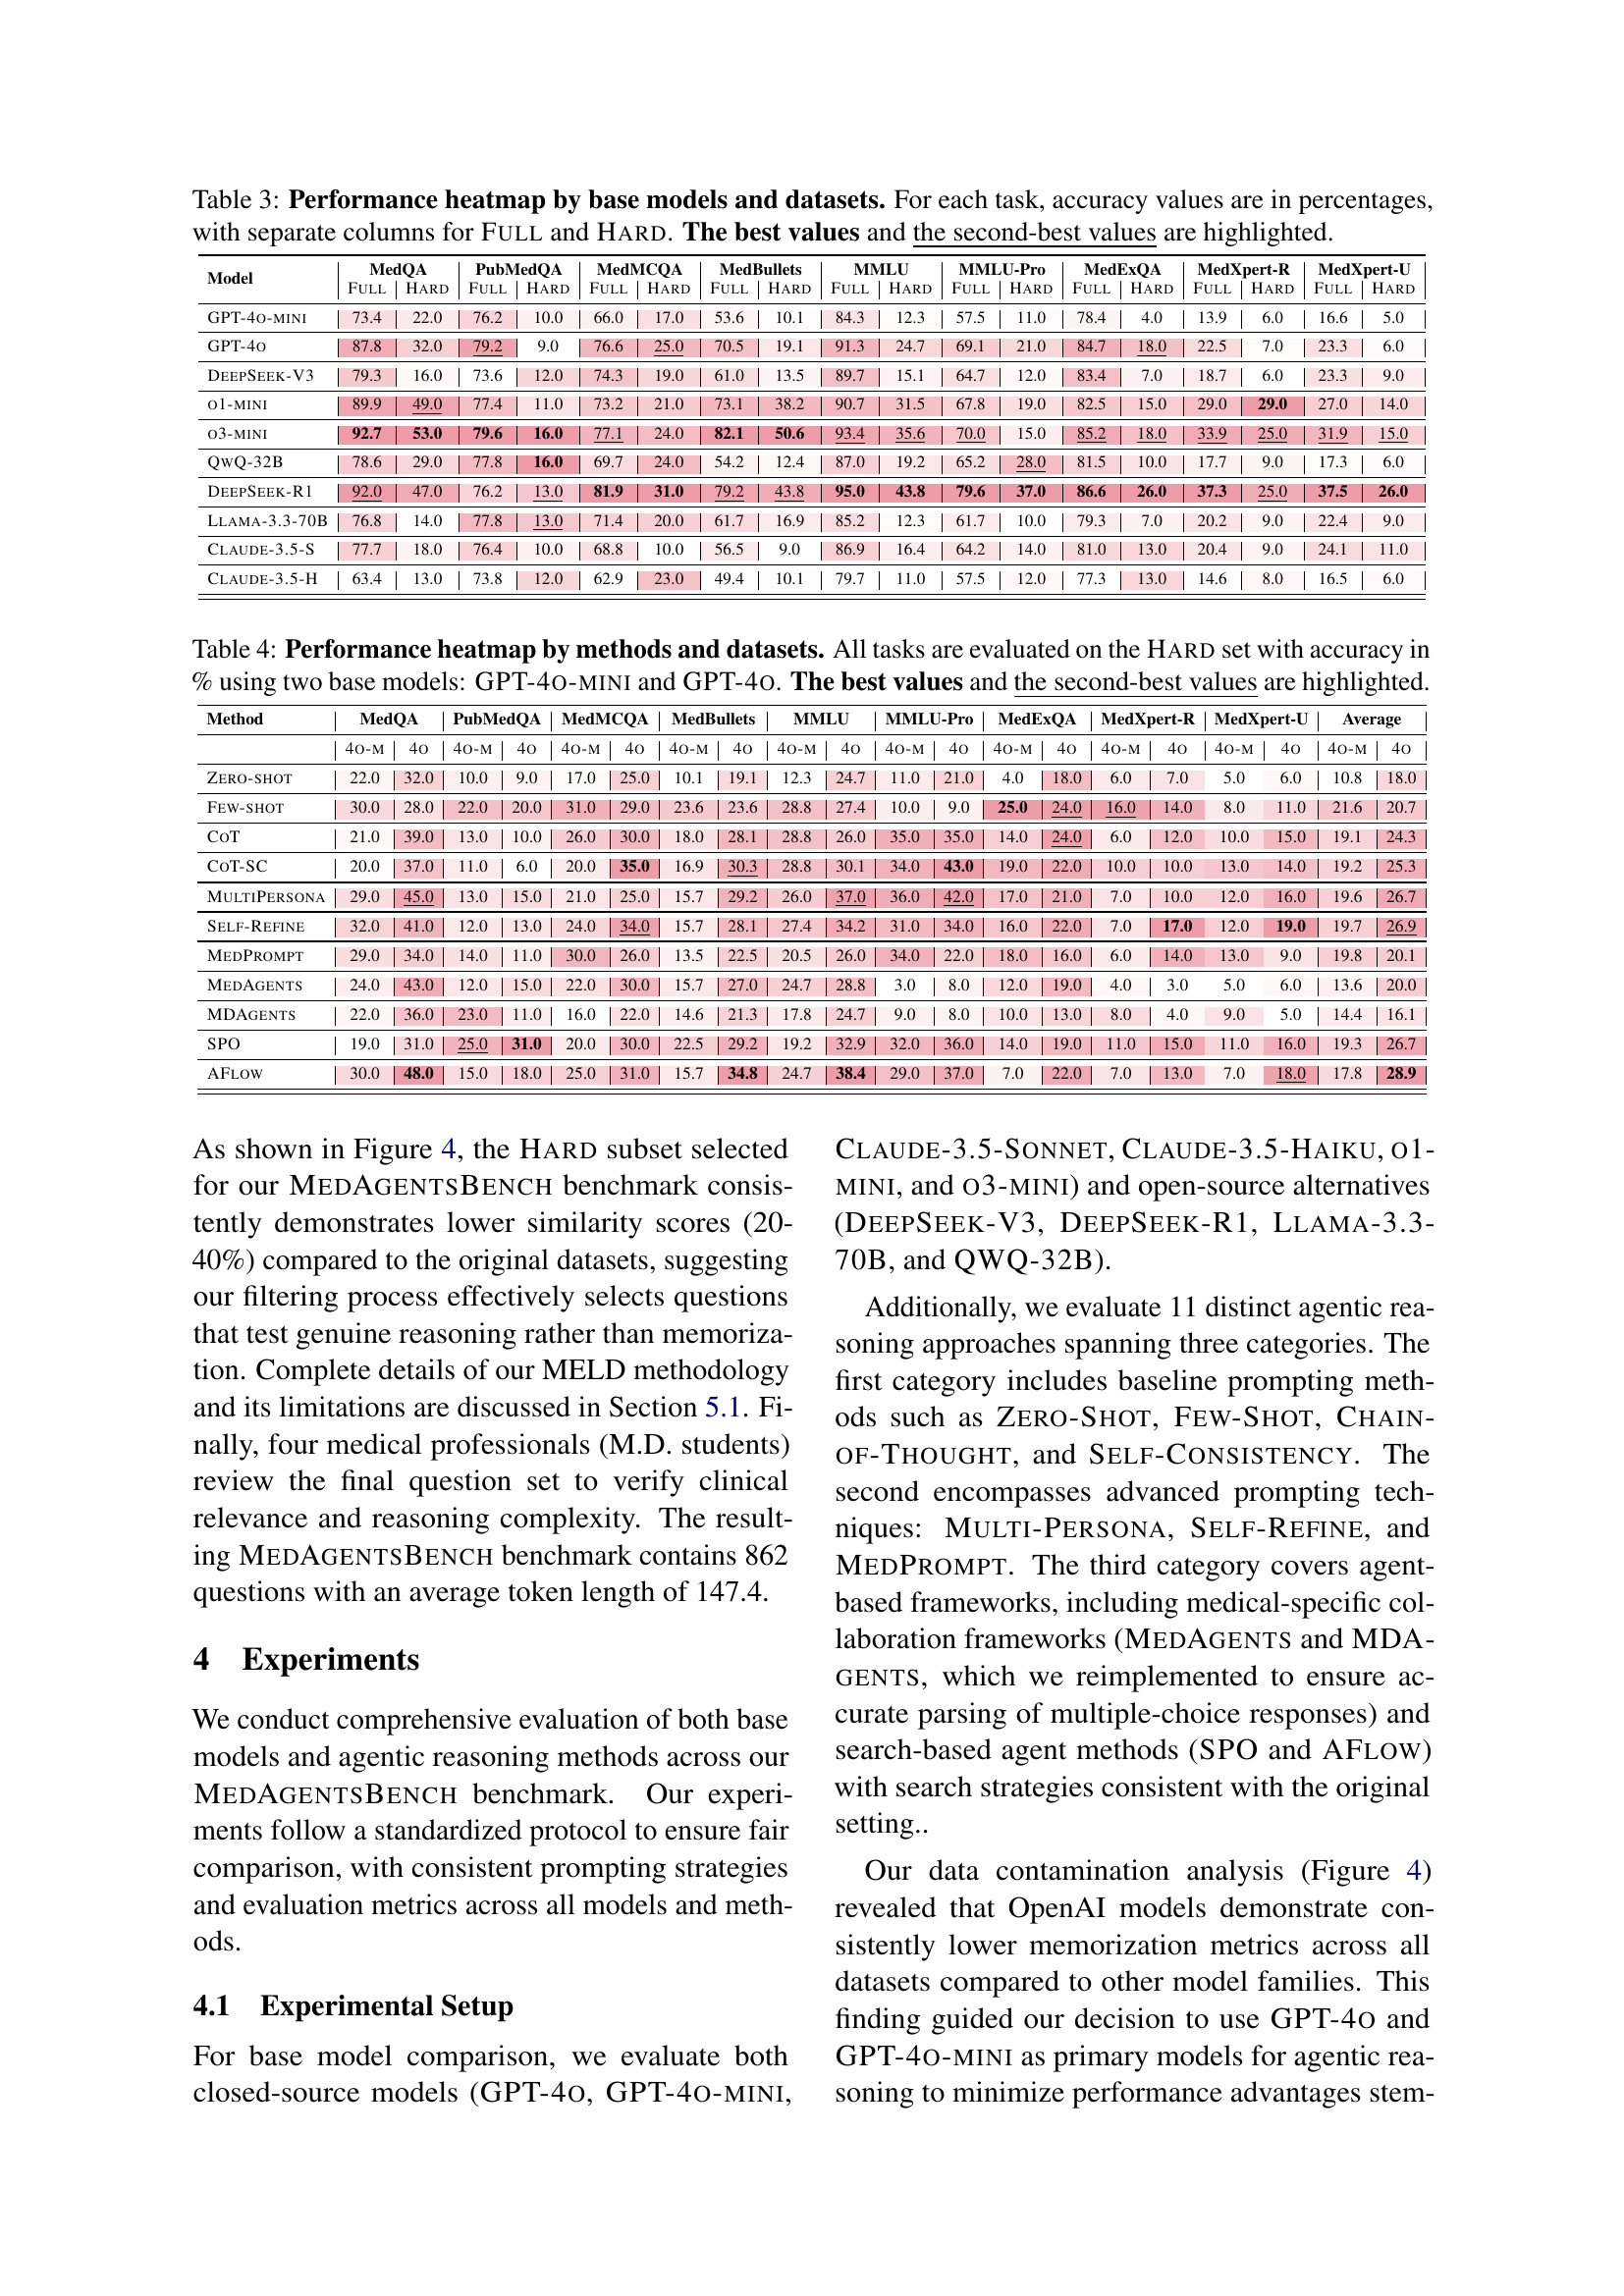
🔼 This table presents a comprehensive performance comparison of various large language models (LLMs) across eight different medical datasets. It displays the accuracy of each model on a ‘Full’ set of questions from each dataset, representing the overall performance on all questions, and a ‘Hard’ subset, which includes more challenging questions designed to assess advanced reasoning abilities. The ‘Hard’ subset focuses on complex scenarios where even state-of-the-art models struggle, allowing for a more nuanced evaluation of the models’ capabilities. The best and second-best performing models for each task (dataset and question type) are highlighted, providing a clear visual representation of relative strengths and weaknesses.
read the caption
Table 3: Performance heatmap by base models and datasets. For each task, accuracy values are in percentages, with separate columns for Full and Hard. The best values and the second-best values are highlighted.
| Method | MedQA | PubMedQA | MedMCQA | MedBullets | MMLU | MMLU-Pro | MedExQA | MedXpert-R | MedXpert-U | Average | ||||||||||
| 4o-m | 4o | 4o-m | 4o | 4o-m | 4o | 4o-m | 4o | 4o-m | 4o | 4o-m | 4o | 4o-m | 4o | 4o-m | 4o | 4o-m | 4o | 4o-m | 4o | |
| Zero-shot | 22.0 | 32.0 | 10.0 | 9.0 | 17.0 | 25.0 | 10.1 | 19.1 | 12.3 | 24.7 | 11.0 | 21.0 | 4.0 | 18.0 | 6.0 | 7.0 | 5.0 | 6.0 | 10.8 | 18.0 |
| Few-shot | 30.0 | 28.0 | 22.0 | 20.0 | 31.0 | 29.0 | 23.6 | 23.6 | 28.8 | 27.4 | 10.0 | 9.0 | 25.0 | 24.0 | 16.0 | 14.0 | 8.0 | 11.0 | 21.6 | 20.7 |
| CoT | 21.0 | 39.0 | 13.0 | 10.0 | 26.0 | 30.0 | 18.0 | 28.1 | 28.8 | 26.0 | 35.0 | 35.0 | 14.0 | 24.0 | 6.0 | 12.0 | 10.0 | 15.0 | 19.1 | 24.3 |
| CoT-SC | 20.0 | 37.0 | 11.0 | 6.0 | 20.0 | 35.0 | 16.9 | 30.3 | 28.8 | 30.1 | 34.0 | 43.0 | 19.0 | 22.0 | 10.0 | 10.0 | 13.0 | 14.0 | 19.2 | 25.3 |
| MultiPersona | 29.0 | 45.0 | 13.0 | 15.0 | 21.0 | 25.0 | 15.7 | 29.2 | 26.0 | 37.0 | 36.0 | 42.0 | 17.0 | 21.0 | 7.0 | 10.0 | 12.0 | 16.0 | 19.6 | 26.7 |
| Self-Refine | 32.0 | 41.0 | 12.0 | 13.0 | 24.0 | 34.0 | 15.7 | 28.1 | 27.4 | 34.2 | 31.0 | 34.0 | 16.0 | 22.0 | 7.0 | 17.0 | 12.0 | 19.0 | 19.7 | 26.9 |
| MedPrompt | 29.0 | 34.0 | 14.0 | 11.0 | 30.0 | 26.0 | 13.5 | 22.5 | 20.5 | 26.0 | 34.0 | 22.0 | 18.0 | 16.0 | 6.0 | 14.0 | 13.0 | 9.0 | 19.8 | 20.1 |
| MedAgents | 24.0 | 43.0 | 12.0 | 15.0 | 22.0 | 30.0 | 15.7 | 27.0 | 24.7 | 28.8 | 3.0 | 8.0 | 12.0 | 19.0 | 4.0 | 3.0 | 5.0 | 6.0 | 13.6 | 20.0 |
| MDAgents | 22.0 | 36.0 | 23.0 | 11.0 | 16.0 | 22.0 | 14.6 | 21.3 | 17.8 | 24.7 | 9.0 | 8.0 | 10.0 | 13.0 | 8.0 | 4.0 | 9.0 | 5.0 | 14.4 | 16.1 |
| SPO | 19.0 | 31.0 | 25.0 | 31.0 | 20.0 | 30.0 | 22.5 | 29.2 | 19.2 | 32.9 | 32.0 | 36.0 | 14.0 | 19.0 | 11.0 | 15.0 | 11.0 | 16.0 | 19.3 | 26.7 |
| AFlow | 30.0 | 48.0 | 15.0 | 18.0 | 25.0 | 31.0 | 15.7 | 34.8 | 24.7 | 38.4 | 29.0 | 37.0 | 7.0 | 22.0 | 7.0 | 13.0 | 7.0 | 18.0 | 17.8 | 28.9 |
🔼 This table presents the performance of different reasoning methods on a hard subset of the MEDAGENTSBENCH dataset. It shows the accuracy (in percentage) of each method for each dataset, using GPT-40-mini and GPT-40 as base models. The best and second-best performing methods for each dataset are highlighted, providing a comparison of various reasoning approaches across multiple medical datasets.
read the caption
Table 4: Performance heatmap by methods and datasets. All tasks are evaluated on the Hard set with accuracy in % using two base models: GPT-4o-mini and GPT-4o. The best values and the second-best values are highlighted.
Full paper#