TL;DR#
Pre-trained Large Language Models(LLMs) benefit from image data for vision-language tasks. The traditional approach separates text/image training, but it’s unclear if this is optimal. This paper investigates integrating images earlier, training models with varied datasets, scales, image-text ratios, and pre-training amounts before vision tokens. They evaluate downstream performance on vision-language and text tasks to optimize VLM training strategies. Models pre-trained with image/text mixtures perform better in vision-language tasks while maintaining text evaluations.
The research uses various datasets and model sizes to experiment with different pre-training strategies. For a 1B parameter model, visual tokens introduced 80% through pre-training result in a 2% average improvement versus introducing visual tokens earlier. This work challenges standard VLM training, recommending an integrated approach with careful image data management, offering a strong foundation for open-source VLM pre-training.
Key Takeaways#
Why does it matter?#
This paper is important for researchers because it questions the traditional practice of separating text and image pre-training phases in VLMs and demonstrates that a more integrated approach of incorporating image data can yield superior results. This finding has the potential to reshape future VLM research and development, guiding the creation of more efficient and capable multimodal models.
Visual Insights#

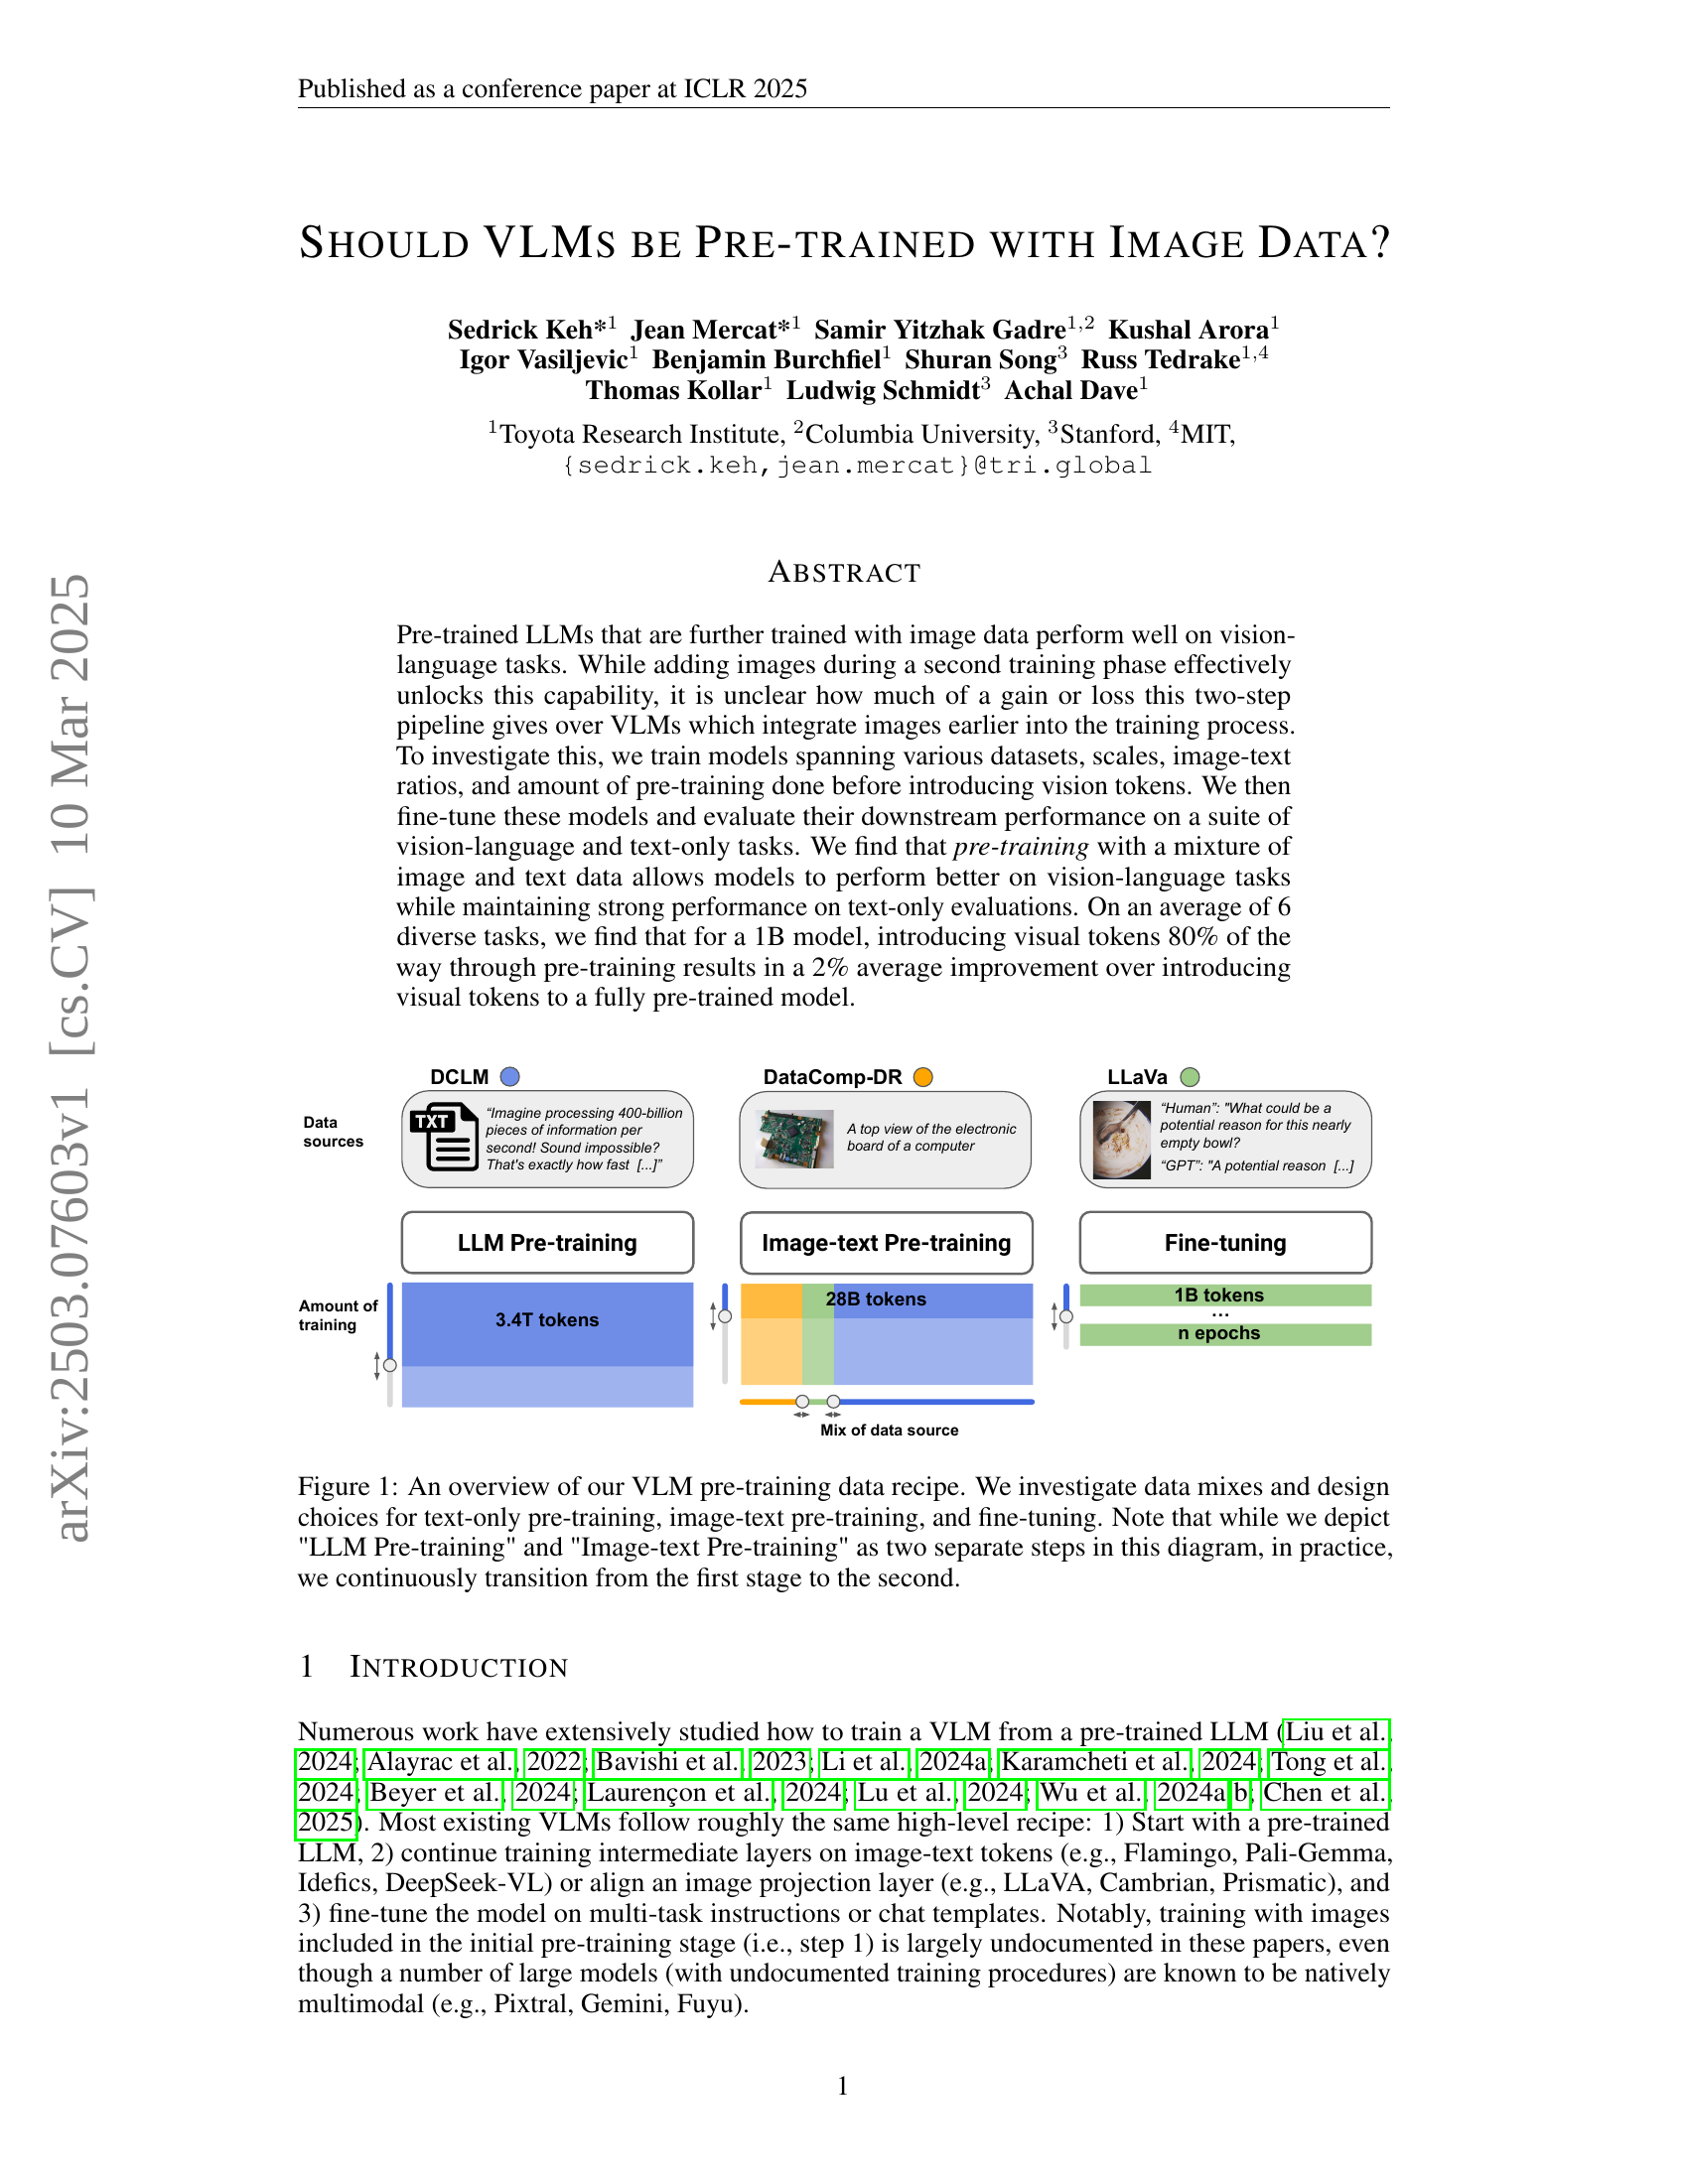
🔼 This figure illustrates the three-stage training process used for the Vision-Language Model (VLM). The first stage involves text-only pre-training of a large language model (LLM), building a strong foundation in language understanding. This is followed by a second stage where image data is gradually introduced alongside text data for image-text pre-training. The transition between text-only and image-text pre-training is continuous and not a discrete step. The final stage is fine-tuning, where the model is further optimized on a suite of vision-language and text-only tasks. The figure visually depicts the different types of data used in each phase and highlights the continuous transition between text-only and image-text pre-training.
read the caption
Figure 1: An overview of our VLM pre-training data recipe. We investigate data mixes and design choices for text-only pre-training, image-text pre-training, and fine-tuning. Note that while we depict 'LLM Pre-training' and 'Image-text Pre-training' as two separate steps in this diagram, in practice, we continuously transition from the first stage to the second.
| Model | Text-Only Pre-training | Image-Text Pre-training | Multitask Fine-Tuning |
|---|---|---|---|
| BLIP3 (Xue et al., 2024) | Fully pre-trained (Phi3-mini) | Re-warmup Caption and interleaved text-image data; no pure text | Re-warmup |
| Flamingo (Alayrac et al., 2022) | Fully pre-trained (closed model) | Re-warmup Caption and interleaved text-image data; no pure text | (Skipped) |
| IDEFICS (Laurençon et al., 2024) | Fully pre-trained (Mistral-7B-v0.1) | Re-warmup Interleaved text-image data; no pure text | Re-warmup |
| MM1 (McKinzie et al., 2024) | Fully pre-trained (closed model) | Re-warmup Various image-text ratios (100::0, 91::9, 86::14, 66::33) | Re-warmup |
| DeepSeek-VL / DeepSeek-VL2 (Lu et al., 2024; Wu et al., 2024b) | Fully pre-trained (DeepSeek) | Two-stage (re-warmup then re-warmup) Multitask; 30::70 image-text ratio | Re-warmup |
| Qwen-VL (Bai et al., 2023) | Fully pre-trained (Qwen) | Two-stage (re-warmup then re-warmup) Caption then multitask; no pure text | Re-warmup |
| PaliGemma (Beyer et al., 2024) | Fully pre-trained (Gemma) | Two-stage (re-warmup then continue LR schedule) Multitask; no pure text | Continued LR schedule |
| Janus / Janus Pro (Wu et al., 2024a; Chen et al., 2025) | Fully pre-trained (DeepSeek-LLM) | Two-stage (re-warmup then re-warmup) Multitask; no pure text, followed by 30::70 image-text ratio | No warmup |
| Prismatic (Karamcheti et al., 2024) | Fully pre-trained (LLaMA) | No image-text pre-training. | Re-warmup |
| Ours | Partially pre-trained (OpenLM) | Continued LR schedule Various image-text ratios | Re-warmup |
🔼 This table compares different approaches to Vision-Language Model (VLM) training. Traditional methods (shown in the table) first fully train a language model using only text data, then add image data in a later stage (fine-tuning). The authors’ approach, however, introduces image data earlier in the pre-training process. To maintain efficiency, this involves resuming a pre-trained language model at various points (e.g., 20%, 80%) and then incorporating the image data. The table lists several existing VLMs, detailing their pre-training and fine-tuning methods to highlight the differences with the proposed method.
read the caption
Table 1: The conventional approach to VLM training first fully trains a language model on text-only data, and adds images in a second or third stage of training. In this work, we instead introduce image data earlier in pre-training. To do this efficiently, we resume a language model during the course of its pre-training at various stages (e.g., 20% of the way through training) and introduce images midway through training.
In-depth insights#
Image Pre-Train#
Image pre-training, as explored in the research paper, is a crucial step in vision-language models (VLMs), significantly impacting downstream task performance. The timing of image data introduction is critical; pre-training with image and text mixtures allows models to perform better on vision-language tasks, maintaining strong text-only evaluations. The paper highlights that introducing visual tokens partially through pre-training yields better average improvement compared to fully pre-trained models. Varying image-to-text data ratios during the pre-training cooldown phase impacts domain performance. Experiments revealed an optimal visual token percentage at a 1B parameter regime. Furthermore, instruction fine-tuning image tokens are crucial for downstream performance, affecting pure text and vision-language tasks. This process actively impacts the model, but introducing instruction tokens boosts vision-language tasks.
Text/Image Ratio#
The text/image ratio is a crucial hyperparameter in vision-language models (VLMs). It dictates the blend of textual and visual information during pre-training, influencing the model’s ability to understand and generate content grounded in both modalities. An optimal ratio enables the model to effectively learn the relationship between text and images, resulting in better downstream performance on various vision-language tasks. Too much text might lead to a neglect of visual cues, while excessive image data could result in a weaker understanding of language nuances. Finding the right balance is essential for achieving strong performance on diverse tasks, requiring careful tuning and experimentation. The ratio might vary based on dataset size, model architecture and specific task goals.
Fine-tuning Impact#
Fine-tuning profoundly shapes VLM behavior, balancing vision-language task improvements against text performance degradation. Initial fine-tuning boosts multimodal understanding, yet prolonged training risks overfitting, eroding text capabilities. The optimal duration is a delicate balance, a ‘sweet spot’ where vision and language skills synergize without compromising either. Further research is needed to explore adaptive fine-tuning strategies that dynamically adjust the training process based on task-specific performance, potentially mitigating the trade-off between vision and text and unlocking further gains.
Scaling Bottleneck#
Though this paper doesn’t explicitly address a section titled “Scaling Bottleneck”, several insights allude to potential bottlenecks when scaling Vision-Language Models (VLMs). Data quality emerges as a key constraint: simply increasing the volume of image-text pairs may not suffice, as the paper highlights the importance of curated datasets and high-quality captions. Furthermore, the model architecture itself presents a bottleneck. The paper observes performance differences between models of varying sizes, suggesting that a simple increase in parameters isn’t a guaranteed path to improvement. The training process itself introduces limitations. The paper’s exploration of different pre-training strategies demonstrates that the order and timing of integrating image data can significantly impact performance. Compute cost is also a bottleneck: Scaling to larger models and datasets demands significant resources, hindering rapid iteration and experimentation for many researchers.
Dataset Matters#
The choice of dataset is paramount in vision-language pre-training. High-quality, curated data is essential, as noisy or irrelevant data can significantly hinder a model’s ability to learn meaningful relationships between images and text. The dataset’s diversity, coverage of visual concepts, and caption quality all influence downstream performance. Specifically for datasets: DataComp-DR is better overall. This selection has significant improvement across different datasets. Thus, the appropriate dataset has a key role in improving the efficiency for VLMs.
More visual insights#
More on figures

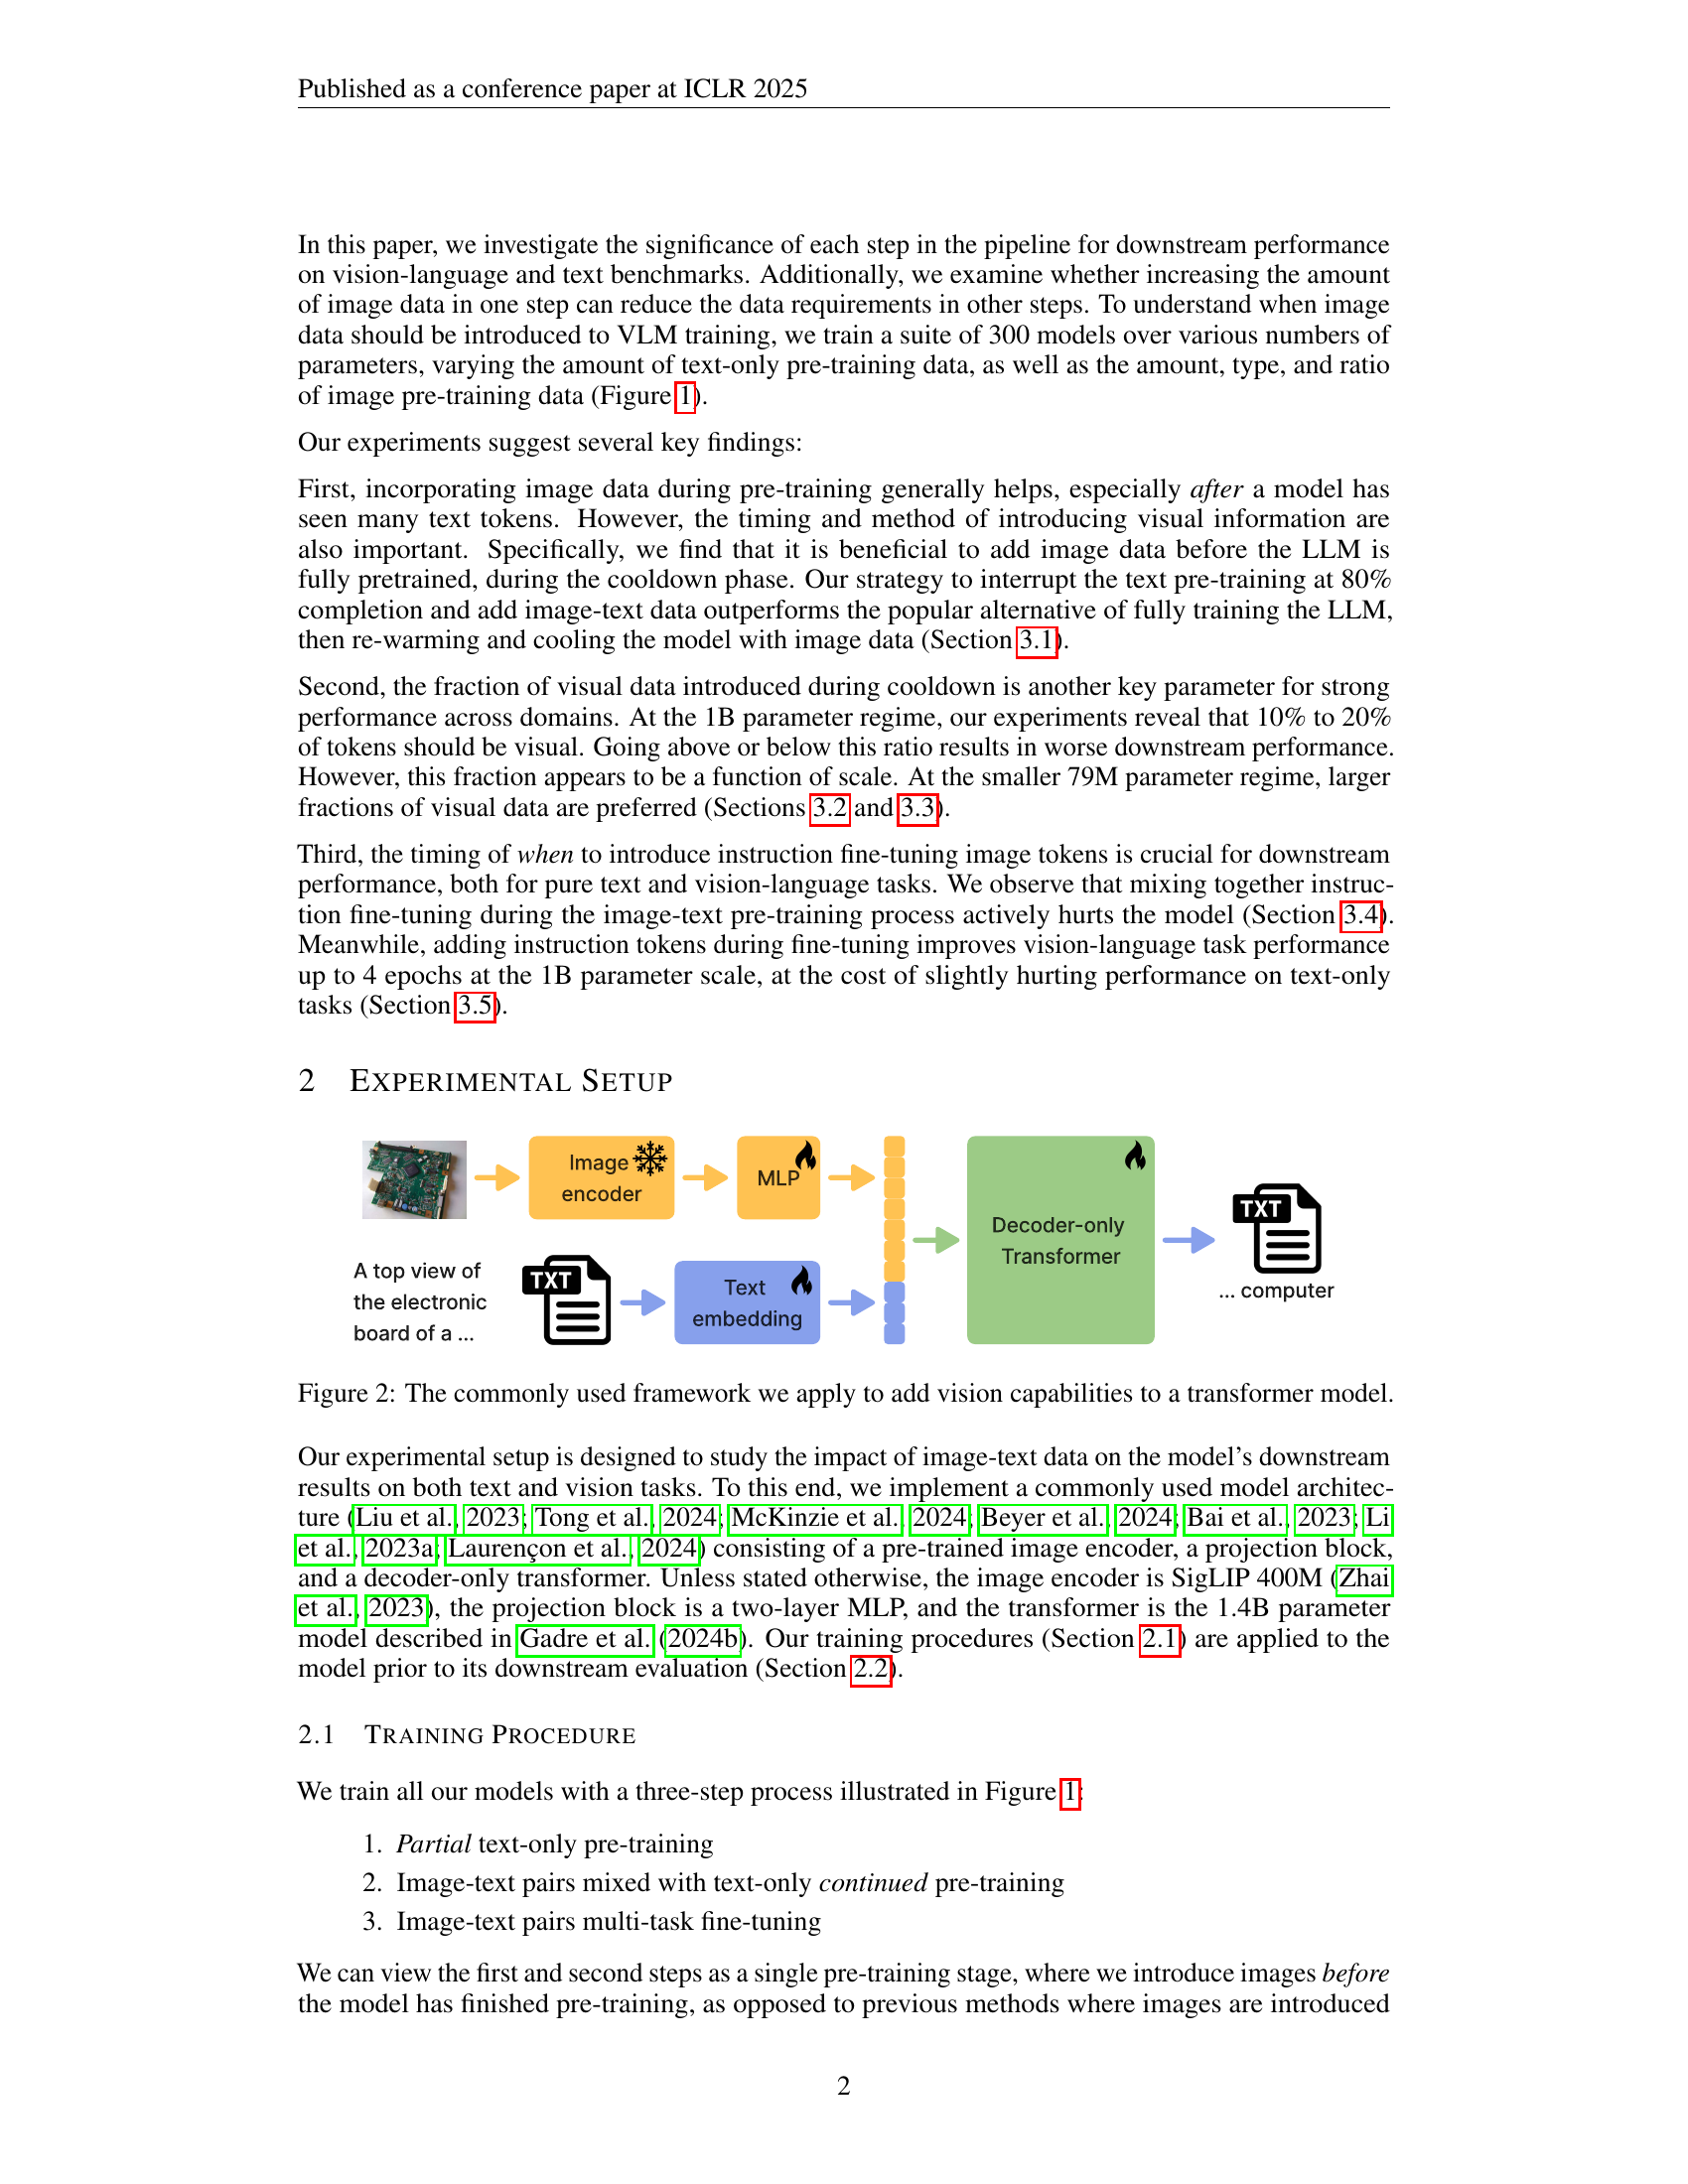
🔼 This figure illustrates a common architecture used to integrate vision into transformer-based language models. It shows how an image encoder processes an image, converting it into a numerical representation. This representation is then passed through a Multi-Layer Perceptron (MLP), which transforms the data into a format compatible with the transformer model’s text embeddings. Finally, the image and text embeddings are combined and processed by a decoder-only transformer to generate a comprehensive textual response based on the combined input.
read the caption
Figure 2: The commonly used framework we apply to add vision capabilities to a transformer model.

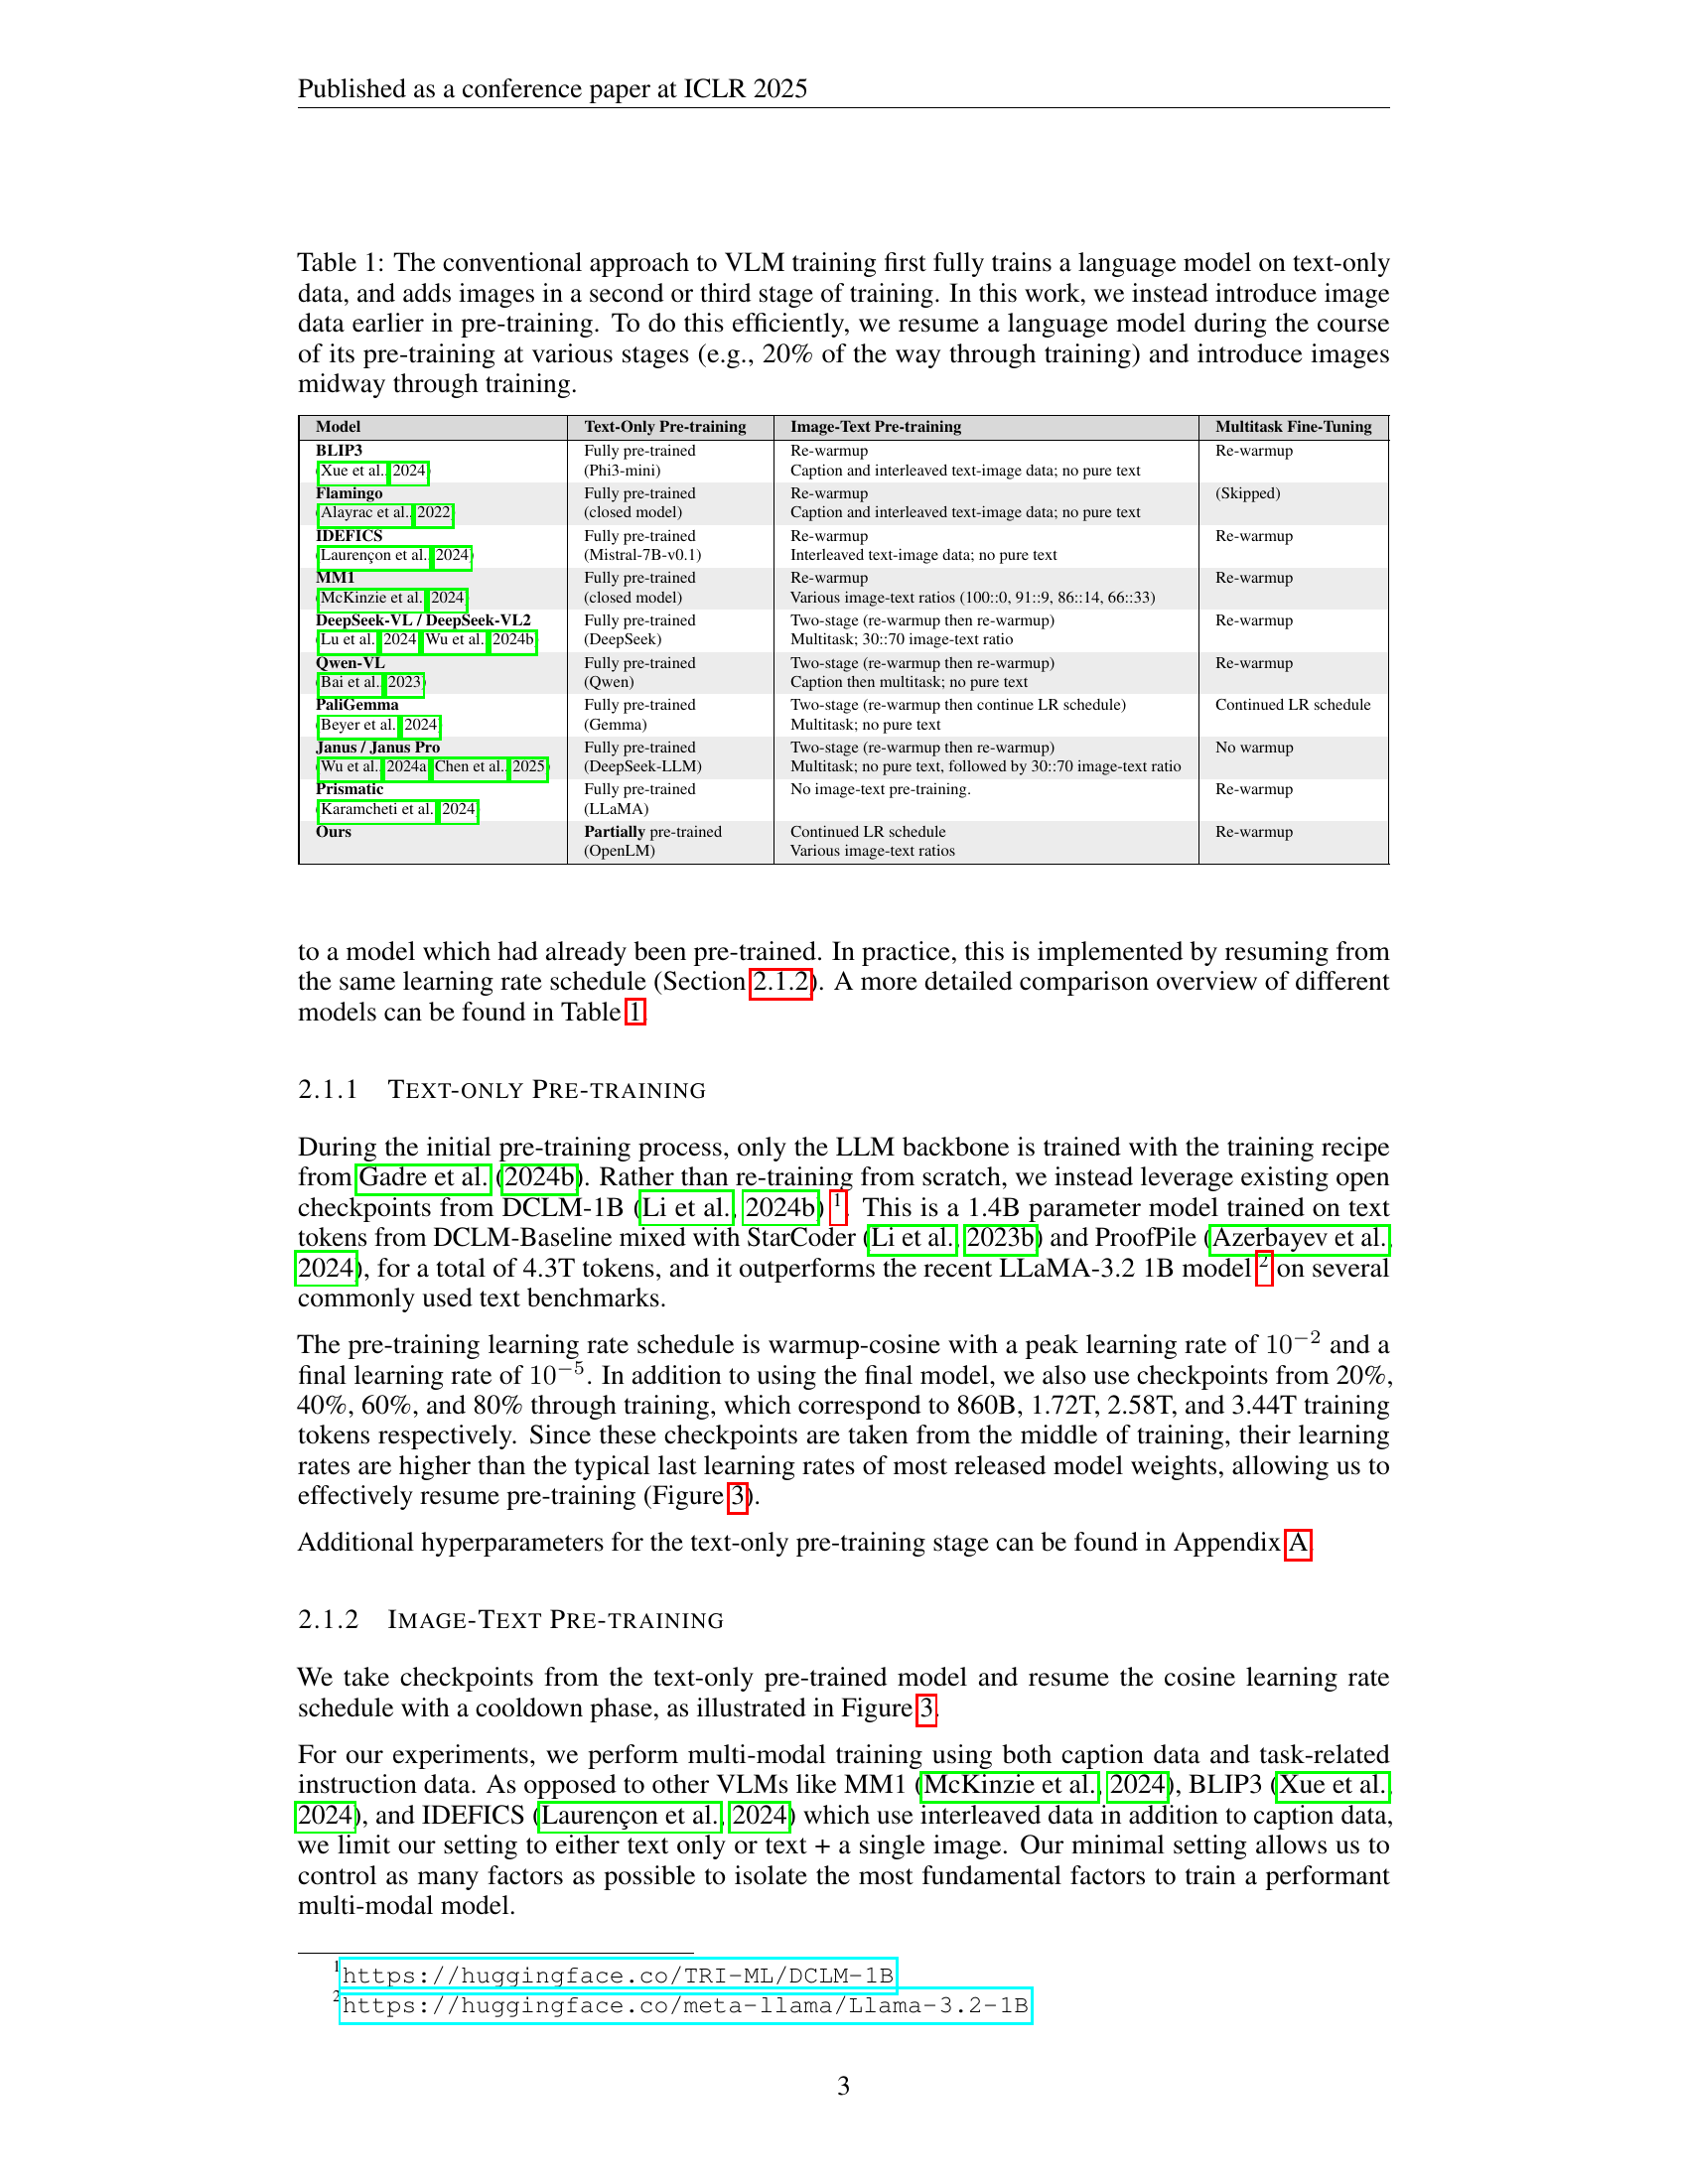
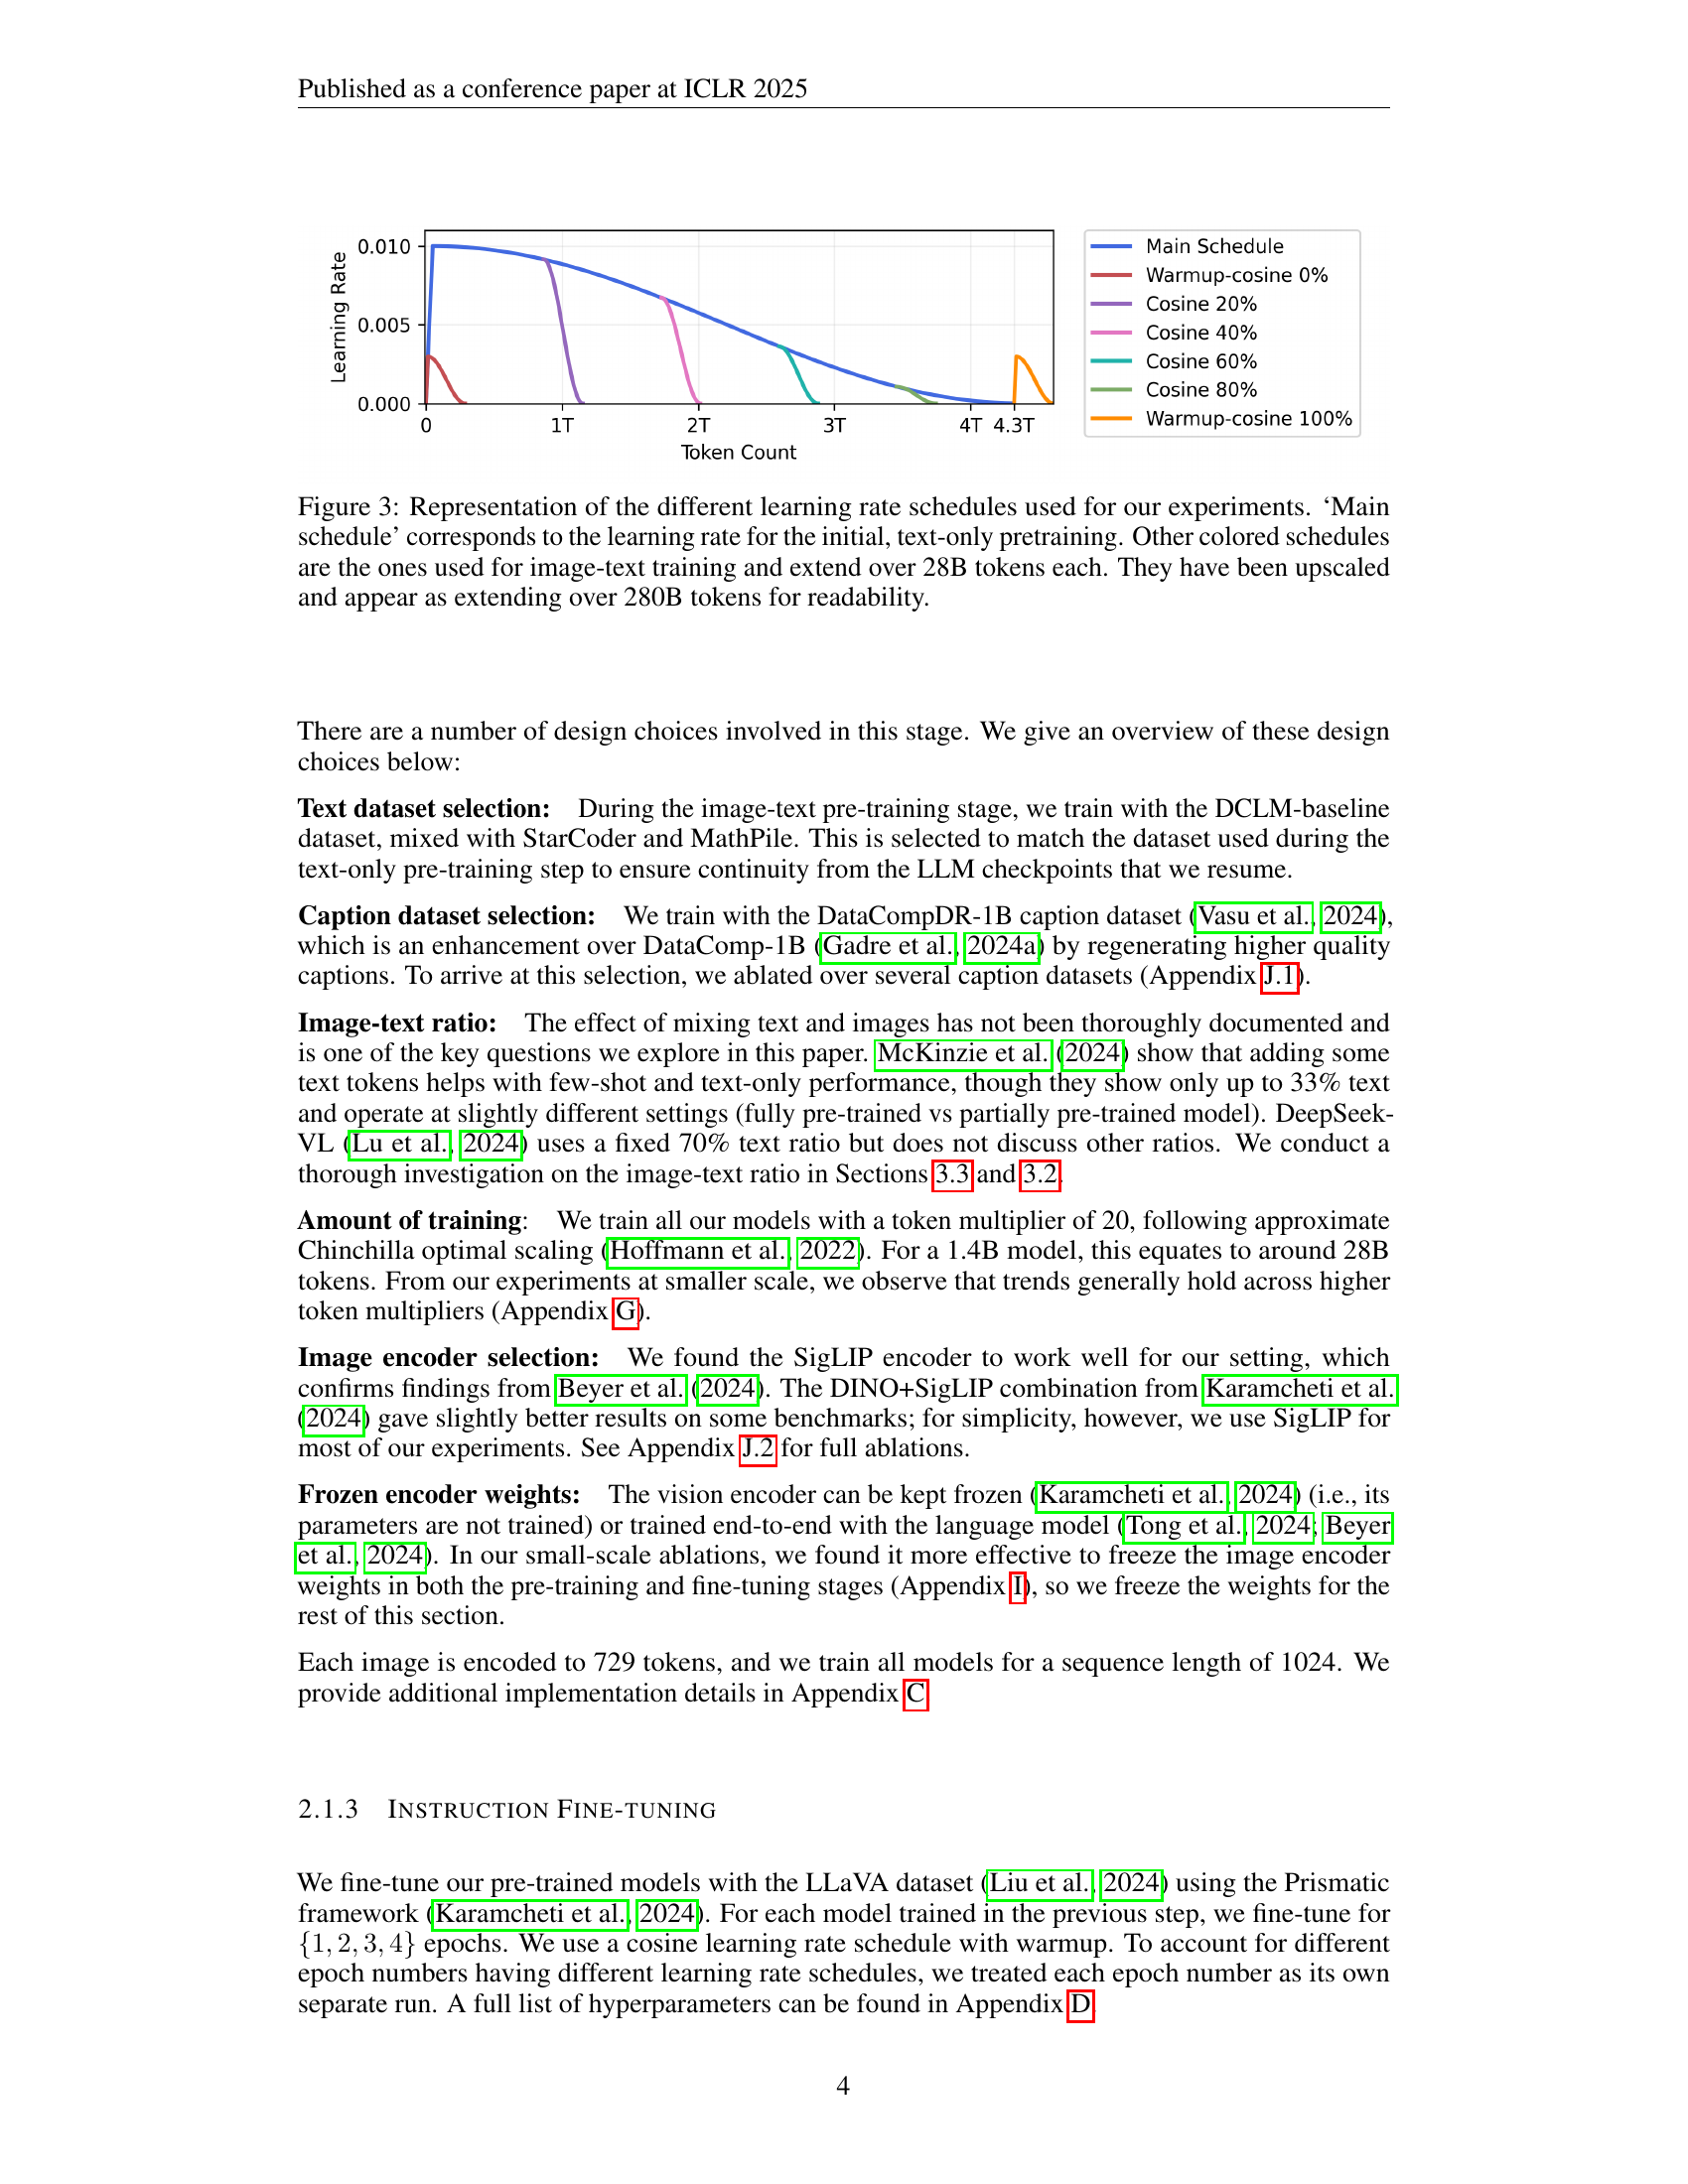
🔼 Figure 3 illustrates the learning rate schedules employed in the experiments. The ‘Main Schedule’ represents the learning rate used during the initial text-only pre-training phase. The colored lines depict the learning rate schedules for the subsequent image-text pre-training phases. Each colored schedule covers 28 billion tokens. For better visualization and readability, the x-axis has been scaled up to represent 280 billion tokens, while maintaining the relative proportions of each schedule.
read the caption
Figure 3: Representation of the different learning rate schedules used for our experiments. ‘Main schedule’ corresponds to the learning rate for the initial, text-only pretraining. Other colored schedules are the ones used for image-text training and extend over 28B tokens each. They have been upscaled and appear as extending over 280B tokens for readability.

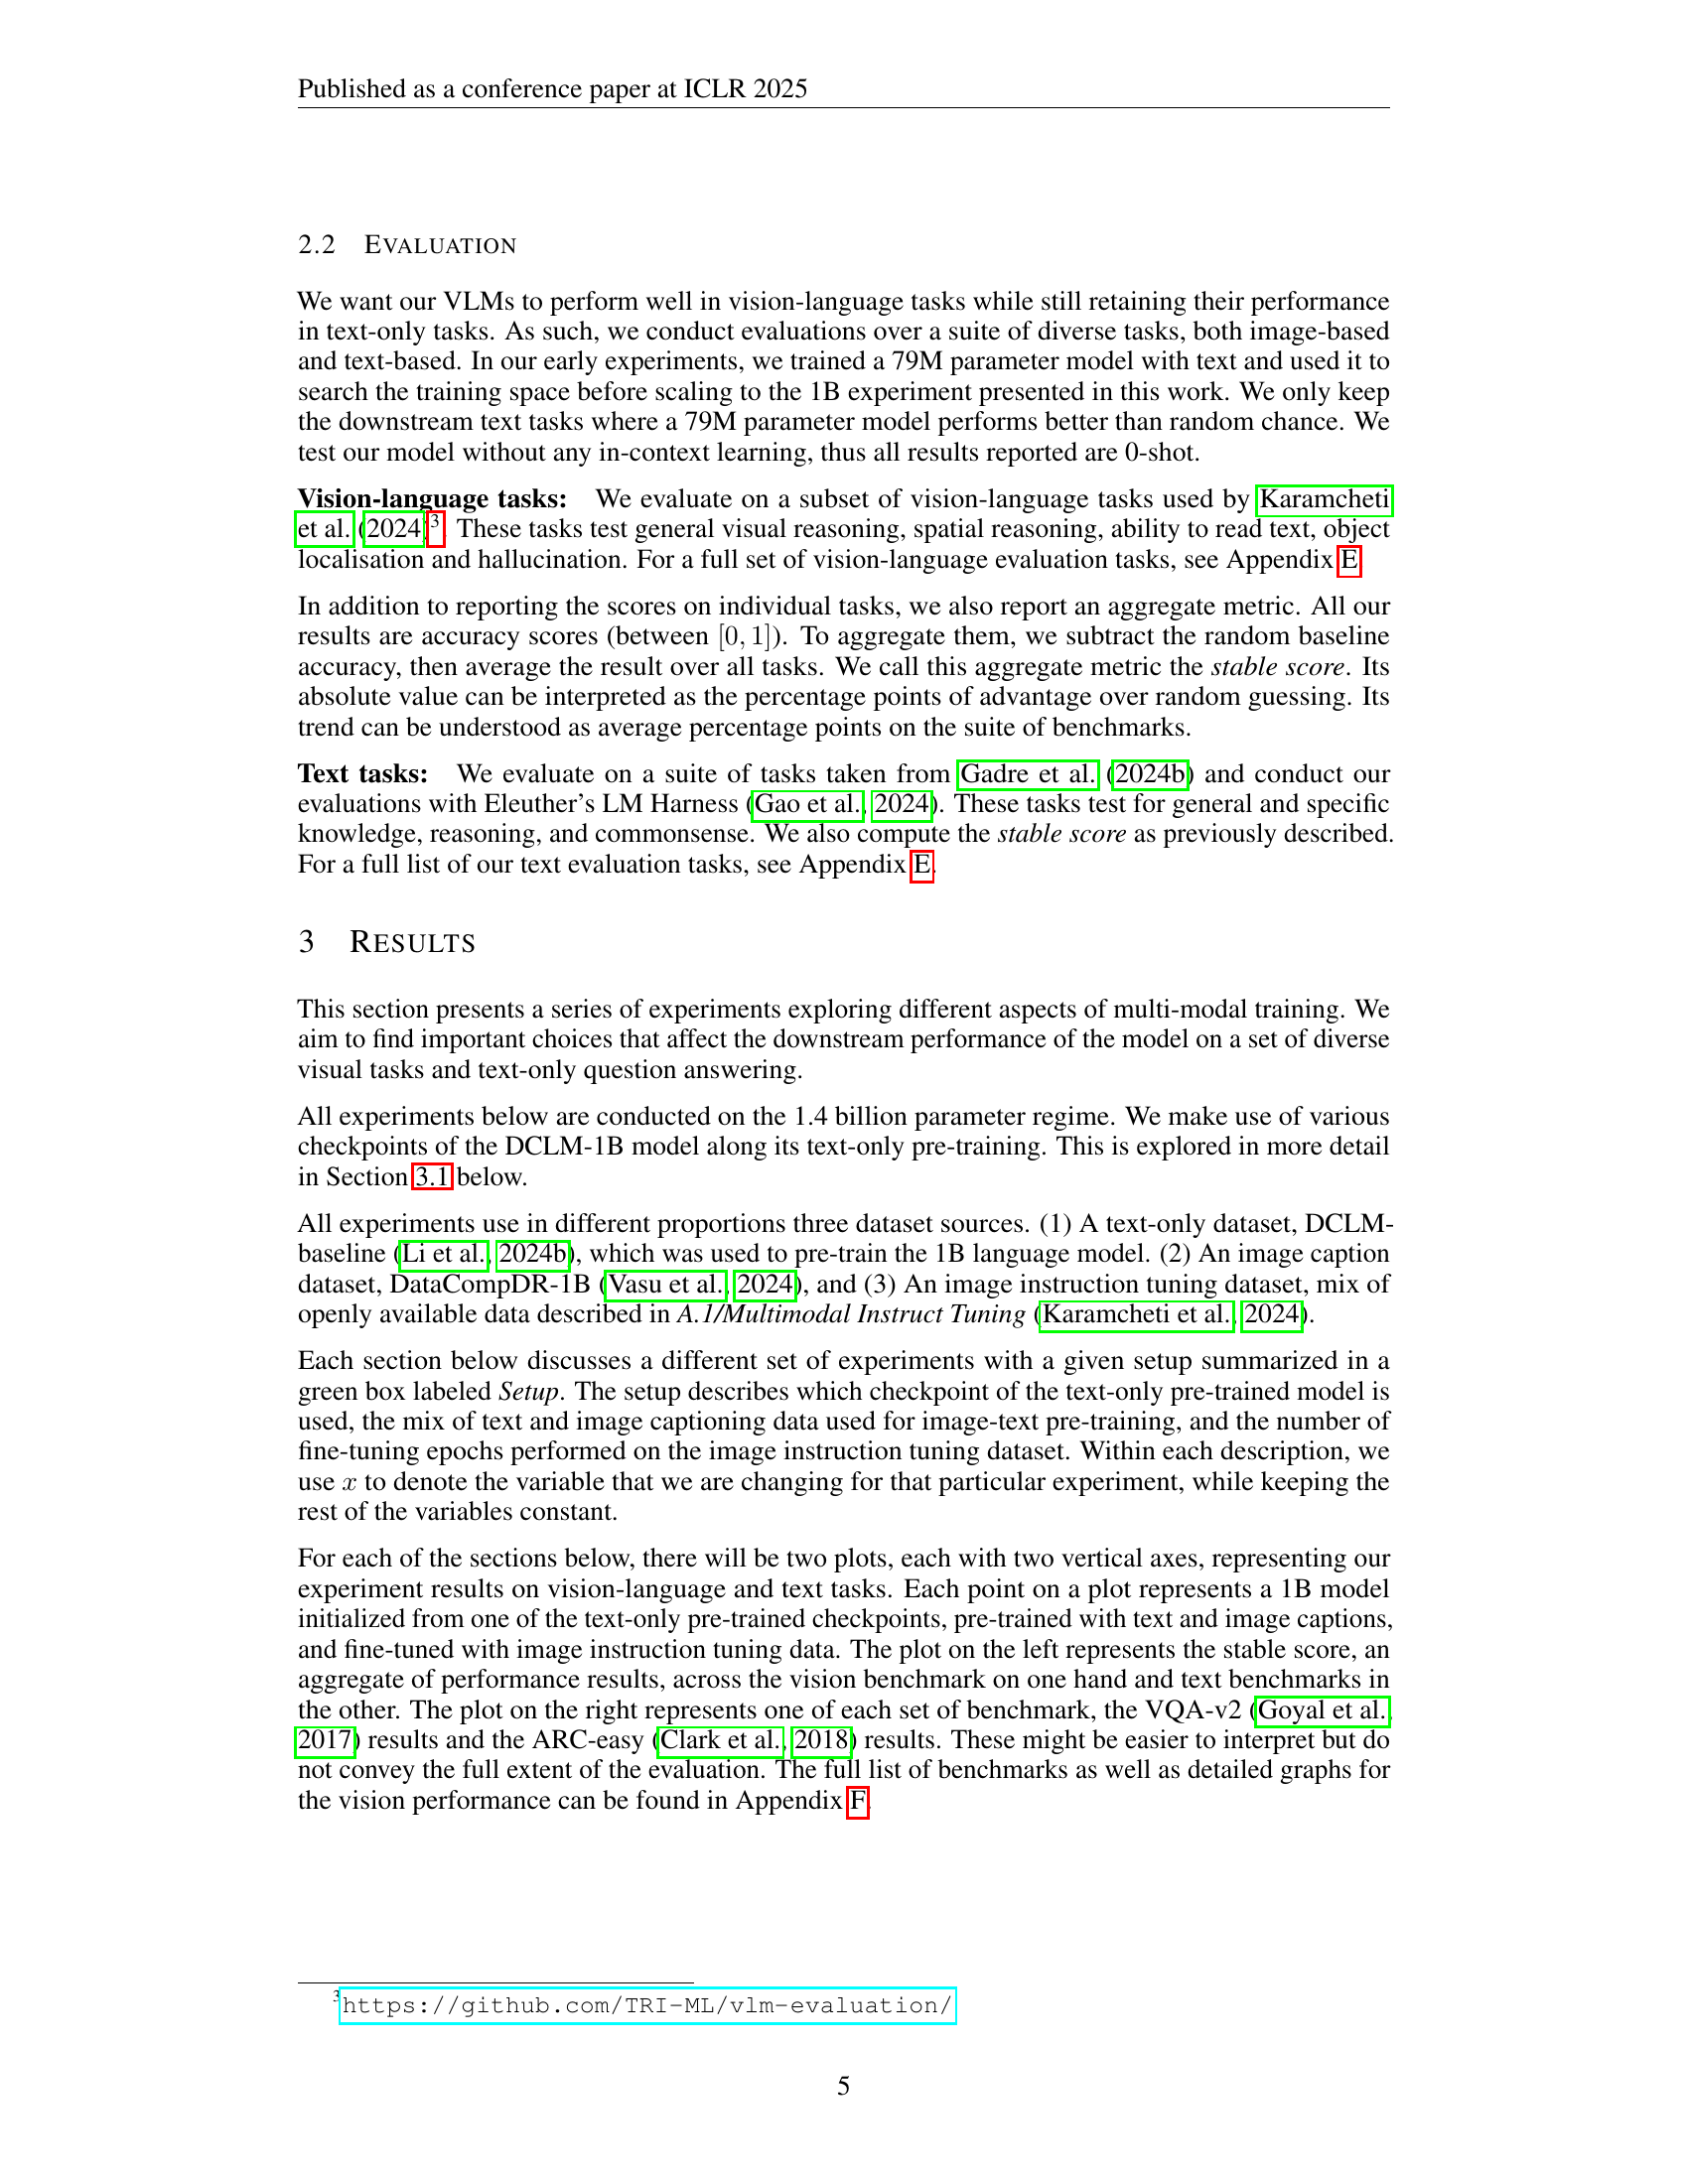
🔼 This figure displays the impact of varying the length of text-only pre-training before introducing image data during the training of a vision-language model (VLM). The experiment involves training VLMs with different amounts of text-only pre-training (0%, 20%, 40%, 60%, 80%, and 100%) before incorporating image data. The results are evaluated on both vision-based and text-based benchmarks. The left panel shows the aggregate performance across multiple vision and text tasks, while the right panel focuses specifically on the VQA-v2 and ARC-easy benchmarks. The findings suggest that introducing image data around 80% of the way through text-only pre-training yields the best overall performance, maintaining strong performance on both vision and text tasks. A key note is that the 100% text-only pre-training point uses a different learning rate schedule than the other points, as detailed in Figure 3 of the paper.
read the caption
Figure 4: Varying the length of text-only pre-training. We analyze the impact of adding image data after varying amounts of text-only pre-training, showing results on vision benchmarks (green) and text benchmarks (blue). On the left, we show results across a suite of vision and text benchmarks; on the right, we plot two common benchmarks, VQA-v2 and ARC-easy. Introducing images at around 80% of the way through training performs best, maintaining high vision and text task performance. Note: The points at 100% are marked with hollow circles to highlight that they are trained with a different learning rate schedule, as shown in Figure 3

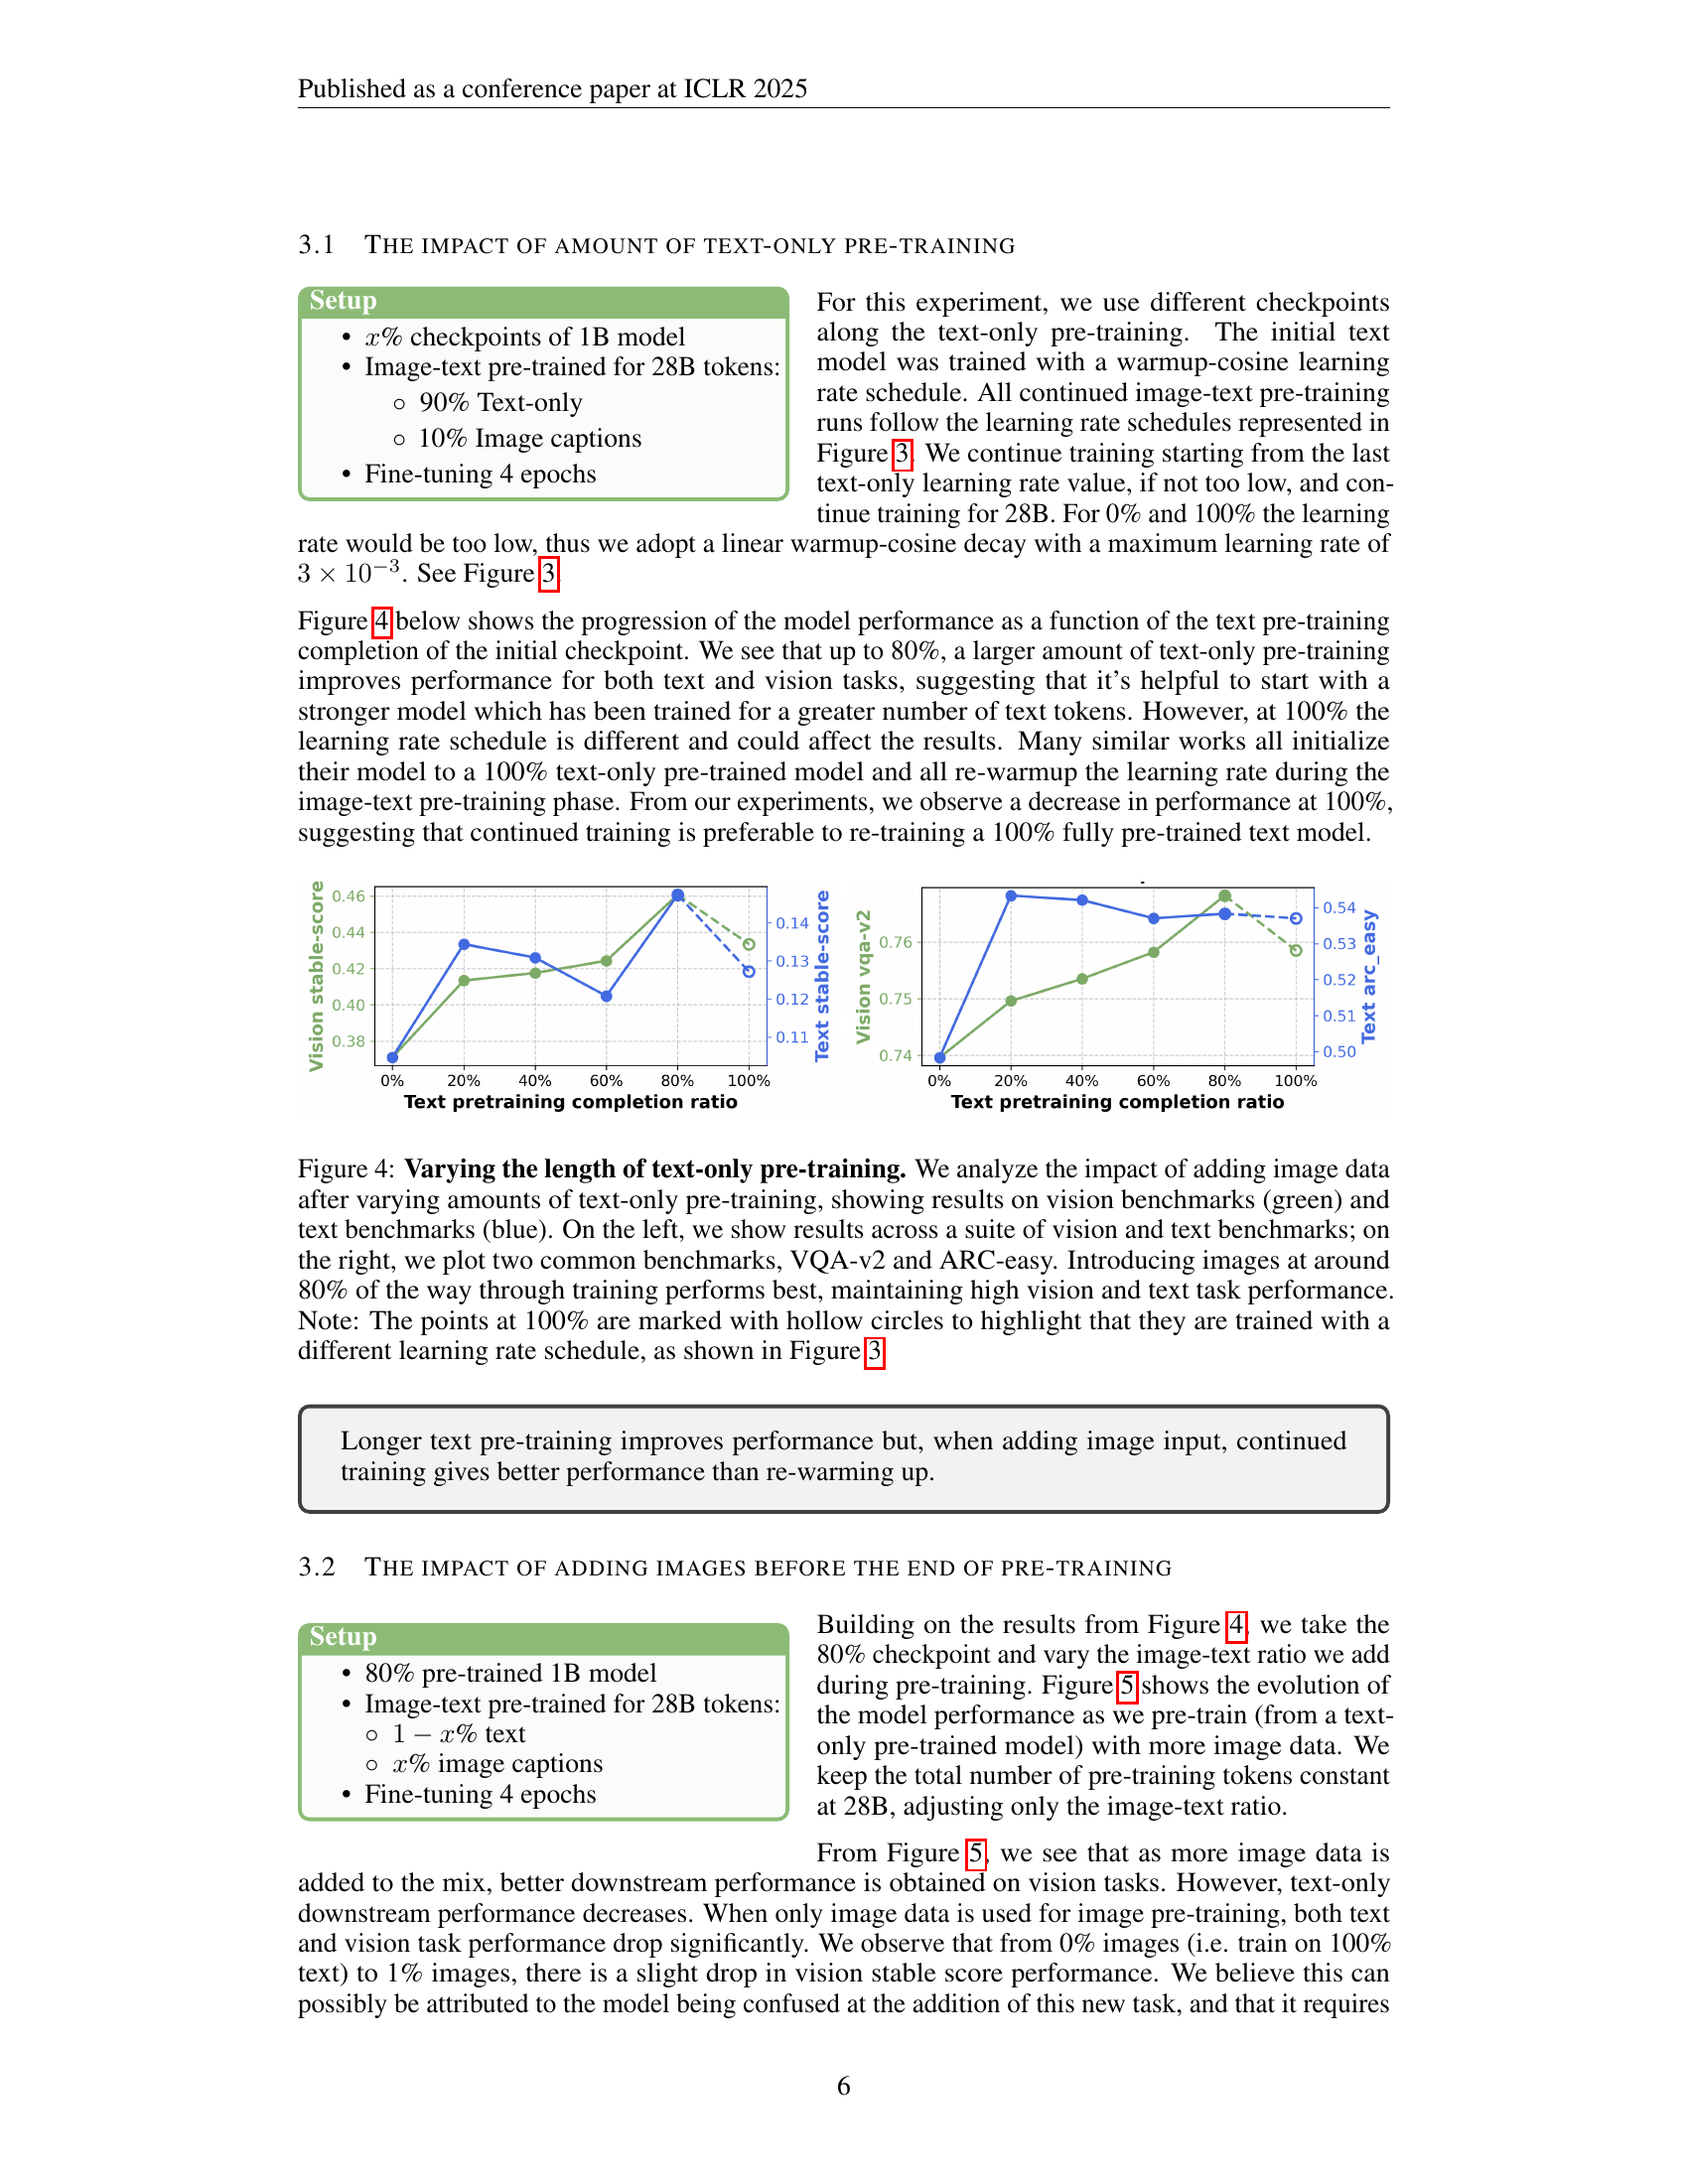
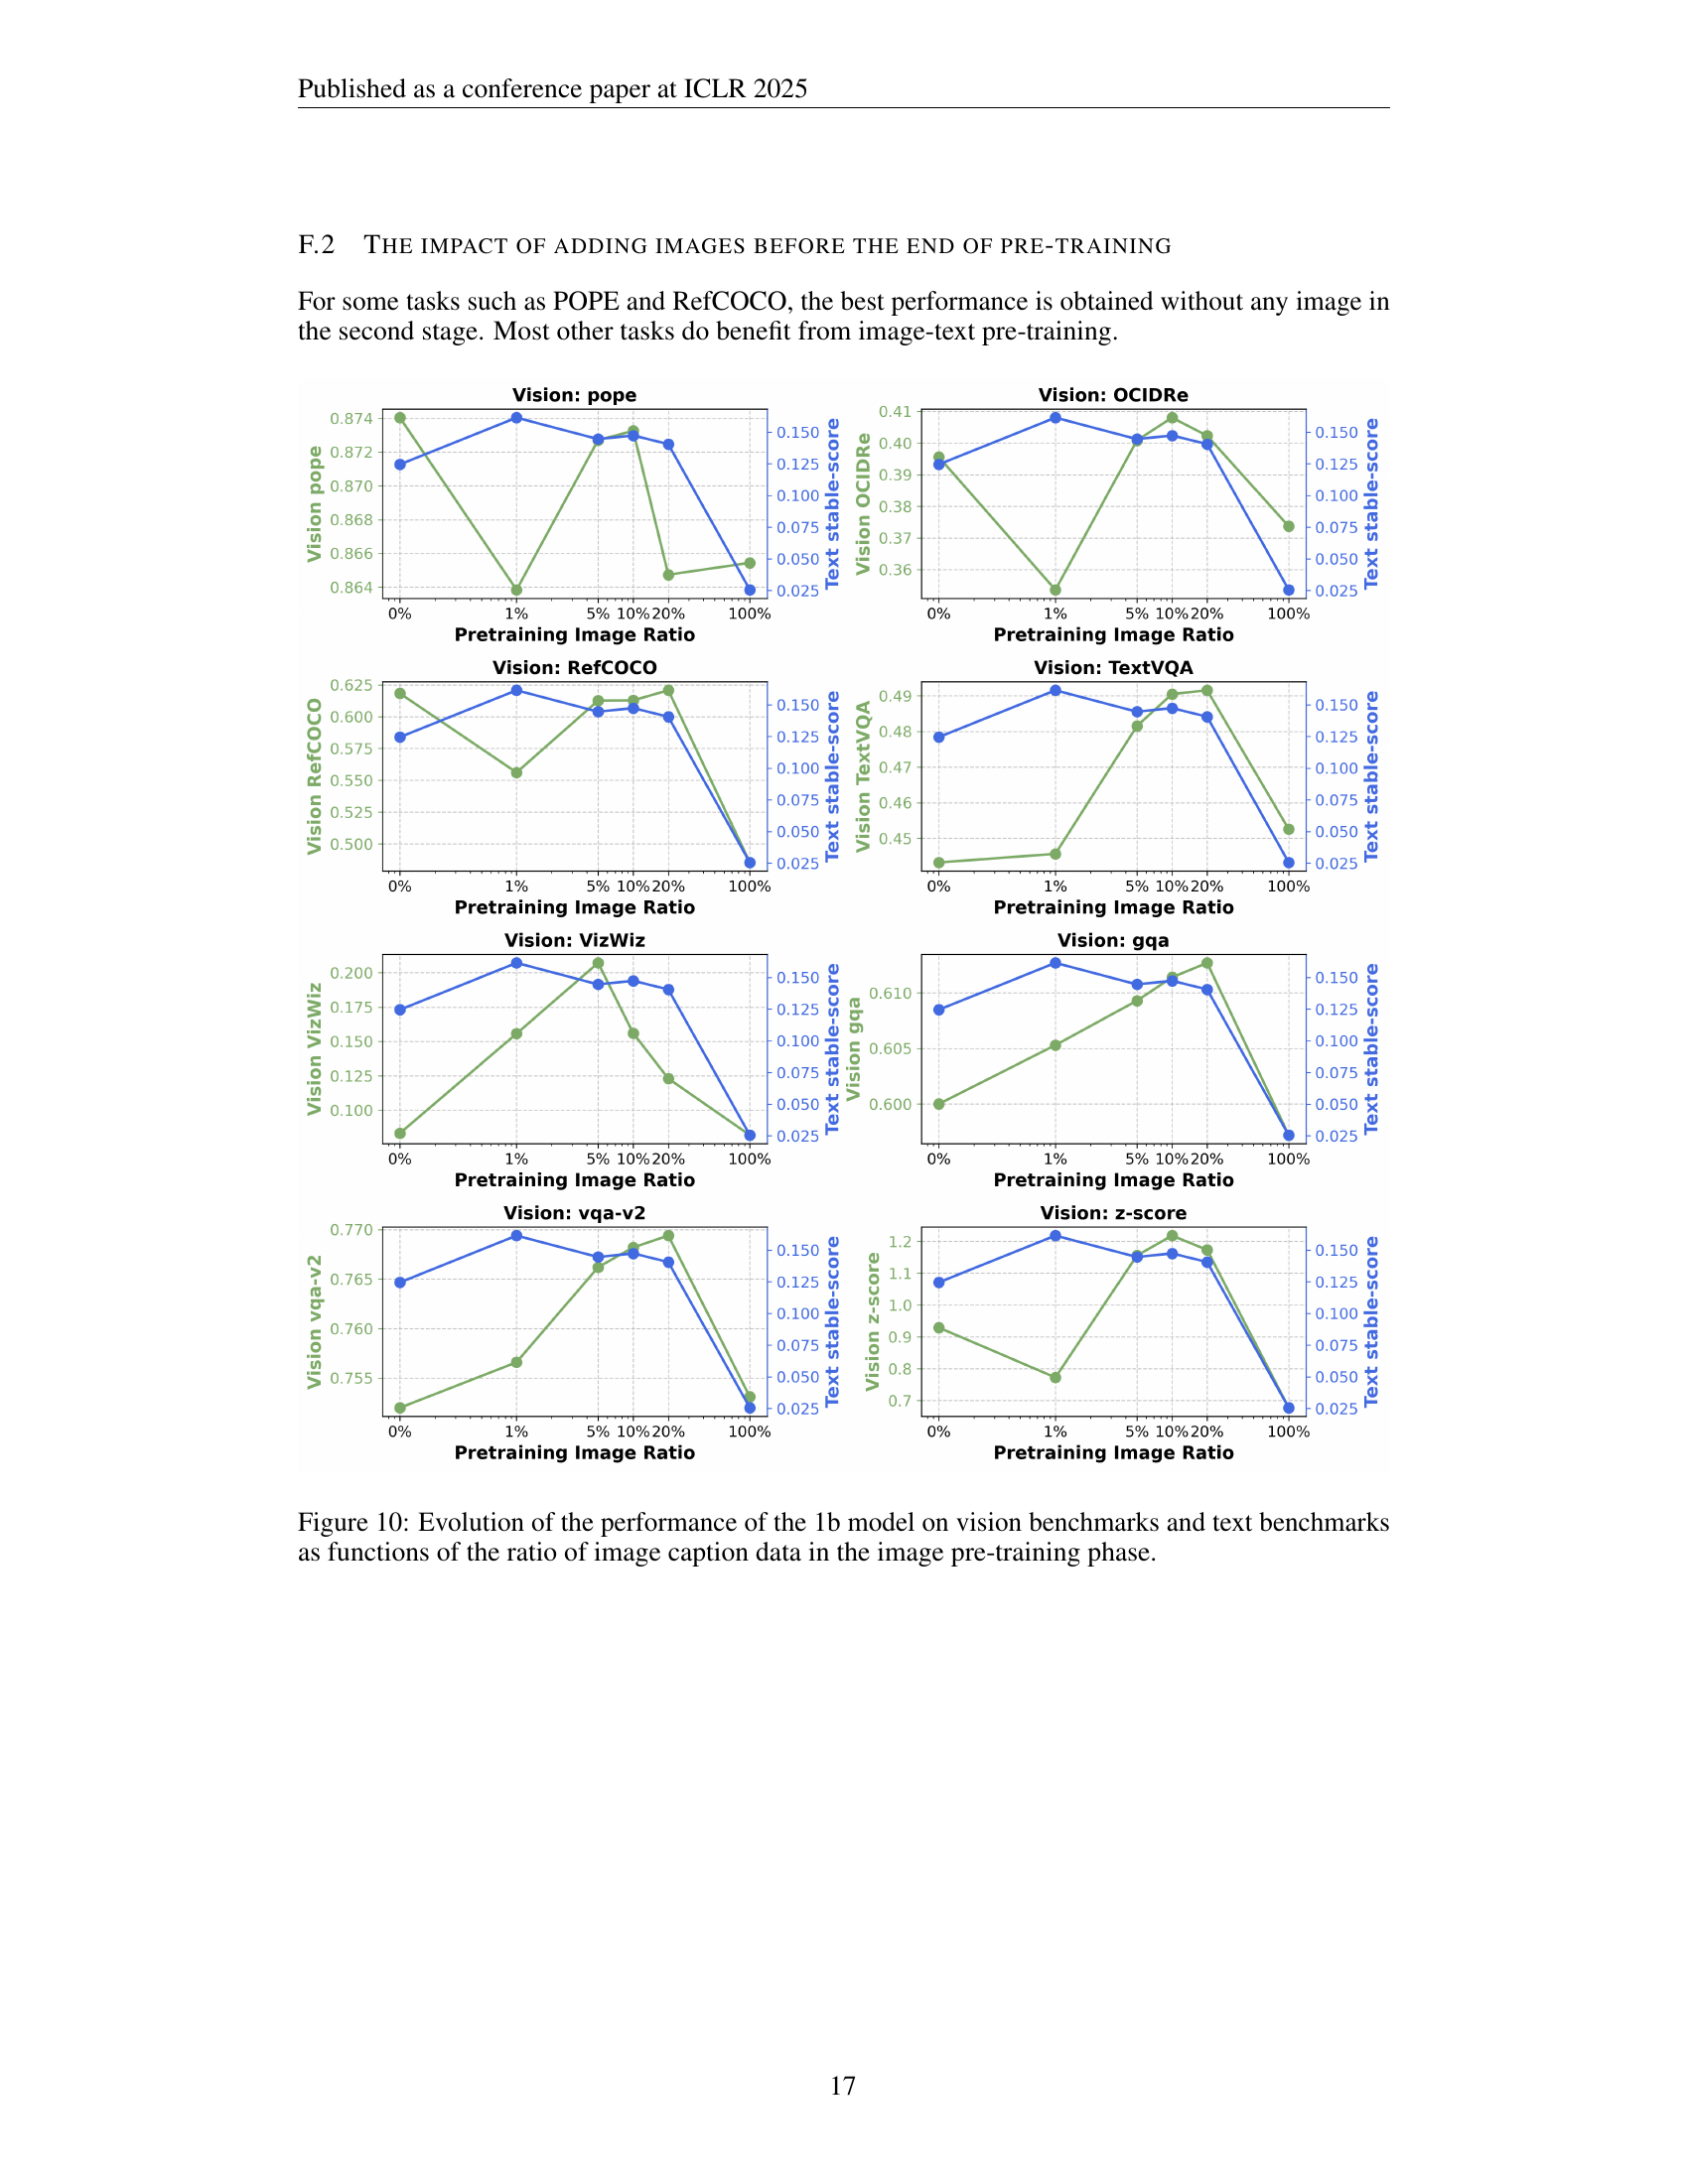
🔼 This figure analyzes the effect of varying the ratio of image to text data during the image-text pre-training phase of a vision-language model (VLM). The experiment starts with a model already pre-trained on text-only data (80% completion). The x-axis represents the percentage of image data included in the subsequent image-text pre-training phase, while the y-axis displays the model’s performance on various vision-language and text-only tasks. The key takeaway is that adding a small amount of image data during this pre-training stage significantly boosts vision-language performance without negatively impacting the model’s proficiency on text-only tasks. This is in contrast to the findings shown in Figure 6, where the model is trained from scratch.
read the caption
Figure 5: Varying the ratio of image to text data, after some text-only pretraining. We analyze the impact of the ratio of image to text data in pre-training, after the model has seen text-only data for most of pre-training (80%). Unlike when training from scratch (Figure 6), we find that adding vision data significantly helps vision performance, while maintaining high text accuracy.

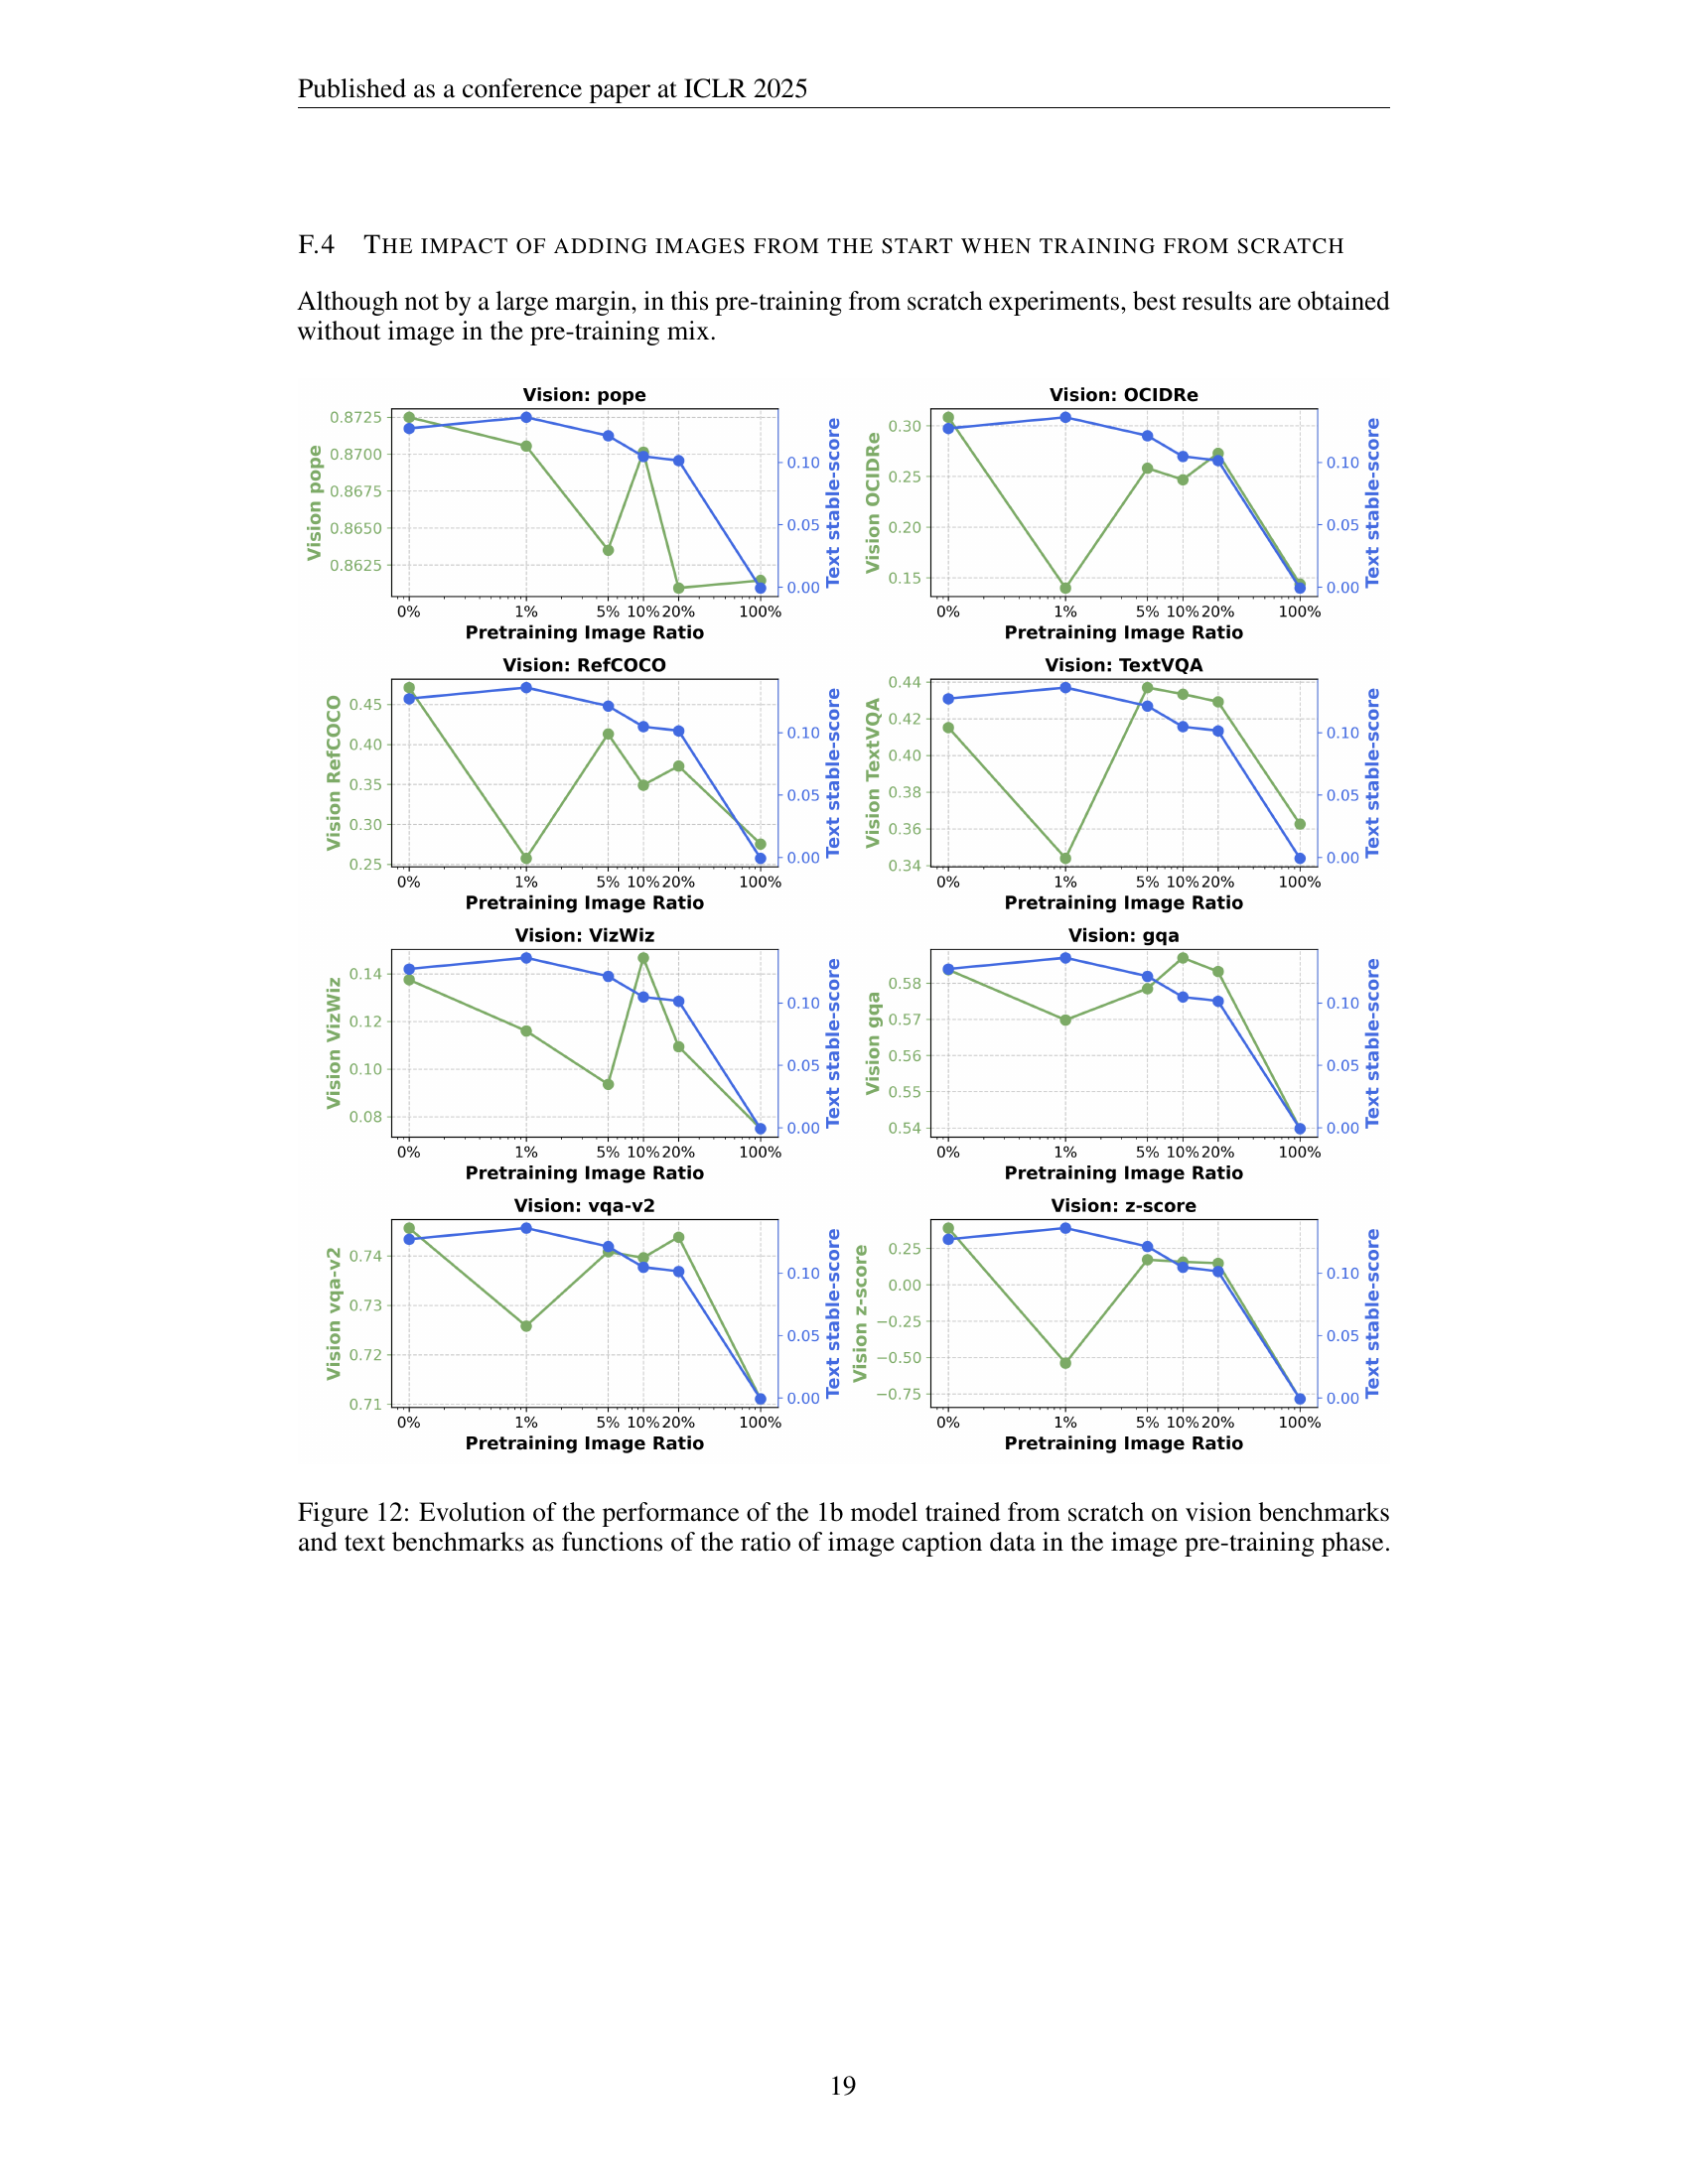
🔼 This figure presents the results of an experiment where vision-language models (VLMs) were trained from scratch with varying ratios of image and text data. Unlike experiments where models were pre-trained with text before introducing images, this experiment reveals that adding visual data during initial training negatively impacts both vision and text-based task performance. The results indicate that a period of initial language-only pre-training is crucial for optimal VLM performance.
read the caption
Figure 6: Varying the ratio of image to text data, when training from scratch. We analyze the impact of the image-text ratio in pre-training from scratch without any language-only pre-training. Perhaps surprisingly, when training from scratch, adding vision data consistently hurts both vision and text performance, suggesting a period of language-only training early on is important for VLMs.

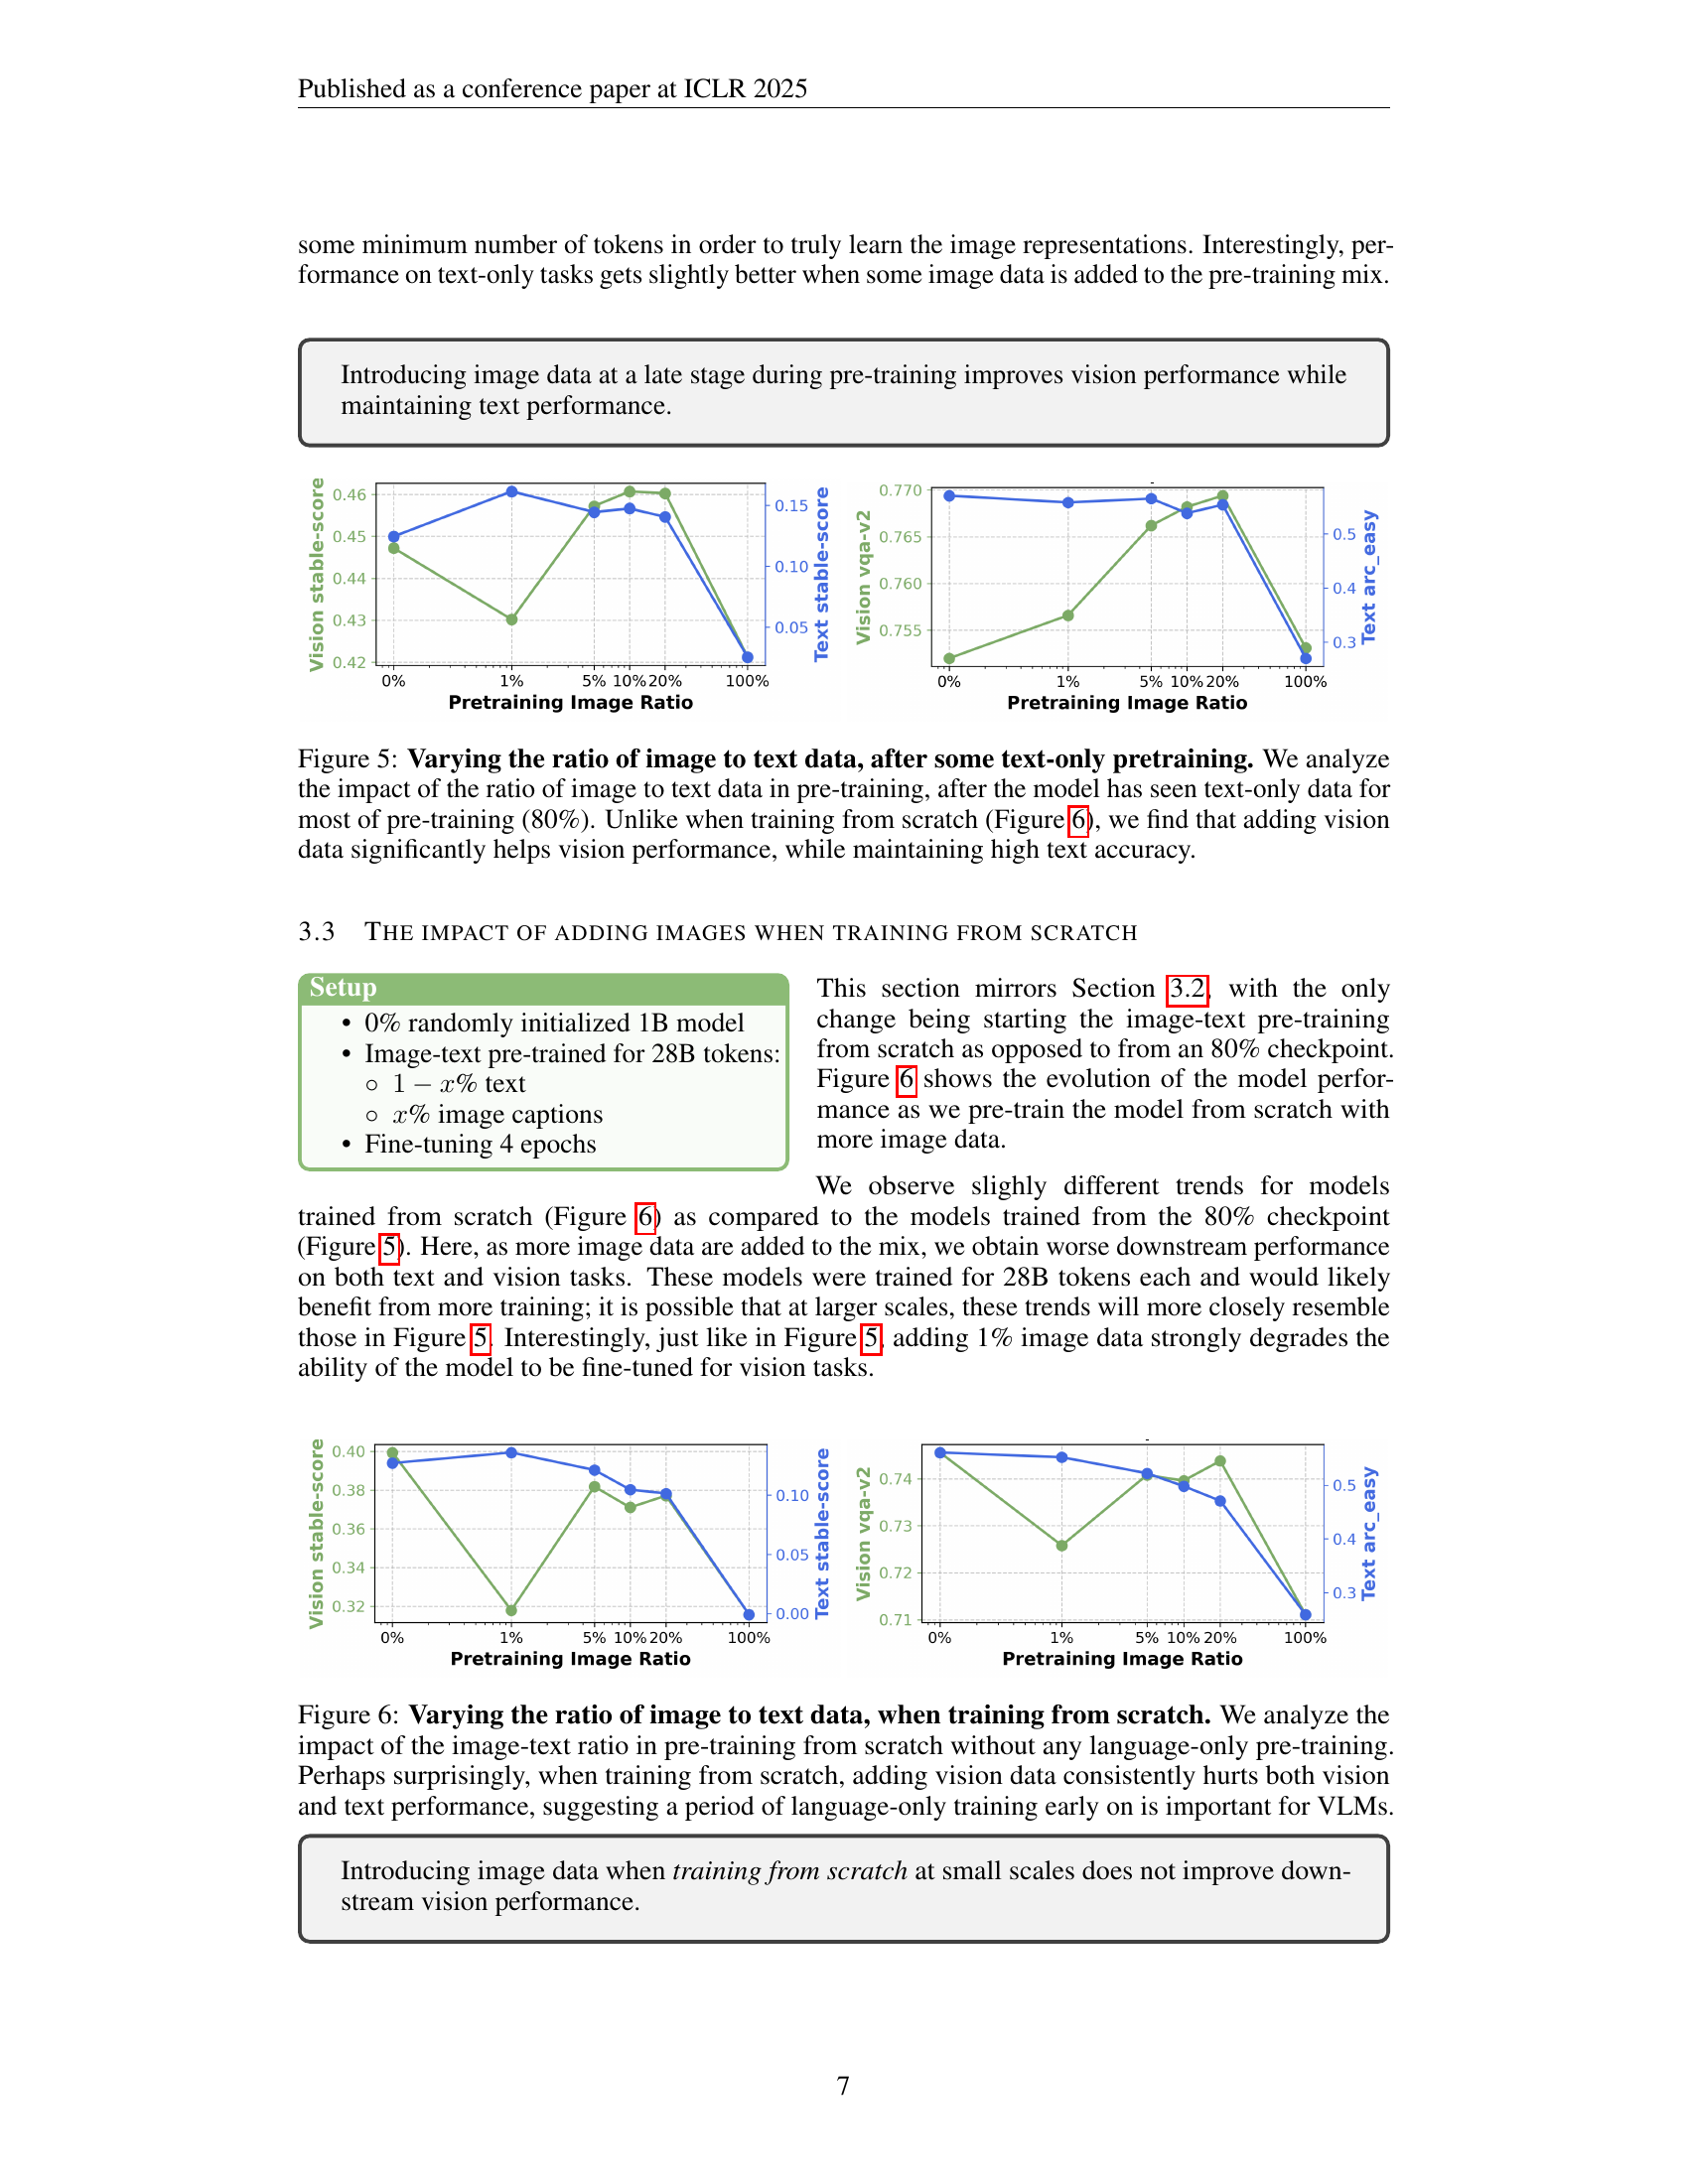
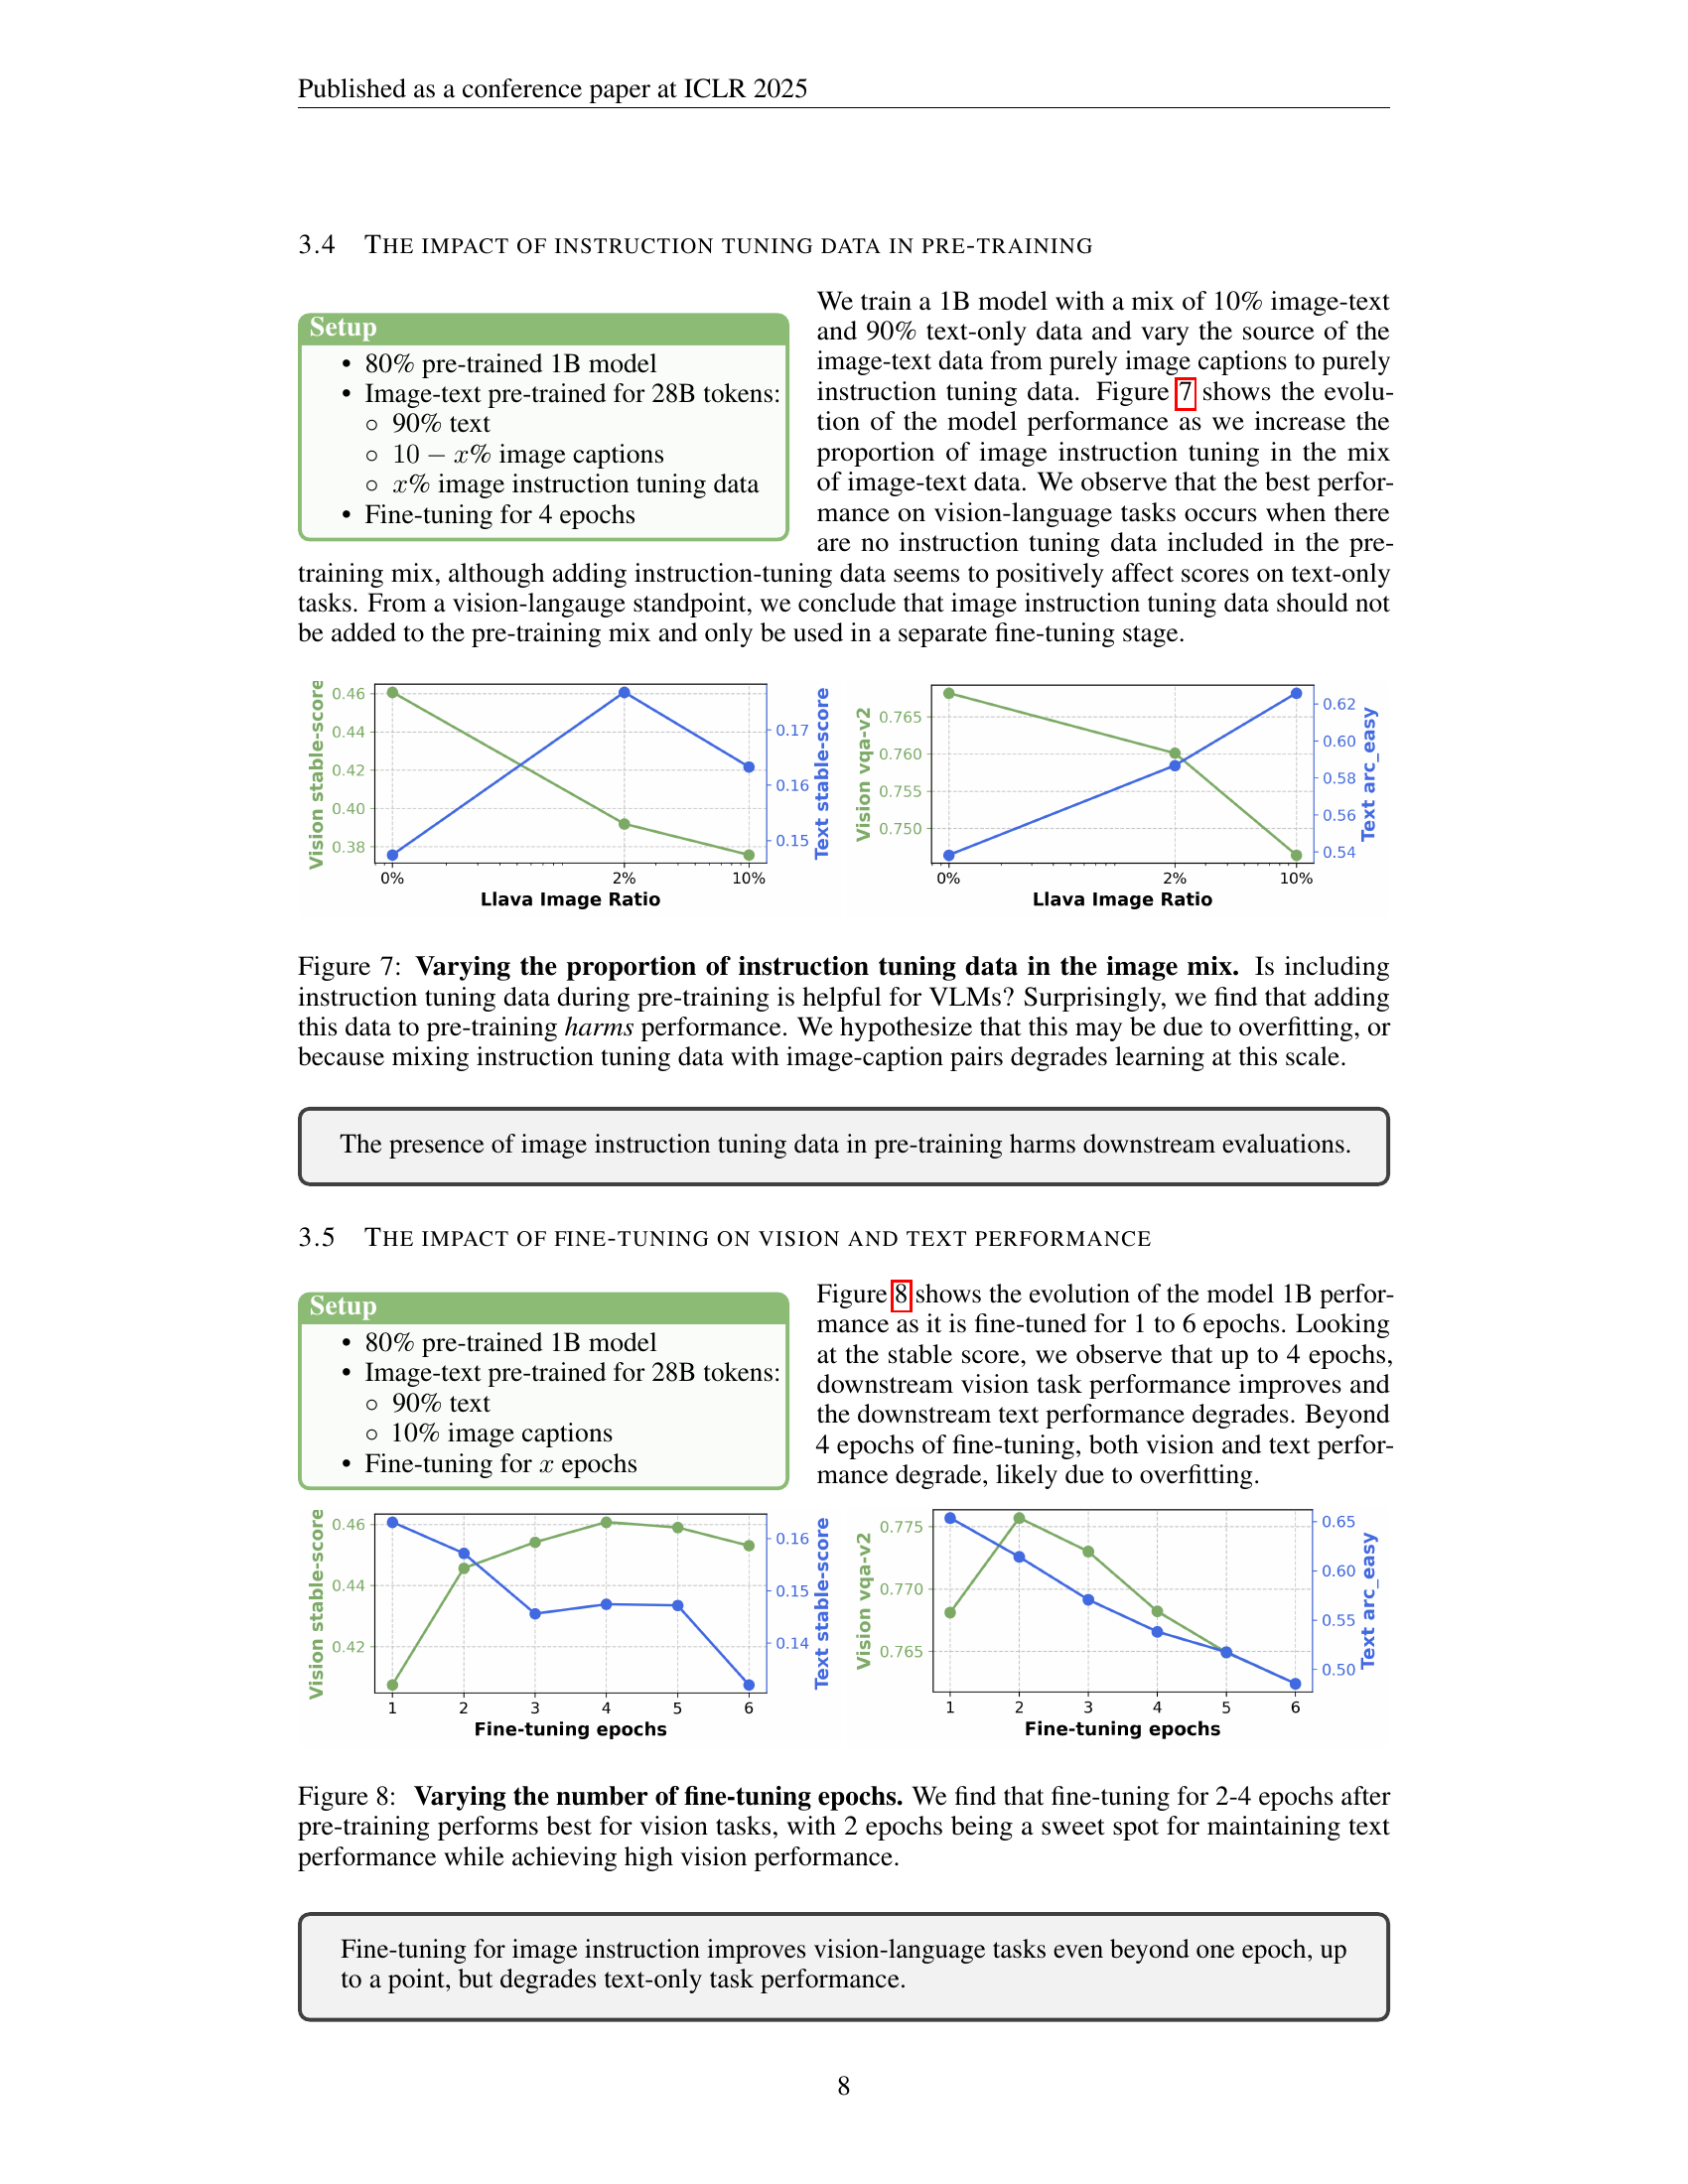
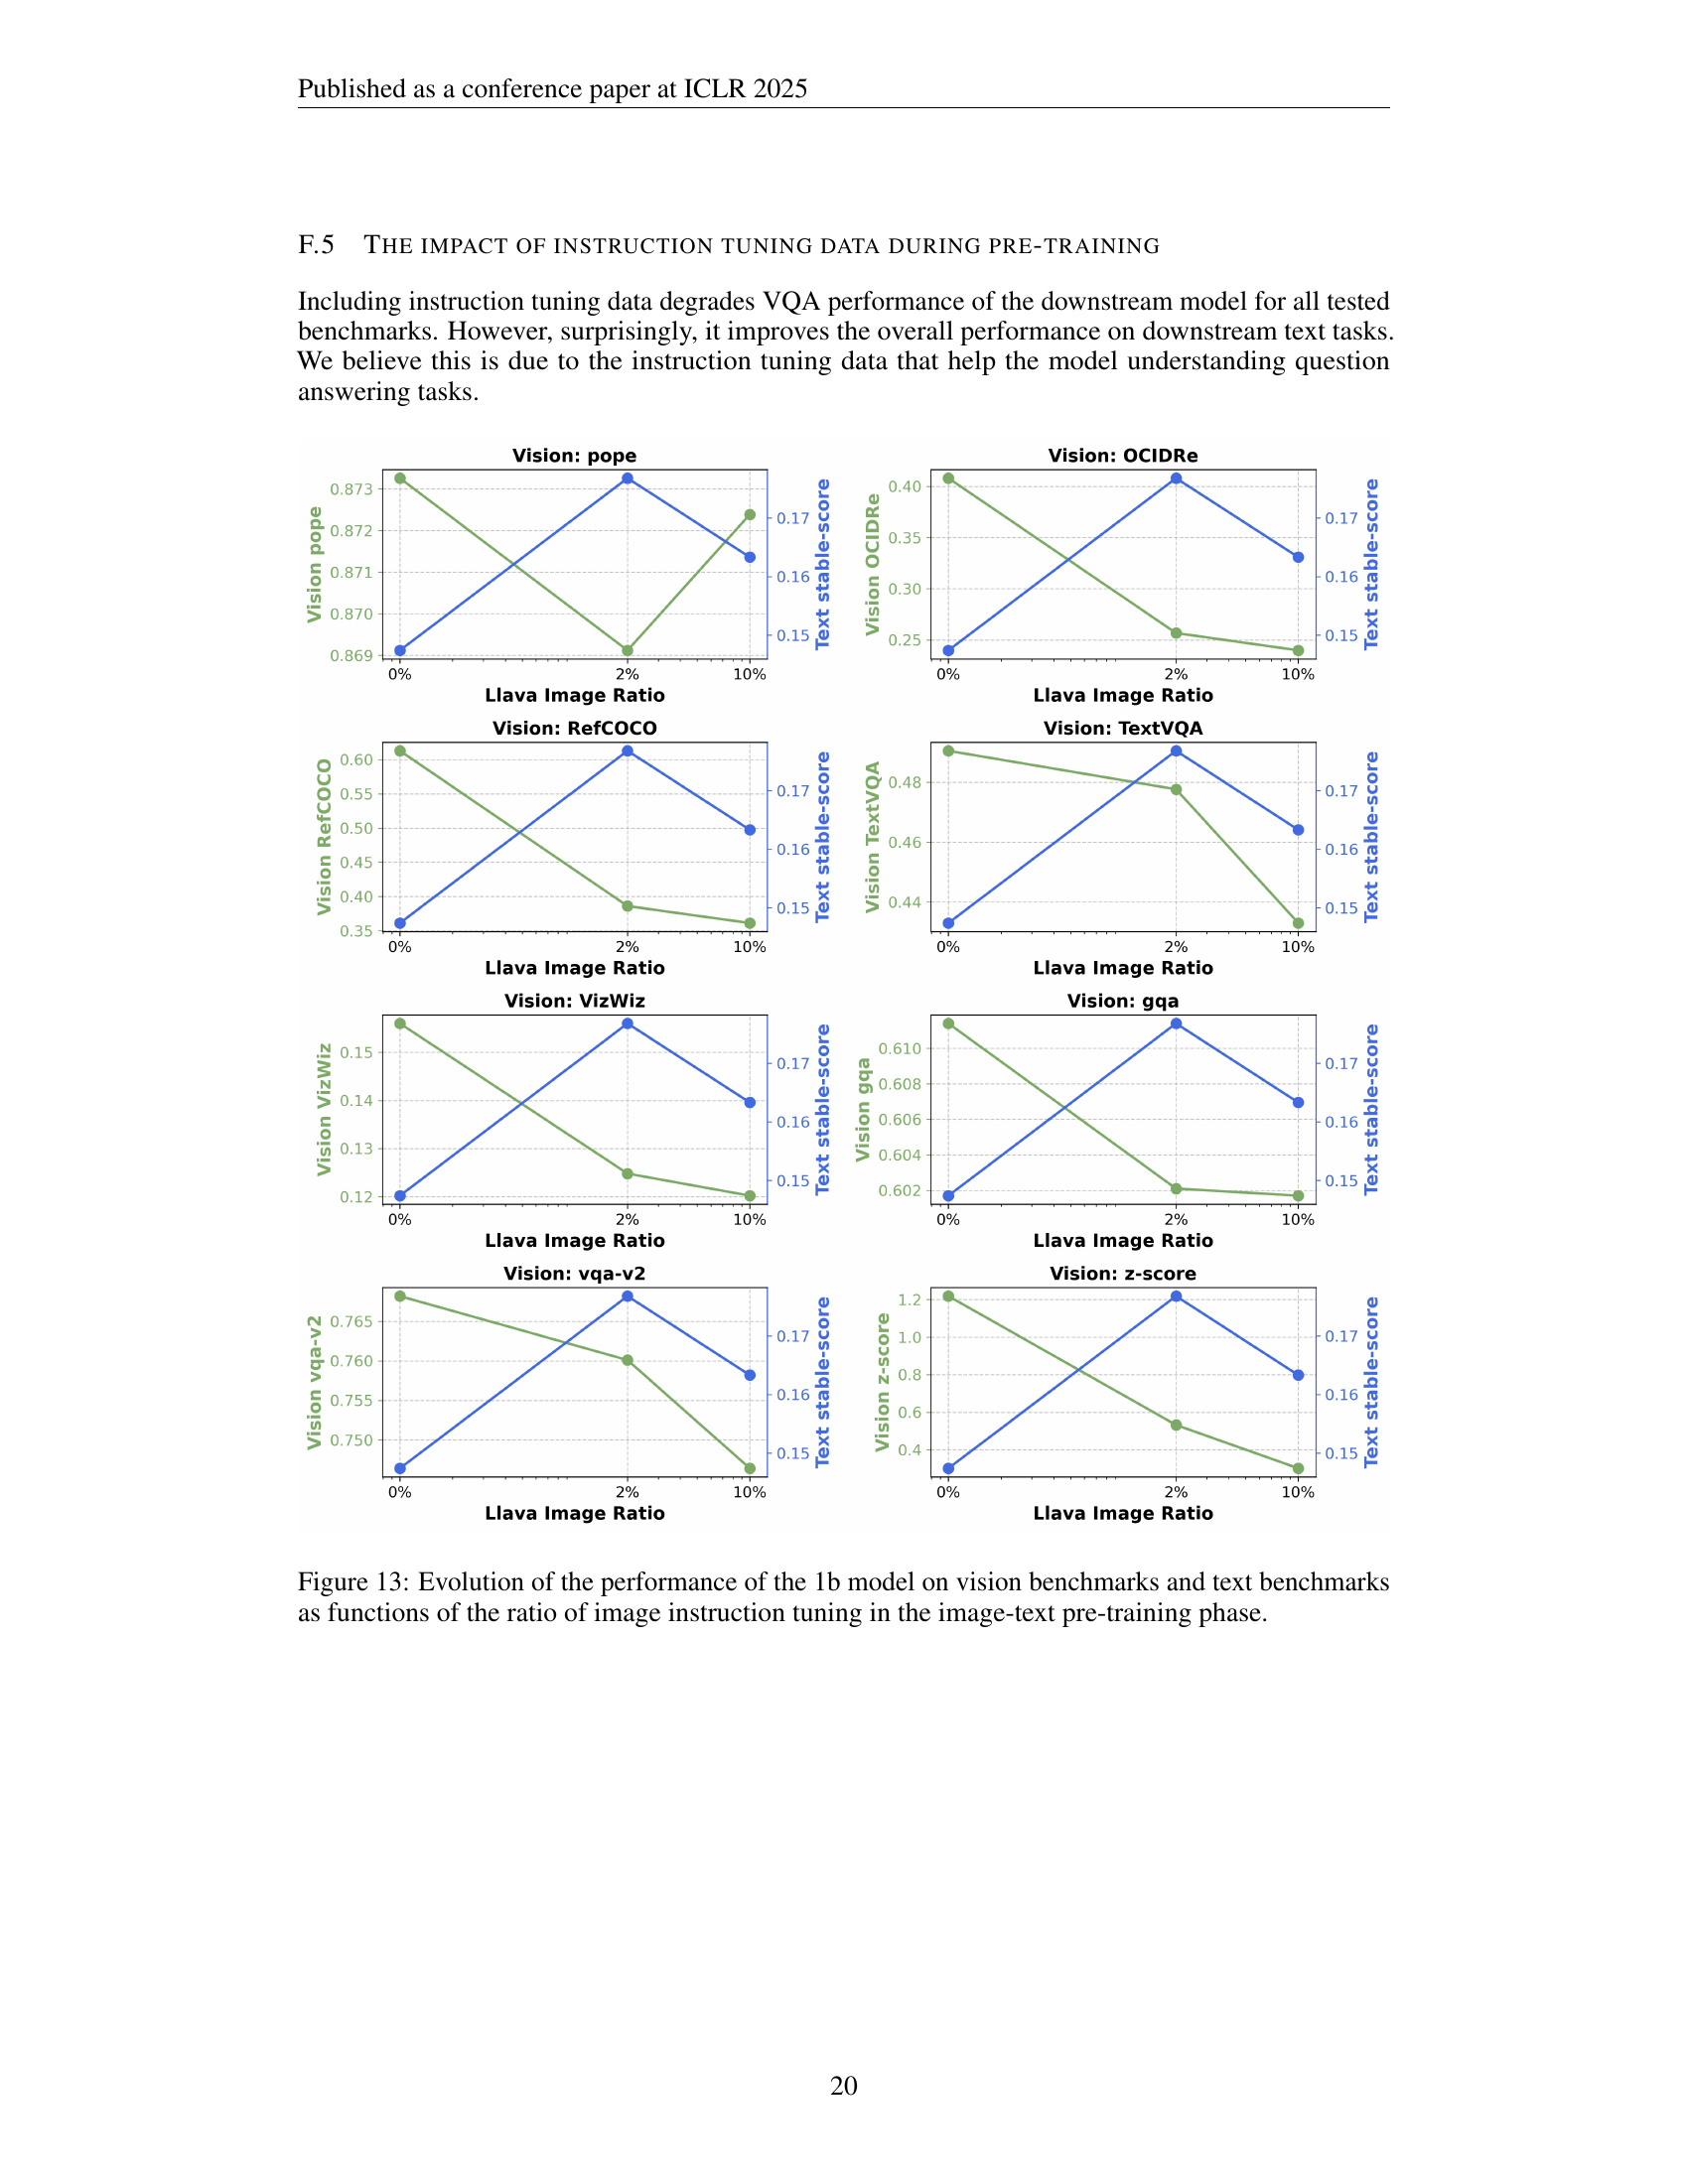
🔼 This figure explores the effect of including instruction tuning data within the image-text pre-training phase on the performance of Vision Language Models (VLMs). The experiment varied the proportion of instruction tuning data mixed with image caption data while keeping other training parameters constant. The results surprisingly showed that including instruction tuning data during pre-training negatively impacts the model’s performance on downstream tasks, contrary to expectations. The authors hypothesize this is due to potential overfitting or a disruption of the learning process caused by mixing instruction-tuning data with image-caption pairs at this model scale.
read the caption
Figure 7: Varying the proportion of instruction tuning data in the image mix. Is including instruction tuning data during pre-training is helpful for VLMs? Surprisingly, we find that adding this data to pre-training harms performance. We hypothesize that this may be due to overfitting, or because mixing instruction tuning data with image-caption pairs degrades learning at this scale.

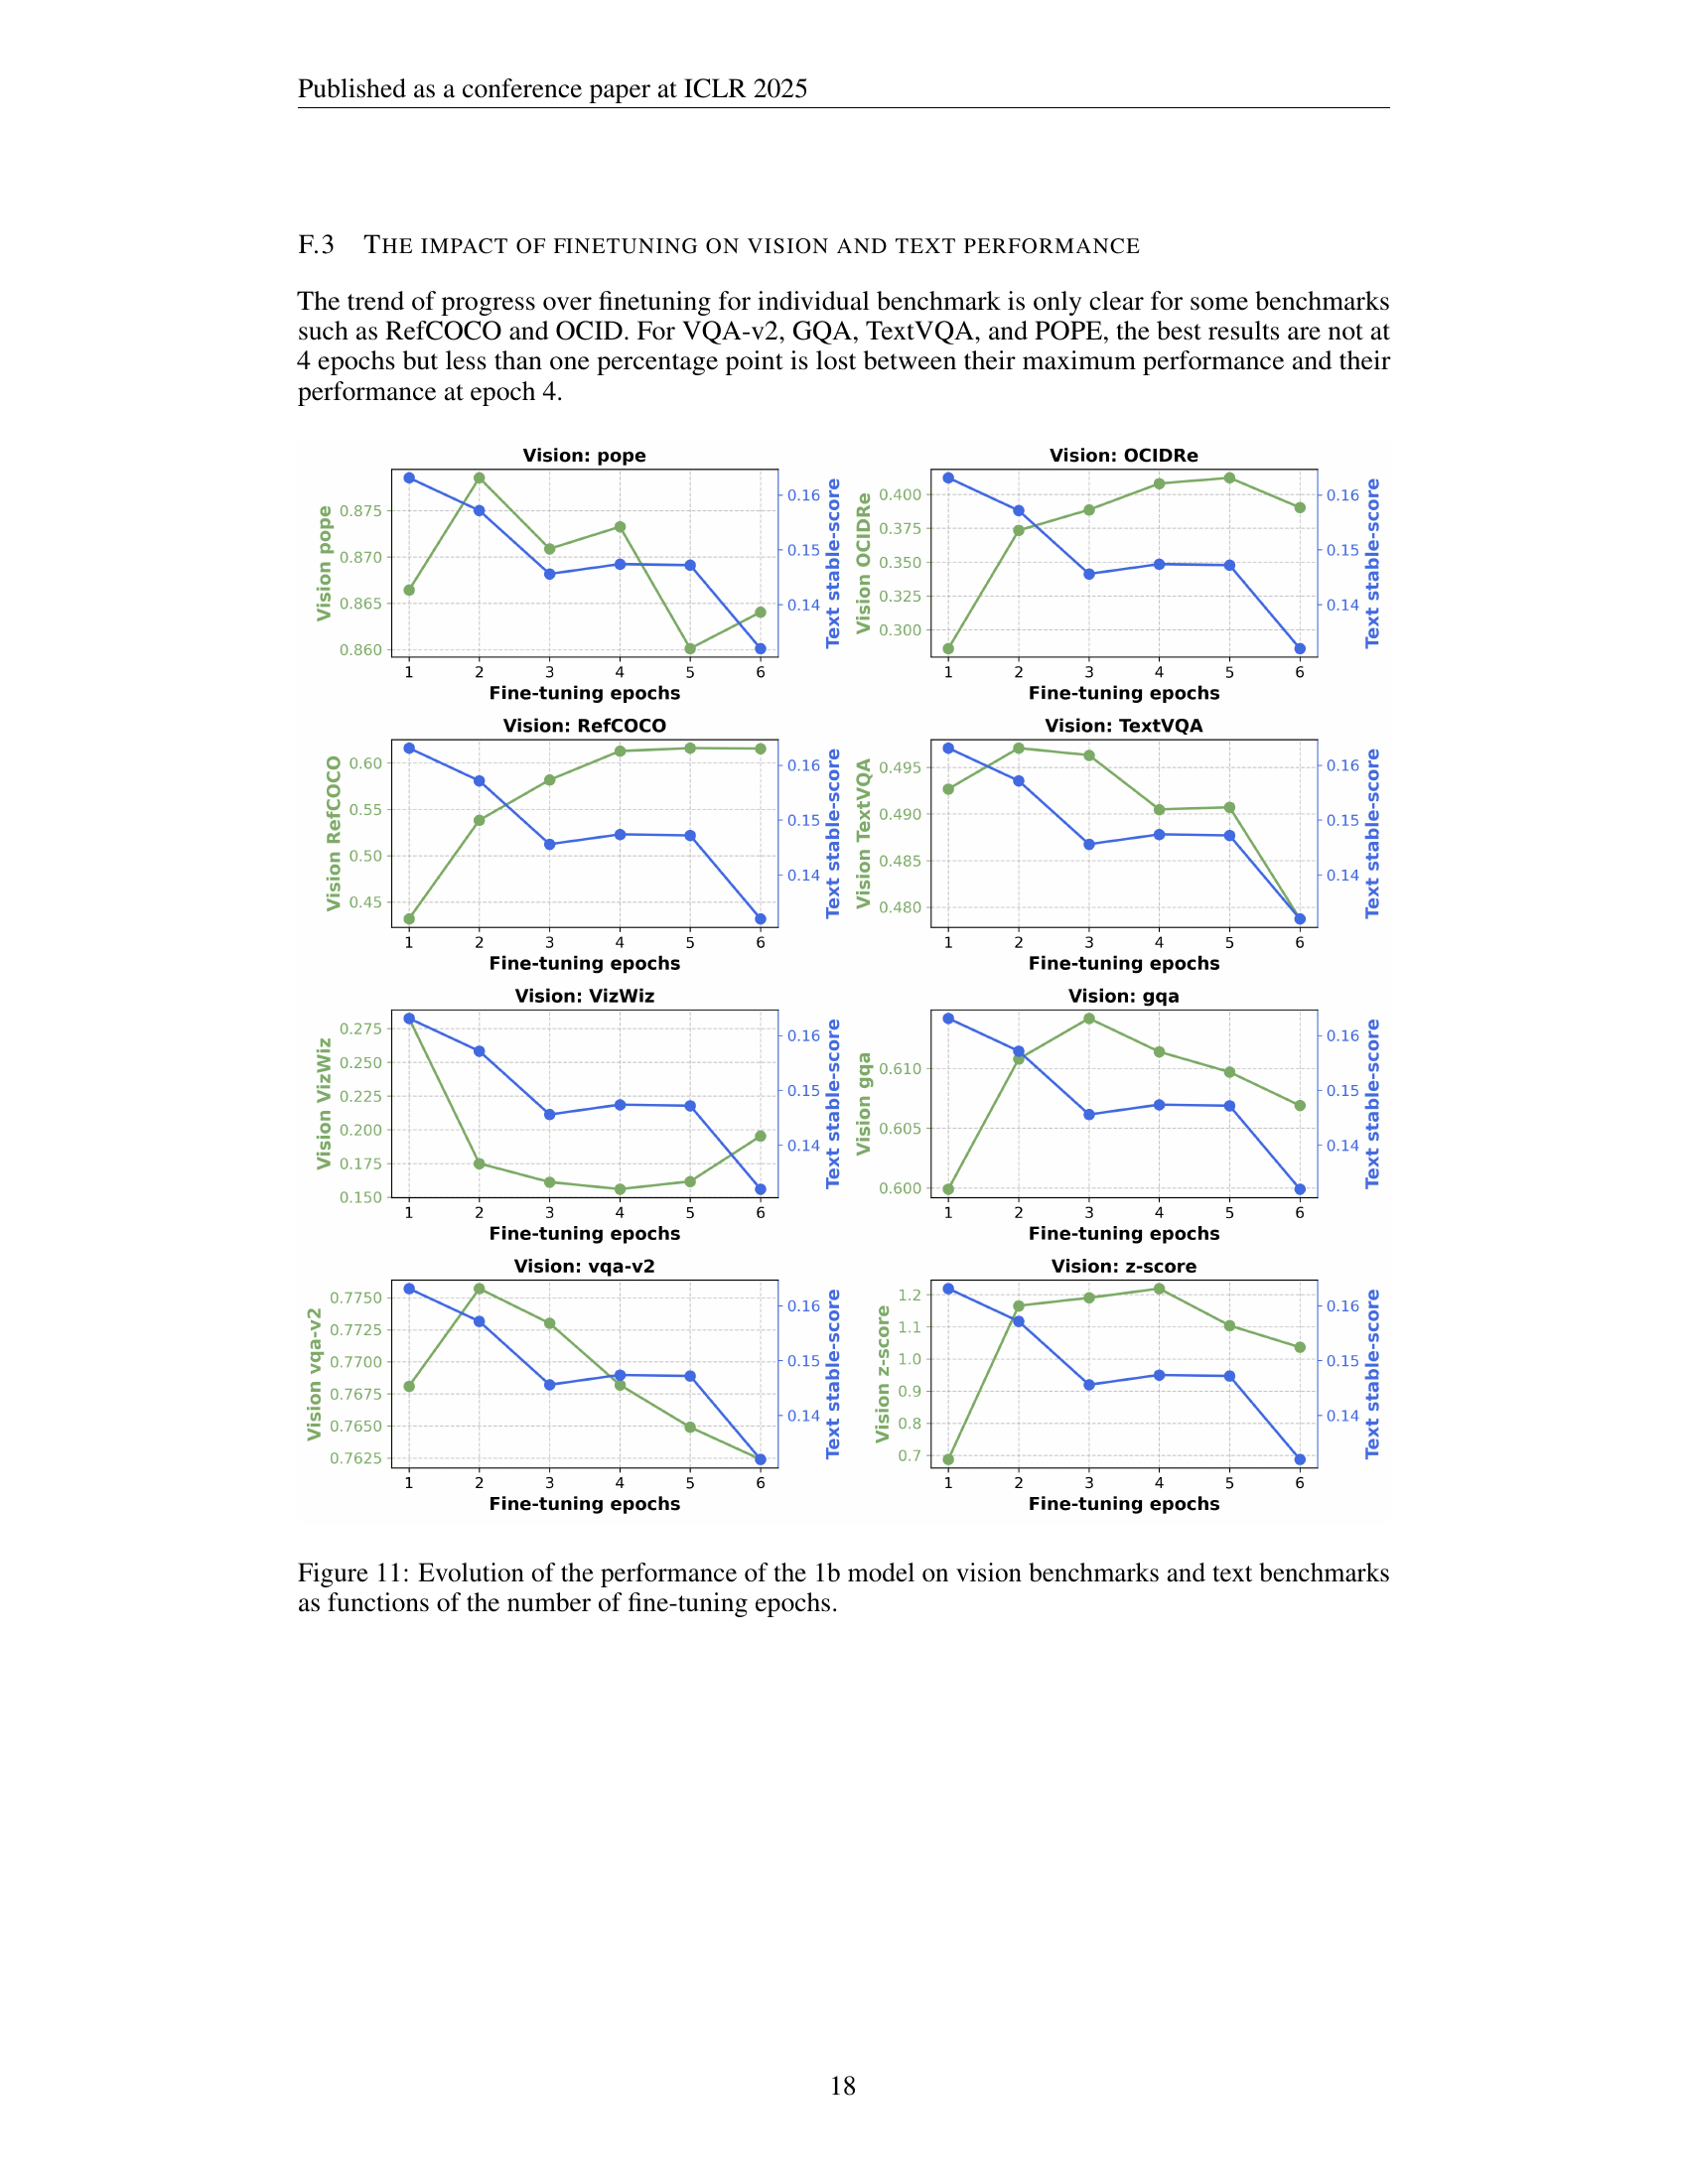
🔼 This figure shows the impact of the number of fine-tuning epochs on the model’s performance on both vision and text tasks. The x-axis represents the number of fine-tuning epochs, while the y-axis shows the stable score (aggregated performance across multiple tasks) for both vision and text. The results indicate that fine-tuning for 2-4 epochs after the initial pre-training yields the best performance on vision tasks, with 2 epochs being optimal for maintaining a balance between vision and text performance. Beyond 4 epochs, performance on both vision and text tasks starts to degrade, suggesting overfitting.
read the caption
Figure 8: Varying the number of fine-tuning epochs. We find that fine-tuning for 2-4 epochs after pre-training performs best for vision tasks, with 2 epochs being a sweet spot for maintaining text performance while achieving high vision performance.

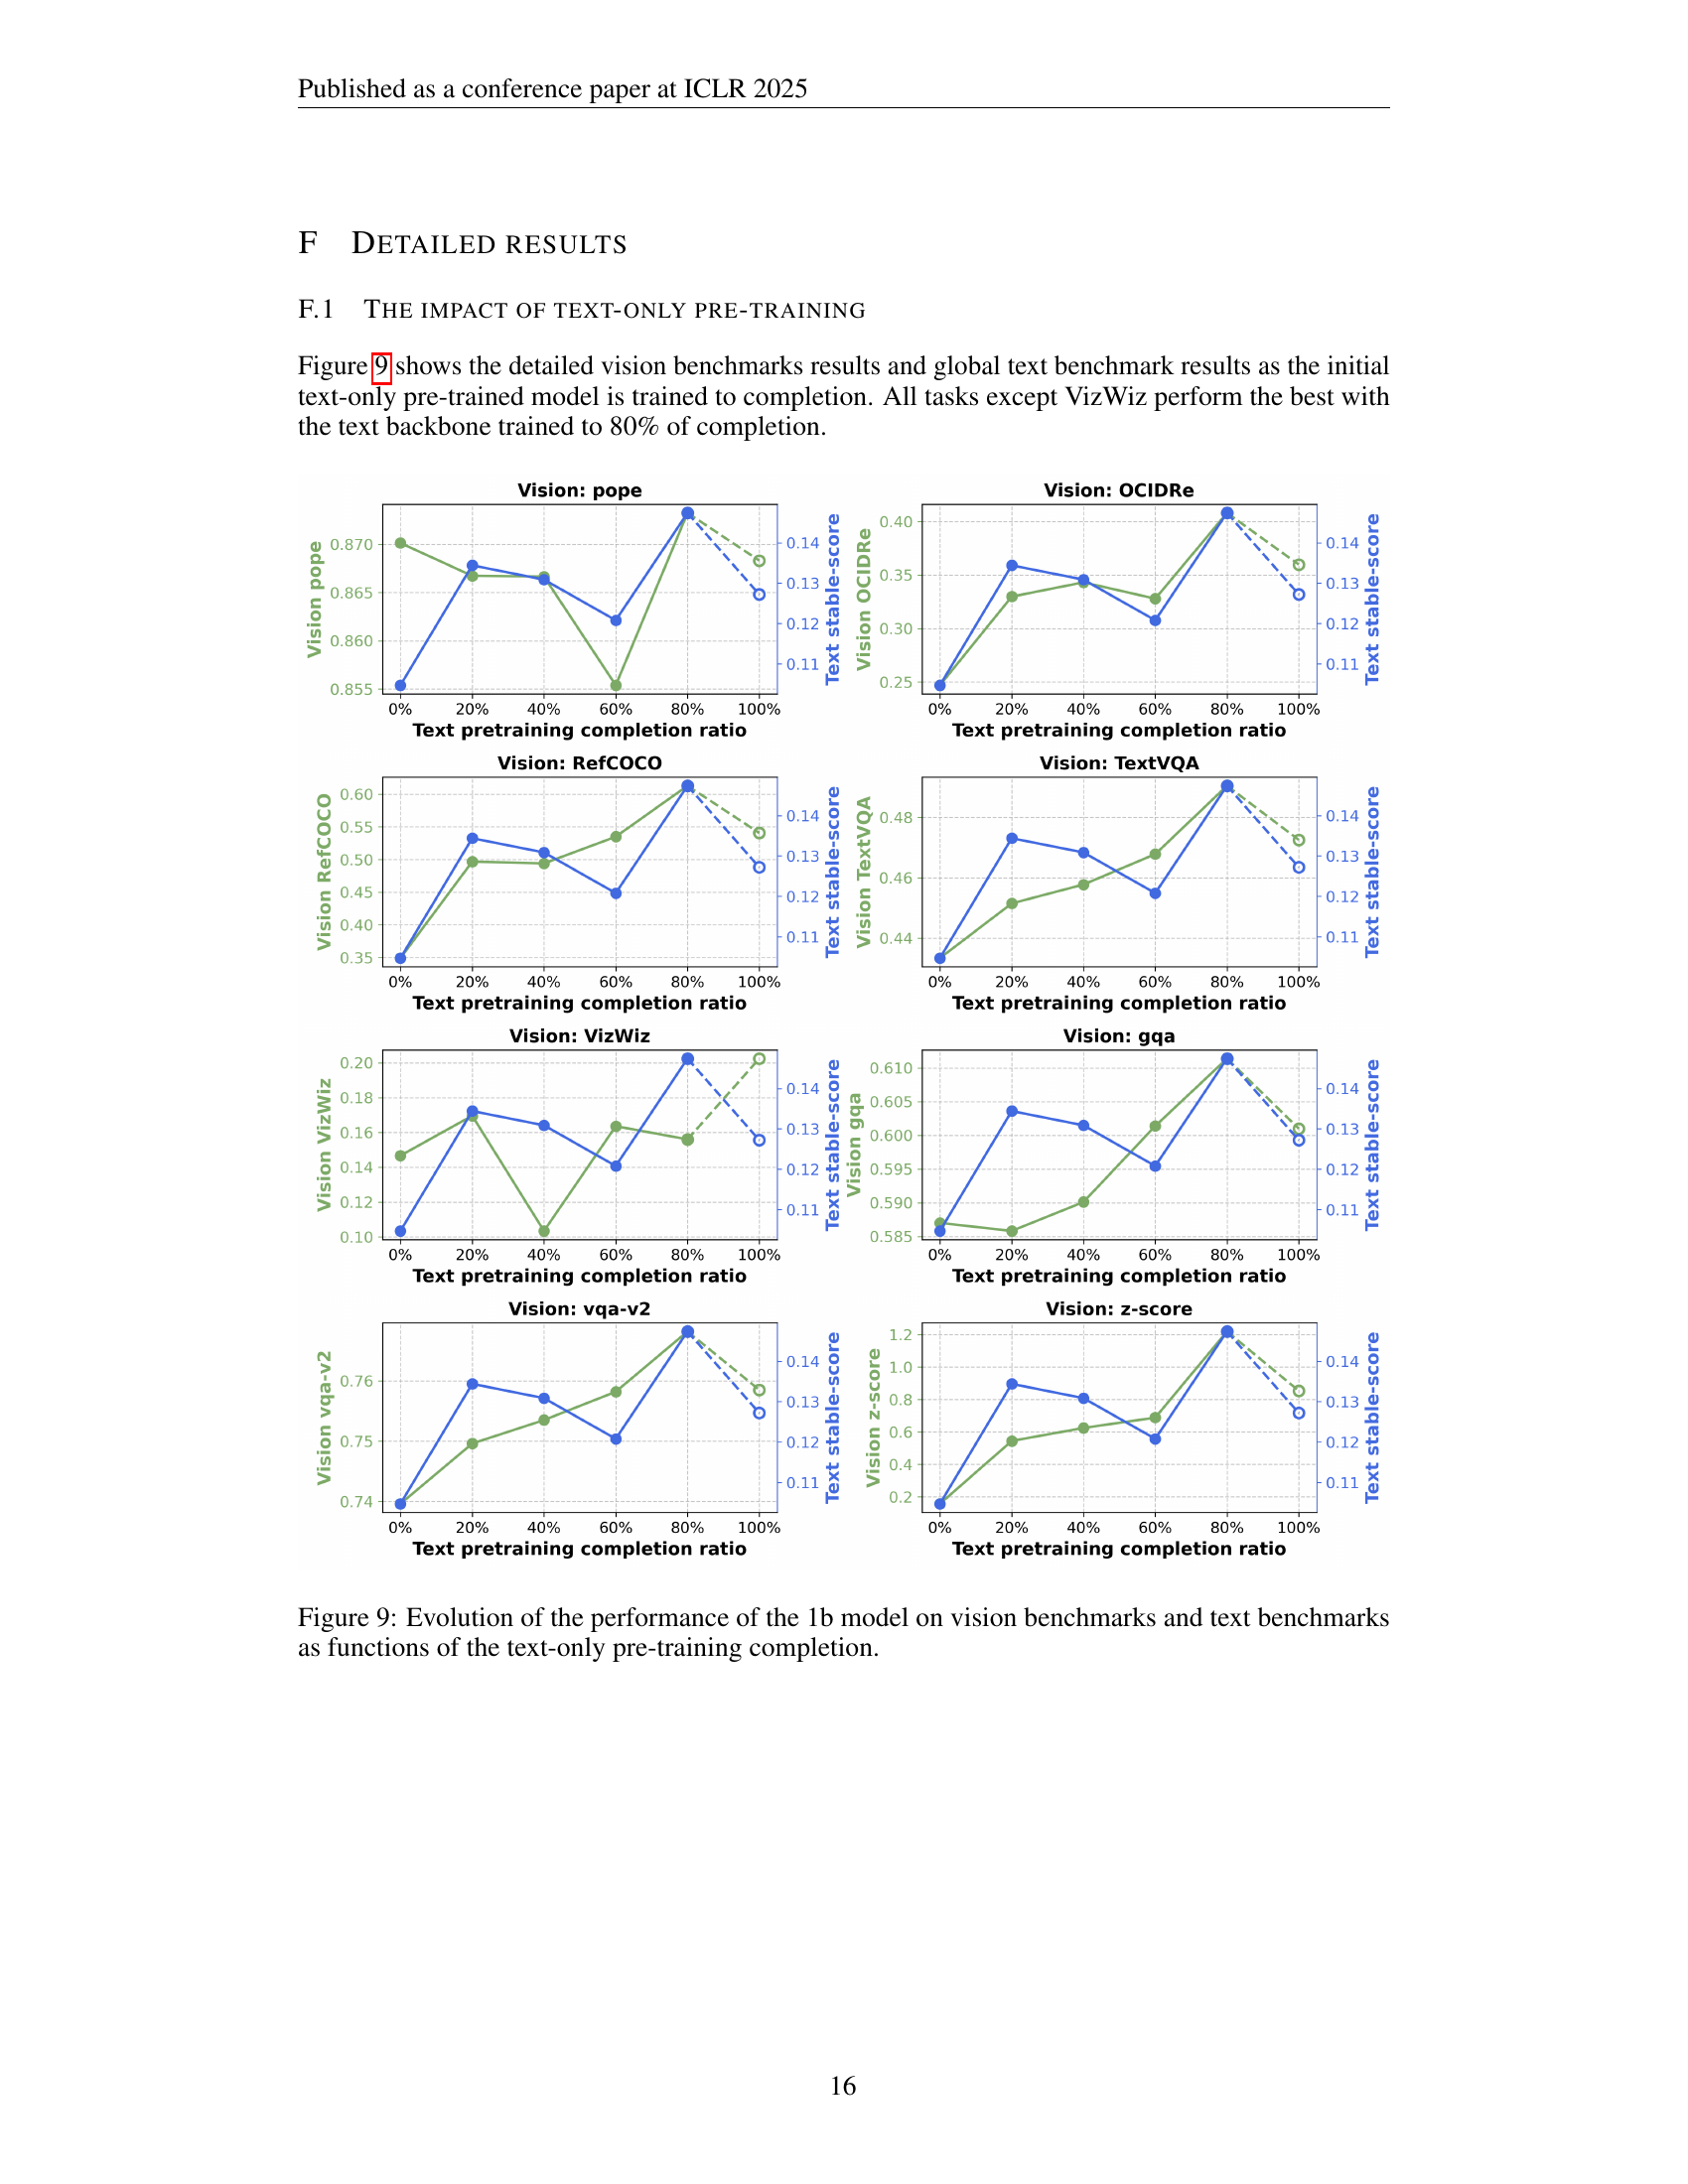
🔼 This figure displays the performance of a 1-billion parameter model on several vision and text benchmarks, showing how performance changes based on the amount of text-only pre-training. Specifically, it illustrates how performance evolves as the model progresses through its initial text-only training phase. Each point on the graph represents the model’s performance at different stages of text-only pre-training, expressed as the percentage of completion. The results highlight the interplay between the amount of text-only training and the model’s ability to generalize to downstream tasks in both vision and language domains.
read the caption
Figure 9: Evolution of the performance of the 1b model on vision benchmarks and text benchmarks as functions of the text-only pre-training completion.
More on tables
| Warmup | Learning rate | Batch size | Training tokens | A100 hours | |||||
|---|---|---|---|---|---|---|---|---|---|
| 79M | 8 | 4 | 512 | 128 | 400 | 3-3 | 512 | 237B | 1.2k |
| 1.4B | 24 | 16 | 2,048 | 128 | 5000 | 1-2 | 256 | 4.3T | 106k |
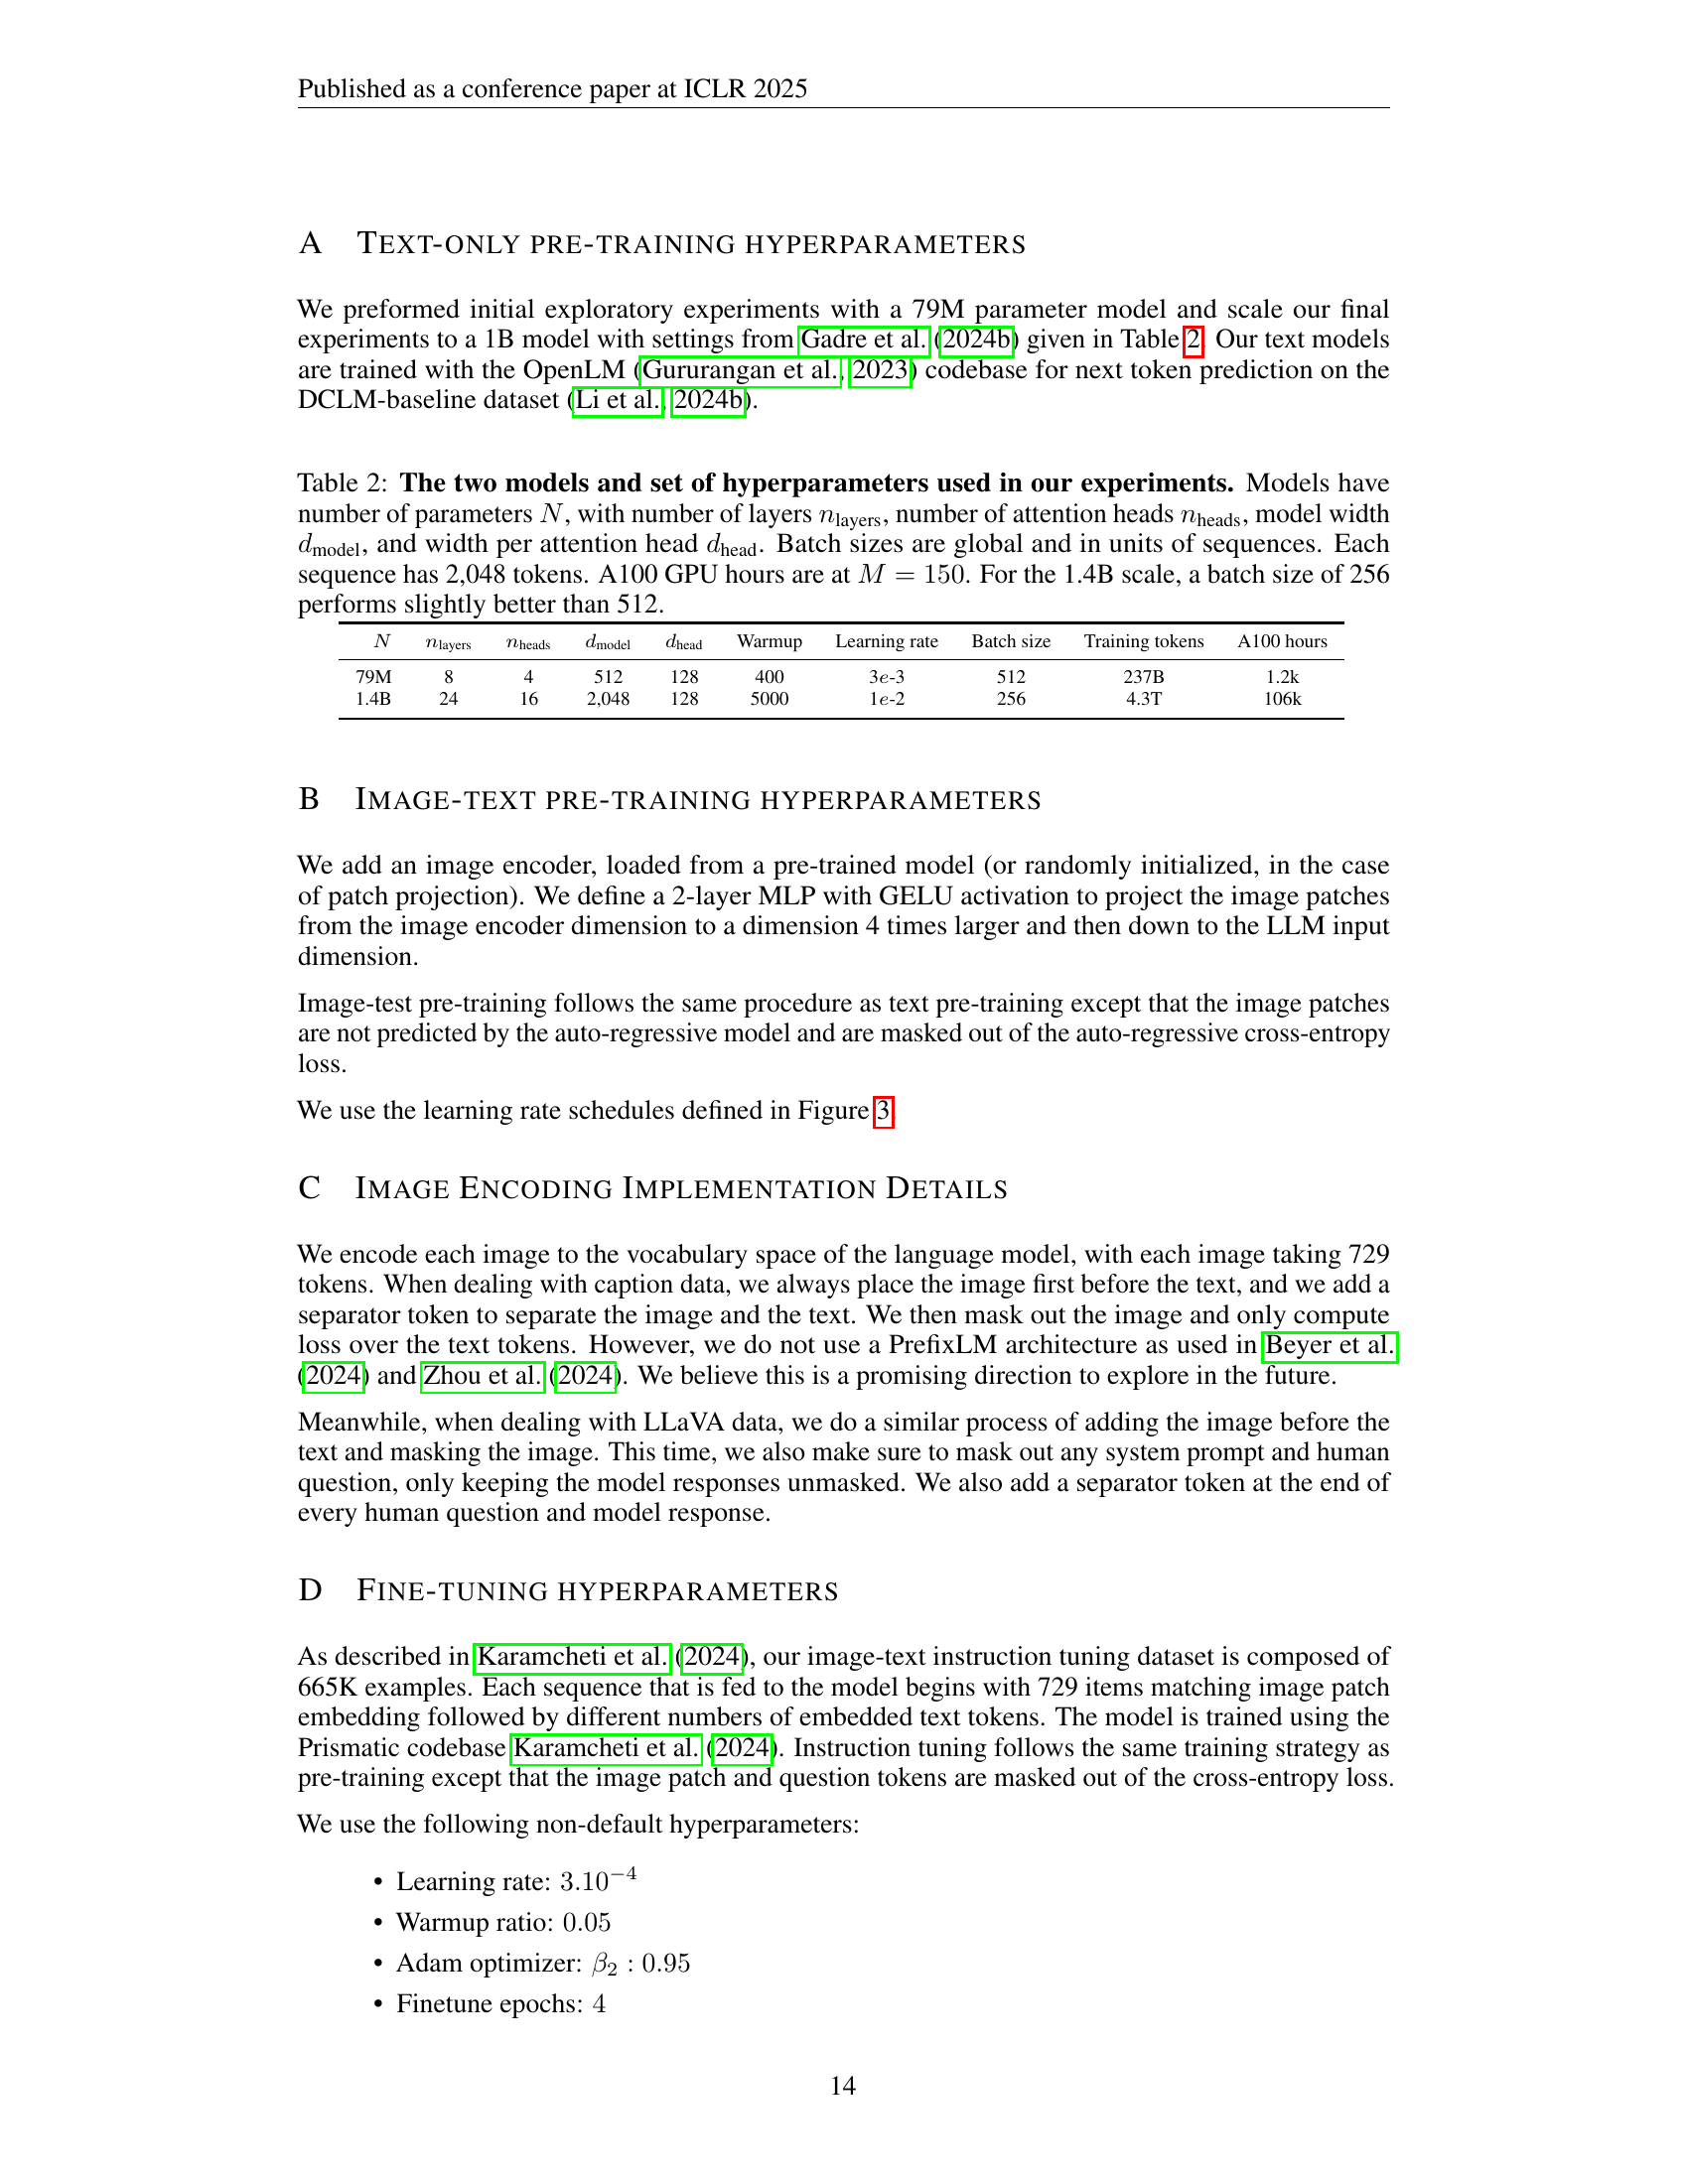
🔼 This table details the hyperparameters used for training two different sized language models: a 79M parameter model and a 1.4B parameter model. It lists the number of layers, attention heads, model width, and width per attention head for each model. It also specifies the batch size (in sequences of 2048 tokens), the training token count, the learning rate, the warmup setting, and the approximate A100 GPU hours utilized for training at a scaling factor (M) of 150. Importantly, the table notes that for the larger 1.4B parameter model, a batch size of 256 sequences produced slightly better results than a batch size of 512.
read the caption
Table 2: The two models and set of hyperparameters used in our experiments. Models have number of parameters N𝑁Nitalic_N, with number of layers nlayerssubscript𝑛layersn_{\text{layers}}italic_n start_POSTSUBSCRIPT layers end_POSTSUBSCRIPT, number of attention heads nheadssubscript𝑛headsn_{\text{heads}}italic_n start_POSTSUBSCRIPT heads end_POSTSUBSCRIPT, model width dmodelsubscript𝑑modeld_{\text{model}}italic_d start_POSTSUBSCRIPT model end_POSTSUBSCRIPT, and width per attention head dheadsubscript𝑑headd_{\text{head}}italic_d start_POSTSUBSCRIPT head end_POSTSUBSCRIPT. Batch sizes are global and in units of sequences. Each sequence has 2,048 tokens. A100 GPU hours are at M=150𝑀150M=150italic_M = 150. For the 1.4B scale, a batch size of 256 performs slightly better than 512.
| Dataset | Model 1 (with image data in pre-training) | Model 2 (no image data in pre-training) |
| VQAv2 | 76.39 | 74.69 |
| GQA | 61.08 | 60.6 |
| VizWiz | 10.88 | 11.69 |
| TextVQA | 0.46828 | 0.41624 |
| RefCOCO | 0.64168 | 0.58889 |
| OCID | 0.46107 | 0.39696 |
| POPE | 0.87478 | 0.87113 |
🔼 Table 3 presents the performance comparison of two 7B parameter models on various vision-language tasks. Model 1 incorporates image data during its pre-training phase, while Model 2 does not. The results show that Model 1, which includes images in pre-training, generally outperforms Model 2 on these tasks. This observation supports the findings from experiments conducted using smaller model sizes, suggesting that the beneficial impact of incorporating image data during pre-training is consistent across different model scales.
read the caption
Table 3: Performance of 7B models on various vision-language tasks. We see that model 1 (with images in pre-training) generally outperforms model 2 (no images in pre-training). This supports the findings that we observed in the smaller scale experiments.
| Checkpoint | Frozen? | Text-Image Ratio | VQA-v2 score |
|---|---|---|---|
| 80% | yes | 5% | 58.71 |
| 80% | yes | 30% | 60.22 |
| 80% | yes | 50% | 60.85 |
| 80% | no | 5% | 68.55 |
| 80% | no | 30% | 69.42 |
| 80% | no | 50% | 71.0 |
🔼 This table presents ablation study results comparing the performance of vision-language models with frozen versus unfrozen image encoders. The models were trained using a mix of DataComp-DR caption data and DCLM text data, followed by three epochs of fine-tuning. The results demonstrate that across various settings and training configurations, models with frozen image encoders consistently outperformed those with unfrozen encoders.
read the caption
Table 4: All results are taken with the mix of DataComp-DR caption data and DCLM text data and fine-tuned on 3 epochs. Across multiple settings, the unfrozen models perform worse in general.
| Dataset Mix | Vision Stable Score | Text Stable Score |
|---|---|---|
| DataComp | 0.4603 | 0.1168 |
| DataComp-DR | 0.4607 | 0.1503 |
| CC12M | 0.4556 | 0.1298 |
| ShutterStock | 0.4518 | 0.1310 |
🔼 This table presents the results of experiments using different random seeds and image ratios during the image-text pre-training phase. The models were all initialized from a 20% checkpoint of a text-only pre-trained model and further trained using a mixture of DataComp-DR caption data and DCLM text data. The table shows how VQA-v2 scores vary across different random seeds (7 and 365) and image ratios (1%, 5%, 10%) with different numbers of fine-tuning epochs (1 and 2). This illustrates the impact of these factors on model performance.
read the caption
Table 7: All models above were trained from a 20% checkpoint on a mix of DataComp-DR caption data and DCLM text data.
| Image Encoder | Vision Stable Score | Text Stable Score |
|---|---|---|
| SigLIP | 0.4607 | 0.1503 |
| SigLIP + DINO | 0.4696 | 0.1347 |
| Patch Projection | 0.1564 | 0.1503 |
🔼 Table 8 presents a comprehensive comparison of benchmark results across various stages of the model training process. It includes results from models trained with different ratios of text and image data, highlighting the impact of incorporating visual information at various stages. The ‘Ours’ column specifically showcases the performance of the model trained using the authors’ proposed method: 90% text and 10% image caption data in pre-training, followed by four epochs of LLaVA fine-tuning. This allows for a direct comparison of the authors’ approach against the baseline and other training variations.
read the caption
Table 8: Benchmark results at different stages of the training process. 'Ours' is our model trained with 10% image captioning and 90% text before 4 epochs of LLaVA fine-tuning.
| Random Seed | Image Ratio | FT epochs | VQA-v2 score |
|---|---|---|---|
| 7 | 1% | 1 | 73.83 |
| 7 | 1% | 2 | 75.39 |
| 7 | 5% | 1 | 75.36 |
| 7 | 5% | 2 | 76.39 |
| 7 | 10% | 1 | 75.39 |
| 7 | 10% | 2 | 76.5 |
| 365 | 1% | 1 | 74.46 |
| 365 | 1% | 2 | 75.9 |
| 365 | 5% | 1 | 75.39 |
| 365 | 5% | 2 | 76.47 |
| 365 | 10% | 1 | 75.55 |
| 365 | 10% | 2 | 76.58 |
🔼 Table 9 presents a comparison of the performance of three different Vision-Language Models (VLMs) on a set of benchmark tasks. The models compared are: the authors’ model (trained using a specific recipe described in the paper), Prismatic 7B, and PaliGemma 3B. The authors’ model was trained with 10% image caption data and 90% text data, followed by 4 epochs of fine-tuning using the LLaVA dataset. The table shows the performance of these models on several vision and text benchmarks, providing a quantitative comparison of their capabilities.
read the caption
Table 9: Comparison of evaluation metrics between our model, Prismatic 7B, and PaliGemma 3B. 'Ours' is our model trained with 10% image captioning and 90% text before 4 epochs of LLaVA fine-tuning.
Full paper#