TL;DR#
Key Takeaways#
Why does it matter?#
This paper introduces PLADIS, a universal technique that improves text-to-image diffusion models without extra training, offering a practical solution for researchers seeking enhanced generation quality, text alignment, and controllable sparsity in attention mechanisms. It integrates with existing models and unlocks new research directions in multimodal generation.
Visual Insights#

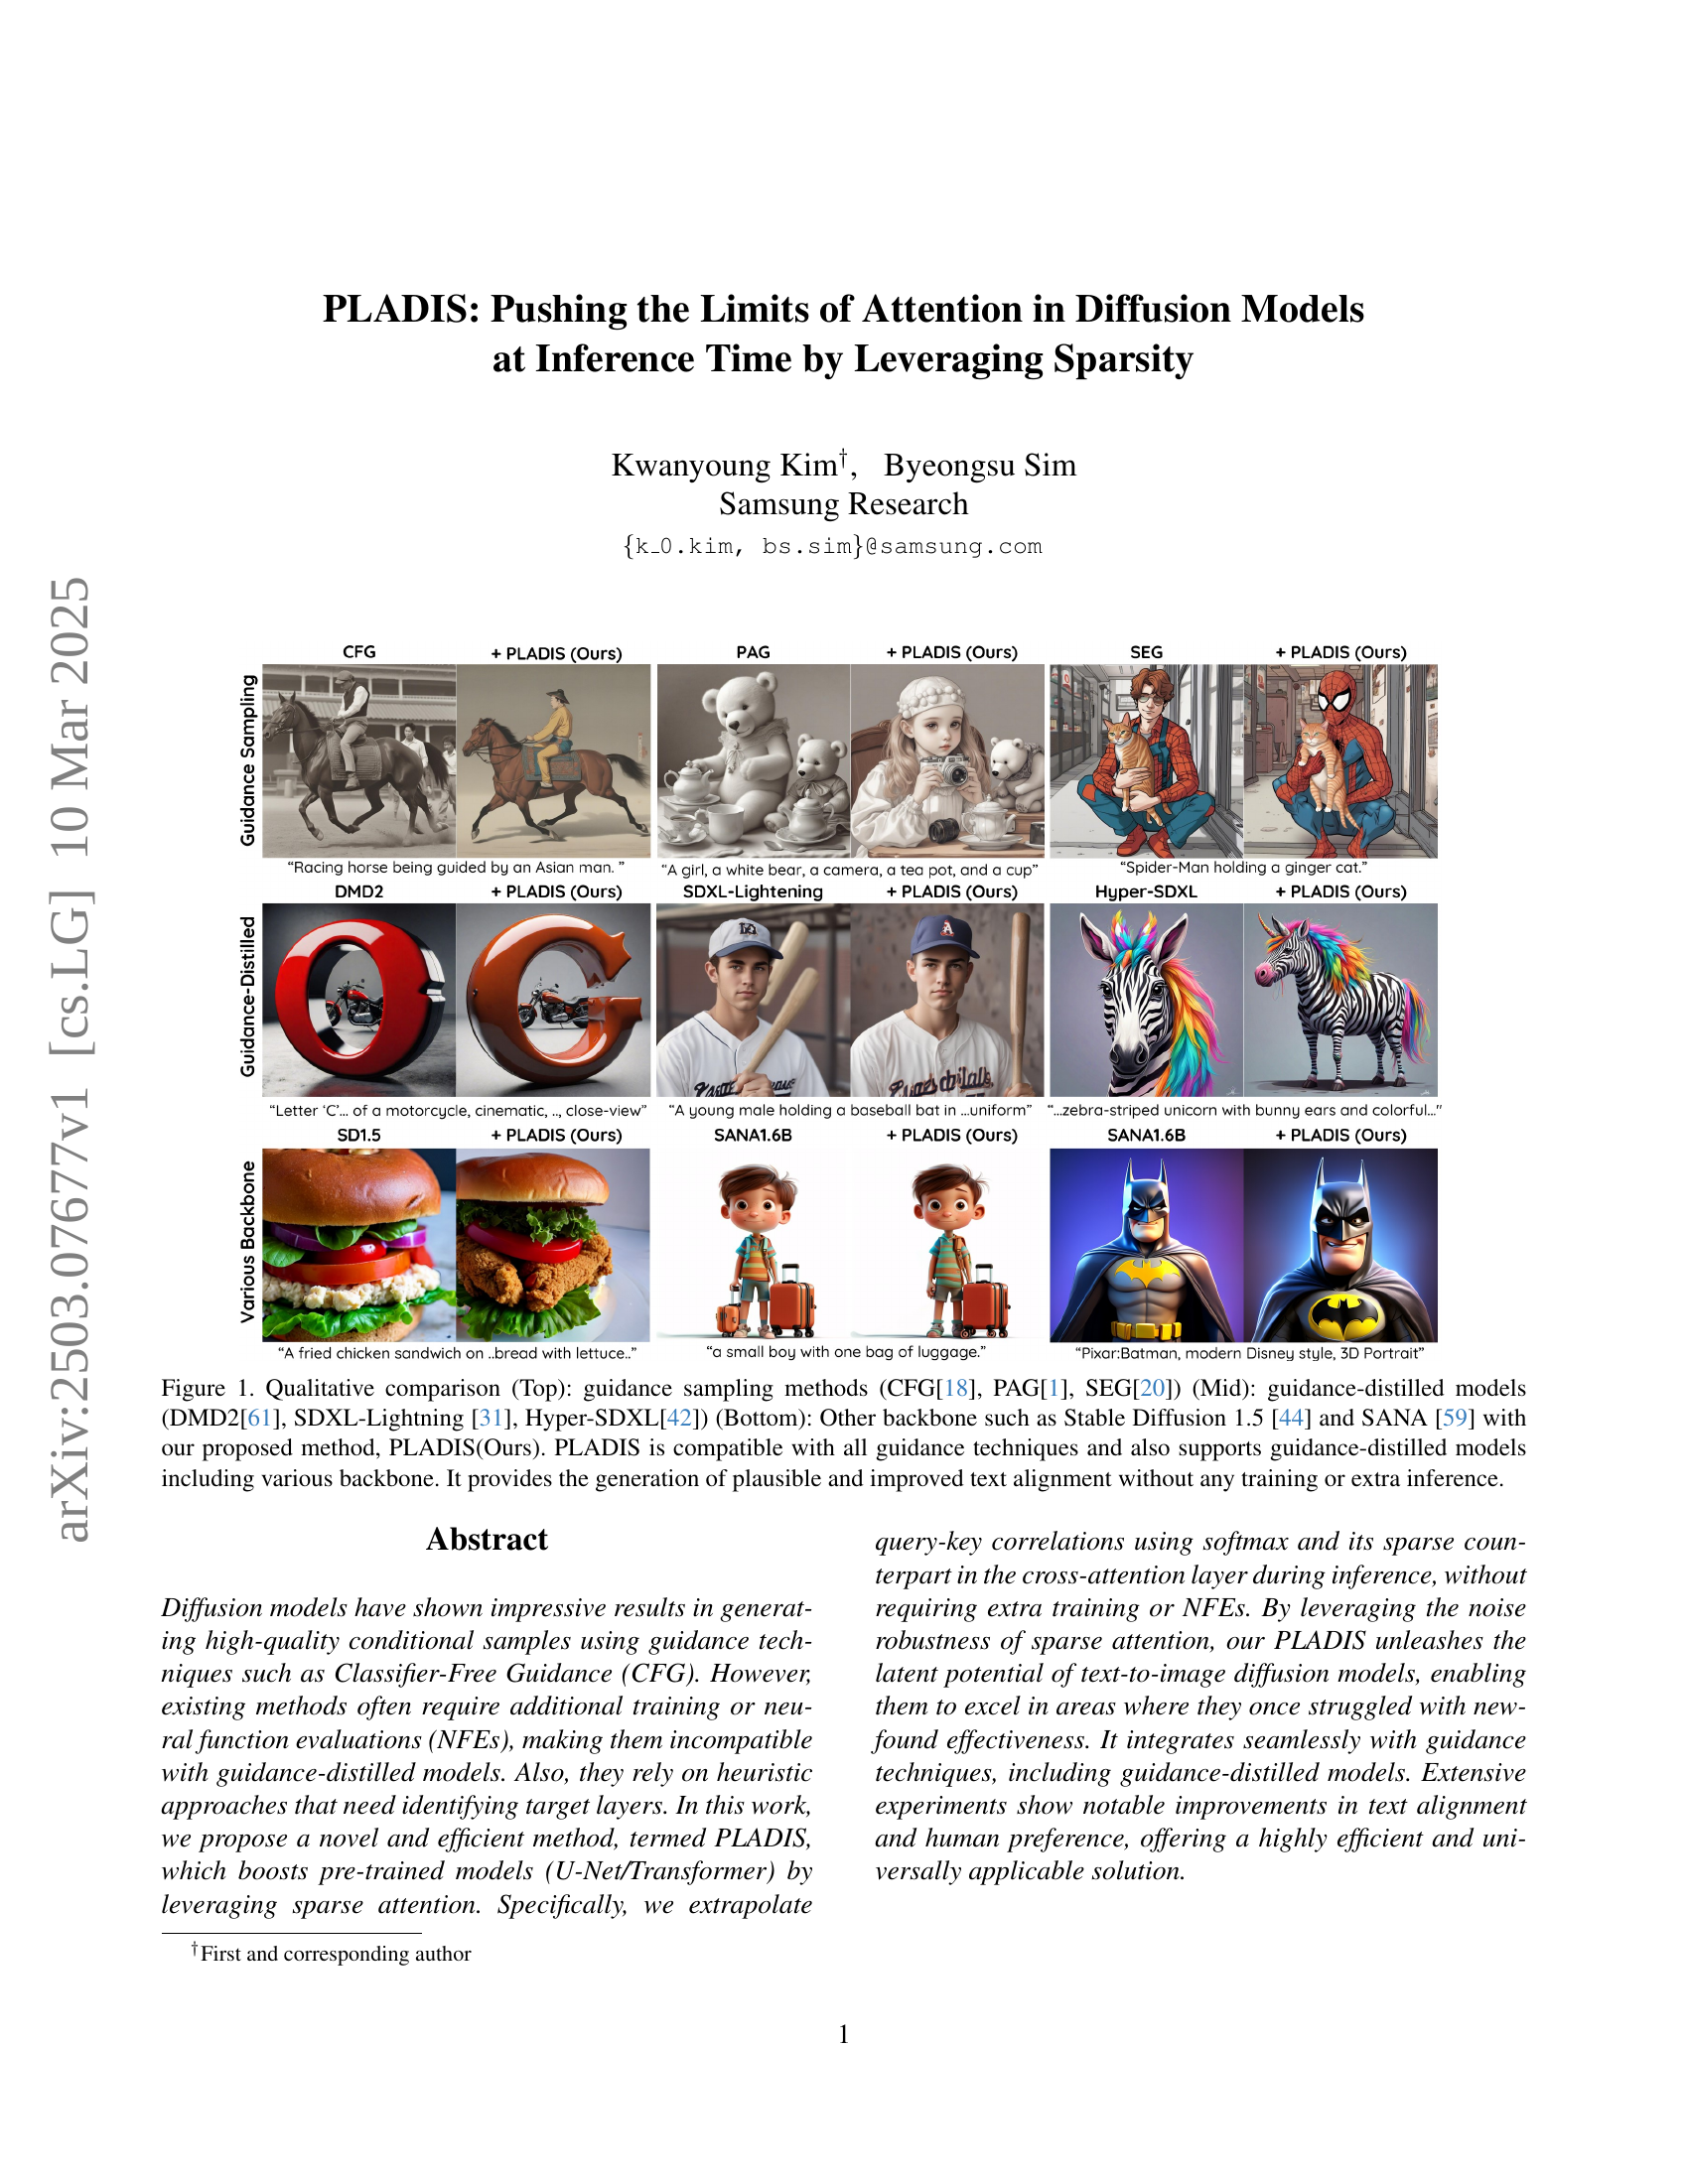
🔼 Figure 1 displays a qualitative comparison of various text-to-image generation methods. The top row shows results from three guidance sampling methods: Classifier-Free Guidance (CFG), Perturbed Attention Guidance (PAG), and Smooth Energy Guidance (SEG). The middle row showcases results using three guidance-distilled models: DMD2, SDXL-Lightning, and Hyper-SDXL. The bottom row presents results obtained by applying the authors’ proposed method, PLADIS, to several different base diffusion models, including Stable Diffusion 1.5 and SANA. This figure highlights PLADIS’s versatility and compatibility with various existing techniques, showing improved text alignment and more plausible image generations without requiring any additional training or inference steps.
read the caption
Figure 1: Qualitative comparison (Top): guidance sampling methods (CFG[18], PAG[1], SEG[20]) (Mid): guidance-distilled models (DMD2[61], SDXL-Lightning [31], Hyper-SDXL[42]) (Bottom): Other backbone such as Stable Diffusion 1.5 [44] and SANA [59] with our proposed method, PLADIS(Ours). PLADIS is compatible with all guidance techniques and also supports guidance-distilled models including various backbone. It provides the generation of plausible and improved text alignment without any training or extra inference.
| Method | Need extra Training | Need heuristic Search | Need extra Inference | Supports guidance- Distilled Model |
|---|---|---|---|---|
| CFG [18] | \faFrown | \faGrin | \faFrown | \faFrown |
| SAG [21] | \faGrin | \faFrown | \faFrown | \faFrown |
| AG [24] | \faGrin | \faFrown | \faFrown | \faFrown |
| PAG [1] | \faGrin | \faFrown | \faFrown | \faFrown |
| SEG [20] | \faGrin | \faFrown | \faFrown | \faFrown |
| PLADIS (Ours) | \faGrin | \faGrin | \faGrin | \faGrin |
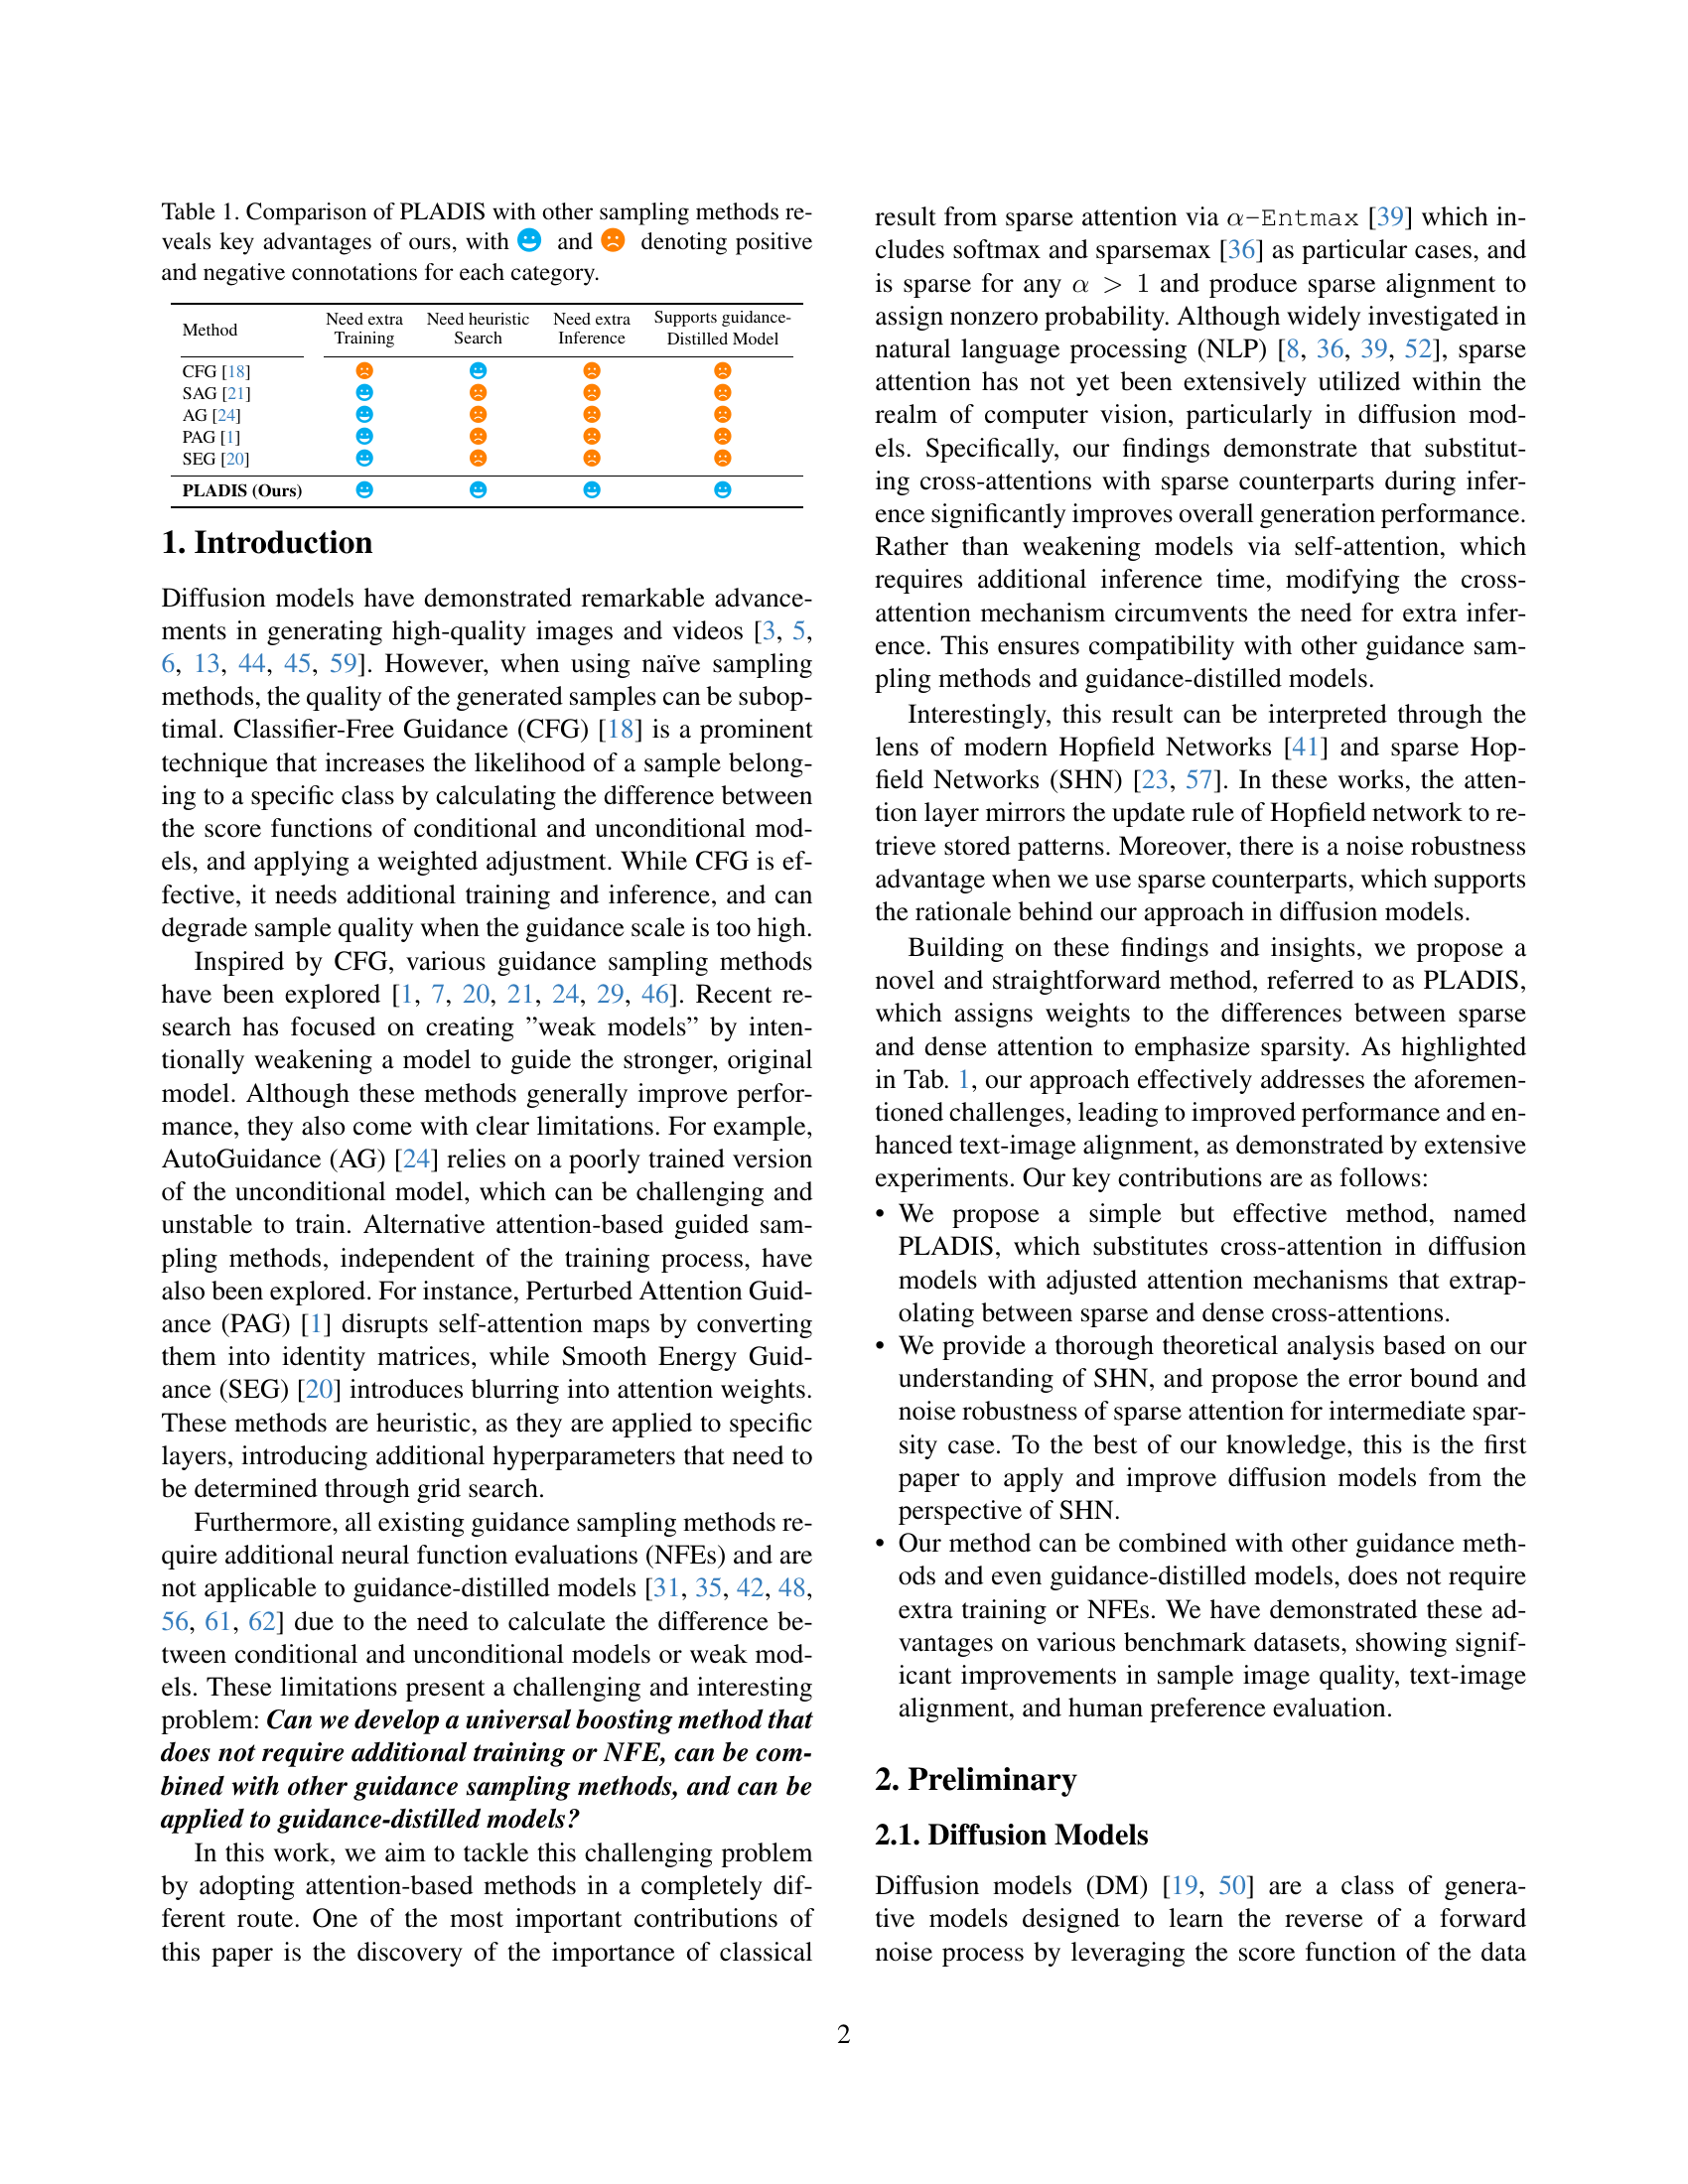
🔼 This table compares PLADIS against other image generation sampling methods. It evaluates each method across several key aspects: the need for extra training data, reliance on heuristic search methods, and the need for extra inference steps. A positive (+) or negative (-) symbol indicates the relative advantage or disadvantage of each method compared to PLADIS. For example, a ‘+’ in the ‘Need extra training’ column signifies PLADIS does not require additional training, which is advantageous compared to methods that do.
read the caption
Table 1: Comparison of PLADIS with other sampling methods reveals key advantages of ours, with \faGrin and \faFrown denoting positive and negative connotations for each category.
In-depth insights#
Sparse Attention#
Sparse attention mechanisms, while initially conceived for computational efficiency, hold intriguing potential beyond mere speed. The paper’s exploration into leveraging sparsity reveals its capacity to enhance noise robustness, a crucial asset in diffusion models where noisy data is inherent. By discarding less relevant correlations, sparse attention may effectively filter out noise, allowing the model to focus on the most salient features for accurate reconstruction. This suggests that sparsity isn’t simply a computational shortcut but a way to guide the model’s focus, mitigating the influence of irrelevant or misleading information. The connection to Hopfield Networks further strengthens this interpretation, where sparsity aids in clearer pattern retrieval. Therefore, sparse attention offers a valuable tool for improving the reliability and quality of diffusion model outputs.
Robust to Noise#
Noise robustness is crucial for deep learning models, particularly in diffusion models where the generative process is inherently noisy. The capacity to withstand noise in the input data, internal representations, or training process is key to achieving stable and reliable results. Models robust to noise can generalize well from limited datasets and avoid overfitting to spurious correlations. Various techniques contribute to noise robustness, including data augmentation, regularization methods like dropout, and the use of robust loss functions. Sparsity can play a key role in noise robustness because sparse representations tend to ignore immaterial correlations while maintaining stricter ones. Furthermore, sparse attention can be more robust to noise than dense attention, leading to lower retrieval error. In essence, noise robustness is not just about handling imperfections but about fostering a more resilient and capable system.
Cross-Attention#
Cross-attention plays a crucial role in diffusion models, mediating the interaction between text prompts and image features. By analyzing the query-key correlations it enables the model to generate images that align semantically with the input text. Sparsifying cross-attention can significantly improve performance by focusing on the most relevant correlations, while reducing noise. Moreover the noise robustness is another advantage of using sparse attention in noisy generation process. Techniques like PLADIS can efficiently leverage sparse cross-attention at inference time, enhancing text-image alignment and overall generation quality without extra training.
No Extra NFE#
The paper emphasizes a significant advantage by obviating the need for extra Neural Function Evaluations (NFEs). This is crucial because existing guidance methods often require additional NFEs, which increases computational cost and limits compatibility with guidance-distilled models. By avoiding extra NFEs, the method maintains efficiency, making it universally applicable and seamlessly integrable with other guidance techniques and even pre-trained guidance-distilled models. This feature enhances the method’s practicality and broadens its potential applications, addressing a key limitation in existing approaches.
SHN connection#
The paper connects the proposed PLADIS method to Sparse Hopfield Networks (SHN), drawing parallels between attention mechanisms and Hopfield networks. It suggests that PLADIS’s effectiveness stems from SHN’s noise robustness, especially beneficial in diffusion models due to noisy image/text data. By sparsifying attention, PLADIS reduces retrieval errors, leading to improved performance, text alignment, and robustness. The connection to SHN provides a theoretical grounding for PLADIS, supporting its efficacy from the perspective of reducing noise and promoting more reliable information retrieval within the diffusion process. The theoretical justification connects to an error bound in retrieval dynamics.
More visual insights#
More on figures

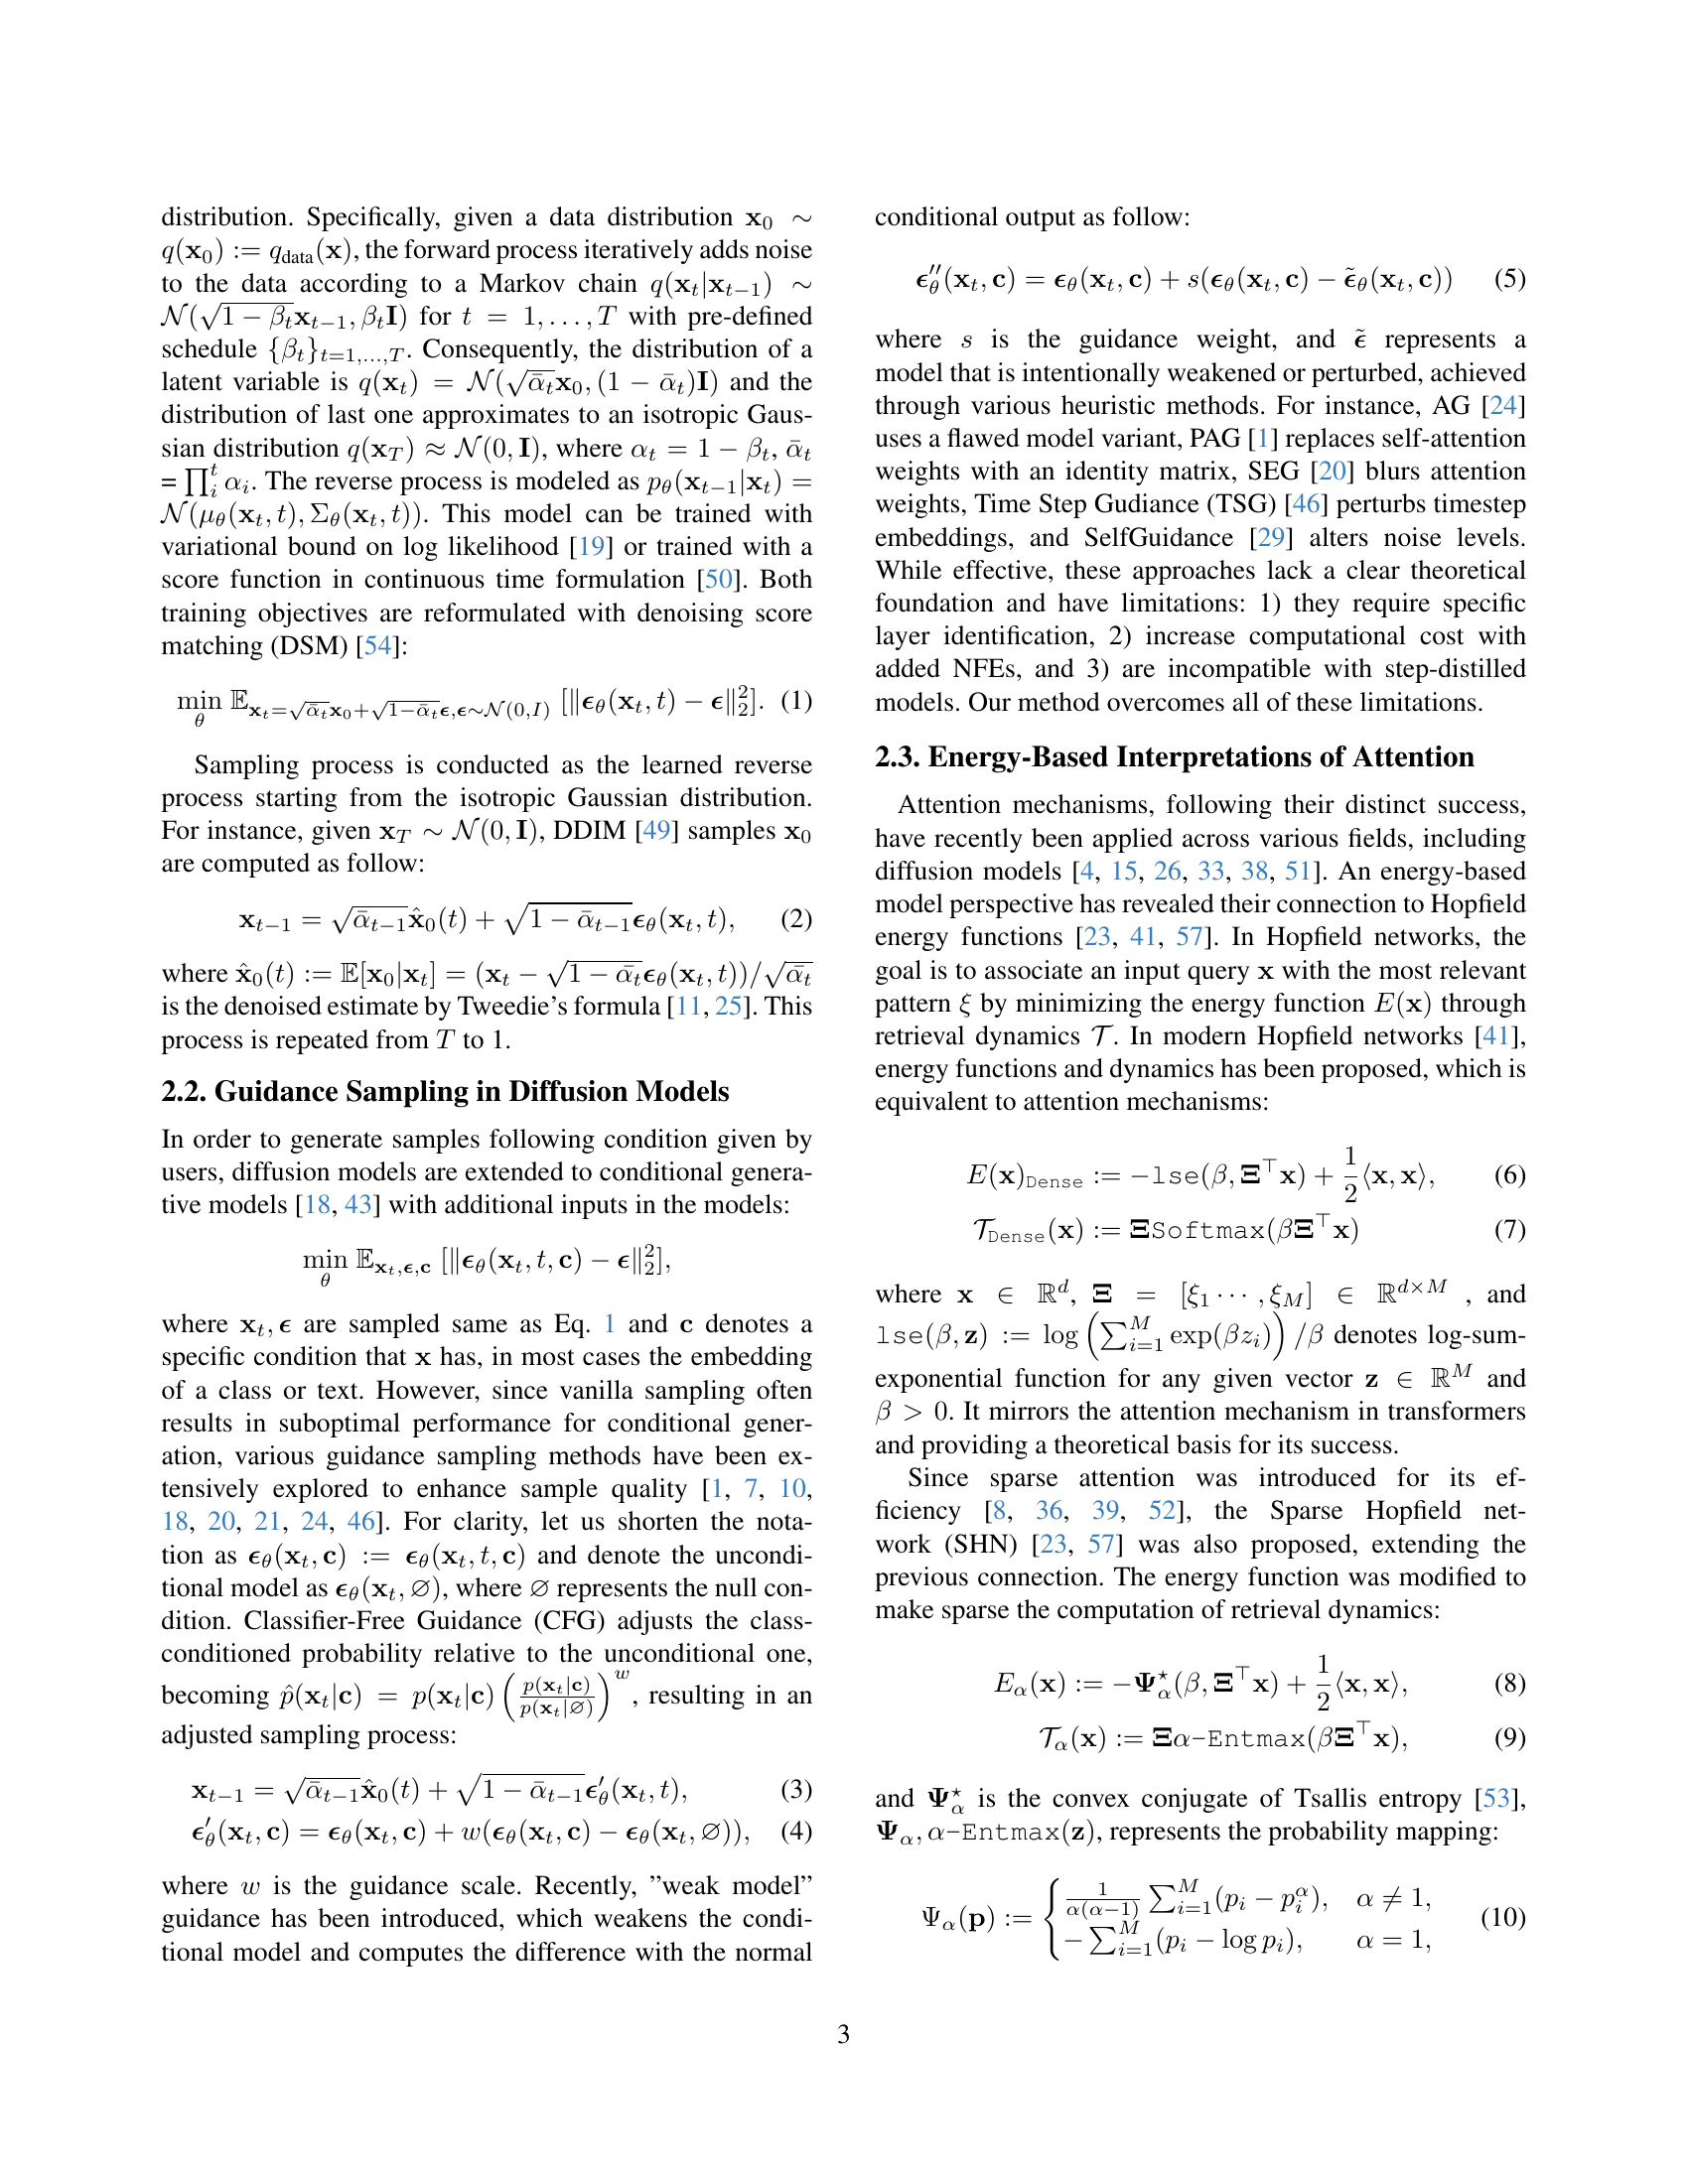
🔼 Figure 2 illustrates the core difference between PLADIS and other guidance methods. Existing methods like CFG, PAG, and SEG, while effective, introduce extra computational steps during inference because they either handle null conditions (CFG) or modify the behavior of self-attention (PAG and SEG). These modifications, such as replacing self-attention weights with an identity matrix (PAG) or blurring attention weights (SEG), introduce indirect paths that add to inference time. PLADIS, however, directly incorporates both sparse and dense cross-attention computations within the cross-attention module. A scaling factor (λ) controls the balance between these two attention types. This streamlined approach eliminates the need for additional inference steps and facilitates easy integration into existing guidance techniques simply by replacing the cross-attention module. This is in contrast to the other methods which often require adjusting parameters for specific layers or modules.
read the caption
Figure 2: Conceptual comparison between other guidance methods [18, 1, 20] and PLADIS: Existing guidance methods require extra inference steps due to undesired paths, such as null conditions or perturbing self-attention with an identity matrix or blurred attention weights. In contrast, PLADIS avoids additional inference paths by computing both sparse and dense attentions within all cross-attention modules using a scaling factor, λ𝜆\lambdaitalic_λ. Moreover, PLADIS can be easily integrated with existing guidance approaches by simply replacing the cross-attention module.

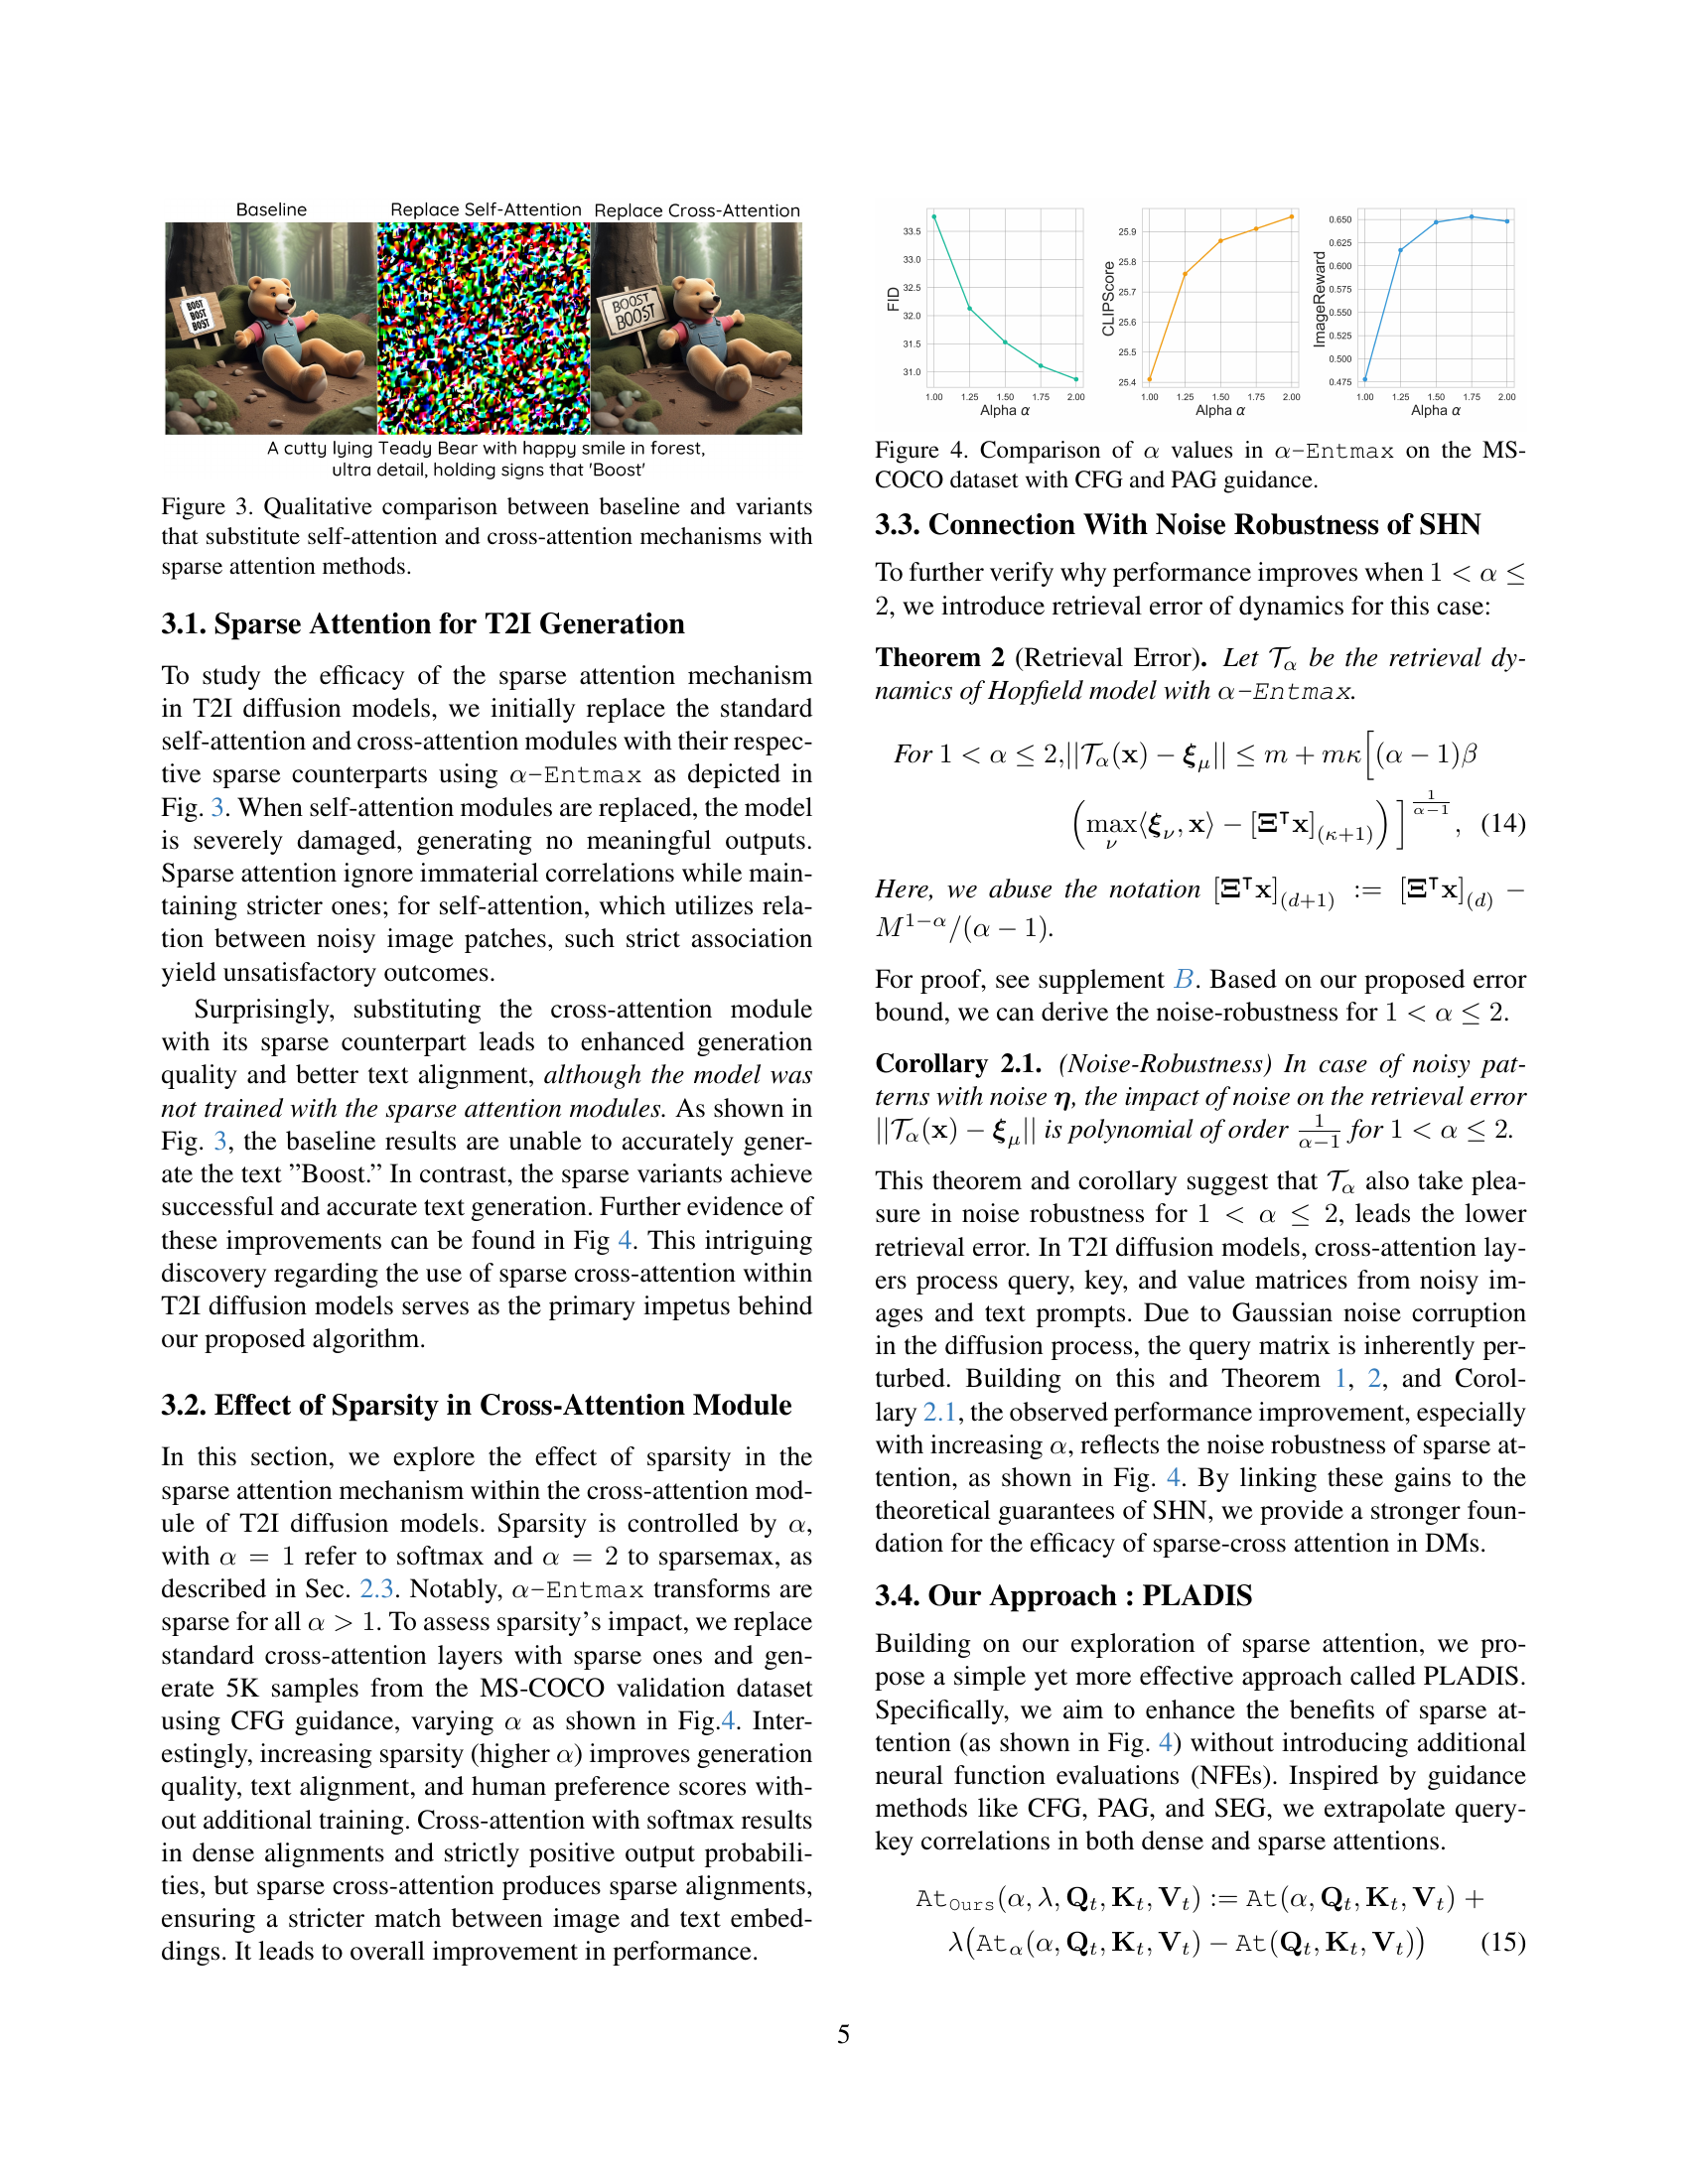
🔼 Figure 3 presents a qualitative comparison of image generation results using different attention mechanisms in diffusion models. The ‘Baseline’ uses standard dense self-attention and cross-attention. The ‘Replace Self-Attention’ variant substitutes sparse attention for the self-attention mechanism, while the ‘Replace Cross-Attention’ variant replaces the cross-attention with sparse attention. The figure displays generated images to illustrate the impact of each approach on image quality and text alignment. It aims to show that replacing cross-attention with its sparse counterpart yields more favorable results but that replacing self-attention negatively impacts image generation.
read the caption
Figure 3: Qualitative comparison between baseline and variants that substitute self-attention and cross-attention mechanisms with sparse attention methods.

🔼 This figure displays the results of an experiment evaluating the impact of different sparsity levels (controlled by the αα parameter in α-Entmaxα-Entmax ) on the quality of images generated by a diffusion model. The experiment used the MS-COCO dataset and two guidance methods: Classifier-Free Guidance (CFG) and Perturbed Attention Guidance (PAG). The figure likely shows metrics like FID (Fréchet Inception Distance), CLIPScore, and possibly others, across varying αα values. It demonstrates how the sparsity level affects the quality of generated images and potentially other aspects of image generation, as measured by these metrics, when using either CFG or PAG.
read the caption
Figure 4: Comparison of α𝛼\alphaitalic_α values in α-Entmax𝛼-Entmax\alpha\texttt{-Entmax}italic_α -Entmax on the MS-COCO dataset with CFG and PAG guidance.

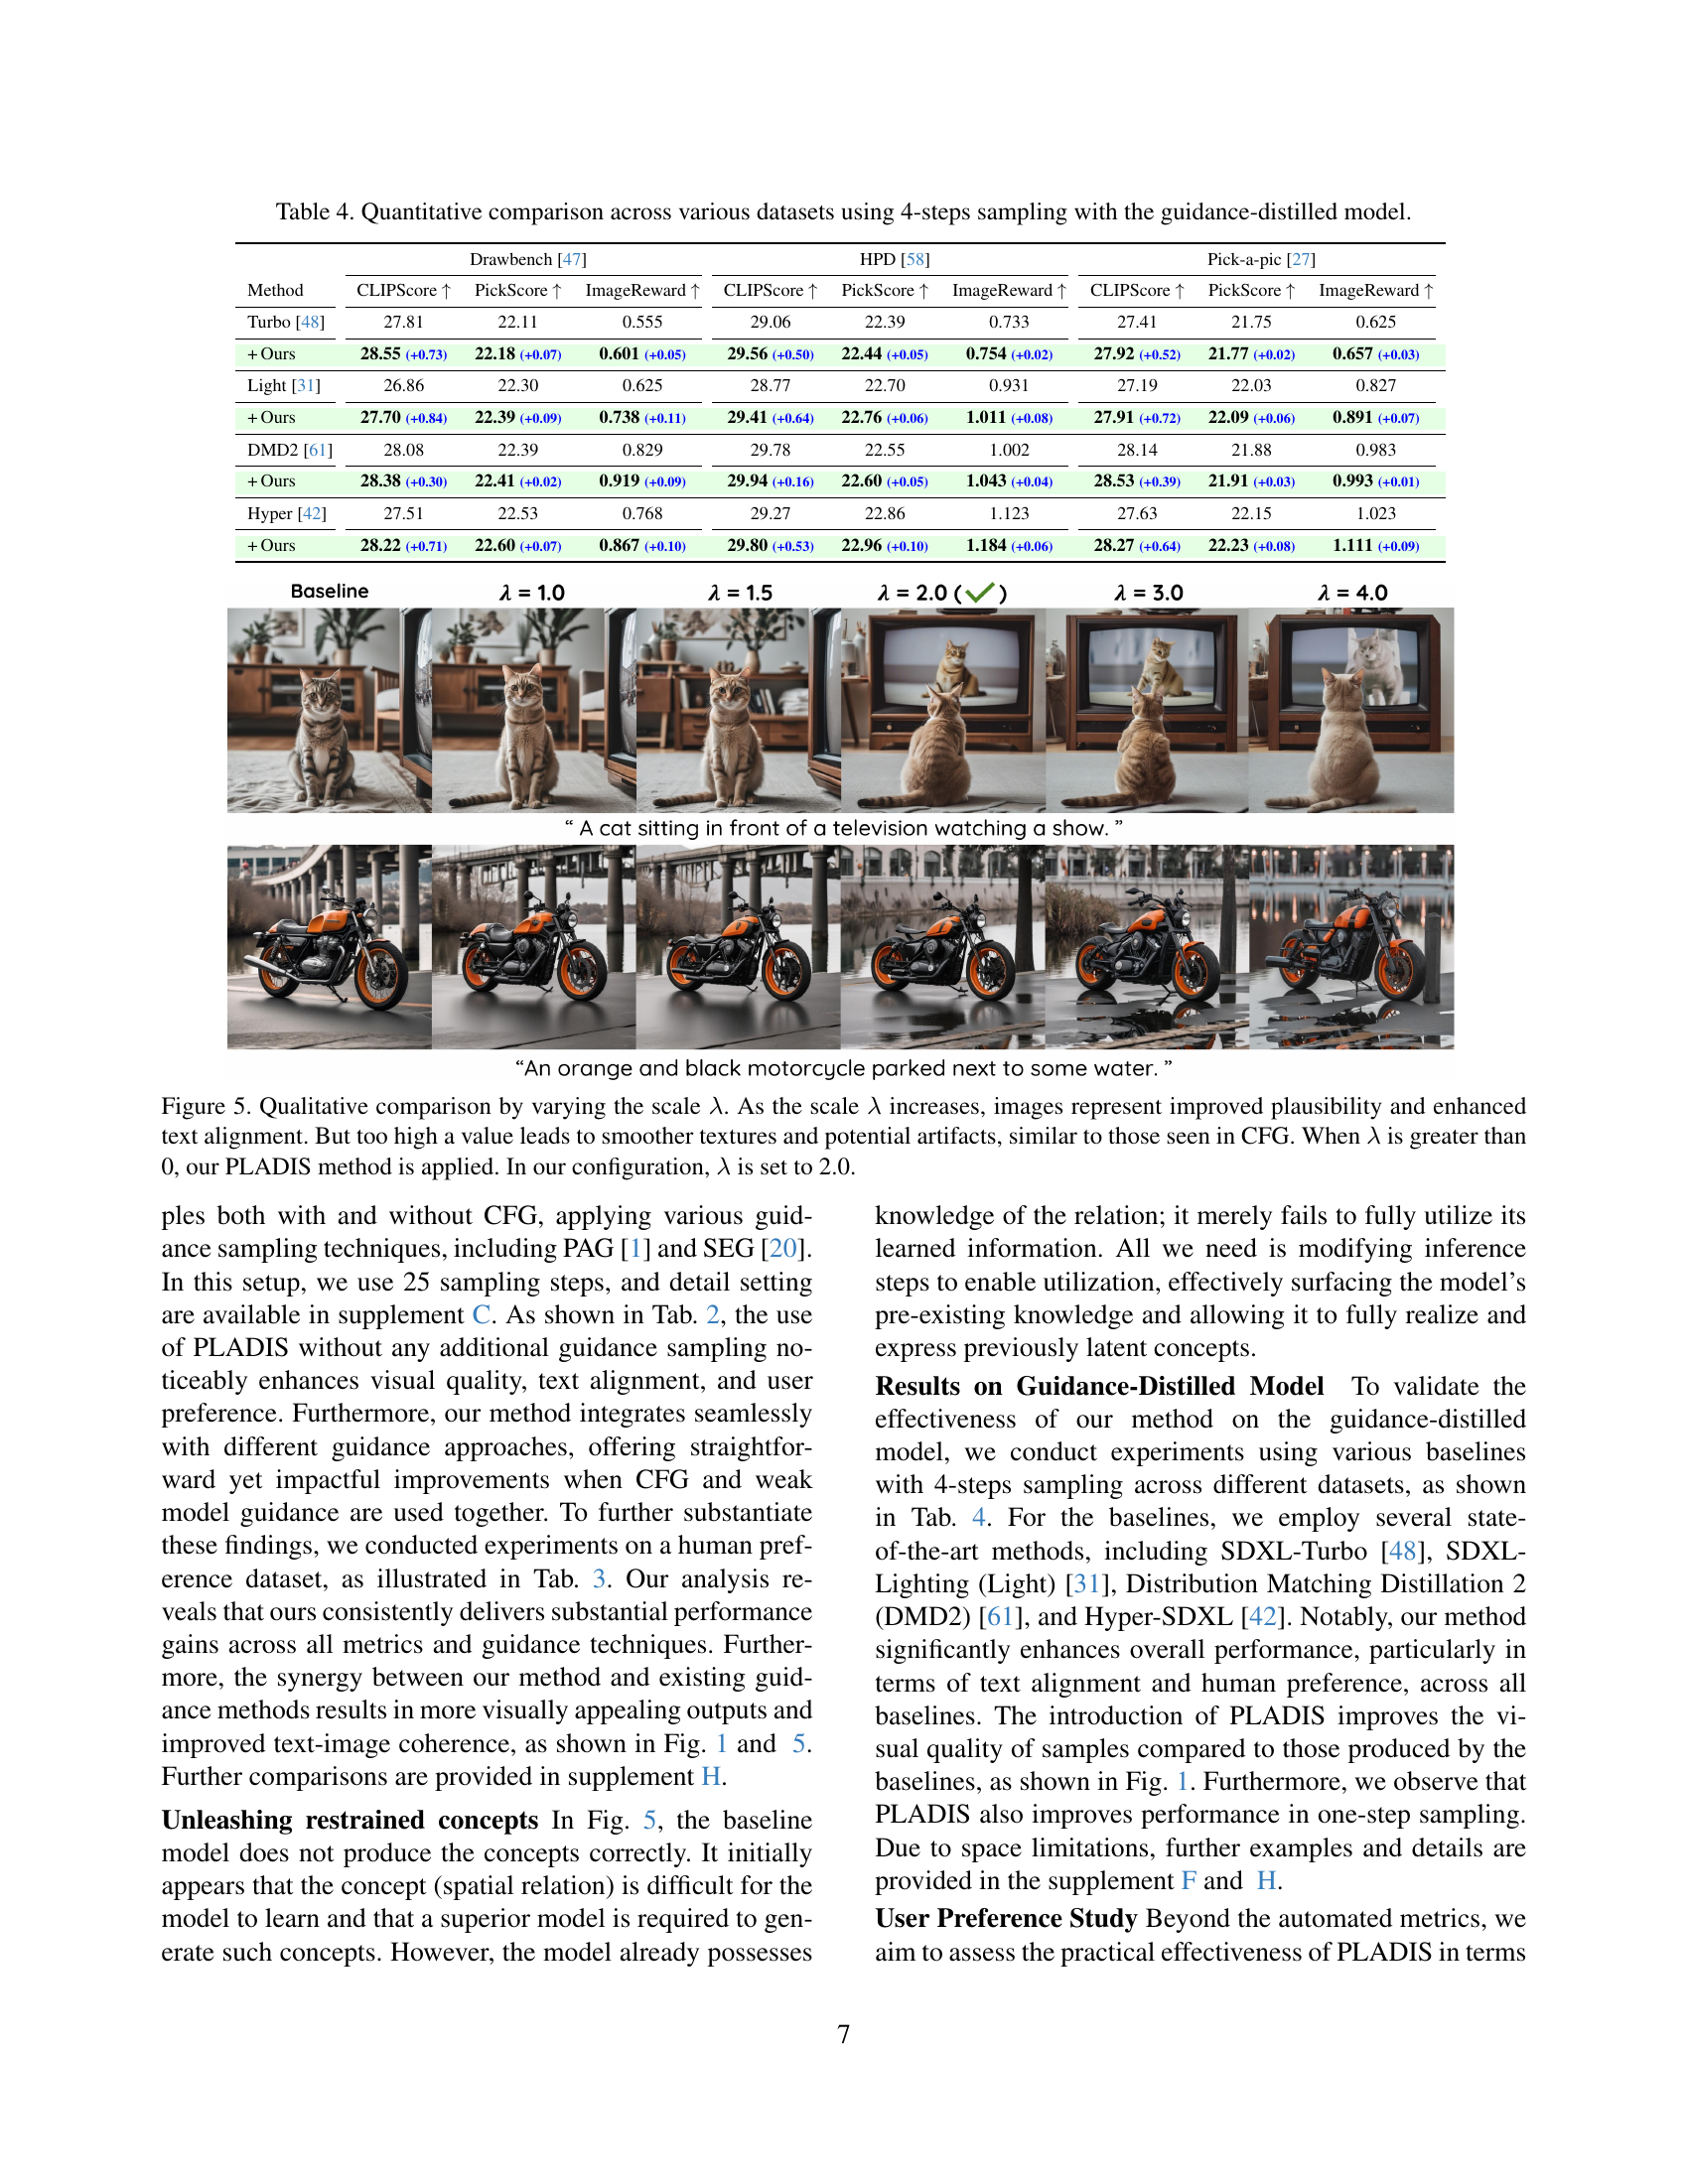
🔼 This figure displays a qualitative comparison of image generation results using the PLADIS method with different scaling factors (λ). The top row shows images generated with a baseline method, while subsequent rows demonstrate results with increasing λ values (1.0, 1.5, 2.0, 3.0, 4.0). The images illustrate how increasing λ enhances both the plausibility of the generated images and their alignment with the given text prompts. However, excessively large λ values (e.g., 4.0) can lead to overly smoothed textures and potential artifacts, mirroring the behavior observed with classifier-free guidance (CFG). The optimal λ value selected for the PLADIS method in this paper is 2.0.
read the caption
Figure 5: Qualitative comparison by varying the scale λ𝜆\lambdaitalic_λ. As the scale λ𝜆\lambdaitalic_λ increases, images represent improved plausibility and enhanced text alignment. But too high a value leads to smoother textures and potential artifacts, similar to those seen in CFG. When λ𝜆\lambdaitalic_λ is greater than 0, our PLADIS method is applied. In our configuration, λ𝜆\lambdaitalic_λ is set to 2.0.

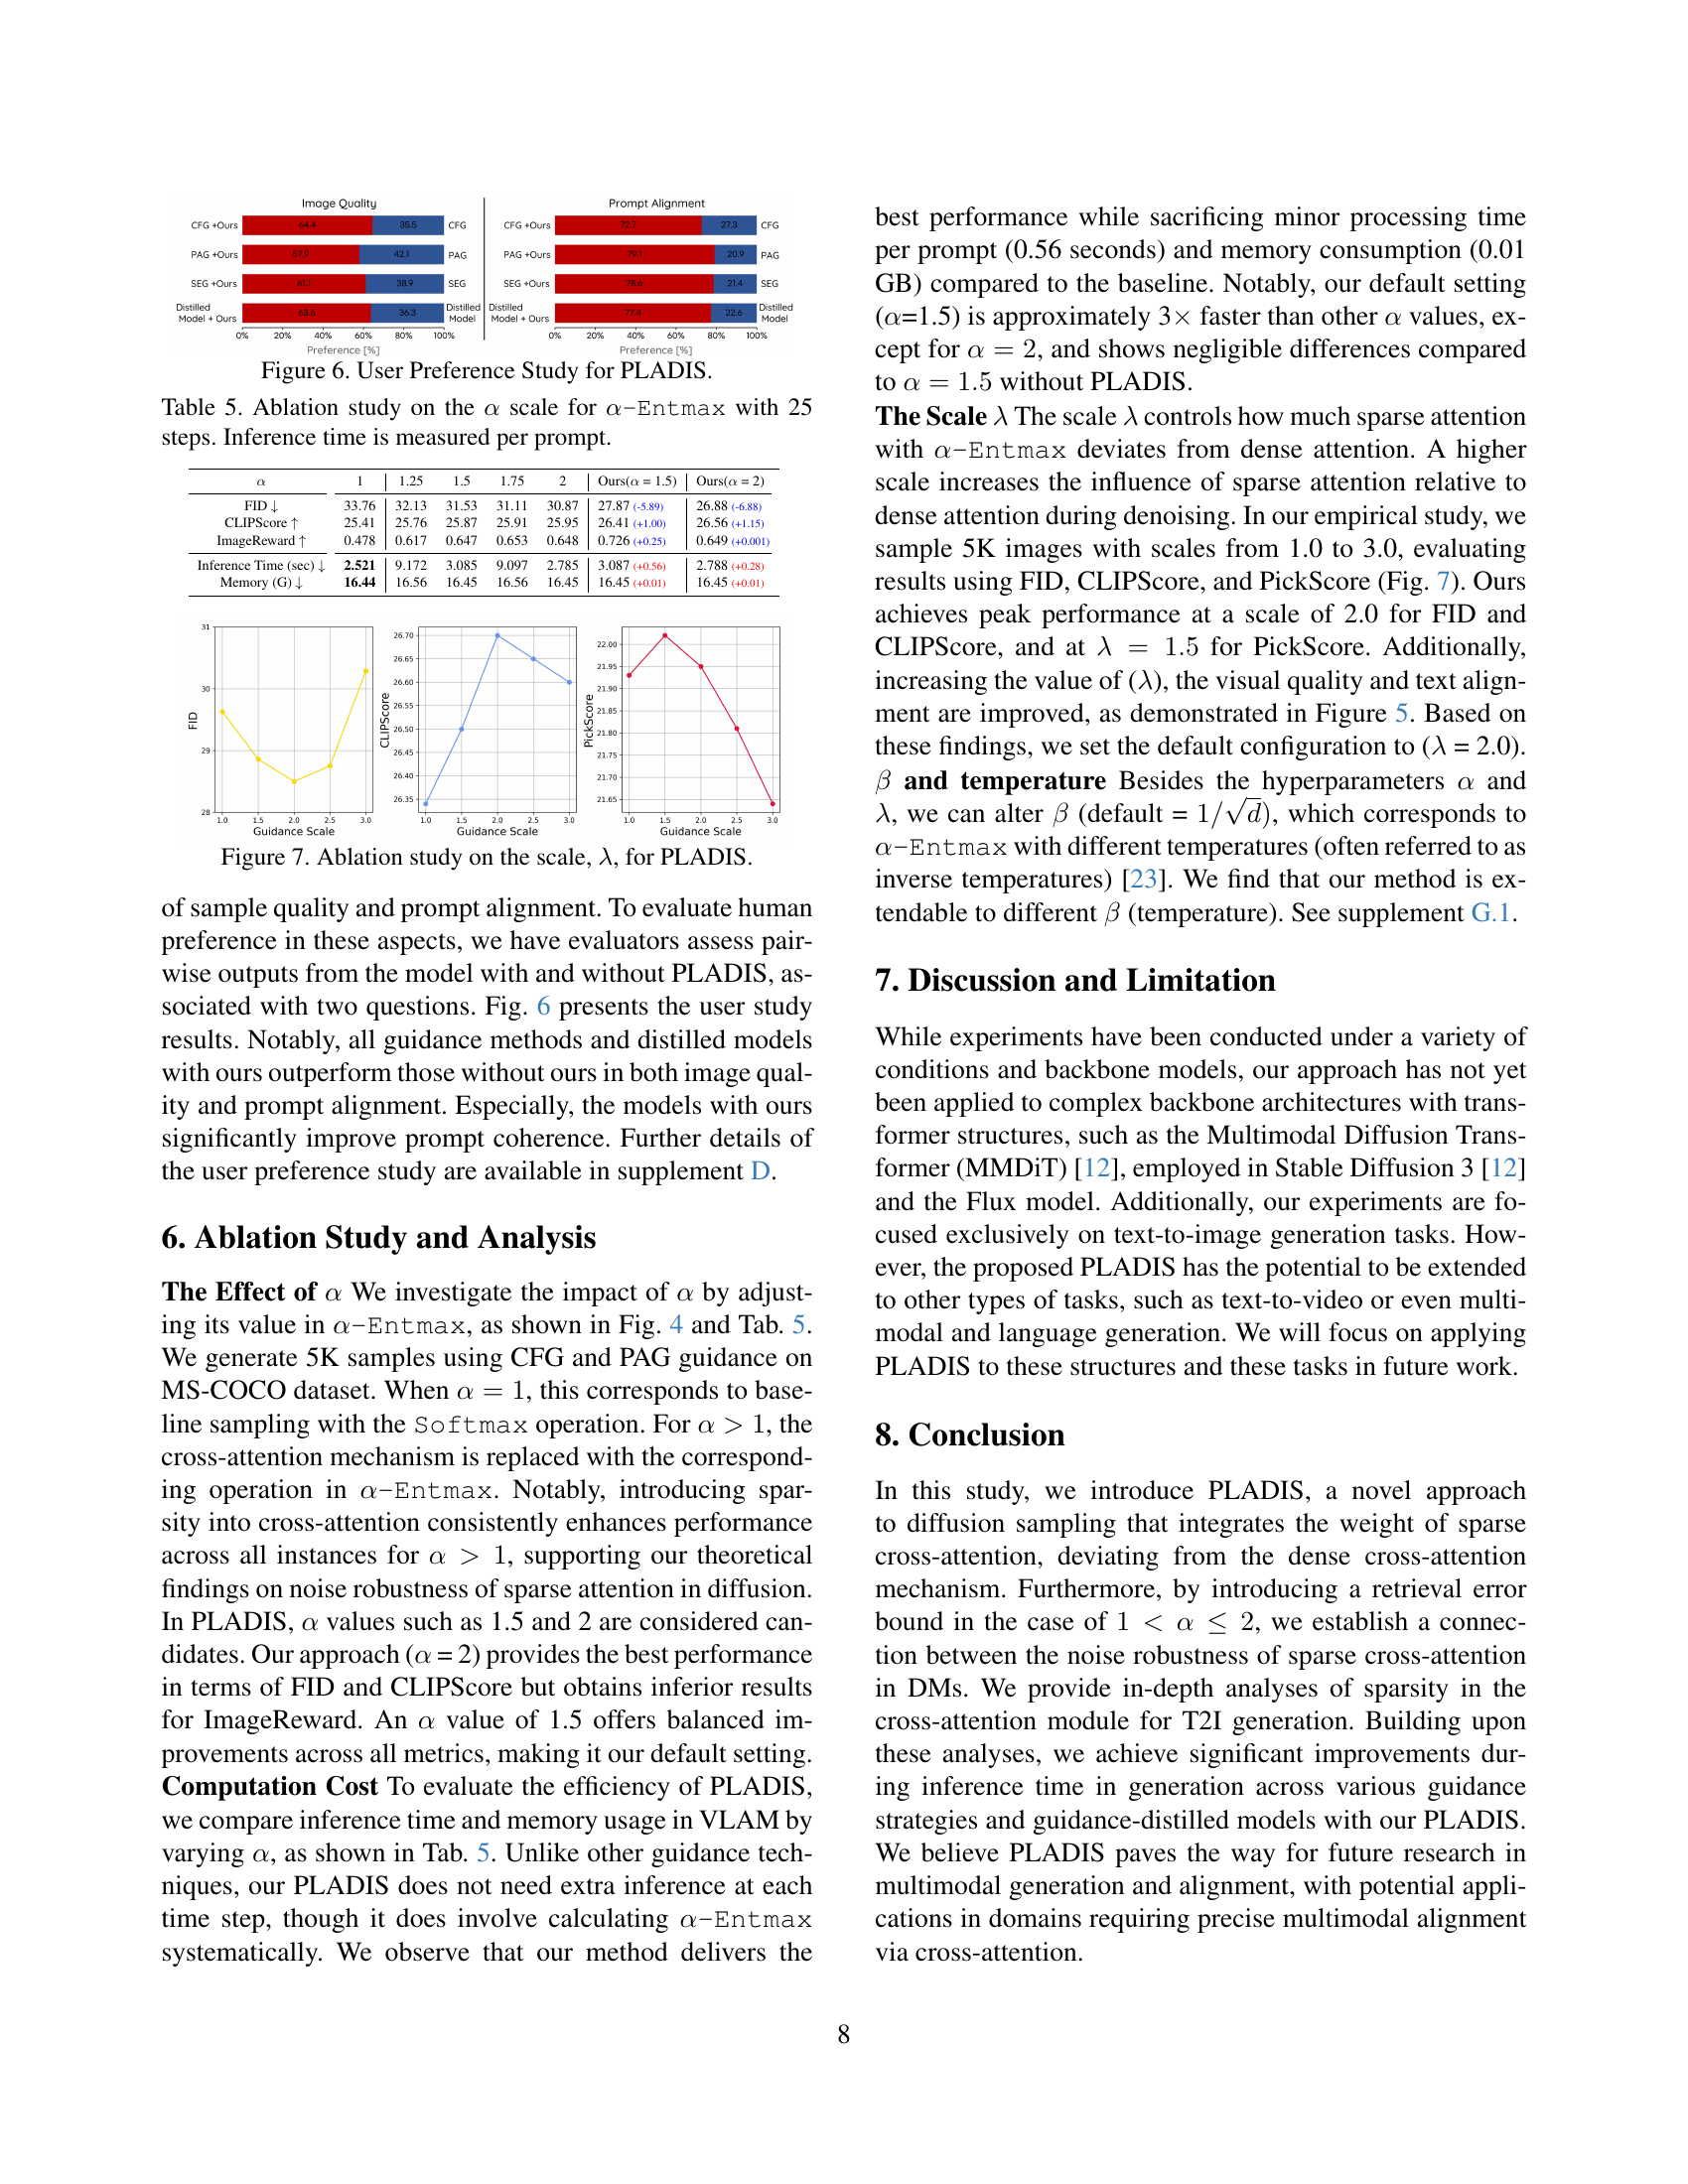
🔼 This figure presents the results of a user preference study comparing image generation results with and without the proposed PLADIS method. The study used various guidance sampling methods (CFG, PAG, SEG) and guidance-distilled models. Two questions were asked of participants: ‘Which image is of higher quality and visually more pleasing?’ and ‘Which image looks more representative of the given prompt?’. The bar graphs show the percentage of times each method was preferred for image quality and prompt alignment.
read the caption
Figure 6: User Preference Study for PLADIS.

🔼 This ablation study analyzes how changing the scaling factor λ in the PLADIS method affects the model’s performance. The scaling factor λ controls the influence of sparse attention compared to dense attention. The plots show how FID, CLIPScore, and PickScore change as λ varies from 1.0 to 3.0. This helps determine the optimal value of λ for balancing the benefits of sparse attention with the performance of the base model. The results illustrate the impact of different levels of sparsity on image generation quality and text alignment.
read the caption
Figure 7: Ablation study on the scale, λ𝜆\lambdaitalic_λ, for PLADIS.

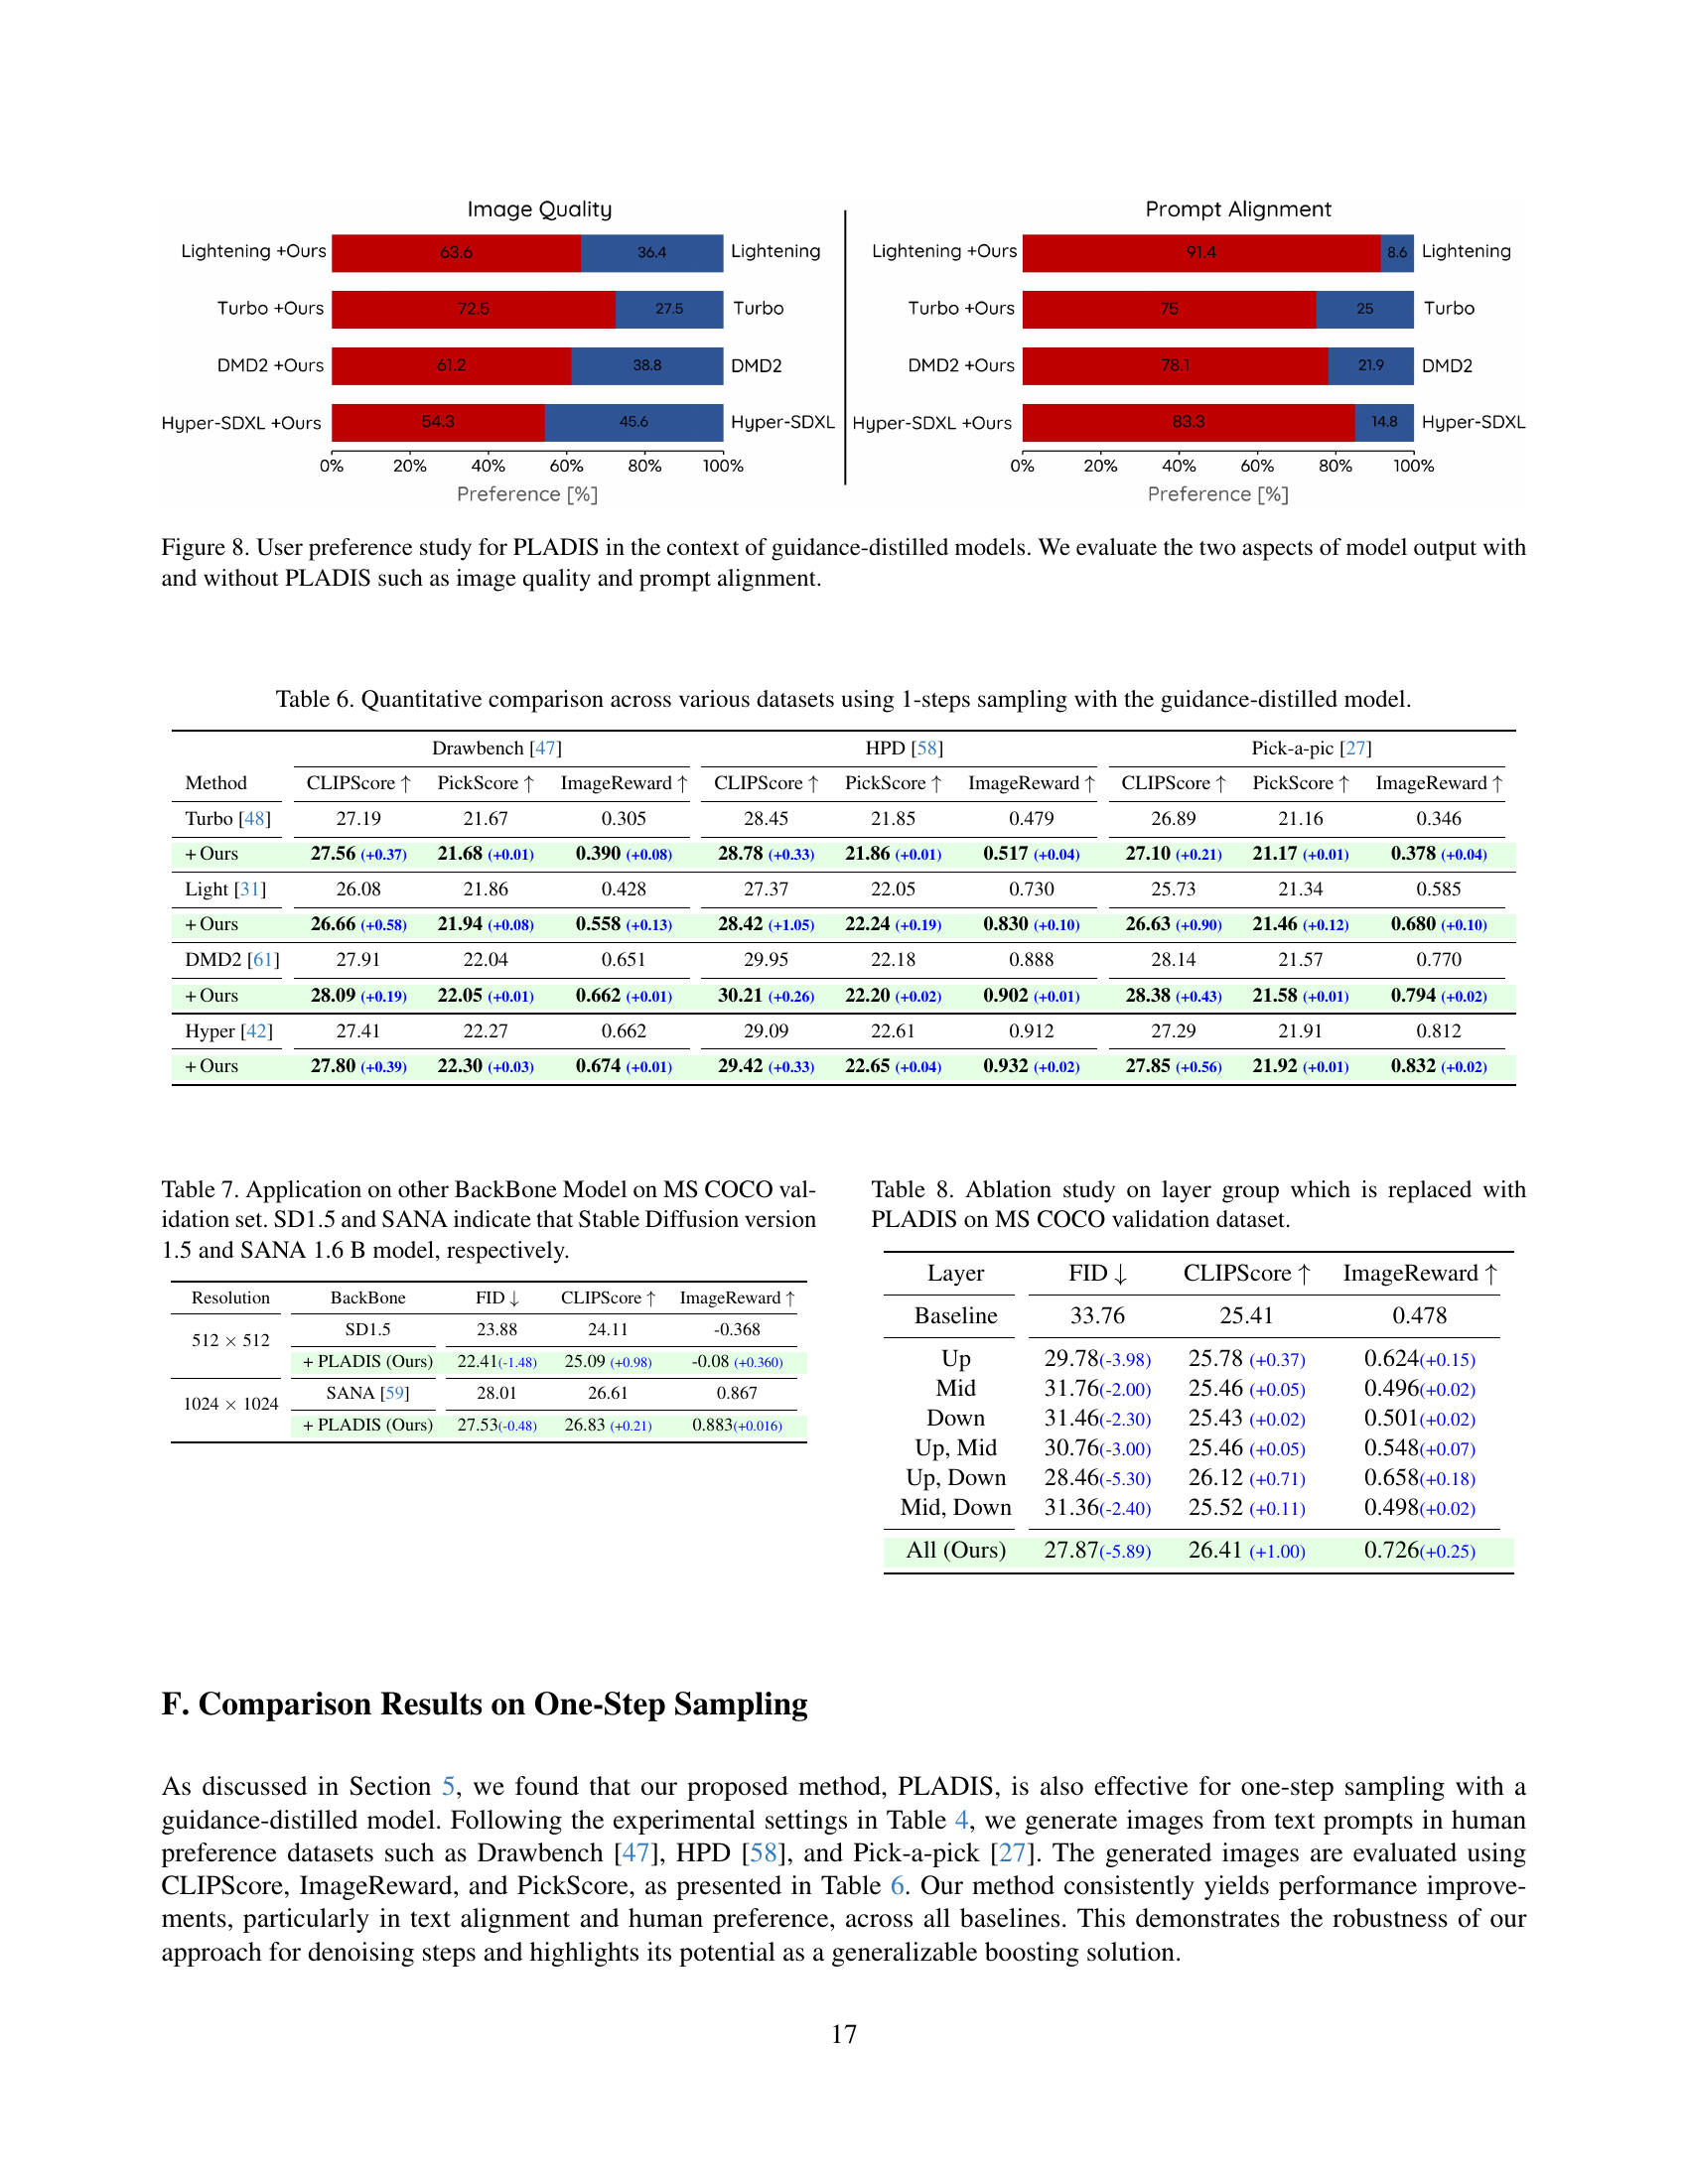
🔼 This figure presents the results of a user preference study comparing image generation with and without the PLADIS method applied to guidance-distilled models. Users were asked to evaluate two aspects of the generated images: image quality and prompt alignment. The bar charts show the percentage of users who preferred the images generated with PLADIS for each aspect and each model. The results demonstrate that PLADIS consistently improves both image quality and prompt alignment across different guidance-distilled models, highlighting its effectiveness.
read the caption
Figure 8: User preference study for PLADIS in the context of guidance-distilled models. We evaluate the two aspects of model output with and without PLADIS such as image quality and prompt alignment.

🔼 This table presents a quantitative comparison of the performance of the proposed PLADIS method on different backbones: Stable Diffusion v1.5 (SD1.5) and SANA 1.6B. It evaluates the FID (Fréchet Inception Distance), CLIPScore, and ImageReward metrics to assess the image quality, text-image alignment, and overall user preference. The results demonstrate the effectiveness and generalizability of the PLADIS method across various diffusion models.
read the caption
Table 7: Application on other BackBone Model on MS COCO validation set. SD1.5 and SANA indicate that Stable Diffusion version 1.5 and SANA 1.6 B model, respectively.

🔼 This ablation study investigates the impact of applying PLADIS to different layer groups within the UNet architecture of Stable Diffusion XL. The MS-COCO validation dataset was used for evaluation. The table compares the performance (FID, CLIPScore, and ImageReward) of various configurations, including applying PLADIS to only the ‘Up’, ‘Mid’, or ‘Down’ layer groups, combinations of these groups, and finally applying it to all layers. This analysis aims to determine the optimal layer or group of layers for applying PLADIS to maximize its effectiveness in improving image generation quality and text alignment.
read the caption
Table 8: Ablation study on layer group which is replaced with PLADIS on MS COCO validation dataset.

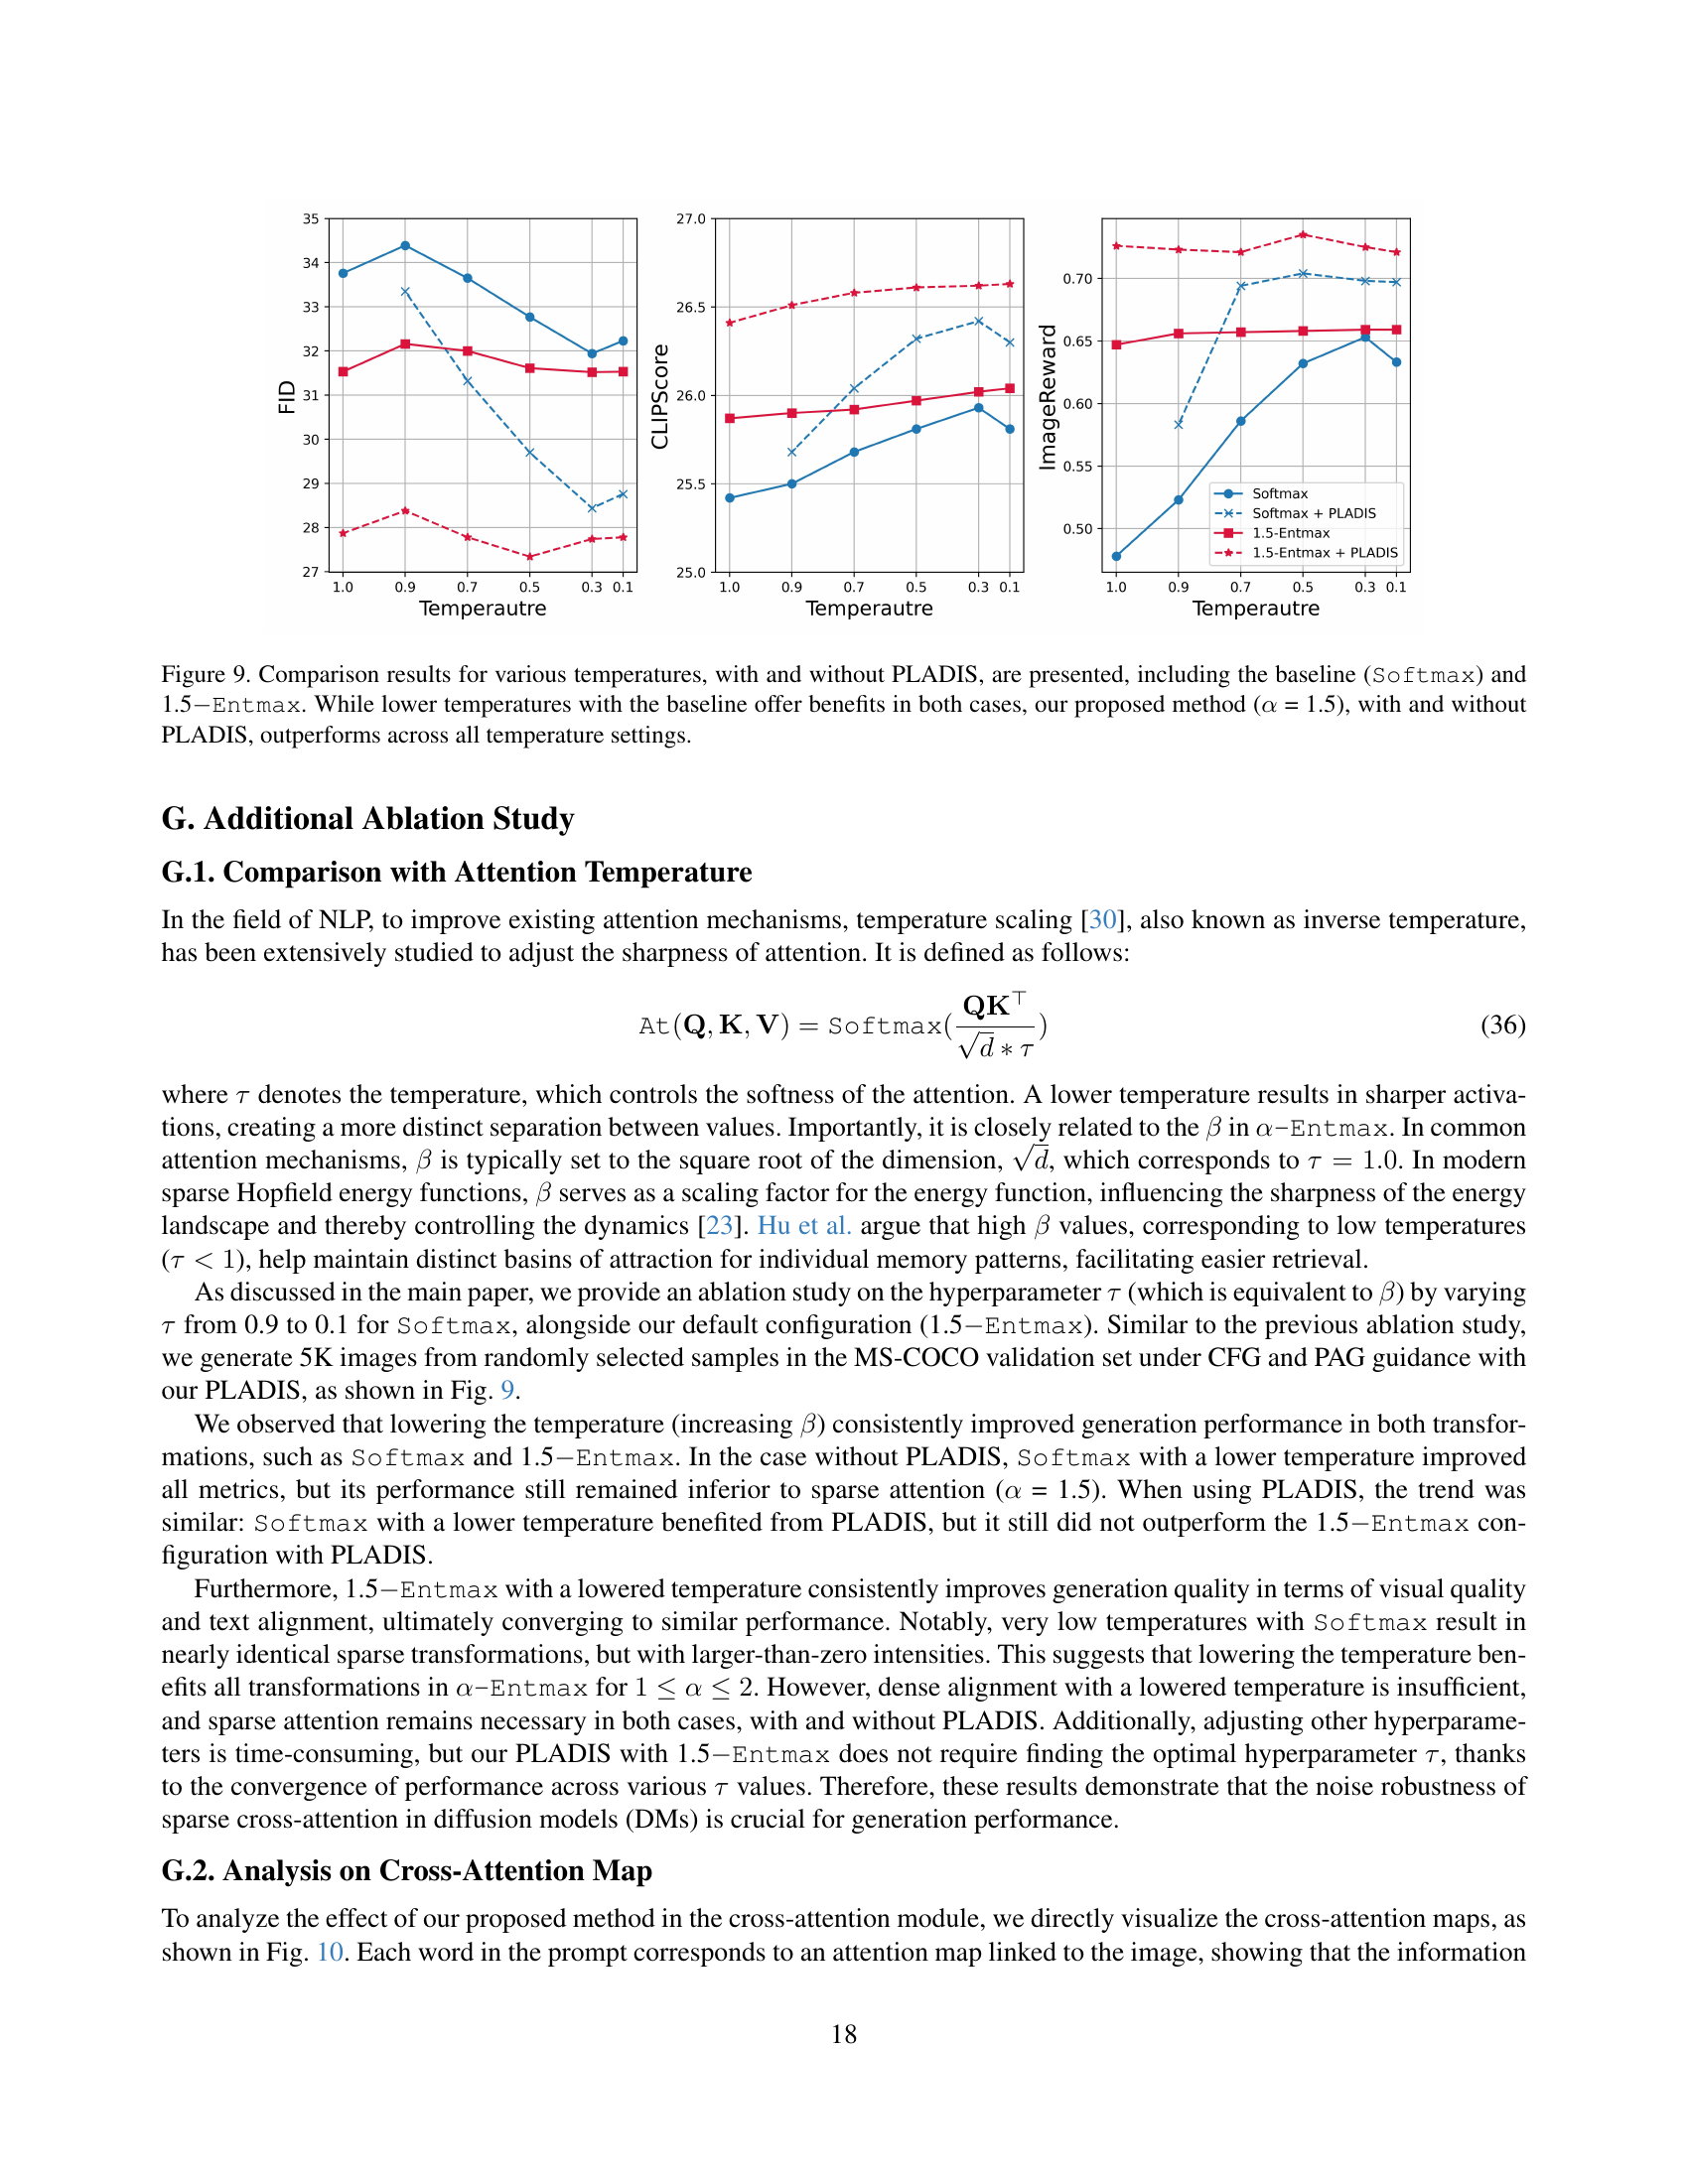
🔼 Figure 9 displays the impact of temperature on the performance of different attention mechanisms, with and without the proposed PLADIS method. The x-axis represents temperature, ranging from 0.1 to 1.0. Four lines are plotted: Softmax (baseline), Softmax with PLADIS, 1.5-Entmax, and 1.5-Entmax with PLADIS. Each line shows the performance in terms of FID, CLIPScore, and ImageReward metrics. The results indicate that while lower temperatures generally improve the baseline method, the 1.5-Entmax approach (with or without PLADIS) consistently outperforms Softmax across all temperature settings. This suggests that the sparsity introduced by 1.5-Entmax is beneficial, regardless of temperature.
read the caption
Figure 9: Comparison results for various temperatures, with and without PLADIS, are presented, including the baseline (Softmax) and 1.5−EntmaxEntmax-\texttt{Entmax}- Entmax. While lower temperatures with the baseline offer benefits in both cases, our proposed method (α𝛼\alphaitalic_α = 1.5), with and without PLADIS, outperforms across all temperature settings.

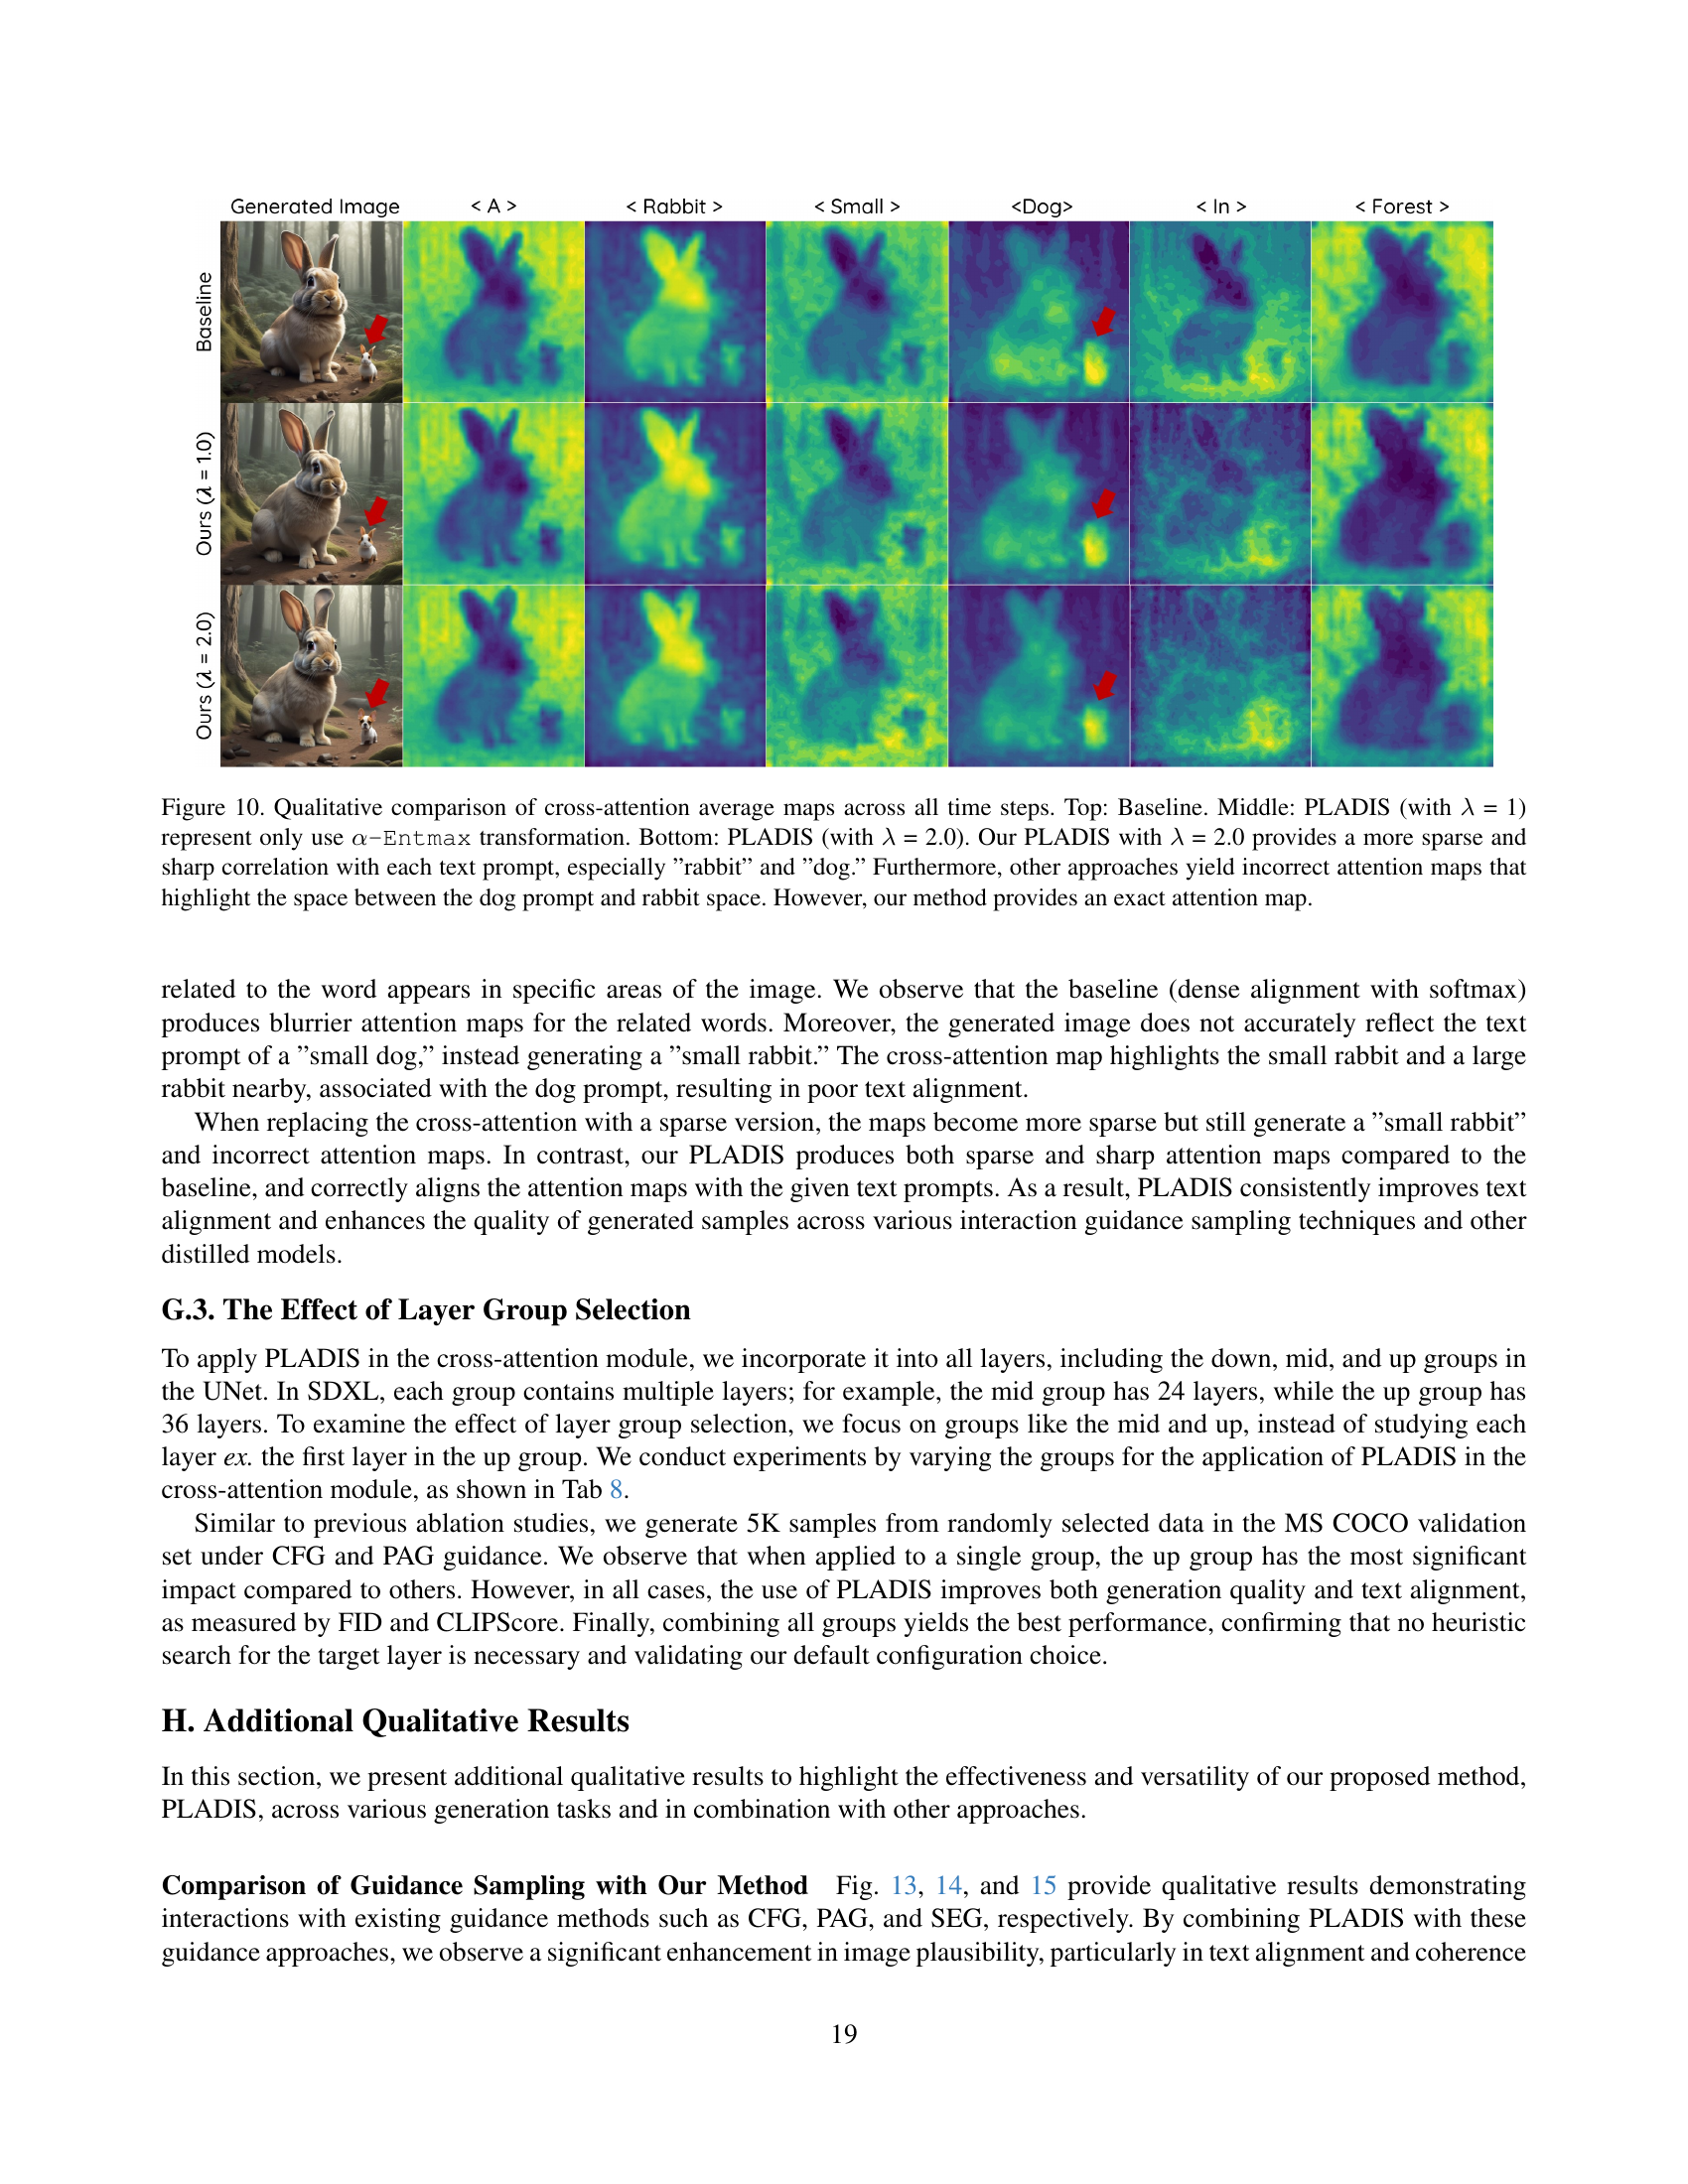
🔼 Figure 10 visualizes cross-attention maps across different time steps to compare the baseline method with PLADIS, using α-Entmax with different sparsity levels (λ=1 and λ=2). The baseline shows diffuse attention, failing to clearly distinguish between objects in the prompt. PLADIS with λ=1 shows improvement in focusing on relevant objects. PLADIS with λ=2 yields the sharpest, most accurate attention map, correctly highlighting the ‘rabbit’ and ‘dog’ while avoiding the incorrect attention given to the space between them present in other methods.
read the caption
Figure 10: Qualitative comparison of cross-attention average maps across all time steps. Top: Baseline. Middle: PLADIS (with λ𝜆\lambdaitalic_λ = 1) represent only use α-Entmax𝛼-Entmax\alpha\texttt{-Entmax}italic_α -Entmax transformation. Bottom: PLADIS (with λ𝜆\lambdaitalic_λ = 2.0). Our PLADIS with λ𝜆\lambdaitalic_λ = 2.0 provides a more sparse and sharp correlation with each text prompt, especially ”rabbit” and ”dog.” Furthermore, other approaches yield incorrect attention maps that highlight the space between the dog prompt and rabbit space. However, our method provides an exact attention map.

🔼 This figure showcases the improved image generation capabilities of Stable Diffusion 1.5 when enhanced with the PLADIS method. The examples demonstrate that PLADIS not only improves the visual quality of the generated images but also significantly improves the alignment between the generated image and the given text prompt. Each row presents a text prompt and the corresponding images generated by Stable Diffusion 1.5 both with and without PLADIS. The comparison highlights PLADIS’s ability to create more realistic and visually appealing images that better match the user’s intentions.
read the caption
Figure 11: Qualitative evaluation of Stable Diffusion 1.5 using our PLADIS method: PLADIS significantly boosts generation quality, strengthens alignment with the given text prompt, and generates visually compelling images.

🔼 This figure presents a qualitative comparison of image generation results using the SANA model [59] with and without the application of the proposed PLADIS method. Each row shows a text prompt, followed by two images: one generated using the original SANA model, and one generated using SANA enhanced with PLADIS. The comparison highlights how PLADIS improves the generated images by enhancing their visual quality, ensuring that the generated image more accurately reflects the given text prompt, and overall resulting in more visually striking and compelling images.
read the caption
Figure 12: Qualitative assessment of SANA [59] with and without our PLADIS method: PLADIS notably improves generation quality, strengthens alignment with the provided text prompt, and produces visually striking images.

🔼 Figure 13 showcases the combined effect of Classifier-Free Guidance (CFG) and the proposed PLADIS method on image generation. It demonstrates that integrating PLADIS with CFG produces images that are more realistic and have better alignment with the text prompts. Importantly, this improvement is achieved without any increase in the computational cost of inference, showing the efficiency of PLADIS.
read the caption
Figure 13: Qualitative evaluation of the joint usage CFG [18] with our method: CFG with PLADIS generates more plausible images with significantly improved text alignment based on the text prompt, without requiring additional inference.

🔼 Figure 14 shows a qualitative comparison of image generation results using Perturbed Attention Guidance (PAG) with and without PLADIS. The figure demonstrates that combining PAG with PLADIS significantly improves the quality and accuracy of generated images, especially in their alignment with the given text prompt. Importantly, this improvement is achieved without the need for any additional inference steps or model retraining, highlighting the efficiency of the PLADIS method.
read the caption
Figure 14: Qualitative evaluation of the joint usage PAG [1] with our method: Integrating PAG with PLADIS produces highly credible images with markedly enhanced correspondence to the text prompt, all achieved without any further inference steps.

🔼 Figure 15 presents a qualitative comparison showcasing the results of using Smooth Energy Guidance (SEG) in conjunction with the proposed PLADIS method. The images generated demonstrate that combining these techniques leads to highly realistic and convincing outputs, significantly improving the alignment between the generated images and their corresponding text prompts. Notably, these improvements are achieved without the need for any additional inference steps, highlighting the efficiency of the PLADIS approach.
read the caption
Figure 15: Qualitative evaluation of the joint usage SEG [20] with our method: The combination of SEG and PLADIS yields highly convincing image generations with substantially improved alignment to the given text prompt, accomplished without the need for additional inference.

🔼 Figure 16 presents a qualitative comparison of several guidance-distilled models (SDXL-Turbo, SDXL-Lightening, DMD2, and Hyper-SDXL) with and without the application of the proposed PLADIS method. The comparison focuses specifically on one-step sampling. The figure shows that even with just one sampling step, PLADIS significantly improves the quality of generated images, enhances the alignment between the generated images and the given text prompts, and produces images that are more visually realistic and plausible.
read the caption
Figure 16: Qualitative comparison of the guidance-distilled model with our PLADIS method for one-step sampling: Even with one-step sampling, our PLADIS enhances generation quality, improves coherence with the given text prompt, and produces visually plausible images.
More on tables
| CFG | Method | FID | CLIPScore | ImageReward |
|---|---|---|---|---|
| ✗ | Vanilla | 83.68 | 20.92 | -1.050 |
| + Ours | 79.72 (-3.96) | 21.86 (+0.89) | -0.858 (+0.19) | |
| PAG [1] | 29.36 | 24.03 | -0.011 | |
| + Ours | 24.51 (-4.85) | 24.85 (+0.93) | 0.251 (+0.31) | |
| SEG [20] | 38.08 | 23.71 | -0.139 | |
| + Ours | 33.19 (-4.89) | 24.63 (+1.02) | 0.134 (+0.28) | |
| ✓ | Vanilla | 23.39 | 25.91 | 0.425 |
| + Ours | 19.01 (-4.38) | 26.61 (+0.70) | 0.622 (+0.20) | |
| PAG [1] | 24.32 | 25.42 | 0.478 | |
| + Ours | 20.11 (-4.21) | 26.41 (+0.99) | 0.726 (+0.25) | |
| SEG [20] | 26.80 | 25.39 | 0.431 | |
| + Ours | 22.08 (-4.80) | 26.49 (+1.10) | 0.689 (+0.26) |
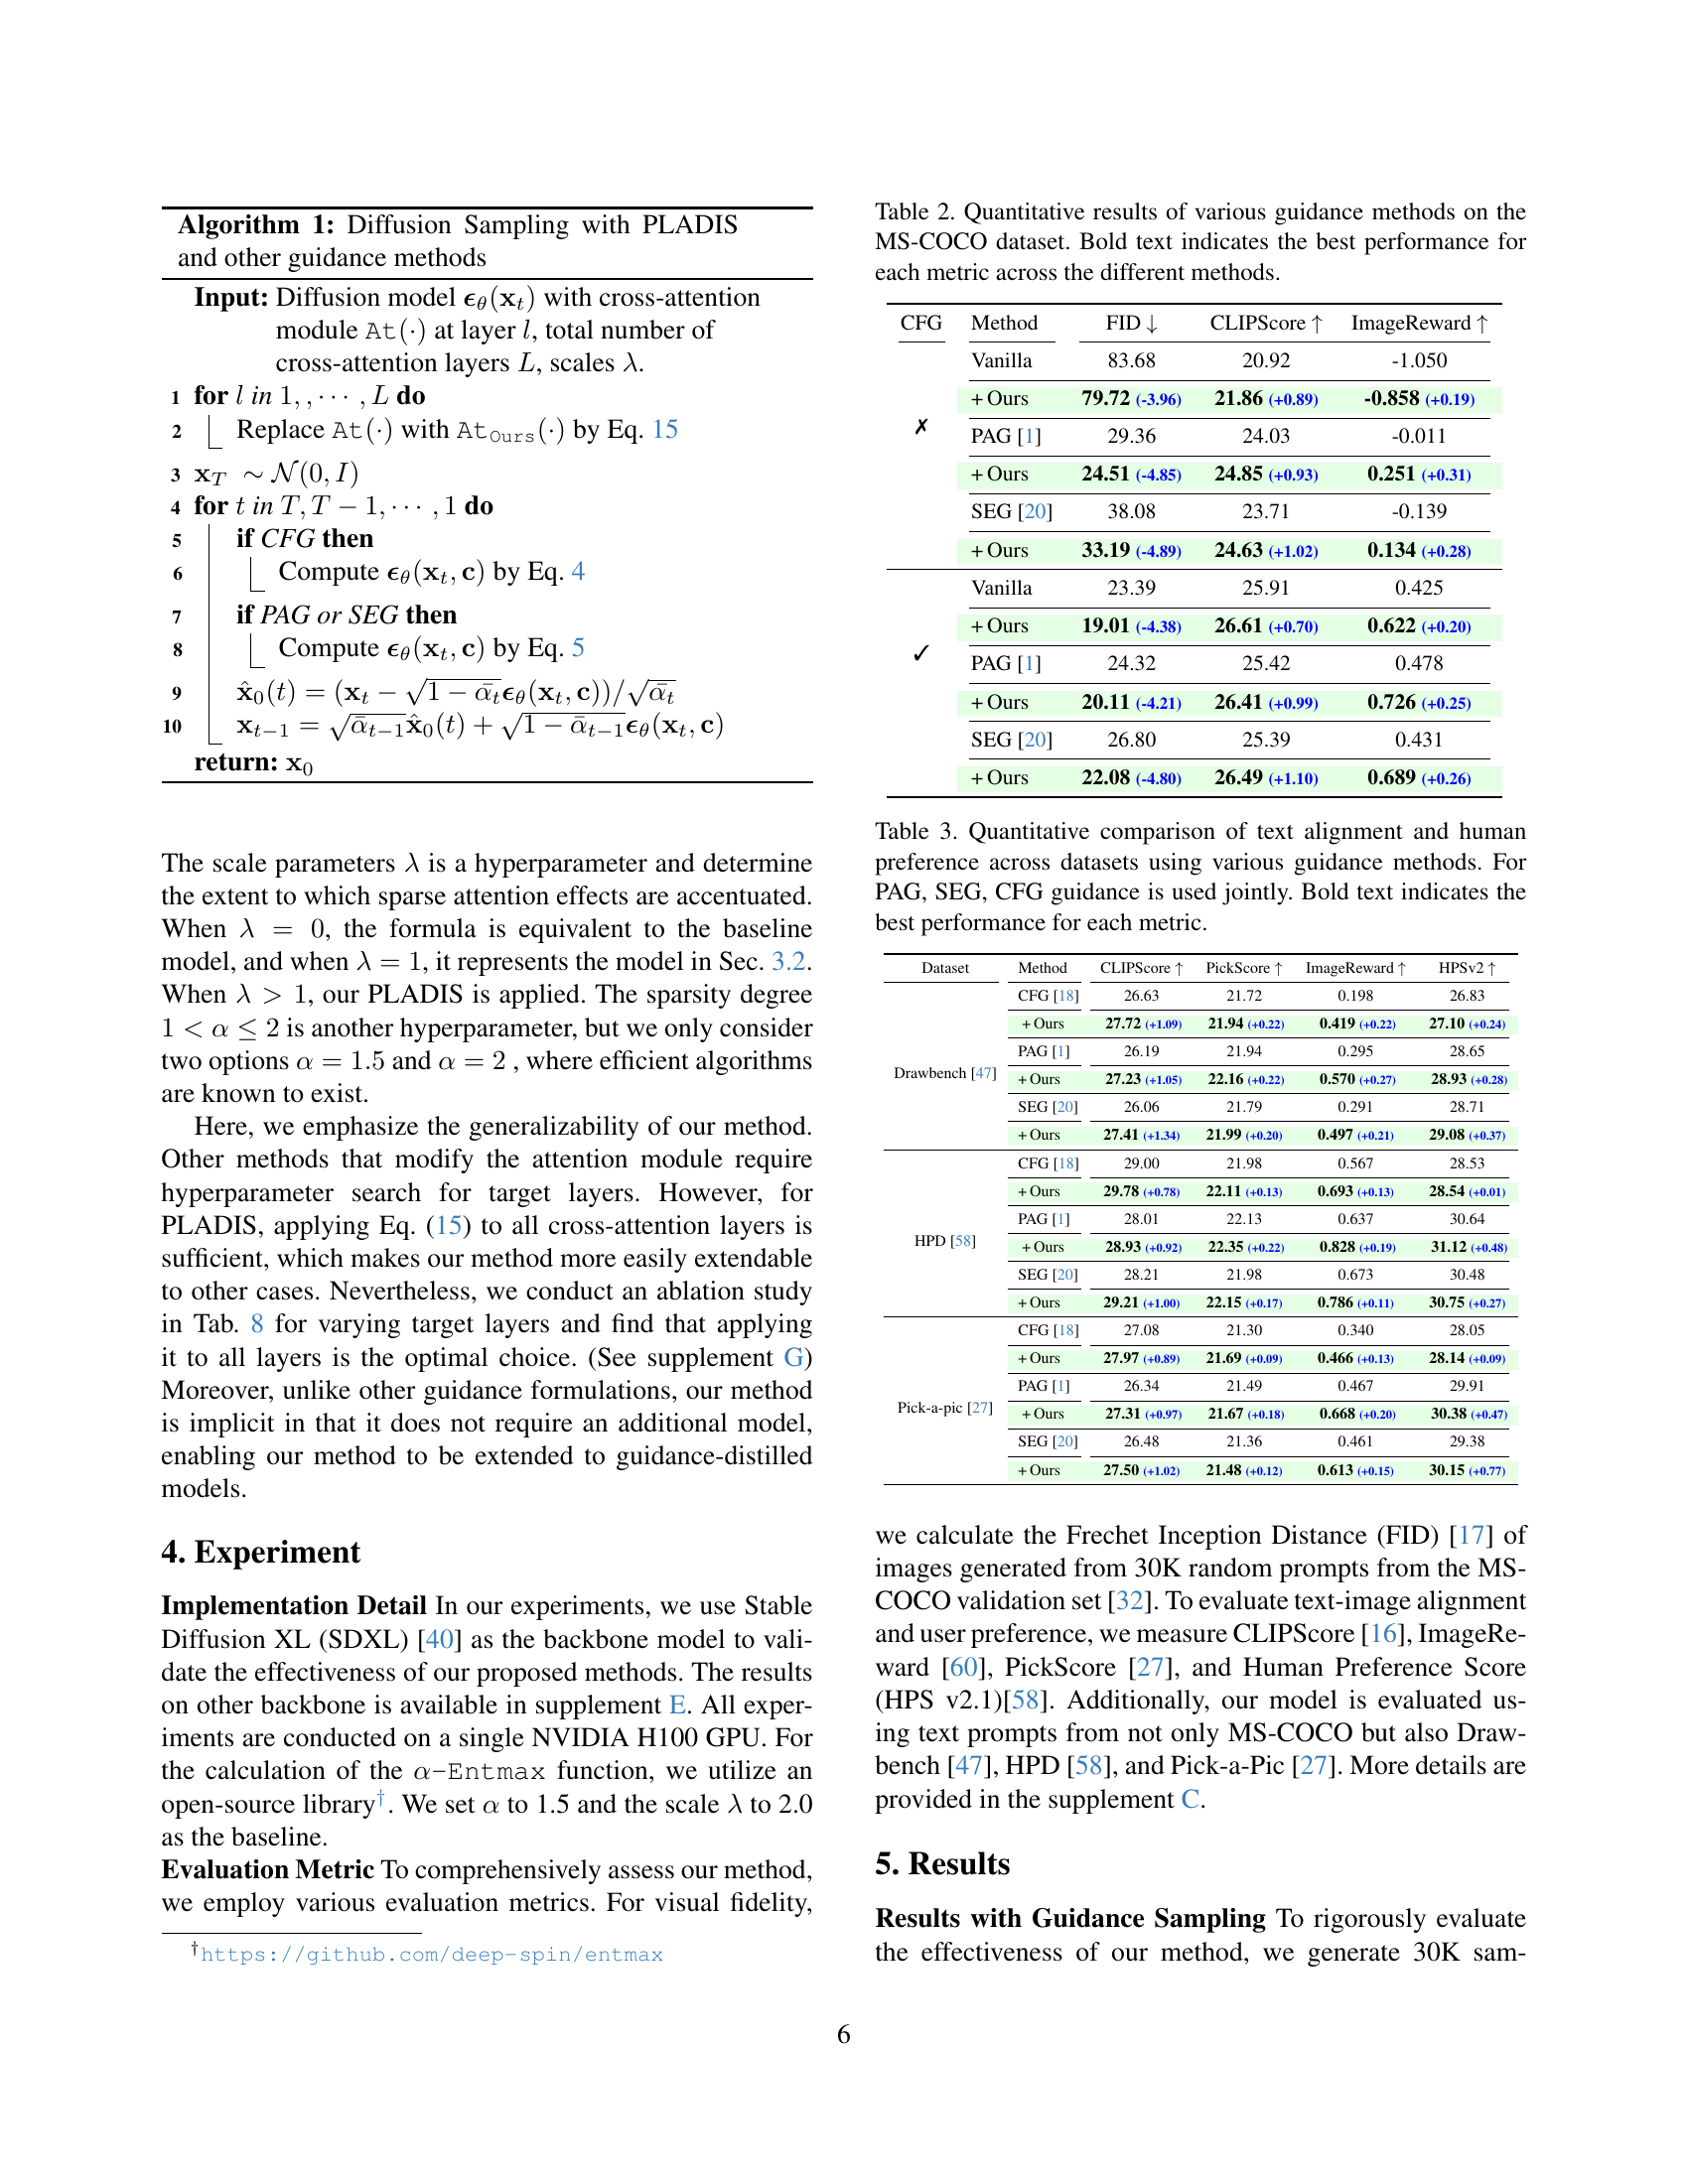
🔼 This table presents a quantitative comparison of different guidance sampling methods applied to a diffusion model for image generation on the MS-COCO dataset. The methods compared include Classifier-Free Guidance (CFG), Perturbed Attention Guidance (PAG), and Smooth Energy Guidance (SEG), each with and without the addition of the proposed PLADIS method. The evaluation metrics used are Frechet Inception Distance (FID), CLIPScore, and ImageReward. Lower FID values indicate better image quality, higher CLIPScore values indicate better alignment between generated images and text prompts, and higher ImageReward values indicate higher human preference. The bold values in the table highlight the best performance for each metric across all the methods tested.
read the caption
Table 2: Quantitative results of various guidance methods on the MS-COCO dataset. Bold text indicates the best performance for each metric across the different methods.
| Dataset | Method | CLIPScore | PickScore | ImageReward | HPSv2 |
|---|---|---|---|---|---|
| Drawbench [47] | CFG [18] | 26.63 | 21.72 | 0.198 | 26.83 |
| + Ours | 27.72 (+1.09) | 21.94 (+0.22) | 0.419 (+0.22) | 27.10 (+0.24) | |
| PAG [1] | 26.19 | 21.94 | 0.295 | 28.65 | |
| + Ours | 27.23 (+1.05) | 22.16 (+0.22) | 0.570 (+0.27) | 28.93 (+0.28) | |
| SEG [20] | 26.06 | 21.79 | 0.291 | 28.71 | |
| + Ours | 27.41 (+1.34) | 21.99 (+0.20) | 0.497 (+0.21) | 29.08 (+0.37) | |
| HPD [58] | CFG [18] | 29.00 | 21.98 | 0.567 | 28.53 |
| + Ours | 29.78 (+0.78) | 22.11 (+0.13) | 0.693 (+0.13) | 28.54 (+0.01) | |
| PAG [1] | 28.01 | 22.13 | 0.637 | 30.64 | |
| + Ours | 28.93 (+0.92) | 22.35 (+0.22) | 0.828 (+0.19) | 31.12 (+0.48) | |
| SEG [20] | 28.21 | 21.98 | 0.673 | 30.48 | |
| + Ours | 29.21 (+1.00) | 22.15 (+0.17) | 0.786 (+0.11) | 30.75 (+0.27) | |
| Pick-a-pic [27] | CFG [18] | 27.08 | 21.30 | 0.340 | 28.05 |
| + Ours | 27.97 (+0.89) | 21.69 (+0.09) | 0.466 (+0.13) | 28.14 (+0.09) | |
| PAG [1] | 26.34 | 21.49 | 0.467 | 29.91 | |
| + Ours | 27.31 (+0.97) | 21.67 (+0.18) | 0.668 (+0.20) | 30.38 (+0.47) | |
| SEG [20] | 26.48 | 21.36 | 0.461 | 29.38 | |
| + Ours | 27.50 (+1.02) | 21.48 (+0.12) | 0.613 (+0.15) | 30.15 (+0.77) |
🔼 This table presents a quantitative comparison of different guidance methods (CFG, PAG, SEG) on text-to-image generation across multiple datasets (Drawbench, HPD, Pick-a-pic). It evaluates the effectiveness of each method by measuring CLIPScore (evaluates text-image alignment), PickScore (human preference), and ImageReward (another measure of human preference). The results are displayed for each method individually and when combined with the proposed PLADIS method. The bold text highlights the best performance for each metric on each dataset.
read the caption
Table 3: Quantitative comparison of text alignment and human preference across datasets using various guidance methods. For PAG, SEG, CFG guidance is used jointly. Bold text indicates the best performance for each metric.
| Drawbench [47] | HPD [58] | Pick-a-pic [27] | |||||||
|---|---|---|---|---|---|---|---|---|---|
| Method | CLIPScore | PickScore | ImageReward | CLIPScore | PickScore | ImageReward | CLIPScore | PickScore | ImageReward |
| Turbo [48] | 27.81 | 22.11 | 0.555 | 29.06 | 22.39 | 0.733 | 27.41 | 21.75 | 0.625 |
| + Ours | 28.55 (+0.73) | 22.18 (+0.07) | 0.601 (+0.05) | 29.56 (+0.50) | 22.44 (+0.05) | 0.754 (+0.02) | 27.92 (+0.52) | 21.77 (+0.02) | 0.657 (+0.03) |
| Light [31] | 26.86 | 22.30 | 0.625 | 28.77 | 22.70 | 0.931 | 27.19 | 22.03 | 0.827 |
| + Ours | 27.70 (+0.84) | 22.39 (+0.09) | 0.738 (+0.11) | 29.41 (+0.64) | 22.76 (+0.06) | 1.011 (+0.08) | 27.91 (+0.72) | 22.09 (+0.06) | 0.891 (+0.07) |
| DMD2 [61] | 28.08 | 22.39 | 0.829 | 29.78 | 22.55 | 1.002 | 28.14 | 21.88 | 0.983 |
| + Ours | 28.38 (+0.30) | 22.41 (+0.02) | 0.919 (+0.09) | 29.94 (+0.16) | 22.60 (+0.05) | 1.043 (+0.04) | 28.53 (+0.39) | 21.91 (+0.03) | 0.993 (+0.01) |
| Hyper [42] | 27.51 | 22.53 | 0.768 | 29.27 | 22.86 | 1.123 | 27.63 | 22.15 | 1.023 |
| + Ours | 28.22 (+0.71) | 22.60 (+0.07) | 0.867 (+0.10) | 29.80 (+0.53) | 22.96 (+0.10) | 1.184 (+0.06) | 28.27 (+0.64) | 22.23 (+0.08) | 1.111 (+0.09) |
🔼 This table presents a quantitative comparison of different guidance-distilled models’ performance across multiple datasets when using a 4-step sampling process. It compares various metrics (CLIPScore, PickScore, and ImageReward) to evaluate the models’ text alignment and image quality across datasets such as Drawbench, HPD, and Pick-a-pic. The table also shows the impact of the proposed PLADIS method on the performance of each guidance-distilled model, highlighting the improvements achieved with PLADIS across different datasets and sampling methods.
read the caption
Table 4: Quantitative comparison across various datasets using 4-steps sampling with the guidance-distilled model.
| 1 | 1.25 | 1.5 | 1.75 | 2 | Ours( = 1.5) | Ours( = 2) | |
|---|---|---|---|---|---|---|---|
| FID | 33.76 | 32.13 | 31.53 | 31.11 | 30.87 | 27.87 (-5.89) | 26.88 (-6.88) |
| CLIPScore | 25.41 | 25.76 | 25.87 | 25.91 | 25.95 | 26.41 (+1.00) | 26.56 (+1.15) |
| ImageReward | 0.478 | 0.617 | 0.647 | 0.653 | 0.648 | 0.726 (+0.25) | 0.649 (+0.001) |
| Inference Time (sec) | 2.521 | 9.172 | 3.085 | 9.097 | 2.785 | 3.087 (+0.56) | 2.788 (+0.28) |
| Memory (G) | 16.44 | 16.56 | 16.45 | 16.56 | 16.45 | 16.45 (+0.01) | 16.45 (+0.01) |
🔼 This ablation study analyzes the impact of varying the αα parameter within the αα -Entmax function on the performance of the PLADIS method. The study uses 25 sampling steps and measures the FID score, CLIPScore, ImageReward, inference time per prompt, and memory usage. Different values of αα (1.0, 1.25, 1.5, 1.75, 2.0) are tested, comparing results against a baseline and the proposed PLADIS method with αα = 1.5 and αα = 2.0 to determine the optimal αα value for balancing performance and efficiency.
read the caption
Table 5: Ablation study on the α𝛼\alphaitalic_α scale for α𝛼\alphaitalic_α-Entmax with 25 steps. Inference time is measured per prompt.
| Drawbench [47] | HPD [58] | Pick-a-pic [27] | |||||||
|---|---|---|---|---|---|---|---|---|---|
| Method | CLIPScore | PickScore | ImageReward | CLIPScore | PickScore | ImageReward | CLIPScore | PickScore | ImageReward |
| Turbo [48] | 27.19 | 21.67 | 0.305 | 28.45 | 21.85 | 0.479 | 26.89 | 21.16 | 0.346 |
| + Ours | 27.56 (+0.37) | 21.68 (+0.01) | 0.390 (+0.08) | 28.78 (+0.33) | 21.86 (+0.01) | 0.517 (+0.04) | 27.10 (+0.21) | 21.17 (+0.01) | 0.378 (+0.04) |
| Light [31] | 26.08 | 21.86 | 0.428 | 27.37 | 22.05 | 0.730 | 25.73 | 21.34 | 0.585 |
| + Ours | 26.66 (+0.58) | 21.94 (+0.08) | 0.558 (+0.13) | 28.42 (+1.05) | 22.24 (+0.19) | 0.830 (+0.10) | 26.63 (+0.90) | 21.46 (+0.12) | 0.680 (+0.10) |
| DMD2 [61] | 27.91 | 22.04 | 0.651 | 29.95 | 22.18 | 0.888 | 28.14 | 21.57 | 0.770 |
| + Ours | 28.09 (+0.19) | 22.05 (+0.01) | 0.662 (+0.01) | 30.21 (+0.26) | 22.20 (+0.02) | 0.902 (+0.01) | 28.38 (+0.43) | 21.58 (+0.01) | 0.794 (+0.02) |
| Hyper [42] | 27.41 | 22.27 | 0.662 | 29.09 | 22.61 | 0.912 | 27.29 | 21.91 | 0.812 |
| + Ours | 27.80 (+0.39) | 22.30 (+0.03) | 0.674 (+0.01) | 29.42 (+0.33) | 22.65 (+0.04) | 0.932 (+0.02) | 27.85 (+0.56) | 21.92 (+0.01) | 0.832 (+0.02) |
🔼 This table presents a quantitative comparison of different guidance-distilled models’ performance on various datasets when using one-step sampling. It shows the improvements achieved by integrating the PLADIS method with several state-of-the-art guidance-distilled models. The comparison is made across three key metrics: CLIPScore, PickScore, and ImageReward, each indicating different aspects of image quality and text alignment.
read the caption
Table 6: Quantitative comparison across various datasets using 1-steps sampling with the guidance-distilled model.
Full paper#