TL;DR#
Multimodal Large Language Models (MLLMs) struggle with pixel-level comprehension, limiting their applicability despite advances in image understanding. Current evaluation methods are too coarse for assessing fine-grained understanding, while existing segmentation methods disrupt the MLLM’s text output space by relying on implicit tokens or external pixel decoders. This paper aims to address these limitations.
To solve this, the paper introduces the Human-Like Mask Annotation Task (HLMAT), where MLLMs mimic human annotators using interactive segmentation tools, modeling the segmentation task as a multi-step Markov Decision Process. It introduces SegAgent, a model fine-tuned on human-like annotation trajectories, achieving SOTA performance and supporting tasks like mask refinement and annotation filtering. Techniques like StaR and PRM guided tree search further enhance the model.
Key Takeaways#
Why does it matter?#
This work is important as it introduces a new method for evaluating and enhancing pixel-level understanding in MLLMs, a crucial step towards more capable and versatile AI systems. The SegAgent framework and HLMAT task open new avenues for research in visual reasoning and decision-making for MLLMs, with potential applications.
Visual Insights#

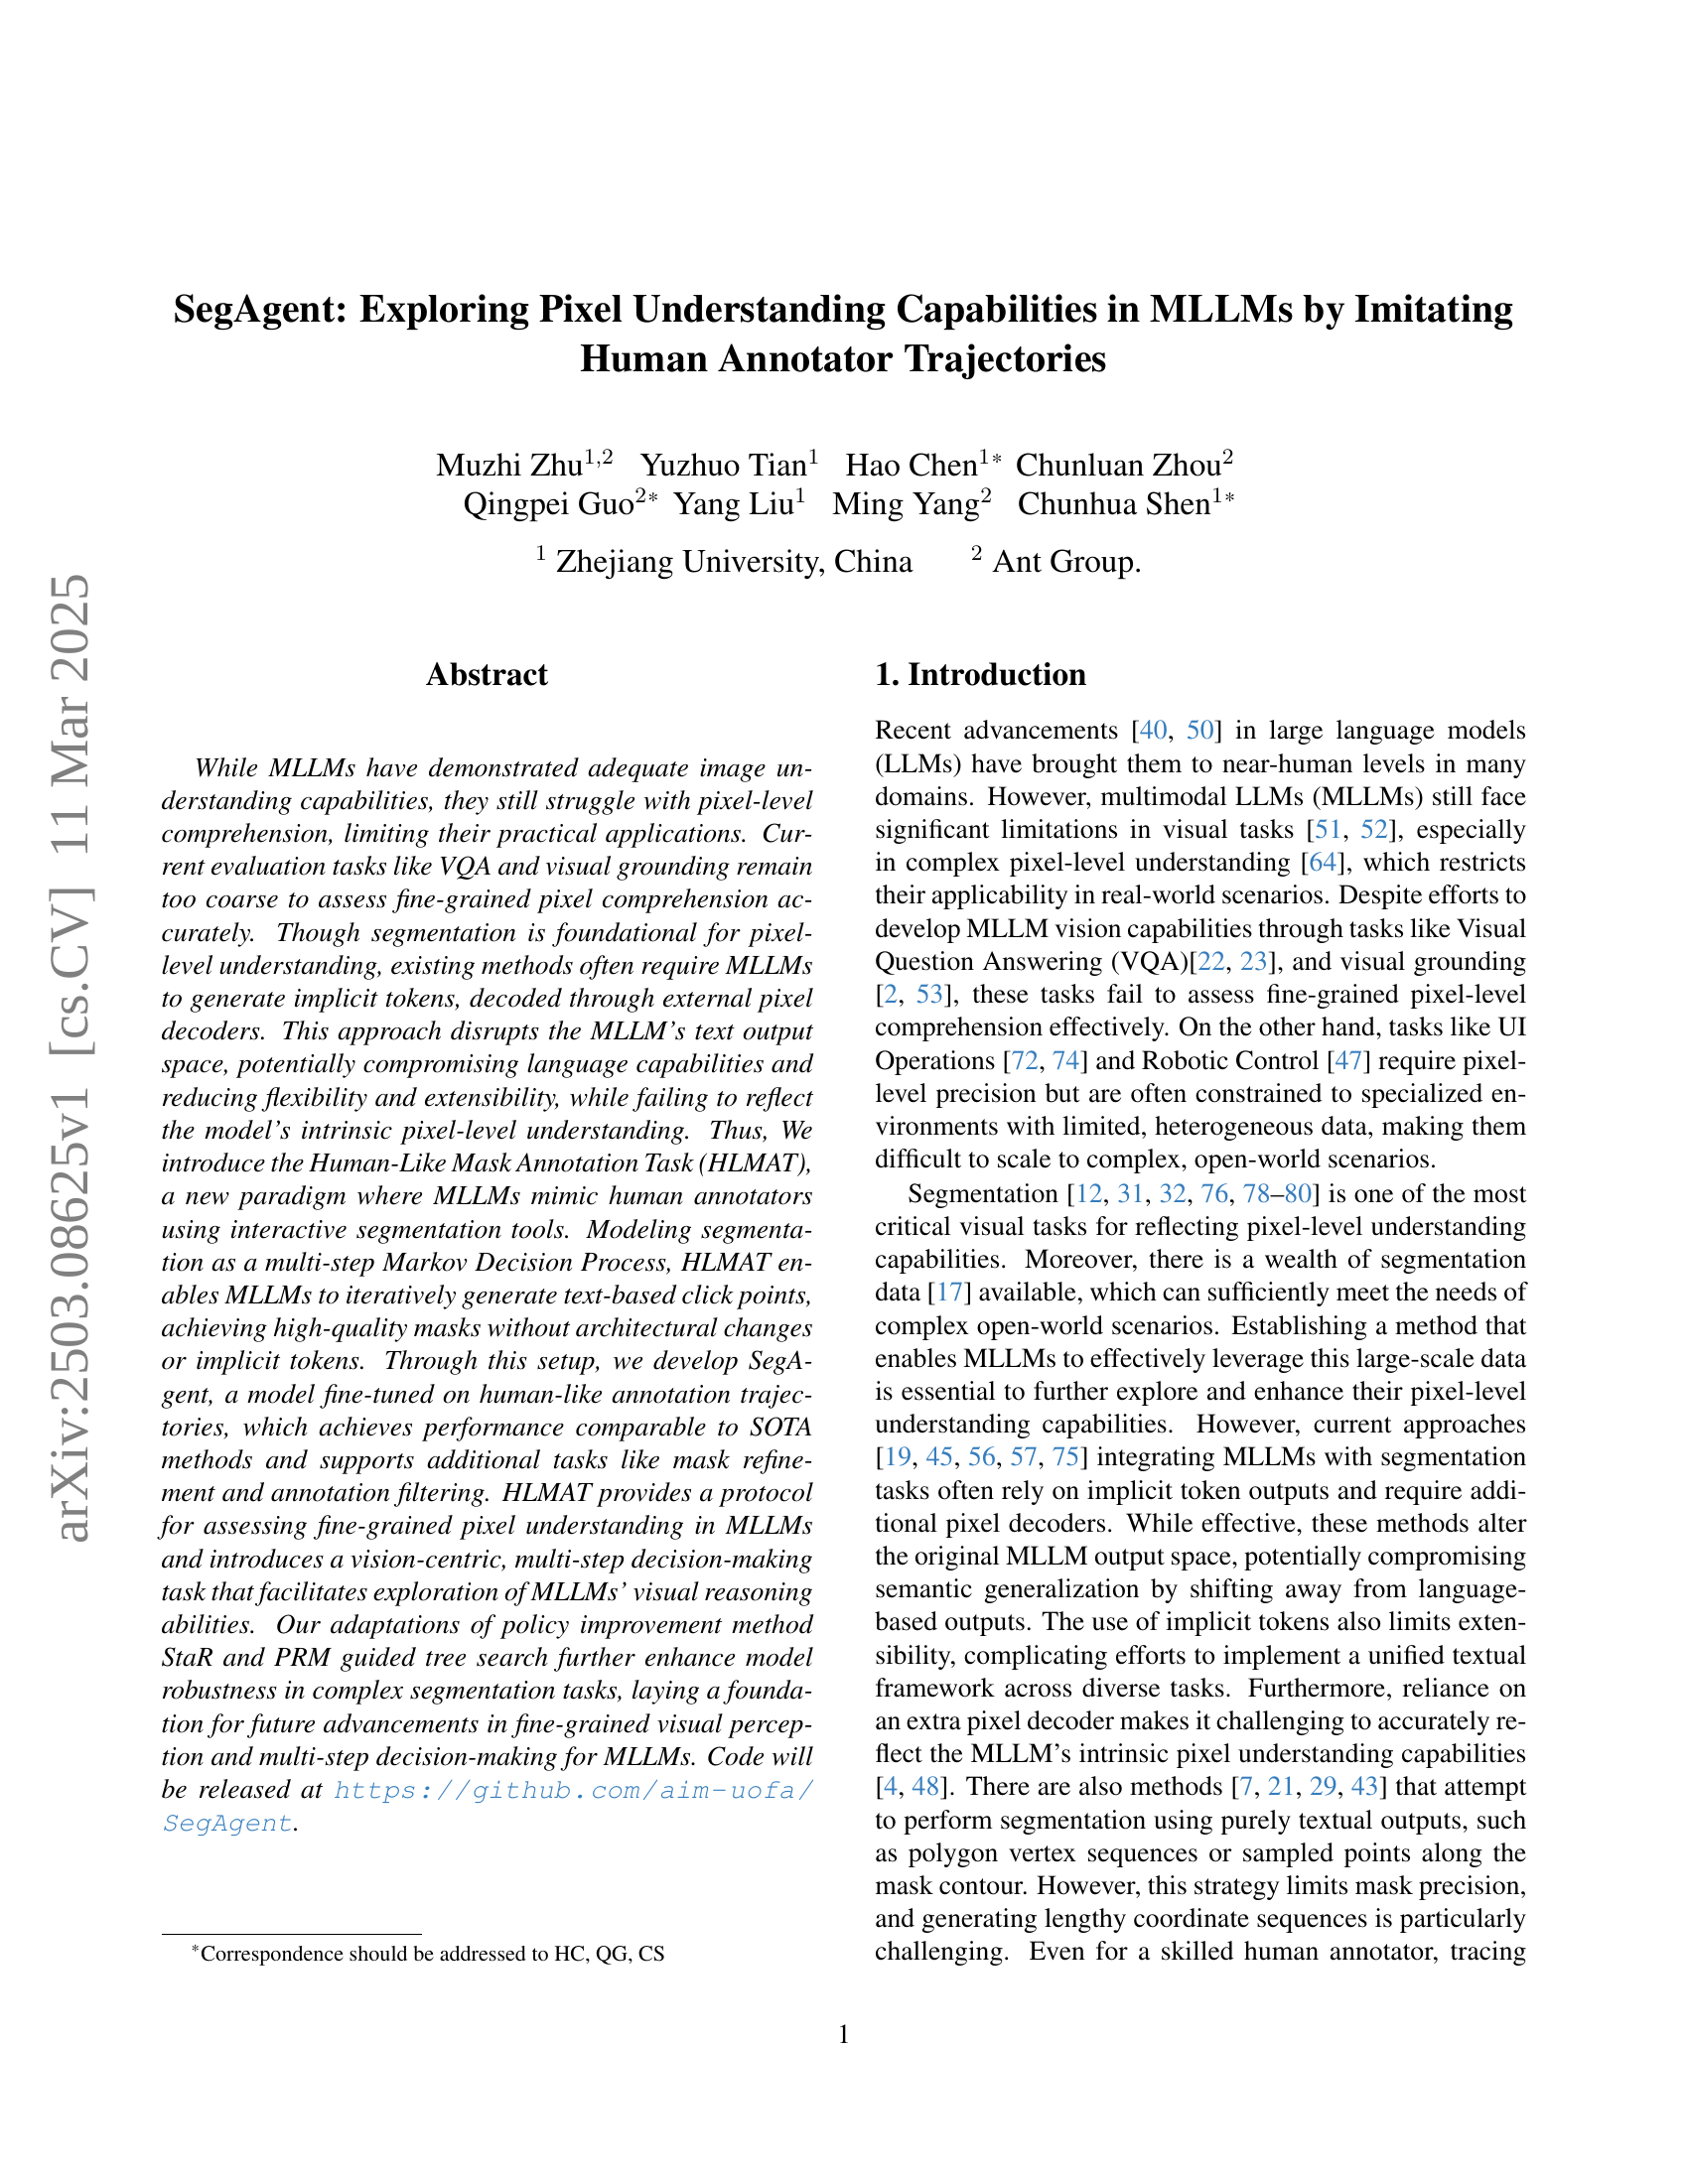
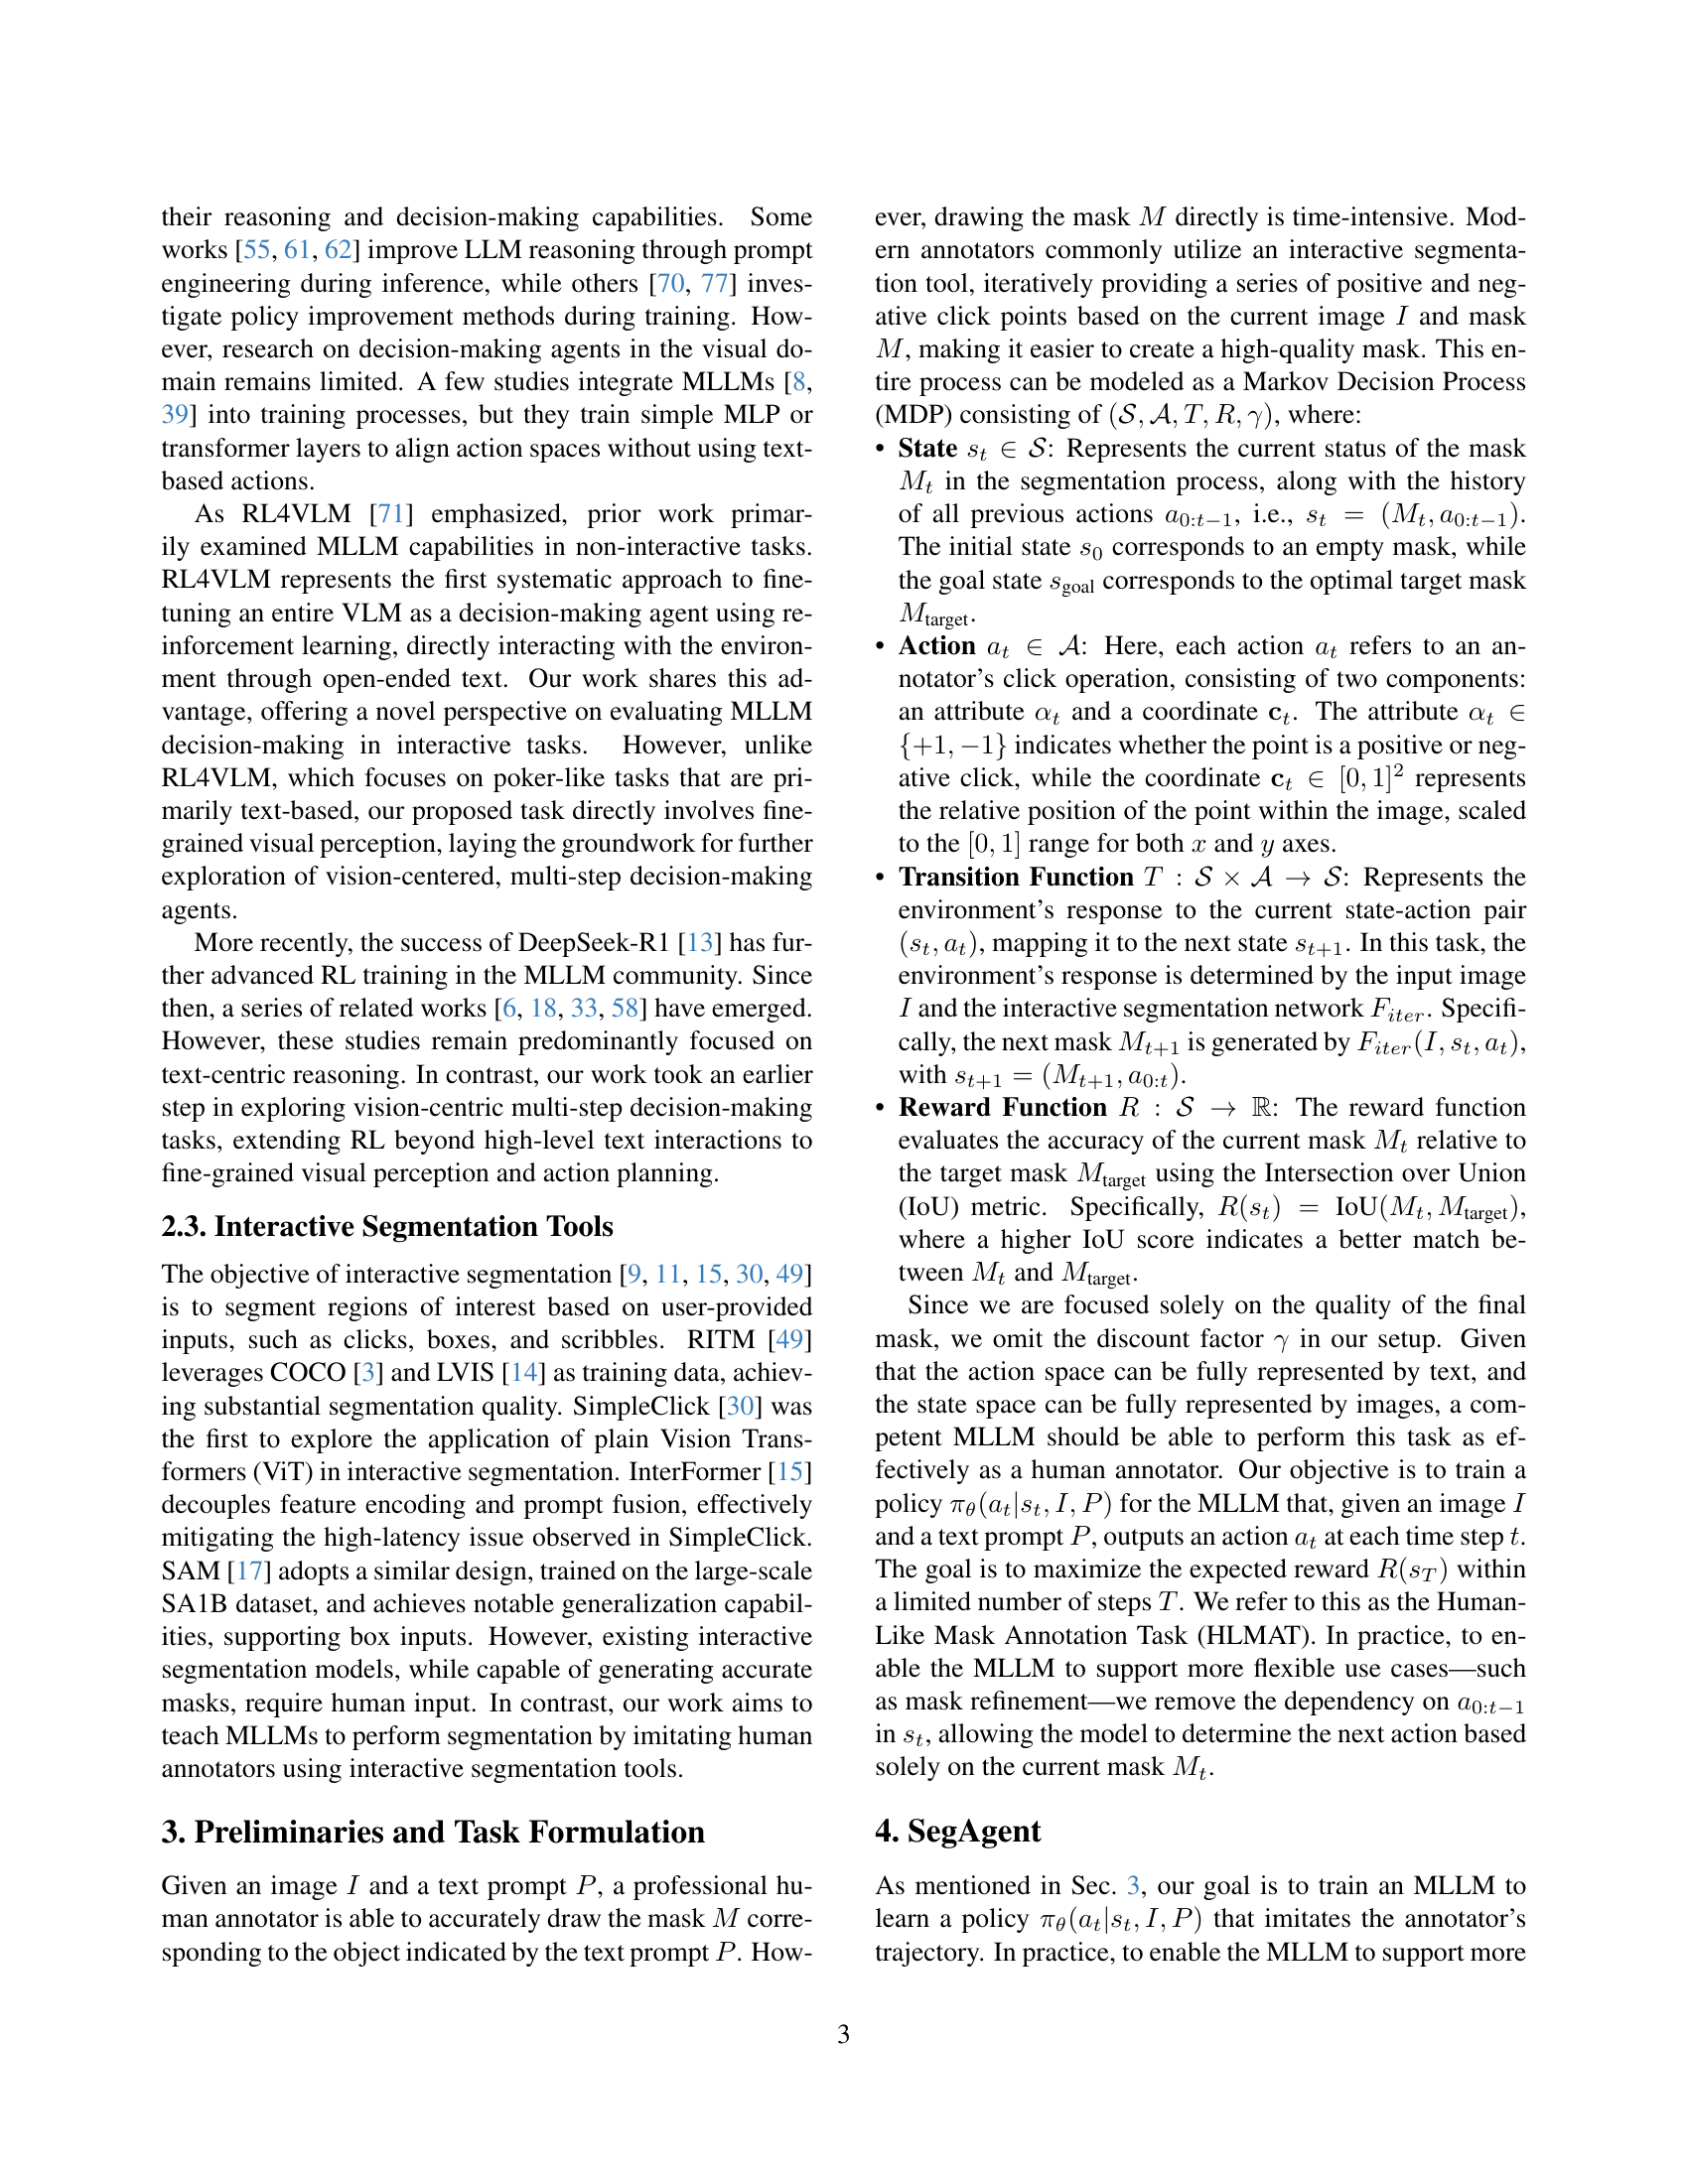
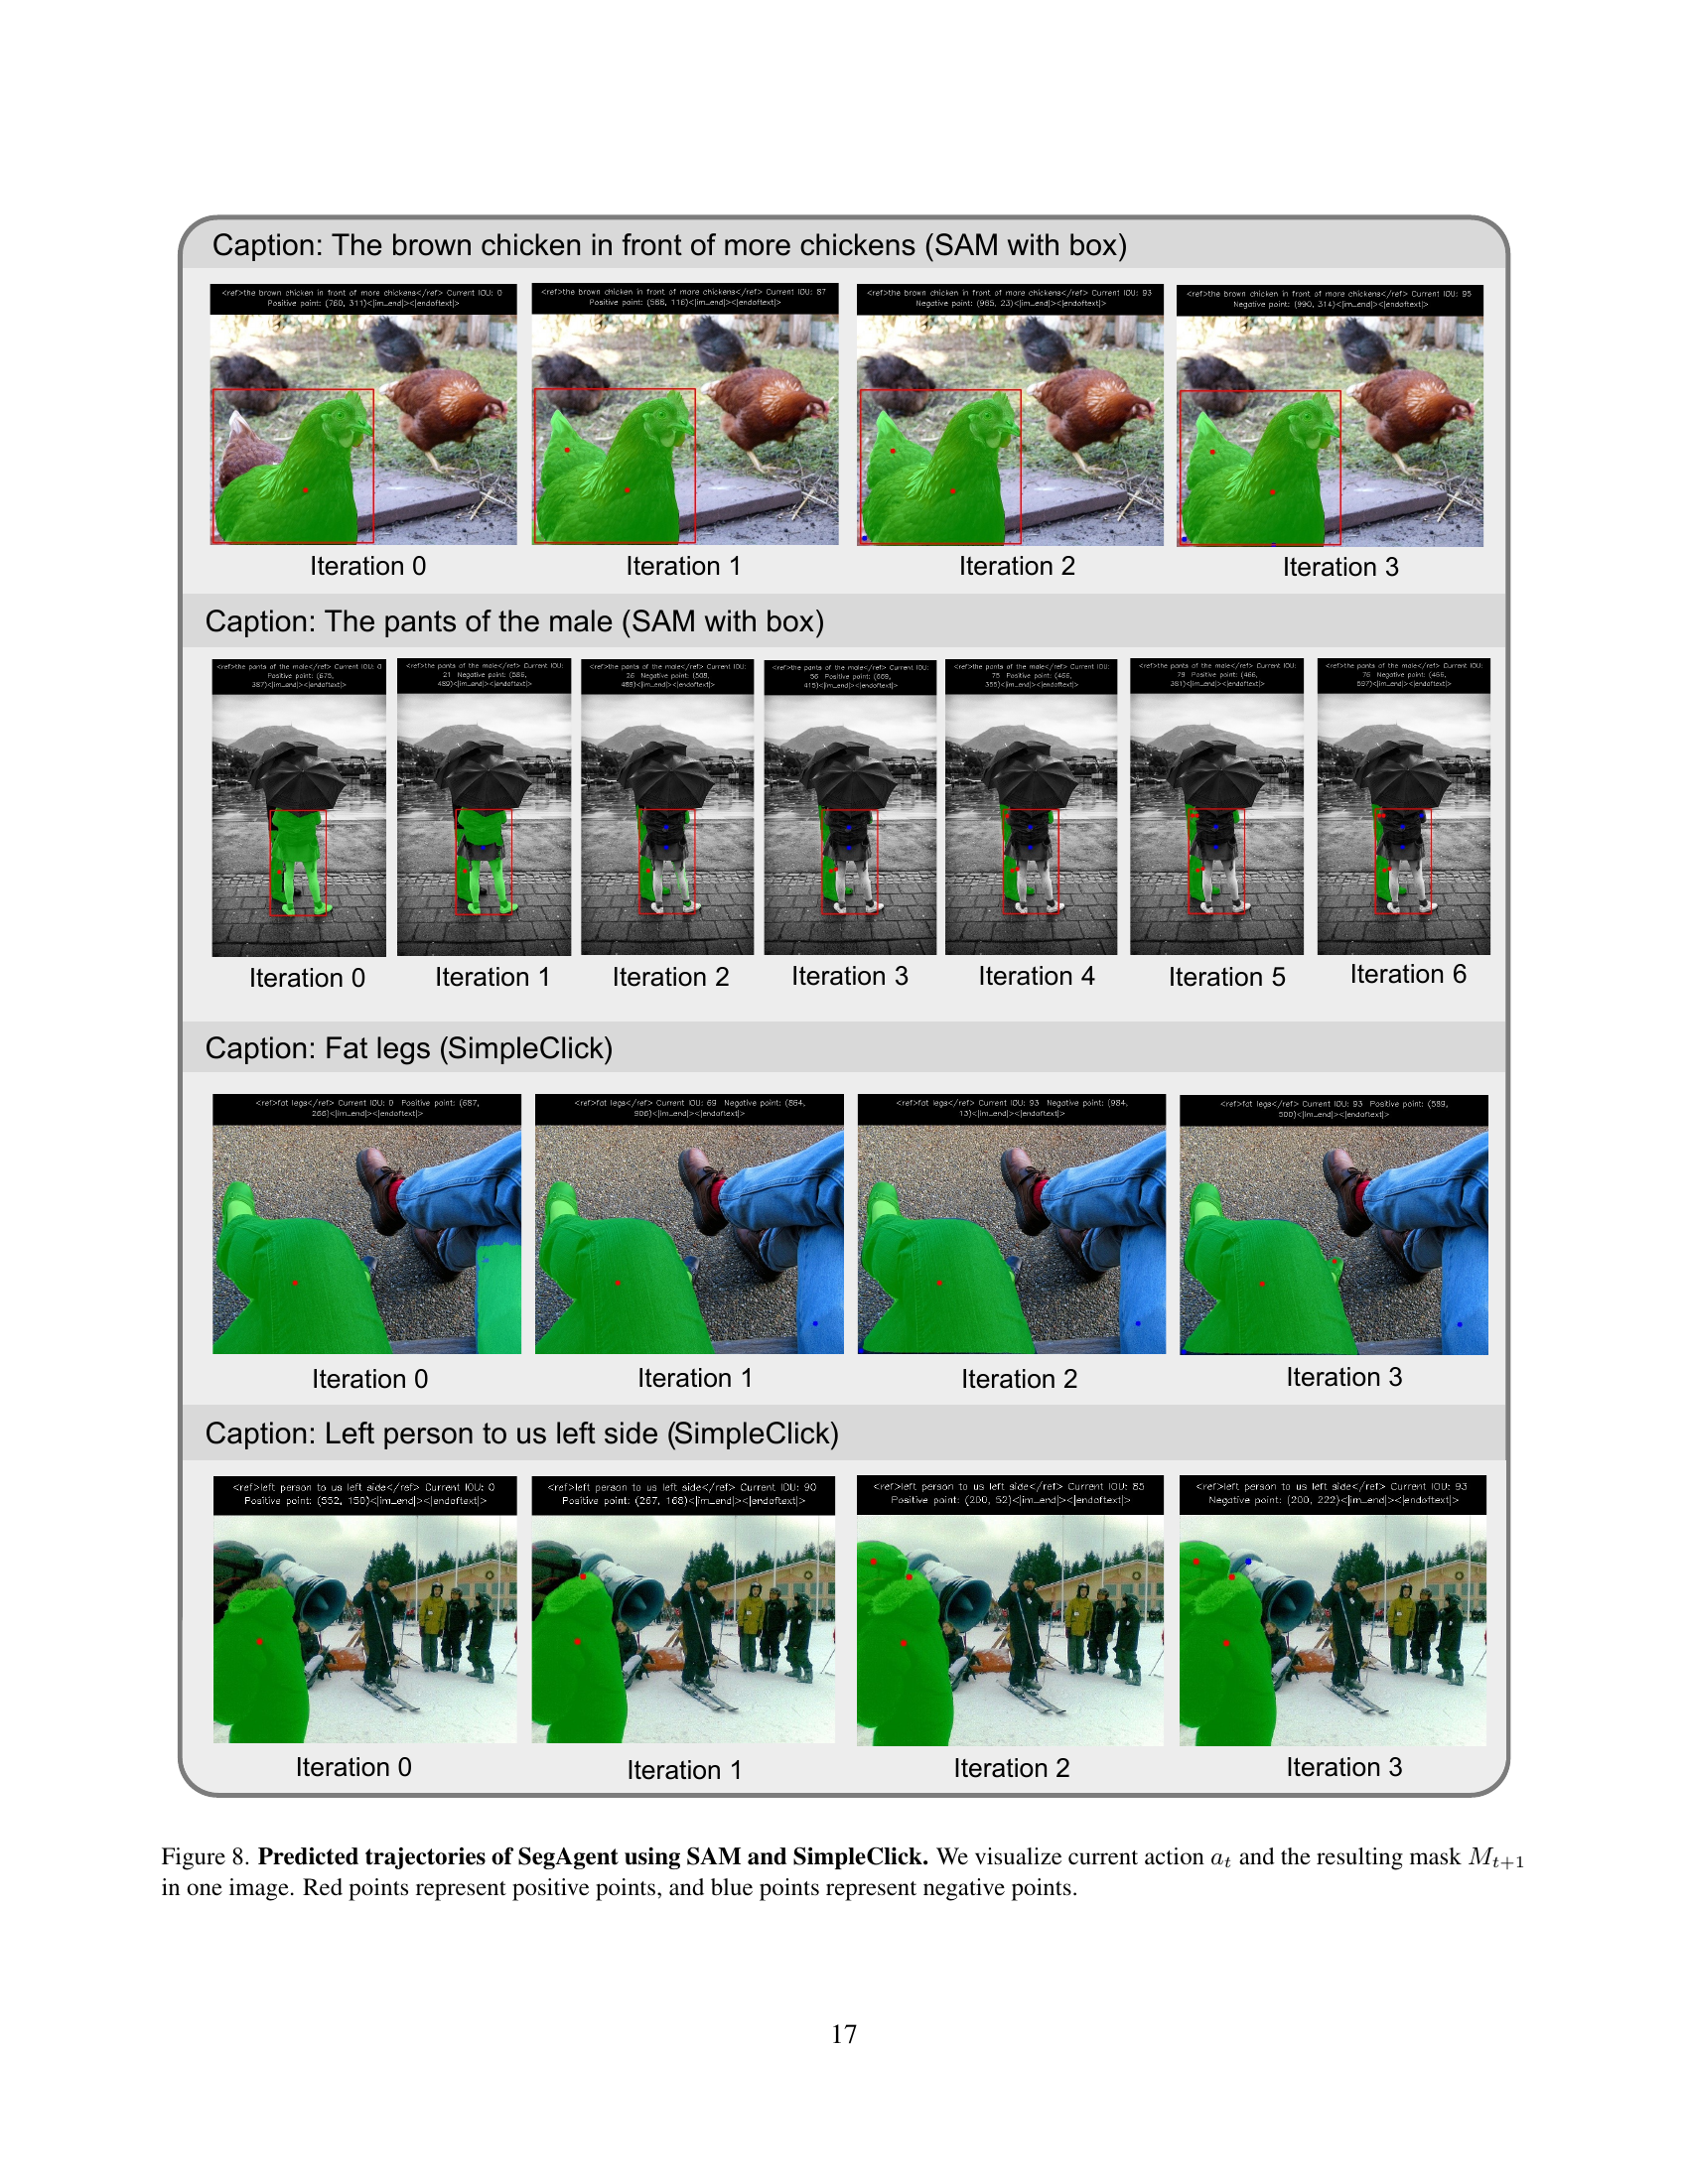
🔼 SegAgent is a model that imitates human annotators using interactive segmentation tools. This figure illustrates the SegAgent framework. An image and a text prompt are input into the MLLM (multimodal large language model), which then iteratively generates text-based coordinates representing clicks (positive or negative) for a segmentation tool. The segmentation tool updates a mask based on the clicks. The process continues until a satisfactory mask is produced. The lower part of the figure shows a sequence of iterations, with each step visualizing both the current action (click coordinates) and the resulting mask. The goal is to evaluate the MLLM’s pixel-level comprehension by assessing its ability to generate high-quality masks through this iterative process.
read the caption
Figure 1: The overall framework of SegAgent. The image below shows a complete set of trajectories. We visualize current action atsubscript𝑎𝑡a_{t}italic_a start_POSTSUBSCRIPT italic_t end_POSTSUBSCRIPT and the resulting mask Mt+1subscript𝑀𝑡1M_{t+1}italic_M start_POSTSUBSCRIPT italic_t + 1 end_POSTSUBSCRIPT in one image.
| Method | Venue | refCOCO | refCOCO+ | refCOCOg | |||||
|---|---|---|---|---|---|---|---|---|---|
| val | testA | testB | val | testA | testB | val(U) | test(U) | ||
| traditional methods | |||||||||
| MAttNet [67] | CVPR’18 | 56.51 | 62.37 | 51.70 | 46.67 | 52.39 | 40.08 | 47.64 | 48.61 |
| LAVT [59] | CVPR’22 | 72.7 | 75.8 | 68.8 | 62.1 | 68.4 | 55.1 | 61.2 | 62.1 |
| CRIS [54] | CVPR’22 | 70.5 | 73.2 | 66.1 | 65.3 | 68.1 | 53.7 | 59.9 | 60.4 |
| PolyFormer-L [29] | CVPR’23 | 76.94 | 78.49 | 74.83 | 72.15 | 75.71 | 66.73 | 71.15 | 71.17 |
| X-Decoder [81] | CVPR’23 | - | - | - | - | - | - | 64.6 | - |
| SEEM [82] | NeurIPS’23 | - | - | - | - | - | - | 65.7 | - |
| LLM based methods | |||||||||
| LISA(SAM) [19] | CVPR’24 | 74.9 | 79.1 | 72.3 | 65.1 | 70.8 | 58.1 | 67.9 | 70.6 |
| PixelLM [46] | CVPR’24 | 73.0 | 76.5 | 68.2 | 66.3 | 71.7 | 58.3 | 69.3 | 70.5 |
| PerceptionGPT [42] | CVPR’24 | 75.1 | 78.6 | 71.7 | 68.5 | 73.9 | 61.3 | 70.3 | 71.7 |
| GSVA(SAM) [56] | CVPR’24 | 77.2 | 78.9 | 73.5 | 65.9 | 69.6 | 59.8 | 72.7 | 73.3 |
| SAM4MLLM(Qwen) [10] | ECCV’24 | 77.1 | 80.9 | 72.5 | 71.5 | 76.8 | 64.7 | 74.5 | 75.2 |
| Qwen box [2] + SAM | - | 71.79 | 75.20 | 67.29 | 65.39 | 71.62 | 59.12 | 66.93 | 68.94 |
| Our methods | |||||||||
| SegAgent-LLaVA+SAM | this work | 79.20 | 81.44 | 75.72 | 71.53 | 76.68 | 65.44 | 74.80 | 74.90 |
| SegAgent-Qwen+SAM | 78.01 | 80.34 | 74.98 | 70.86 | 75.52 | 65.75 | 74.49 | 74.62 | |
| SegAgent-LLaVA+SClick | 77.81 | 80.03 | 74.12 | 66.73 | 71.16 | 59.89 | 70.45 | 71.25 | |
| SegAgent-Qwen+SClick | 79.69 | 81.35 | 76.57 | 72.49 | 75.80 | 66.89 | 75.11 | 75.20 | |
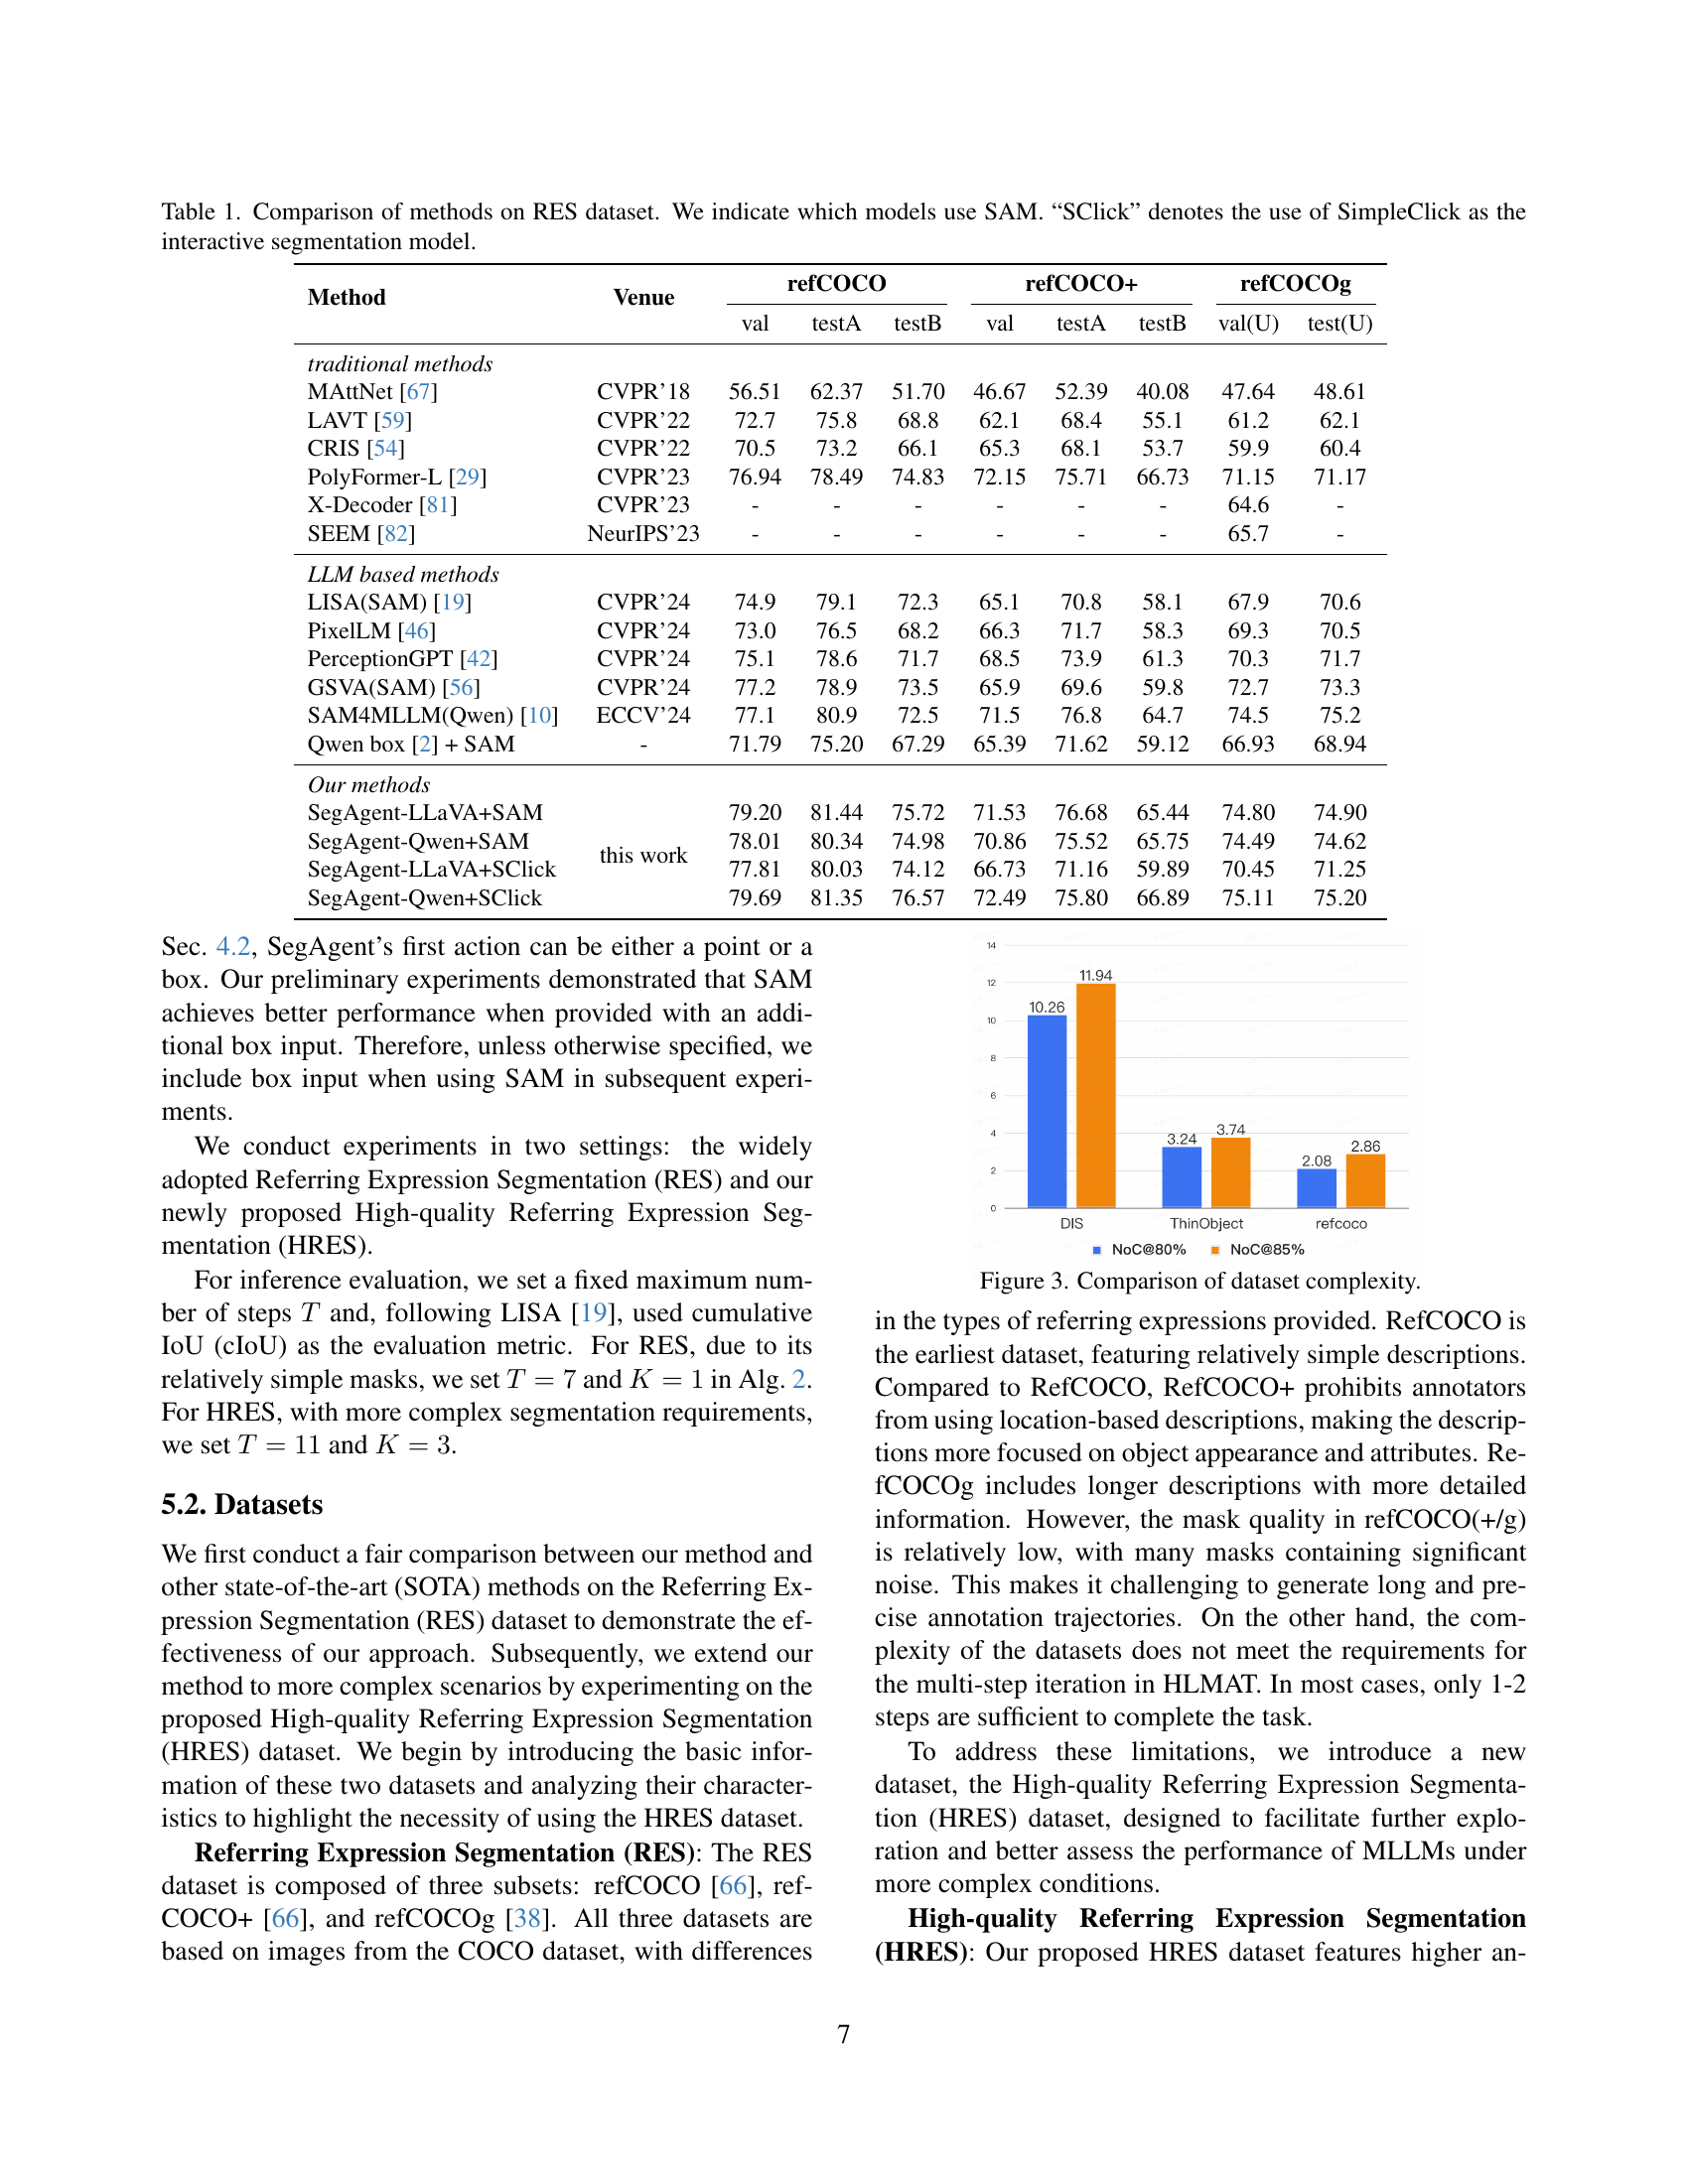
🔼 This table presents a quantitative comparison of different methods’ performance on the Referring Expression Segmentation (RES) dataset. It specifically contrasts traditional computer vision methods with more recent approaches leveraging Large Language Models (LLMs). The table highlights the performance (measured likely by Intersection over Union or IoU) of each method across three subsets of the RES dataset: refCOCO, refCOCO+, and refCOCOg. The table also distinguishes whether a method uses the Segment Anything Model (SAM) or the SimpleClick interactive segmentation model, showcasing the impact of these different tools on overall performance.
read the caption
Table 1: Comparison of methods on RES dataset. We indicate which models use SAM. “SClick” denotes the use of SimpleClick as the interactive segmentation model.
In-depth insights#
HLMAT: A New Task#
While ‘HLMAT: A New Task’ isn’t directly from the text, it suggests a novel task-centric approach, likely focusing on Human-Like Mask Annotation. This highlights a shift towards more realistic simulation of human annotators’ behaviors in image segmentation. The task likely demands fine-grained pixel understanding from MLLMs. It introduces a vision-centric, multi-step decision-making process, moving beyond simple image understanding towards interactive, iterative annotation. This approach allows MLLMs to learn from human-like annotation trajectories using interactive segmentation tools. The core idea would be to mimic the steps a human would take during segmentation, using iterative refinement and feedback. HLMAT promises a more nuanced and comprehensive method for evaluating and advancing MLLMs’ visual reasoning skills, fostering more accurate and flexible AI systems.
SegAgent Details#
The paper likely delves into the specifics of the SegAgent model, a system designed to perform image segmentation by imitating human annotators. Model architecture details such as the vision encoder and LLM are probably covered, highlighting key components like ConvNeXt-L CLIP or Qwen-VL-Chat. Hyperparameter settings, including learning rates, batch sizes, and training epochs, would be specified to allow for reproducibility. A crucial aspect is the prompt engineering, detailing how instructions are formatted for the LLM to guide its segmentation process. Further discussion of the architecture could show details about the VIT structure utilized. The coordinate formats employed would be discussed, and the rationale behind the specific choices could be highlighted.
Iterative Refinement#
Iterative refinement is a crucial aspect of many computer vision tasks, as it allows models to progressively improve their predictions by repeatedly refining an initial estimate. In segmentation, this could involve starting with a coarse mask and then iteratively adjusting its boundaries based on local image features and contextual information. This approach is particularly useful for handling complex shapes and ambiguous regions, where a single-pass prediction might be insufficient. The success of iterative refinement depends on several factors, including the quality of the initial estimate, the effectiveness of the refinement mechanism, and the stopping criterion. A well-designed iterative refinement strategy can lead to significant improvements in segmentation accuracy and robustness.
HRES Dataset#
Based on the paper, the High-quality Referring Expression Segmentation (HRES) dataset is a novel contribution designed to address the limitations of existing datasets like RefCOCO, which lack the complexity and annotation quality needed for multi-step reasoning in MLLMs. The authors note that RefCOCO’s masks often contain noise and don’t require extensive iterative refinement. HRES utilizes subsets from HQSeg-44K, specifically DIS5K and ThinObject5K, which offer more detailed and precise annotations of complex objects. DIS5K focuses on high-resolution images with binary segmentation masks, while ThinObject5K targets objects with thin structures like insect legs. This is crucial for evaluating MLLMs’ fine-grained pixel understanding and ability to refine masks over multiple steps, ultimately enabling more robust and reliable performance in challenging segmentation scenarios. This dataset is key because it enables a focus on visual understanding, and more robust evaluation of MLLMs.
Future MLLM Agent#
If we envision “Future MLLM Agents,” several key directions emerge from this paper’s context. The core idea of enabling fine-grained pixel understanding in MLLMs opens up a path toward more capable agents. The approach of imitating human annotator trajectories is interesting because it leverages the existing interaction data. These agents would likely perform complex tasks demanding visual reasoning and precise manipulation. HLMAT acts as a way to explore and advance the MLLMs’ visual capabilities. The framework allows for a more direct assessment of the MLLMs’ ability to process and understand visual information at the pixel level. Additionally, the integration of techniques like StaR+ and tree search with PRM hints at more robust and reliable agents that can overcome noisy or ambiguous environments.
More visual insights#
More on figures

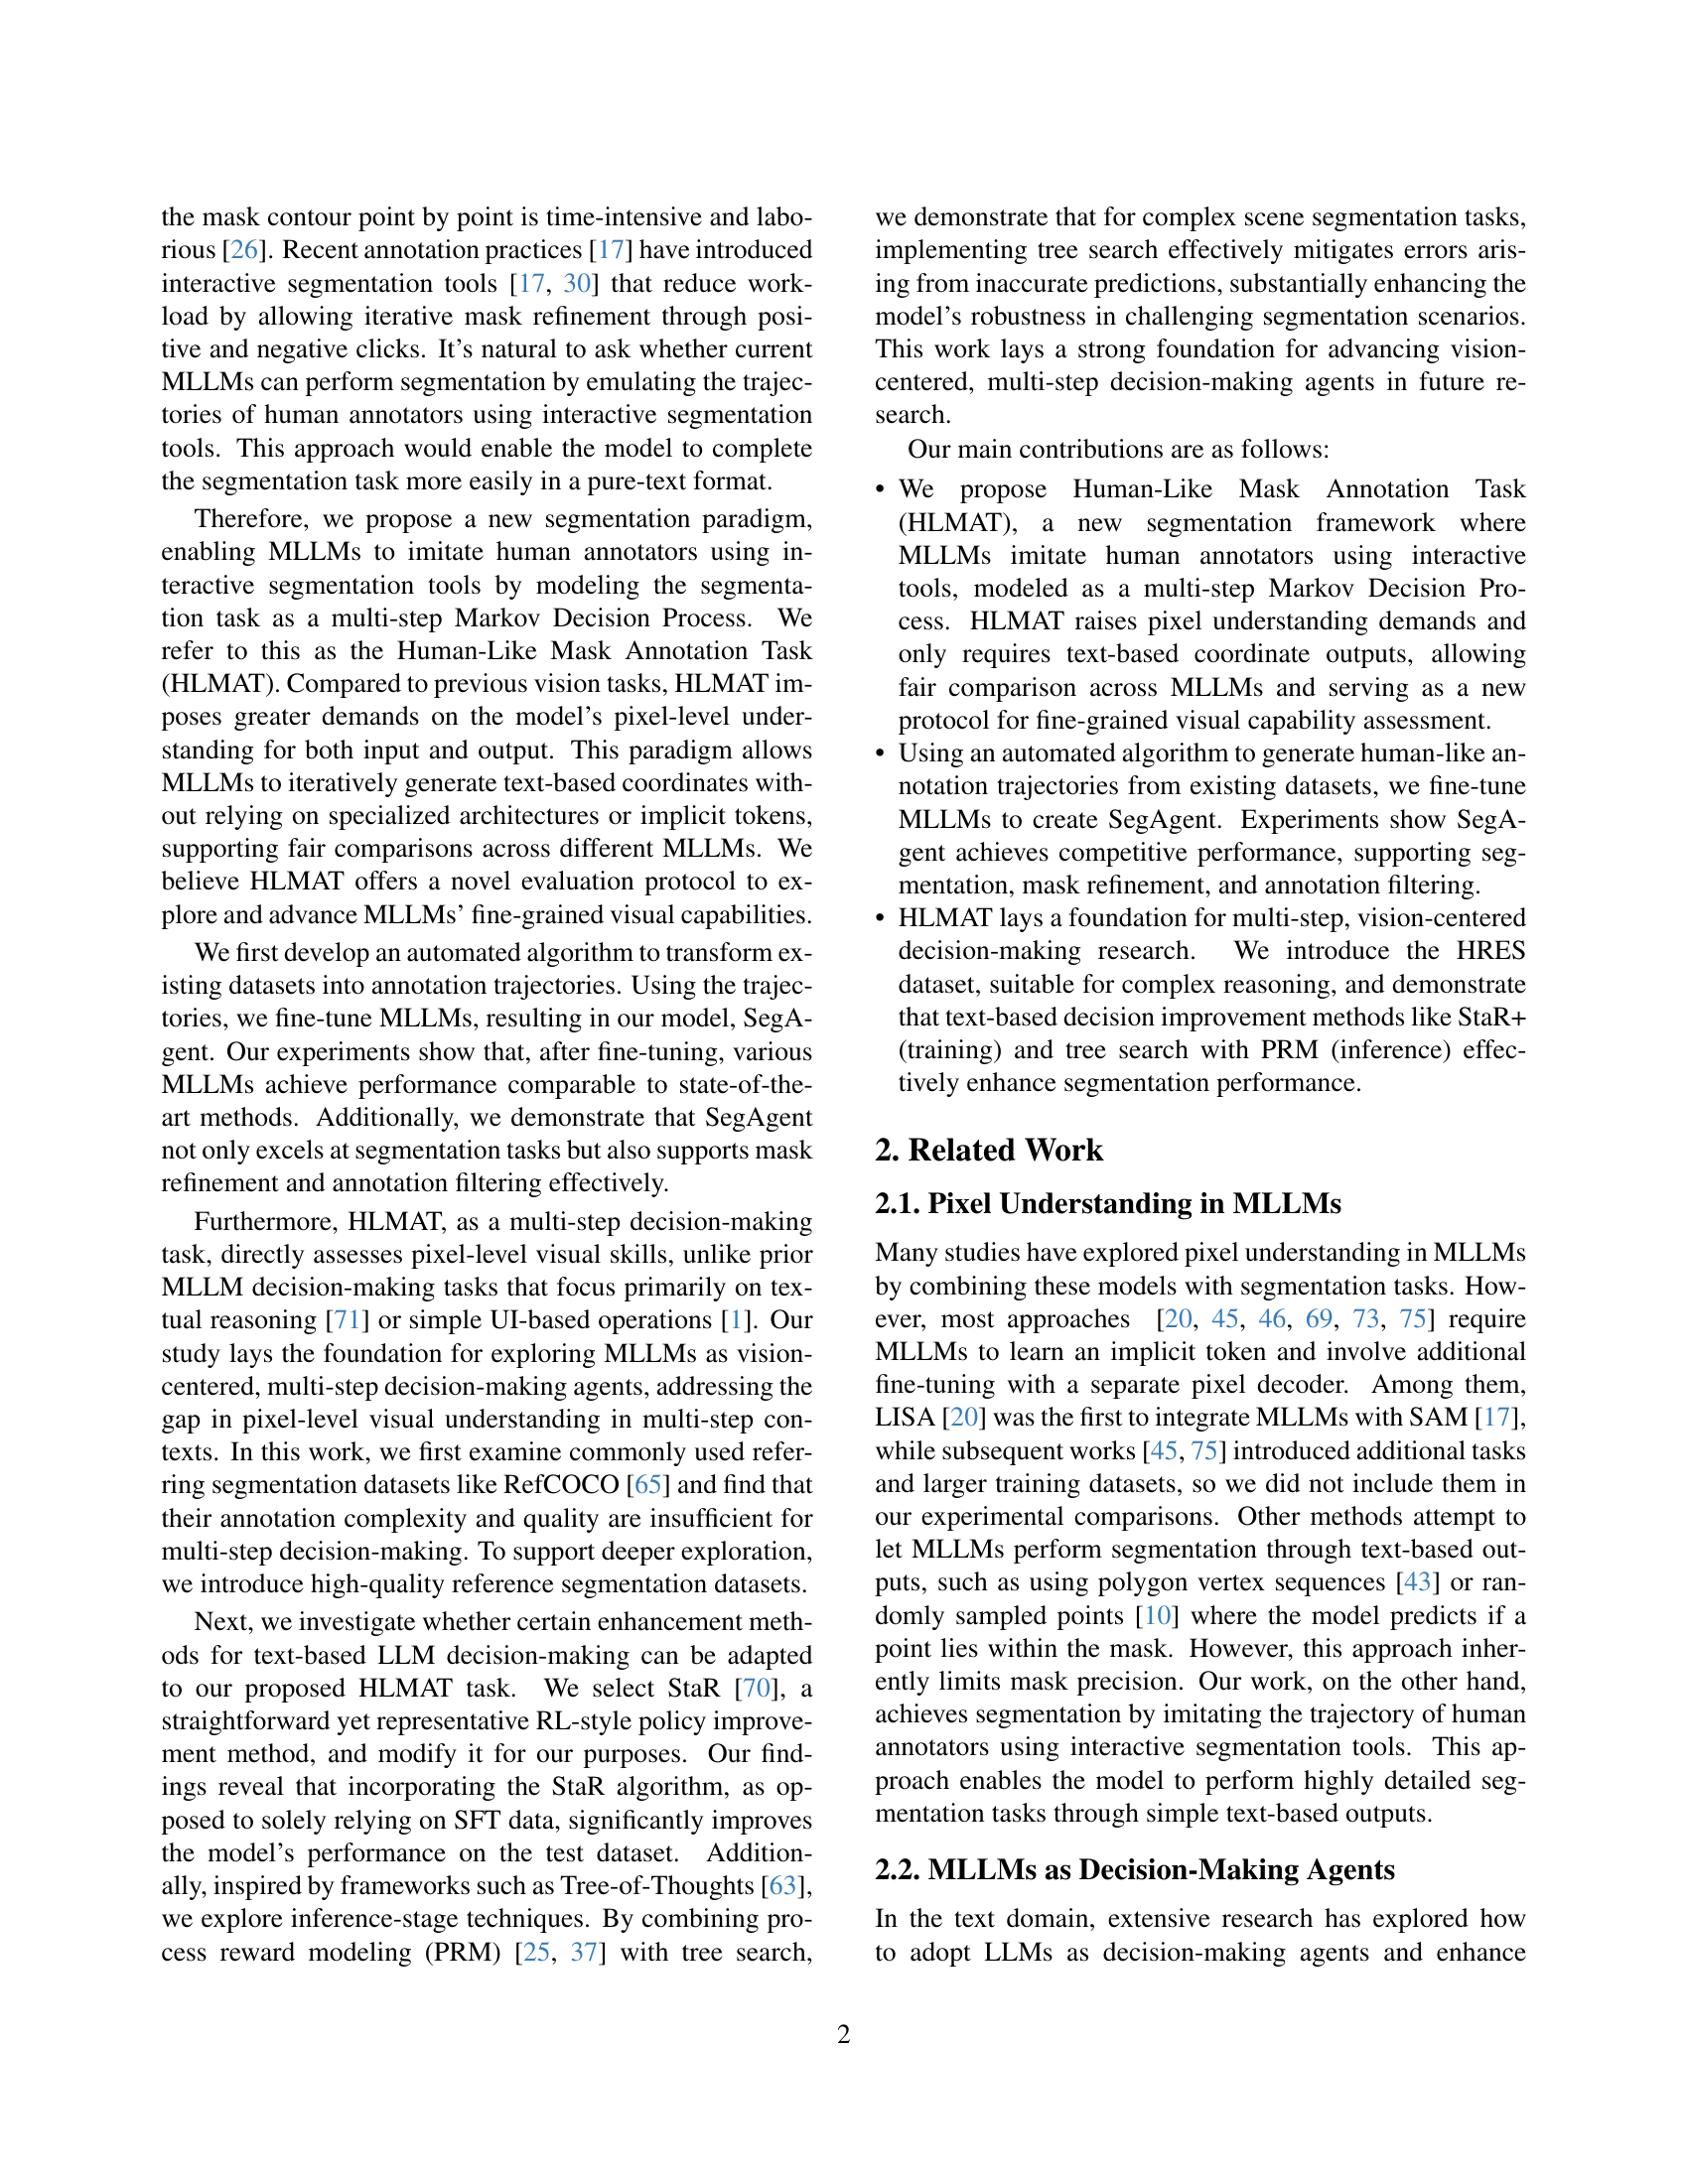
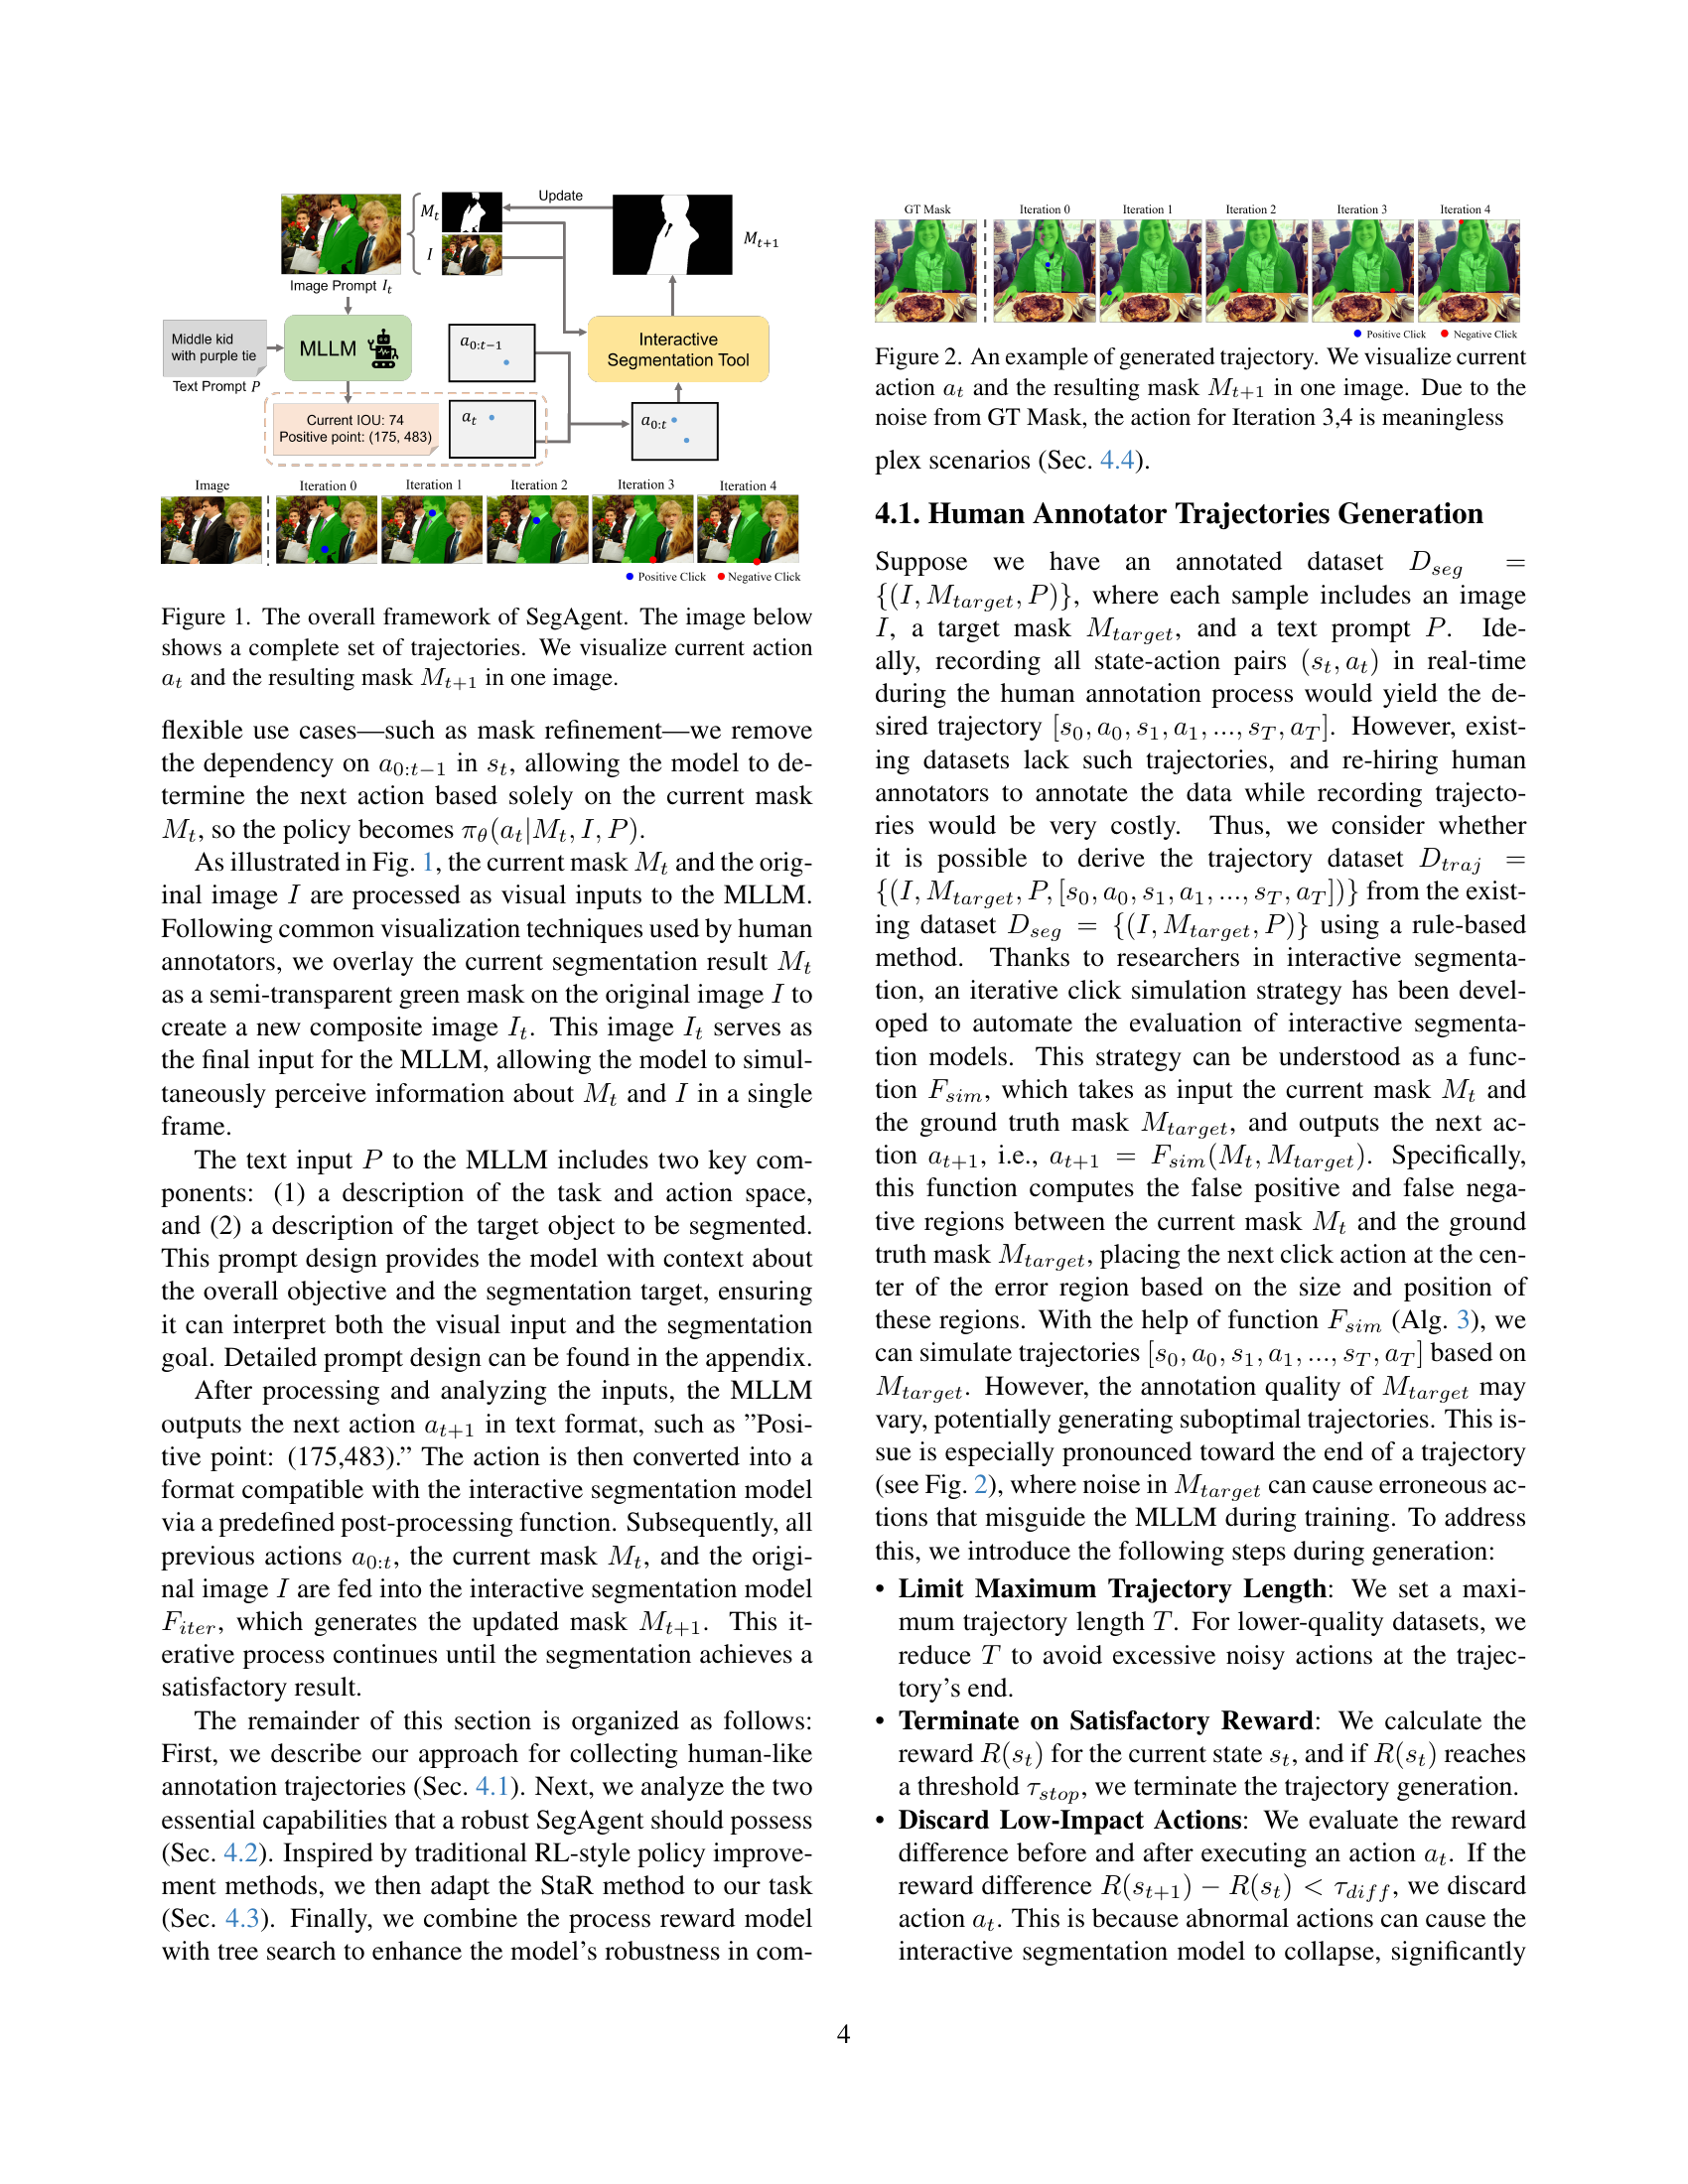
🔼 This figure visualizes a generated trajectory from an automated algorithm that simulates human-like mask annotation. Each image shows the mask at a particular iteration, along with the current action (a positive or negative click) represented by a point on the image. Iteration 0 begins with an empty mask, and subsequent iterations show how the mask is refined based on the sequential actions. The trajectory generation is based on the ground truth (GT) mask; however, the GT mask contains noise, resulting in the last two actions (Iteration 3,4) being meaningless and not contributing to the overall mask refinement. The visualization helps illustrate the process of iterative mask creation using simulated human actions.
read the caption
Figure 2: An example of generated trajectory. We visualize current action atsubscript𝑎𝑡a_{t}italic_a start_POSTSUBSCRIPT italic_t end_POSTSUBSCRIPT and the resulting mask Mt+1subscript𝑀𝑡1M_{t+1}italic_M start_POSTSUBSCRIPT italic_t + 1 end_POSTSUBSCRIPT in one image. Due to the noise from GT Mask, the action for Iteration 3,4 is meaningless

🔼 The bar chart visualizes the complexity of three datasets: DIS5K, ThinObject5K, and refcoco. The complexity is measured by the average number of clicks needed to achieve 80% and 85% Intersection over Union (IoU) during interactive image segmentation. The chart clearly shows that DIS5K and ThinObject5K require significantly more clicks than refcoco, indicating a higher complexity level in the former two datasets. This difference is due to the inherent characteristics of the datasets, such as the presence of more intricate object boundaries and finer-grained details in DIS5K and ThinObject5K compared to refcoco. Therefore, the datasets DIS5K and ThinObject5K are more challenging and appropriate for evaluating the pixel-level understanding capabilities of a model.
read the caption
Figure 3: Comparison of dataset complexity.

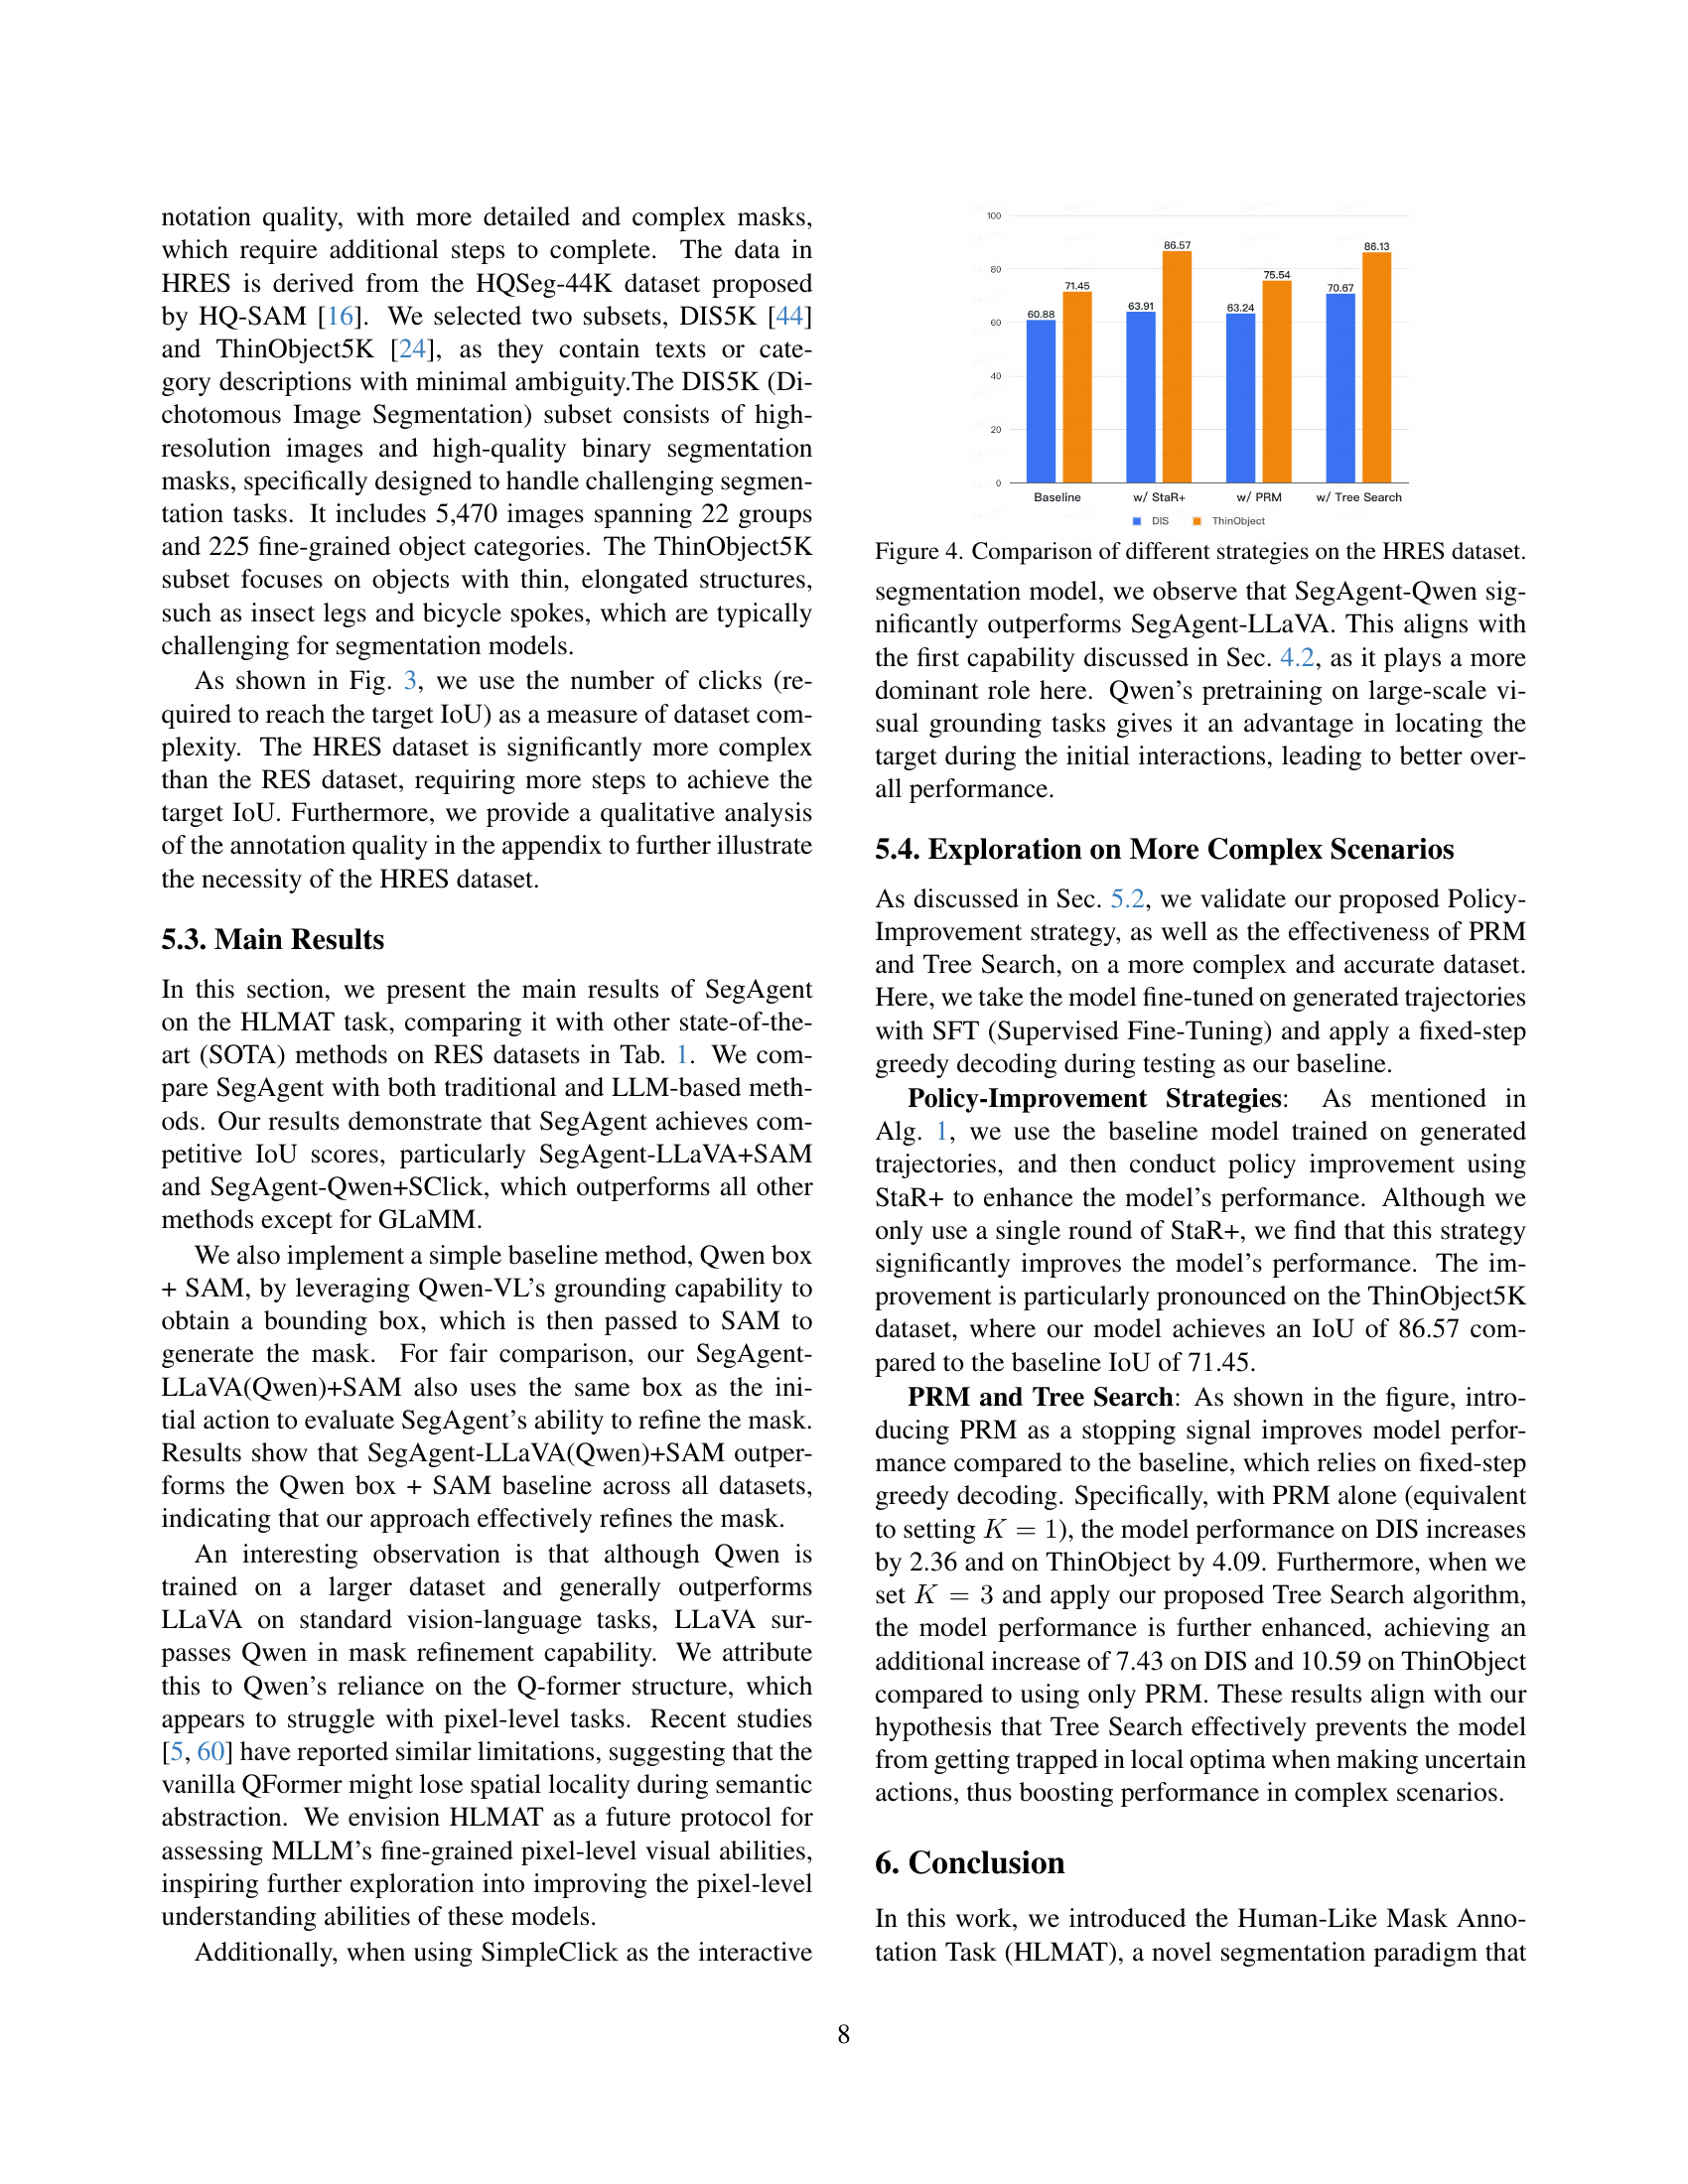
🔼 The bar chart compares the performance of different strategies for image segmentation on the HRES dataset. The baseline strategy uses a model fine-tuned with supervised fine-tuning (SFT) and a fixed-step greedy decoding method during testing. The chart then shows performance improvements achieved by incorporating policy improvement methods (StaR+), process reward modeling (PRM), and the addition of tree search. The improvements are shown for both the DIS and ThinObject subsets of the HRES dataset, illustrating the effectiveness of each method in enhancing segmentation accuracy in complex scenarios.
read the caption
Figure 4: Comparison of different strategies on the HRES dataset.

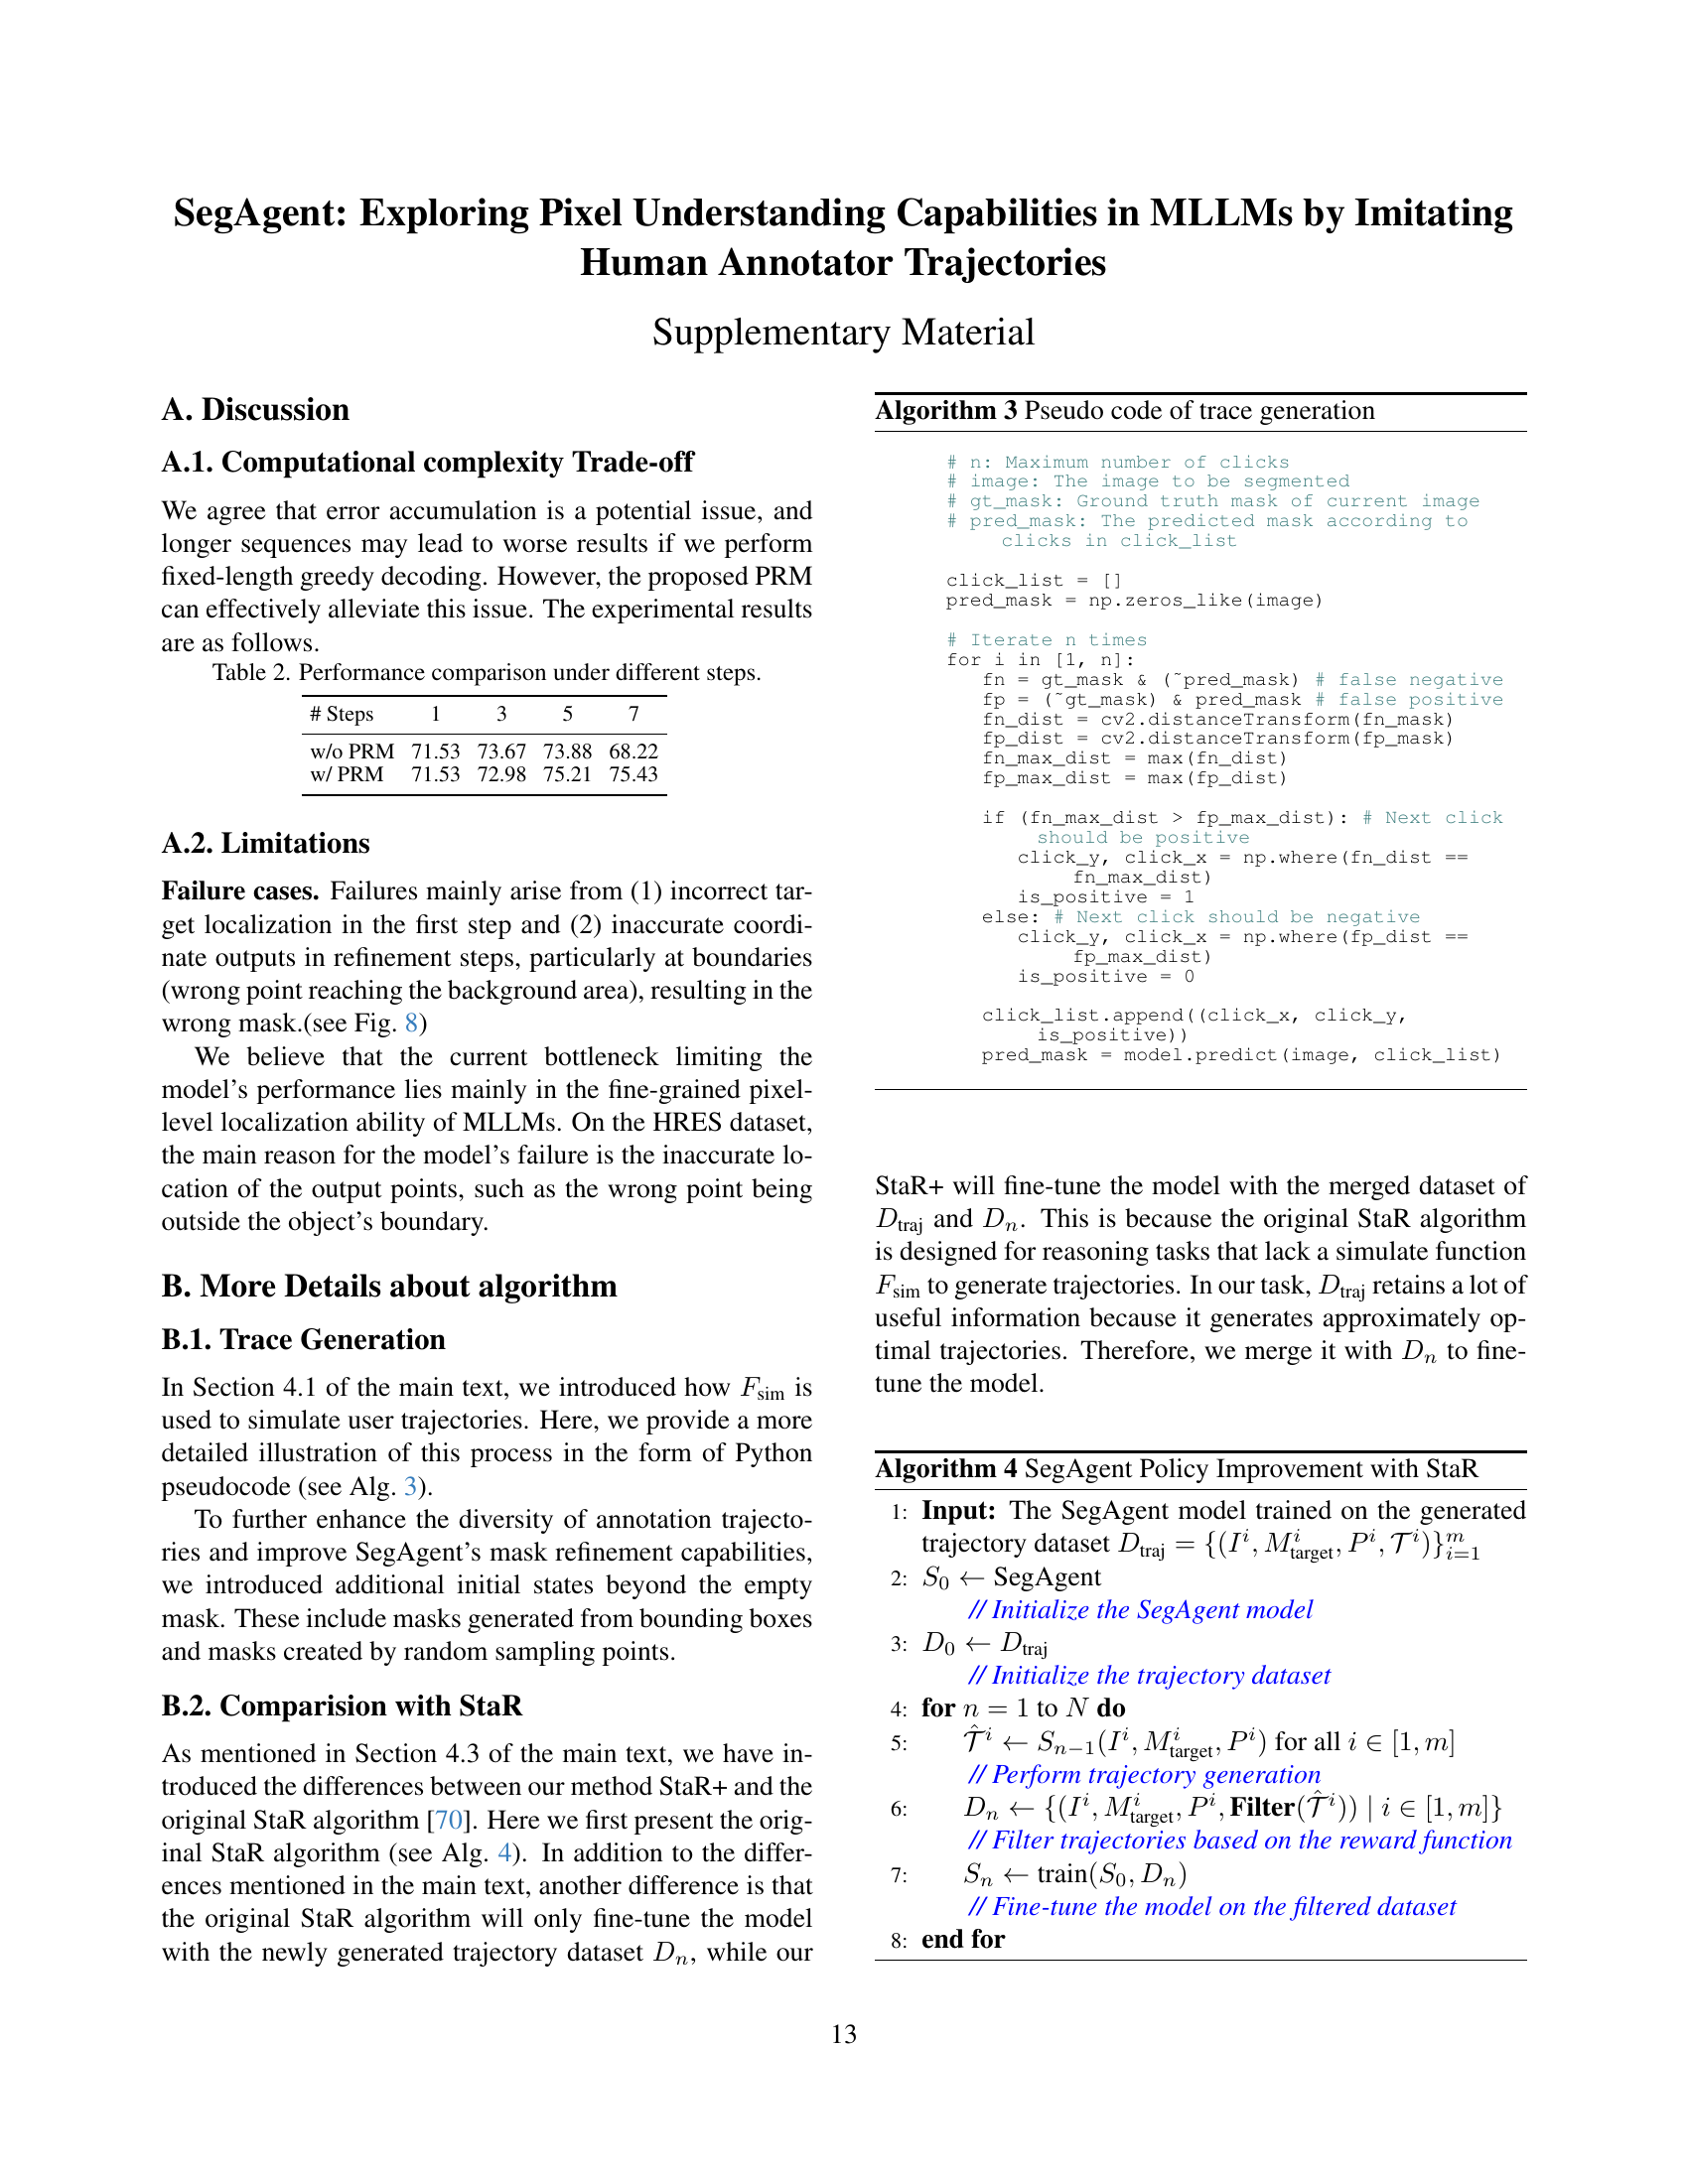
🔼 This figure illustrates the process of PRM-guided tree search used in SegAgent for interactive image segmentation. The model begins with an initial mask and image. At each step, it generates multiple candidate actions (positive or negative clicks). It uses a PRM (Process Reward Model) to predict the reward (measured by IoU) for each action, selecting the action with the highest predicted reward. The chosen action is then input to the interactive segmentation tool to update the mask. This iterative process repeats until a satisfactory mask is produced or a predetermined number of steps is reached. The visualization shows the progression of the mask at each step and the corresponding predicted rewards.
read the caption
Figure 5: An illustrative example of PRM-guided tree search. The model predicts the reward at each step and selects the action with the highest reward to generate the next mask.

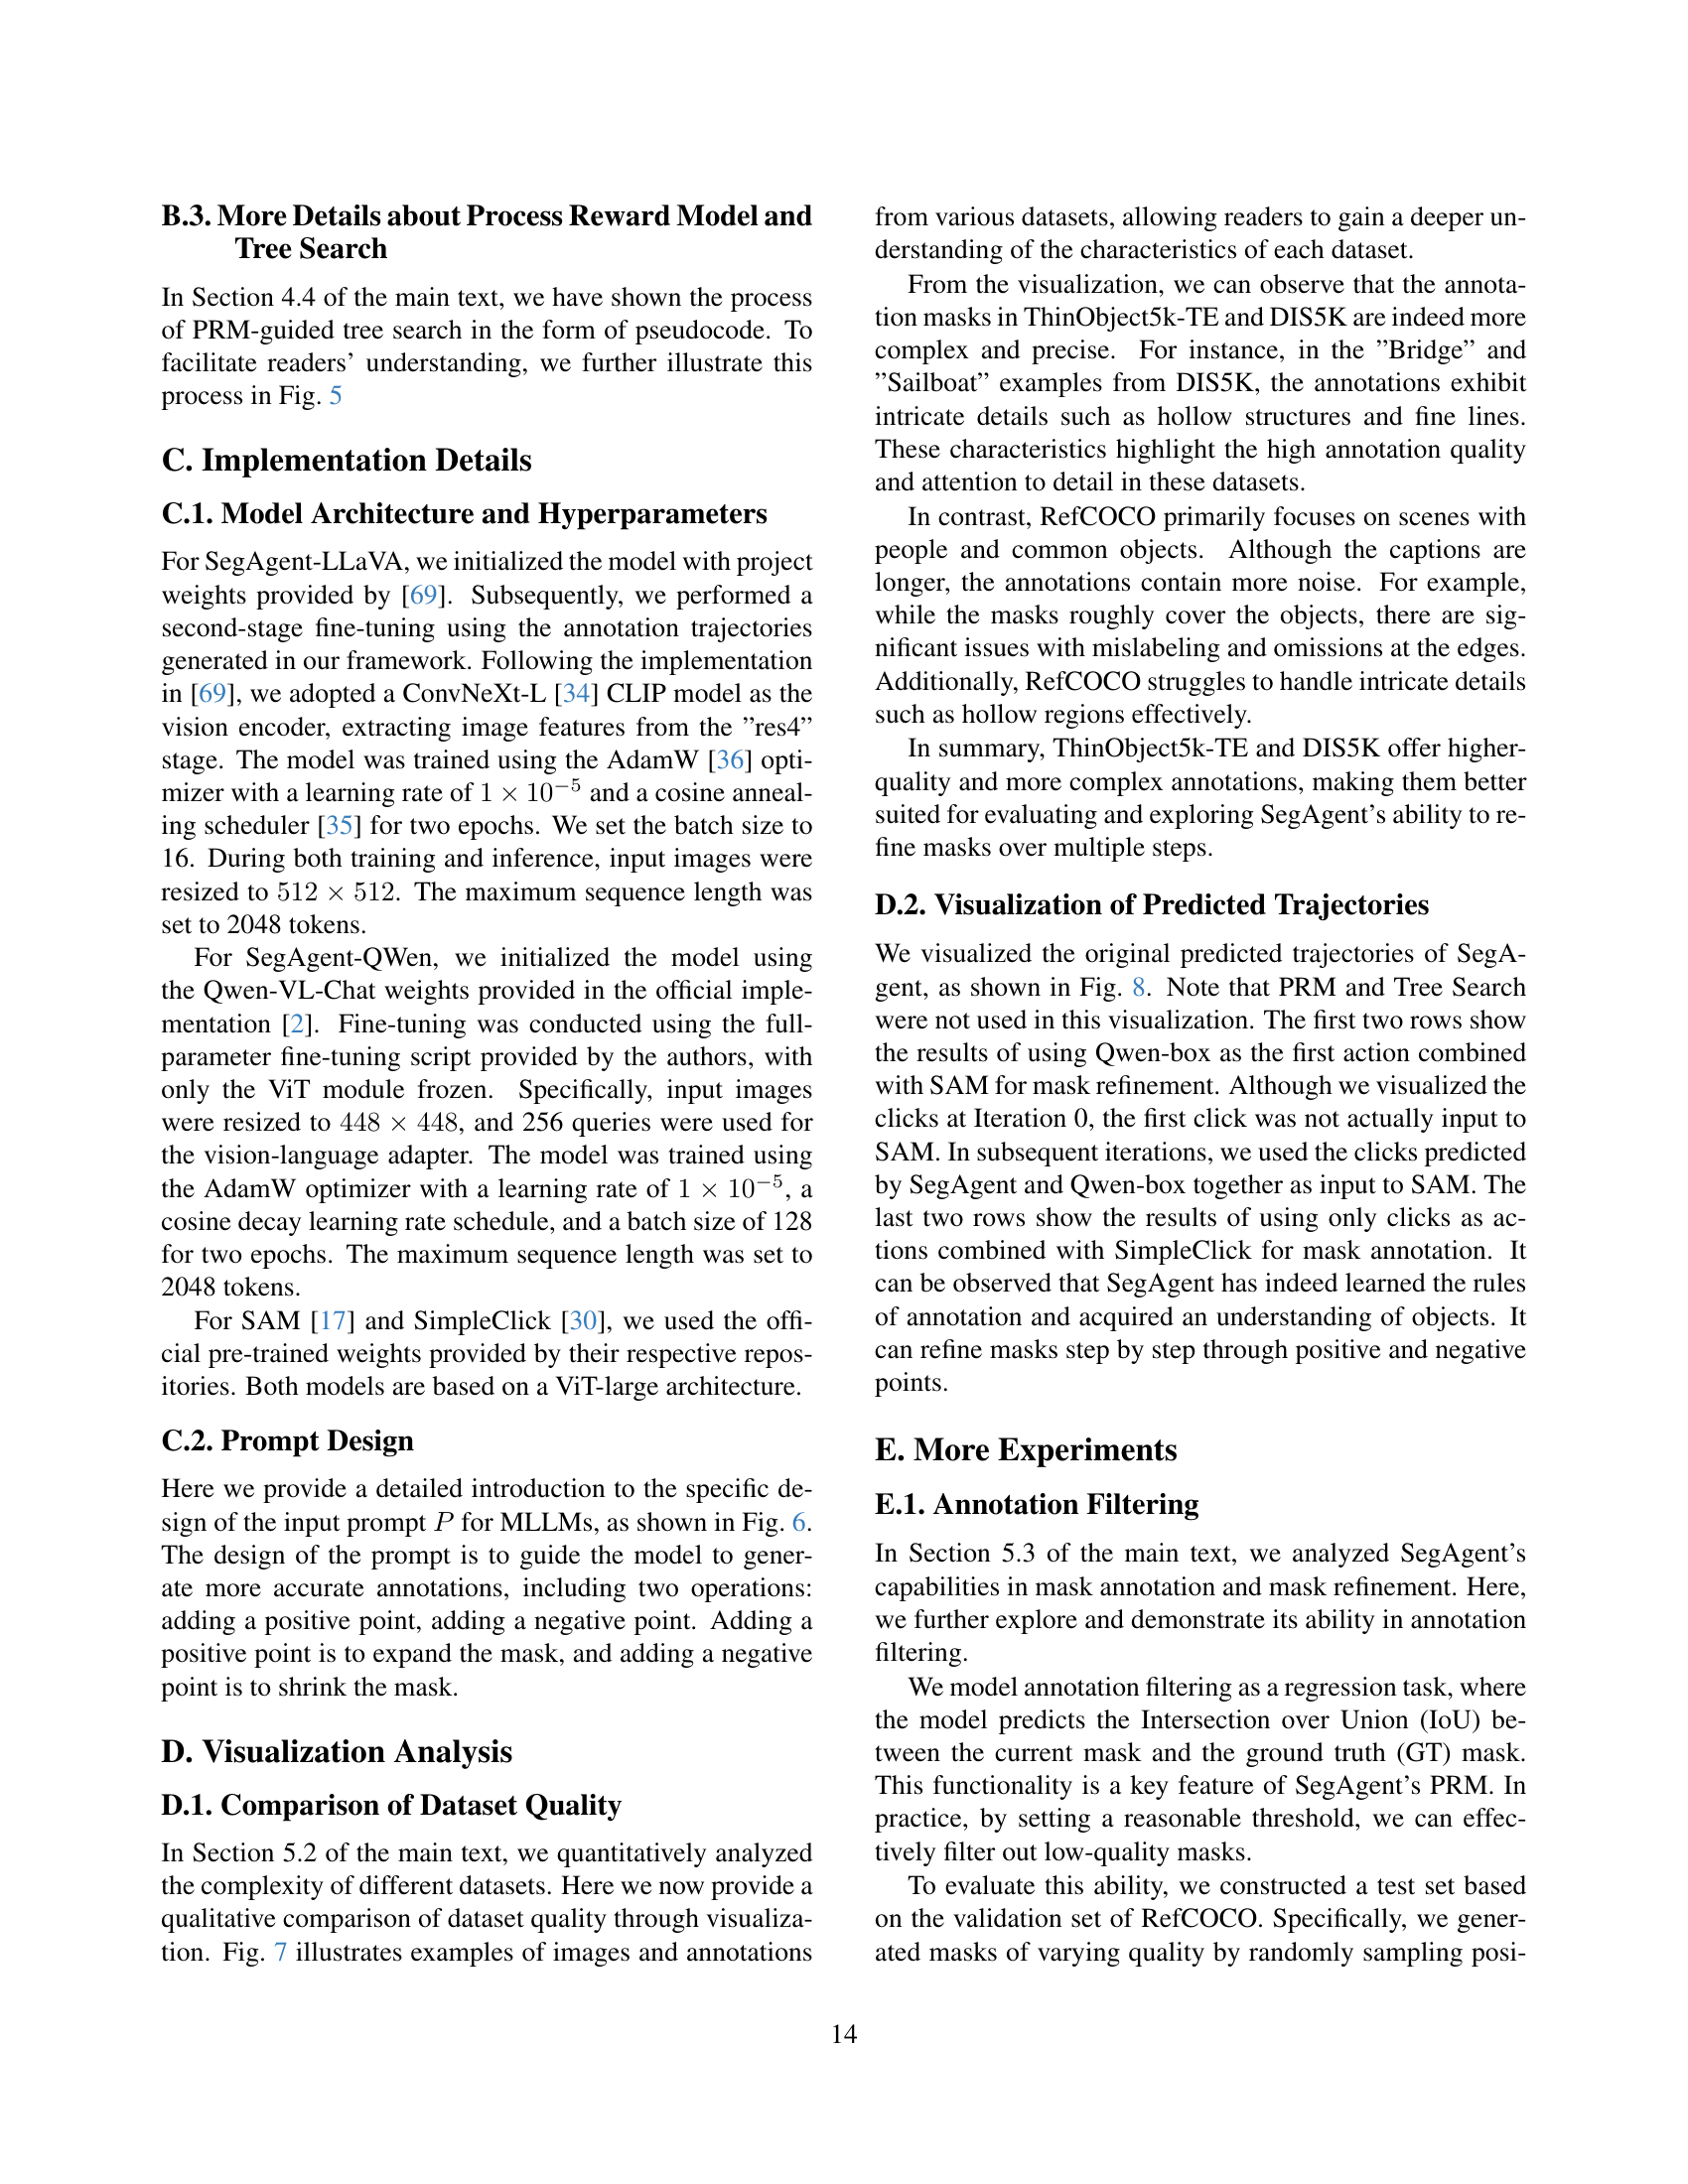
🔼 Figure 6 shows a detailed example of the text prompt used to guide the model during the mask refinement process in the interactive segmentation task. The prompt provides clear instructions on how to refine a mask using three actions: adding a positive point (to expand the mask), adding a negative point (to shrink the mask), and generating additional information (optional). The red text section is where user-specific inputs, such as the object description, are included to ensure the model’s understanding of the task. This prompt design is crucial for enabling the model to learn the human-like annotation process.
read the caption
Figure 6: The prompt provides detailed instructions for refining a segmentation mask with three possible actions: adding a positive point, adding a negative point. The red part indicates user-specific input, such as object descriptions.

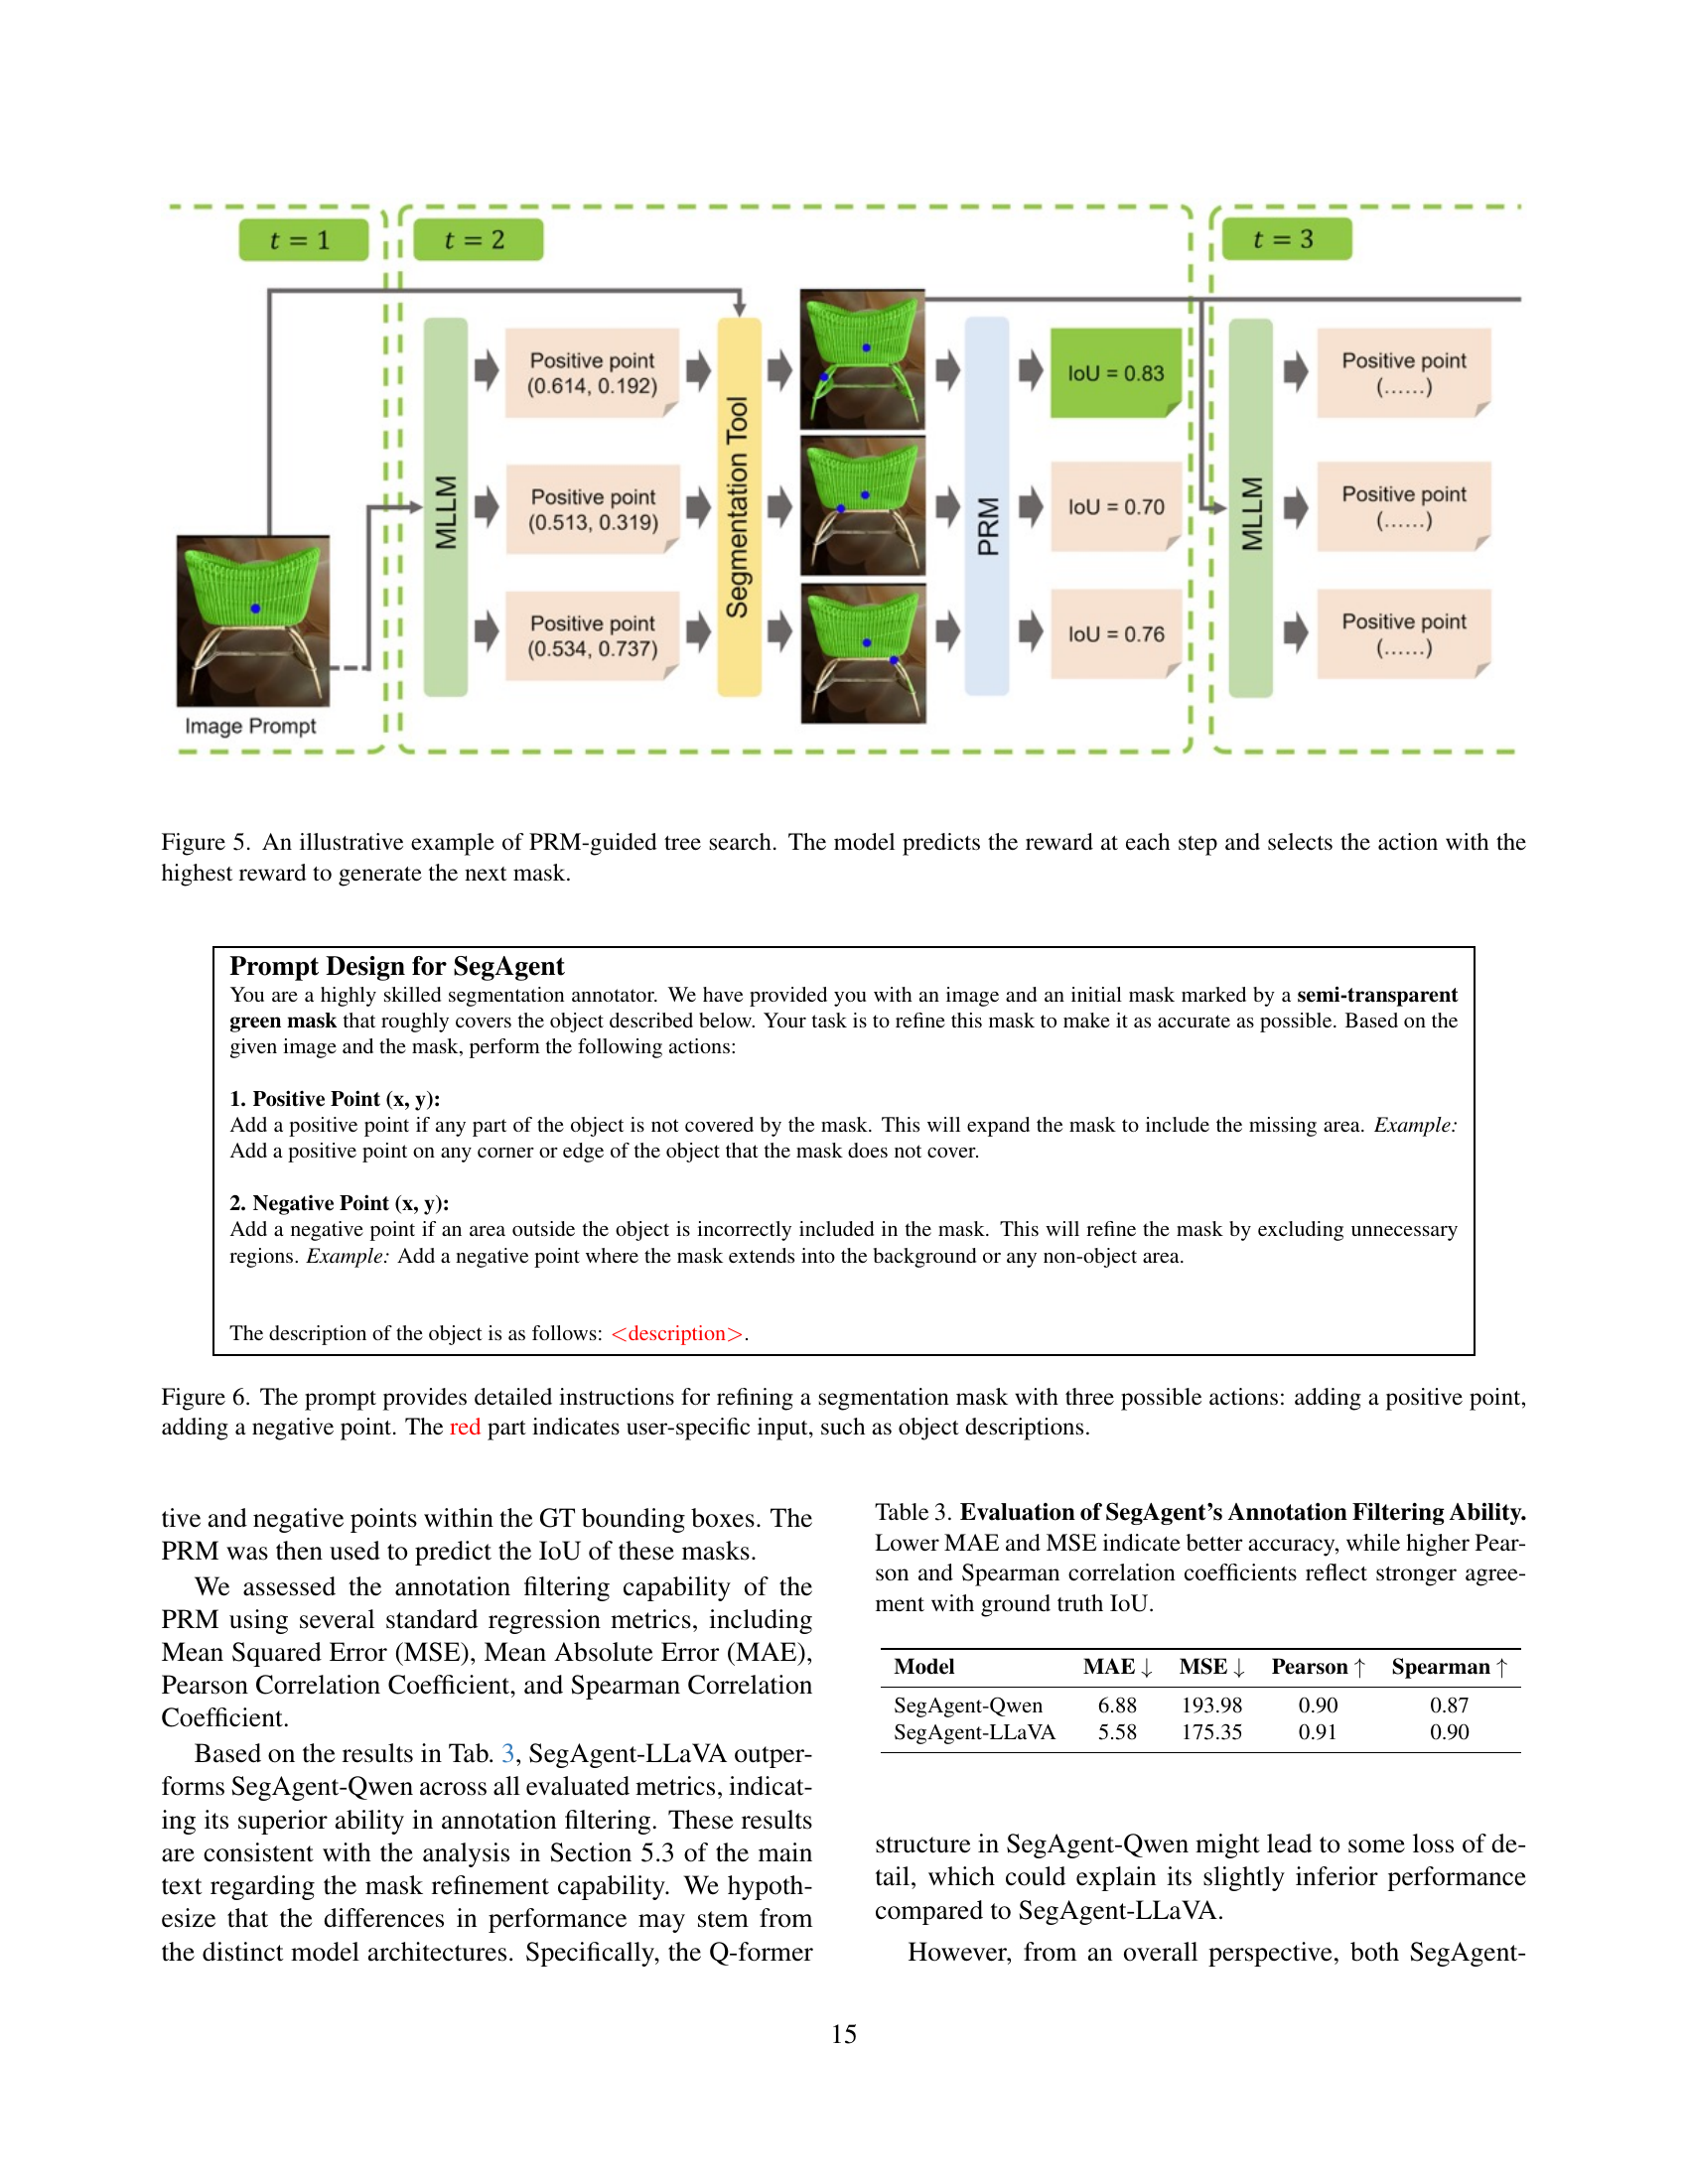
🔼 This figure visually compares the quality and complexity of annotations across three datasets: ThinObject5k-TE, DIS5K, and RefCOCO. Each row displays example images from one dataset, with their corresponding segmentation masks overlaid in green. The differences in mask detail and accuracy highlight how the complexity of the segmentation task varies between datasets. This is important for evaluating the performance of the proposed method, as more complex and accurate datasets better assess the fine-grained pixel-level understanding capabilities of the model.
read the caption
Figure 7: Examples of Images and Annotations from Various Datasets. The figure showcases representative samples from three datasets: ThinObject5k-TE, DIS5K, and RefCOCO. Each row represents a dataset, with images and corresponding annotations highlighting different objects and scenes. The annotations (green overlays) demonstrate the varying levels of detail and complexity across datasets.
More on tables
| # Steps | 1 | 3 | 5 | 7 |
|---|---|---|---|---|
| w/o PRM | 71.53 | 73.67 | 73.88 | 68.22 |
| w/ PRM | 71.53 | 72.98 | 75.21 | 75.43 |
🔼 This table compares the model’s performance with and without the process reward model (PRM) across different numbers of steps in a multi-step segmentation task. It demonstrates the impact of PRM on mitigating error accumulation in longer sequences.
read the caption
Table 2: Performance comparison under different steps.
| Model | MAE | MSE | Pearson | Spearman |
|---|---|---|---|---|
| SegAgent-Qwen | 6.88 | 193.98 | 0.90 | 0.87 |
| SegAgent-LLaVA | 5.58 | 175.35 | 0.91 | 0.90 |
🔼 This table presents a quantitative evaluation of SegAgent’s ability to filter annotations. It assesses the model’s performance on a regression task where it predicts the Intersection over Union (IoU) between a generated mask and the ground truth mask. Lower Mean Absolute Error (MAE) and Mean Squared Error (MSE) scores indicate higher accuracy in predicting the IoU. Conversely, higher Pearson and Spearman correlation coefficients signify stronger agreement between the model’s IoU predictions and the actual ground truth IoU values.
read the caption
Table 3: Evaluation of SegAgent’s Annotation Filtering Ability. Lower MAE and MSE indicate better accuracy, while higher Pearson and Spearman correlation coefficients reflect stronger agreement with ground truth IoU.
| Mask Color | Green | Blue | Red |
|---|---|---|---|
| mIoU | 0.749 | 0.750 | 0.749 |
🔼 This table presents the results of an experiment evaluating the impact of different mask colors (green, blue, and red) on the performance of the SegAgent model in image segmentation tasks. The mean Intersection over Union (mIoU) metric was used to measure the performance, with nearly identical results obtained for all three colors. This demonstrates that the model’s segmentation capabilities are robust to variations in mask color.
read the caption
Table 4: Evaluation of Mask Color on Segmentation Performance.
| Initial Action | NO box | Qwen Box | Self Box |
|---|---|---|---|
| refcoco(val) | 77.81 | 78.01 | 77.85 |
| refcoco+(val) | 70.88 | 70.86 | 70.50 |
| refcocog(test) | 73.13 | 74.62 | 74.33 |
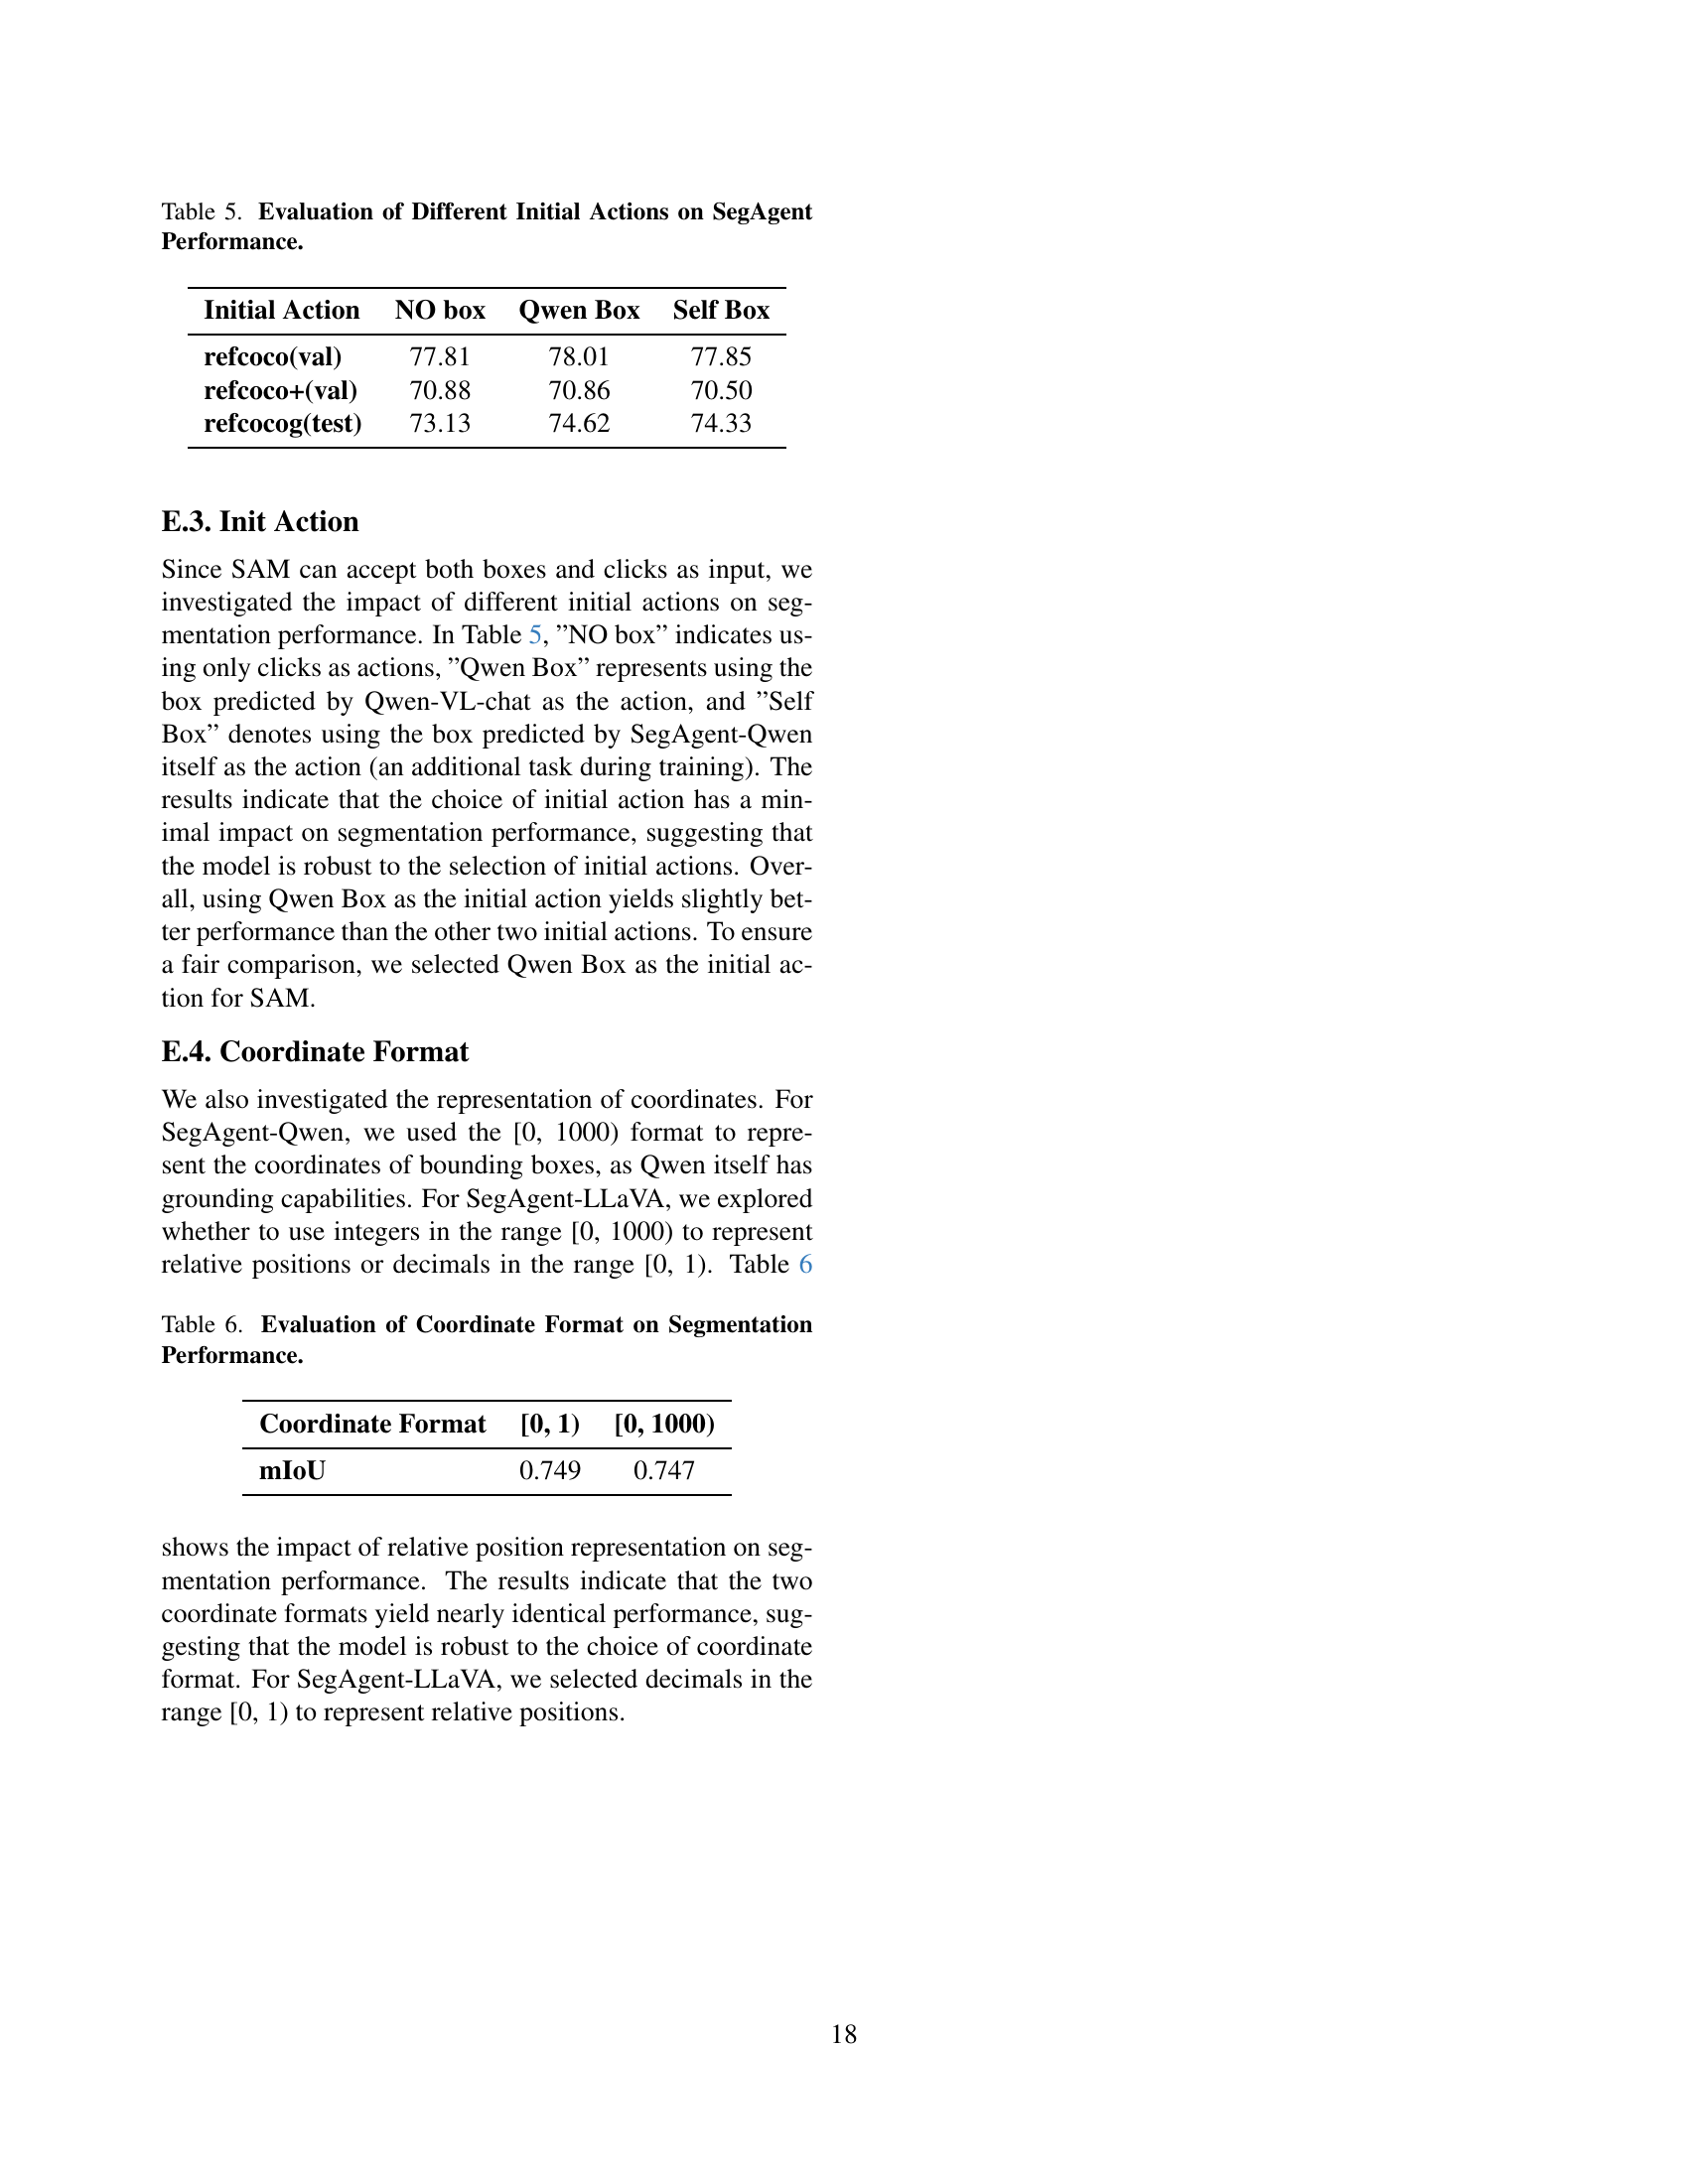
🔼 This table presents a comparison of SegAgent’s performance using different initial actions for segmentation. The initial action refers to the first action taken by the model when initiating a segmentation task. Three different initial actions were tested: no initial box (only clicks provided), a bounding box predicted by the Qwen-VL-chat model, and a bounding box predicted by the SegAgent itself. The performance is evaluated across three different subsets of the referring expression segmentation (RES) dataset (refcoco, refcoco+, refcocog) using the validation or test set for each. The results show the impact of the initial action selection on the mIoU (mean Intersection over Union) score, providing insights into the model’s robustness to the initial action.
read the caption
Table 5: Evaluation of Different Initial Actions on SegAgent Performance.
| Coordinate Format | [0, 1) | [0, 1000) |
|---|---|---|
| mIoU | 0.749 | 0.747 |
🔼 This table presents the results of an experiment comparing the performance of the SegAgent model using two different coordinate formats for representing the location of segmentation points: decimals in the range [0, 1) and integers in the range [0, 1000). The mIoU (mean Intersection over Union) metric is used to evaluate the segmentation performance for each format. The purpose of the experiment is to assess the model’s robustness to the choice of coordinate representation.
read the caption
Table 6: Evaluation of Coordinate Format on Segmentation Performance.
Full paper#