TL;DR#
Previous studies have shown that PLM-based retrieval models favor LLM-generated content, even when their semantic quality is comparable to human-written ones. This is known as source bias, which hurts the information access ecosystem. However, the reasons for this bias were not clear. This paper explains information retrieval with a causal graph, showing that PLM retrievers use perplexity features for relevance, resulting in source bias by favoring documents with low perplexity. Theoretical analysis showed the positive correlation between gradients in language modeling and retrieval tasks.
Based on the analysis, the authors suggest a causal inference-time debiasing method, called Causal Diagnosis and Correction (CDC). CDC identifies the bias effect of perplexity and separates it from the overall relevance score. Experiments across three domains showed that CDC is effective at debiasing, highlighting the validity of the explanatory framework. The results showed that PLM-based retrievers assign higher relevance scores to documents with lower perplexity because these models have gradients of MLM and IR loss functions, leading to bias.
Key Takeaways#
Why does it matter?#
This paper reveals a critical source of bias in PLM-based retrievers, offering a novel causal-based debiasing method, enhancing the fairness and reliability of information retrieval and inspiring new research directions in mitigating AI-driven biases.
Visual Insights#
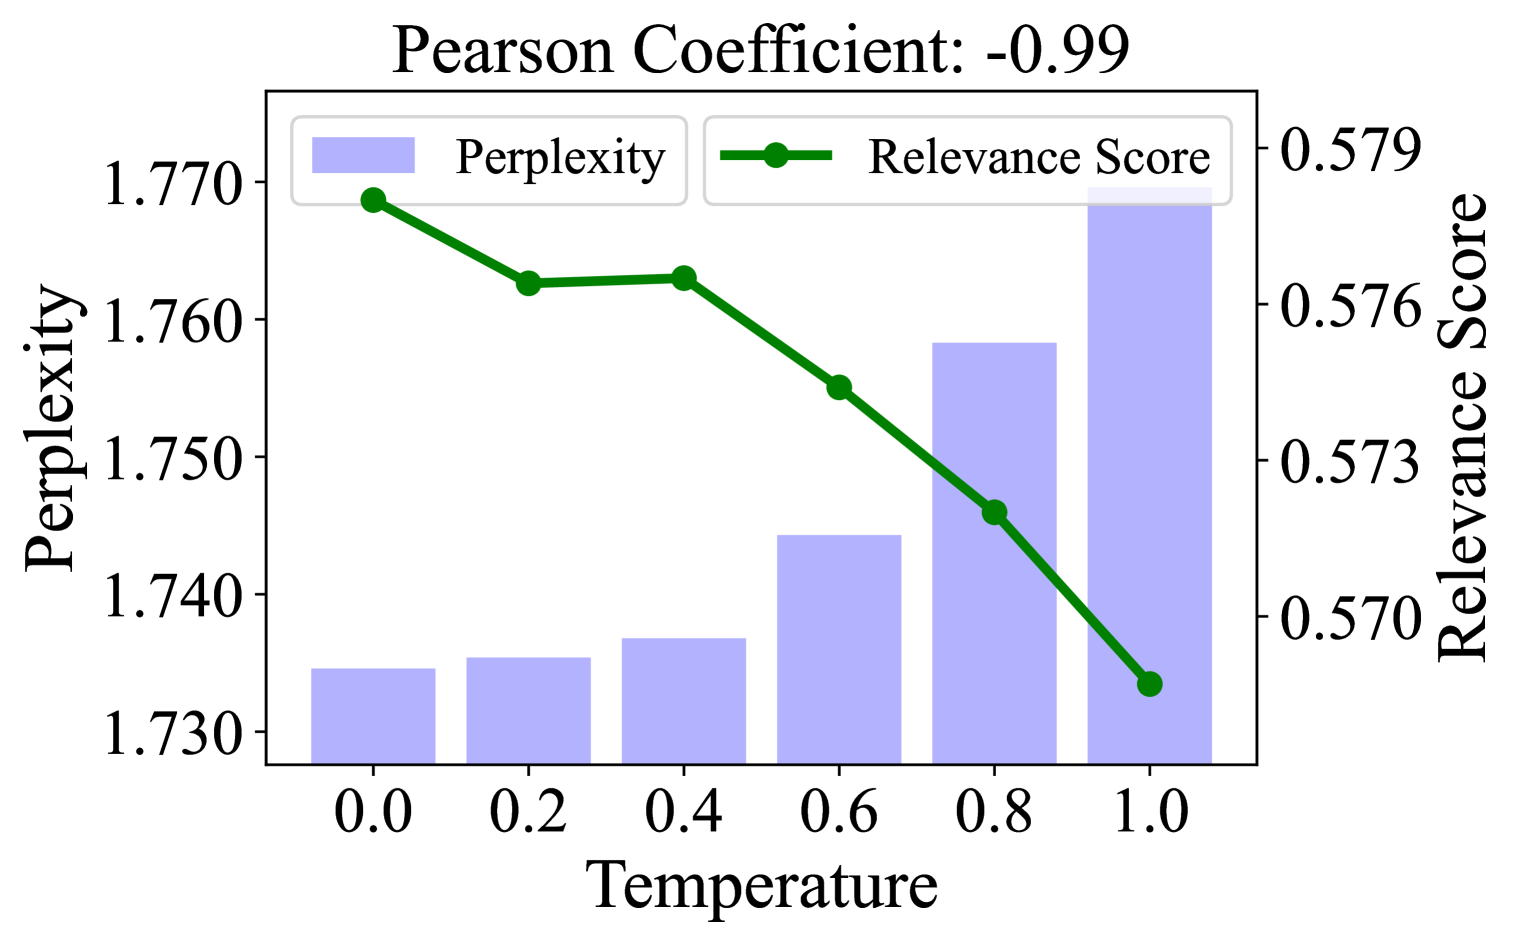
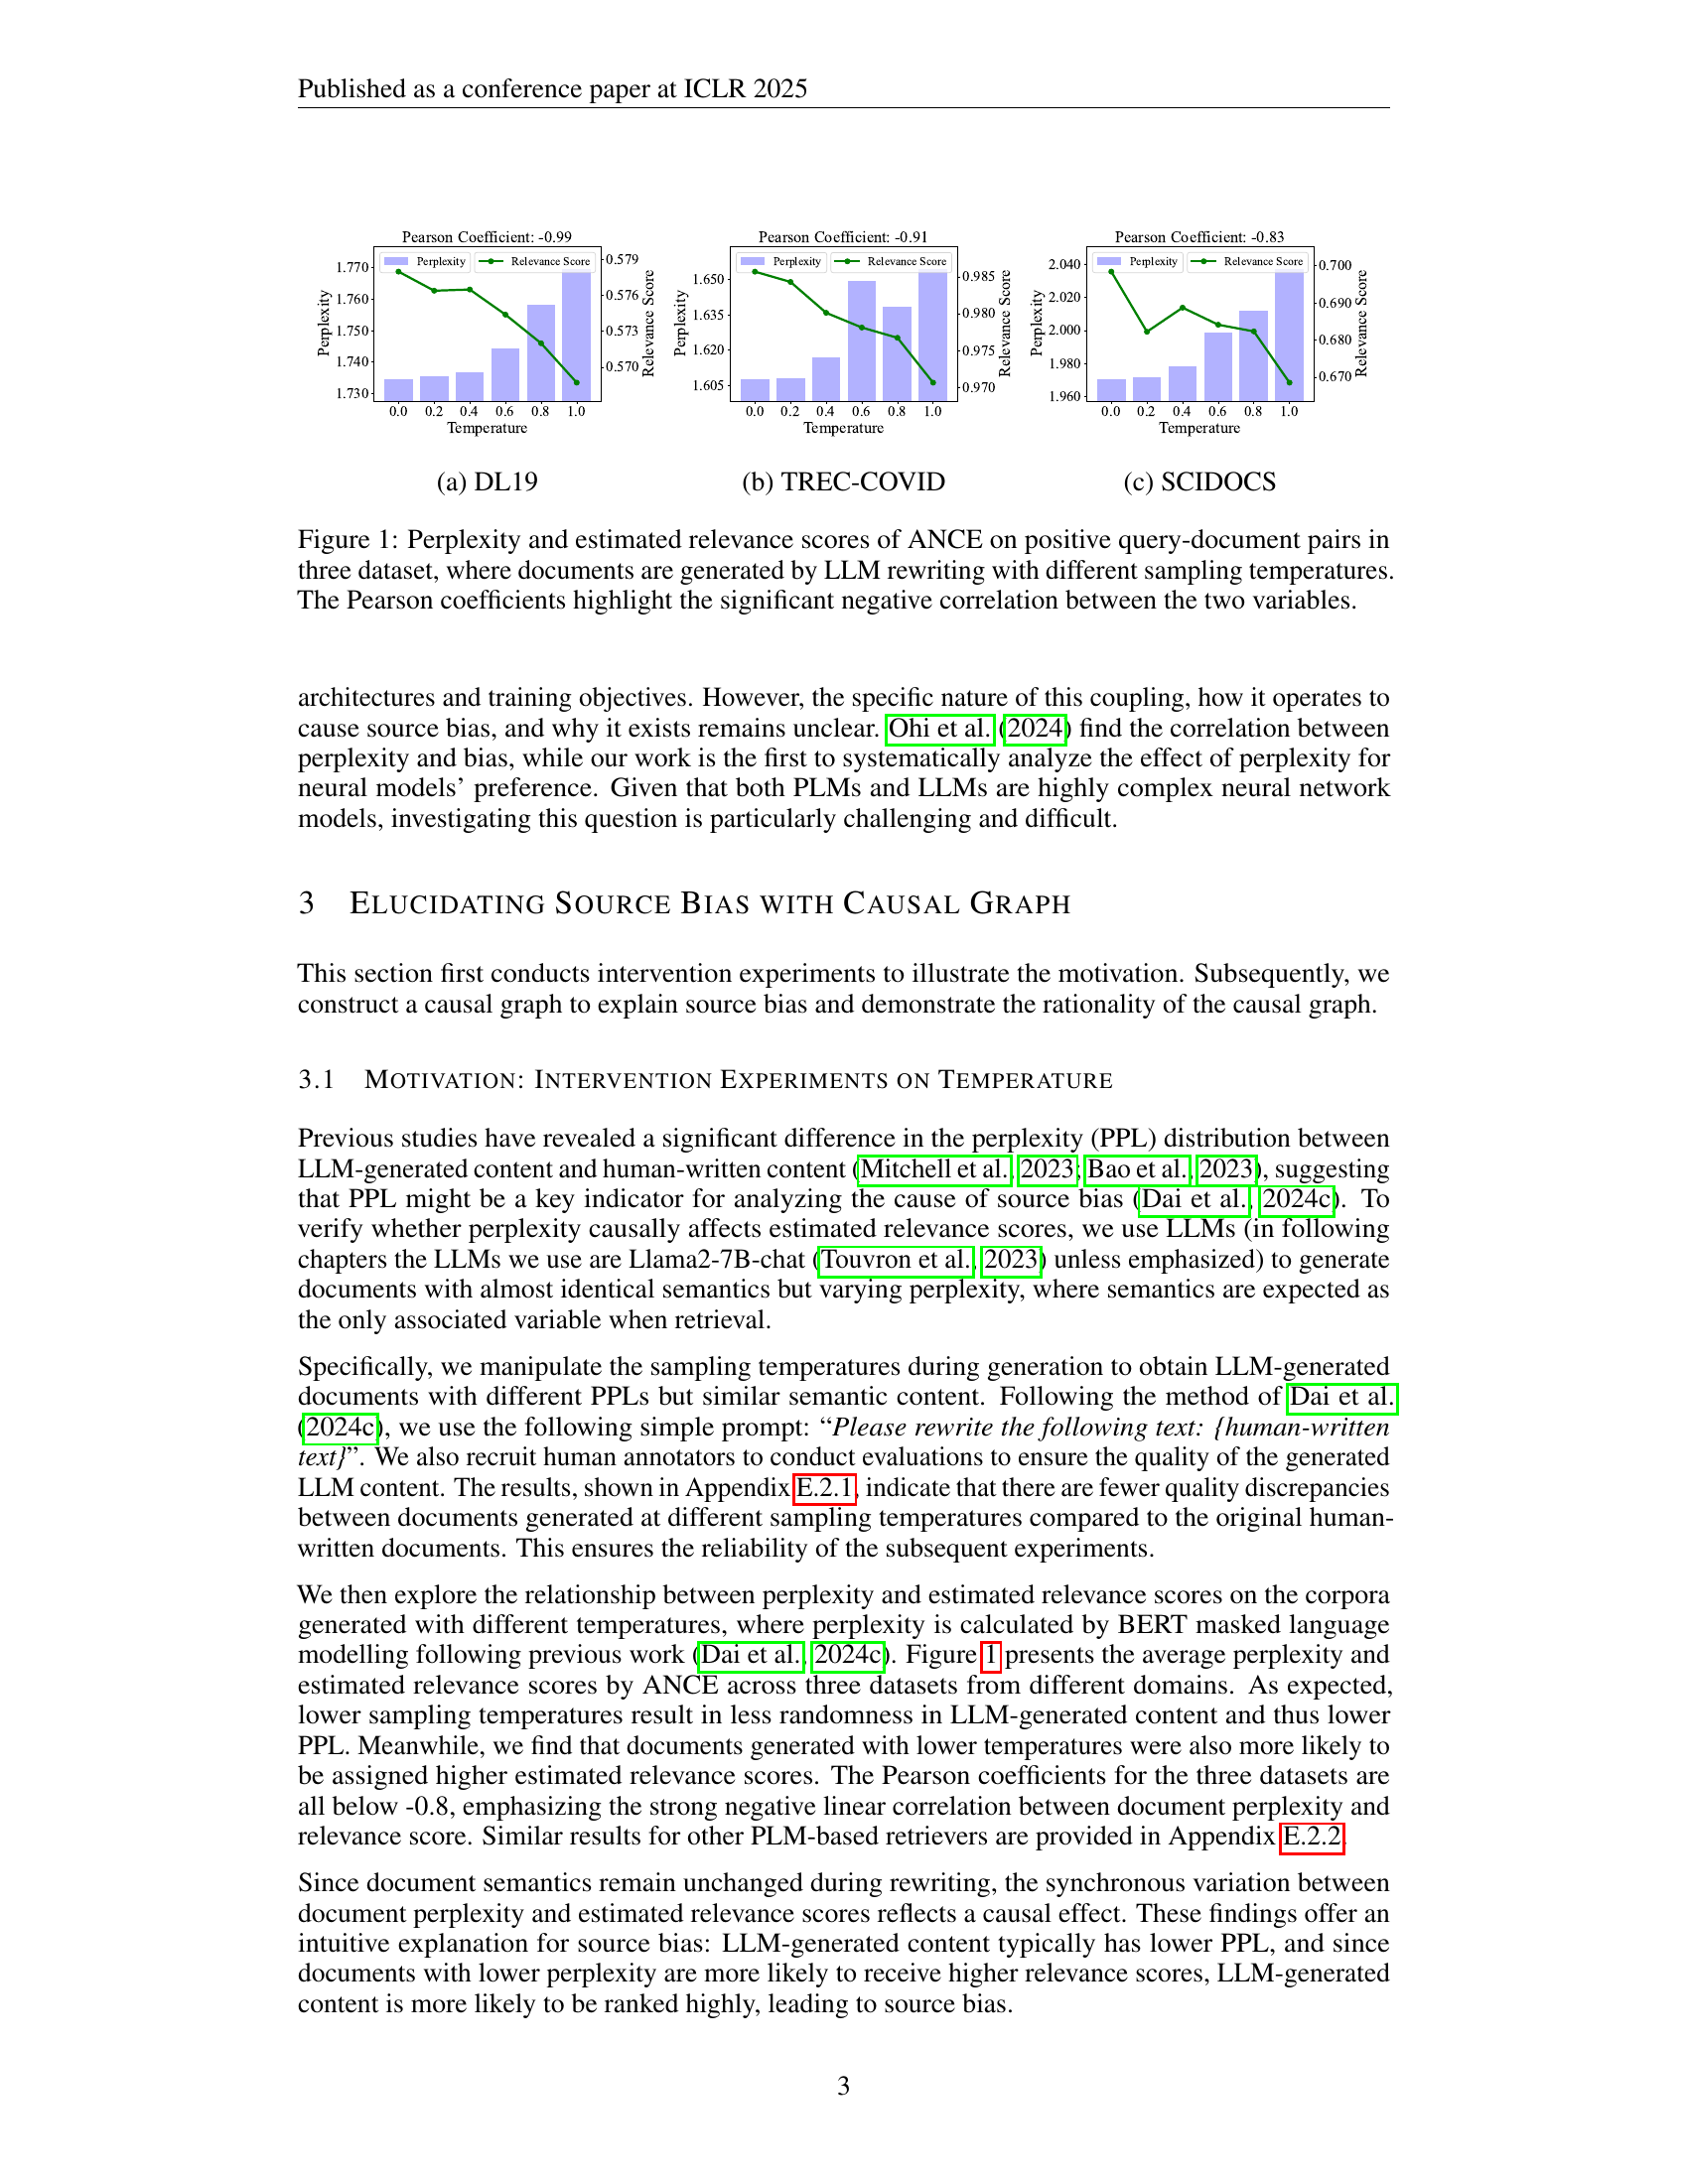
🔼 The figure shows the perplexity and estimated relevance scores for the DL19 dataset, where documents are generated by an LLM with varying sampling temperatures. The x-axis represents the sampling temperature, while the y-axis shows the perplexity and estimated relevance scores. It demonstrates the negative correlation between perplexity and estimated relevance scores, indicating that lower perplexity documents tend to receive higher estimated relevance scores. This supports the paper’s argument that low-perplexity documents are overestimated by PLM-based retrievers.
read the caption
(a) DL19
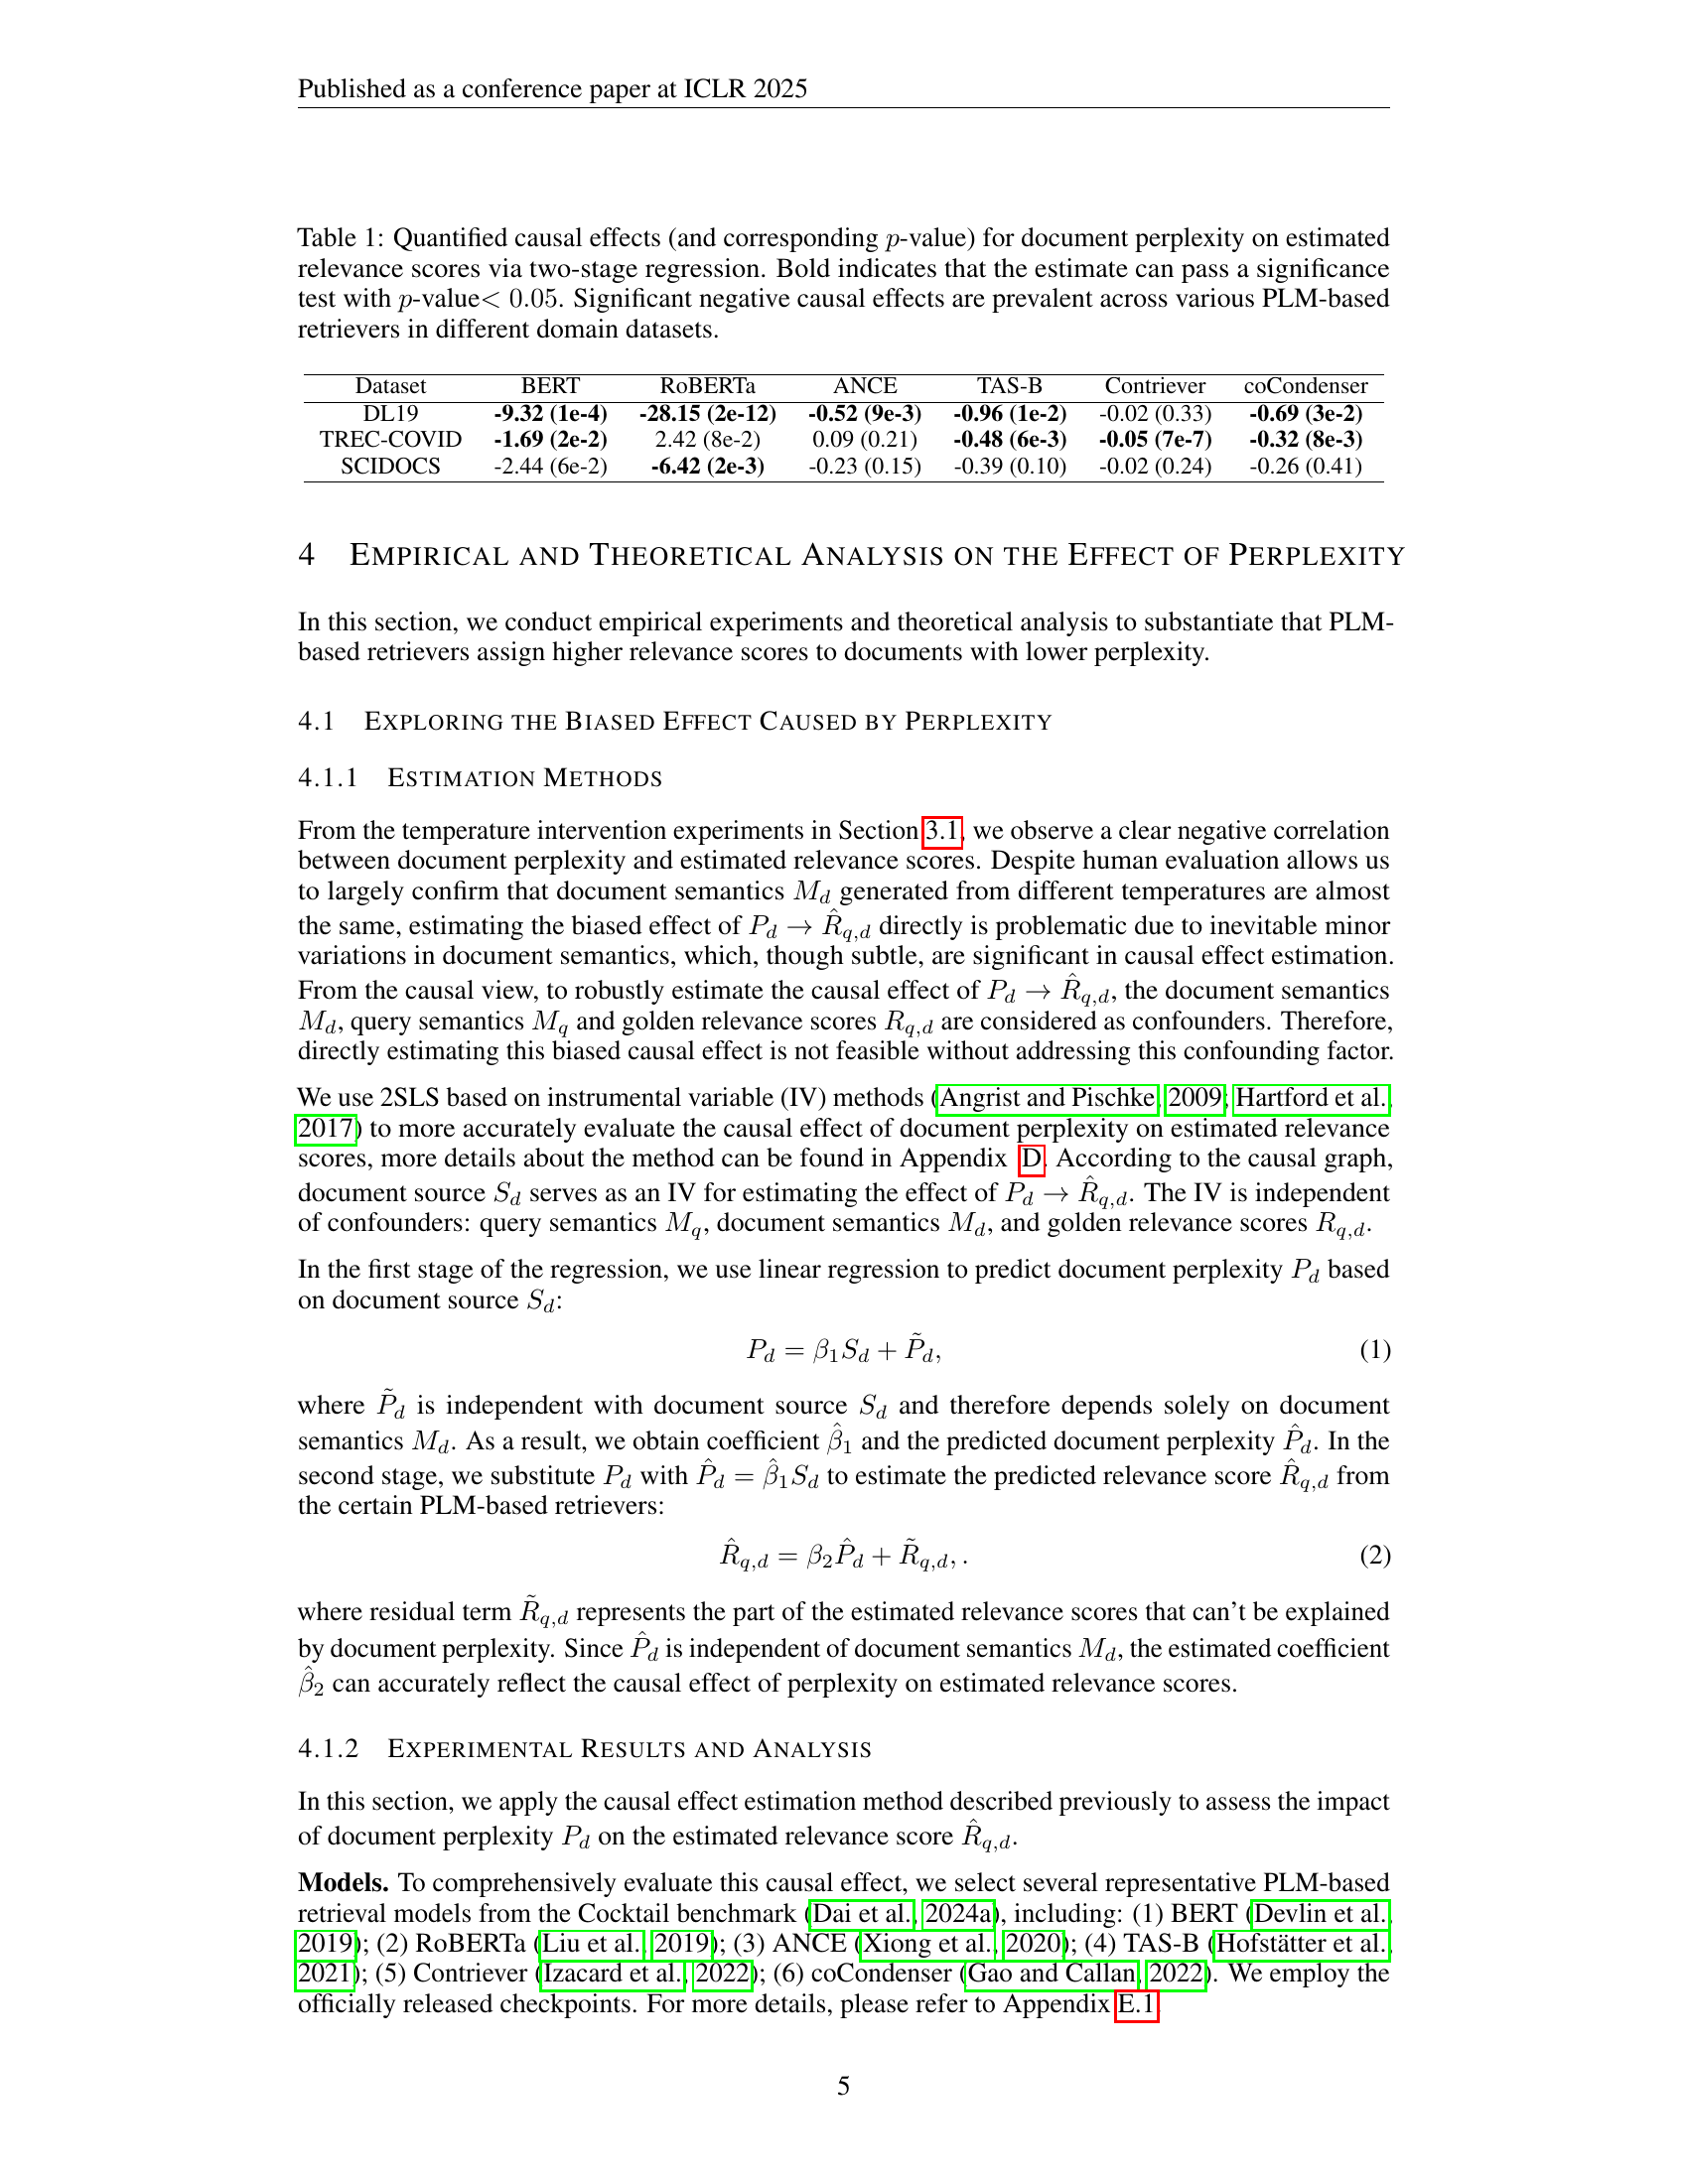
| Dataset | BERT | RoBERTa | ANCE | TAS-B | Contriever | coCondenser |
|---|---|---|---|---|---|---|
| DL19 | -9.32 (1e-4) | -28.15 (2e-12) | -0.52 (9e-3) | -0.96 (1e-2) | -0.02 (0.33) | -0.69 (3e-2) |
| TREC-COVID | -1.69 (2e-2) | 2.42 (8e-2) | 0.09 (0.21) | -0.48 (6e-3) | -0.05 (7e-7) | -0.32 (8e-3) |
| SCIDOCS | -2.44 (6e-2) | -6.42 (2e-3) | -0.23 (0.15) | -0.39 (0.10) | -0.02 (0.24) | -0.26 (0.41) |
🔼 This table presents the results of a two-stage regression analysis conducted to quantify the causal effect of document perplexity on estimated relevance scores. The analysis was performed using instrumental variables to control for confounding factors. The table shows the estimated causal effects for six different PLM-based retrieval models across three datasets representing different domains. Bold values indicate statistically significant negative causal effects (p<0.05), suggesting that lower document perplexity is associated with higher estimated relevance scores, regardless of the model or dataset. This highlights a systematic bias where models tend to overrate low-perplexity documents.
read the caption
Table 1: Quantified causal effects (and corresponding p𝑝pitalic_p-value) for document perplexity on estimated relevance scores via two-stage regression. Bold indicates that the estimate can pass a significance test with p𝑝pitalic_p-value<0.05absent0.05<0.05< 0.05. Significant negative causal effects are prevalent across various PLM-based retrievers in different domain datasets.
In-depth insights#
Perplexity Trap#
The concept of a ‘Perplexity Trap’ in the context of PLM-based retrievers is intriguing. It suggests that these models, while powerful, can be misled by the perplexity of documents, essentially the model’s confidence in generating the text. The ’trap’ arises because PLMs may overrate documents with low perplexity, often characteristic of machine-generated content, leading to a bias against human-written text, even when the latter is semantically superior. This can undermine the trustworthiness and fairness of information retrieval systems. The exploration of causal relationships, as proposed in the source material, is critical to understanding and mitigating this trap. Identifying perplexity as a non-causal feature that negatively impacts relevance estimation is a crucial step. Future work might explore more sophisticated debiasing strategies to ensure PLMs prioritize semantic relevance over superficial text generation characteristics.
Causal Source Bias#
Causal source bias is a phenomenon where models exhibit preferences for content based on its source, regardless of its inherent quality. This bias can stem from the model learning spurious correlations between source characteristics (e.g., LLM-generated content having lower perplexity) and relevance scores. The model might inadvertently prioritize lower perplexity documents, leading to unfair ranking outcomes. Addressing causal source bias requires careful disentangling of the true causal relationships driving relevance from spurious correlations learned by the model, potentially using techniques like causal intervention or bias correction methods. The consequences of not addressing this is that humans may be less incentivized.
CDC Debiasing#
CDC Debiasing, a key focus, aims to mitigate source bias where PLM-based retrievers overrate low-perplexity documents. It employs Causal Diagnosis and Correction (CDC), an inference-time method derived from causal analysis. CDC’s two-stage process involves (i) Bias Diagnosis, estimating perplexity’s impact on relevance scores using Instrumental Variables, and (ii) Bias Correction, separating the biased effect from overall relevance scores. This debiasing is achieved post-model training, integrating easily into existing PLM-based retrievers. Results show effective bias reduction and maintain retrieval performance, proving generalizability across domains and LLMs. The adjustable nature allows balancing information quality and provider fairness.
Gradient Analysis#
Gradient analysis is a crucial method for comprehending how models, particularly PLM-based retrievers, learn and make decisions. By examining the gradients of the loss functions during training, we can gain insights into the model’s sensitivity to different features and potential biases. In the context of PLM-based retrievers, gradient analysis can help reveal the relationship between document perplexity and relevance score estimation. A positive correlation between gradients suggests that the model might be inadvertently favoring documents with lower perplexity, leading to source bias. This analysis is vital for developing effective debiasing strategies.
IV Regression#
Instrumental Variable (IV) regression is a powerful technique used in statistics to estimate causal effects when there is a correlation between the explanatory variable and the error term, violating a key assumption of ordinary least squares (OLS) regression. The core idea is to use an instrumental variable that is correlated with the explanatory variable but independent of the error term. This allows to isolate the exogenous variation in the explanatory variable and estimate its causal effect on the outcome variable. The method typically involves a two-stage least squares (2SLS) procedure: first, the explanatory variable is regressed on the instrument, and then the outcome variable is regressed on the predicted values from the first stage. The coefficient on the predicted values in the second stage provides an estimate of the causal effect. IV regression requires careful consideration of the validity of the instrument, which must satisfy relevance and exclusion restrictions. It is particularly useful in situations where endogeneity may be present, such as when there is omitted variable bias or reverse causality. This is a crucial point to note since endogeneity results in biased and inconsistent OLS estimates.
More visual insights#
More on figures

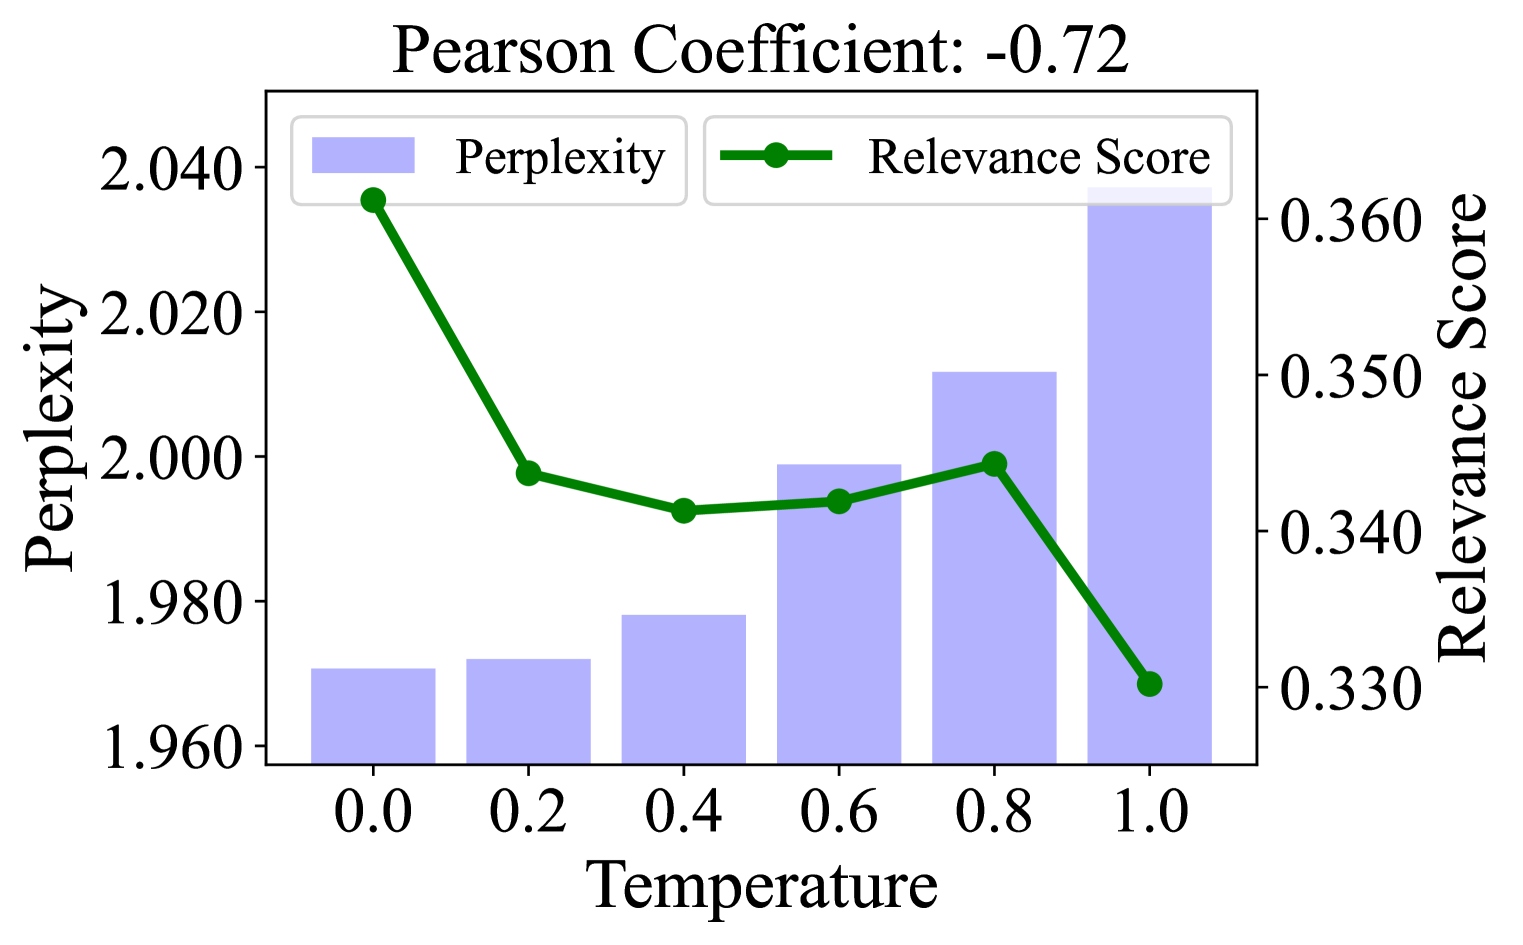
🔼 The figure shows the perplexity and estimated relevance scores for the TREC-COVID dataset. Documents were generated using LLMs with varying sampling temperatures. The x-axis represents the sampling temperature, while the y-axis shows the perplexity and relevance scores. The plot illustrates the negative correlation between perplexity and relevance scores, indicating that lower perplexity documents tend to receive higher relevance scores from the PLM-based retriever. This supports the paper’s central hypothesis that low perplexity, often associated with LLM-generated text, leads to inflated relevance scores. This specific figure shows data for the TREC-COVID dataset, one of the three datasets used in the paper to test the findings.
read the caption
(b) TREC-COVID

🔼 The figure shows the relationship between perplexity and estimated relevance scores for the SCIDOCS dataset. Documents were generated using different sampling temperatures. The Pearson correlation coefficient highlights a strong negative correlation between the two variables, indicating that documents with lower perplexity tend to receive higher relevance scores. This suggests that PLM-based retrievers have a bias towards low-perplexity documents, which often are LLM-generated.
read the caption
(c) SCIDOCS
🔼 This figure displays the relationship between document perplexity and estimated relevance scores, as calculated by the ANCE model. Three datasets (DL19, TREC-COVID, and SCIDOCS) are used, and in each, documents were generated using an LLM with varying sampling temperatures. The x-axis represents the sampling temperature, and the y-axes show the perplexity and estimated relevance scores. Each subplot shows a strong negative correlation between perplexity and relevance score; documents with lower perplexity receive higher relevance scores. The Pearson correlation coefficient for each dataset is displayed to quantify this negative relationship.
read the caption
Figure 1: Perplexity and estimated relevance scores of ANCE on positive query-document pairs in three dataset, where documents are generated by LLM rewriting with different sampling temperatures. The Pearson coefficients highlight the significant negative correlation between the two variables.

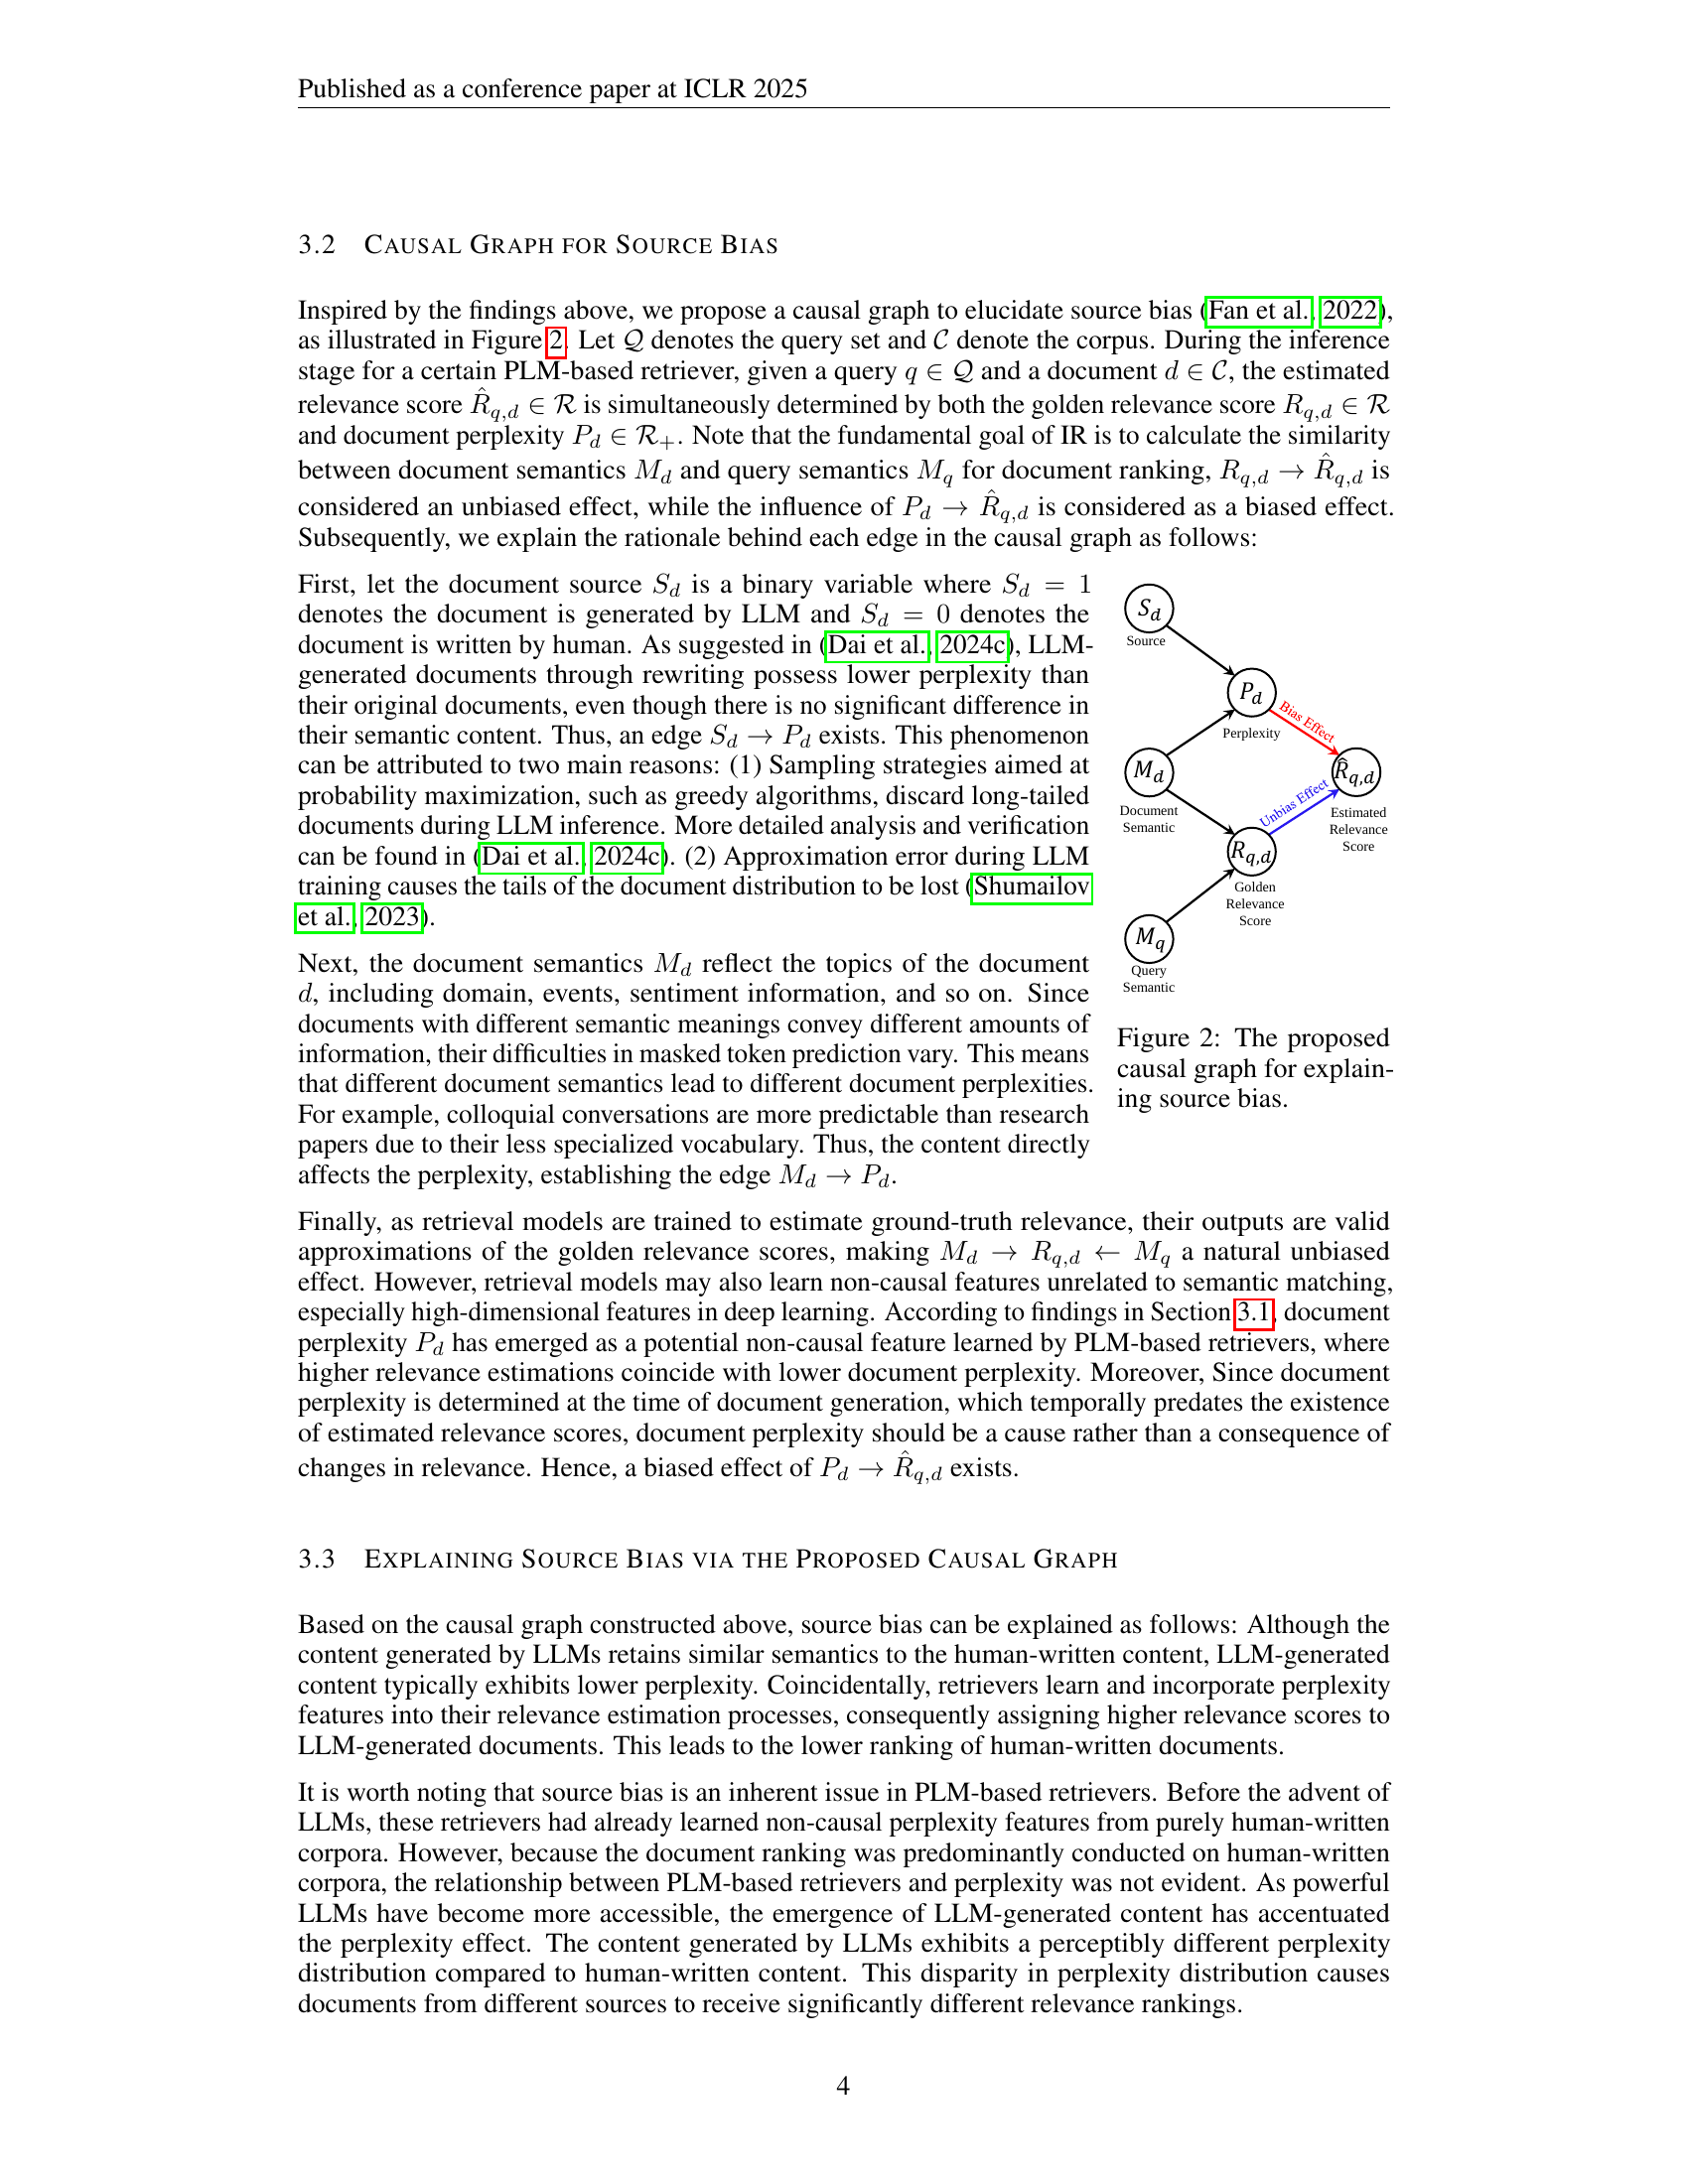
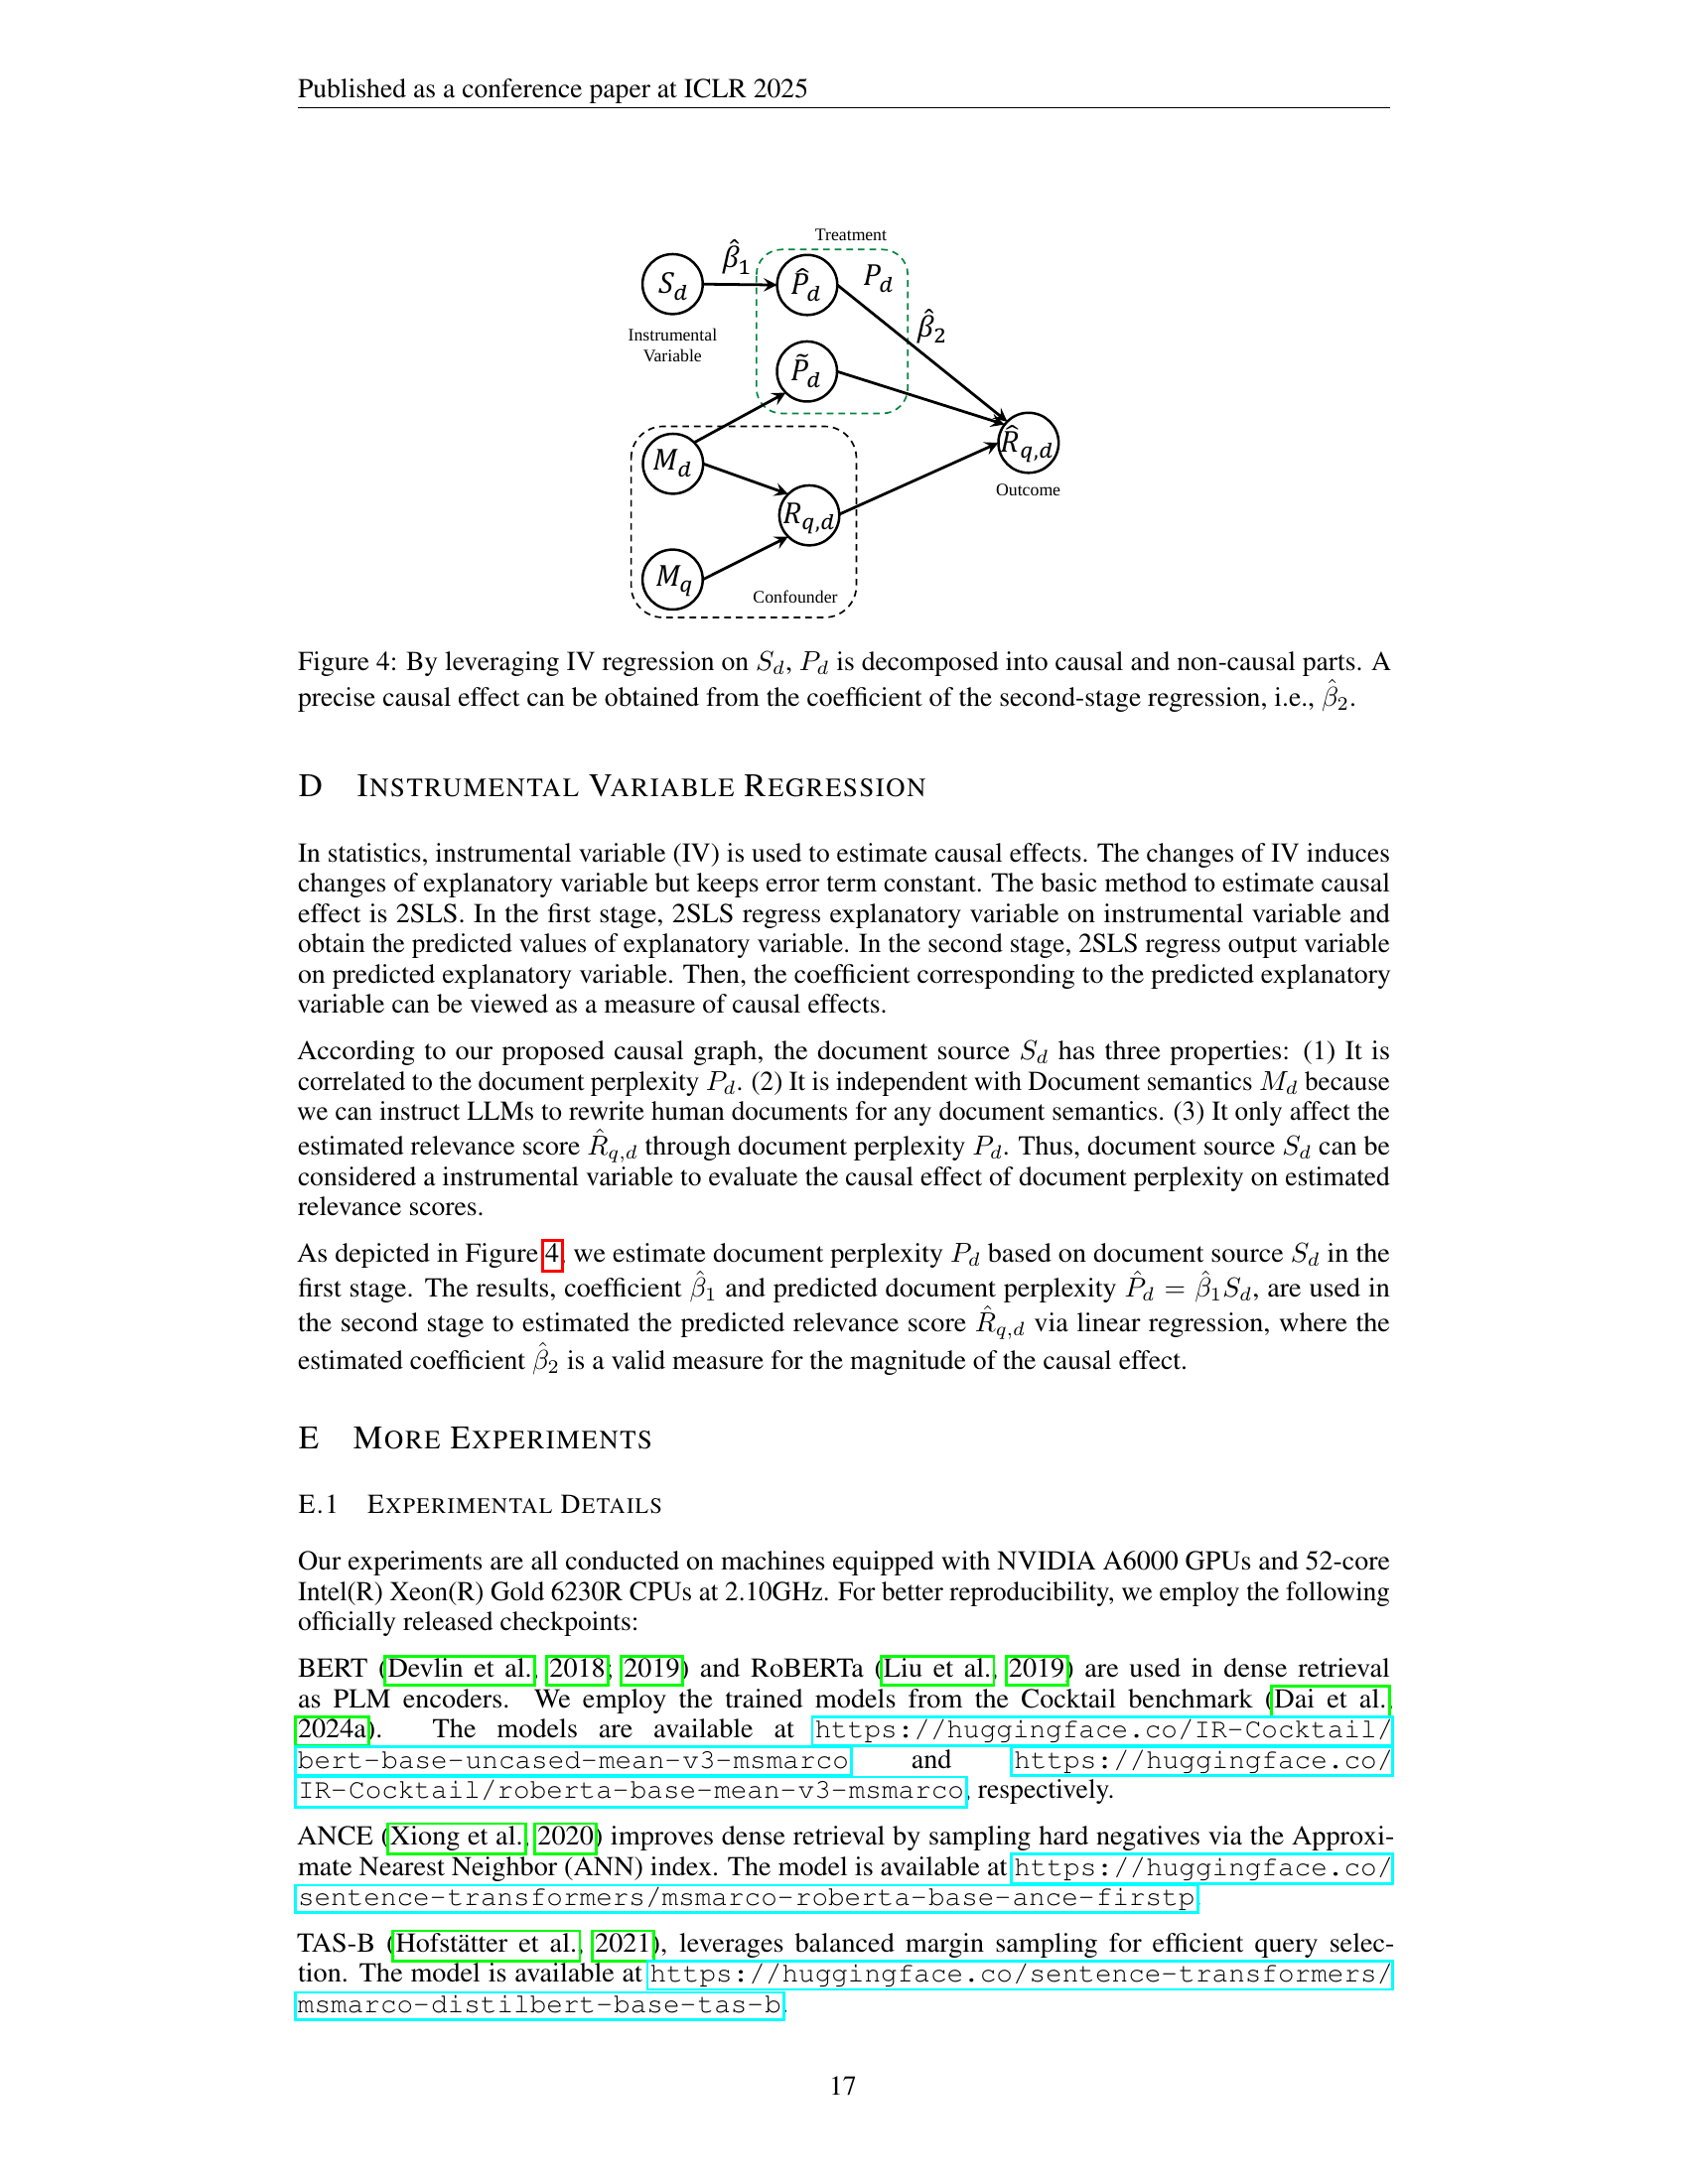
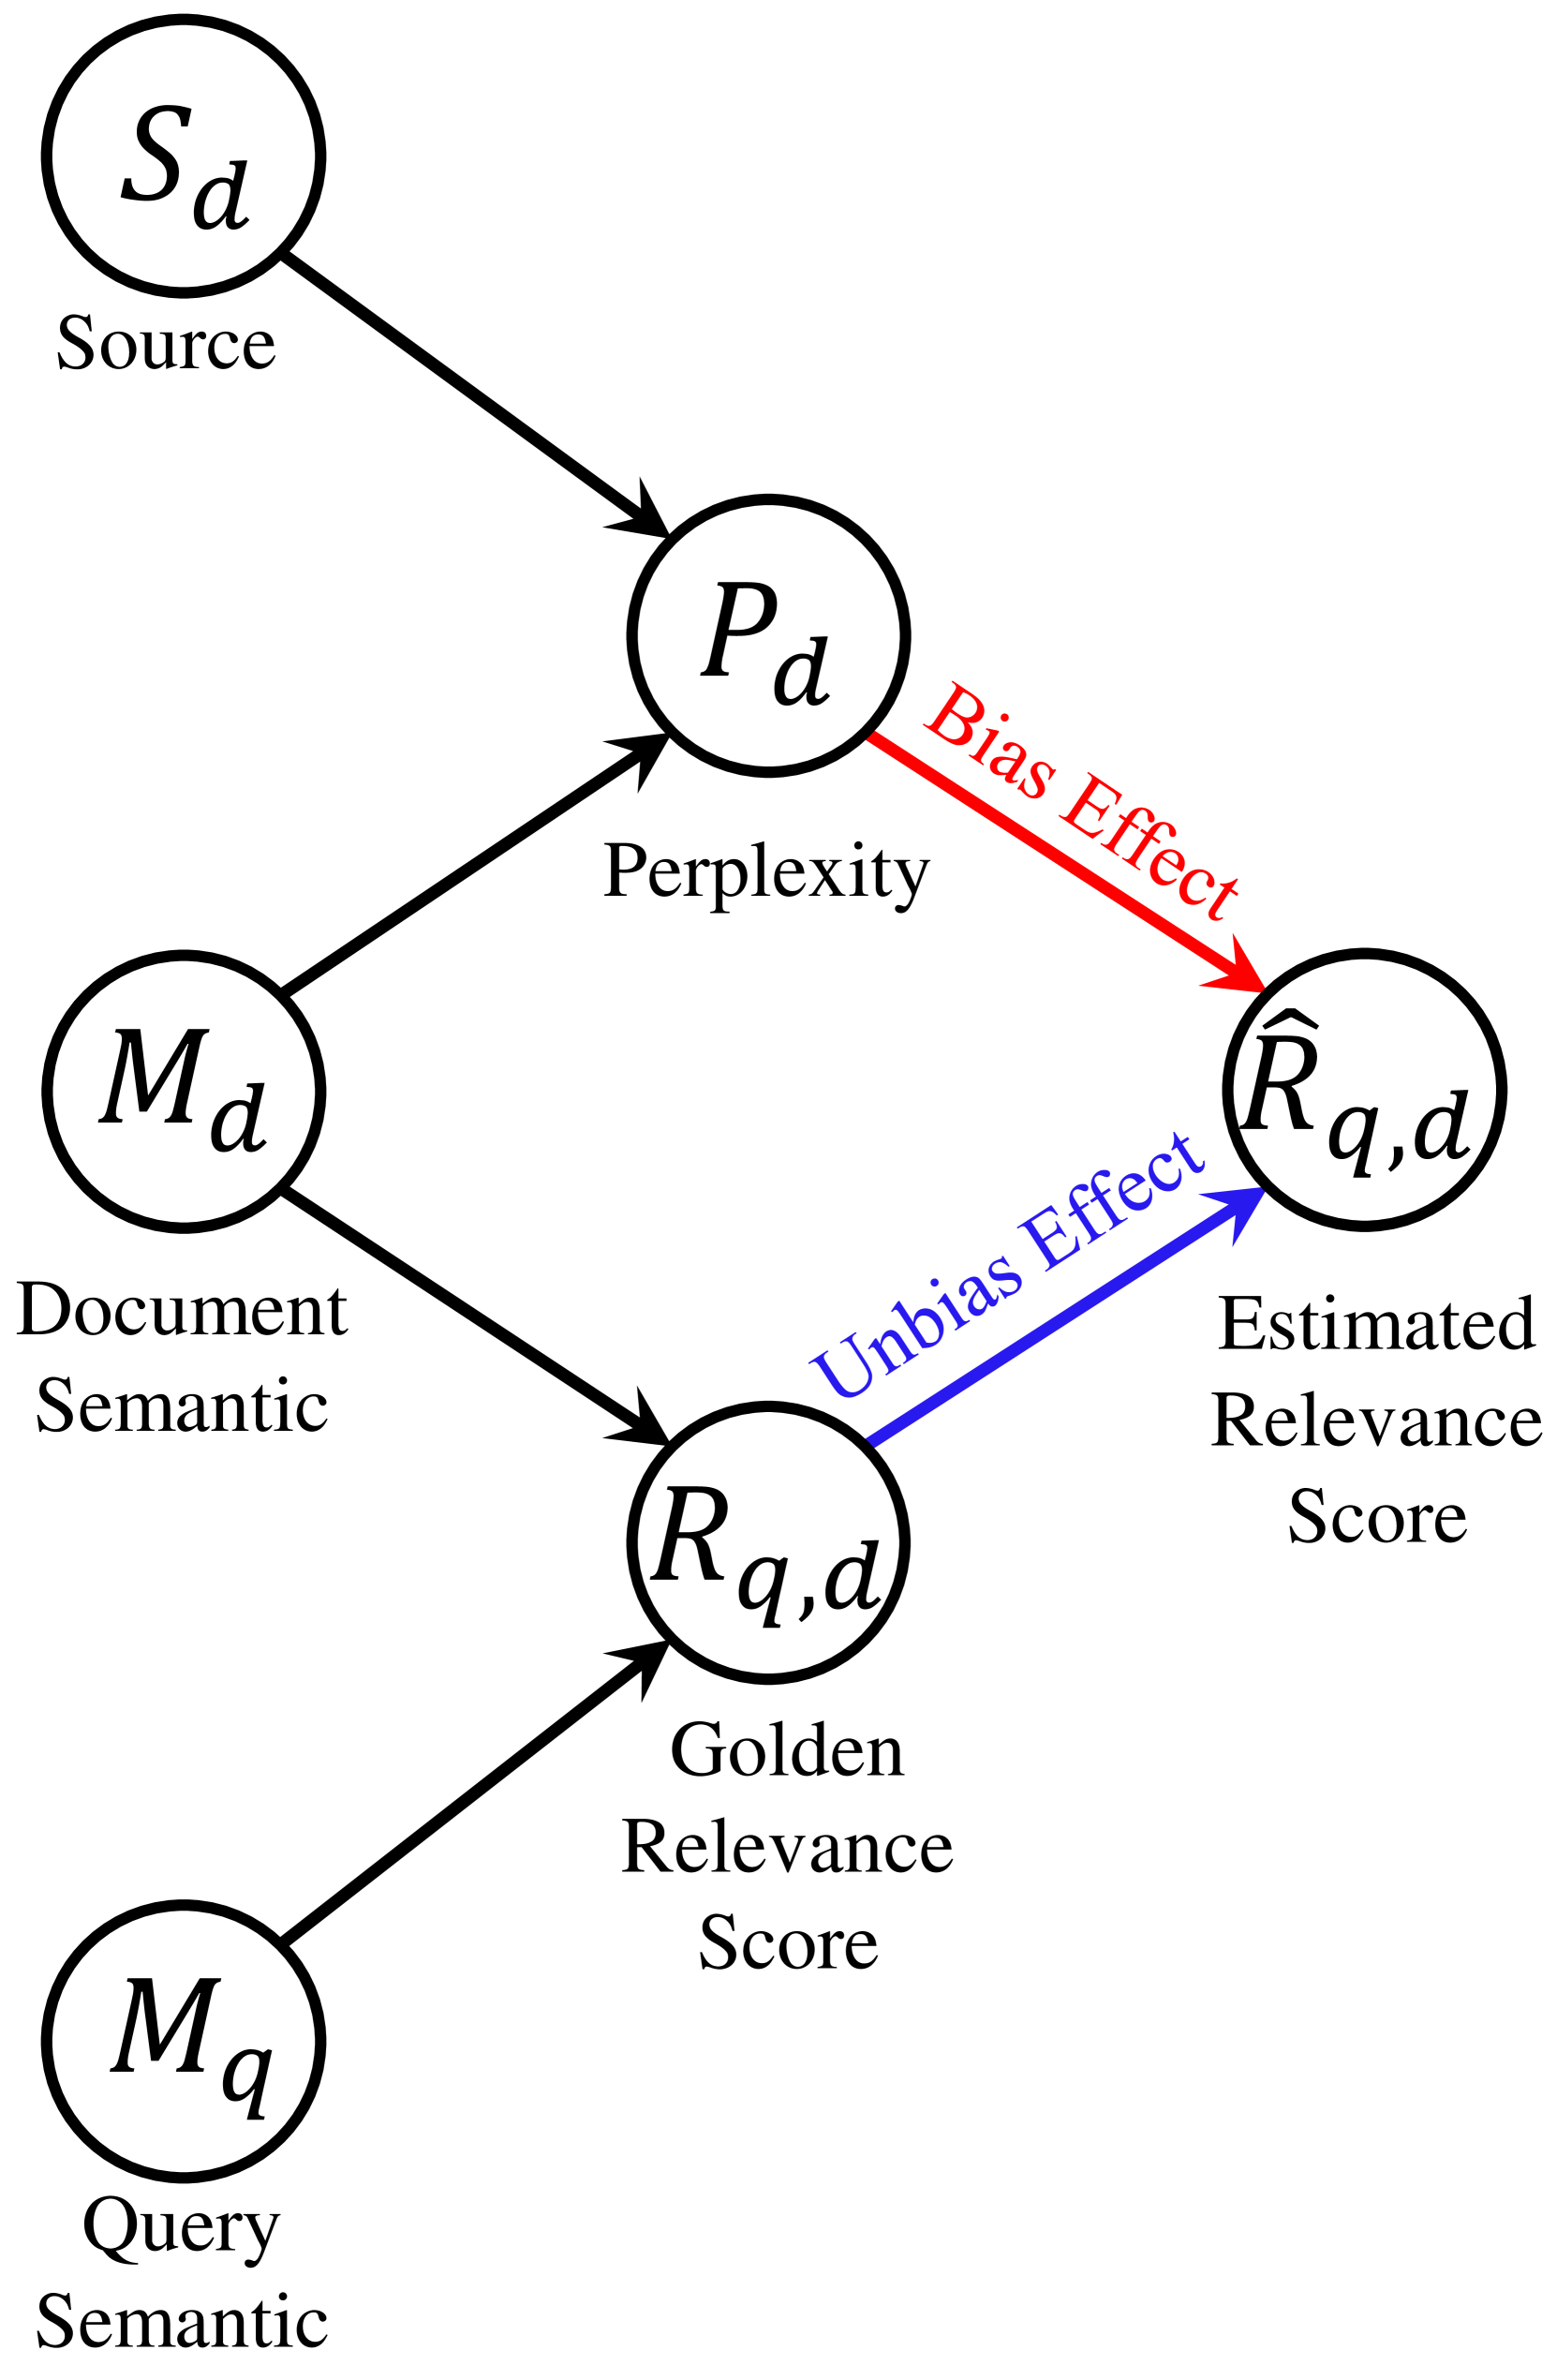
🔼 This causal graph illustrates the relationships between different factors contributing to source bias in PLM-based retrievers. The graph shows how the document source (human-written or LLM-generated), document semantics, query semantics, and document perplexity all influence the estimated relevance score. Crucially, it highlights the causal link between document perplexity and the estimated relevance score, indicating that low perplexity documents are causally assigned higher relevance scores regardless of their semantic quality, leading to source bias.
read the caption
Figure 2: The proposed causal graph for explaining source bias.

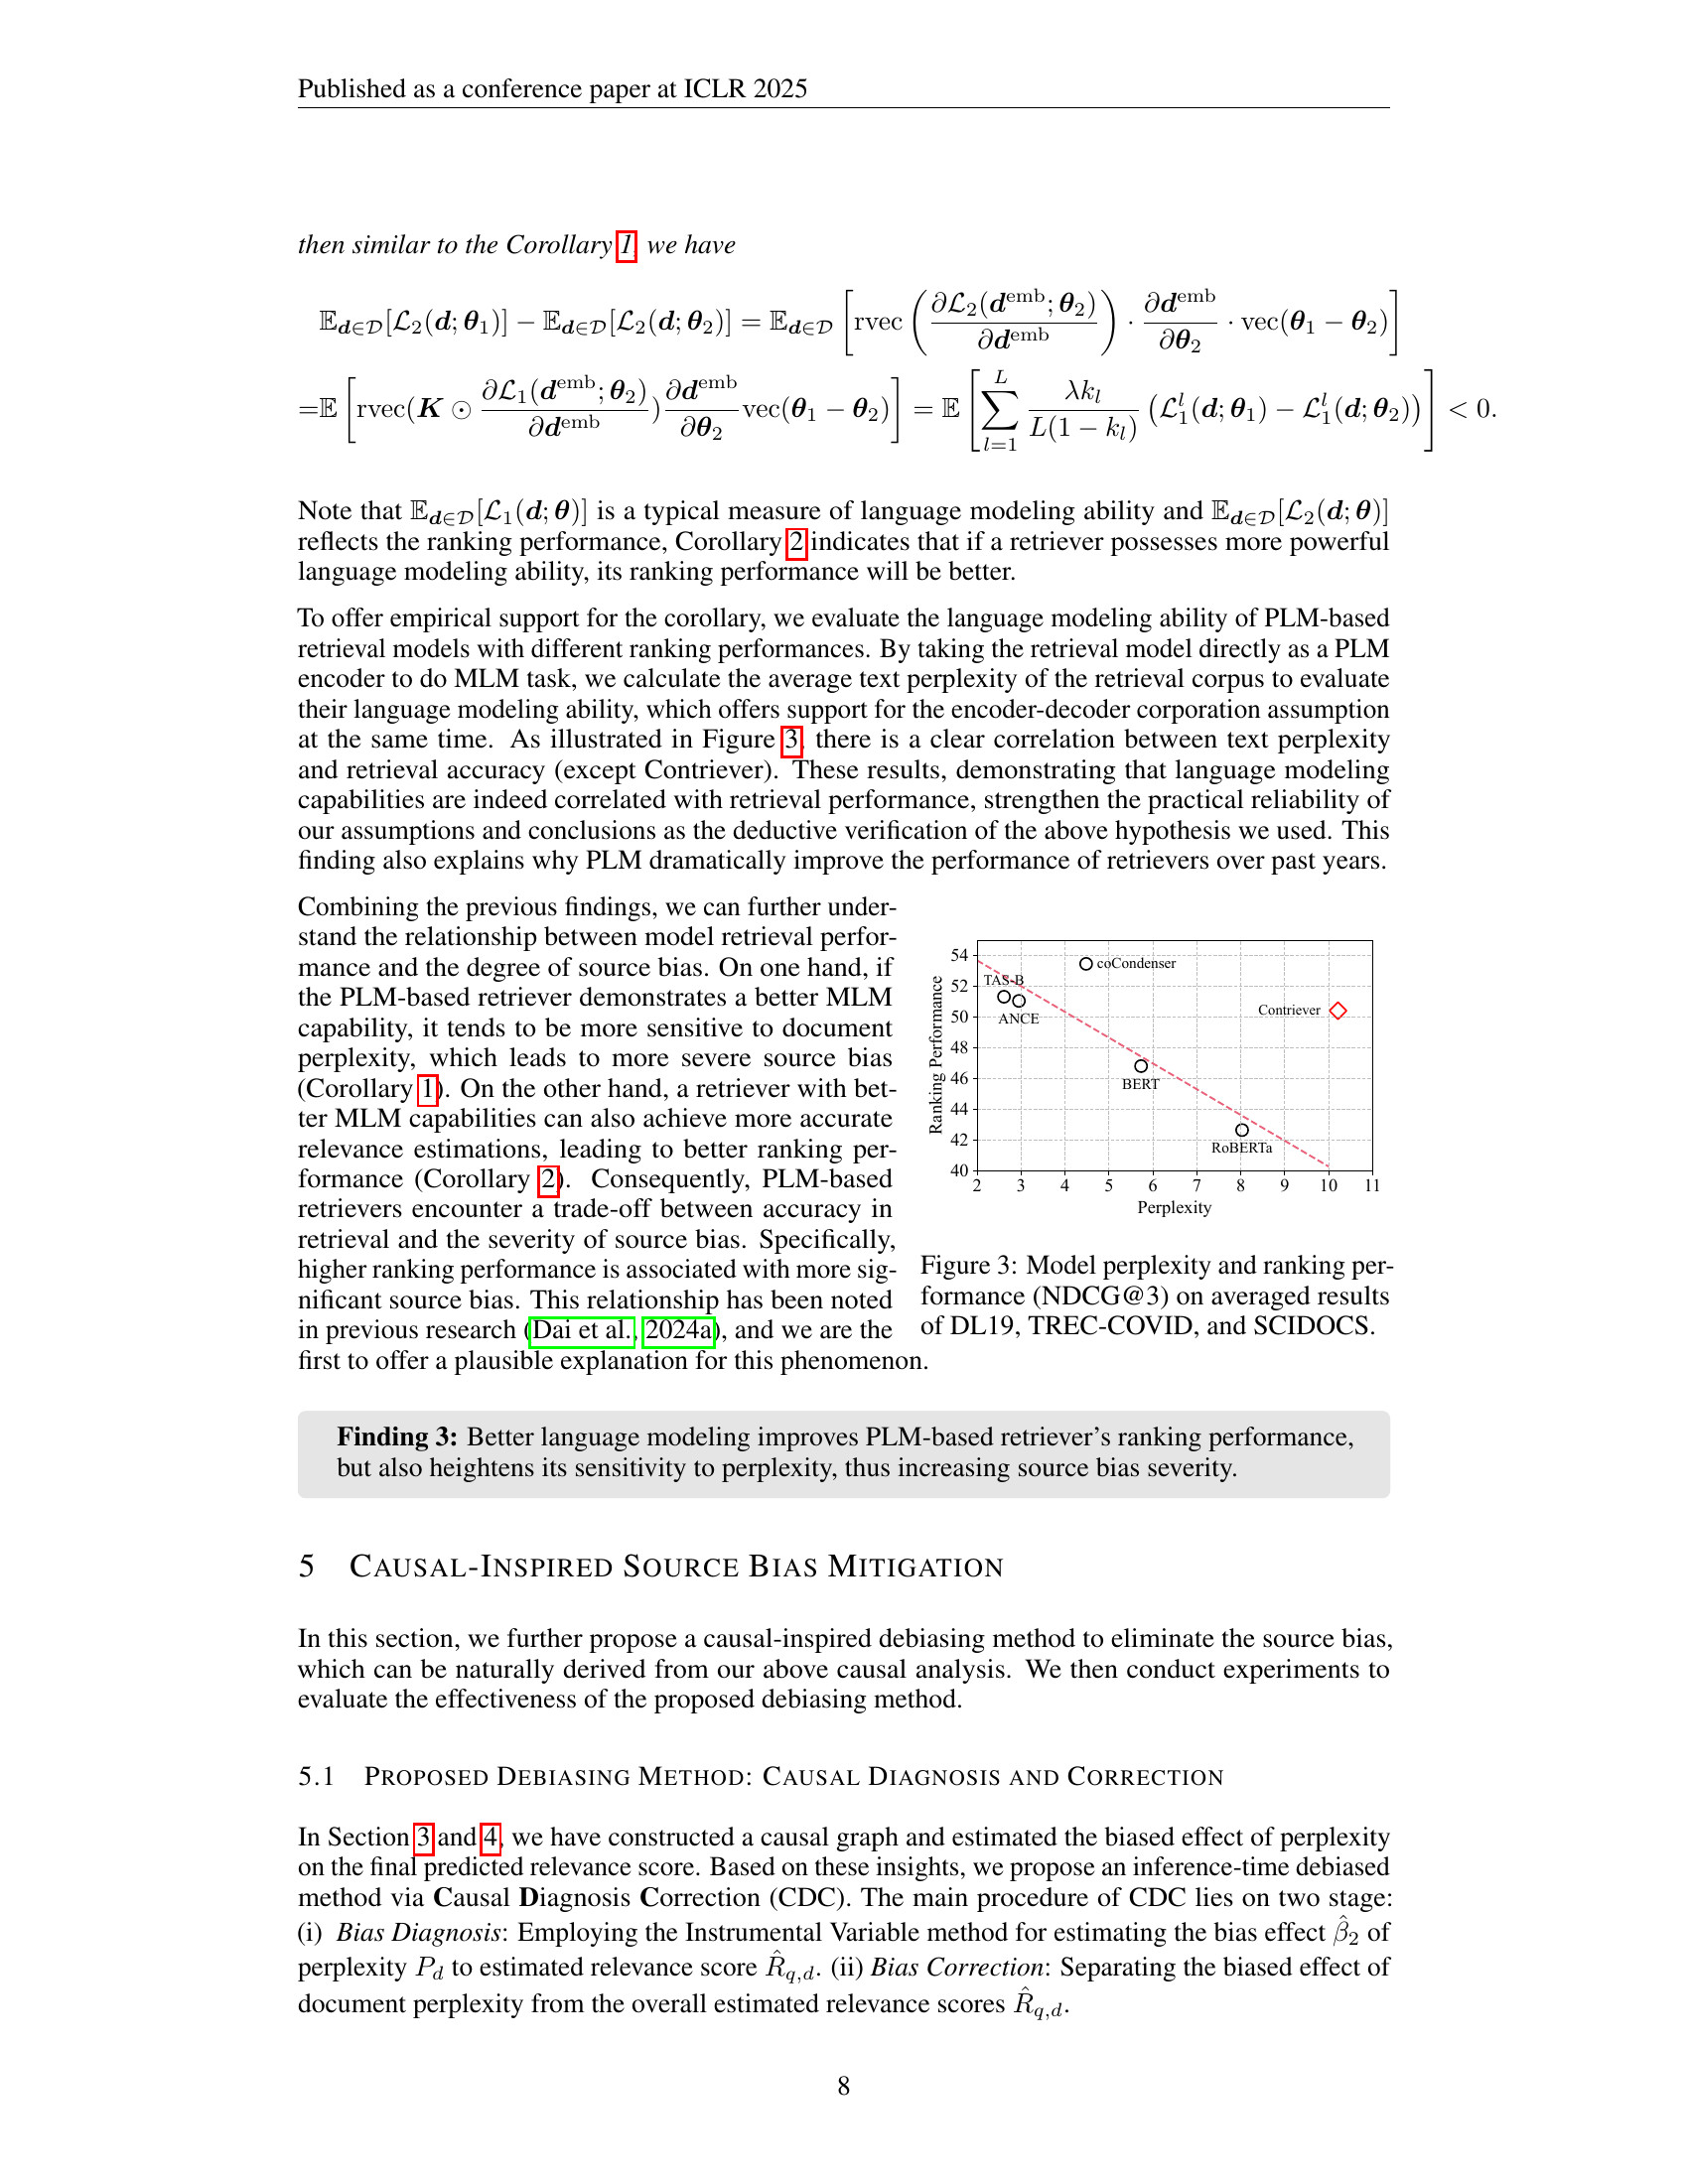
🔼 This figure visualizes the relationship between model perplexity and ranking performance (NDCG@3) across three datasets: DL19, TREC-COVID, and SCIDOCS. It shows that models with lower perplexity tend to exhibit better ranking performance. Each point represents the average perplexity and NDCG@3 score for a specific model. The x-axis shows the perplexity, and the y-axis shows the NDCG@3 score. This plot helps demonstrate the effect of perplexity on retrieval performance and supports the paper’s claim that lower perplexity scores lead to source bias because models tend to favor low perplexity documents.
read the caption
Figure 3: Model perplexity and ranking performance (NDCG@3) on averaged results of DL19, TREC-COVID, and SCIDOCS.

🔼 The figure illustrates the instrumental variable (IV) regression method used to disentangle the causal effect of document perplexity (Pd) on estimated relevance scores (Rq,d) from confounding factors. The method uses two-stage least squares (2SLS). In the first stage, the document source (Sd), acting as an instrumental variable, is regressed against document perplexity (Pd) to obtain predicted perplexity values. In the second stage, the predicted perplexity is used as a predictor to estimate the relevance scores (Rq,d). The causal effect of perplexity is derived from the coefficient (β̂2) of the predicted perplexity in the second stage.
read the caption
Figure 4: By leveraging IV regression on Sdsubscript𝑆𝑑S_{d}italic_S start_POSTSUBSCRIPT italic_d end_POSTSUBSCRIPT, Pdsubscript𝑃𝑑P_{d}italic_P start_POSTSUBSCRIPT italic_d end_POSTSUBSCRIPT is decomposed into causal and non-causal parts. A precise causal effect can be obtained from the coefficient of the second-stage regression, i.e., β^2subscript^𝛽2\hat{\beta}_{2}over^ start_ARG italic_β end_ARG start_POSTSUBSCRIPT 2 end_POSTSUBSCRIPT.

🔼 The figure shows the perplexity and estimated relevance scores for documents generated by LLMs with different sampling temperatures on the DL19 dataset. The x-axis represents the sampling temperature, ranging from 0 to 1. The y-axis on the left shows the perplexity of the generated documents. The y-axis on the right shows the estimated relevance scores given by the retriever. The plot visually demonstrates a strong negative correlation between document perplexity and estimated relevance scores. Lower perplexity documents receive higher relevance scores, highlighting the source bias problem.
read the caption
(a) DL19

🔼 The figure shows the perplexity and estimated relevance scores for the TREC-COVID dataset, where documents are generated by an LLM with different sampling temperatures. The x-axis represents the sampling temperature, and the y-axis shows the perplexity and relevance score. The graph illustrates the negative correlation between perplexity and estimated relevance scores. Lower perplexity documents receive higher relevance scores, demonstrating the source bias of PLM-based retrievers.
read the caption
(b) TREC-COVID

🔼 The figure shows the relationship between perplexity and estimated relevance scores for the SCIDOCS dataset. Specifically, it displays how the estimated relevance score changes as a function of the perplexity, highlighting the inverse relationship where lower perplexity documents receive higher relevance scores. The data was obtained by generating LLM-rewritten documents with varying sampling temperatures. The Pearson correlation coefficient is also shown to quantify the strength of the negative relationship.
read the caption
(c) SCIDOCS

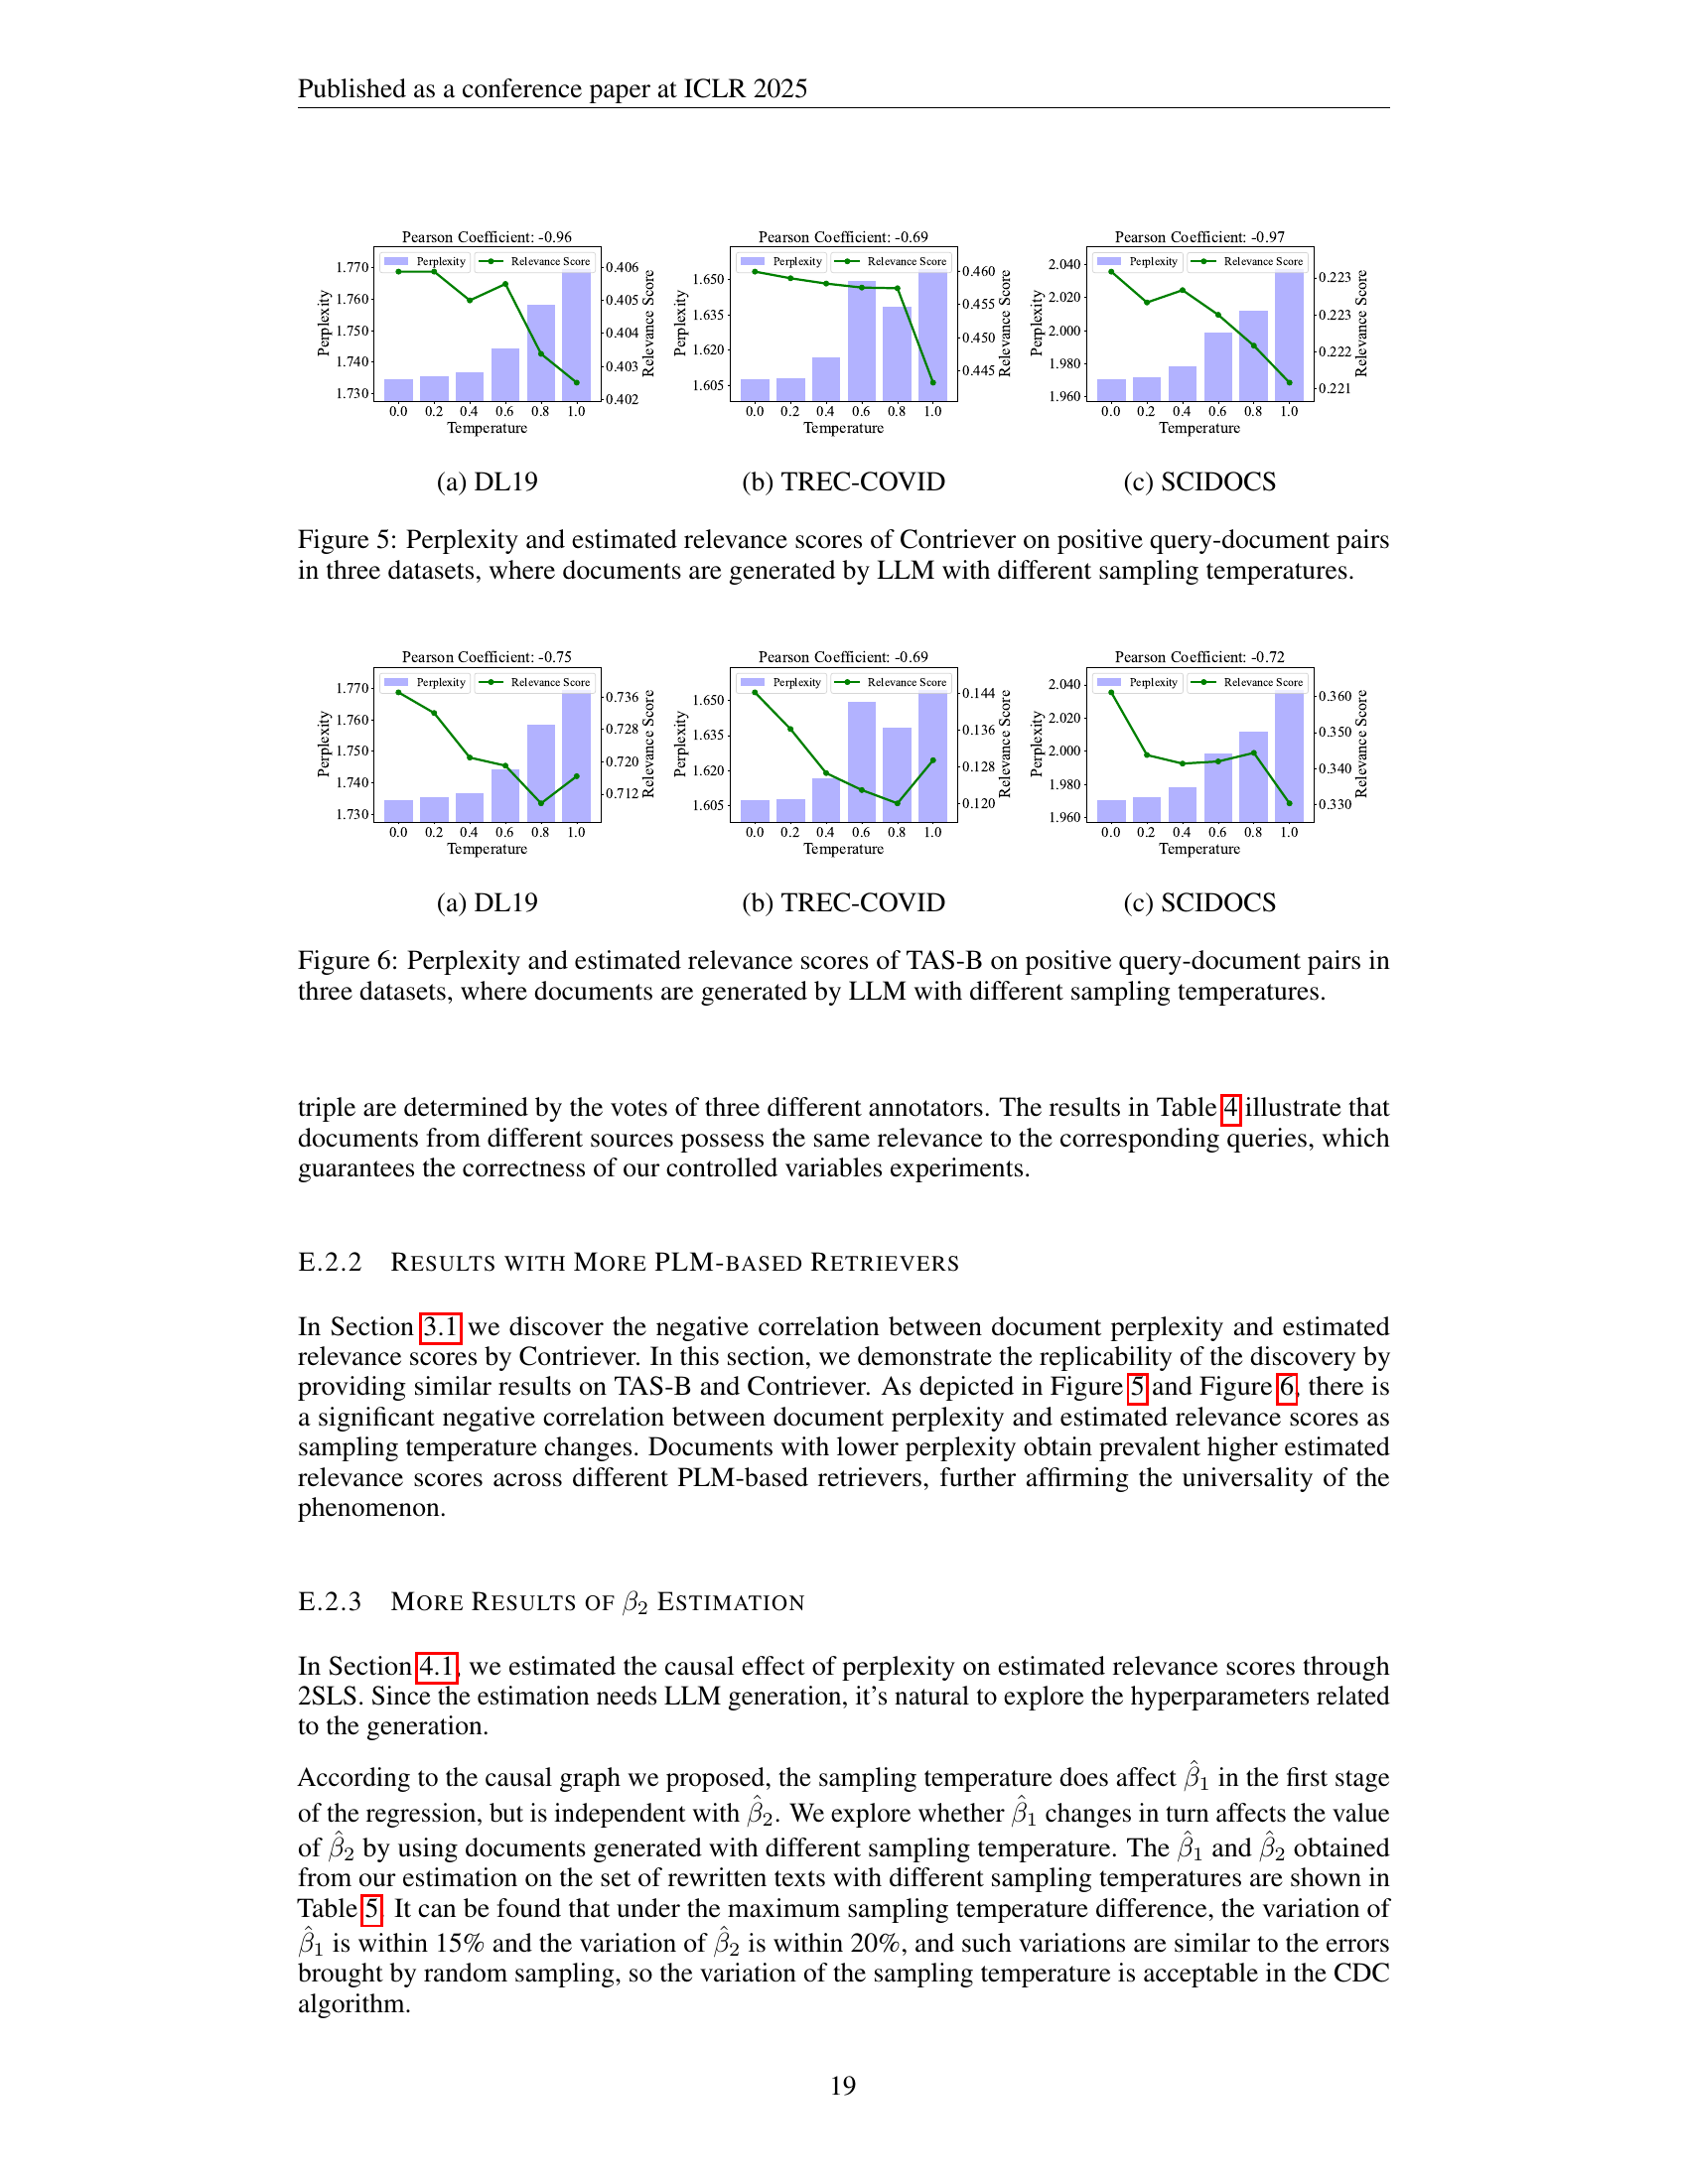
🔼 This figure displays the relationship between perplexity and estimated relevance scores produced by the Contriever model. Three datasets are used, and in each, documents were generated by an LLM using various sampling temperatures. The x-axis represents the sampling temperature, and the y-axes show both perplexity and the estimated relevance scores. The plots illustrate a negative correlation between perplexity and estimated relevance, indicating that lower-perplexity documents (those generated with lower sampling temperatures) tend to receive higher relevance scores.
read the caption
Figure 5: Perplexity and estimated relevance scores of Contriever on positive query-document pairs in three datasets, where documents are generated by LLM with different sampling temperatures.
🔼 The figure shows the perplexity and estimated relevance scores for the DL19 dataset, where documents were generated by an LLM with different sampling temperatures. The x-axis represents the sampling temperature, while the y-axis shows the perplexity and estimated relevance scores. The Pearson correlation coefficient is also displayed, highlighting the significant negative correlation between perplexity and estimated relevance scores. This illustrates that documents with lower perplexity are given higher estimated relevance scores by the PLM-based retriever, leading to source bias.
read the caption
(a) DL19
More on tables
| Model | DL19 (In-Domain) | TREC-COVID (Out-of-Domain) | SCIDOCS (Out-of-Domain) | |||||||||
|---|---|---|---|---|---|---|---|---|---|---|---|---|
| Performance | Bias | Performance | Bias | Performance | Bias | |||||||
| Raw | +CDC | Raw | +CDC | Raw | +CDC | Raw | +CDC | Raw | +CDC | Raw | +CDC | |
| BERT | 75.92 | 77.65 | -23.68 | 5.90 | 53.72 | 45.88 | -39.58 | -18.40 | 10.80 | 10.44 | -2.85 | 29.19 |
| Roberta | 72.79 | 71.33 | -36.32 | 4.45 | 46.31 | 45.86 | -48.14 | -10.51 | 8.85 | 8.24 | -30.90 | 32.13 |
| ANCE | 69.41 | 67.73 | -21.03 | 34.95 | 71.01 | 69.94 | -33.59 | -1.94 | 12.73 | 12.31 | -1.57 | 26.26 |
| TAS-B | 74.97 | 75.63 | -49.17 | -9.97 | 63.95 | 62.84 | -73.36 | -37.42 | 15.04 | 14.15 | -1.90 | 23.48 |
| Contriever | 72.61 | 73.83 | -21.93 | -5.33 | 63.17 | 61.35 | -62.26 | -31.33 | 15.45 | 15.09 | -6.96 | 1.63 |
| coCondenser | 75.50 | 75.36 | -18.99 | 9.60 | 70.94 | 71.07 | -67.95 | -45.39 | 13.93 | 13.79 | -5.95 | 1.06 |
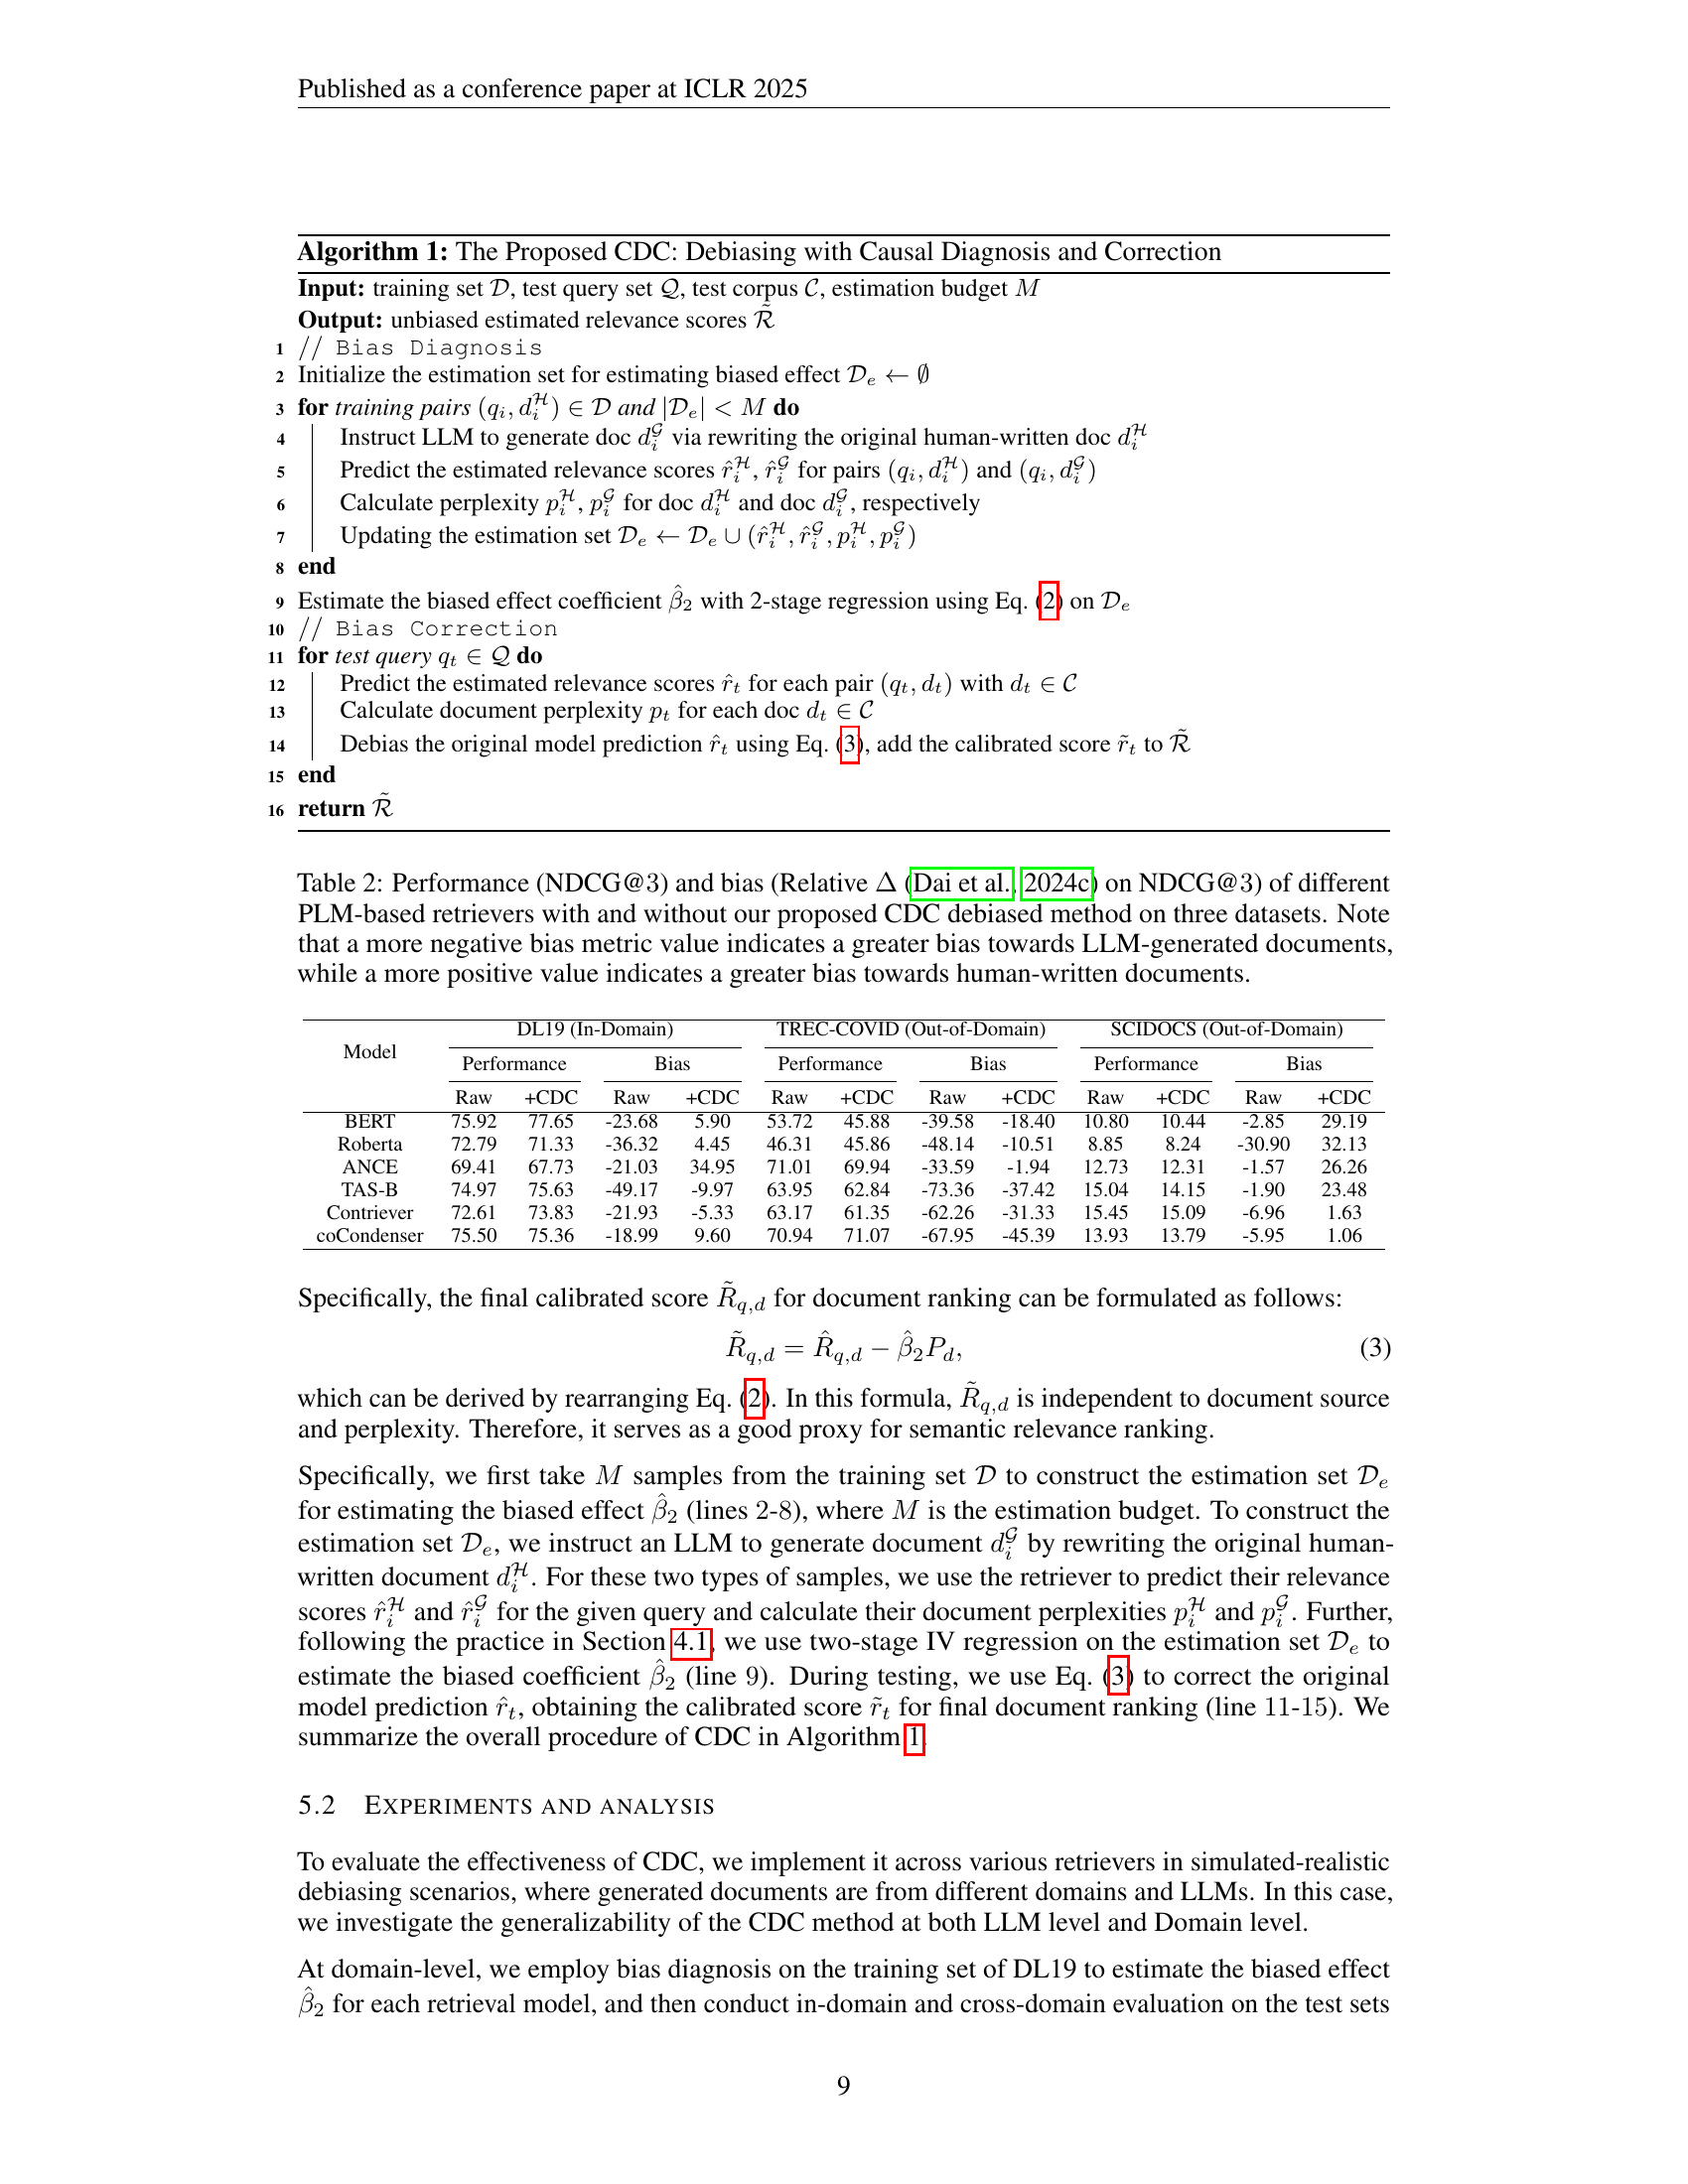
🔼 This table presents the performance and bias of several popular PLM-based retrieval models, with and without the application of the proposed CDC debiased method. Performance is measured using NDCG@3 on three different datasets. The bias metric (Relative Δ) indicates the preference of the model towards either LLM-generated or human-written documents; a more negative value suggests stronger bias towards LLM-generated content, while a more positive value indicates bias towards human-written content.
read the caption
Table 2: Performance (NDCG@3333) and bias (Relative ΔΔ\Deltaroman_Δ (Dai et al., 2024c) on NDCG@3333) of different PLM-based retrievers with and without our proposed CDC debiased method on three datasets. Note that a more negative bias metric value indicates a greater bias towards LLM-generated documents, while a more positive value indicates a greater bias towards human-written documents.
| Model | Llama-2 (In-Domain) | GPT-4 (Out-of-Domain) | GPT-3.5 (Out-of-Domain) | Mistral (Out-of-Domain) | ||||||||||||
|---|---|---|---|---|---|---|---|---|---|---|---|---|---|---|---|---|
| Performance | Bias | Performance | Bias | Performance | Bias | Performance | Bias | |||||||||
| Raw | +CDC | Raw | +CDC | Raw | +CDC | Raw | +CDC | Raw | +CDC | Raw | +CDC | Raw | +CDC | Raw | +CDC | |
| BERT | 35.67 | 35.08 | -12.37 | 6.75 | 36.47 | 35.75 | -3.69 | 6.04 | 35.97 | 35.27 | -5.03 | 18.08 | 35.13 | 35.08 | 0.73 | 13.07 |
| RoBERTa | 38.09 | 36.76 | -29.54 | -0.88 | 38.53 | 37.70 | -11.98 | 4.52 | 39.17 | 38.00 | -35.39 | 14.09 | 38.29 | 37.28 | -17.95 | 16.78 |
| ANCE | 42.13 | 42.13 | -8.81 | 4.59 | 42.67 | 42.99 | -5.53 | 3.28 | 42.76 | 42.96 | -13.59 | 6.09 | 42.62 | 42.71 | -8.59 | 1.82 |
| TAS-B | 52.95 | 53.94 | -15.04 | -7.96 | 52.12 | 52.44 | -4.94 | -0.05 | 52.83 | 52.90 | -5.65 | 5.57 | 52.18 | 52.69 | -8.71 | -2.00 |
| Contriever | 55.19 | 55.37 | -2.87 | 1.07 | 55.78 | 55.70 | -5.32 | -4.44 | 56.11 | 56.17 | -7.43 | -2.81 | 56.13 | 56.28 | -4.13 | -2.39 |
| coCondenser | 49.53 | 49.40 | -12.98 | -9.26 | 48.57 | 48.91 | 5.04 | 6.04 | 48.59 | 48.81 | -1.00 | 5.30 | 49.57 | 49.92 | -5.90 | -0.76 |
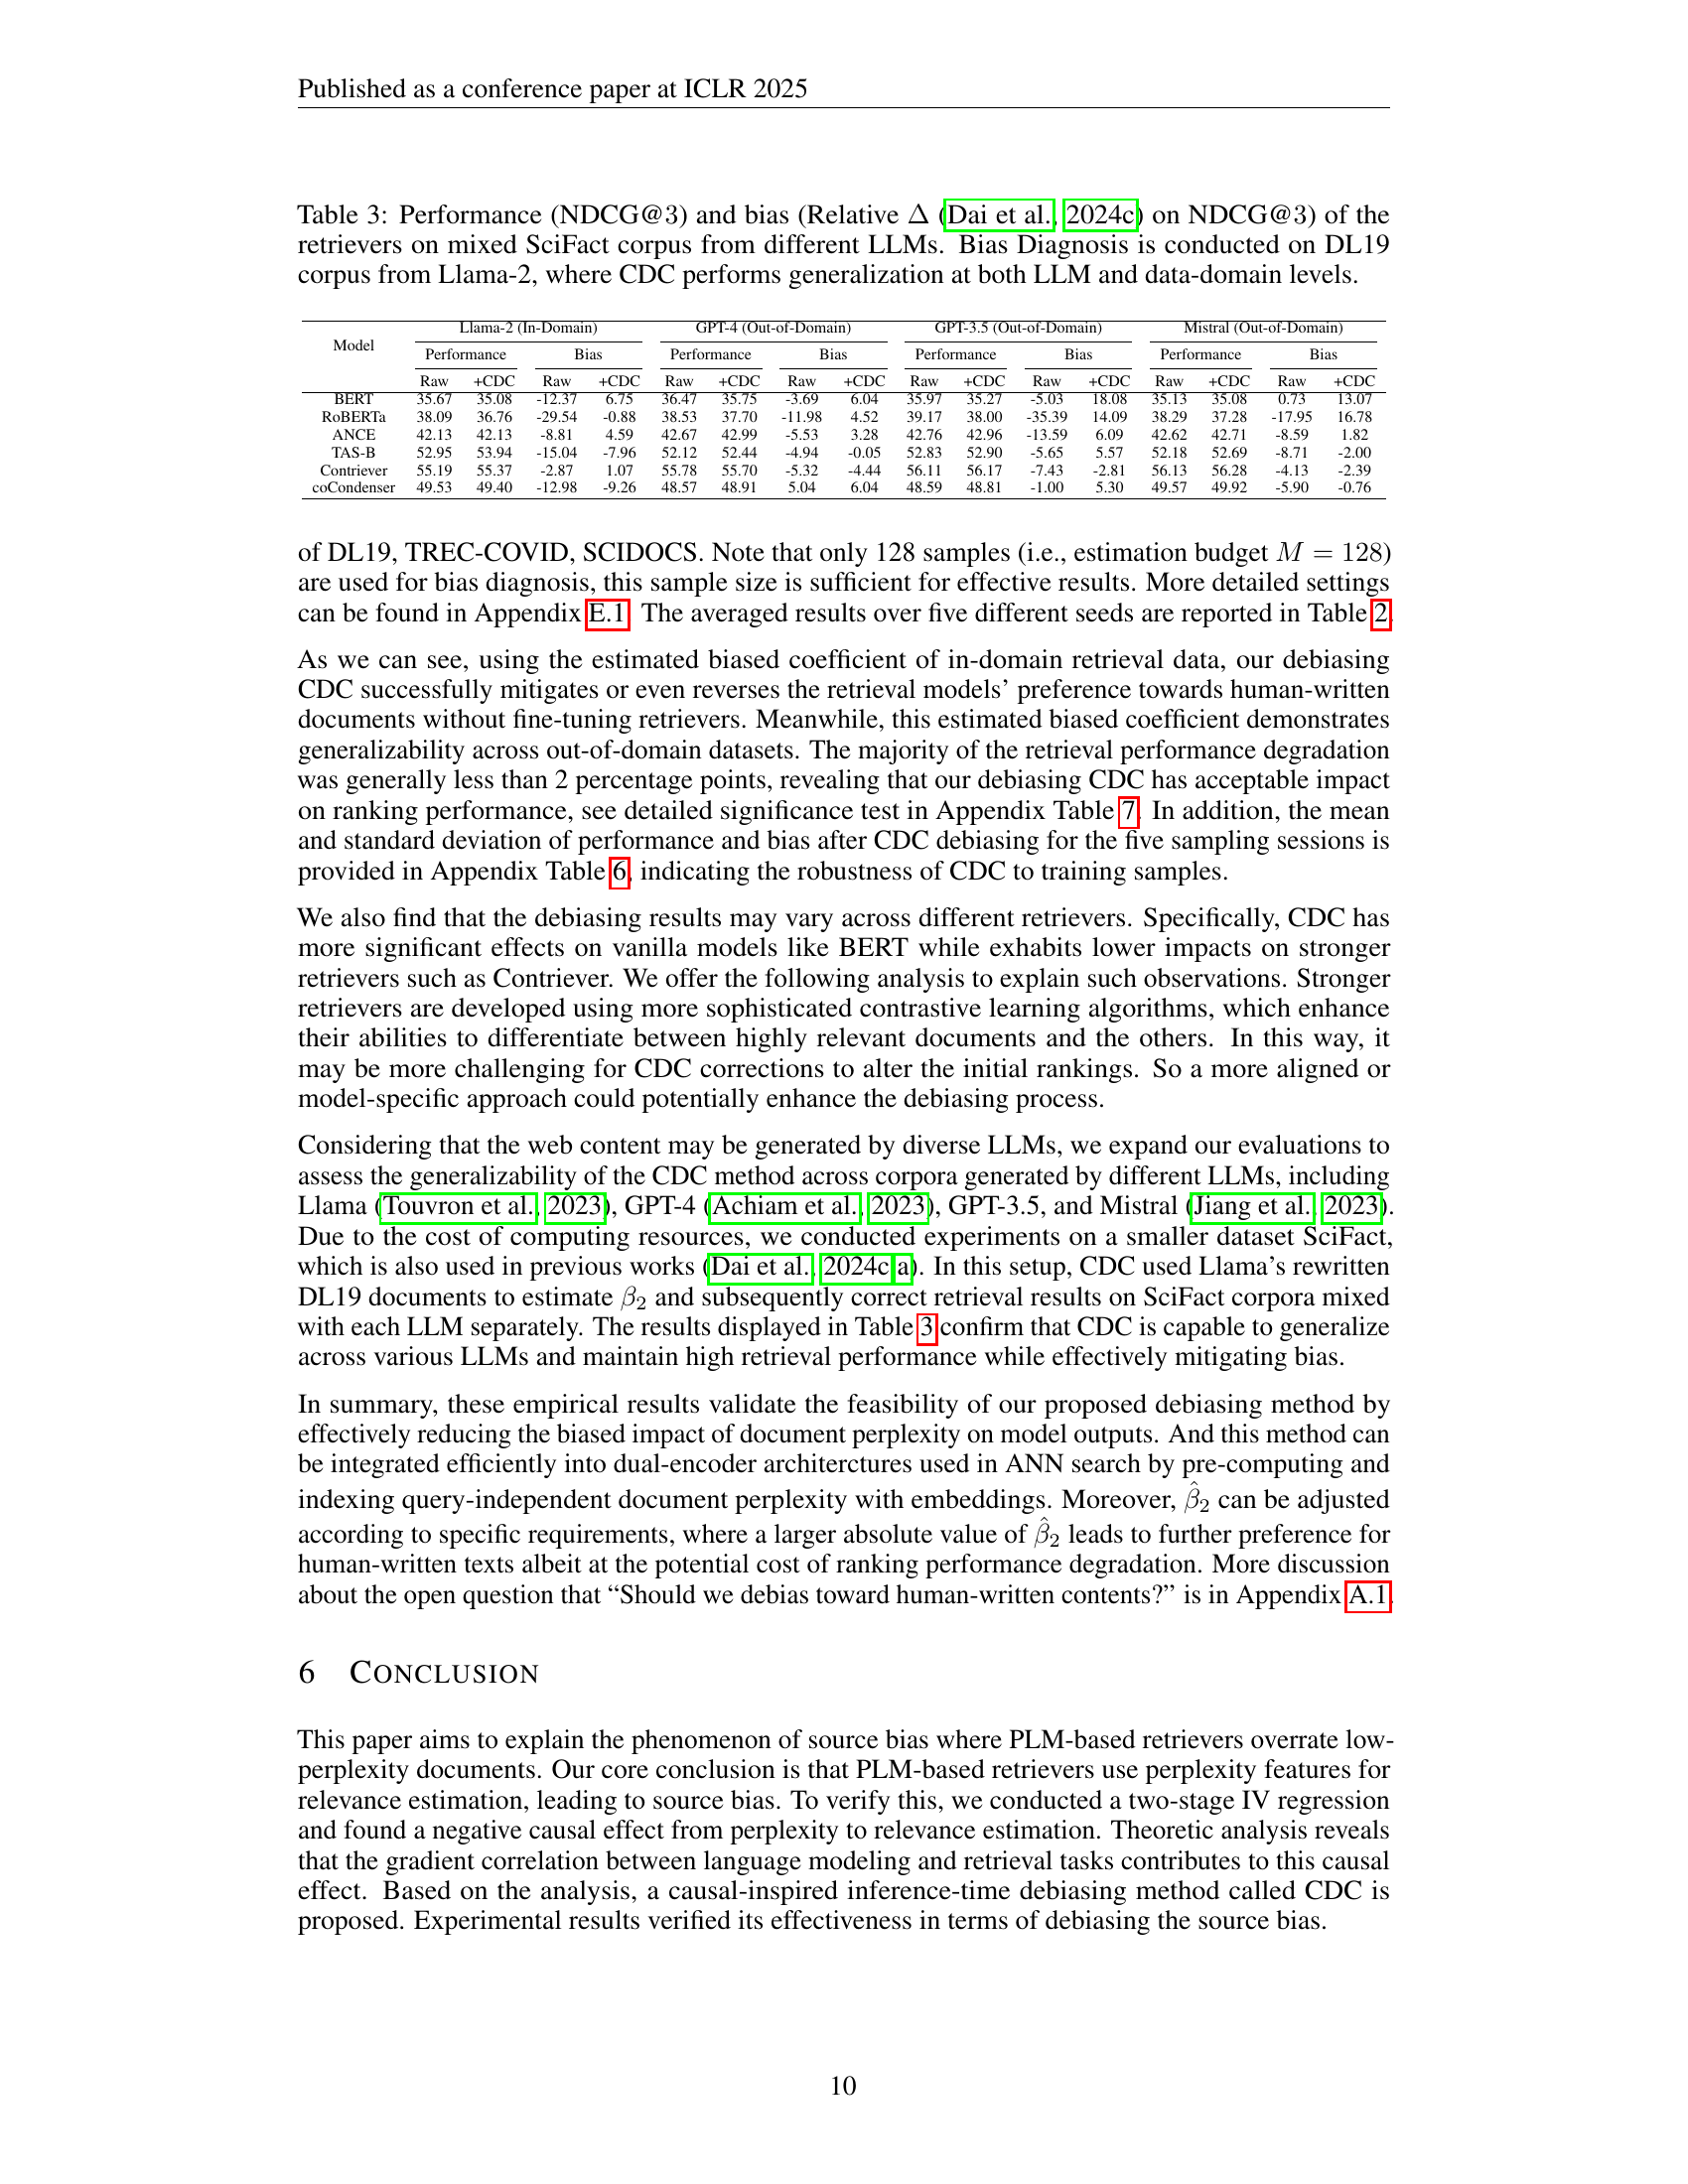
🔼 Table 3 presents the NDCG@3 scores and relative bias (measuring the difference in NDCG@3 scores between human-written and LLM-generated documents) for various retrieval models on a mixed SciFact dataset comprising documents generated by different LLMs. The Bias Diagnosis was performed on the DL19 dataset using Llama-2, and the Causal Diagnosis and Correction (CDC) method’s generalizability was then tested across both different LLMs and datasets. This demonstrates whether a model trained to debias on one LLM and dataset can effectively debias on different LLMs and datasets.
read the caption
Table 3: Performance (NDCG@3333) and bias (Relative ΔΔ\Deltaroman_Δ (Dai et al., 2024c) on NDCG@3333) of the retrievers on mixed SciFact corpus from different LLMs. Bias Diagnosis is conducted on DL19 corpus from Llama-2, where CDC performs generalization at both LLM and data-domain levels.
| Temperature | DL19 | ||
| Human | LLM | Equal | |
| 0.00 | 0.0% (0.0%) | 5% (0.0%) | 95% (83.8%) |
| 0.20 | 0.0%(0.0%) | 5% (0.0%) | 95% (94.2%) |
| 0.40 | 0.0% (0.0%) | 0.0% (0.0%) | 100% (79.6%) |
| 0.60 | 0.0% (0.0%) | 0.0% (0.0%) | 100% (84.6%) |
| 0.80 | 0.0% (0.0%) | 0.0% (0.0%) | 100% (94.5%) |
| 1.00 | 0.0%(0.0%) | 0.0% (0.0%) | 100% (94.5%) |
| Temperature | TREC-COVID | ||
| Human | LLM | Equal | |
| 0.00 | 0.0% (0.0%) | 0.0% (0.0%) | 100% (84.6%) |
| 0.20 | 0.0% (0.0%) | 0.0% (0.0%) | 100% (94.5%) |
| 0.40 | 0.0% (0.0%) | 0.0% (0.0%) | 100% (74.6%) |
| 0.60 | 0.0% (0.0%) | 0.0% (0.0%) | 100% (94.5%) |
| 0.80 | 0.0% (0.0%) | 0.0% (0.0%) | 100% (79.6%) |
| 1.00 | 0.0% (0.0%) | 0.0% (0.0%) | 100% (84.6%) |
| Temperature | SCIDOCS | ||
| Human | LLM | Equal | |
| 0.00 | 0.0% (0.0%) | 0.0% (0.0%) | 100% (84.6%) |
| 0.20 | 0.0% (0.0%) | 0.0% (0.0%) | 100% (84.6%) |
| 0.40 | 0.0% (0.0%) | 0.0% (0.0%) | 100% (79.6%) |
| 0.60 | 0.0% (0.0%) | 5.0% (0.0%) | 95% (83.8%) |
| 0.80 | 0.0% (0.0%) | 0.0% (0.0%) | 100% (79.6%) |
| 1.00 | 0.0% (0.0%) | 5% (0.0%) | 95% (89.0%) |
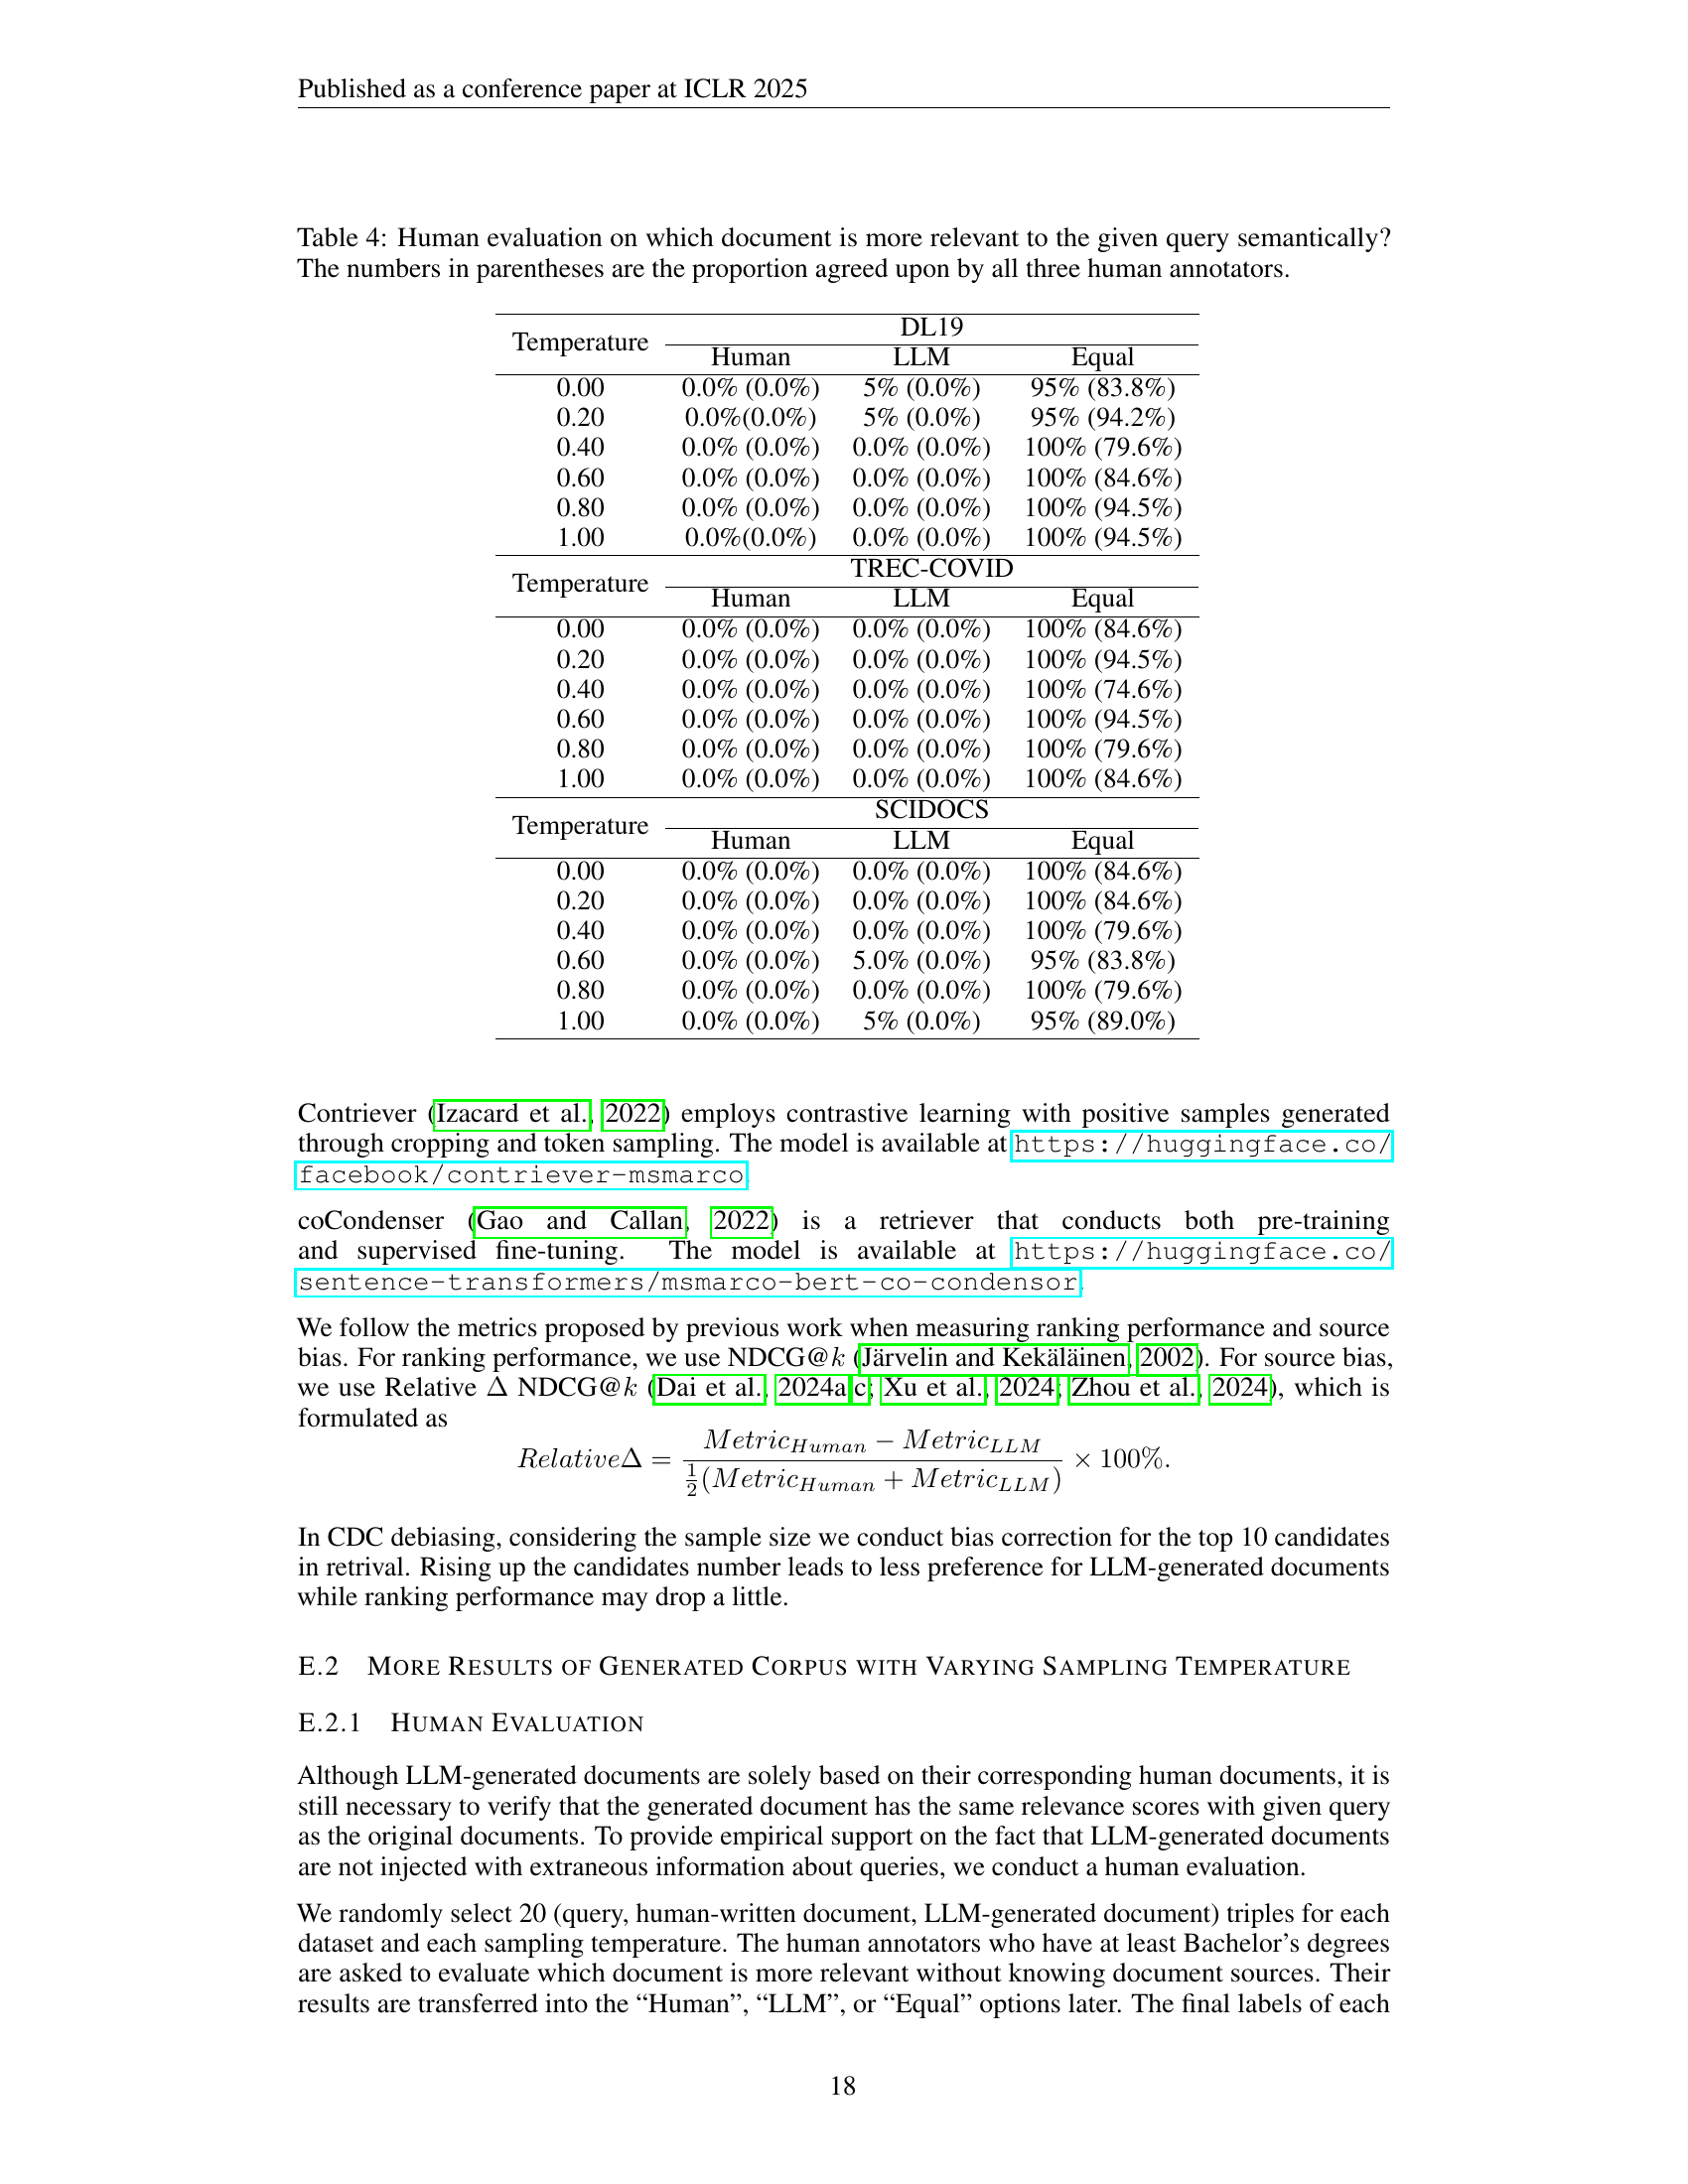
🔼 This table presents the results of a human evaluation experiment designed to assess the semantic relevance of LLM-generated versus human-written documents. Three human annotators evaluated pairs of documents (one human-written and one LLM-generated) for each of three datasets (DL19, TREC-COVID, SCIDOCS) and various sampling temperatures. The evaluation focused on which document within each pair was more semantically relevant to the given query. The numbers in parentheses represent the percentage of annotators who unanimously agreed on the more relevant document.
read the caption
Table 4: Human evaluation on which document is more relevant to the given query semantically? The numbers in parentheses are the proportion agreed upon by all three human annotators.
| DL19 | TREC-COVID | SCIDOCS | ||||||||||
|---|---|---|---|---|---|---|---|---|---|---|---|---|
| Temperature | 0.0 | 0.2 | 0.4 | 0.6 | 0.0 | 0.2 | 0.4 | 0.6 | 0.0 | 0.2 | 0.4 | 0.6 |
| (BERT) | -7.80 | -7.78 | -7.77 | -7.94 | -1.21 | -1.20 | -1.24 | -1.26 | -2.29 | -2.29 | -2.33 | -2.46 |
| (RoBERTa) | -23.57 | -23.50 | -23.45 | -23.97 | 1.73 | 1.73 | 1.77 | 1.80 | -6.02 | -6.04 | -6.13 | -6.47 |
| (ANCE) | -0.44 | -0.44 | -0.44 | -0.45 | 0.07 | 0.07 | 0.07 | 0.07 | -0.22 | -0.22 | -0.22 | -0.23 |
| (TAS-B) | -0.81 | -0.80 | -0.80 | -0.82 | -0.34 | -0.34 | -0.35 | -0.35 | -0.37 | -0.37 | -0.37 | -0.39 |
| (Contriever) | -0.01 | -0.01 | -0.01 | -0.01 | -0.03 | -0.03 | -0.04 | -0.04 | -0.02 | -0.02 | -0.02 | -0.02 |
| (coCondenser) | -0.58 | -0.58 | -0.58 | -0.59 | -0.23 | -0.23 | -0.24 | -0.24 | -0.25 | -0.25 | -0.25 | -0.26 |
| -0.44 | -0.44 | -0.44 | -0.43 | -0.41 | -0.41 | -0.40 | -0.39 | -0.41 | -0.40 | -0.40 | -0.38 | |
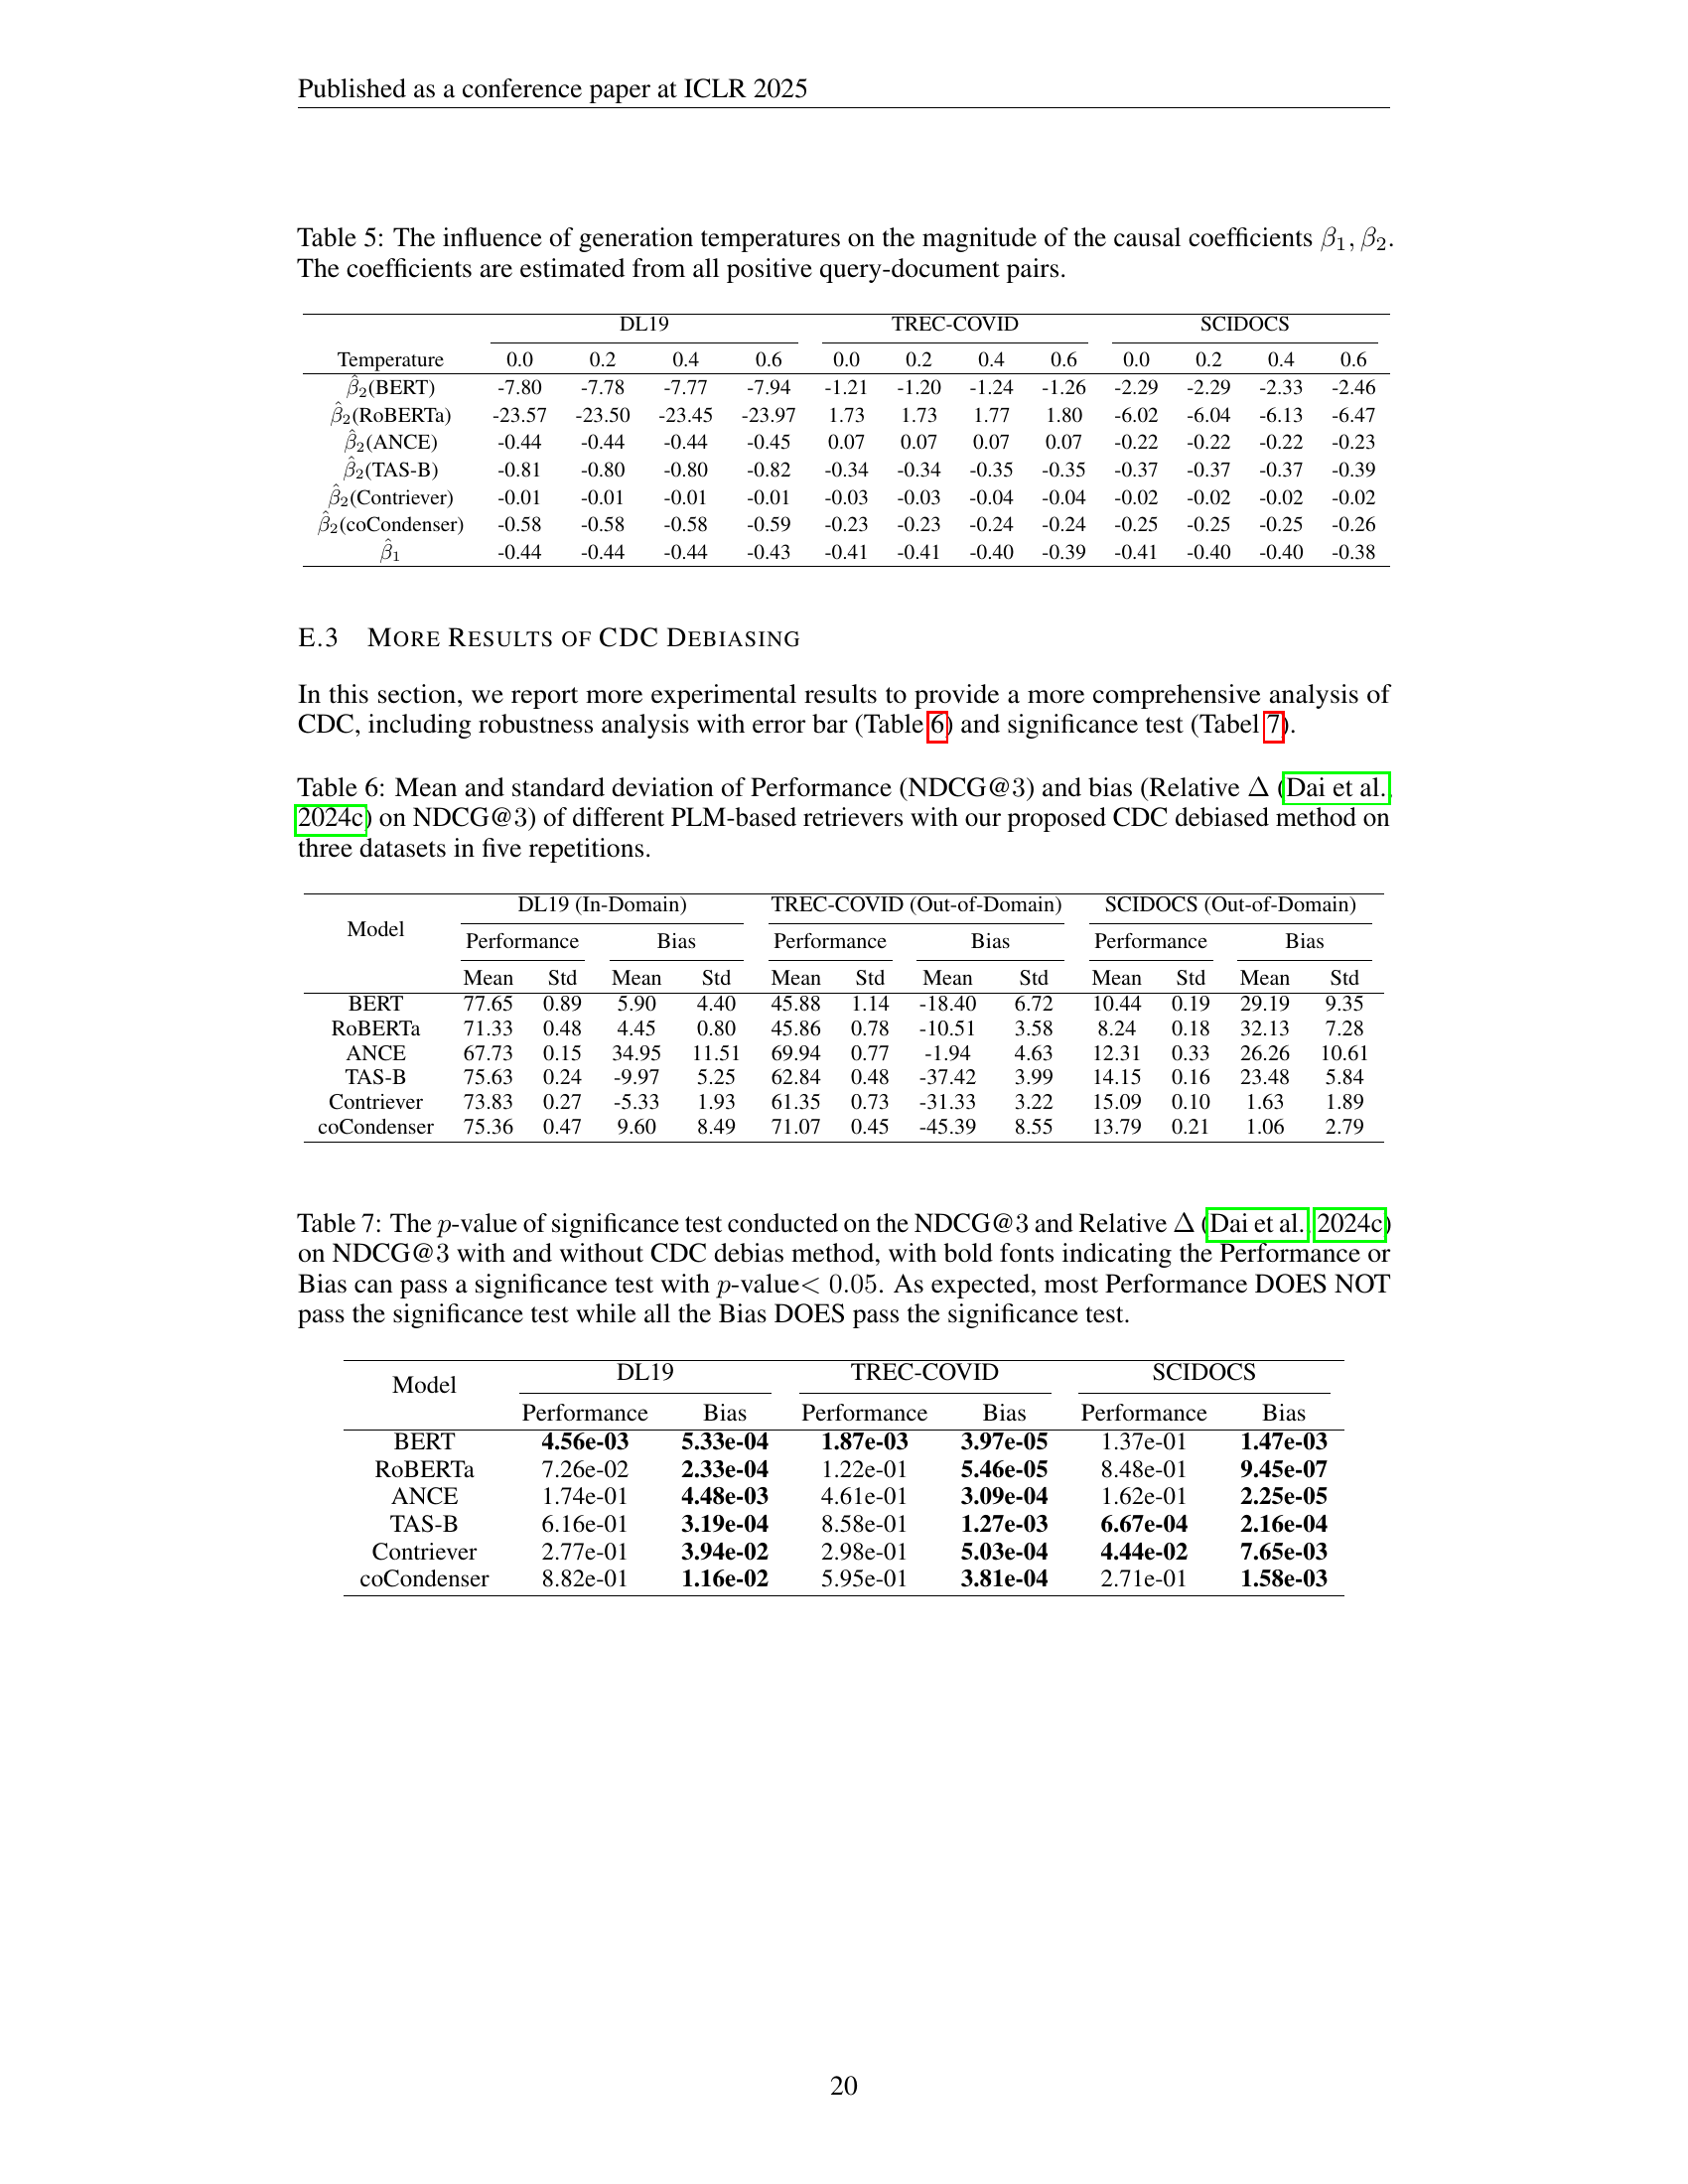
🔼 This table shows how changing the temperature parameter during the generation of LLM-rewritten documents affects the estimated causal coefficients (β1 and β2). These coefficients represent the impact of document perplexity on the estimated relevance scores. The analysis is done for three different datasets (DL19, TREC-COVID, SCIDOCS) and six different PLM-based retrieval models (BERT, RoBERTa, ANCE, TAS-B, Contriever, and coCondenser). The table helps to demonstrate that the causal effect of perplexity on relevance scores is robust across various datasets, models, and generation temperatures.
read the caption
Table 5: The influence of generation temperatures on the magnitude of the causal coefficients β1,β2subscript𝛽1subscript𝛽2\beta_{1},\beta_{2}italic_β start_POSTSUBSCRIPT 1 end_POSTSUBSCRIPT , italic_β start_POSTSUBSCRIPT 2 end_POSTSUBSCRIPT. The coefficients are estimated from all positive query-document pairs.
| Model | DL19 (In-Domain) | TREC-COVID (Out-of-Domain) | SCIDOCS (Out-of-Domain) | |||||||||
| Performance | Bias | Performance | Bias | Performance | Bias | |||||||
| Mean | Std | Mean | Std | Mean | Std | Mean | Std | Mean | Std | Mean | Std | |
| BERT | 77.65 | 0.89 | 5.90 | 4.40 | 45.88 | 1.14 | -18.40 | 6.72 | 10.44 | 0.19 | 29.19 | 9.35 |
| RoBERTa | 71.33 | 0.48 | 4.45 | 0.80 | 45.86 | 0.78 | -10.51 | 3.58 | 8.24 | 0.18 | 32.13 | 7.28 |
| ANCE | 67.73 | 0.15 | 34.95 | 11.51 | 69.94 | 0.77 | -1.94 | 4.63 | 12.31 | 0.33 | 26.26 | 10.61 |
| TAS-B | 75.63 | 0.24 | -9.97 | 5.25 | 62.84 | 0.48 | -37.42 | 3.99 | 14.15 | 0.16 | 23.48 | 5.84 |
| Contriever | 73.83 | 0.27 | -5.33 | 1.93 | 61.35 | 0.73 | -31.33 | 3.22 | 15.09 | 0.10 | 1.63 | 1.89 |
| coCondenser | 75.36 | 0.47 | 9.60 | 8.49 | 71.07 | 0.45 | -45.39 | 8.55 | 13.79 | 0.21 | 1.06 | 2.79 |
🔼 This table presents the average NDCG@3 scores and relative bias (measuring the difference between the performance on human-written and LLM-generated documents) for six different PLM-based retrieval models. The results are shown for three different datasets (DL19, TREC-COVID, and SCIDOCS) and are averaged across five repetitions of the experiment to demonstrate the robustness of the results. The table compares the performance before and after applying the proposed CDC (Causal Diagnosis and Correction) debiasing method. The mean and standard deviation are provided for each metric and dataset.
read the caption
Table 6: Mean and standard deviation of Performance (NDCG@3333) and bias (Relative ΔΔ\Deltaroman_Δ [Dai et al., 2024c] on NDCG@3333) of different PLM-based retrievers with our proposed CDC debiased method on three datasets in five repetitions.
| Model | DL19 | TREC-COVID | SCIDOCS | |||
|---|---|---|---|---|---|---|
| Performance | Bias | Performance | Bias | Performance | Bias | |
| BERT | 4.56e-03 | 5.33e-04 | 1.87e-03 | 3.97e-05 | 1.37e-01 | 1.47e-03 |
| RoBERTa | 7.26e-02 | 2.33e-04 | 1.22e-01 | 5.46e-05 | 8.48e-01 | 9.45e-07 |
| ANCE | 1.74e-01 | 4.48e-03 | 4.61e-01 | 3.09e-04 | 1.62e-01 | 2.25e-05 |
| TAS-B | 6.16e-01 | 3.19e-04 | 8.58e-01 | 1.27e-03 | 6.67e-04 | 2.16e-04 |
| Contriever | 2.77e-01 | 3.94e-02 | 2.98e-01 | 5.03e-04 | 4.44e-02 | 7.65e-03 |
| coCondenser | 8.82e-01 | 1.16e-02 | 5.95e-01 | 3.81e-04 | 2.71e-01 | 1.58e-03 |
🔼 Table 7 presents the results of statistical significance tests performed on the NDCG@3 (Normalized Discounted Cumulative Gain at position 3) and Relative Δ (a measure of bias) metrics, both with and without the application of the proposed CDC (Causal Diagnosis and Correction) debiasing method. The p-values from these tests are shown, with bold text highlighting results that are statistically significant at the p<0.05 level. The results demonstrate that while the CDC method significantly affects the bias, it does not substantially impact the overall performance (NDCG@3).
read the caption
Table 7: The p𝑝pitalic_p-value of significance test conducted on the NDCG@3333 and Relative ΔΔ\Deltaroman_Δ [Dai et al., 2024c] on NDCG@3333 with and without CDC debias method, with bold fonts indicating the Performance or Bias can pass a significance test with p𝑝pitalic_p-value<0.05absent0.05<0.05< 0.05. As expected, most Performance DOES NOT pass the significance test while all the Bias DOES pass the significance test.
Full paper#