TL;DR#
Machine unlearning aims to remove the influence of specific training data while preserving knowledge. Previous approaches assume uniform forget data distribution; however, performance degrades for dominant groups when this doesn’t hold, leading to fairness issues. This paper addresses this by presenting group-robust machine unlearning to tackle the overlooked problem of non-uniformly distributed forget sets.
The paper presents a simple strategy that mitigates performance loss in dominant groups via sample distribution reweighting. It also introduces MIU, the first approach for group robustness in approximate machine unlearning, minimizing the mutual information between model features and group information. It also exploits sample distribution reweighting and mutual information calibration to preserve group robustness.
Key Takeaways#
Why does it matter?#
This paper introduces group-robust unlearning, a novel approach to mitigate performance degradation in dominant groups after unlearning. It offers practical solutions and opens avenues for research in fair and robust ML systems.
Visual Insights#

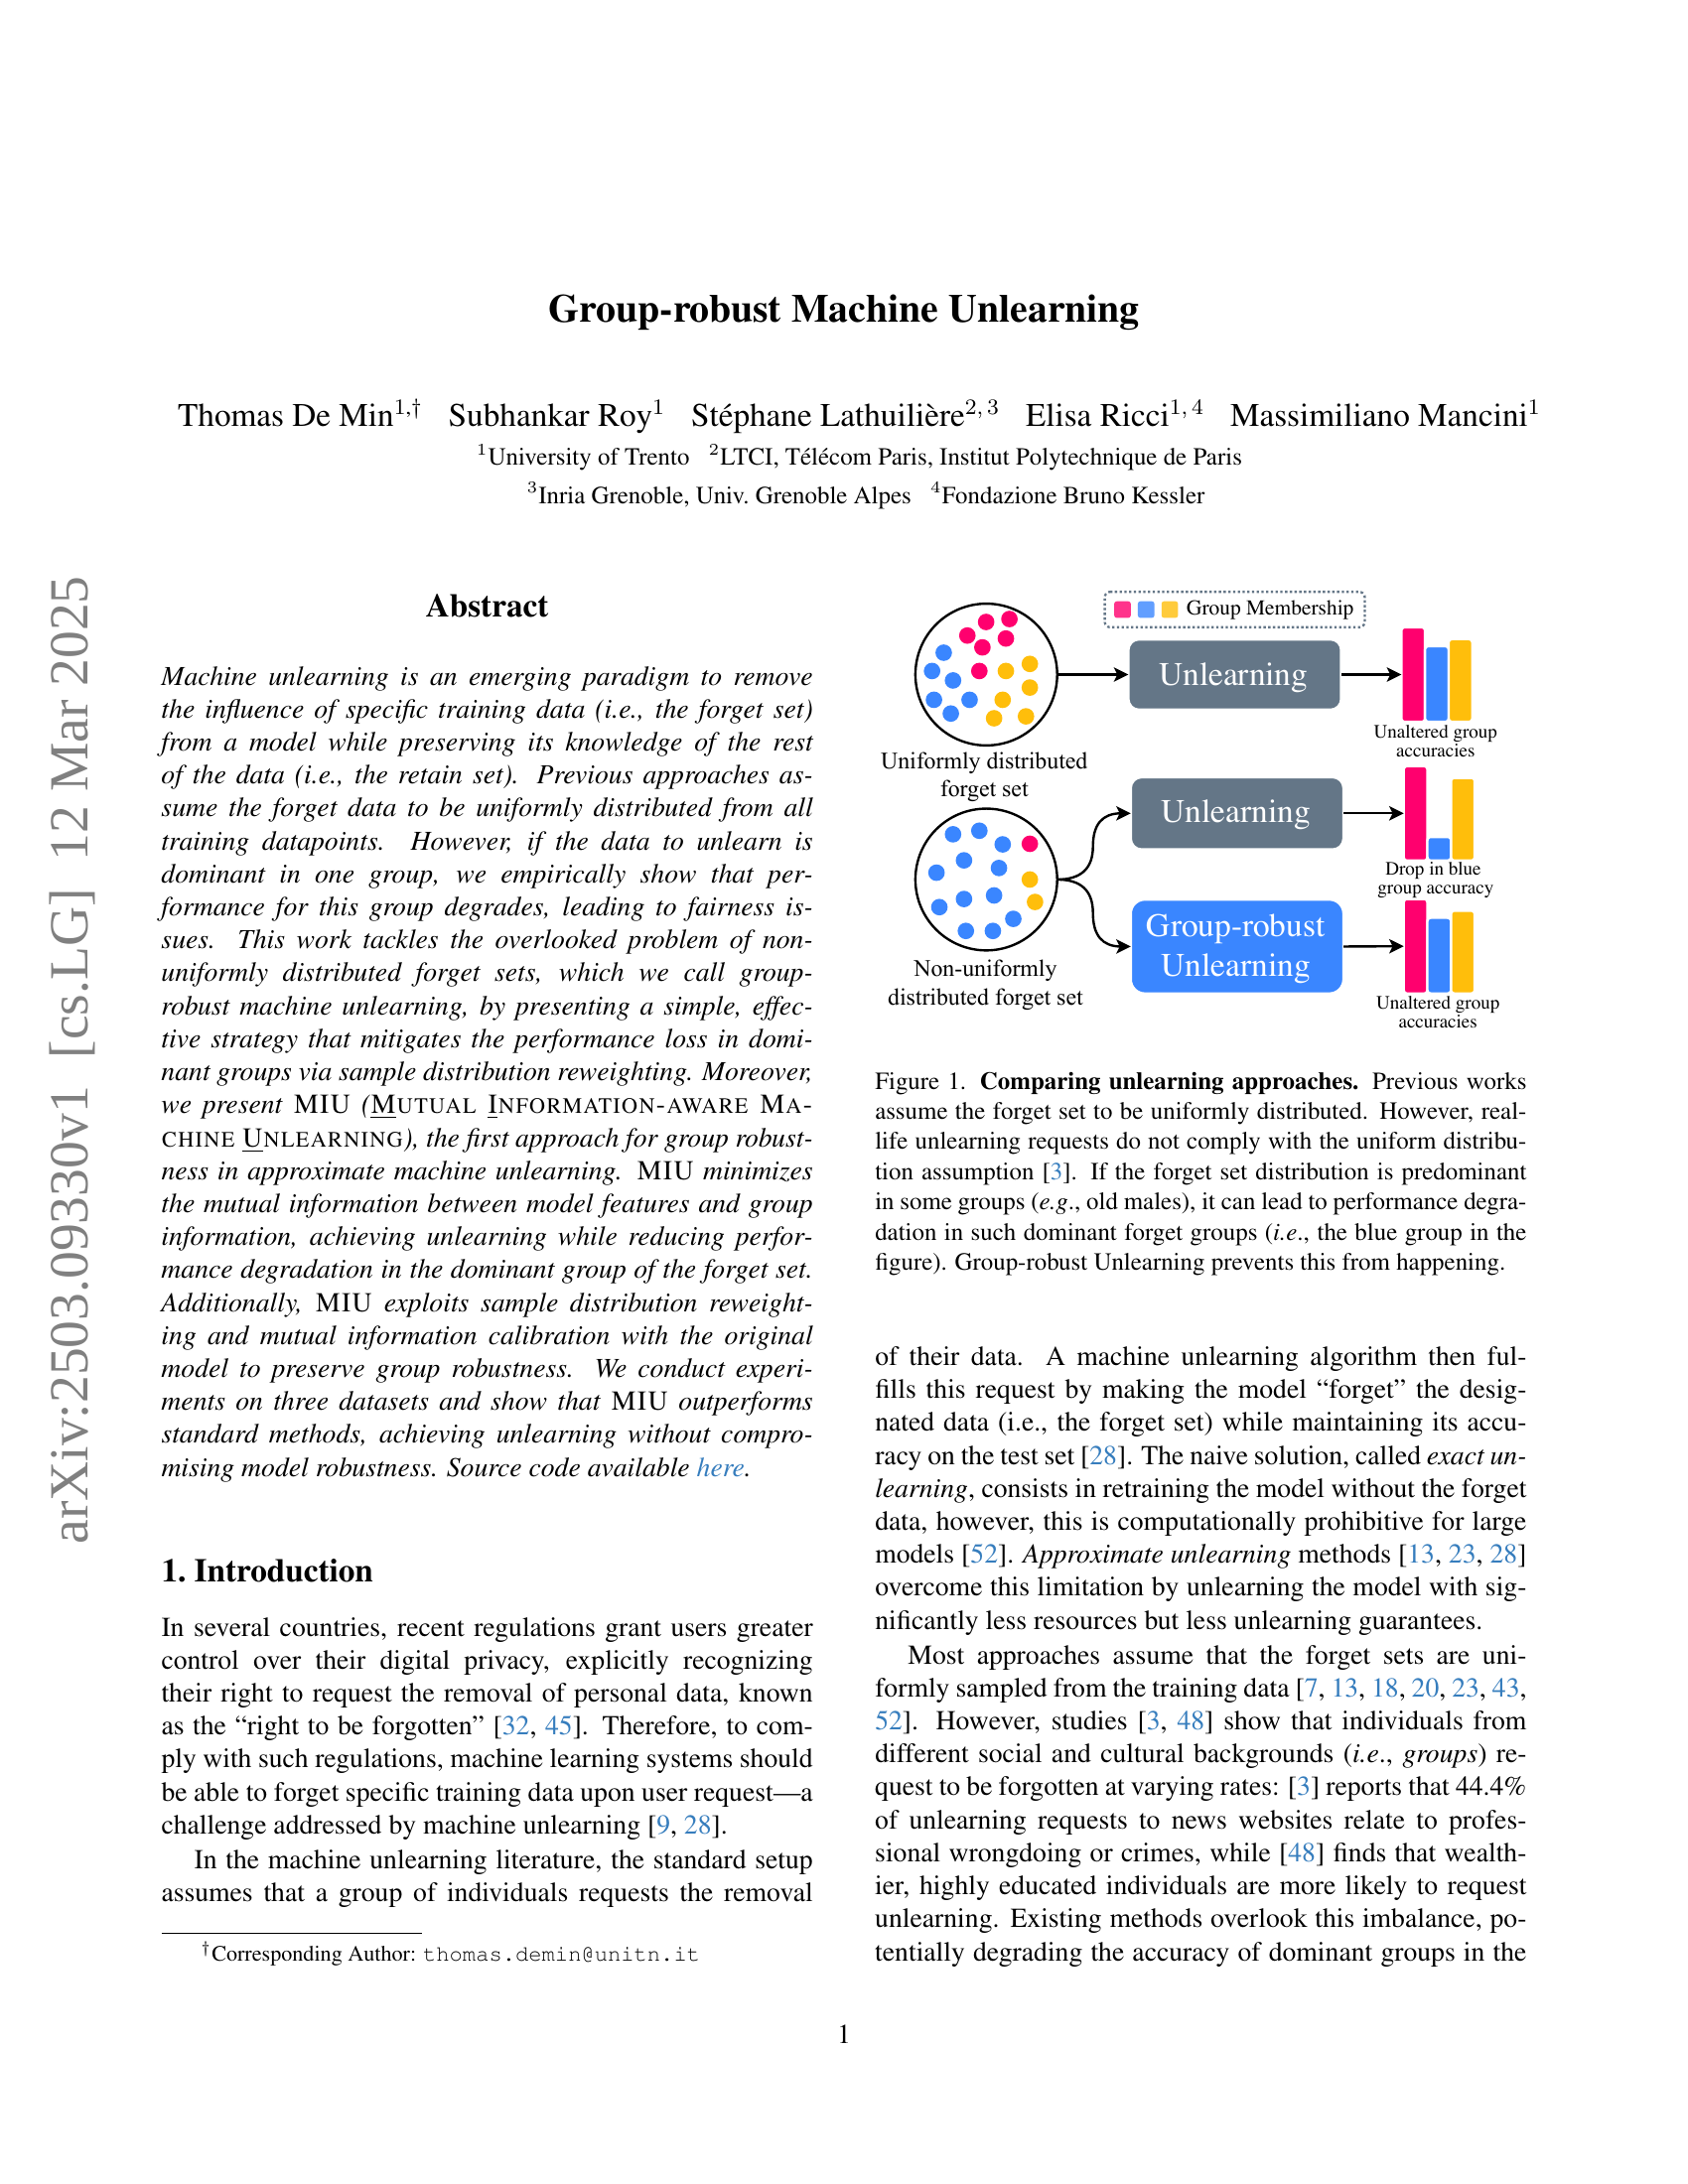
🔼 This figure compares different machine unlearning approaches. Traditional methods assume that the data being unlearned (the ‘forget set’) is evenly distributed across all groups within the dataset. However, in reality, unlearning requests may disproportionately come from certain demographics (e.g., older men). This figure illustrates how this non-uniform distribution can cause a significant drop in model accuracy for the over-represented group (shown as the blue group experiencing a drop in accuracy). In contrast, ‘Group-robust Unlearning,’ the focus of this paper, aims to mitigate this performance degradation by considering the uneven distribution of the forget set.
read the caption
Figure 1: Comparing unlearning approaches. Previous works assume the forget set to be uniformly distributed. However, real-life unlearning requests do not comply with the uniform distribution assumption [3]. If the forget set distribution is predominant in some groups (e.g., old males), it can lead to performance degradation in such dominant forget groups (i.e., the blue group in the figure). Group-robust Unlearning prevents this from happening.
| Method | reweight | RA | UA | TA | MIA | EO | GA | Avg. Gap |
|---|---|---|---|---|---|---|---|---|
| Pretrain | 84.6 | 66.6 | 82.8 | 0.1 | 20.9 | 67.3 | - | |
| Retrain | 84.7 | 54.6 | 82.3 | 0.1 | 31.6 | 56.9 | - | |
| Retrain | 81.4 | 82.8 | 79.9 | 11.3 | 3.9 | 83.5 | - | |
| Retrain | 84.5 | 66.6 | 82.4 | 0.3 | 20.8 | 67.8 | - | |
| L1-sparse [23] | 83.8 (0.7) | 44.3 (22.3) | 81.3 (1.1) | 0.2 (0.1) | 37.5 (16.7) | 47.5 (20.2) | 89.8 | |
| SalUn [13] | 84.9 (0.4) | 47.6 (19.0) | 82.4 (0.2) | 0.1 (0.2) | 31.6 (10.8) | 48.8 (19.0) | 91.7 | |
| SCRUB [28] | 82.1 (2.5) | 40.6 (26.0) | 79.8 (2.6) | 0.4 (0.2) | 40.1 (19.3) | 42.6 (25.1) | 87.4 | |
| MIU | 84.8 (0.3) | 55.3 (11.3) | 82.6 (0.3) | 0.3 (0.2) | 27.4 (6.6) | 55.9 (11.9) | 94.9 | |
| L1-sparse [23] | 83.4 (1.1) | 60.6 (6.0) | 81.3 (1.1) | 0.2 (0.2) | 27.9 (7.2) | 62.0 (5.7) | 96.5 | |
| SalUn [13] | 84.4 (0.3) | 64.9 (3.7) | 82.5 (0.2) | 0.1 (0.2) | 21.4 (1.5) | 66.2 (3.0) | 98.5 | |
| SCRUB [28] | 84.4 (0.3) | 61.6 (5.0) | 82.6 (0.3) | 0.5 (0.3) | 24.0 (3.2) | 62.9 (4.8) | 97.7 | |
| MIU | 84.2 (0.4) | 68.8 (2.6) | 82.5 (0.1) | 0.1 (0.2) | 20.2 (0.6) | 69.0 (1.3) | 99.2 |
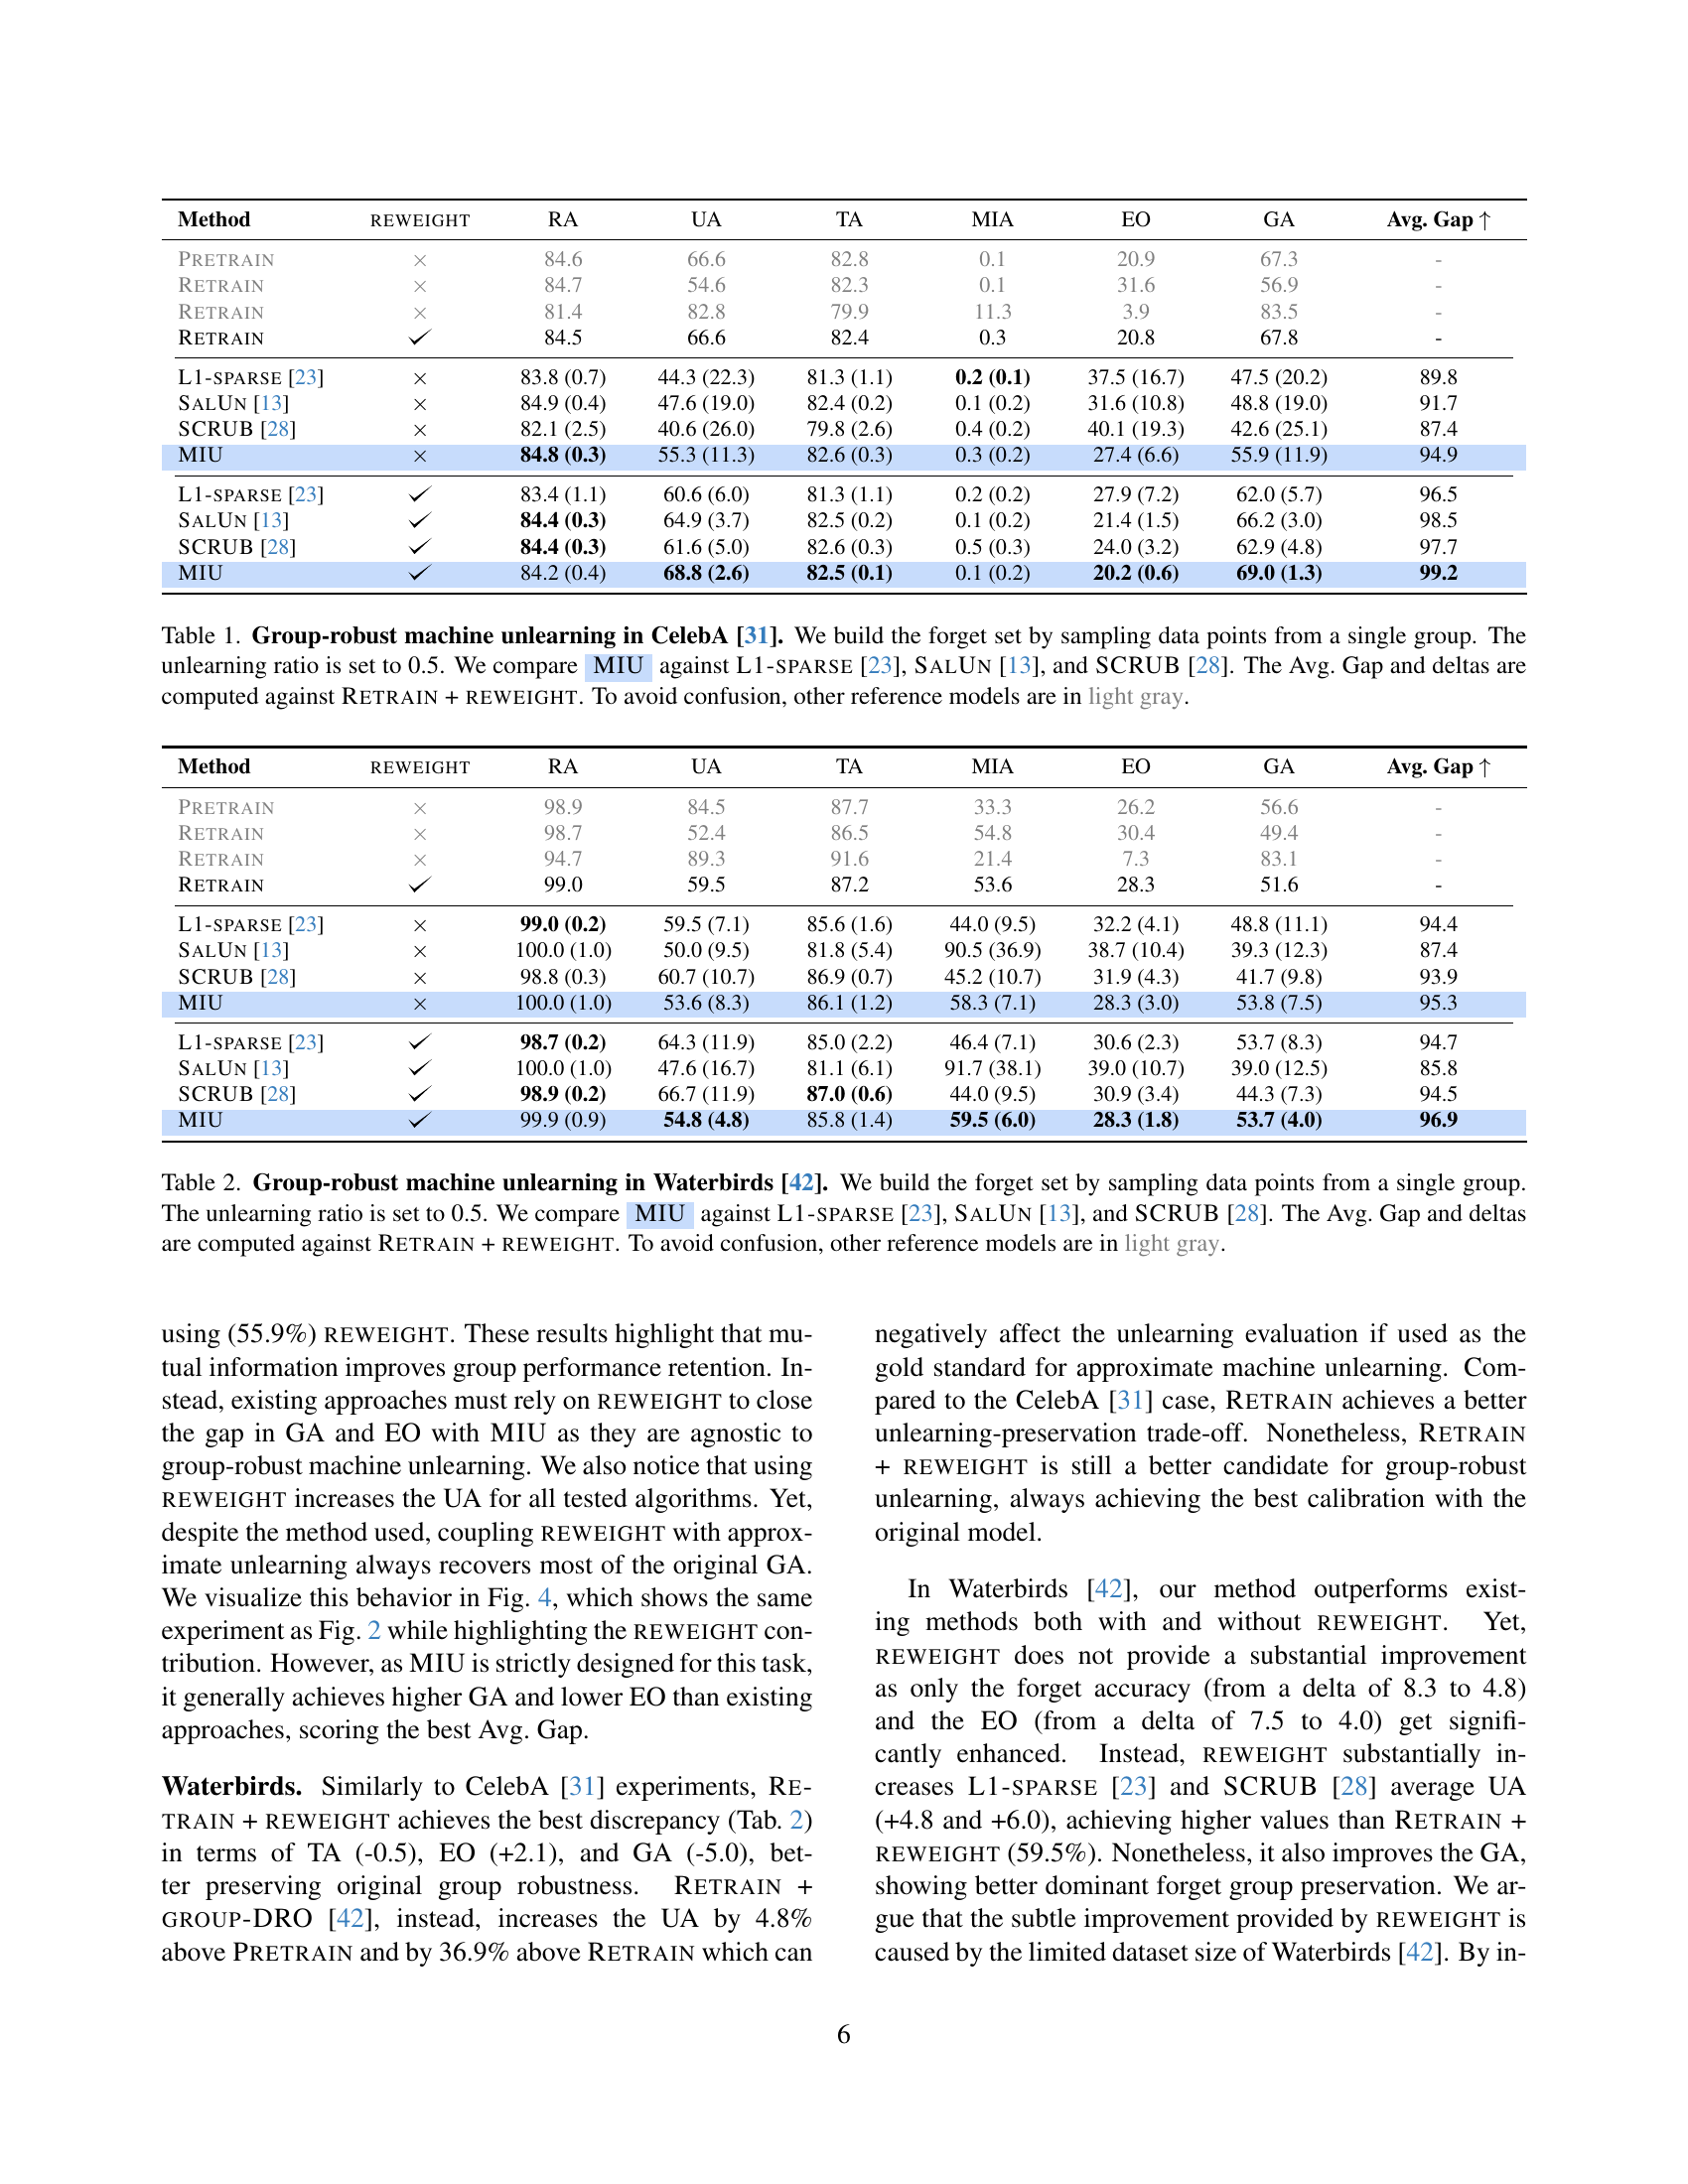
🔼 This table presents the results of a group-robust machine unlearning experiment on the CelebA dataset. The experiment focuses on the scenario where the data to be unlearned (the ‘forget set’) is not uniformly distributed across different groups within the dataset, but rather heavily concentrated in a single group. The goal is to evaluate how well different machine unlearning methods, specifically MIU (the proposed method in this paper), L1-sparse, SalUn, and SCRUB, can remove the influence of the forget set while preserving the model’s accuracy on the remaining data (the ‘retain set’), particularly within the dominant group of the forget set. The unlearning ratio is set to 0.5, meaning 50% of the data from the dominant group in the forget set is removed. Performance is measured using several metrics, and compared against a baseline of retraining the model without the forget set (Retrain) and a modified version with the proposed sample reweighting strategy (Retrain + Reweight), which is used as the gold standard against which other methods are compared. Methods that don’t employ the reweighting strategy are shown in light gray to clearly distinguish them from the reweighted methods.
read the caption
Table 1: Group-robust machine unlearning in CelebA [31]. We build the forget set by sampling data points from a single group. The unlearning ratio is set to 0.5. We compare AyMIU against L1-sparse [23], SalUn [13], and SCRUB [28]. The Avg. Gap and deltas are computed against Retrain + reweight. To avoid confusion, other reference models are in light gray.
In-depth insights#
Group-robustness#
The paper tackles the critical issue of performance degradation in specific groups when unlearning data, particularly when the data to be unlearned is not uniformly distributed across all groups. This is a significant problem because existing machine unlearning methods often assume uniform distribution, which can lead to unfair outcomes and reduced accuracy for dominant groups within the forget set. The paper addresses this gap by introducing a novel approach called group-robust machine unlearning. By mitigating the performance deterioration in these dominating groups, the algorithm helps in preserving the model’s generalization capabilities and ensuring fairness across different demographic or social groups.
Unlearning MIU#
Unlearning through Mutual Information Unlearning (MIU) is a novel method in machine unlearning, focusing on balancing privacy and utility. MIU leverages mutual information minimization between model features and group labels, decorrelating unlearning from spurious attributes to mitigate performance loss in dominant forget groups. To prevent impacting other groups, MIU calibrates the unlearned model’s mutual information to match the original, preserving robustness. By minimizing the mutual information between forget-set features and ground-truth labels, MIU decorrelates unlearning from spurious attributes.
This mitigation addresses the scenario where data to be unlearned is not uniformly distributed but dominant in one group, leading to performance degradation.
The key idea is that by making the features independent of the group labels, the effect of the unlearning process can be isolated to the intended data without causing fairness issues.
Coupled with REWEIGHT, MIU outperforms existing unlearning approaches (L1-SPARSE, SALUN, SCRUB) in unlearning efficacy and preserved group robustness.
Reweighting Data#
Reweighting data is a crucial aspect of machine unlearning, particularly when dealing with non-uniformly distributed forget sets. Simply removing data can lead to performance degradation in dominant groups, thus requiring a more nuanced approach. Reweighting techniques adjust the importance of different data points during retraining. By increasing the sampling likelihood of underrepresented groups, the model can compensate for information loss and maintain group robustness. This strategy helps preserve original group accuracies and overall model performance after unlearning. The effectiveness of reweighting depends on factors such as dataset size and the degree of imbalance in the forget set. Properly implemented reweighting can mitigate fairness issues and ensure that the unlearning process does not disproportionately affect certain demographic groups.
Fairness Metrics#
Evaluating fairness is crucial in machine unlearning, especially with group robustness. The paper considers Demographic Parity (DP), ensuring prediction independence from sensitive attributes, Equal Opportunity (EO), focusing on equal true positive rates across groups, and Worst Group Accuracy (WG), maximizing performance for the least accurate group. These metrics complement typical unlearning evaluations by highlighting potential biases. Moreover, they measure model performance discrepancy with protected attributes. The use of these metrics suggests the importance of quantifying unlearning’s impact on different demographic groups to ensure fair and equitable outcomes, preventing the exacerbation of existing biases or the introduction of new ones. Furthermore, a comprehensive evaluation requires a set of metrics that can capture the nuances of fairness, considering various aspects of model behavior beyond overall accuracy. In essence, these metrics are used to reveal if unlearning affects specific group’s overall model capabilities or increases biases within it, so as to guide in developing group robust models.
Ablation Study#
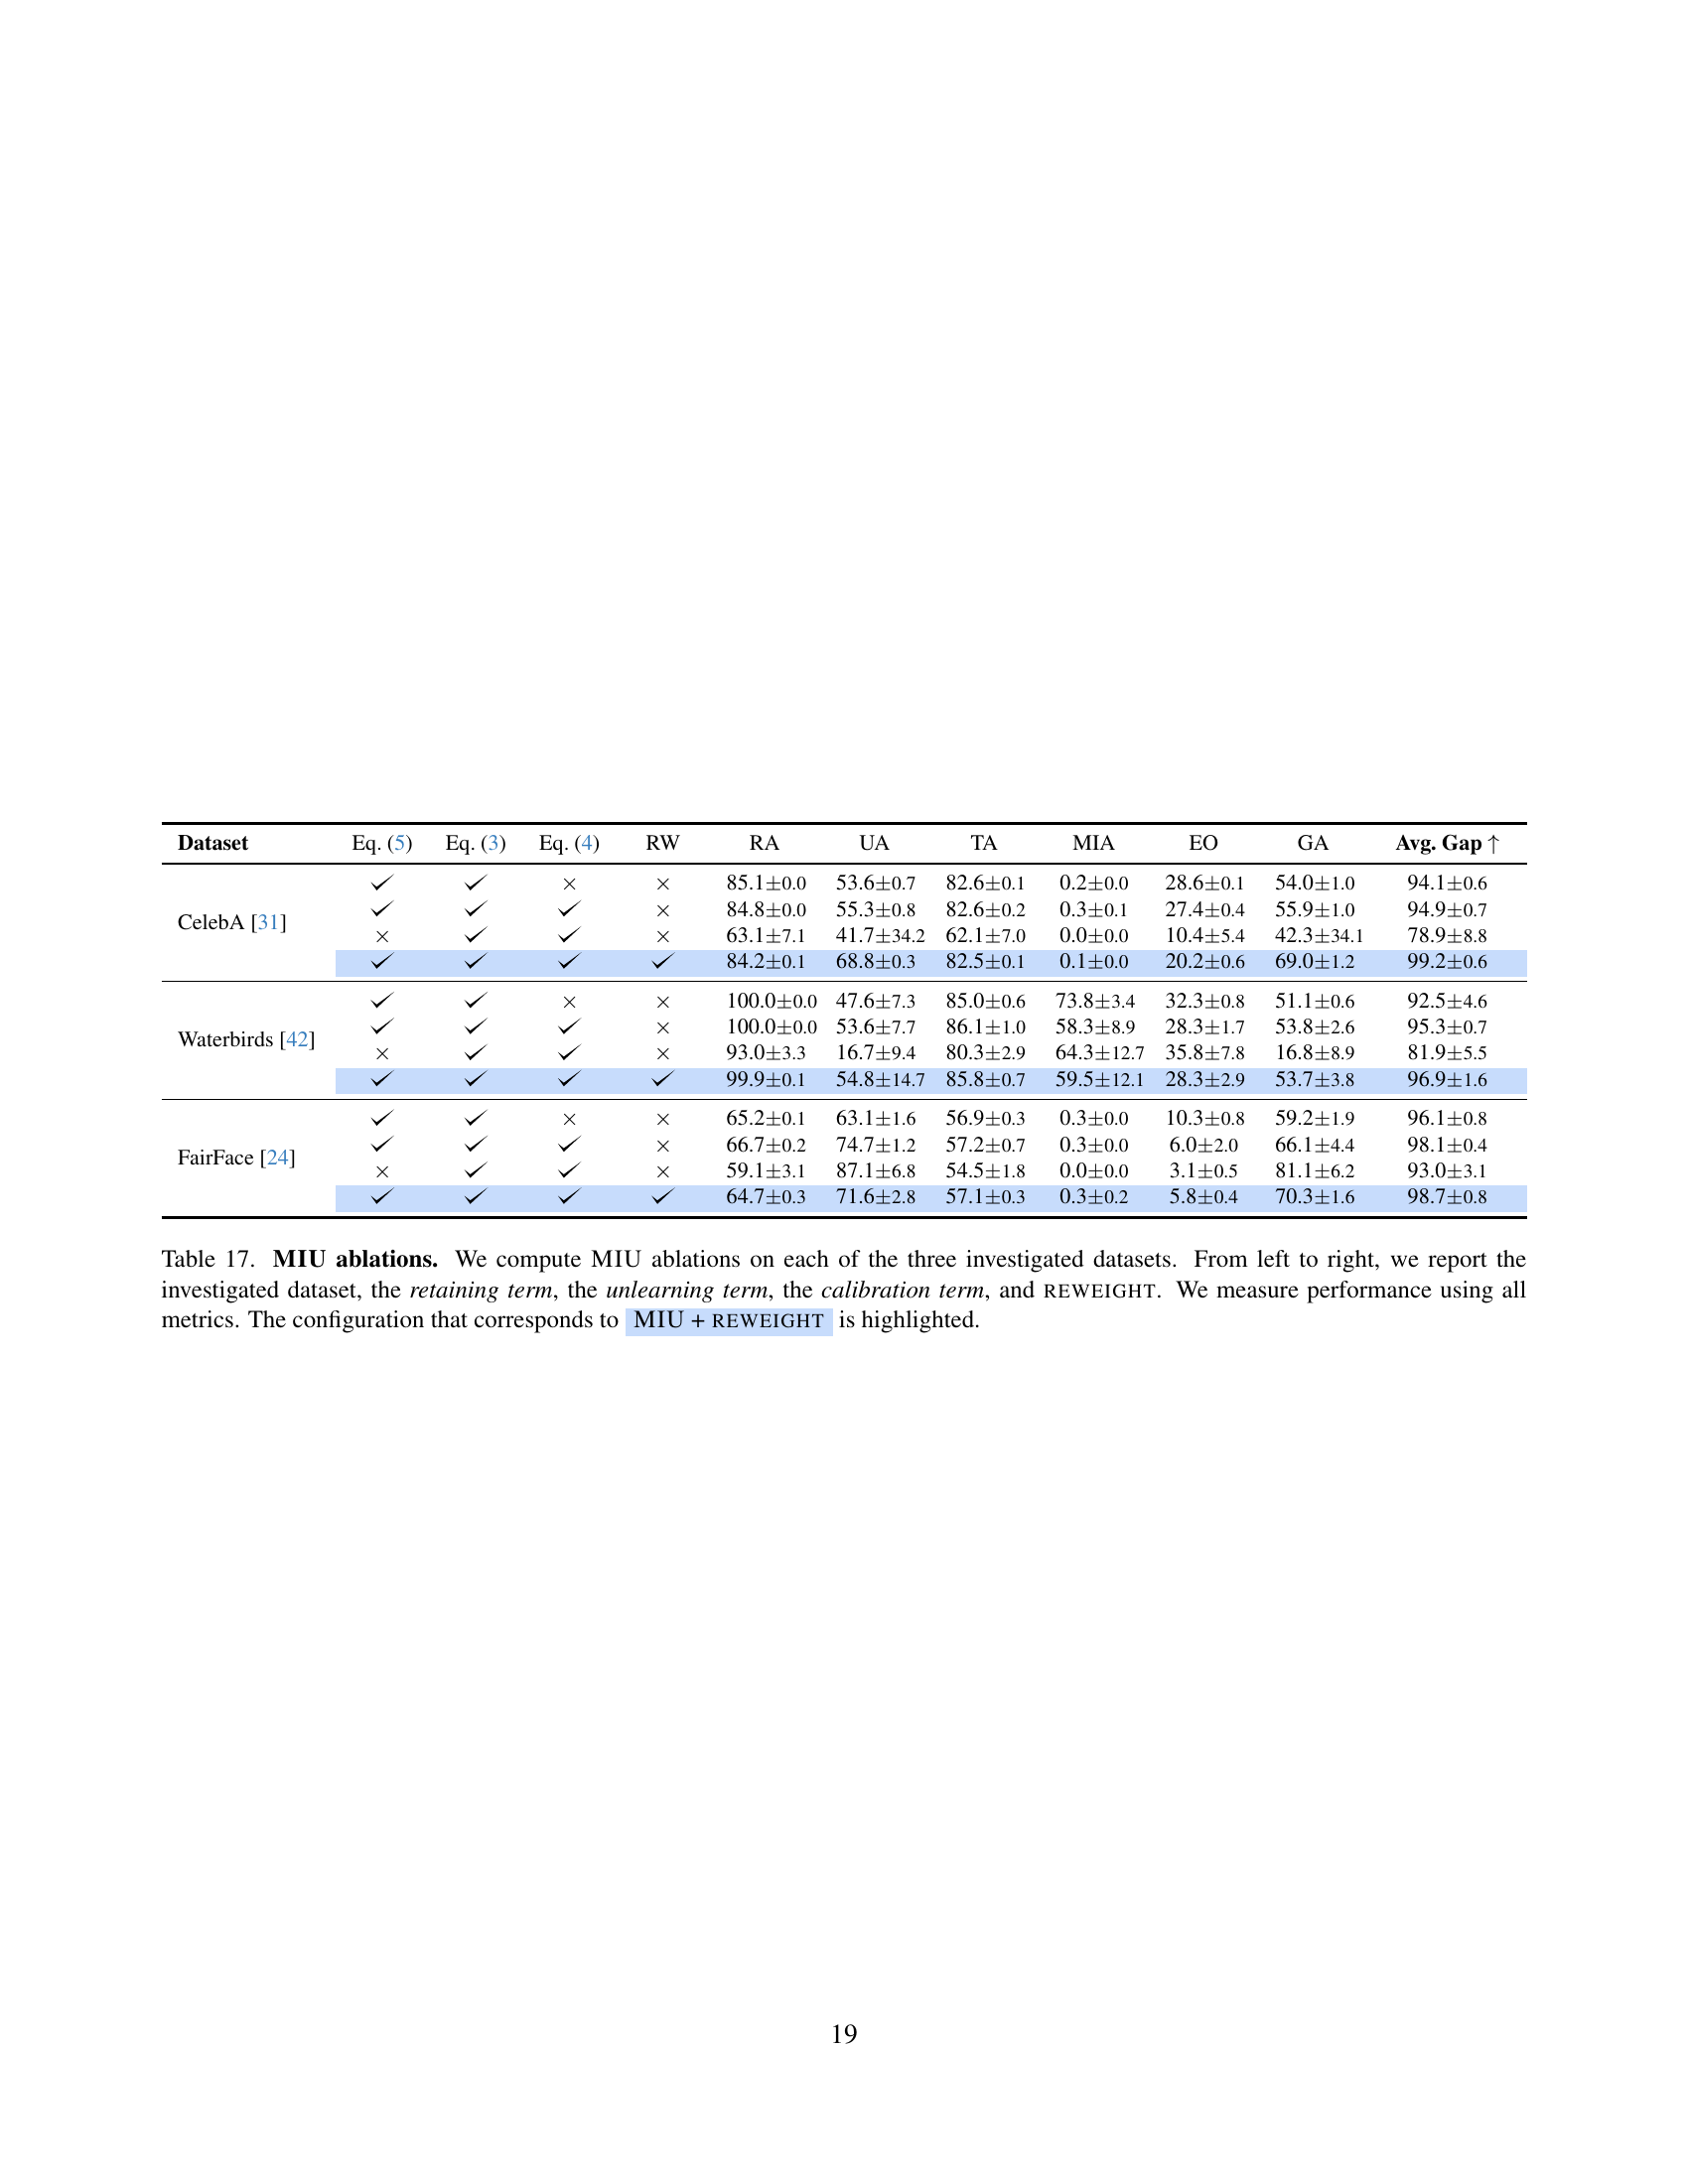
The ablation study meticulously dissects MIU’s architecture across diverse datasets (CelebA, Waterbirds, and FairFace). It systematically evaluates the contribution of each component: retaining term, unlearning term, calibration term, and REWEIGHT. Results underscore the unlearning term’s efficacy in reducing mutual information, evidenced by consistently lower UA scores. The calibration term enhances group fairness (increased GA), while REWEIGHT boosts robustness. The study also explores the impact of the λ parameter, finding optimal values vary across datasets. Overall, the ablation study validates the effectiveness of MIU’s design choices in achieving group-robust unlearning.
More visual insights#
More on figures

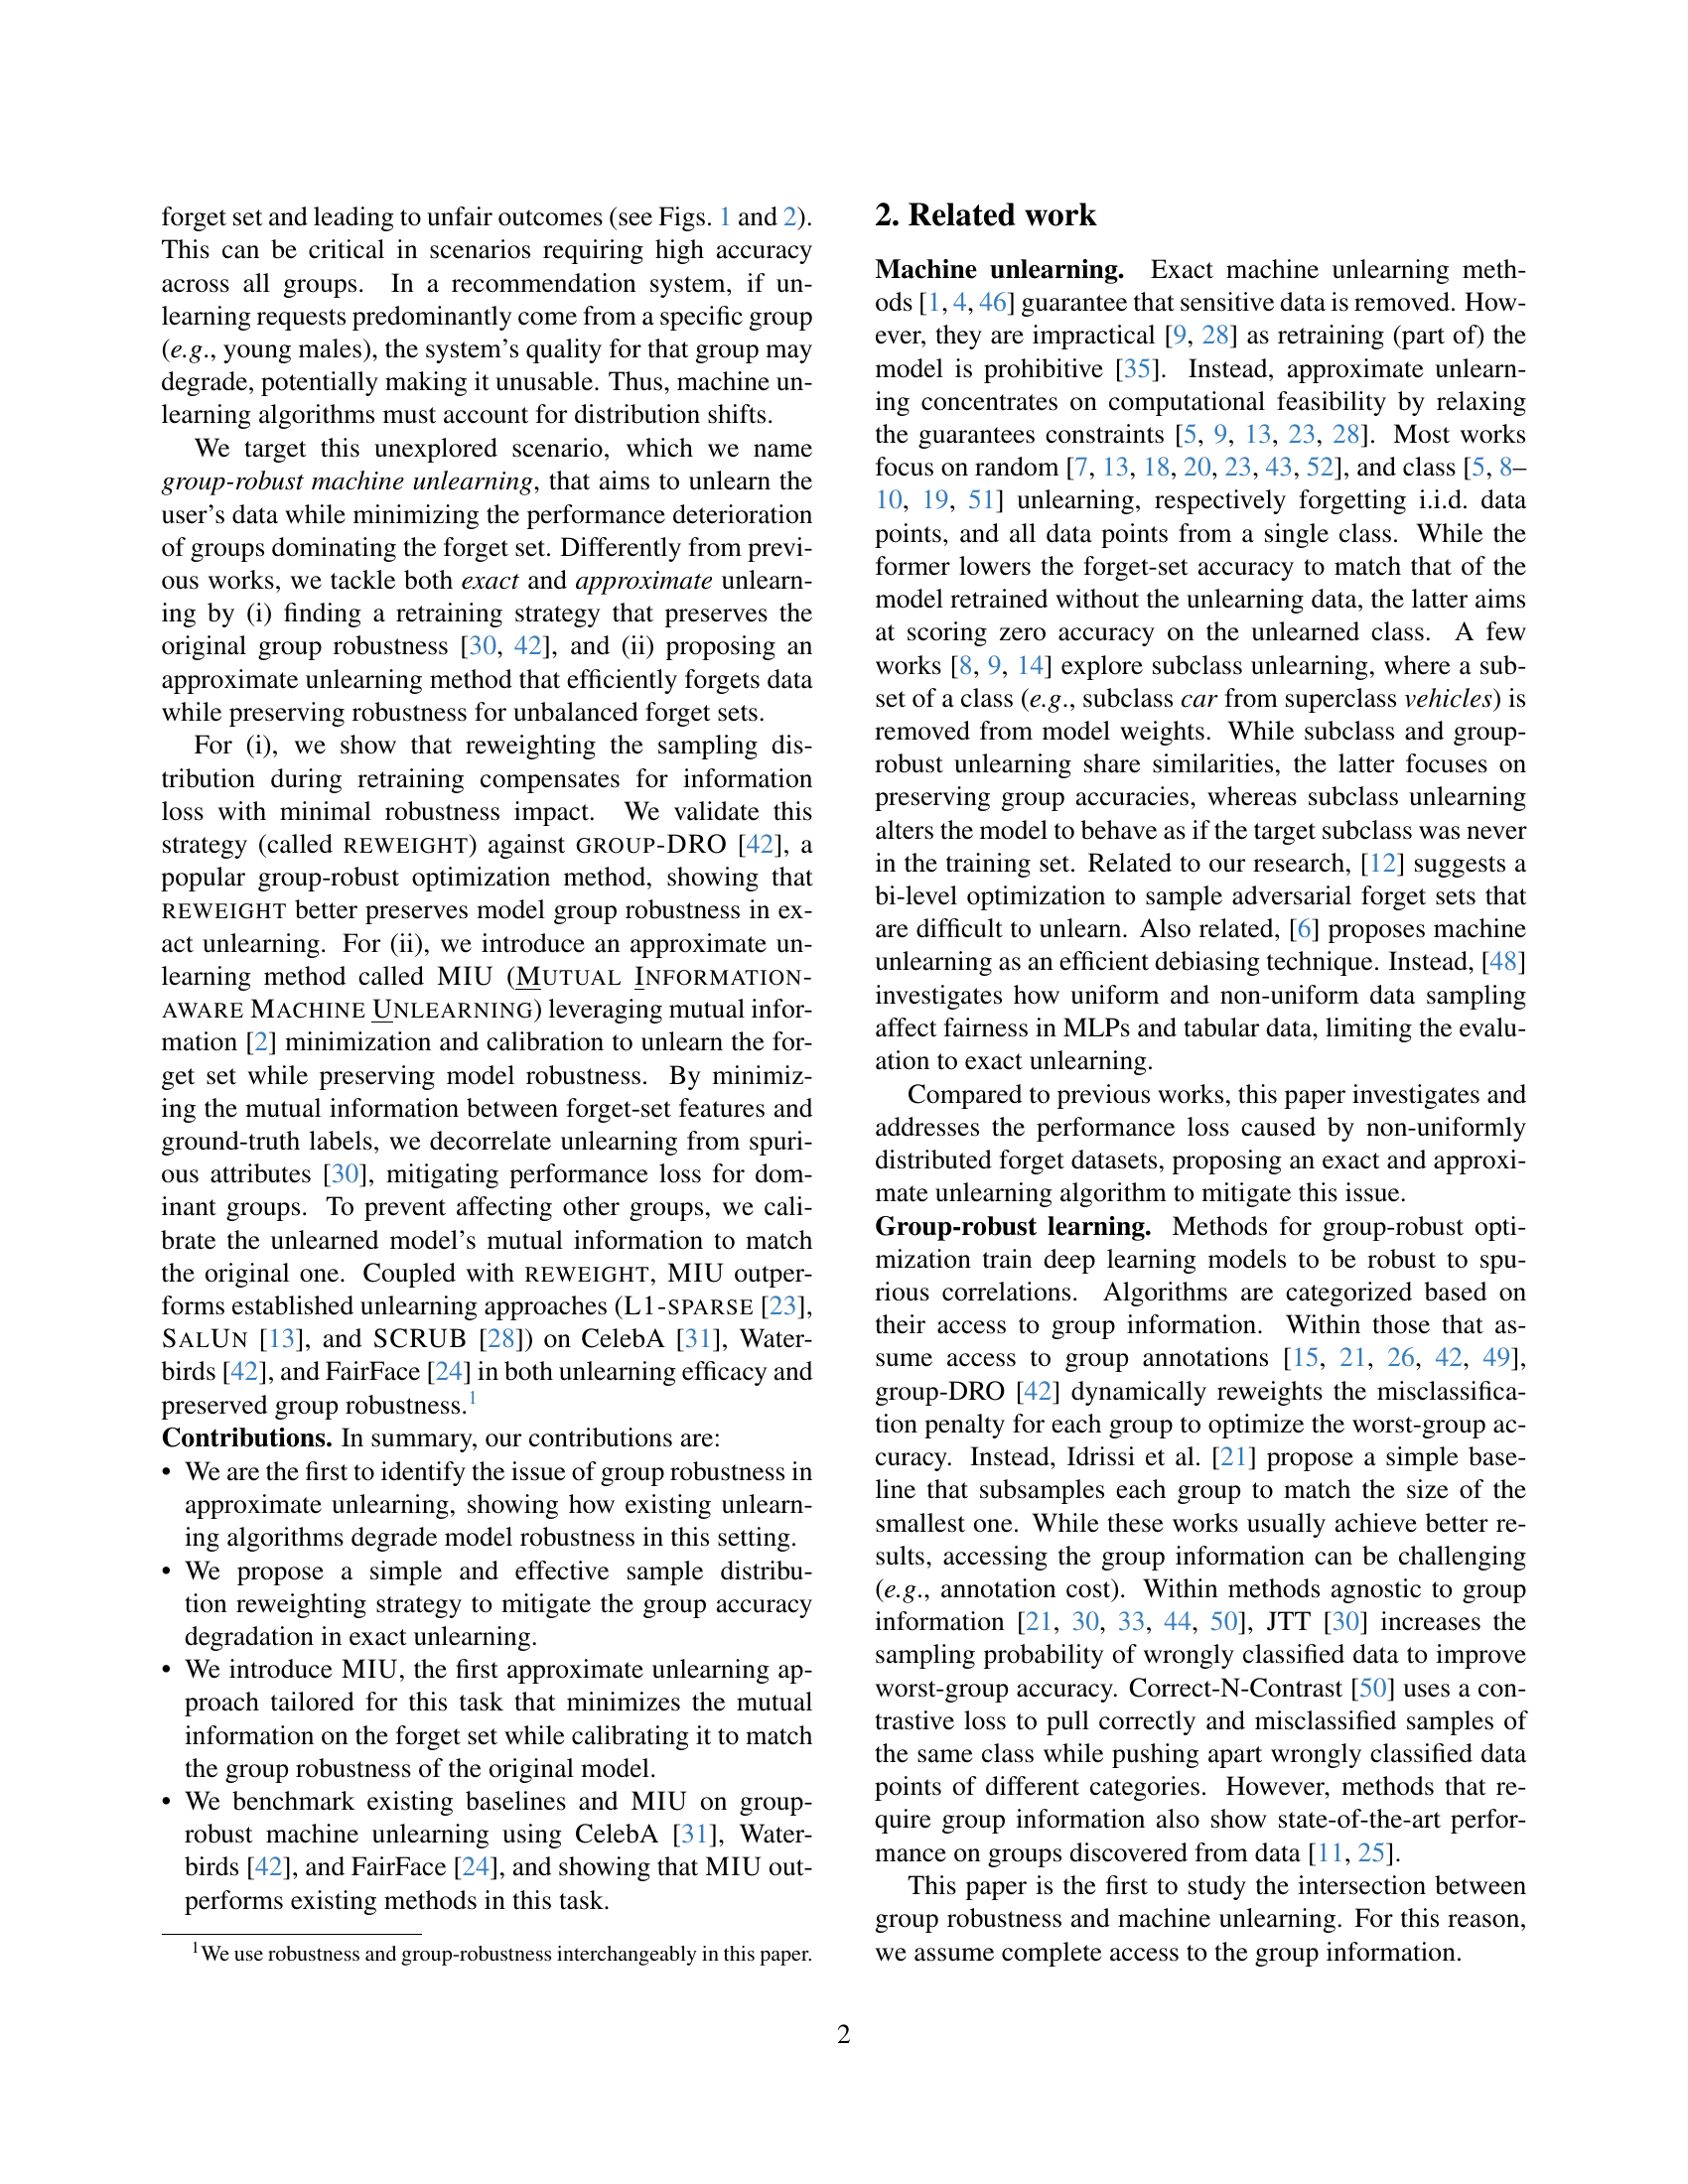
🔼 This figure illustrates the impact of non-uniformly distributed data on machine unlearning. It demonstrates how existing approximate unlearning methods (L1-sparse, SalUn, and SCRUB) fail to maintain accuracy for a dominant group (attractive males) within the dataset when a disproportionate number of samples from that group are requested for removal (‘forget set’). Specifically, as more attractive males are removed from the CelebA dataset, the model’s accuracy in classifying the remaining attractive males progressively decreases.
read the caption
Figure 2: Unlearning non-uniformly distributed data. We test standard model retraining, and popular approximate unlearning methods (L1-sparse [23], SalUn [13], and SCRUB [28]) in group-robust unlearning. The more attractive males are unlearned from CelebA [31], the lower the model accuracy on that group.

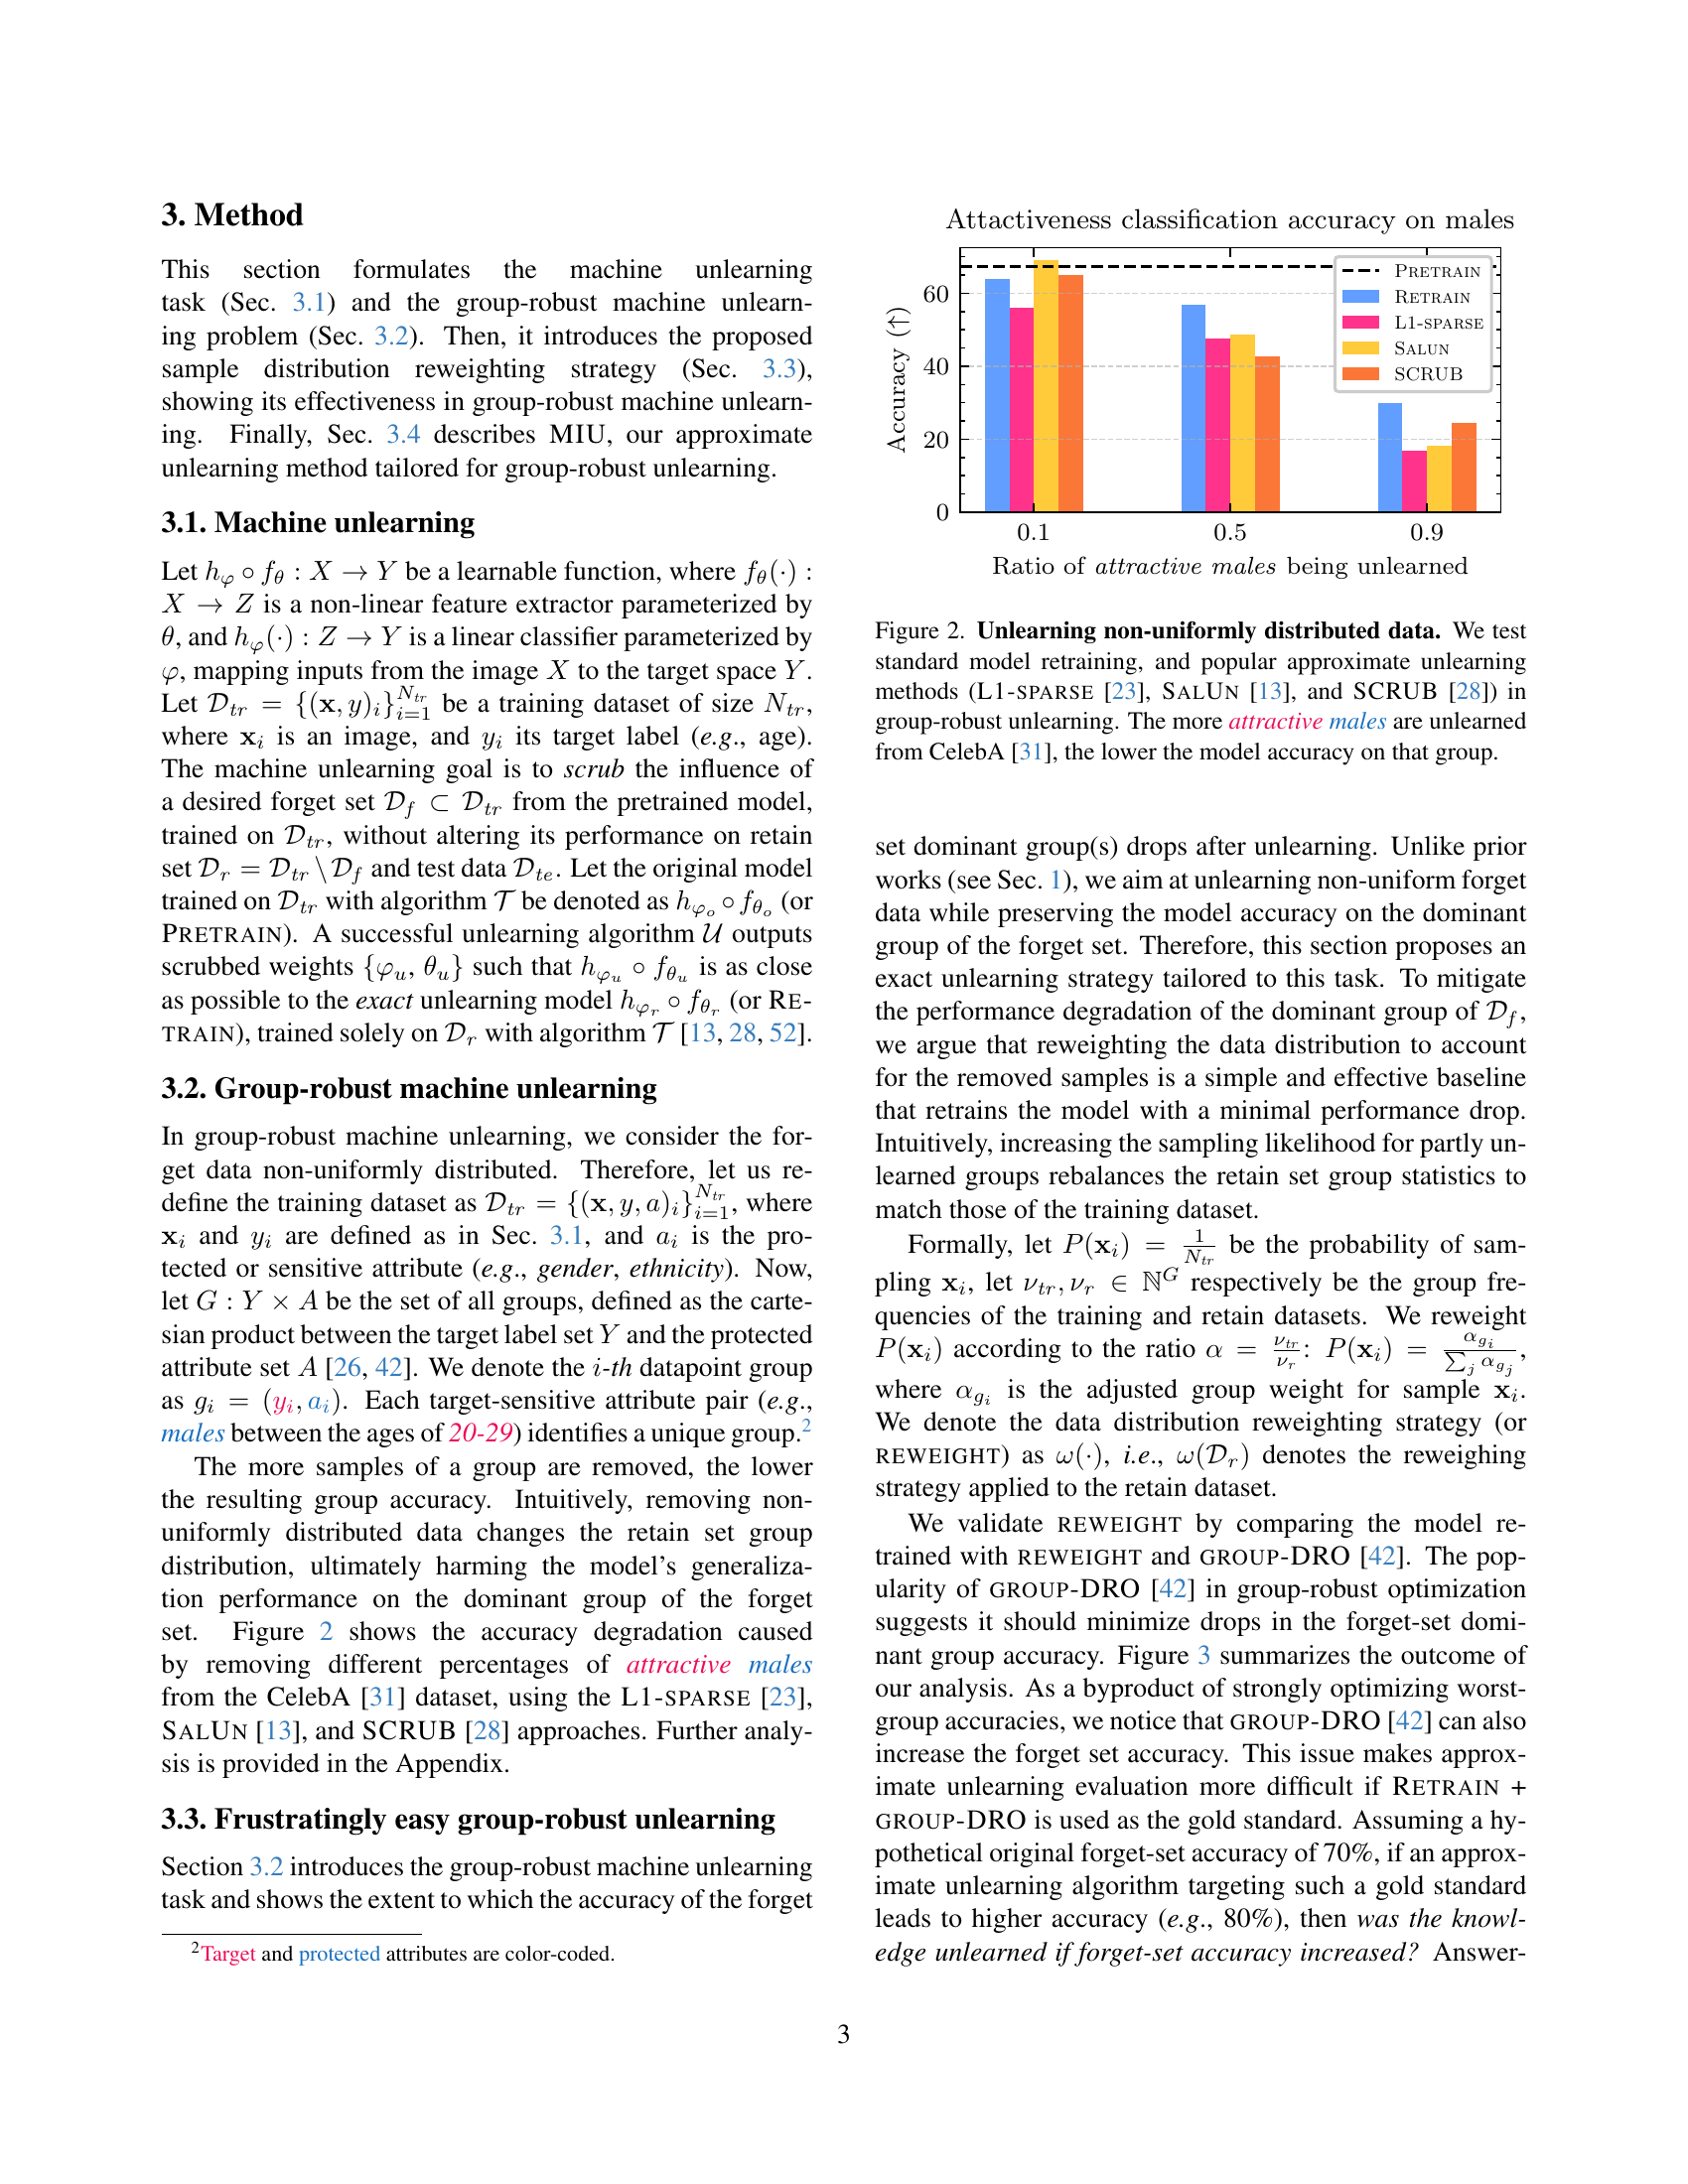
🔼 This figure compares the performance of two methods for group-robust machine unlearning: RETRAIN + REWEIGHT and RETRAIN + GROUP-DRO. The x-axis represents different datasets (CelebA, Waterbirds, and FairFace). The y-axis represents the gap between the performance of the model after unlearning and the original pre-trained model’s performance. The bars show that RETRAIN + REWEIGHT achieves a smaller gap, indicating that it better preserves both overall test accuracy and the accuracy within specific groups (the dominant group in the forget set) after the unlearning process. This suggests that the sample reweighting strategy in RETRAIN + REWEIGHT is more effective in maintaining model performance and robustness than the GROUP-DRO optimization approach.
read the caption
Figure 3: reweight vs. group-DRO [42]. Retrain + reweight achieves a better test and group accuracy alignment with the original model (higher is better). Thus, it better preserves original performance after unlearning.

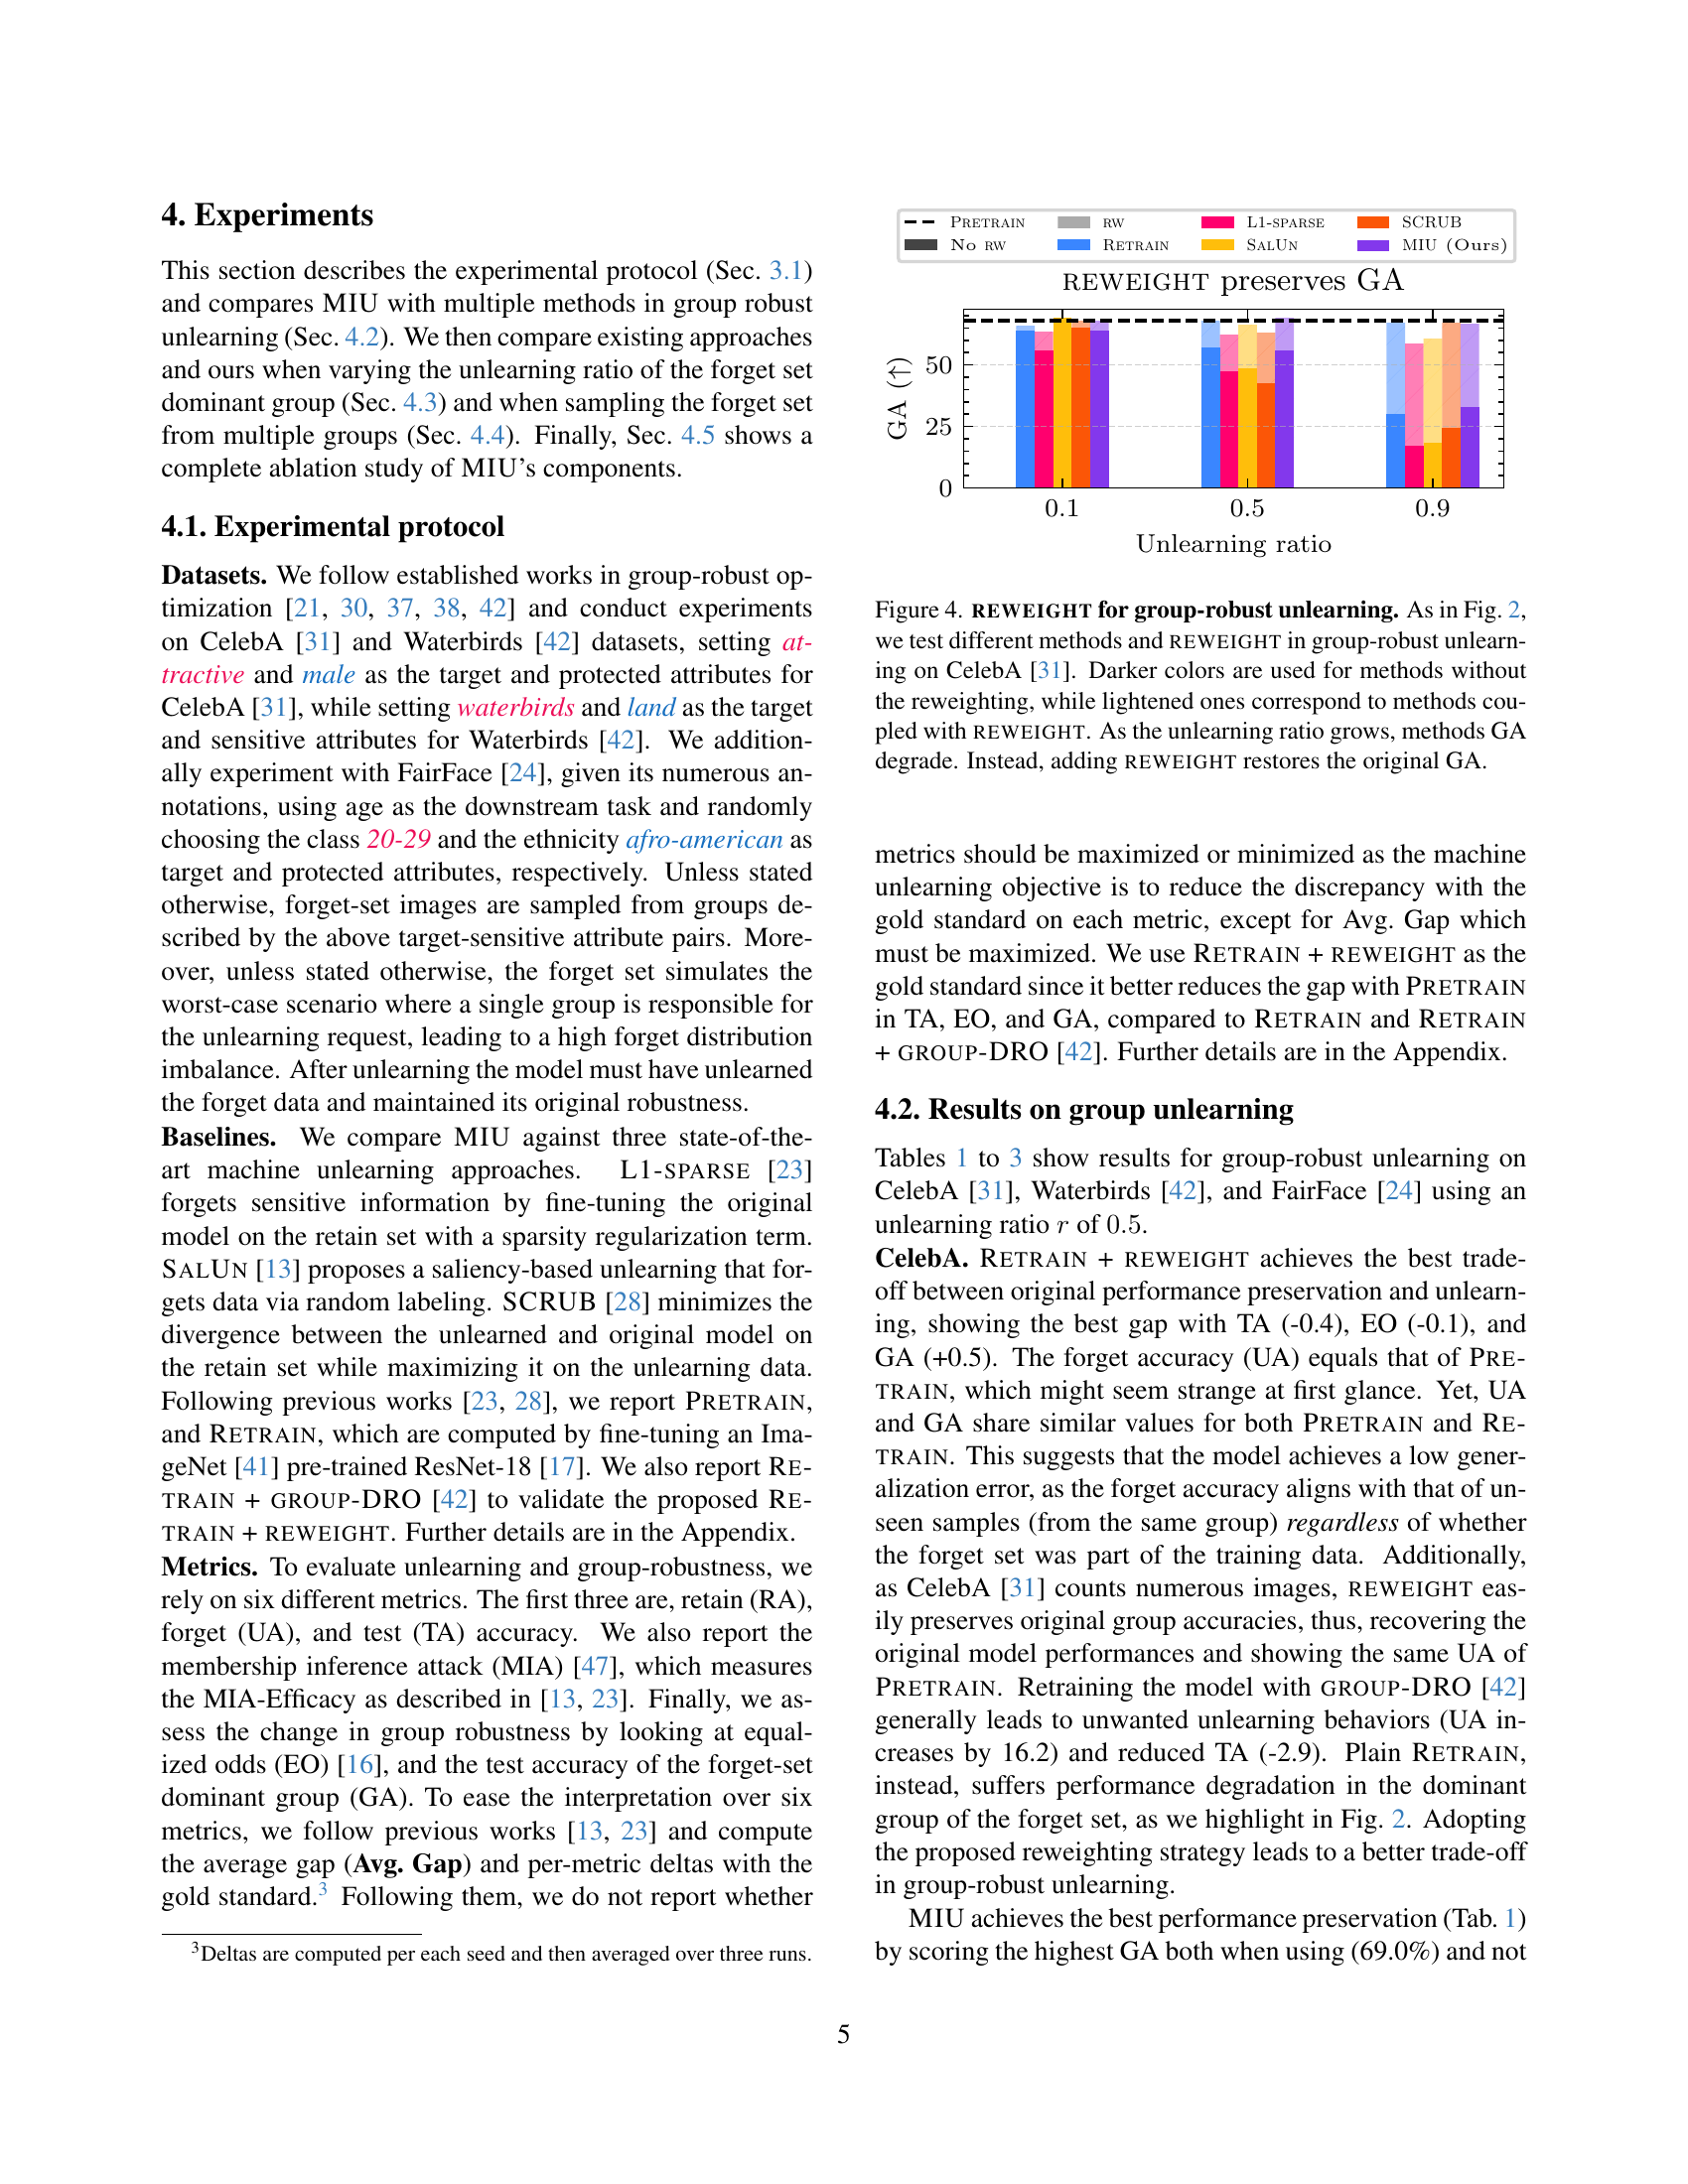
🔼 Figure 4 illustrates the impact of the proposed sample reweighting strategy (REWEIGHT) on group-robust machine unlearning. The experiment uses the CelebA dataset [31], focusing on the accuracy of the ‘dominant group’ (GA) within the forget set, that is the group of data most heavily affected by the unlearning process. Different unlearning methods are tested, each evaluated both with and without REWEIGHT. The graph plots the dominant group accuracy (GA) against the unlearning ratio (the proportion of data from the dominant group that is removed during the unlearning process). The results show that as the unlearning ratio increases, the dominant group accuracy (GA) decreases for methods without REWEIGHT. However, incorporating the REWEIGHT strategy effectively mitigates the performance drop, keeping the dominant group accuracy close to its original level even with a higher unlearning ratio. This demonstrates that REWEIGHT improves the robustness of machine unlearning when dealing with non-uniformly distributed forget sets.
read the caption
Figure 4: reweight for group-robust unlearning. As in Fig. 2, we test different methods and reweight in group-robust unlearning on CelebA [31]. Darker colors are used for methods without the reweighting, while lightened ones correspond to methods coupled with reweight. As the unlearning ratio grows, methods GA degrade. Instead, adding reweight restores the original GA.

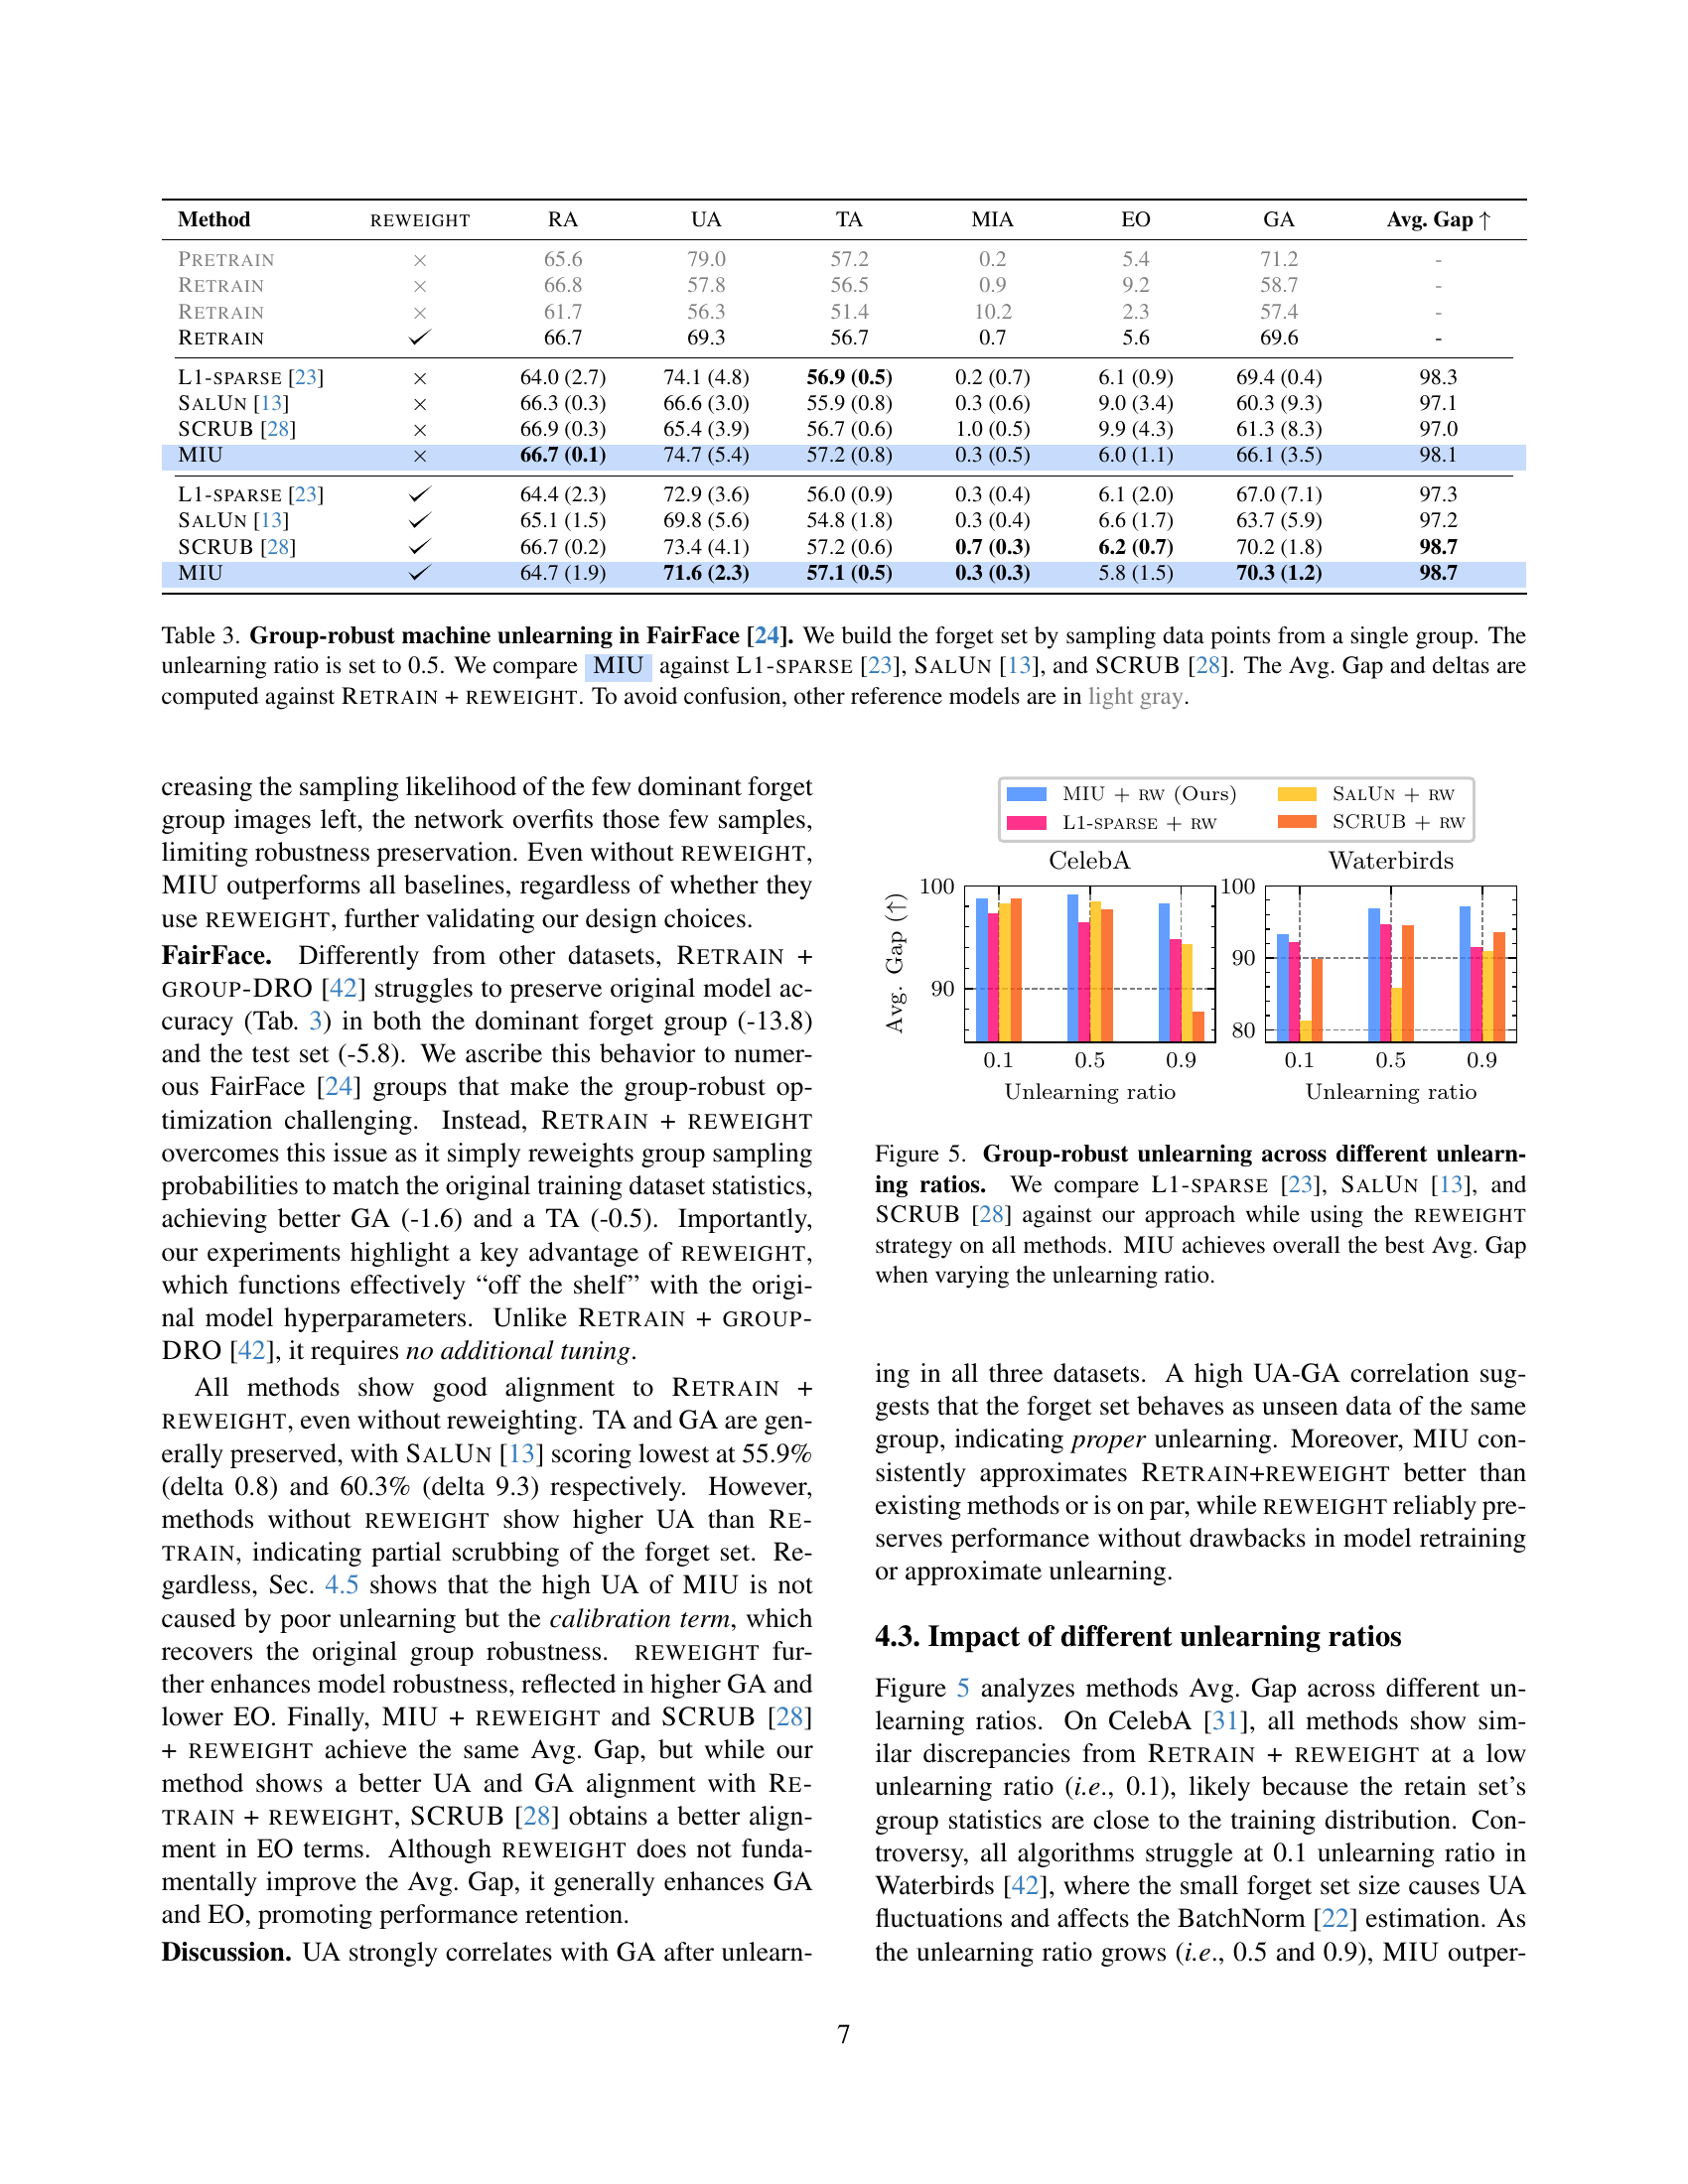
🔼 This figure compares the performance of several machine unlearning methods, including L1-sparse, SalUn, SCRUB, and the authors’ proposed MIU method, across different unlearning ratios. The performance is measured using the average gap (Avg. Gap) metric, which quantifies the difference between the unlearned model and the ideal retrained model. The reweight strategy is applied to all methods to mitigate the impact of non-uniformly distributed forget sets. The results show that MIU consistently achieves the best Avg. Gap across all unlearning ratios, indicating its superior robustness and effectiveness in handling imbalanced data.
read the caption
Figure 5: Group-robust unlearning across different unlearning ratios. We compare L1-sparse [23], SalUn [13], and SCRUB [28] against our approach while using the reweight strategy on all methods. MIU achieves overall the best Avg. Gap when varying the unlearning ratio.

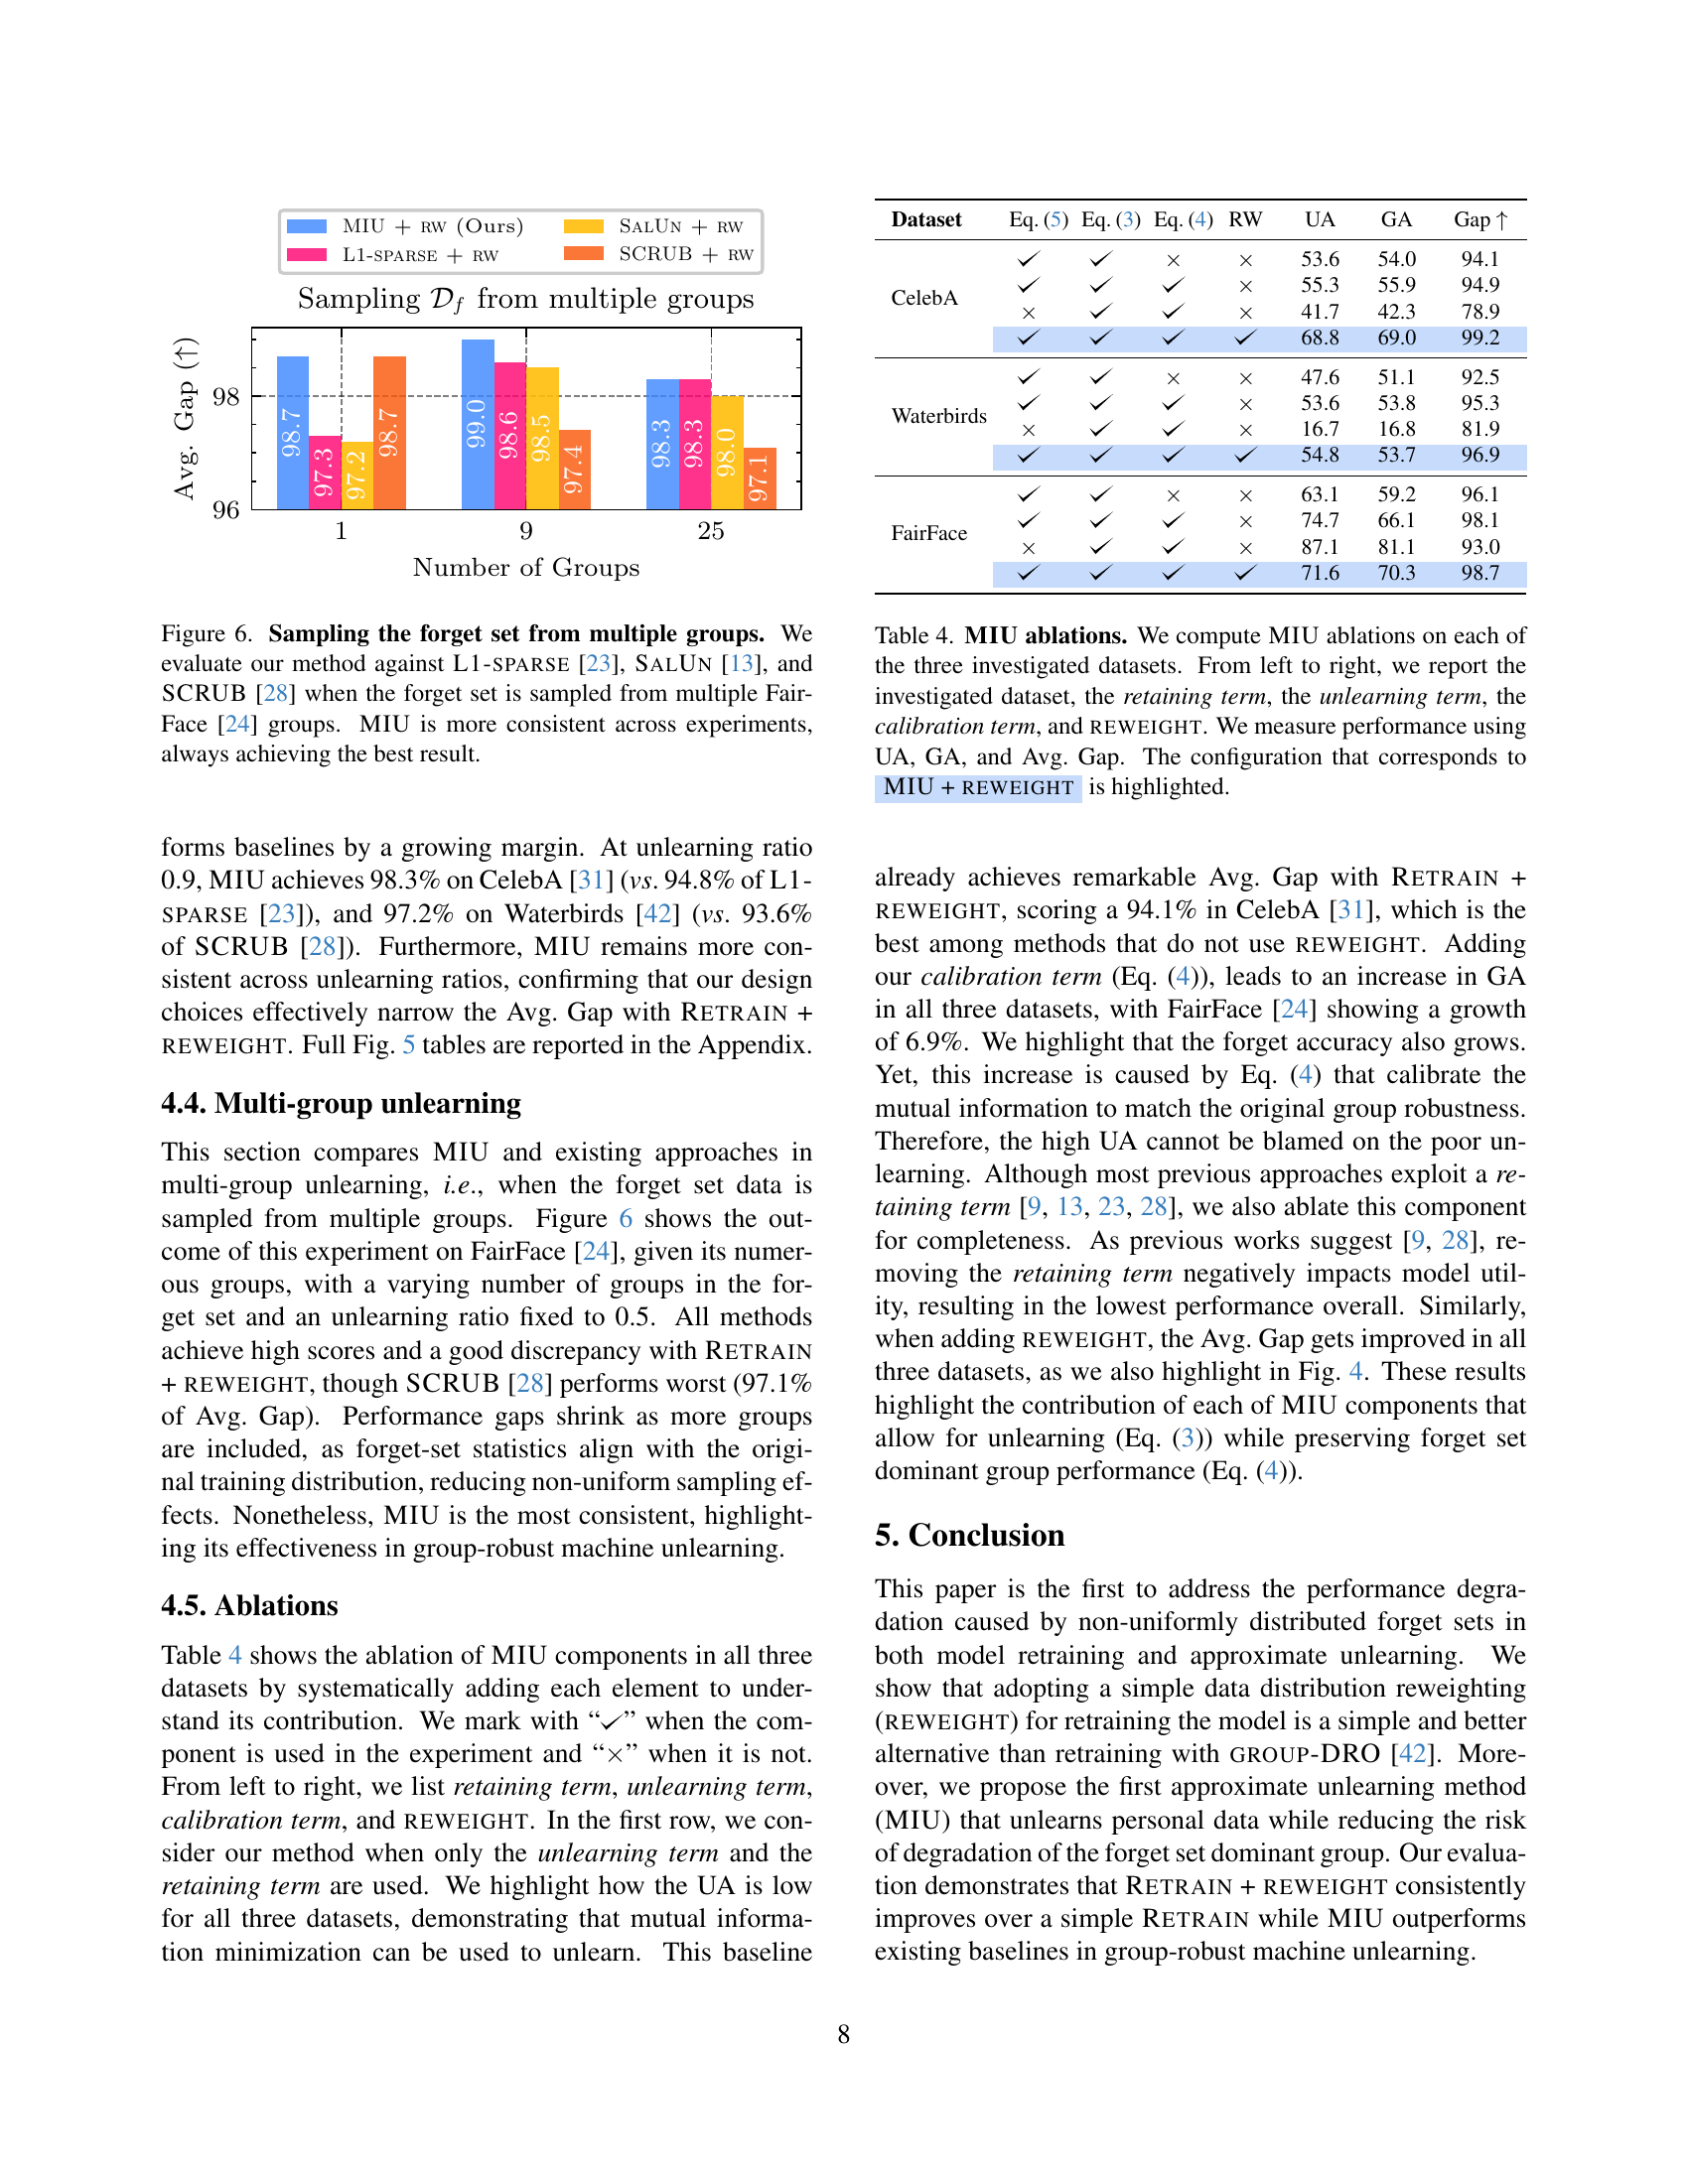
🔼 This figure displays a comparison of different machine unlearning methods’ performance when the forget set is sampled from multiple groups, focusing on the consistency and overall effectiveness of each method. The experiment uses the FairFace dataset and compares MIU to L1-sparse, SalUn, and SCRUB. The results show that MIU consistently achieves the best results across various experimental settings. The x-axis represents the number of groups sampled from, and the y-axis shows the average performance gap of each method relative to the best possible outcome.
read the caption
Figure 6: Sampling the forget set from multiple groups. We evaluate our method against L1-sparse [23], SalUn [13], and SCRUB [28] when the forget set is sampled from multiple FairFace [24] groups. MIU is more consistent across experiments, always achieving the best result.

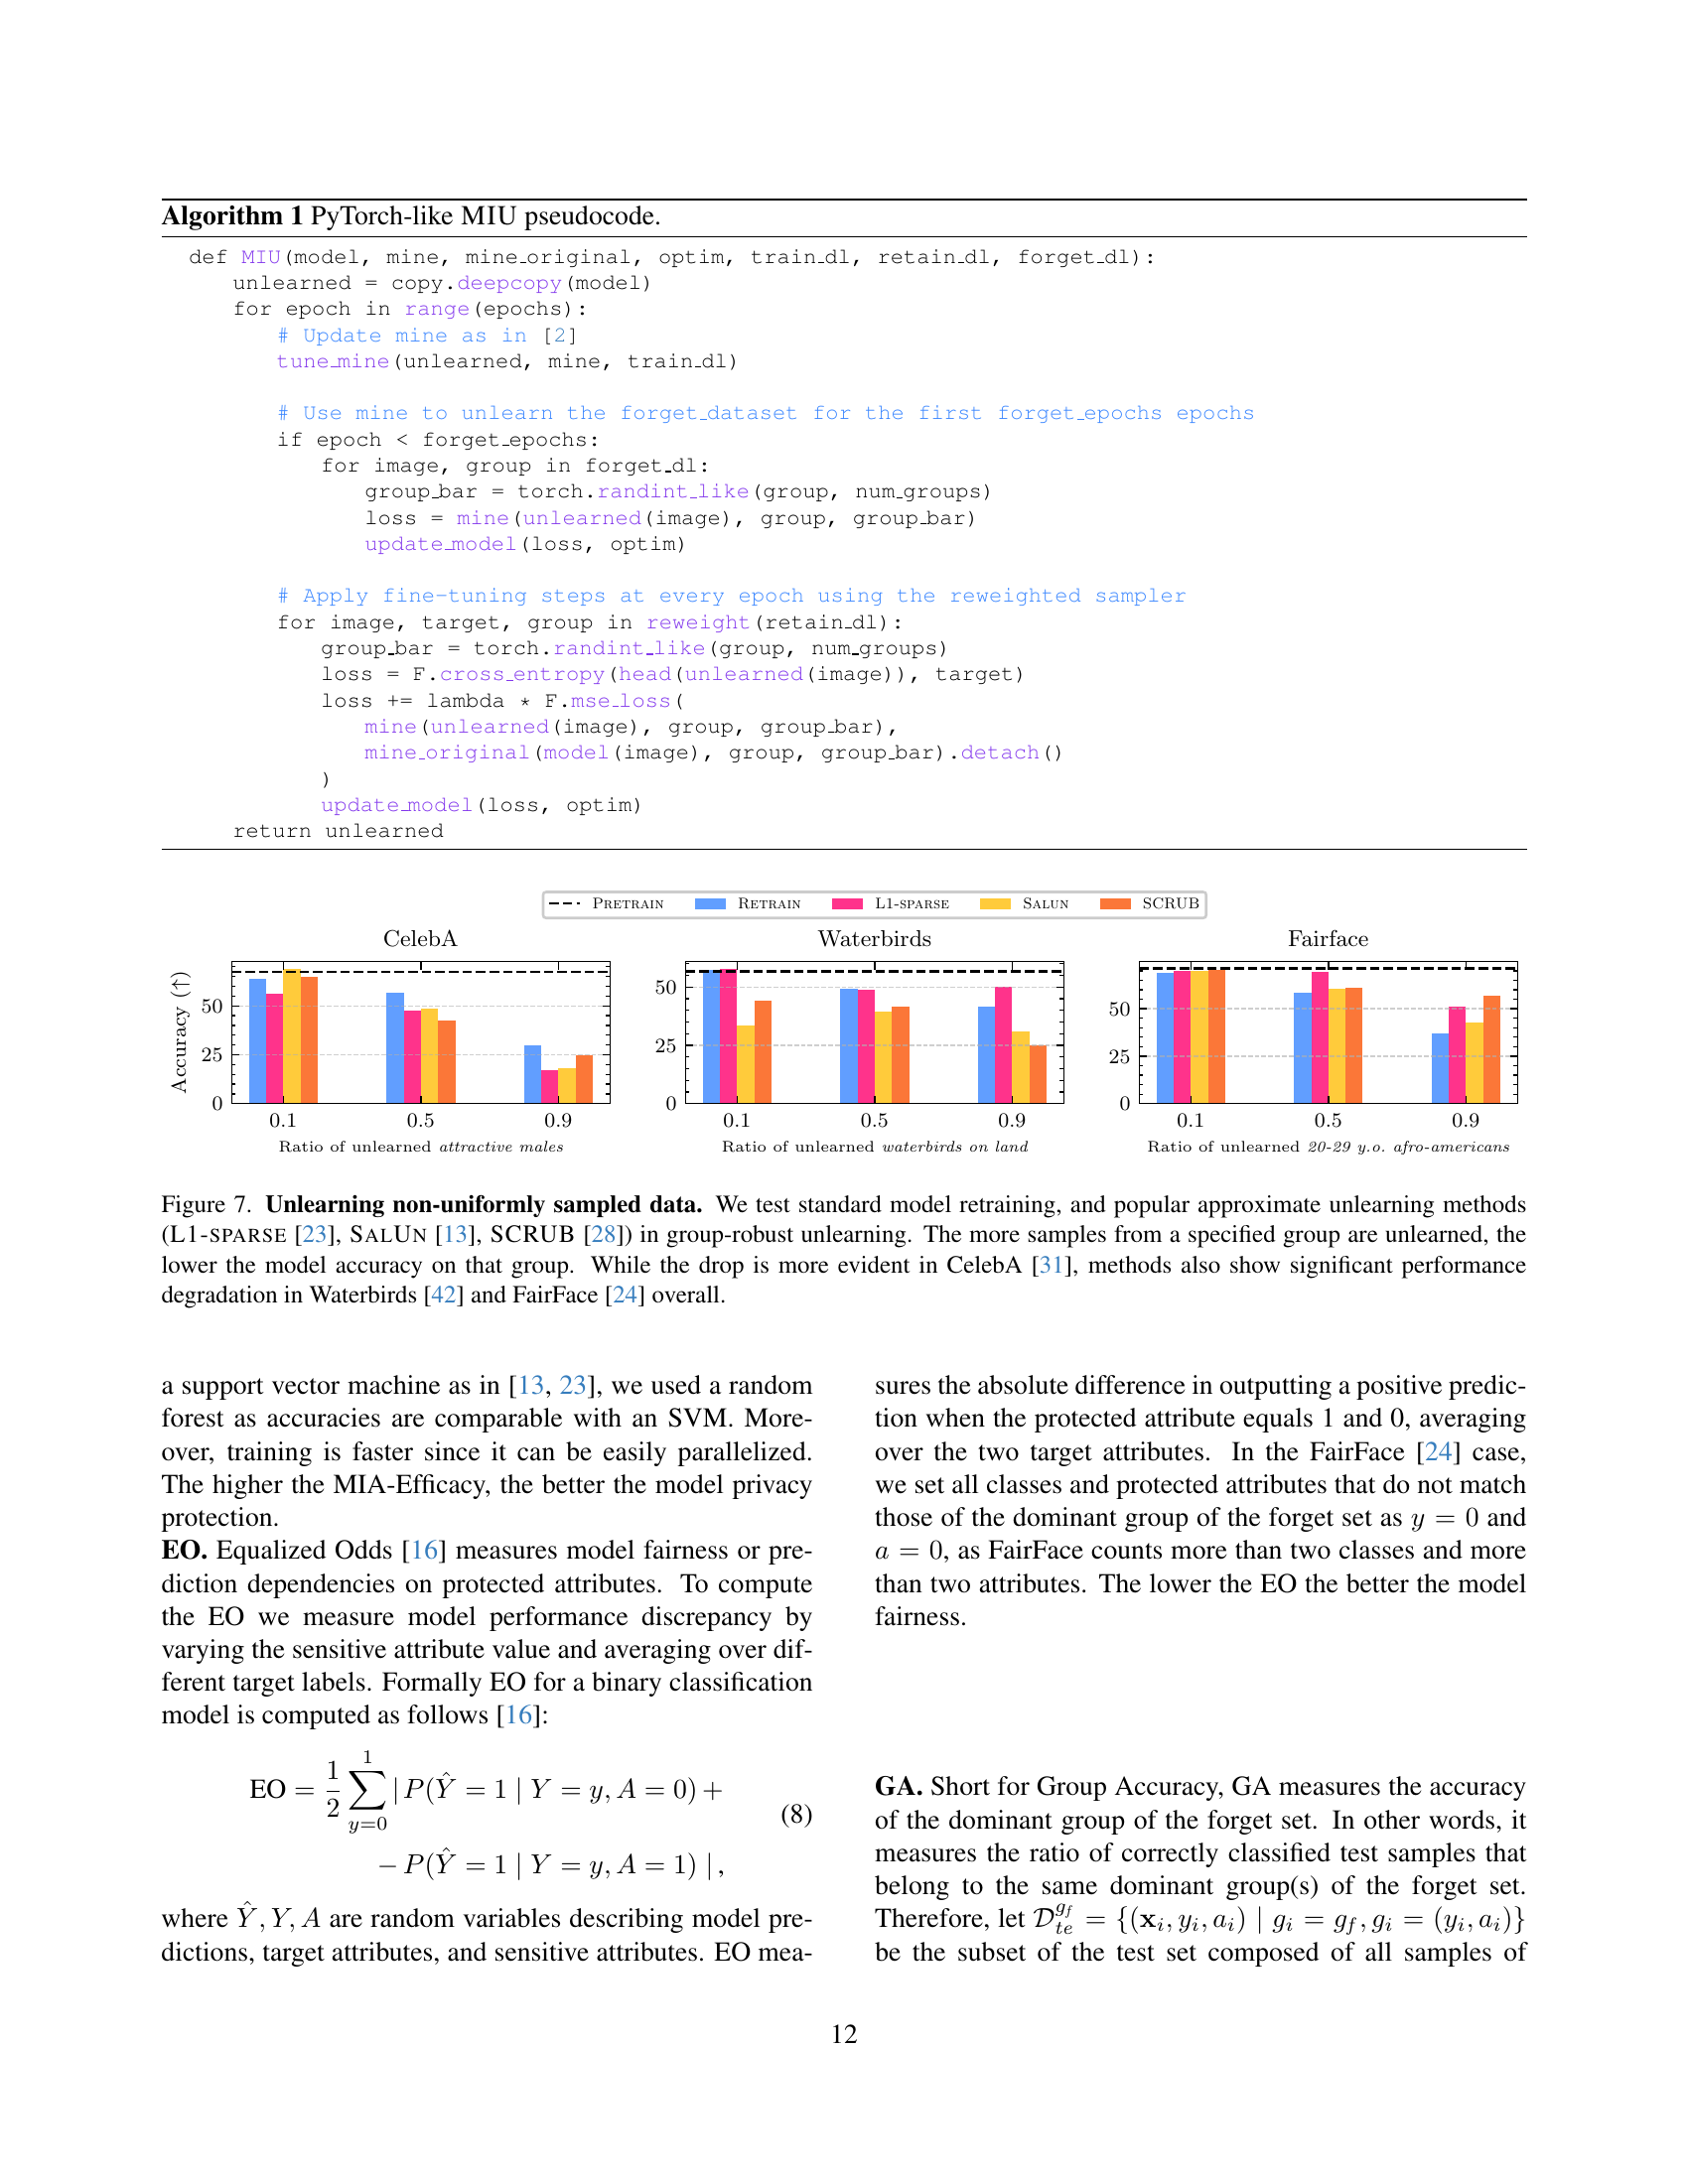
🔼 This figure displays a comparison of how different machine unlearning methods handle non-uniformly distributed data. Three popular approximate unlearning methods (L1-sparse, SalUn, and SCRUB) are tested, along with standard model retraining. The x-axis shows the proportion of data removed from a specific group (attractive males in CelebA, waterbirds on land in Waterbirds, and 20-29 year-old Afro-Americans in FairFace). The y-axis represents the model’s accuracy on that same group. The results show that as more data is removed from a single group, the accuracy for that group significantly decreases across all methods tested. While CelebA demonstrates the most pronounced drop, Waterbirds and FairFace datasets also exhibit substantial accuracy degradation, highlighting the challenge of preserving fairness and accuracy when unlearning data non-uniformly.
read the caption
Figure 7: Unlearning non-uniformly sampled data. We test standard model retraining, and popular approximate unlearning methods (L1-sparse [23], SalUn [13], SCRUB [28]) in group-robust unlearning. The more samples from a specified group are unlearned, the lower the model accuracy on that group. While the drop is more evident in CelebA [31], methods also show significant performance degradation in Waterbirds [42] and FairFace [24] overall.

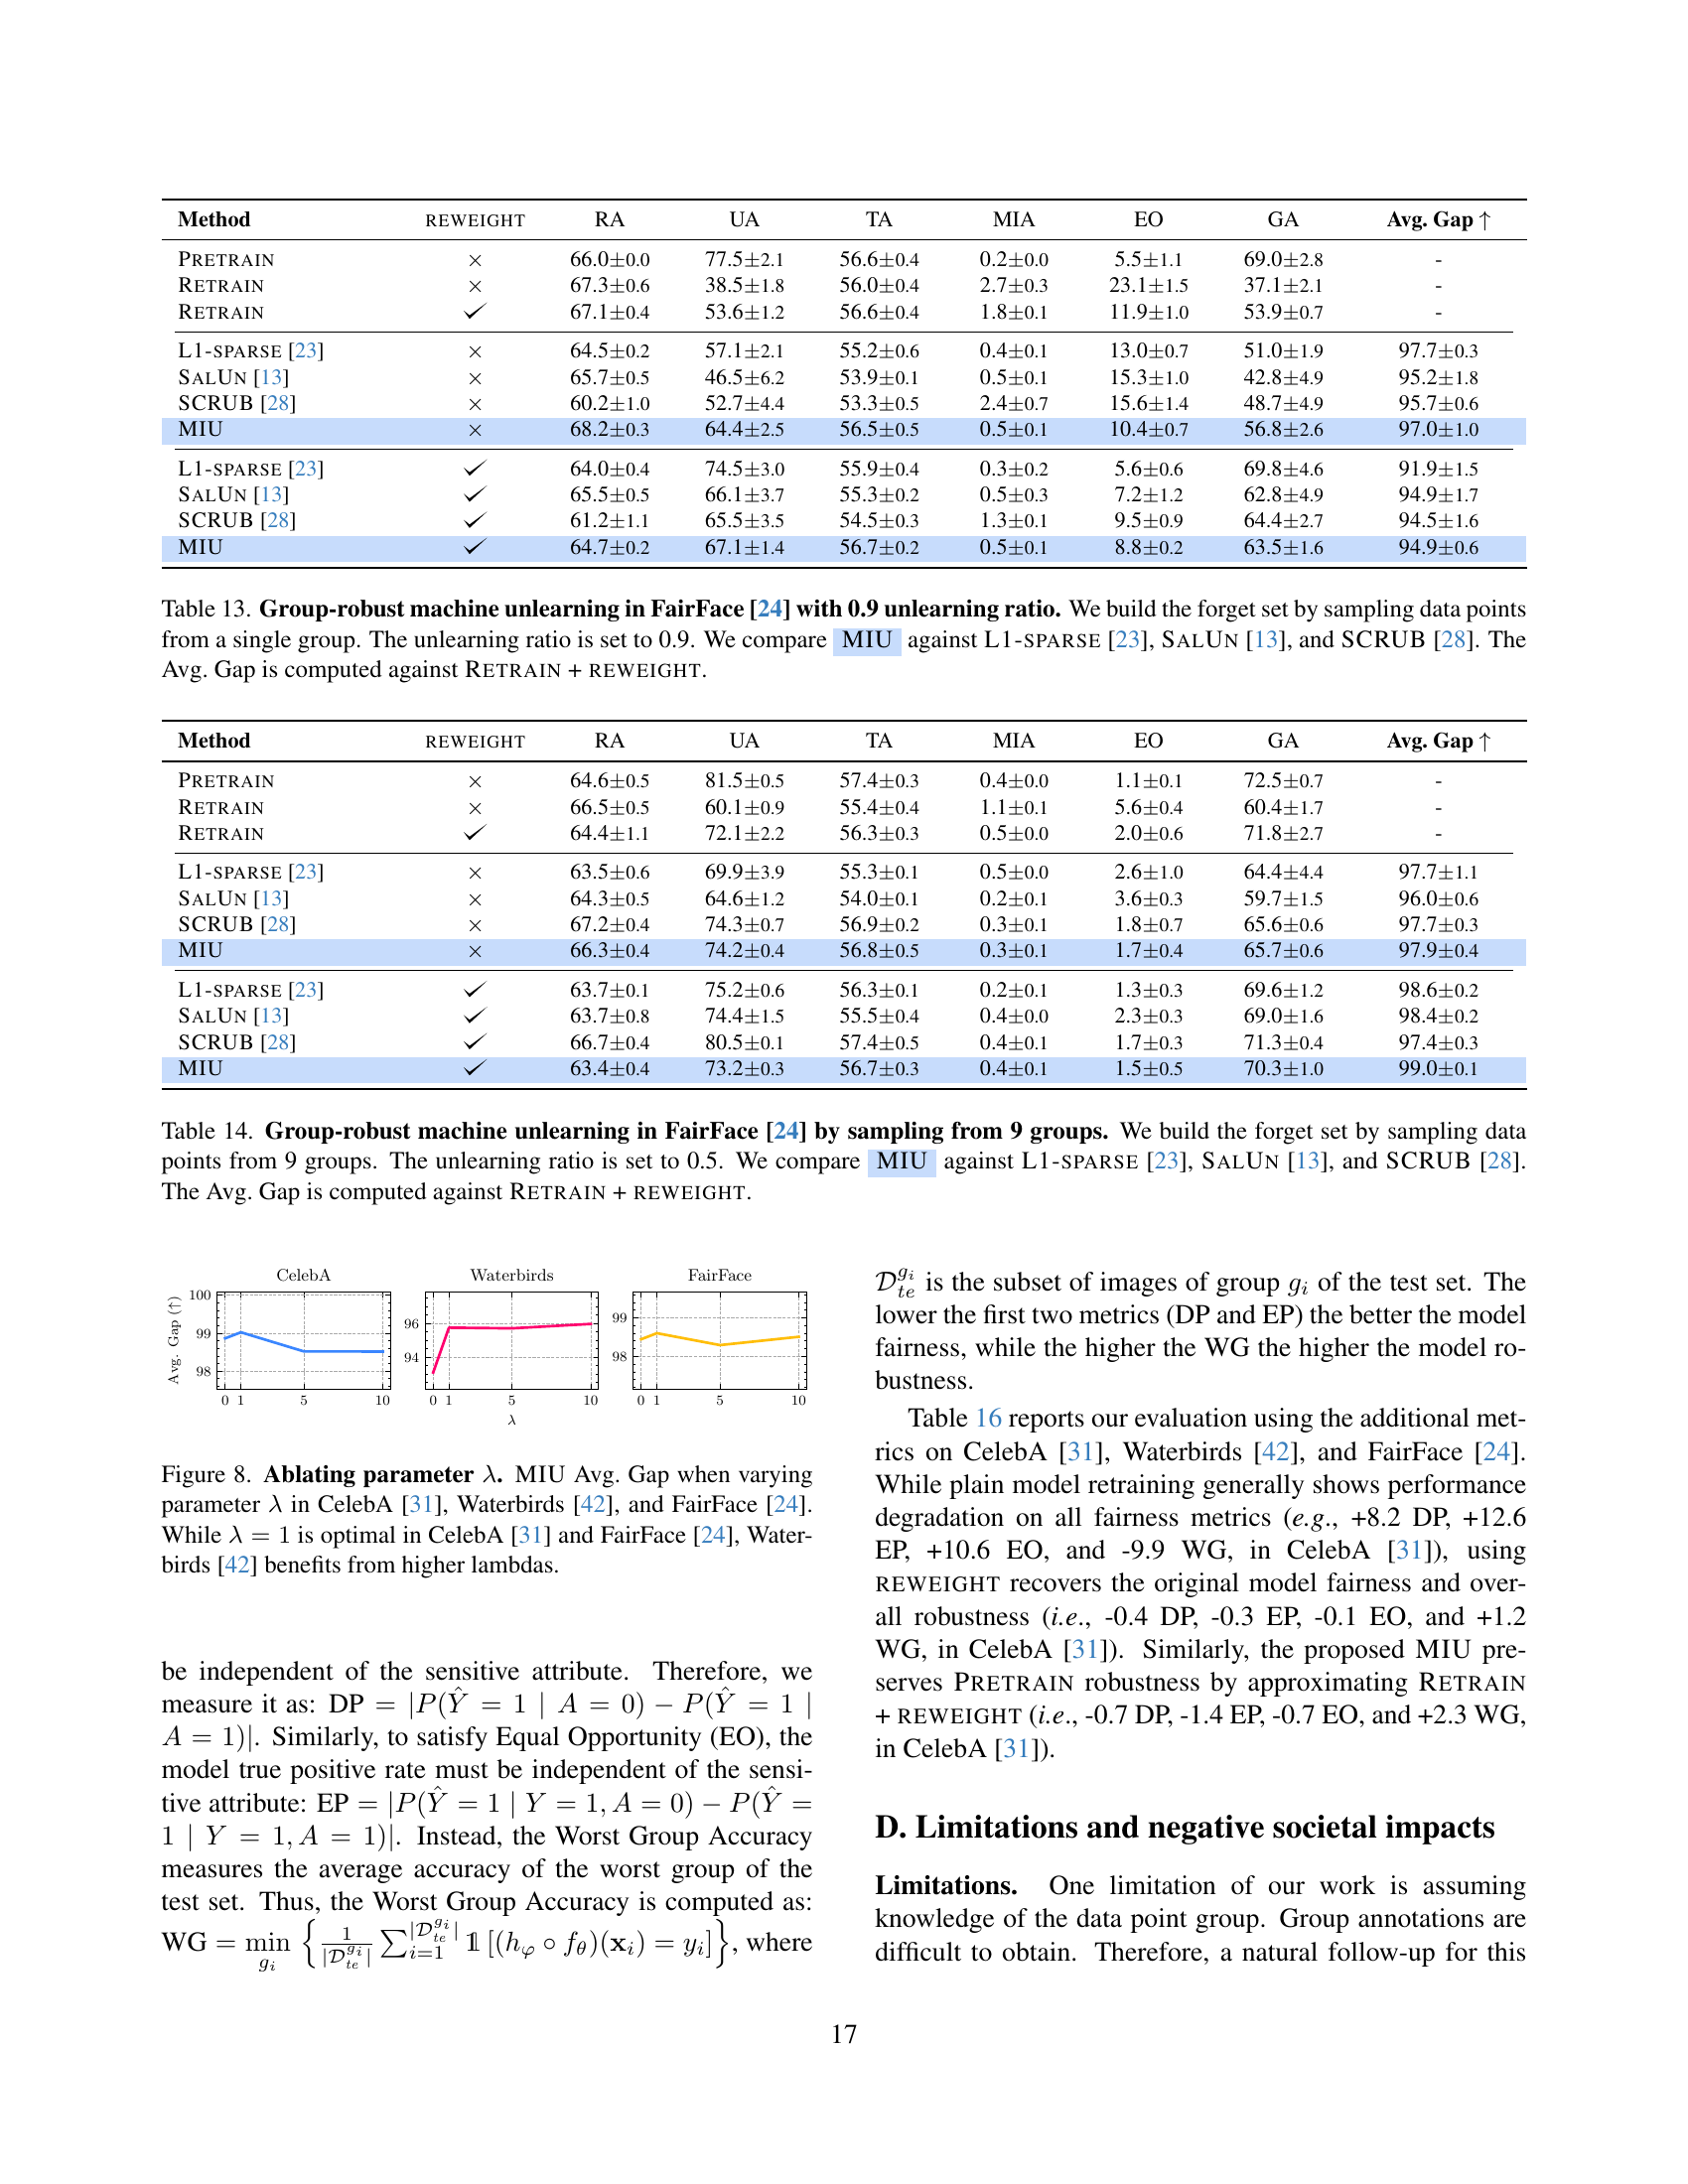
🔼 This figure shows the impact of the hyperparameter lambda (λ) on the performance of the MIU model across three different datasets: CelebA, Waterbirds, and FairFace. The y-axis represents the average gap (Avg. Gap) which is a metric measuring how close the MIU model’s performance comes to the ideal performance (RETRAIN + REWEIGHT). The x-axis shows the different values of λ that were tested. The results indicate that for CelebA and FairFace, λ=1 yields the best performance, whereas for Waterbirds, higher values of λ may be beneficial. This suggests that the optimal value of λ may be dataset-dependent.
read the caption
Figure 8: Ablating parameter λ𝜆\lambdaitalic_λ. MIU Avg. Gap when varying parameter λ𝜆\lambdaitalic_λ in CelebA [31], Waterbirds [42], and FairFace [24]. While λ=1𝜆1\lambda=1italic_λ = 1 is optimal in CelebA [31] and FairFace [24], Waterbirds [42] benefits from higher lambdas.
More on tables
| Method | reweight | RA | UA | TA | MIA | EO | GA | Avg. Gap |
|---|---|---|---|---|---|---|---|---|
| Pretrain | 98.9 | 84.5 | 87.7 | 33.3 | 26.2 | 56.6 | - | |
| Retrain | 98.7 | 52.4 | 86.5 | 54.8 | 30.4 | 49.4 | - | |
| Retrain | 94.7 | 89.3 | 91.6 | 21.4 | 7.3 | 83.1 | - | |
| Retrain | 99.0 | 59.5 | 87.2 | 53.6 | 28.3 | 51.6 | - | |
| L1-sparse [23] | 99.0 (0.2) | 59.5 (7.1) | 85.6 (1.6) | 44.0 (9.5) | 32.2 (4.1) | 48.8 (11.1) | 94.4 | |
| SalUn [13] | 100.0 (1.0) | 50.0 (9.5) | 81.8 (5.4) | 90.5 (36.9) | 38.7 (10.4) | 39.3 (12.3) | 87.4 | |
| SCRUB [28] | 98.8 (0.3) | 60.7 (10.7) | 86.9 (0.7) | 45.2 (10.7) | 31.9 (4.3) | 41.7 (9.8) | 93.9 | |
| MIU | 100.0 (1.0) | 53.6 (8.3) | 86.1 (1.2) | 58.3 (7.1) | 28.3 (3.0) | 53.8 (7.5) | 95.3 | |
| L1-sparse [23] | 98.7 (0.2) | 64.3 (11.9) | 85.0 (2.2) | 46.4 (7.1) | 30.6 (2.3) | 53.7 (8.3) | 94.7 | |
| SalUn [13] | 100.0 (1.0) | 47.6 (16.7) | 81.1 (6.1) | 91.7 (38.1) | 39.0 (10.7) | 39.0 (12.5) | 85.8 | |
| SCRUB [28] | 98.9 (0.2) | 66.7 (11.9) | 87.0 (0.6) | 44.0 (9.5) | 30.9 (3.4) | 44.3 (7.3) | 94.5 | |
| MIU | 99.9 (0.9) | 54.8 (4.8) | 85.8 (1.4) | 59.5 (6.0) | 28.3 (1.8) | 53.7 (4.0) | 96.9 |
🔼 Table 2 presents a comparison of different machine unlearning methods on the Waterbirds dataset [42], focusing on their ability to handle non-uniformly distributed forget sets (where the data to be forgotten is not evenly distributed across different groups). The experiment involves removing 50% of the data from a single dominant group within the forget set. The table compares the performance of the proposed MIU method against three existing baselines: L1-sparse [23], SalUn [13], and SCRUB [28]. Evaluation metrics include retention accuracy (RA), unlearning accuracy (UA), test accuracy (TA), Membership Inference Attack efficacy (MIA), Equalized Odds (EO), and the accuracy of the dominant group in the forget set (GA). The ‘Avg. Gap’ metric summarizes the average performance difference compared to an ideal scenario (Retrain + Reweight). The results demonstrate MIU’s effectiveness in maintaining model performance, specifically for the dominant group, in the face of non-uniform data removal.
read the caption
Table 2: Group-robust machine unlearning in Waterbirds [42]. We build the forget set by sampling data points from a single group. The unlearning ratio is set to 0.5. We compare AyMIU against L1-sparse [23], SalUn [13], and SCRUB [28]. The Avg. Gap and deltas are computed against Retrain + reweight. To avoid confusion, other reference models are in light gray.
| Method | reweight | RA | UA | TA | MIA | EO | GA | Avg. Gap |
|---|---|---|---|---|---|---|---|---|
| Pretrain | 65.6 | 79.0 | 57.2 | 0.2 | 5.4 | 71.2 | - | |
| Retrain | 66.8 | 57.8 | 56.5 | 0.9 | 9.2 | 58.7 | - | |
| Retrain | 61.7 | 56.3 | 51.4 | 10.2 | 2.3 | 57.4 | - | |
| Retrain | 66.7 | 69.3 | 56.7 | 0.7 | 5.6 | 69.6 | - | |
| L1-sparse [23] | 64.0 (2.7) | 74.1 (4.8) | 56.9 (0.5) | 0.2 (0.7) | 6.1 (0.9) | 69.4 (0.4) | 98.3 | |
| SalUn [13] | 66.3 (0.3) | 66.6 (3.0) | 55.9 (0.8) | 0.3 (0.6) | 9.0 (3.4) | 60.3 (9.3) | 97.1 | |
| SCRUB [28] | 66.9 (0.3) | 65.4 (3.9) | 56.7 (0.6) | 1.0 (0.5) | 9.9 (4.3) | 61.3 (8.3) | 97.0 | |
| MIU | 66.7 (0.1) | 74.7 (5.4) | 57.2 (0.8) | 0.3 (0.5) | 6.0 (1.1) | 66.1 (3.5) | 98.1 | |
| L1-sparse [23] | 64.4 (2.3) | 72.9 (3.6) | 56.0 (0.9) | 0.3 (0.4) | 6.1 (2.0) | 67.0 (7.1) | 97.3 | |
| SalUn [13] | 65.1 (1.5) | 69.8 (5.6) | 54.8 (1.8) | 0.3 (0.4) | 6.6 (1.7) | 63.7 (5.9) | 97.2 | |
| SCRUB [28] | 66.7 (0.2) | 73.4 (4.1) | 57.2 (0.6) | 0.7 (0.3) | 6.2 (0.7) | 70.2 (1.8) | 98.7 | |
| MIU | 64.7 (1.9) | 71.6 (2.3) | 57.1 (0.5) | 0.3 (0.3) | 5.8 (1.5) | 70.3 (1.2) | 98.7 |
🔼 This table presents the results of a group-robust machine unlearning experiment on the FairFace dataset. The experiment aims to remove the influence of a specific group’s data from a pre-trained model while minimizing the impact on the accuracy for other groups. The forget set (data to be removed) was sampled from a single group, with a 50% unlearning ratio (half the data from that group was removed). The table compares a new method, MIU, with three existing approaches (L1-sparse, SalUn, and SCRUB) in terms of several metrics that measure unlearning effectiveness and fairness across different groups. The ‘Avg. Gap’ metric shows the average difference between the performance of each method and an optimal retraining model (Retrain + Reweight) that serves as a baseline for comparison. The use of light gray for some rows aids in distinguishing between MIU and other baselines.
read the caption
Table 3: Group-robust machine unlearning in FairFace [24]. We build the forget set by sampling data points from a single group. The unlearning ratio is set to 0.5. We compare AyMIU against L1-sparse [23], SalUn [13], and SCRUB [28]. The Avg. Gap and deltas are computed against Retrain + reweight. To avoid confusion, other reference models are in light gray.
| Dataset | Eq. 5 | Eq. 3 | Eq. 4 | RW | UA | GA | Gap |
|---|---|---|---|---|---|---|---|
| CelebA | 53.6 | 54.0 | 94.1 | ||||
| 55.3 | 55.9 | 94.9 | |||||
| 41.7 | 42.3 | 78.9 | |||||
| 68.8 | 69.0 | 99.2 | |||||
| Waterbirds | 47.6 | 51.1 | 92.5 | ||||
| 53.6 | 53.8 | 95.3 | |||||
| 16.7 | 16.8 | 81.9 | |||||
| 54.8 | 53.7 | 96.9 | |||||
| FairFace | 63.1 | 59.2 | 96.1 | ||||
| 74.7 | 66.1 | 98.1 | |||||
| 87.1 | 81.1 | 93.0 | |||||
| 71.6 | 70.3 | 98.7 |
🔼 This table presents an ablation study of the MIU model. It shows the impact of removing different components of the MIU model (retaining term, unlearning term, calibration term, and reweighting) on the model’s performance. The performance is measured using three metrics: Unlearning Accuracy (UA), Dominant Group Accuracy (GA), and Average Gap (Avg. Gap). The table helps to understand the contribution of each component to the overall effectiveness of the MIU model in achieving group robustness during machine unlearning. The row highlighted corresponds to the full MIU model with all components included.
read the caption
Table 4: MIU ablations. We compute MIU ablations on each of the three investigated datasets. From left to right, we report the investigated dataset, the retaining term, the unlearning term, the calibration term, and reweight. We measure performance using UA, GA, and Avg. Gap. The configuration that corresponds to AyMIU + reweight is highlighted.
| Method | reweight | RA | UA | TA | MIA | EO | GA | Avg. Gap |
| Pretrain | 83.80.0 | 67.90.5 | 82.70.1 | 0.10.1 | 20.81.0 | 69.00.9 | - | |
| Retrain | 83.80.1 | 62.01.6 | 82.50.1 | 0.20.1 | 21.91.3 | 64.01.9 | - | |
| Retrain | 83.70.2 | 63.21.6 | 82.70.2 | 0.20.0 | 21.20.5 | 65.81.7 | - | |
| L1-sparse [23] | 82.20.1 | 52.80.5 | 81.50.0 | 0.10.0 | 29.80.1 | 56.01.4 | 94.80.5 | |
| SalUn [13] | 83.10.8 | 69.28.5 | 81.80.9 | 0.10.1 | 23.81.8 | 69.18.0 | 96.92.0 | |
| SCRUB [28] | 84.40.0 | 64.90.6 | 82.90.2 | 0.10.0 | 22.00.3 | 65.00.1 | 99.10.2 | |
| MIU | 83.90.1 | 63.13.8 | 82.70.0 | 0.10.0 | 22.30.4 | 64.03.8 | 98.60.8 | |
| L1-sparse [23] | 82.20.2 | 60.72.0 | 81.50.2 | 0.10.0 | 27.40.6 | 63.42.2 | 97.30.8 | |
| SalUn [13] | 83.50.1 | 61.92.0 | 82.60.1 | 0.10.1 | 22.71.0 | 63.12.0 | 98.30.2 | |
| SCRUB [28] | 84.40.0 | 66.80.7 | 82.90.1 | 0.20.0 | 20.40.2 | 67.60.5 | 98.80.6 | |
| MIU | 83.80.2 | 67.25.6 | 82.40.2 | 0.10.1 | 20.90.6 | 67.84.3 | 98.81.2 |
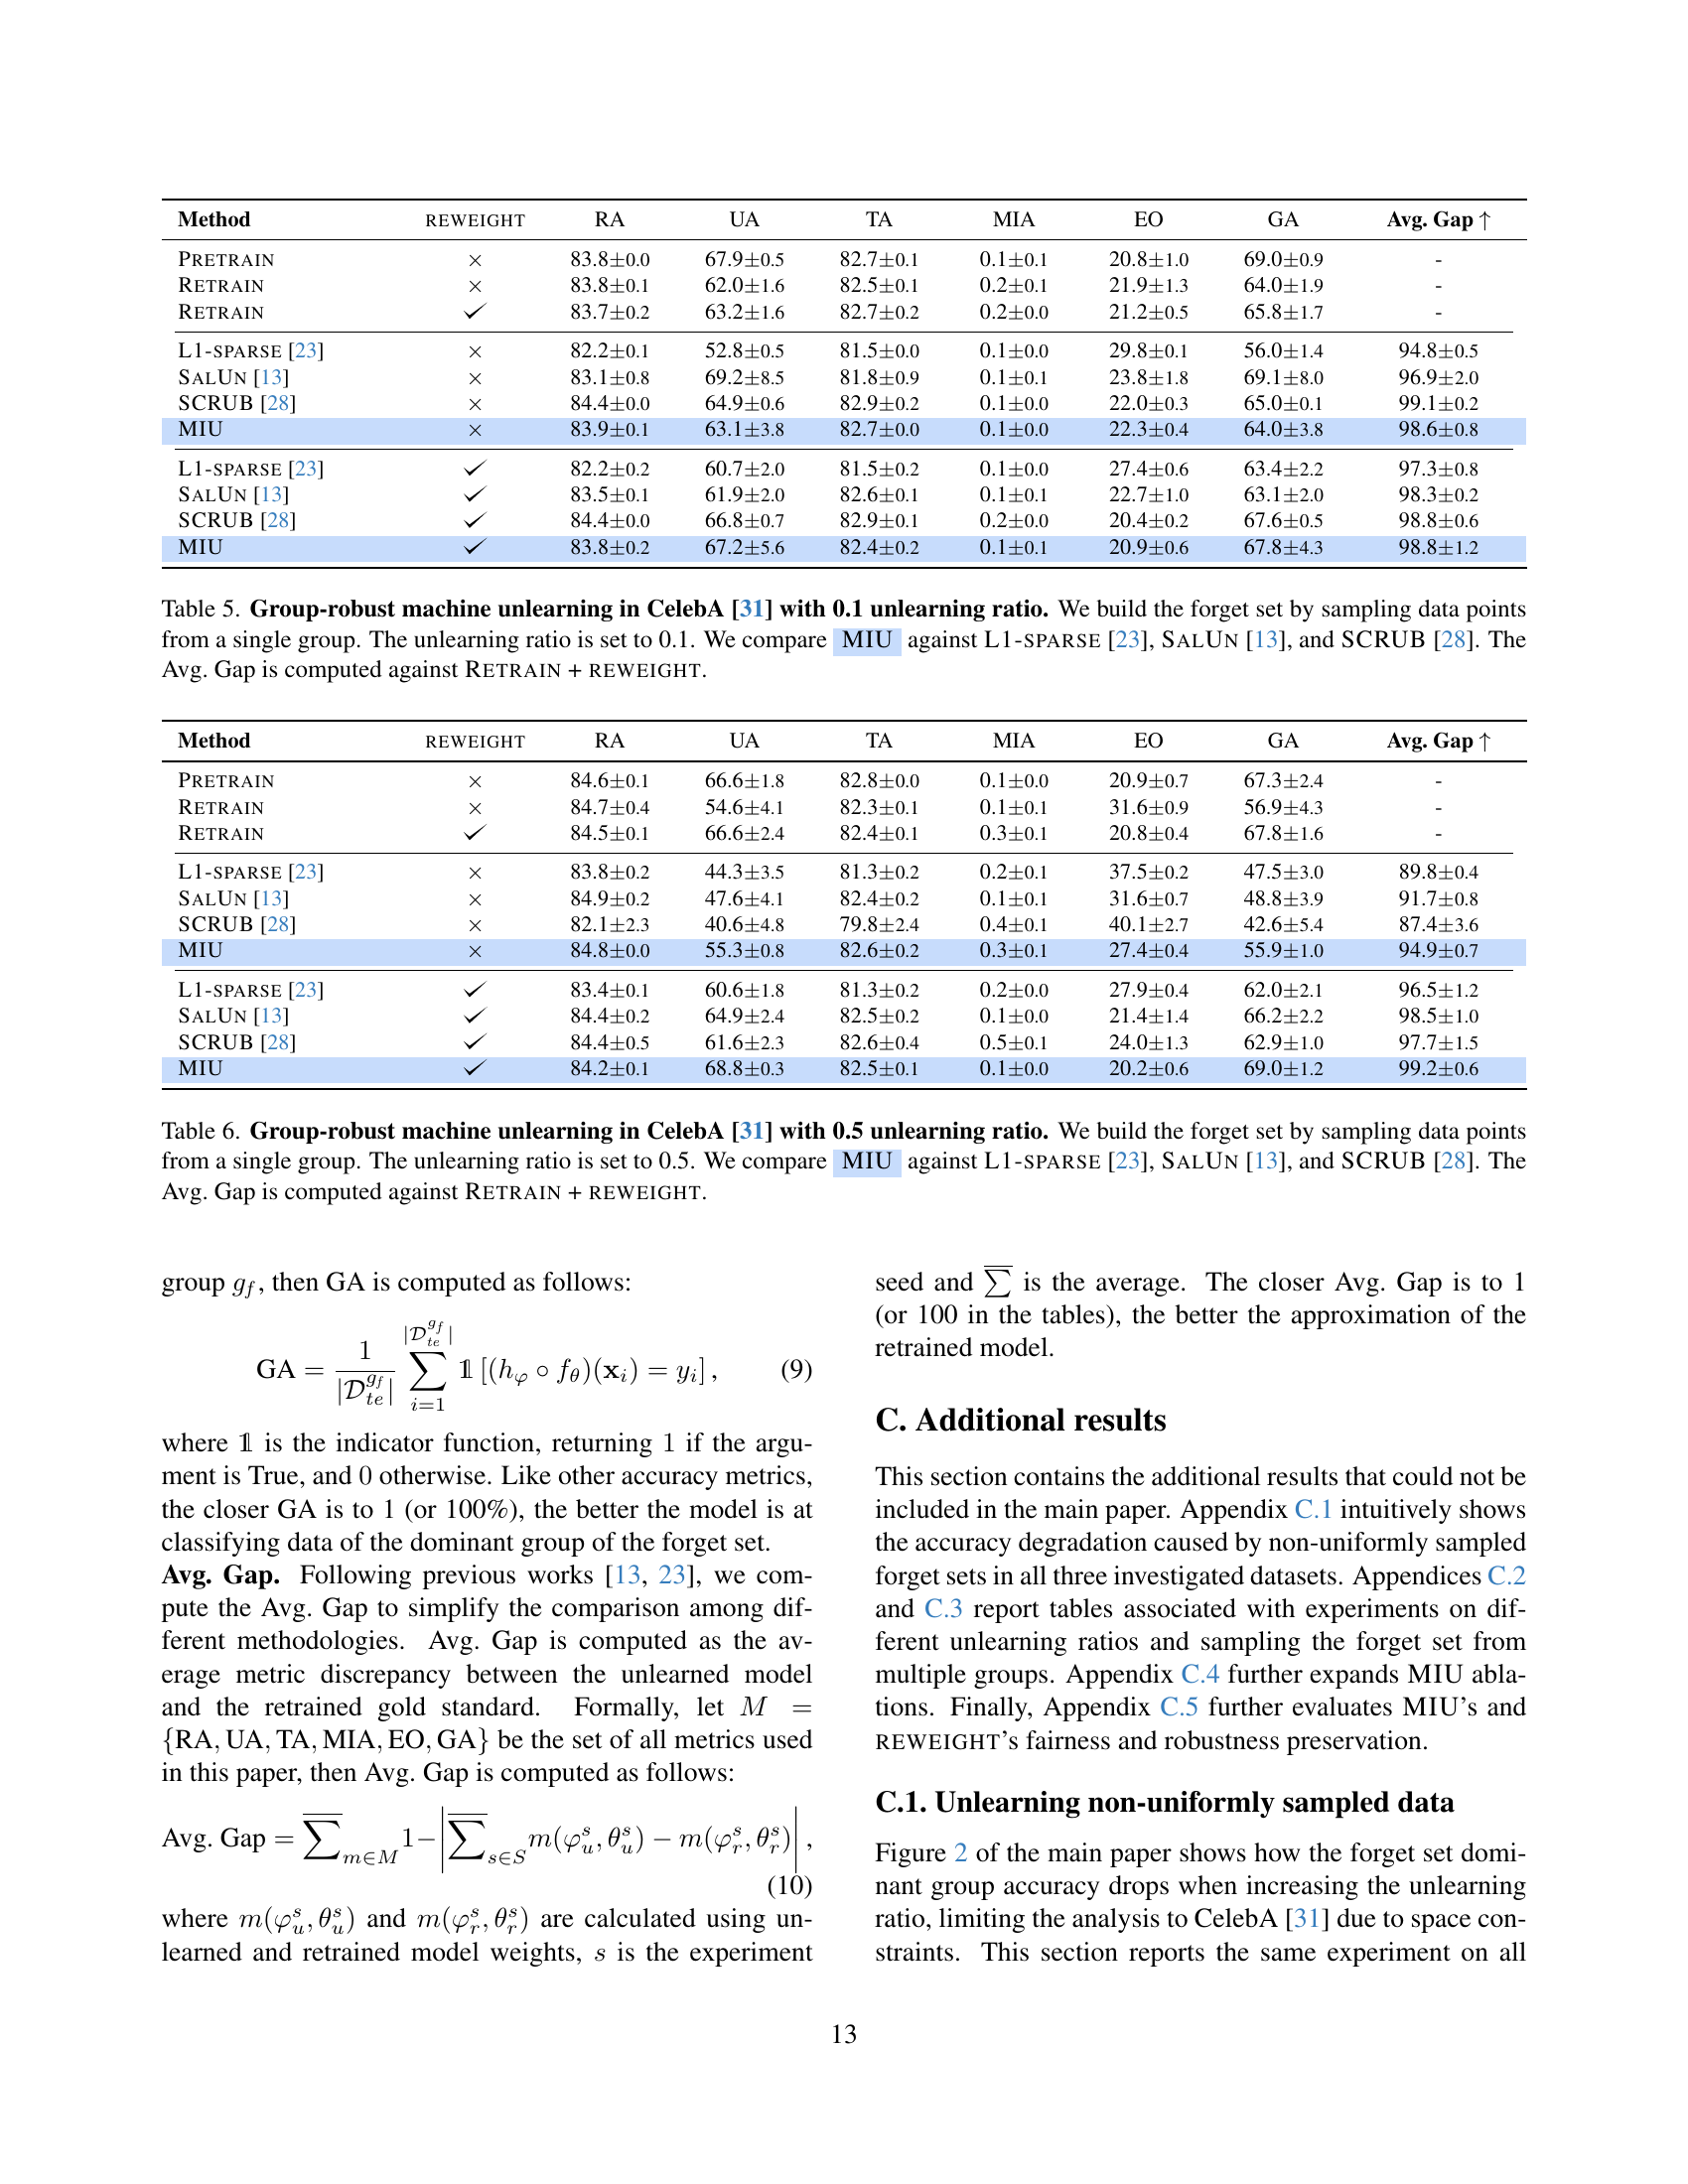
🔼 This table presents the results of a group-robust machine unlearning experiment on the CelebA dataset [31], where only 10% of the data points from a single group are removed from the model. The experiment compares the performance of MIU to several baseline methods (L1-sparse [23], SalUn [13], SCRUB [28]) in terms of retain accuracy (RA), unlearning accuracy (UA), test accuracy (TA), membership inference attack (MIA) efficacy, equalized odds (EO), dominant group accuracy (GA), and an average gap (Avg. Gap) calculated relative to a retrained model with reweighting. The Avg. Gap metric helps quantify the overall performance difference between each method and the ideal case, providing a comprehensive evaluation of group-robustness after unlearning.
read the caption
Table 5: Group-robust machine unlearning in CelebA [31] with 0.1 unlearning ratio. We build the forget set by sampling data points from a single group. The unlearning ratio is set to 0.1. We compare AyMIU against L1-sparse [23], SalUn [13], and SCRUB [28]. The Avg. Gap is computed against Retrain + reweight.
| Method | reweight | RA | UA | TA | MIA | EO | GA | Avg. Gap |
| Pretrain | 84.60.1 | 66.61.8 | 82.80.0 | 0.10.0 | 20.90.7 | 67.32.4 | - | |
| Retrain | 84.70.4 | 54.64.1 | 82.30.1 | 0.10.1 | 31.60.9 | 56.94.3 | - | |
| Retrain | 84.50.1 | 66.62.4 | 82.40.1 | 0.30.1 | 20.80.4 | 67.81.6 | - | |
| L1-sparse [23] | 83.80.2 | 44.33.5 | 81.30.2 | 0.20.1 | 37.50.2 | 47.53.0 | 89.80.4 | |
| SalUn [13] | 84.90.2 | 47.64.1 | 82.40.2 | 0.10.1 | 31.60.7 | 48.83.9 | 91.70.8 | |
| SCRUB [28] | 82.12.3 | 40.64.8 | 79.82.4 | 0.40.1 | 40.12.7 | 42.65.4 | 87.43.6 | |
| MIU | 84.80.0 | 55.30.8 | 82.60.2 | 0.30.1 | 27.40.4 | 55.91.0 | 94.90.7 | |
| L1-sparse [23] | 83.40.1 | 60.61.8 | 81.30.2 | 0.20.0 | 27.90.4 | 62.02.1 | 96.51.2 | |
| SalUn [13] | 84.40.2 | 64.92.4 | 82.50.2 | 0.10.0 | 21.41.4 | 66.22.2 | 98.51.0 | |
| SCRUB [28] | 84.40.5 | 61.62.3 | 82.60.4 | 0.50.1 | 24.01.3 | 62.91.0 | 97.71.5 | |
| MIU | 84.20.1 | 68.80.3 | 82.50.1 | 0.10.0 | 20.20.6 | 69.01.2 | 99.20.6 |
🔼 Table 6 presents a comparison of different machine unlearning methods on the CelebA dataset. The experiment focuses on group robustness, specifically how well each method maintains accuracy for a specific group within the dataset when a portion of that group’s data is removed (unlearning ratio of 0.5). The forget set consists solely of data from a single group. The table compares the performance of MIU against three other methods: L1-SPARSE, SalUn, and SCRUB. The performance of each method is evaluated using multiple metrics. The ‘Avg. Gap’ metric indicates the average performance difference compared to an ideal scenario, which involves retraining the model after removing the forgotten data with a sample reweighting strategy.
read the caption
Table 6: Group-robust machine unlearning in CelebA [31] with 0.5 unlearning ratio. We build the forget set by sampling data points from a single group. The unlearning ratio is set to 0.5. We compare AyMIU against L1-sparse [23], SalUn [13], and SCRUB [28]. The Avg. Gap is computed against Retrain + reweight.
| Method | reweight | RA | UA | TA | MIA | EO | GA | Avg. Gap |
| Pretrain | 85.30.1 | 67.60.9 | 82.70.1 | 0.10.1 | 20.00.8 | 68.00.9 | - | |
| Retrain | 86.80.4 | 27.82.4 | 80.70.2 | 1.30.2 | 50.01.0 | 29.92.2 | - | |
| Retrain | 84.20.9 | 64.24.5 | 81.80.2 | 0.40.4 | 22.90.9 | 66.84.8 | - | |
| L1-sparse [23] | 86.90.1 | 15.61.5 | 79.60.2 | 10.02.6 | 54.60.8 | 17.01.1 | 75.91.9 | |
| SalUn [13] | 87.00.3 | 17.310.0 | 80.01.0 | 8.25.4 | 44.40.8 | 18.39.9 | 78.42.9 | |
| SCRUB [28] | 71.51.2 | 34.01.6 | 67.01.1 | 0.90.9 | 36.63.3 | 34.62.1 | 82.61.1 | |
| MIU | 87.30.1 | 31.62.0 | 81.30.2 | 1.90.4 | 38.30.2 | 32.81.8 | 85.51.1 | |
| L1-sparse [23] | 85.00.4 | 56.03.2 | 80.60.2 | 5.12.1 | 31.10.4 | 58.52.7 | 94.81.5 | |
| SalUn [13] | 85.11.0 | 59.711.6 | 81.40.6 | 1.00.8 | 23.52.2 | 60.610.8 | 94.31.0 | |
| SCRUB [28] | 64.25.2 | 66.36.2 | 62.84.4 | 0.20.1 | 16.010.7 | 66.97.4 | 87.81.3 | |
| MIU | 82.93.1 | 64.13.7 | 79.82.1 | 1.51.2 | 25.83.1 | 66.44.6 | 98.30.6 |
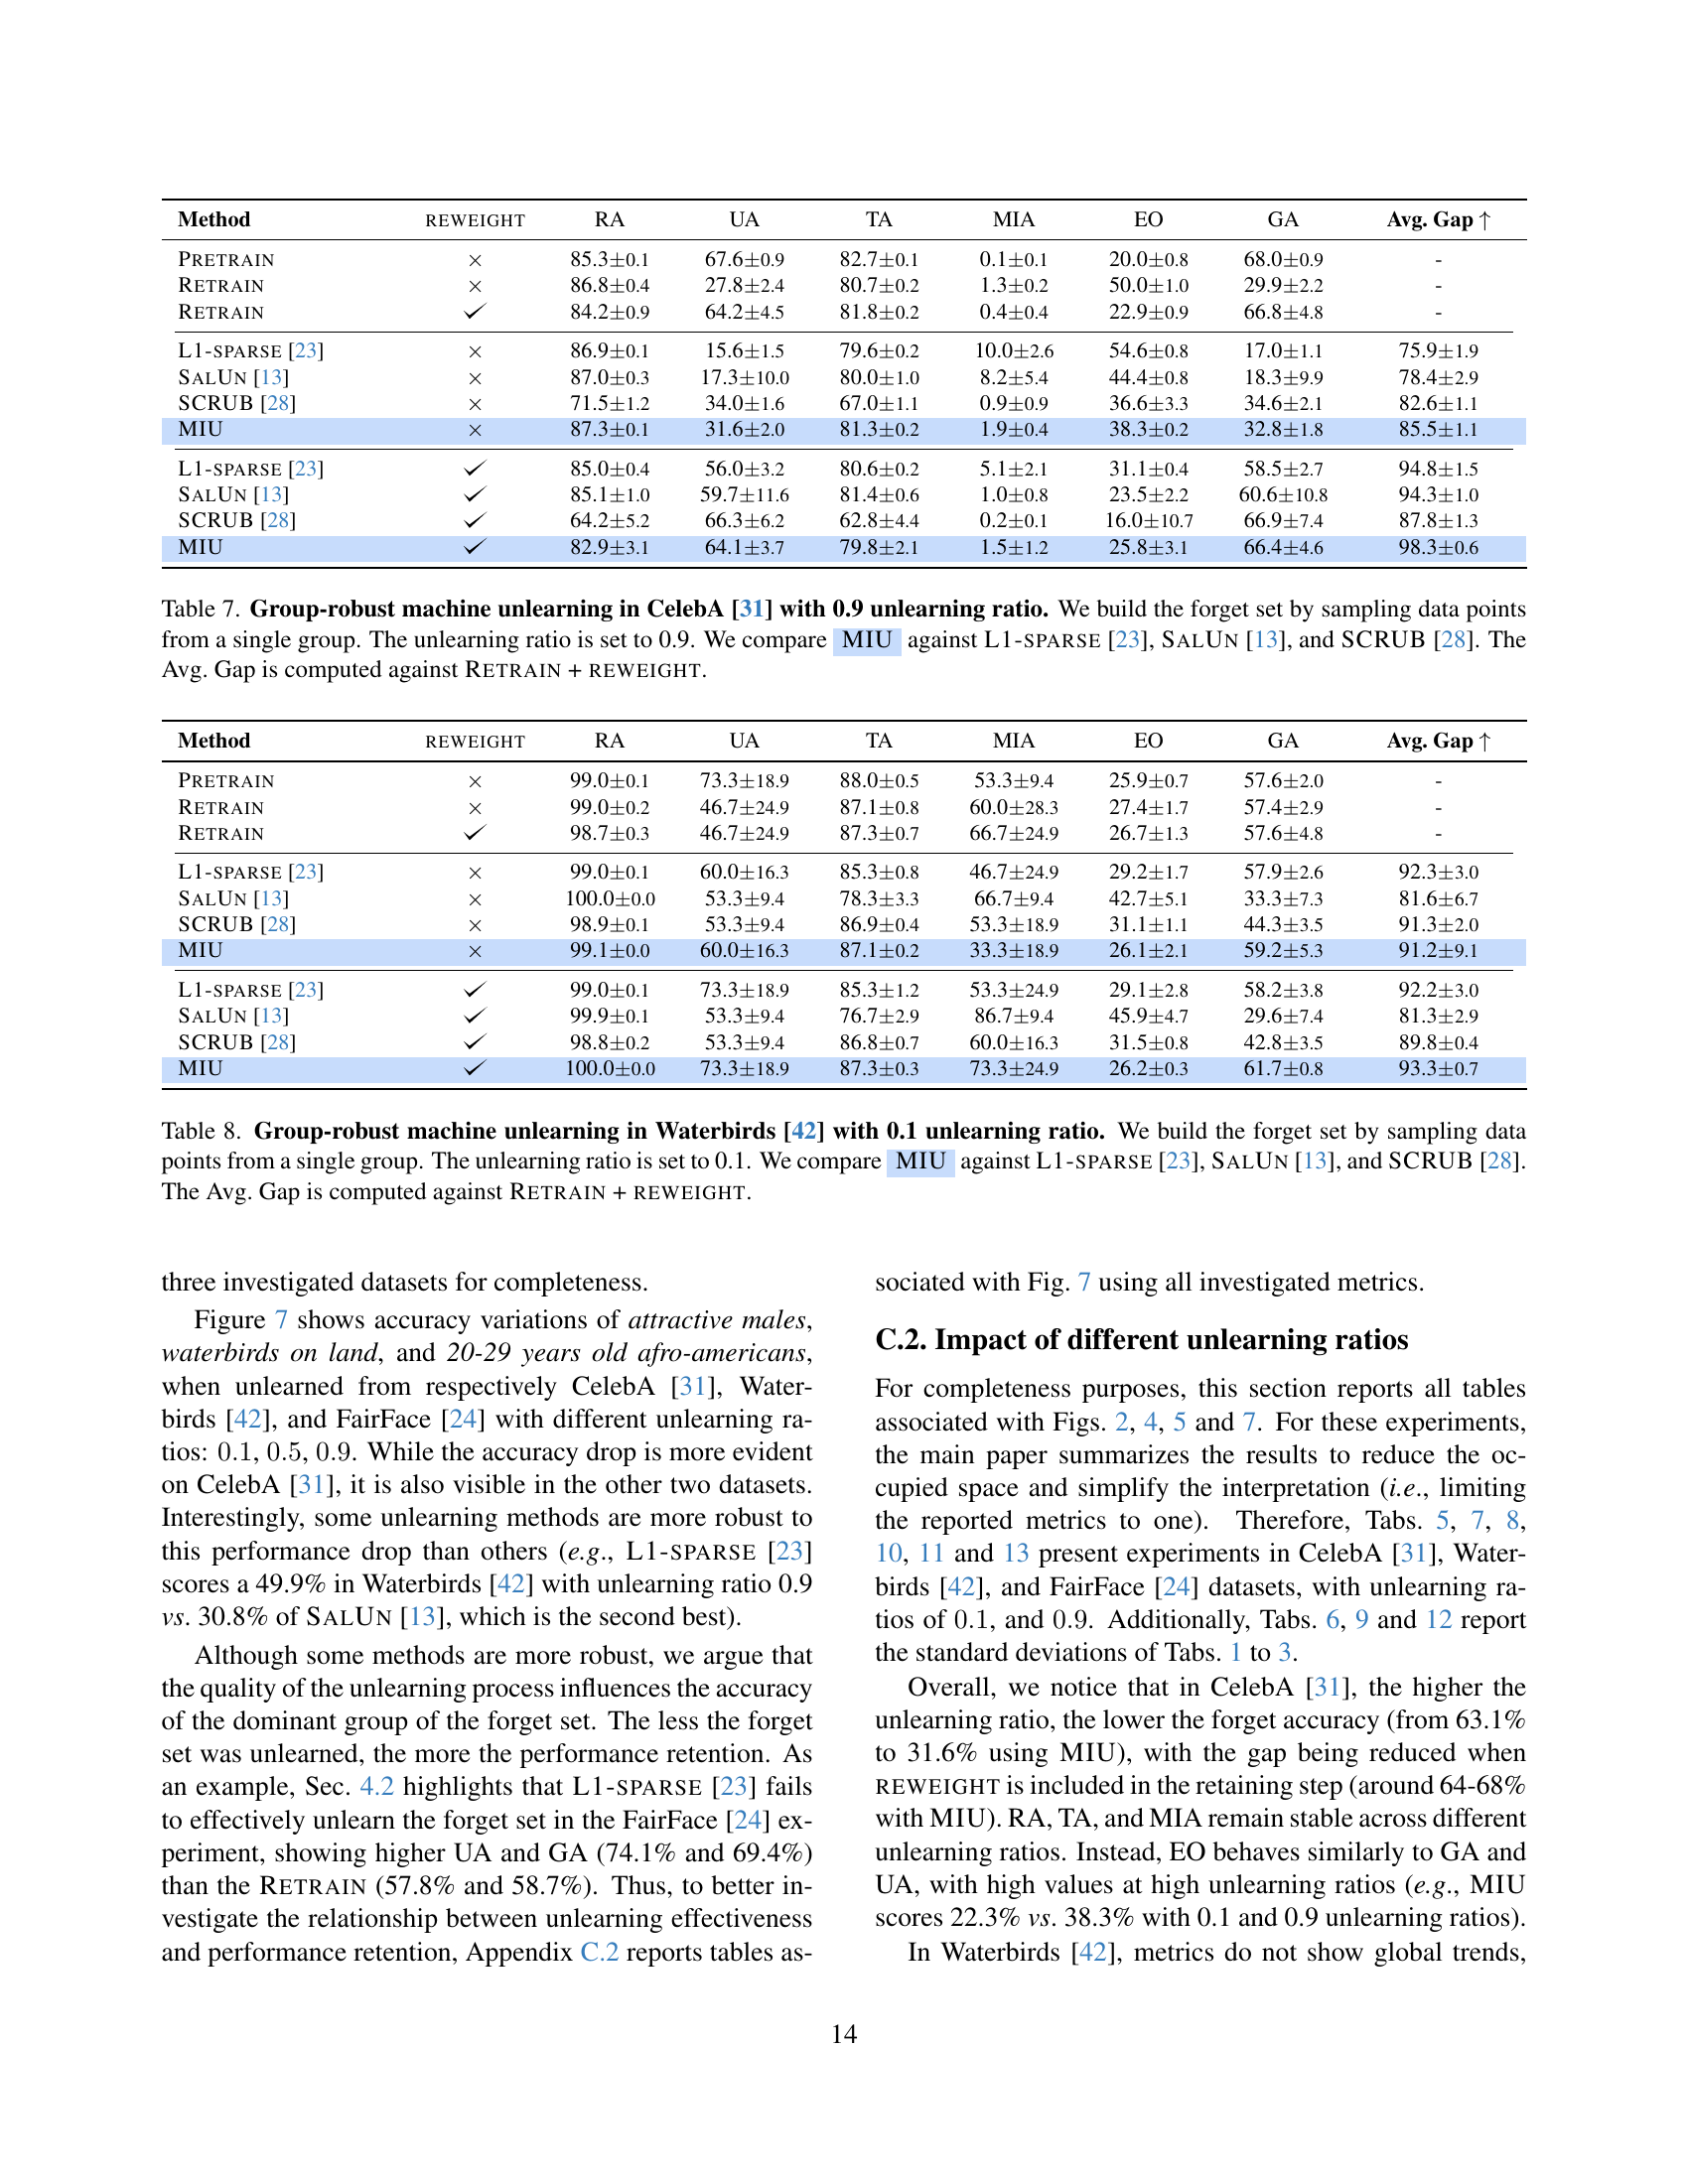
🔼 Table 7 presents the results of a group-robust machine unlearning experiment on the CelebA dataset [31] using an unlearning ratio of 0.9. In this experiment, the forget set (the data the model is trained to forget) was created by sampling data points from a single group within the dataset. The table compares the performance of the proposed method (MIU) against three existing machine unlearning methods: L1-sparse [23], SalUn [13], and SCRUB [28]. The comparison focuses on several metrics including retain accuracy (RA), forget accuracy (UA), test accuracy (TA), membership inference attack efficacy (MIA), equalized odds (EO), dominant group accuracy (GA), and the average gap (Avg. Gap) which measures the overall performance difference compared to the ideal scenario of retraining the model with the retain set and re-weighting the samples, which is considered the gold standard. The Avg. Gap is calculated relative to the Retrain + Reweight scenario.
read the caption
Table 7: Group-robust machine unlearning in CelebA [31] with 0.9 unlearning ratio. We build the forget set by sampling data points from a single group. The unlearning ratio is set to 0.9. We compare AyMIU against L1-sparse [23], SalUn [13], and SCRUB [28]. The Avg. Gap is computed against Retrain + reweight.
| Method | reweight | RA | UA | TA | MIA | EO | GA | Avg. Gap |
| Pretrain | 99.00.1 | 73.318.9 | 88.00.5 | 53.39.4 | 25.90.7 | 57.62.0 | - | |
| Retrain | 99.00.2 | 46.724.9 | 87.10.8 | 60.028.3 | 27.41.7 | 57.42.9 | - | |
| Retrain | 98.70.3 | 46.724.9 | 87.30.7 | 66.724.9 | 26.71.3 | 57.64.8 | - | |
| L1-sparse [23] | 99.00.1 | 60.016.3 | 85.30.8 | 46.724.9 | 29.21.7 | 57.92.6 | 92.33.0 | |
| SalUn [13] | 100.00.0 | 53.39.4 | 78.33.3 | 66.79.4 | 42.75.1 | 33.37.3 | 81.66.7 | |
| SCRUB [28] | 98.90.1 | 53.39.4 | 86.90.4 | 53.318.9 | 31.11.1 | 44.33.5 | 91.32.0 | |
| MIU | 99.10.0 | 60.016.3 | 87.10.2 | 33.318.9 | 26.12.1 | 59.25.3 | 91.29.1 | |
| L1-sparse [23] | 99.00.1 | 73.318.9 | 85.31.2 | 53.324.9 | 29.12.8 | 58.23.8 | 92.23.0 | |
| SalUn [13] | 99.90.1 | 53.39.4 | 76.72.9 | 86.79.4 | 45.94.7 | 29.67.4 | 81.32.9 | |
| SCRUB [28] | 98.80.2 | 53.39.4 | 86.80.7 | 60.016.3 | 31.50.8 | 42.83.5 | 89.80.4 | |
| MIU | 100.00.0 | 73.318.9 | 87.30.3 | 73.324.9 | 26.20.3 | 61.70.8 | 93.30.7 |
🔼 This table presents the results of a group-robust machine unlearning experiment on the Waterbirds dataset. The experiment focused on a scenario where the unlearning ratio is 0.1 (meaning only 10% of the data points from the dominant group in the forget set are unlearned). The table compares the performance of the proposed MIU method to three existing unlearning methods (L1-sparse, SalUn, and SCRUB). Performance is evaluated using various metrics, including retention accuracy (RA), unlearning accuracy (UA), test accuracy (TA), membership inference attack efficacy (MIA), equalized odds (EO), and the forget-set dominant group accuracy (GA). The Avg. Gap metric summarizes the overall discrepancy of each method with a retraining baseline that uses reweighting, indicating how well each method approximates this optimal result. The results are presented to illustrate MIU’s effectiveness compared to existing methods for robust unlearning in scenarios with non-uniformly distributed data.
read the caption
Table 8: Group-robust machine unlearning in Waterbirds [42] with 0.1 unlearning ratio. We build the forget set by sampling data points from a single group. The unlearning ratio is set to 0.1. We compare AyMIU against L1-sparse [23], SalUn [13], and SCRUB [28]. The Avg. Gap is computed against Retrain + reweight.
| Method | reweight | RA | UA | TA | MIA | EO | GA | Avg. Gap |
| Pretrain | 98.90.3 | 84.51.7 | 87.70.5 | 33.36.1 | 26.21.9 | 56.66.0 | - | |
| Retrain | 98.70.3 | 52.48.9 | 86.50.2 | 54.89.4 | 30.40.5 | 49.41.6 | - | |
| Retrain | 99.00.1 | 59.511.8 | 87.20.3 | 53.68.7 | 28.32.0 | 51.66.0 | - | |
| L1-sparse [23] | 99.00.1 | 59.58.9 | 85.60.4 | 44.011.8 | 32.21.8 | 48.87.4 | 94.40.3 | |
| SalUn [13] | 100.00.0 | 50.05.1 | 81.80.4 | 90.53.4 | 38.71.2 | 39.33.3 | 87.43.5 | |
| SCRUB [28] | 98.80.2 | 60.77.7 | 86.90.6 | 45.28.9 | 31.91.8 | 41.71.7 | 93.91.4 | |
| MIU | 100.00.0 | 53.67.7 | 86.11.0 | 58.38.9 | 28.31.7 | 53.82.6 | 95.30.7 | |
| L1-sparse [23] | 98.70.1 | 64.35.8 | 85.01.2 | 46.412.7 | 30.61.4 | 53.74.3 | 94.71.1 | |
| SalUn [13] | 100.00.0 | 47.64.5 | 81.11.9 | 91.77.3 | 39.02.2 | 39.01.6 | 85.84.2 | |
| SCRUB [28] | 98.90.2 | 66.71.7 | 87.00.5 | 44.08.9 | 30.91.3 | 44.33.1 | 94.51.3 | |
| MIU | 99.90.1 | 54.814.7 | 85.80.7 | 59.512.1 | 28.32.9 | 53.73.8 | 96.91.6 |
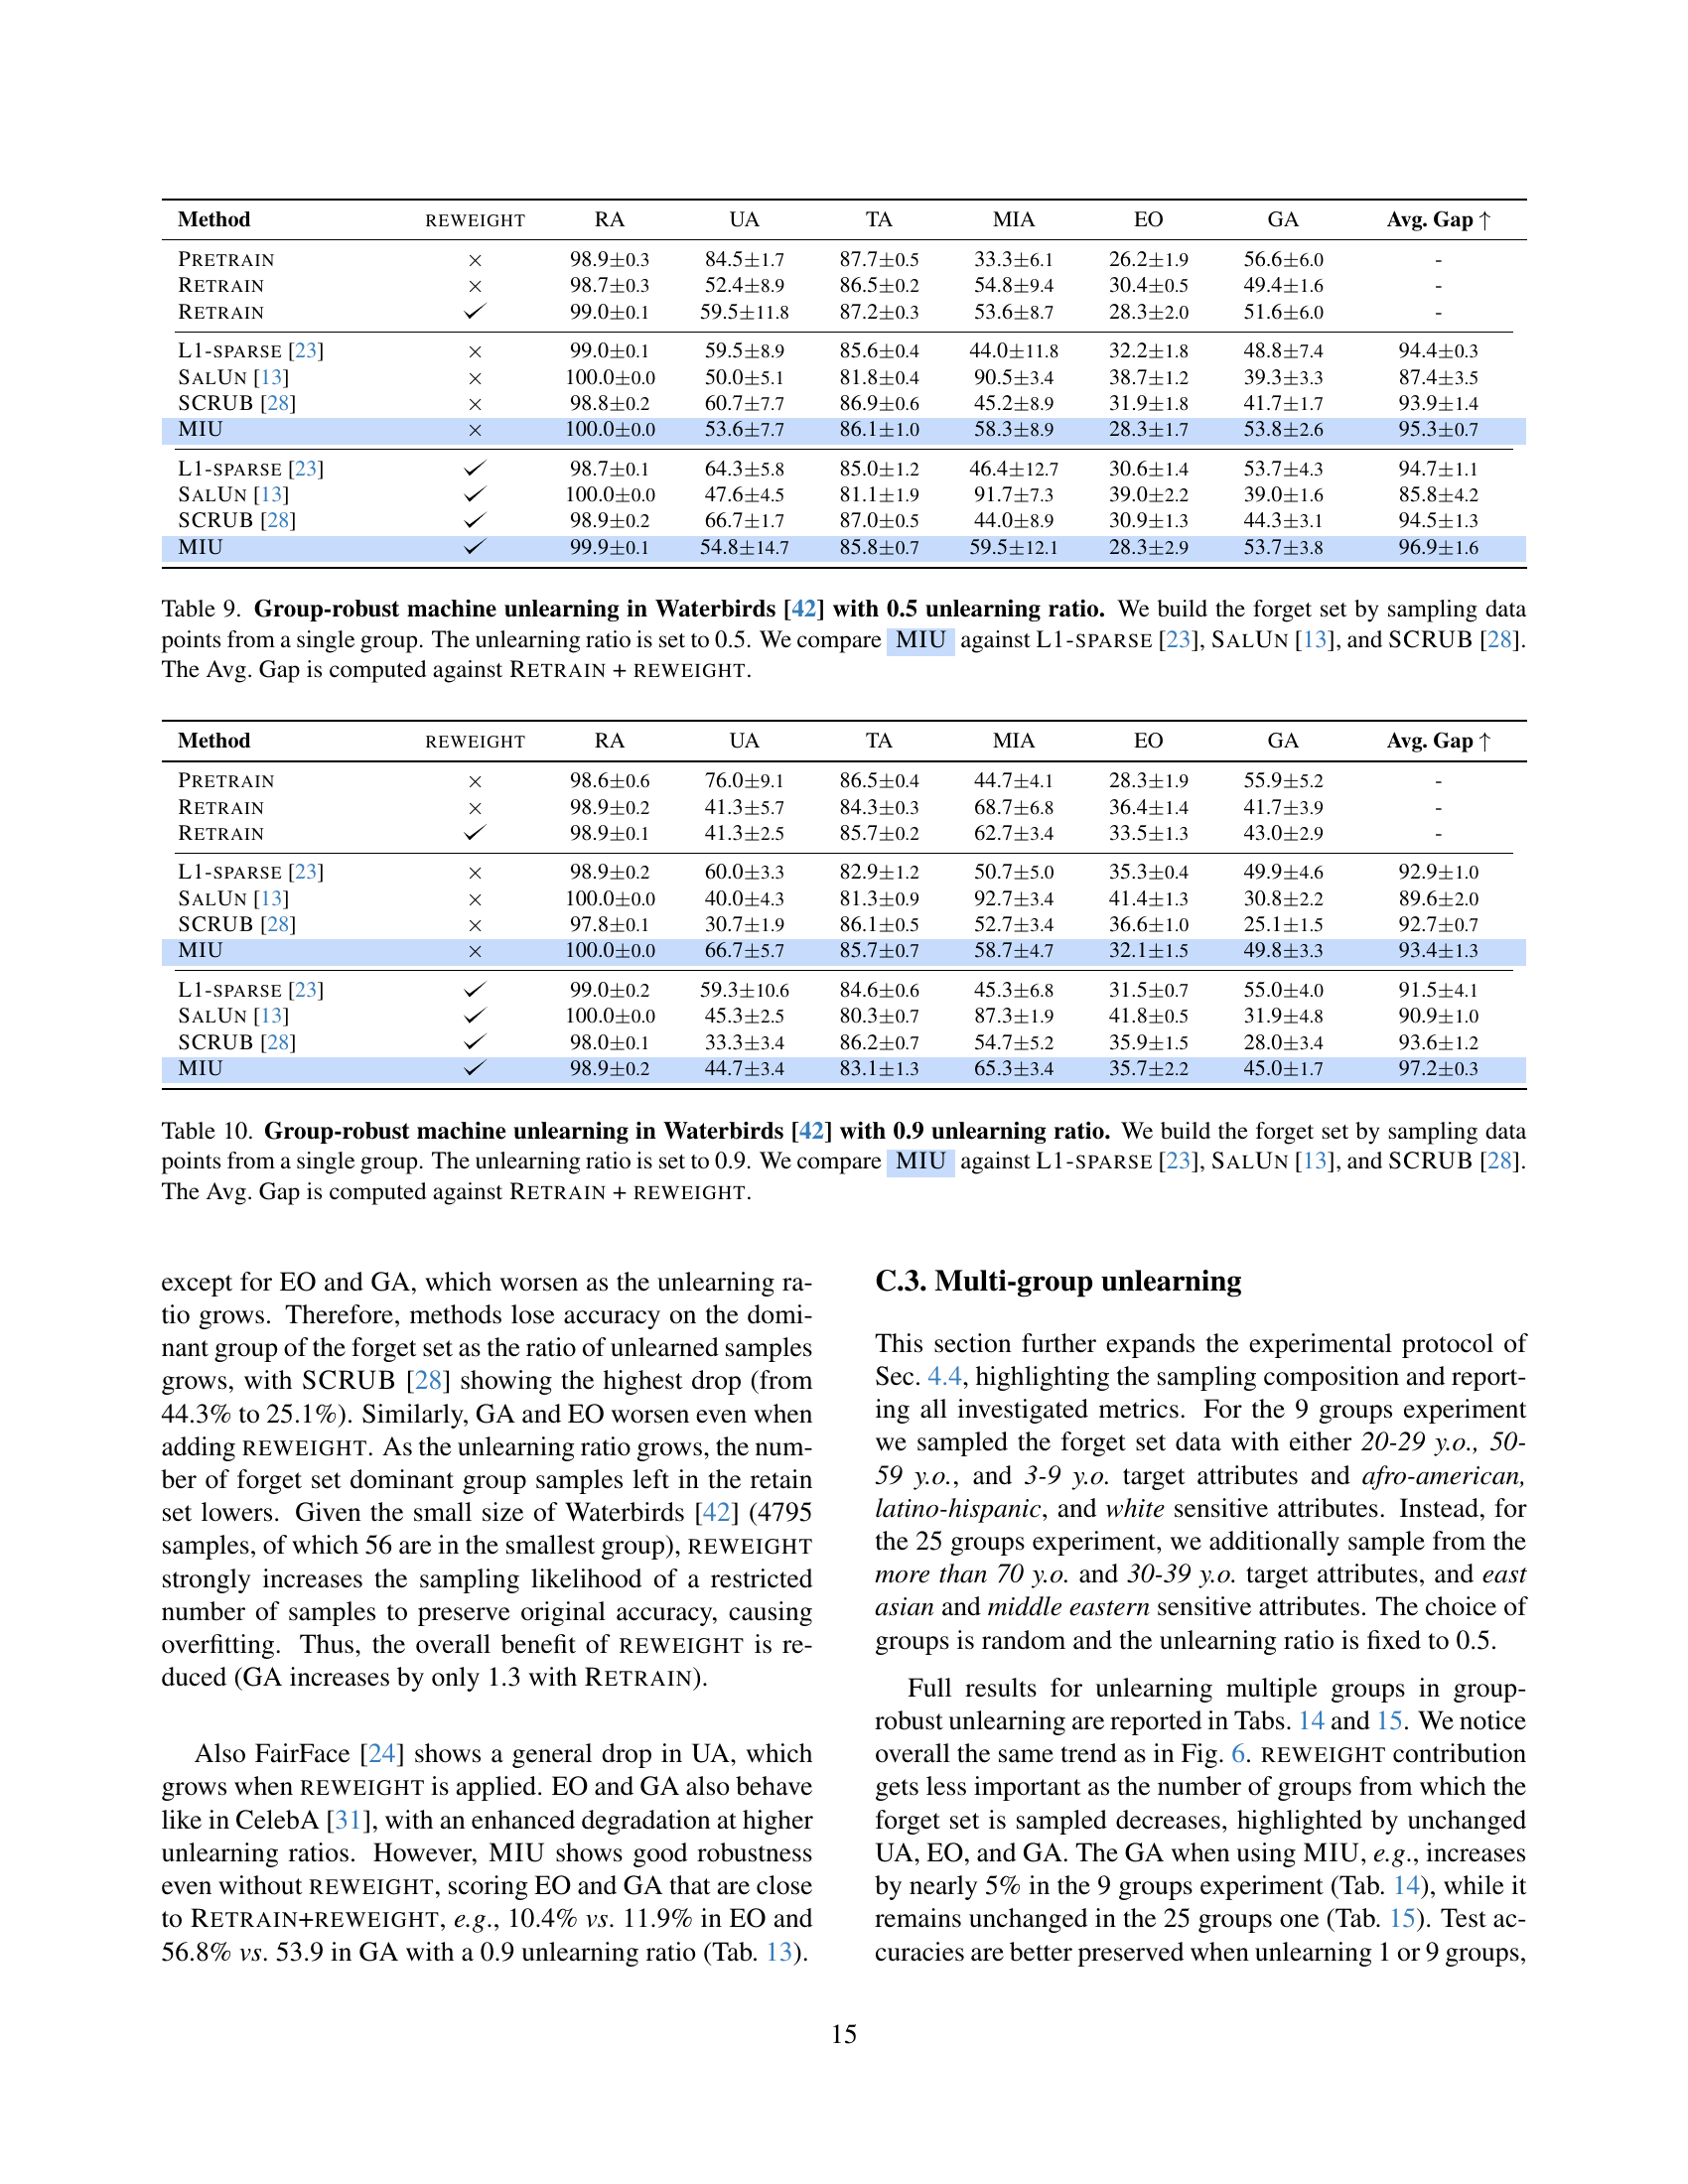
🔼 This table presents the results of a group-robust machine unlearning experiment on the Waterbirds dataset. The experiment involves removing a specific portion (0.5 unlearning ratio) of data points from a single group within the dataset, simulating a non-uniformly distributed forget set. Multiple methods, including MIU, L1-sparse, SalUn, and SCRUB, are compared in terms of their ability to successfully unlearn the targeted data while maintaining overall model accuracy and group-level accuracy (especially for the affected group). The performance of each method is assessed using various metrics, including retain accuracy (RA), forget accuracy (UA), test accuracy (TA), membership inference attack efficacy (MIA), equalized odds (EO), and the accuracy of the dominant group in the forget set (GA). The average gap (Avg. Gap) metric represents the average difference between a method’s performance and the performance of a retrained model (using the retain set and a reweighting strategy), serving as a baseline for ideal unlearning. The Avg. Gap is calculated relative to the Retrain + Reweight method to ensure a fair comparison.
read the caption
Table 9: Group-robust machine unlearning in Waterbirds [42] with 0.5 unlearning ratio. We build the forget set by sampling data points from a single group. The unlearning ratio is set to 0.5. We compare AyMIU against L1-sparse [23], SalUn [13], and SCRUB [28]. The Avg. Gap is computed against Retrain + reweight.
| Method | reweight | RA | UA | TA | MIA | EO | GA | Avg. Gap |
| Pretrain | 98.60.6 | 76.09.1 | 86.50.4 | 44.74.1 | 28.31.9 | 55.95.2 | - | |
| Retrain | 98.90.2 | 41.35.7 | 84.30.3 | 68.76.8 | 36.41.4 | 41.73.9 | - | |
| Retrain | 98.90.1 | 41.32.5 | 85.70.2 | 62.73.4 | 33.51.3 | 43.02.9 | - | |
| L1-sparse [23] | 98.90.2 | 60.03.3 | 82.91.2 | 50.75.0 | 35.30.4 | 49.94.6 | 92.91.0 | |
| SalUn [13] | 100.00.0 | 40.04.3 | 81.30.9 | 92.73.4 | 41.41.3 | 30.82.2 | 89.62.0 | |
| SCRUB [28] | 97.80.1 | 30.71.9 | 86.10.5 | 52.73.4 | 36.61.0 | 25.11.5 | 92.70.7 | |
| MIU | 100.00.0 | 66.75.7 | 85.70.7 | 58.74.7 | 32.11.5 | 49.83.3 | 93.41.3 | |
| L1-sparse [23] | 99.00.2 | 59.310.6 | 84.60.6 | 45.36.8 | 31.50.7 | 55.04.0 | 91.54.1 | |
| SalUn [13] | 100.00.0 | 45.32.5 | 80.30.7 | 87.31.9 | 41.80.5 | 31.94.8 | 90.91.0 | |
| SCRUB [28] | 98.00.1 | 33.33.4 | 86.20.7 | 54.75.2 | 35.91.5 | 28.03.4 | 93.61.2 | |
| MIU | 98.90.2 | 44.73.4 | 83.11.3 | 65.33.4 | 35.72.2 | 45.01.7 | 97.20.3 |
🔼 This table presents the results of a group-robust machine unlearning experiment on the Waterbirds dataset, where 90% of data points from a single group were removed. The experiment compares the performance of MIU against three other state-of-the-art machine unlearning techniques (L1-sparse, SalUn, and SCRUB). The performance metrics used include retain accuracy (RA), forget accuracy (UA), test accuracy (TA), membership inference attack (MIA), equalized odds (EO), dominant group accuracy in the forget set (GA), and the average gap (Avg. Gap). The Avg. Gap is calculated relative to the performance of a model retrained after reweighting the data samples.
read the caption
Table 10: Group-robust machine unlearning in Waterbirds [42] with 0.9 unlearning ratio. We build the forget set by sampling data points from a single group. The unlearning ratio is set to 0.9. We compare AyMIU against L1-sparse [23], SalUn [13], and SCRUB [28]. The Avg. Gap is computed against Retrain + reweight.
| Method | reweight | RA | UA | TA | MIA | EO | GA | Avg. Gap |
| Pretrain | 66.20.7 | 79.22.5 | 57.20.1 | 0.70.2 | 5.80.2 | 71.62.1 | - | |
| Retrain | 67.30.1 | 71.70.8 | 57.00.4 | 1.00.8 | 5.41.1 | 69.02.8 | - | |
| Retrain | 66.80.1 | 72.01.7 | 56.80.4 | 0.90.5 | 4.30.6 | 71.10.6 | - | |
| L1-sparse [23] | 63.70.3 | 78.93.5 | 56.10.8 | 0.00.0 | 5.52.6 | 69.72.2 | 97.30.7 | |
| SalUn [13] | 65.90.8 | 73.93.9 | 55.11.1 | 0.50.0 | 2.91.1 | 69.87.0 | 97.80.9 | |
| SCRUB [28] | 68.40.5 | 78.70.8 | 57.50.3 | 0.20.2 | 5.70.2 | 70.41.5 | 97.90.5 | |
| MIU | 66.90.5 | 81.30.2 | 57.30.2 | 0.20.2 | 5.30.6 | 70.40.5 | 97.80.5 | |
| L1-sparse [23] | 64.00.3 | 72.70.7 | 56.40.6 | 0.20.2 | 5.31.2 | 69.10.7 | 98.60.3 | |
| SalUn [13] | 66.20.4 | 80.11.5 | 55.30.4 | 0.20.2 | 4.70.9 | 73.34.6 | 97.10.3 | |
| SCRUB [28] | 68.40.5 | 79.21.0 | 57.50.4 | 0.20.2 | 5.61.1 | 70.91.7 | 97.80.6 | |
| MIU | 67.40.5 | 82.31.3 | 57.60.3 | 0.00.0 | 6.00.7 | 71.20.5 | 97.60.8 |
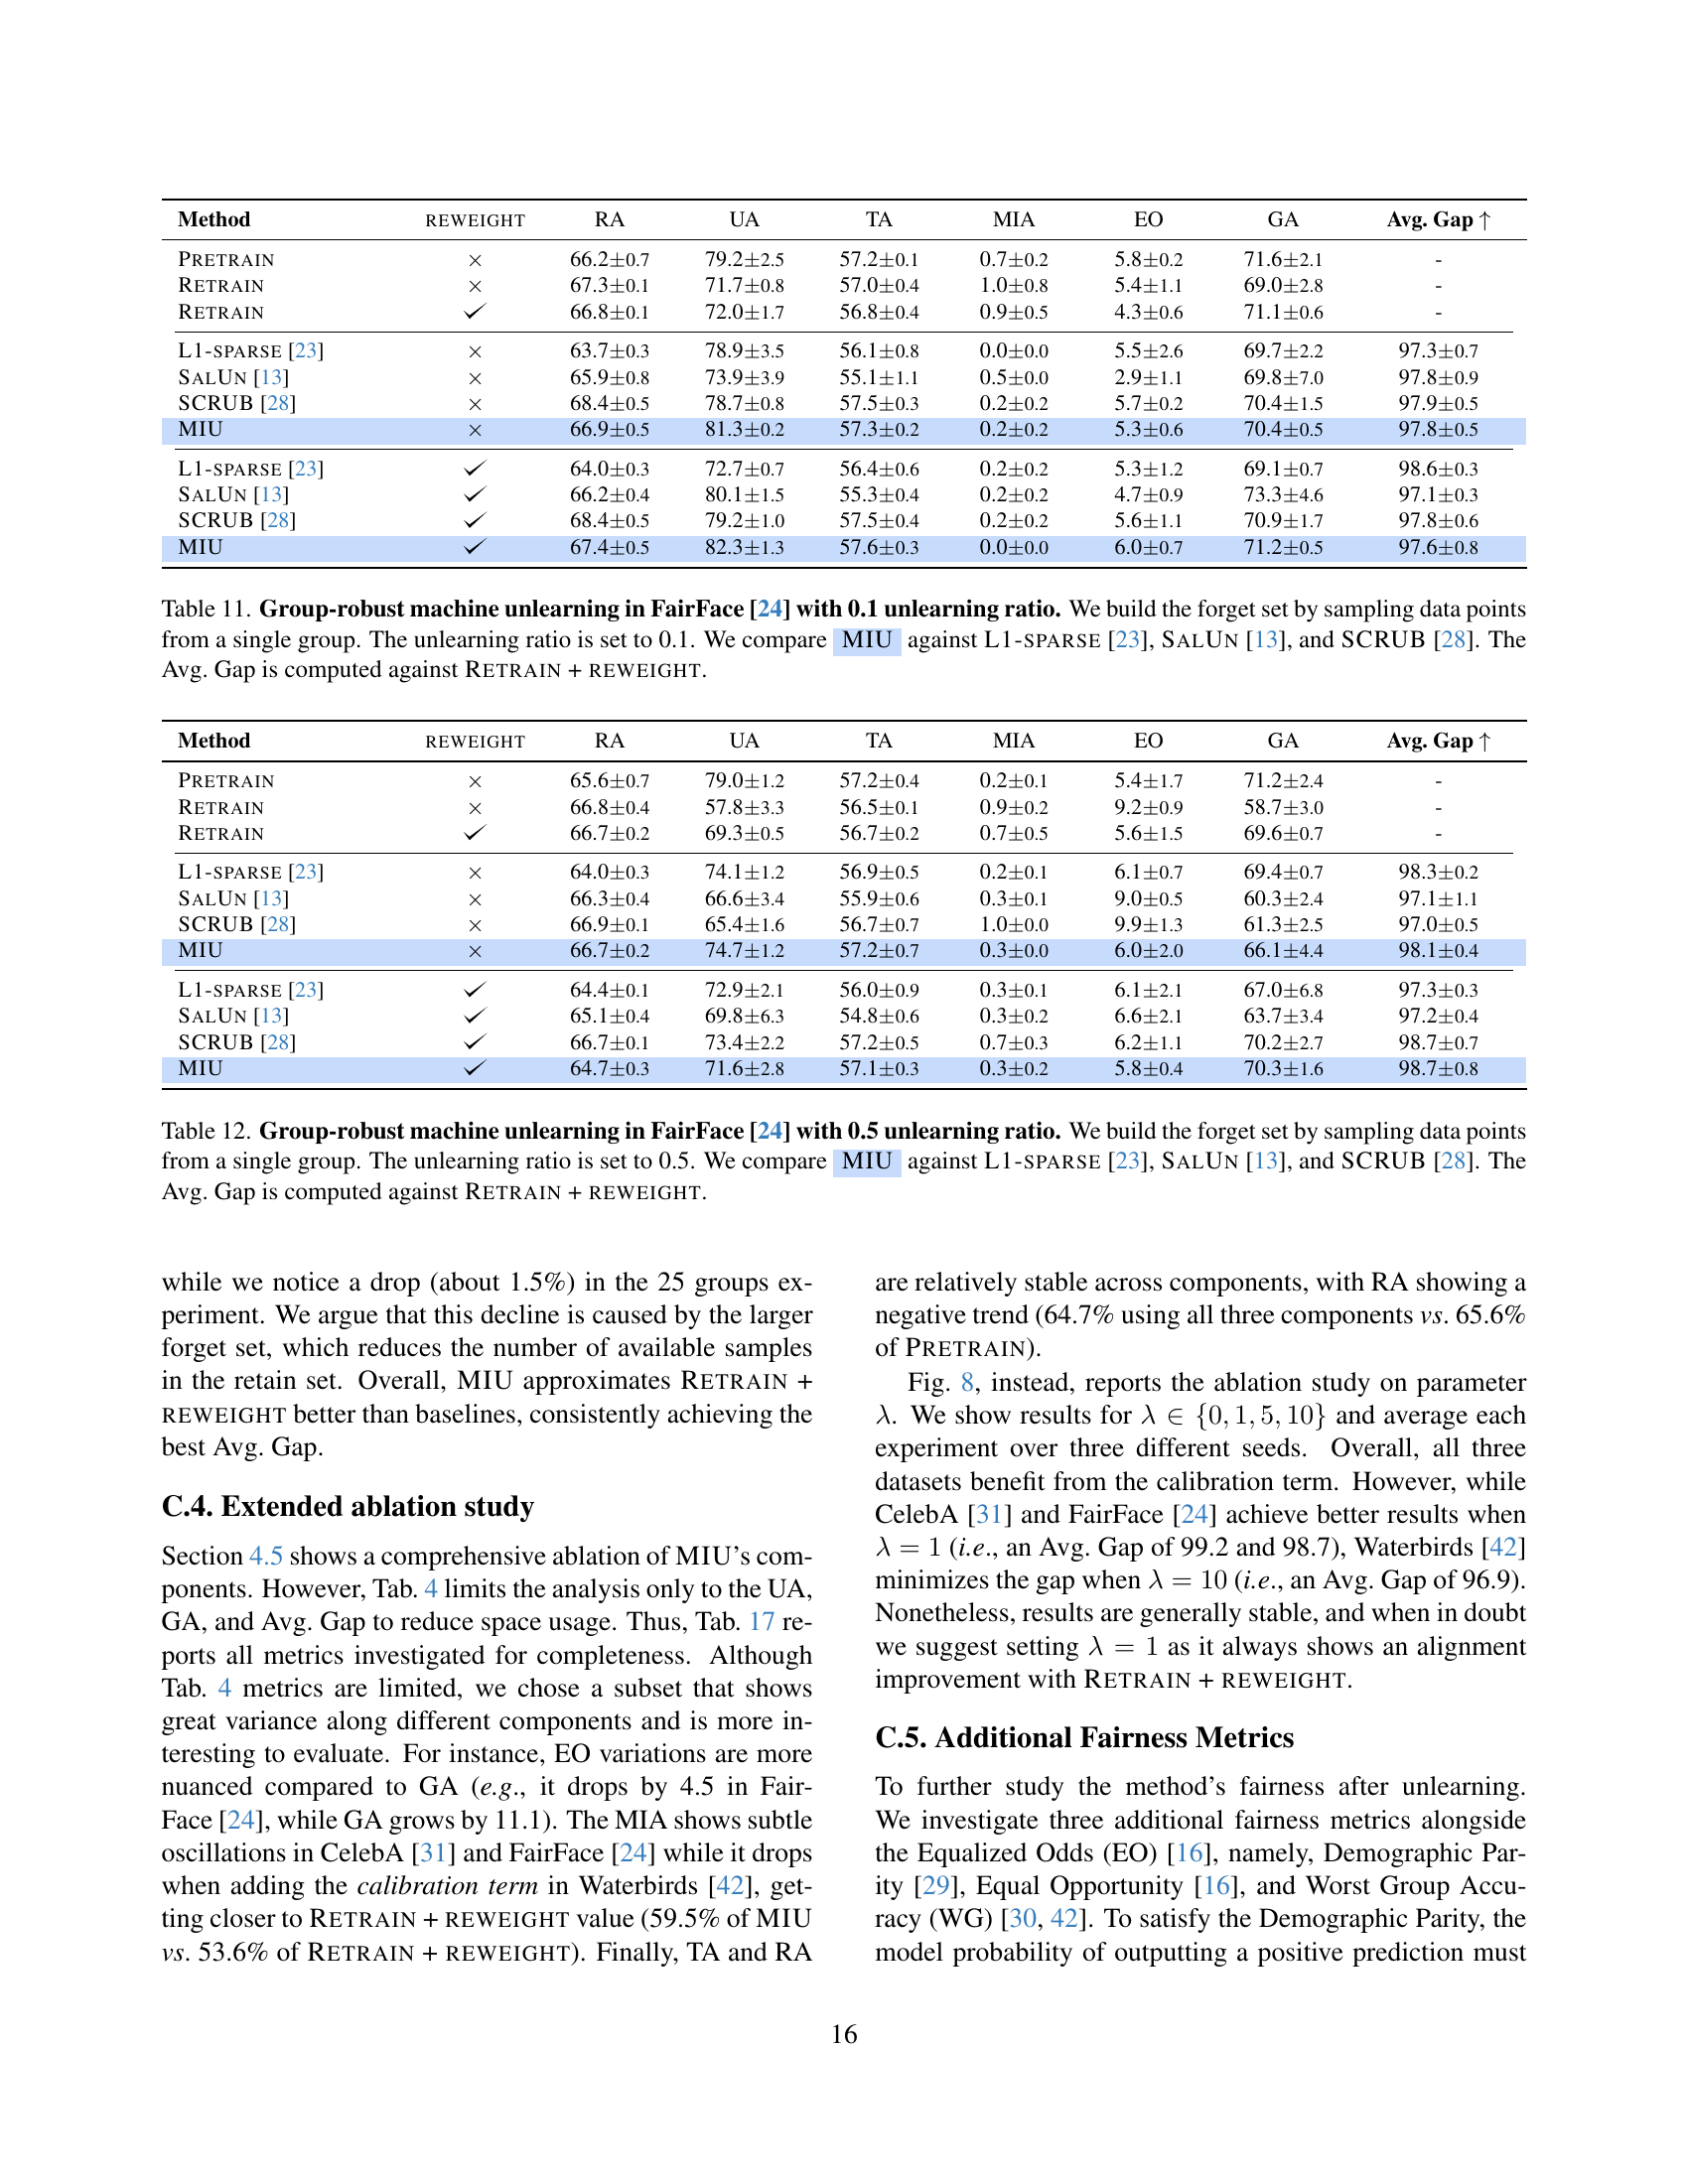
🔼 This table presents the results of a group-robust machine unlearning experiment on the FairFace dataset [24], using an unlearning ratio of 0.1. The experiment focuses on scenarios where the data to be unlearned (forget set) is not uniformly distributed across all groups, but rather concentrated in a single dominant group. The table compares the performance of the proposed MIU algorithm with three existing machine unlearning methods: L1-sparse [23], SalUn [13], and SCRUB [28]. Performance is evaluated across several metrics, including retain accuracy (RA), forget accuracy (UA), test accuracy (TA), membership inference attack (MIA) effectiveness, equalized odds (EO), and accuracy of the dominant group in the forget set (GA). The Avg. Gap metric summarizes the overall performance difference compared to a baseline established by retraining the model with the reweighted retain set (Retrain + Reweight).
read the caption
Table 11: Group-robust machine unlearning in FairFace [24] with 0.1 unlearning ratio. We build the forget set by sampling data points from a single group. The unlearning ratio is set to 0.1. We compare AyMIU against L1-sparse [23], SalUn [13], and SCRUB [28]. The Avg. Gap is computed against Retrain + reweight.
| Method | reweight | RA | UA | TA | MIA | EO | GA | Avg. Gap |
| Pretrain | 65.60.7 | 79.01.2 | 57.20.4 | 0.20.1 | 5.41.7 | 71.22.4 | - | |
| Retrain | 66.80.4 | 57.83.3 | 56.50.1 | 0.90.2 | 9.20.9 | 58.73.0 | - | |
| Retrain | 66.70.2 | 69.30.5 | 56.70.2 | 0.70.5 | 5.61.5 | 69.60.7 | - | |
| L1-sparse [23] | 64.00.3 | 74.11.2 | 56.90.5 | 0.20.1 | 6.10.7 | 69.40.7 | 98.30.2 | |
| SalUn [13] | 66.30.4 | 66.63.4 | 55.90.6 | 0.30.1 | 9.00.5 | 60.32.4 | 97.11.1 | |
| SCRUB [28] | 66.90.1 | 65.41.6 | 56.70.7 | 1.00.0 | 9.91.3 | 61.32.5 | 97.00.5 | |
| MIU | 66.70.2 | 74.71.2 | 57.20.7 | 0.30.0 | 6.02.0 | 66.14.4 | 98.10.4 | |
| L1-sparse [23] | 64.40.1 | 72.92.1 | 56.00.9 | 0.30.1 | 6.12.1 | 67.06.8 | 97.30.3 | |
| SalUn [13] | 65.10.4 | 69.86.3 | 54.80.6 | 0.30.2 | 6.62.1 | 63.73.4 | 97.20.4 | |
| SCRUB [28] | 66.70.1 | 73.42.2 | 57.20.5 | 0.70.3 | 6.21.1 | 70.22.7 | 98.70.7 | |
| MIU | 64.70.3 | 71.62.8 | 57.10.3 | 0.30.2 | 5.80.4 | 70.31.6 | 98.70.8 |
🔼 Table 12 presents the results of a group-robust machine unlearning experiment on the FairFace dataset. The experiment involved removing 50% of the data points from a single group within the training dataset (forget set). The table compares the performance of MIU (Mutual Information-Aware Machine Unlearning) against three other established machine unlearning methods: L1-sparse, SalUn, and SCRUB. Performance is evaluated across multiple metrics, including retain accuracy, forget accuracy, test accuracy, membership inference attack efficacy, equalized odds, dominant group accuracy within the forget set and an average gap calculated from the differences between the algorithms and a retraining baseline that uses a reweighting strategy. The table shows that MIU provides improvements in several metrics, particularly in maintaining the accuracy of the dominant group within the forget set.
read the caption
Table 12: Group-robust machine unlearning in FairFace [24] with 0.5 unlearning ratio. We build the forget set by sampling data points from a single group. The unlearning ratio is set to 0.5. We compare AyMIU against L1-sparse [23], SalUn [13], and SCRUB [28]. The Avg. Gap is computed against Retrain + reweight.
| Method | reweight | RA | UA | TA | MIA | EO | GA | Avg. Gap |
| Pretrain | 66.00.0 | 77.52.1 | 56.60.4 | 0.20.0 | 5.51.1 | 69.02.8 | - | |
| Retrain | 67.30.6 | 38.51.8 | 56.00.4 | 2.70.3 | 23.11.5 | 37.12.1 | - | |
| Retrain | 67.10.4 | 53.61.2 | 56.60.4 | 1.80.1 | 11.91.0 | 53.90.7 | - | |
| L1-sparse [23] | 64.50.2 | 57.12.1 | 55.20.6 | 0.40.1 | 13.00.7 | 51.01.9 | 97.70.3 | |
| SalUn [13] | 65.70.5 | 46.56.2 | 53.90.1 | 0.50.1 | 15.31.0 | 42.84.9 | 95.21.8 | |
| SCRUB [28] | 60.21.0 | 52.74.4 | 53.30.5 | 2.40.7 | 15.61.4 | 48.74.9 | 95.70.6 | |
| MIU | 68.20.3 | 64.42.5 | 56.50.5 | 0.50.1 | 10.40.7 | 56.82.6 | 97.01.0 | |
| L1-sparse [23] | 64.00.4 | 74.53.0 | 55.90.4 | 0.30.2 | 5.60.6 | 69.84.6 | 91.91.5 | |
| SalUn [13] | 65.50.5 | 66.13.7 | 55.30.2 | 0.50.3 | 7.21.2 | 62.84.9 | 94.91.7 | |
| SCRUB [28] | 61.21.1 | 65.53.5 | 54.50.3 | 1.30.1 | 9.50.9 | 64.42.7 | 94.51.6 | |
| MIU | 64.70.2 | 67.11.4 | 56.70.2 | 0.50.1 | 8.80.2 | 63.51.6 | 94.90.6 |
🔼 This table presents the results of a group-robust machine unlearning experiment conducted on the FairFace dataset [24] using an unlearning ratio of 0.9. The experiment focused on removing the influence of a single, dominant group from the training data. The table compares the performance of MIU (Mutual Information-Aware Machine Unlearning) against three other baseline unlearning methods: L1-sparse [23], SalUn [13], and SCRUB [28]. Performance is measured across multiple metrics including retain accuracy (RA), unlearning accuracy (UA), test accuracy (TA), membership inference attack efficacy (MIA), equalized odds (EO), dominant group accuracy (GA), and the average gap (Avg. Gap) compared to a retrained model using a reweighting technique. The Avg. Gap provides a summary of the overall performance differences across all the metrics compared to the reweighted retraining baseline.
read the caption
Table 13: Group-robust machine unlearning in FairFace [24] with 0.9 unlearning ratio. We build the forget set by sampling data points from a single group. The unlearning ratio is set to 0.9. We compare AyMIU against L1-sparse [23], SalUn [13], and SCRUB [28]. The Avg. Gap is computed against Retrain + reweight.
| Method | reweight | RA | UA | TA | MIA | EO | GA | Avg. Gap |
| Pretrain | 64.60.5 | 81.50.5 | 57.40.3 | 0.40.0 | 1.10.1 | 72.50.7 | - | |
| Retrain | 66.50.5 | 60.10.9 | 55.40.4 | 1.10.1 | 5.60.4 | 60.41.7 | - | |
| Retrain | 64.41.1 | 72.12.2 | 56.30.3 | 0.50.0 | 2.00.6 | 71.82.7 | - | |
| L1-sparse [23] | 63.50.6 | 69.93.9 | 55.30.1 | 0.50.0 | 2.61.0 | 64.44.4 | 97.71.1 | |
| SalUn [13] | 64.30.5 | 64.61.2 | 54.00.1 | 0.20.1 | 3.60.3 | 59.71.5 | 96.00.6 | |
| SCRUB [28] | 67.20.4 | 74.30.7 | 56.90.2 | 0.30.1 | 1.80.7 | 65.60.6 | 97.70.3 | |
| MIU | 66.30.4 | 74.20.4 | 56.80.5 | 0.30.1 | 1.70.4 | 65.70.6 | 97.90.4 | |
| L1-sparse [23] | 63.70.1 | 75.20.6 | 56.30.1 | 0.20.1 | 1.30.3 | 69.61.2 | 98.60.2 | |
| SalUn [13] | 63.70.8 | 74.41.5 | 55.50.4 | 0.40.0 | 2.30.3 | 69.01.6 | 98.40.2 | |
| SCRUB [28] | 66.70.4 | 80.50.1 | 57.40.5 | 0.40.1 | 1.70.3 | 71.30.4 | 97.40.3 | |
| MIU | 63.40.4 | 73.20.3 | 56.70.3 | 0.40.1 | 1.50.5 | 70.31.0 | 99.00.1 |
🔼 This table presents the results of a group-robust machine unlearning experiment on the FairFace dataset. The experiment involved sampling data points for the forget set from 9 different groups, with an unlearning ratio of 0.5. The table compares the performance of the proposed MIU method with three existing approximate machine unlearning algorithms (L1-SPARSE, SalUn, and SCRUB). The performance is evaluated across several metrics, including group accuracy, overall accuracy, and the gap between the achieved performance and the performance of an ideal model (Retrain + Reweight). The Avg. Gap metric helps to quantify how well each algorithm achieves the goal of effective unlearning while preserving the model’s robustness.
read the caption
Table 14: Group-robust machine unlearning in FairFace [24] by sampling from 9 groups. We build the forget set by sampling data points from 9 groups. The unlearning ratio is set to 0.5. We compare AyMIU against L1-sparse [23], SalUn [13], and SCRUB [28]. The Avg. Gap is computed against Retrain + reweight.
| Method | reweight | RA | UA | TA | MIA | EO | GA | Avg. Gap |
| Pretrain | 65.10.3 | 70.60.5 | 56.90.3 | 0.30.1 | 1.60.6 | 62.21.4 | - | |
| Retrain | 66.51.0 | 55.52.1 | 54.80.7 | 0.80.1 | 1.90.3 | 56.02.1 | - | |
| Retrain | 66.10.6 | 60.50.7 | 55.50.4 | 0.70.1 | 2.30.3 | 60.50.5 | - | |
| L1-sparse [23] | 65.50.8 | 61.80.3 | 55.50.5 | 0.50.1 | 1.60.8 | 57.00.9 | 98.70.2 | |
| SalUn [13] | 64.50.5 | 60.03.8 | 55.21.0 | 0.50.1 | 1.10.4 | 57.03.8 | 98.00.7 | |
| SCRUB [28] | 66.70.6 | 62.41.0 | 55.40.3 | 0.30.1 | 1.70.9 | 55.20.6 | 98.40.2 | |
| MIU | 66.80.2 | 64.80.5 | 56.40.5 | 0.30.1 | 1.70.7 | 57.51.1 | 98.30.2 | |
| L1-sparse [23] | 64.30.7 | 66.70.4 | 55.80.4 | 0.40.1 | 2.10.8 | 60.81.0 | 98.30.3 | |
| SalUn [13] | 62.51.6 | 64.62.0 | 54.60.8 | 0.30.1 | 2.20.4 | 60.12.0 | 98.00.3 | |
| SCRUB [28] | 65.30.3 | 71.40.6 | 57.00.3 | 0.20.0 | 1.90.9 | 63.70.7 | 97.10.1 | |
| MIU | 66.21.6 | 63.01.9 | 54.30.6 | 0.90.3 | 3.50.9 | 57.63.3 | 98.30.1 |
🔼 This table presents the results of a group-robust machine unlearning experiment on the FairFace dataset. The experiment involved removing data points from 25 different groups within the training data (the ‘forget set’) while attempting to preserve the model’s accuracy on the remaining data. The table compares the performance of MIU (Mutual Information-Aware Machine Unlearning) against three other machine unlearning methods: L1-sparse, SalUn, and SCRUB. Performance is evaluated across multiple metrics, including retain accuracy, forget accuracy, test accuracy, membership inference attack efficacy, equalized odds, dominant group accuracy of the forget set and an aggregate gap score comparing the methods to a retraining-based gold standard. The ‘Avg. Gap’ is a composite metric summarizing the differences between each method and a baseline model trained only on the retained data, while applying a reweighting strategy to improve group robustness.
read the caption
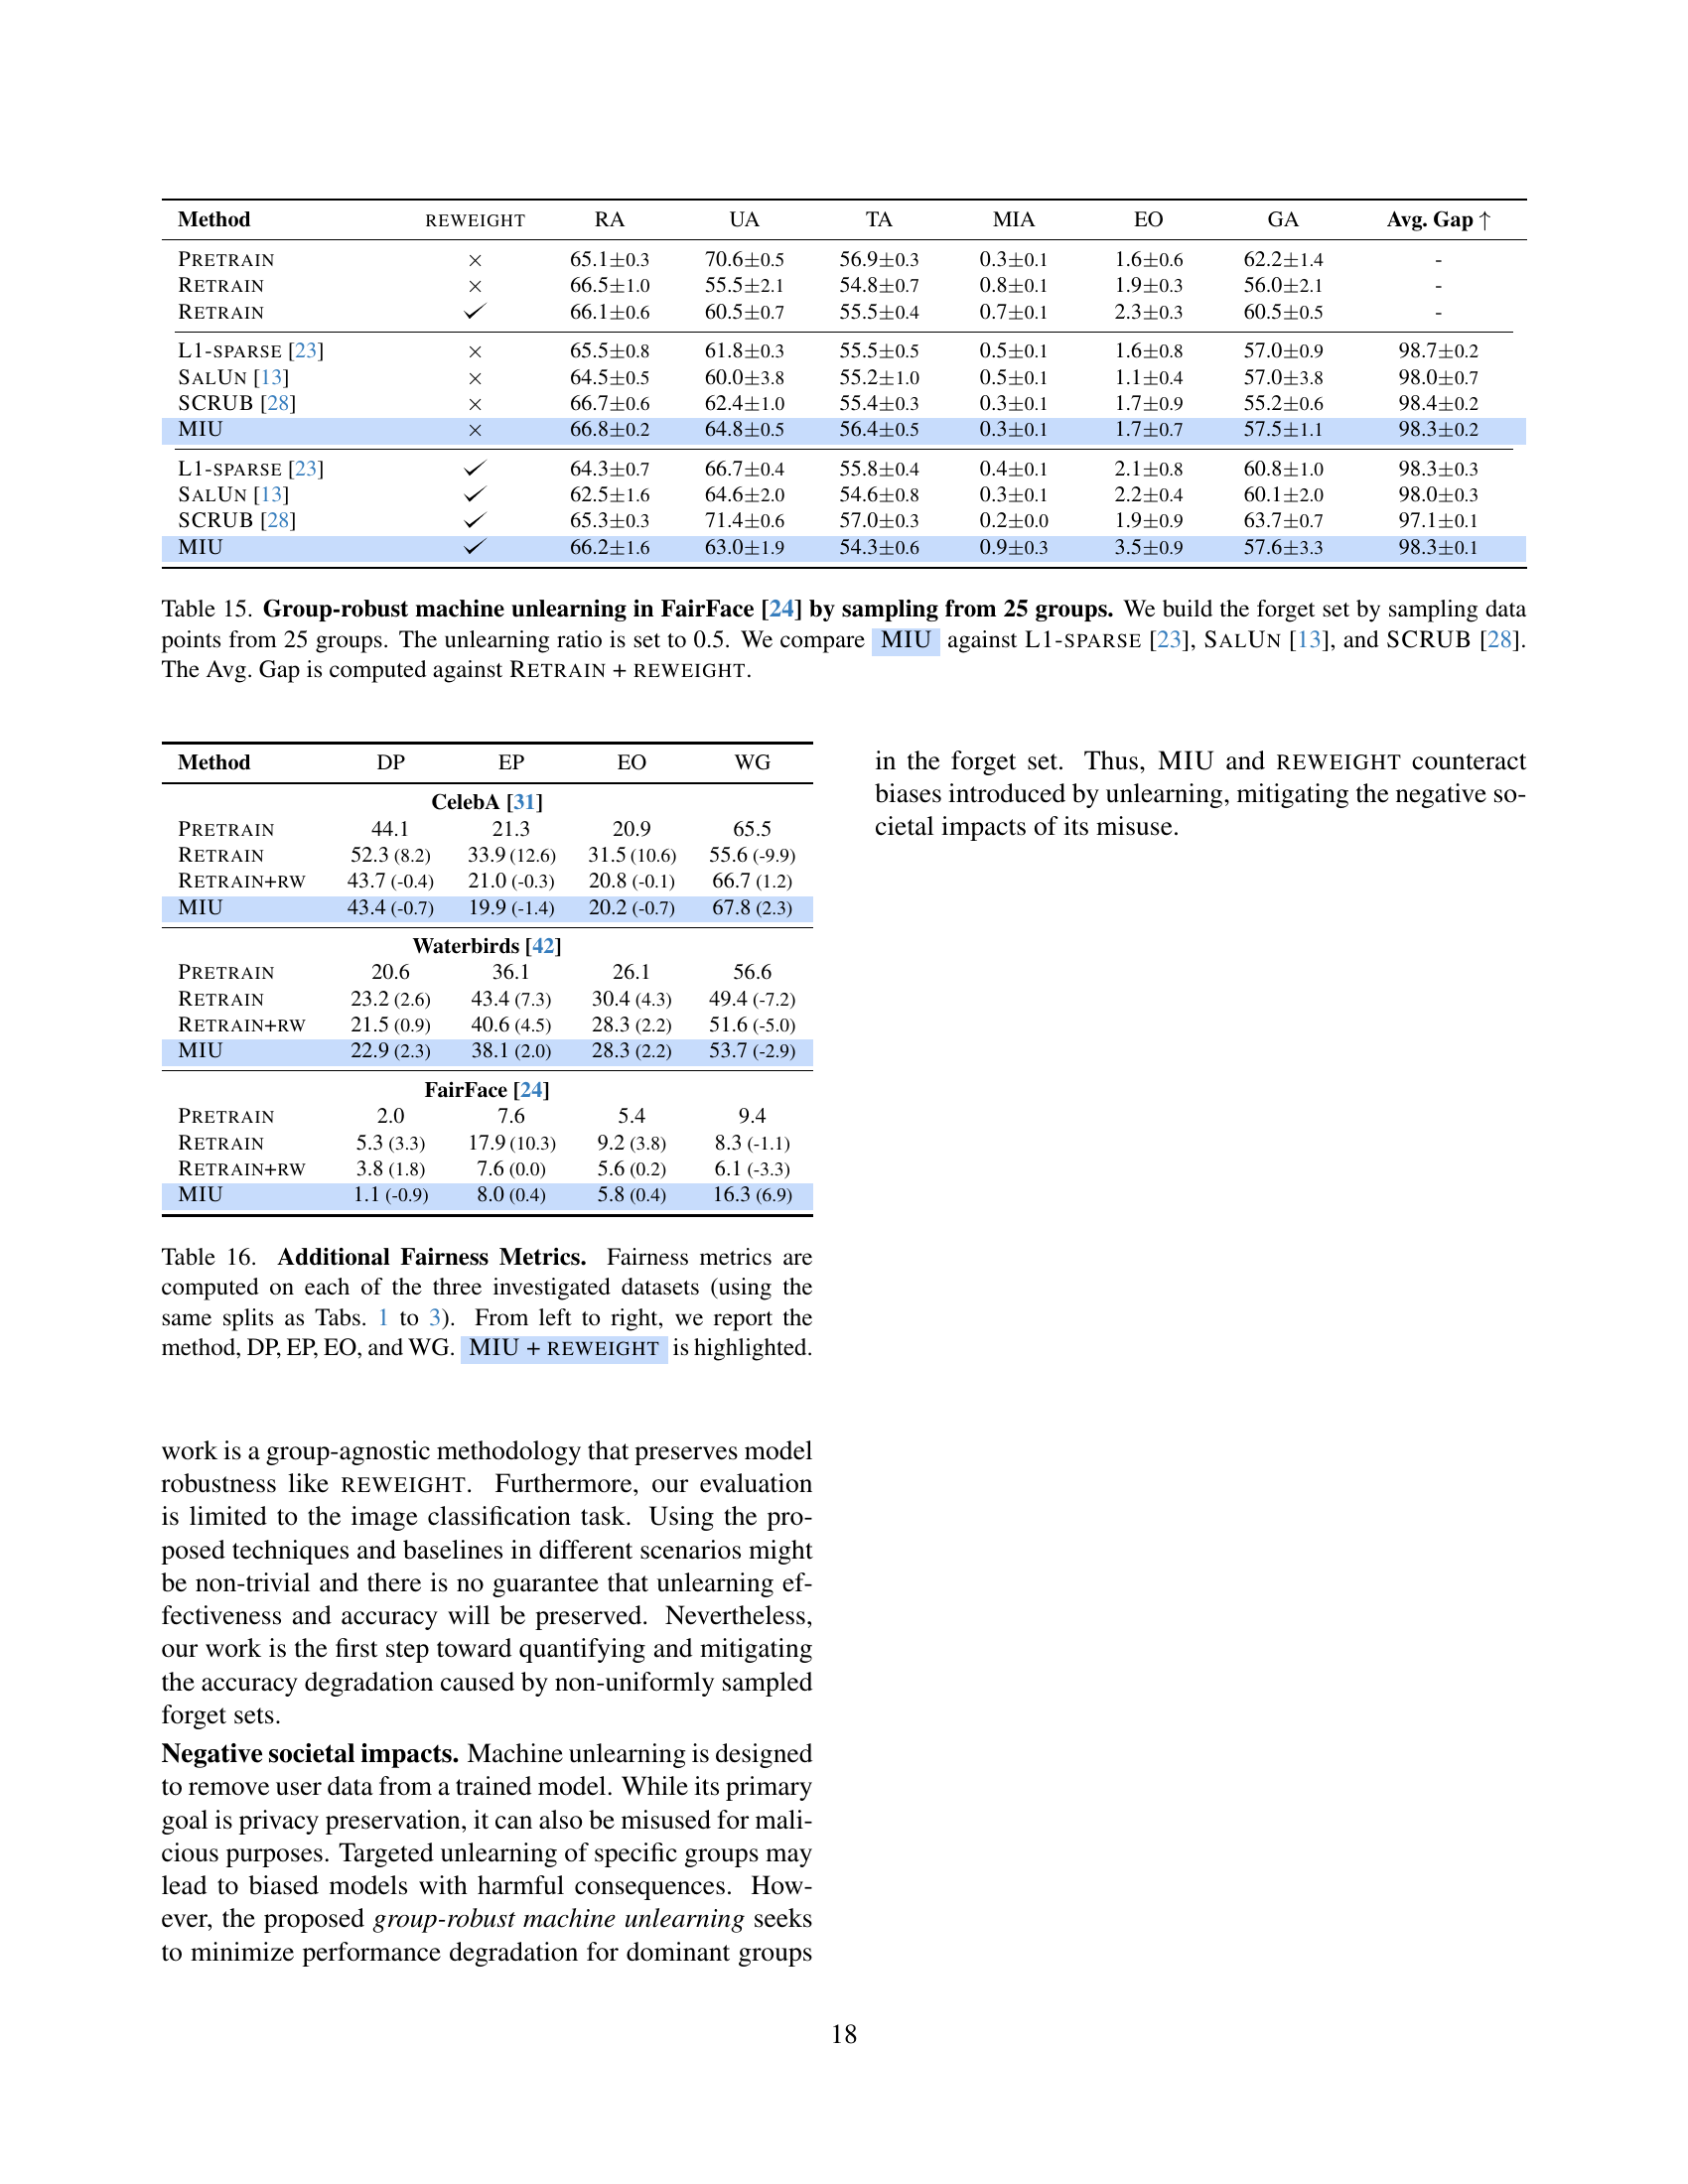
Table 15: Group-robust machine unlearning in FairFace [24] by sampling from 25 groups. We build the forget set by sampling data points from 25 groups. The unlearning ratio is set to 0.5. We compare AyMIU against L1-sparse [23], SalUn [13], and SCRUB [28]. The Avg. Gap is computed against Retrain + reweight.
| Method | DP | EP | EO | WG |
| CelebA [31] | ||||
| Pretrain | 44.1 | 21.3 | 20.9 | 65.5 |
| Retrain | 52.3 (8.2) | 33.9 (12.6) | 31.5 (10.6) | 55.6 (-9.9) |
| Retrain+rw | 43.7 (-0.4) | 21.0 (-0.3) | 20.8 (-0.1) | 66.7 (1.2) |
| MIU | 43.4 (-0.7) | 19.9 (-1.4) | 20.2 (-0.7) | 67.8 (2.3) |
| Waterbirds [42] | ||||
| Pretrain | 20.6 | 36.1 | 26.1 | 56.6 |
| Retrain | 23.2 (2.6) | 43.4 (7.3) | 30.4 (4.3) | 49.4 (-7.2) |
| Retrain+rw | 21.5 (0.9) | 40.6 (4.5) | 28.3 (2.2) | 51.6 (-5.0) |
| MIU | 22.9 (2.3) | 38.1 (2.0) | 28.3 (2.2) | 53.7 (-2.9) |
| FairFace [24] | ||||
| Pretrain | 2.0 | 7.6 | 5.4 | 9.4 |
| Retrain | 5.3 (3.3) | 17.9 (10.3) | 9.2 (3.8) | 8.3 (-1.1) |
| Retrain+rw | 3.8 (1.8) | 7.6 (0.0) | 5.6 (0.2) | 6.1 (-3.3) |
| MIU | 1.1 (-0.9) | 8.0 (0.4) | 5.8 (0.4) | 16.3 (6.9) |
🔼 This table presents a detailed fairness analysis of different machine unlearning methods across three datasets (CelebA, Waterbirds, and FairFace). It compares the performance of the methods against a gold standard (RETRAIN + REWEIGHT) using four fairness metrics: Demographic Parity (DP), Equal Opportunity (EP), Equalized Odds (EO), and Worst Group Accuracy (WG). Lower DP and EP values indicate better fairness, while higher WG indicates better robustness. The table shows the differences in these metrics between the baseline methods (PRETRAIN, RETRAIN, L1-SPARSE, SALUN, and SCRUB) and the proposed method (MIU), both with and without a reweighting strategy. This allows for a comprehensive assessment of the fairness implications of different unlearning techniques.
read the caption
Table 16: Additional Fairness Metrics. Fairness metrics are computed on each of the three investigated datasets (using the same splits as Tabs. 1, 2 and 3). From left to right, we report the method, DP, EP, EO, and WG. AyMIU + reweight is highlighted.
| Dataset | Eq. 5 | Eq. 3 | Eq. 4 | RW | RA | UA | TA | MIA | EO | GA | Avg. Gap |
|---|---|---|---|---|---|---|---|---|---|---|---|
| CelebA [31] | 85.10.0 | 53.60.7 | 82.60.1 | 0.20.0 | 28.60.1 | 54.01.0 | 94.10.6 | ||||
| 84.80.0 | 55.30.8 | 82.60.2 | 0.30.1 | 27.40.4 | 55.91.0 | 94.90.7 | |||||
| 63.17.1 | 41.734.2 | 62.17.0 | 0.00.0 | 10.45.4 | 42.334.1 | 78.98.8 | |||||
| 84.20.1 | 68.80.3 | 82.50.1 | 0.10.0 | 20.20.6 | 69.01.2 | 99.20.6 | |||||
| Waterbirds [42] | 100.00.0 | 47.67.3 | 85.00.6 | 73.83.4 | 32.30.8 | 51.10.6 | 92.54.6 | ||||
| 100.00.0 | 53.67.7 | 86.11.0 | 58.38.9 | 28.31.7 | 53.82.6 | 95.30.7 | |||||
| 93.03.3 | 16.79.4 | 80.32.9 | 64.312.7 | 35.87.8 | 16.88.9 | 81.95.5 | |||||
| 99.90.1 | 54.814.7 | 85.80.7 | 59.512.1 | 28.32.9 | 53.73.8 | 96.91.6 | |||||
| FairFace [24] | 65.20.1 | 63.11.6 | 56.90.3 | 0.30.0 | 10.30.8 | 59.21.9 | 96.10.8 | ||||
| 66.70.2 | 74.71.2 | 57.20.7 | 0.30.0 | 6.02.0 | 66.14.4 | 98.10.4 | |||||
| 59.13.1 | 87.16.8 | 54.51.8 | 0.00.0 | 3.10.5 | 81.16.2 | 93.03.1 | |||||
| 64.70.3 | 71.62.8 | 57.10.3 | 0.30.2 | 5.80.4 | 70.31.6 | 98.70.8 |
🔼 This table presents an ablation study of the MIU model, showing the impact of each component on the overall performance. The experiments were conducted on three datasets: CelebA, Waterbirds, and FairFace. For each dataset, several model configurations were tested, systematically removing or adding components like the retaining term, unlearning term, calibration term, and sample reweighting. The results are evaluated using multiple metrics to provide a comprehensive assessment of the impact of each MIU component.
read the caption
Table 17: MIU ablations. We compute MIU ablations on each of the three investigated datasets. From left to right, we report the investigated dataset, the retaining term, the unlearning term, the calibration term, and reweight. We measure performance using all metrics. The configuration that corresponds to AyMIU + reweight is highlighted.
Full paper#