TL;DR#
In the realm of image compression, Perceptual compression methods uses generative models to synthesize realistic details at lower bit-rates. Foundation models have shown potential in ultra-low bit-rate image compression but current methods still relies on proprietary models or suffer from quality deviations. This paper addresses the gap and quantify the existing analysis of the design in the research area.
The paper introduces PerCoV2, a novel and open ultra-low bit-rate perceptual image compression system built on Stable Diffusion 3. It enhances entropy coding efficiency by modeling the hyper-latent image distribution with implicit hierarchical masked image modeling. The method conducts a comprehensive comparison of autoregressive methods and demonstrates its benefits for compression and generation, achieving higher image fidelity and perceptual quality.
Key Takeaways#
Why does it matter?#
This research enhances ultra-low bit-rate image compression by leveraging Stable Diffusion 3 and implicit hierarchical masked image modeling. It offers improved fidelity and perceptual quality. Thus, it is opening new avenues for bandwidth- and storage-constrained applications and advancing the field of generative compression.
Visual Insights#

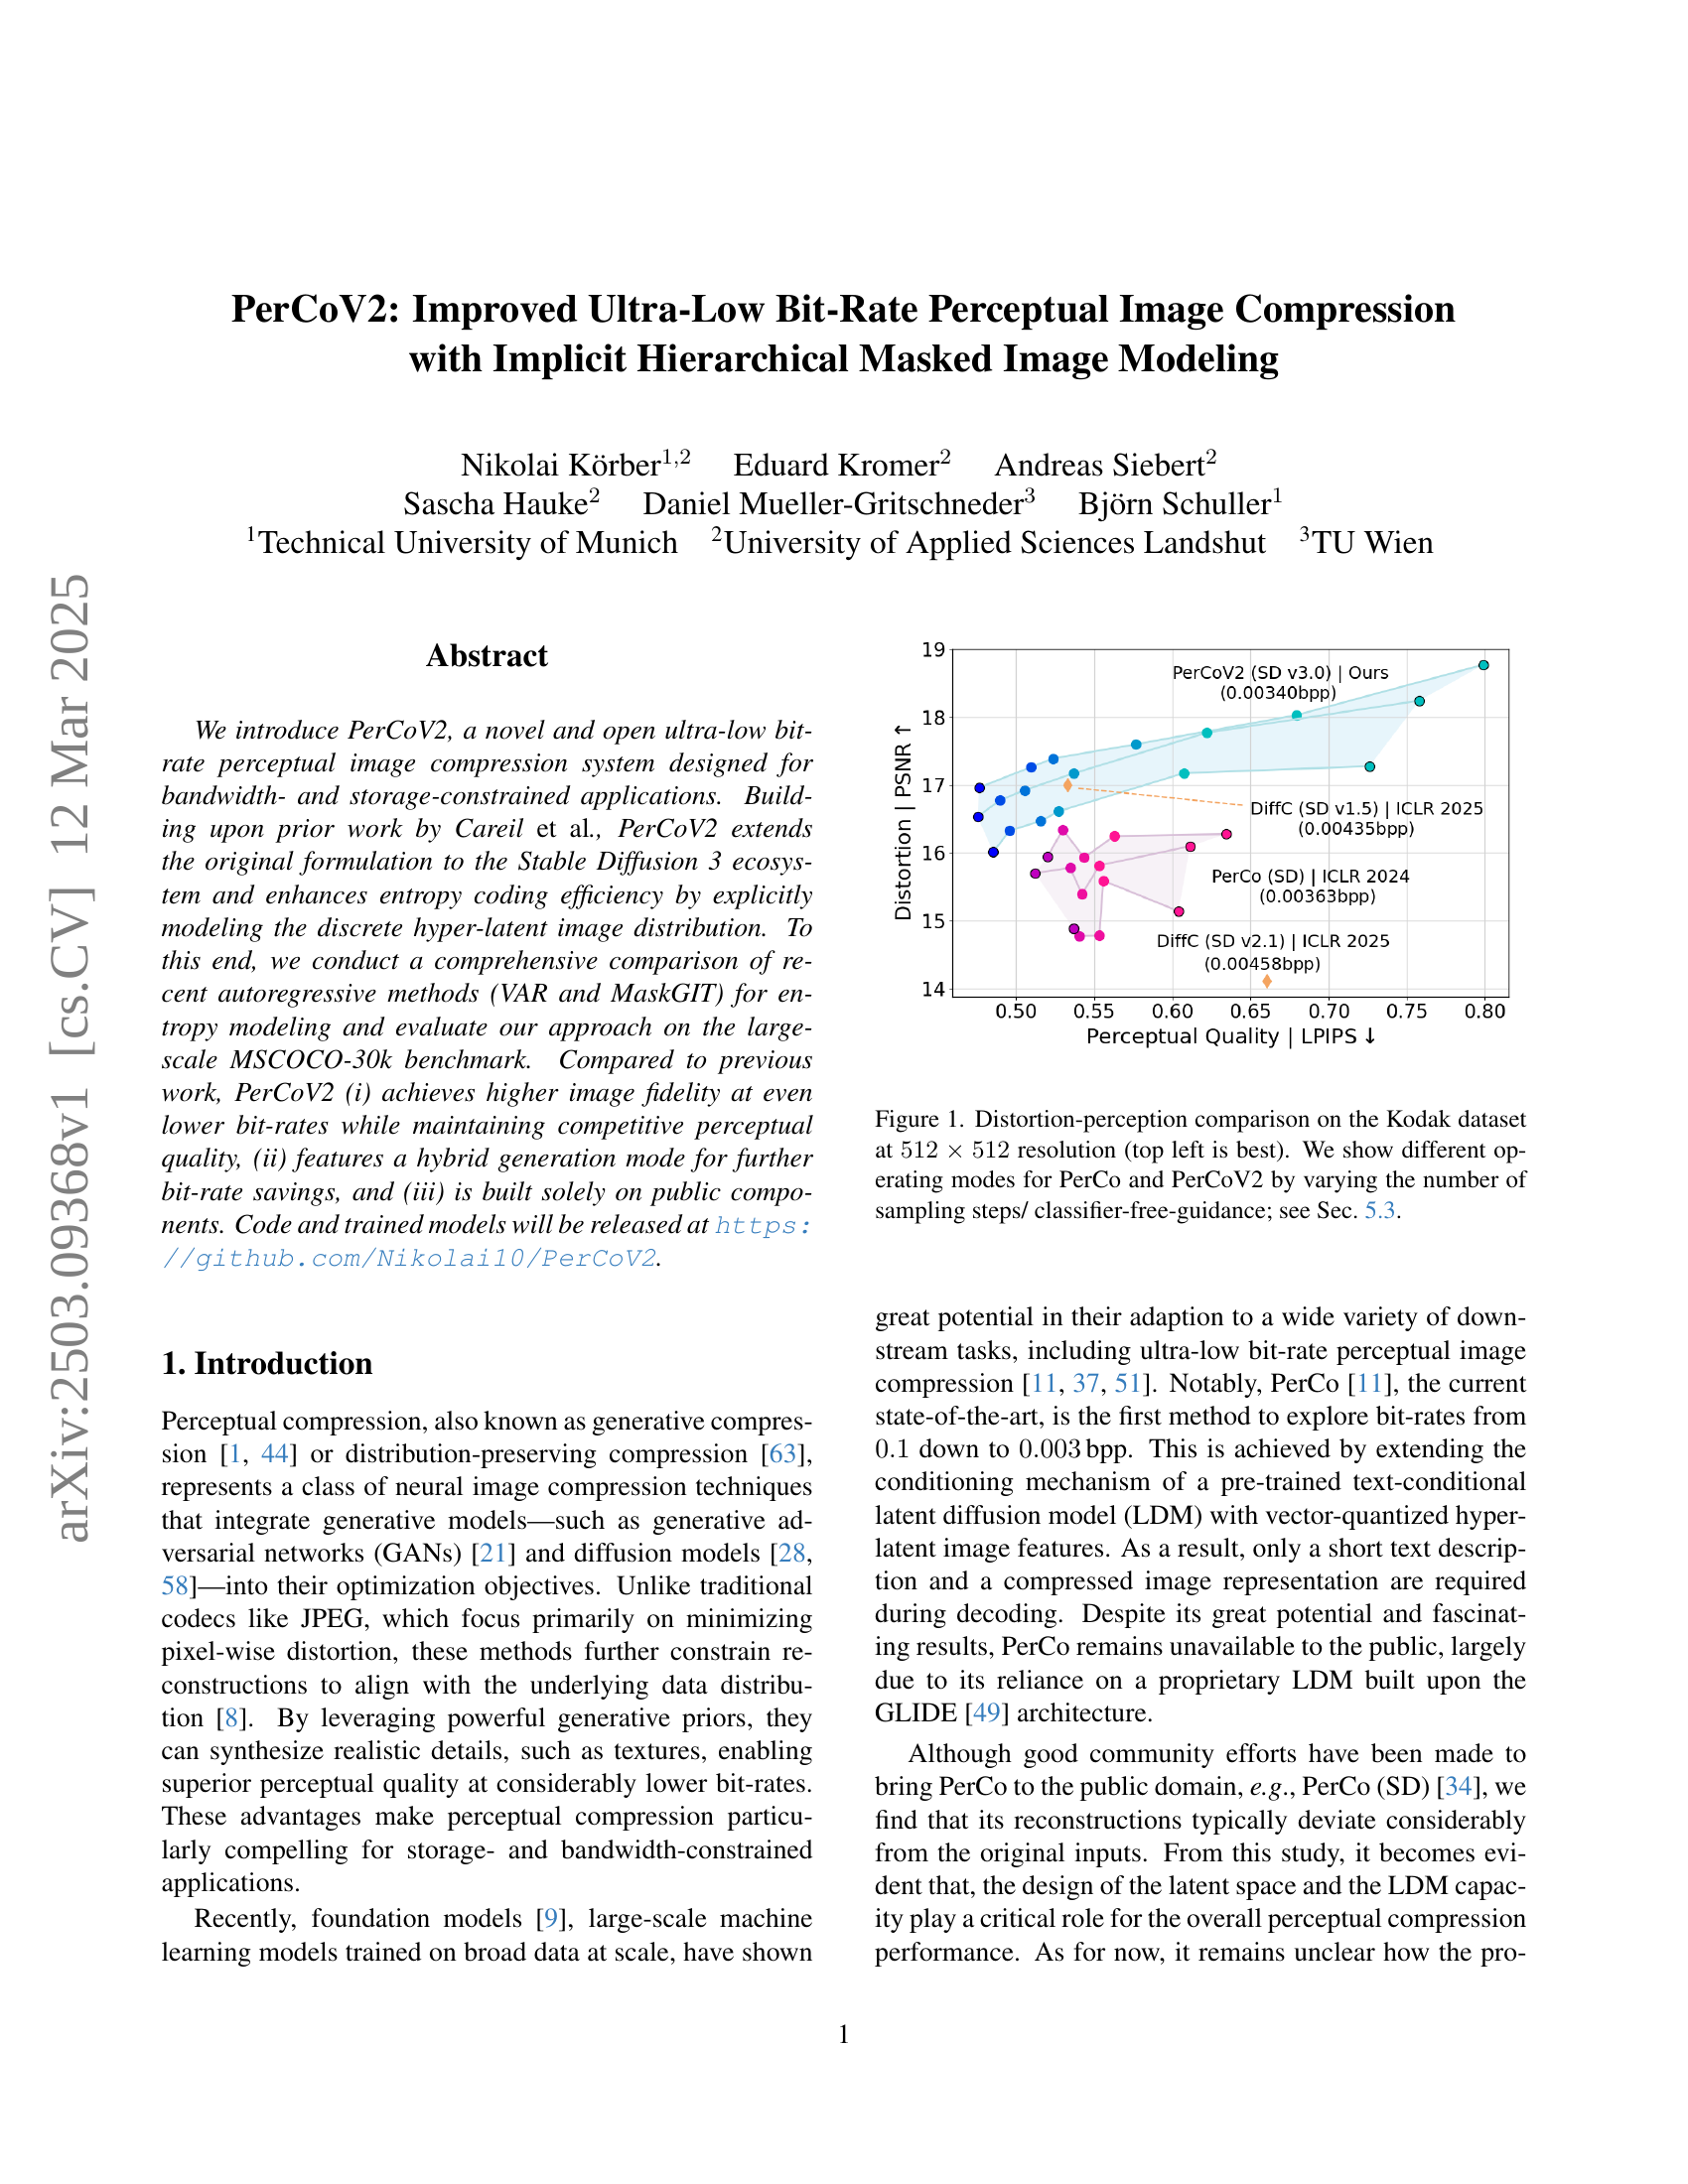
🔼 This figure displays a comparison of perceptual image quality versus distortion (measured as PSNR) for different image compression methods at a resolution of 512x512 pixels, using the Kodak image dataset. The methods compared include PerCo and PerCoV2, both in various operating modes. The modes differ in the number of sampling steps and the classifier-free-guidance parameter used in the image generation process. The top-left corner of the graph represents the best performance (lowest distortion and highest perceptual quality). Section 5.3 of the paper provides further details on the experimental setup and the different operating modes tested.
read the caption
Figure 1: Distortion-perception comparison on the Kodak dataset at 512×512512512512\times 512512 × 512 resolution (top left is best). We show different operating modes for PerCo and PerCoV2 by varying the number of sampling steps/ classifier-free-guidance; see Sec. 5.3.
| Original | PICS [37] | MS-ILLM [48] | DiffC (SD v1.5) [66] | PerCo (SD v2.1) [11, 34] | PerCoV2 (SD v3.0) |
|---|---|---|---|---|---|
| (ICML 2023 Workshop) | (ICML 2023) | (ICLR 2025) | (ICLR 2024) | Ours | |
| kodim10 | bpp () | bpp () | bpp () | bpp () | bpp |
| kodim21 | bpp () | bpp () | bpp () | bpp () | bpp |
| kodim13 | bpp () | bpp () | bpp () | bpp () | bpp |
| kodim07 | bpp () | bpp () | bpp () | bpp () | bpp |
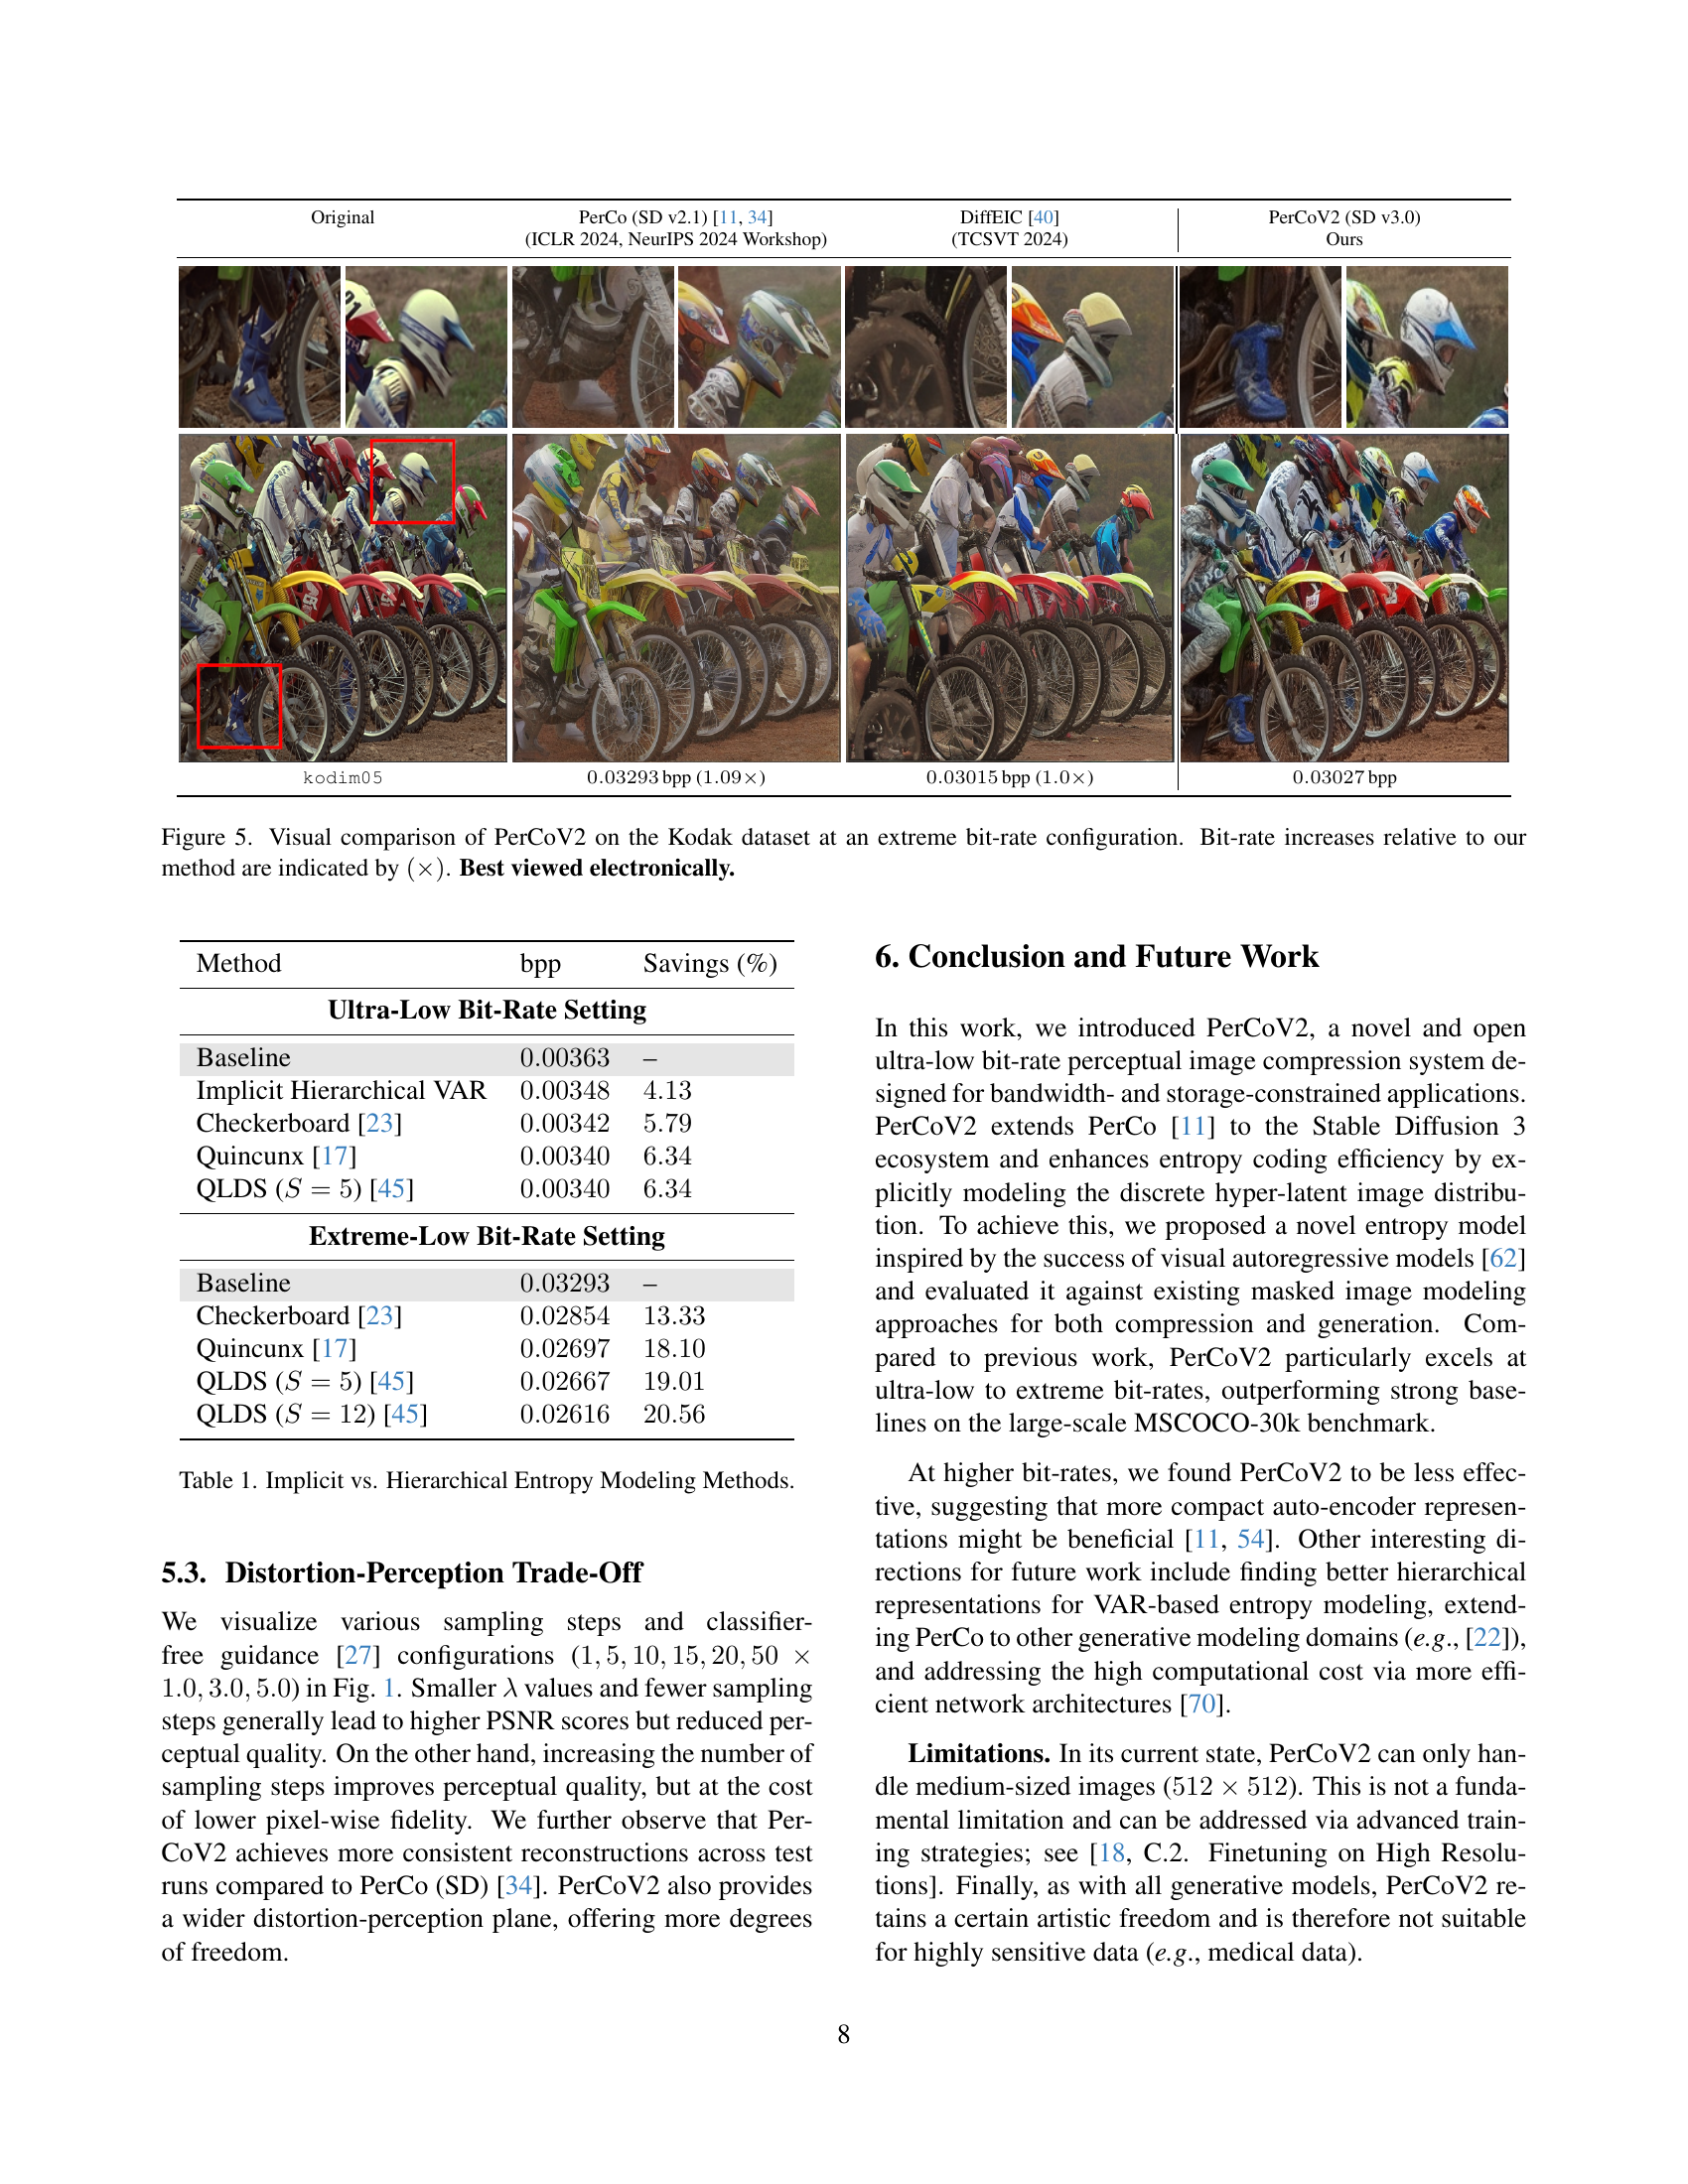
🔼 This table compares the performance of different entropy modeling methods used in PerCoV2, a perceptual image compression system. It shows the bit-rate savings achieved by using implicit hierarchical VAR and different masking schemes (Checkerboard, Quincunx, QLDS) compared to a baseline method, for both ultra-low and extreme-low bit-rate settings. The results highlight the impact of the chosen entropy model on compression efficiency.
read the caption
Table 1: Implicit vs. Hierarchical Entropy Modeling Methods.
In-depth insights#
Implicit MIM#
Implicit Masked Image Modeling (MIM) appears as a crucial component within the PerCoV2 framework, enhancing entropy coding efficiency. Instead of directly modeling the explicit dependencies between latent variables, PerCoV2 leverages MIM to implicitly capture these relationships. This likely involves training a model to reconstruct masked portions of the hyper-latent image representation. By training the model to predict these masked regions, it learns to understand the underlying data distribution. The success of MIM hinges on the careful selection of masking strategies. It is more computationally efficient than explicit autoregressive modeling, offering a valuable trade-off between performance and computational cost.
PerCo v2 Open#
It appears you’re asking about a hypothetical concept: “PerCo v2 Open,” based on the paper provided. In the context of perceptual image compression, this suggests a version of PerCo (likely Perceptual Compression) that emphasizes openness: open-source code, publicly available models, and reliance on non-proprietary components. This is crucial because the original PerCo had limitations in public availability due to its dependence on a proprietary LDM. An “Open” version addresses this by utilizing resources like Stable Diffusion. The focus on openness promotes reproducibility, community contribution, and wider adoption of the technology. Furthermore, it enables more thorough analysis of the underlying components, facilitating improvements in areas like the latent space design and LDM capacity, which are critical for perceptual compression performance. A publicly accessible PerCo v2 would allow researchers to directly compare and build upon its results, accelerating progress in the field of ultra-low bit-rate image compression.
Hi-res is next#
The phrase “Hi-res is next” strongly suggests a forward-looking perspective in image compression. Focusing on high-resolution is crucial as displays and capture devices improve, creating a need for efficiently storing and transmitting large images. This implies evolving compression techniques. A shift from PSNR-driven methods to perceptual metrics is key, ensuring visual quality even at high resolutions. Generative models and neural codecs become more essential to manage complex data. Scaling these models effectively and adapting them to higher resolutions remains a significant challenge. Computational cost must be addressed, as processing larger images demands more resources. There would be emphasis on parallelism and hardware acceleration. Future work would optimize network architectures and training strategies to accommodate high-resolution images without compromising performance. The industry would start to prioritize end-to-end high-resolution compression solutions.
Trade-off RDP#
The Rate-Distortion-Perception (RDP) trade-off acknowledges that optimizing solely for pixel-wise fidelity doesn’t guarantee improved perceptual quality. Achieving a balance between minimizing distortion and maximizing perceptual realism is crucial. Perceptual compression methods leverage powerful generative priors to synthesize realistic details, resulting in superior perceptual quality at considerably lower bit-rates, making them compelling for bandwidth-constrained applications. However, the trade-off highlights the need to carefully consider how different optimization strategies affect both distortion and perception. Finding the optimal balance is a key challenge in designing effective image compression systems that can deliver high-quality results while minimizing resource consumption.
Stable Diff. 3#
Stable Diffusion 3 (SD3) appears as a central component for PerCoV2. It serves as the foundational architecture, replacing proprietary LDMs. Its adoption enables an open and accessible compression system. The paper leverages the enhanced auto-encoder design and increased LDM capacity of SD3. The use of Stable Diffusion 3 allows for a more compact and efficient representation, facilitating faster processing. SD3 is the core for achieving ultra-low bit-rate perceptual image compression. The move to Stable Diffusion 3 is a crucial step towards community accessibility and reproducibility, allowing for more research.
More visual insights#
More on figures

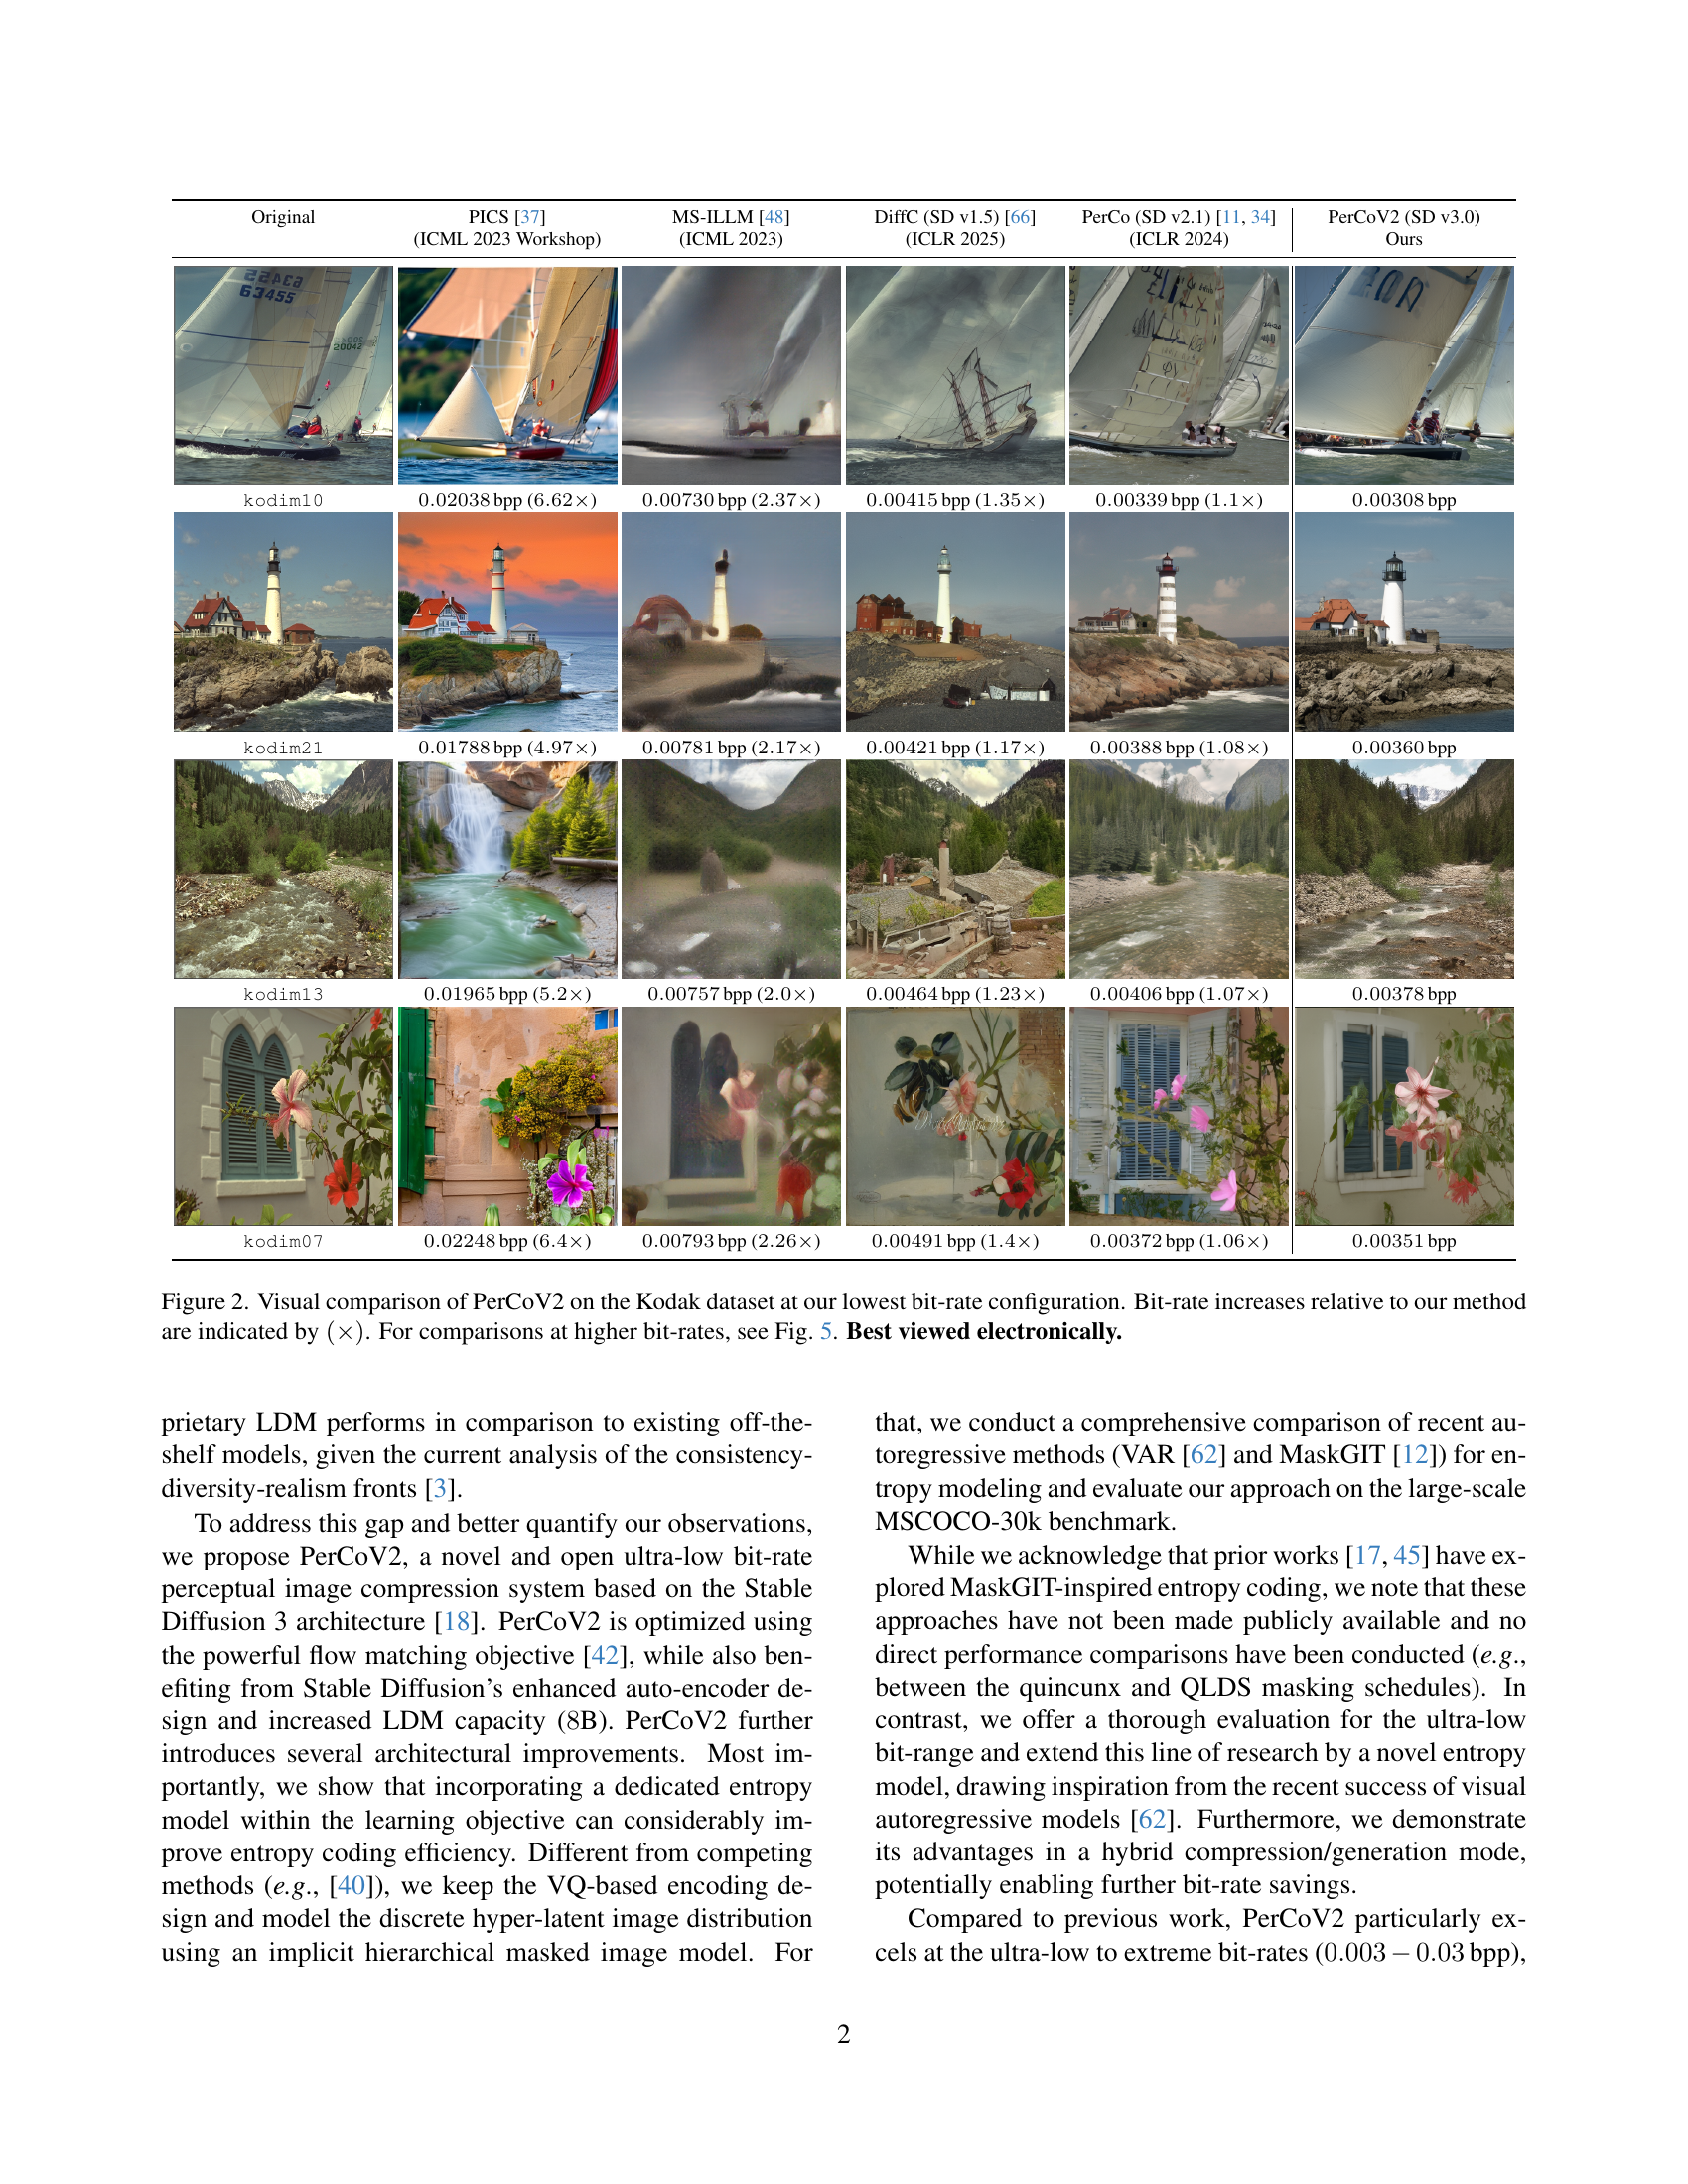
🔼 Figure 2 presents a visual comparison of image compression results using PerCoV2 and several other methods on the Kodak dataset. The comparison focuses on the lowest bit-rate achieved by PerCoV2. Each image shows the original photo alongside its reconstructions using different compression techniques. The relative bit-rates (how much data is used for each compression) compared to PerCoV2’s lowest bit-rate are indicated by the multiplication factor shown in parentheses (×). For instance, (× 6.62) means the method used 6.62 times more data than PerCoV2. The figure highlights PerCoV2’s ability to maintain better image quality at significantly lower bit rates compared to the alternative techniques. Additional comparisons at higher bit rates can be found in Figure 5.
read the caption
Figure 2: Visual comparison of PerCoV2 on the Kodak dataset at our lowest bit-rate configuration. Bit-rate increases relative to our method are indicated by (×)(\times)( × ). For comparisons at higher bit-rates, see Fig. 5. Best viewed electronically.

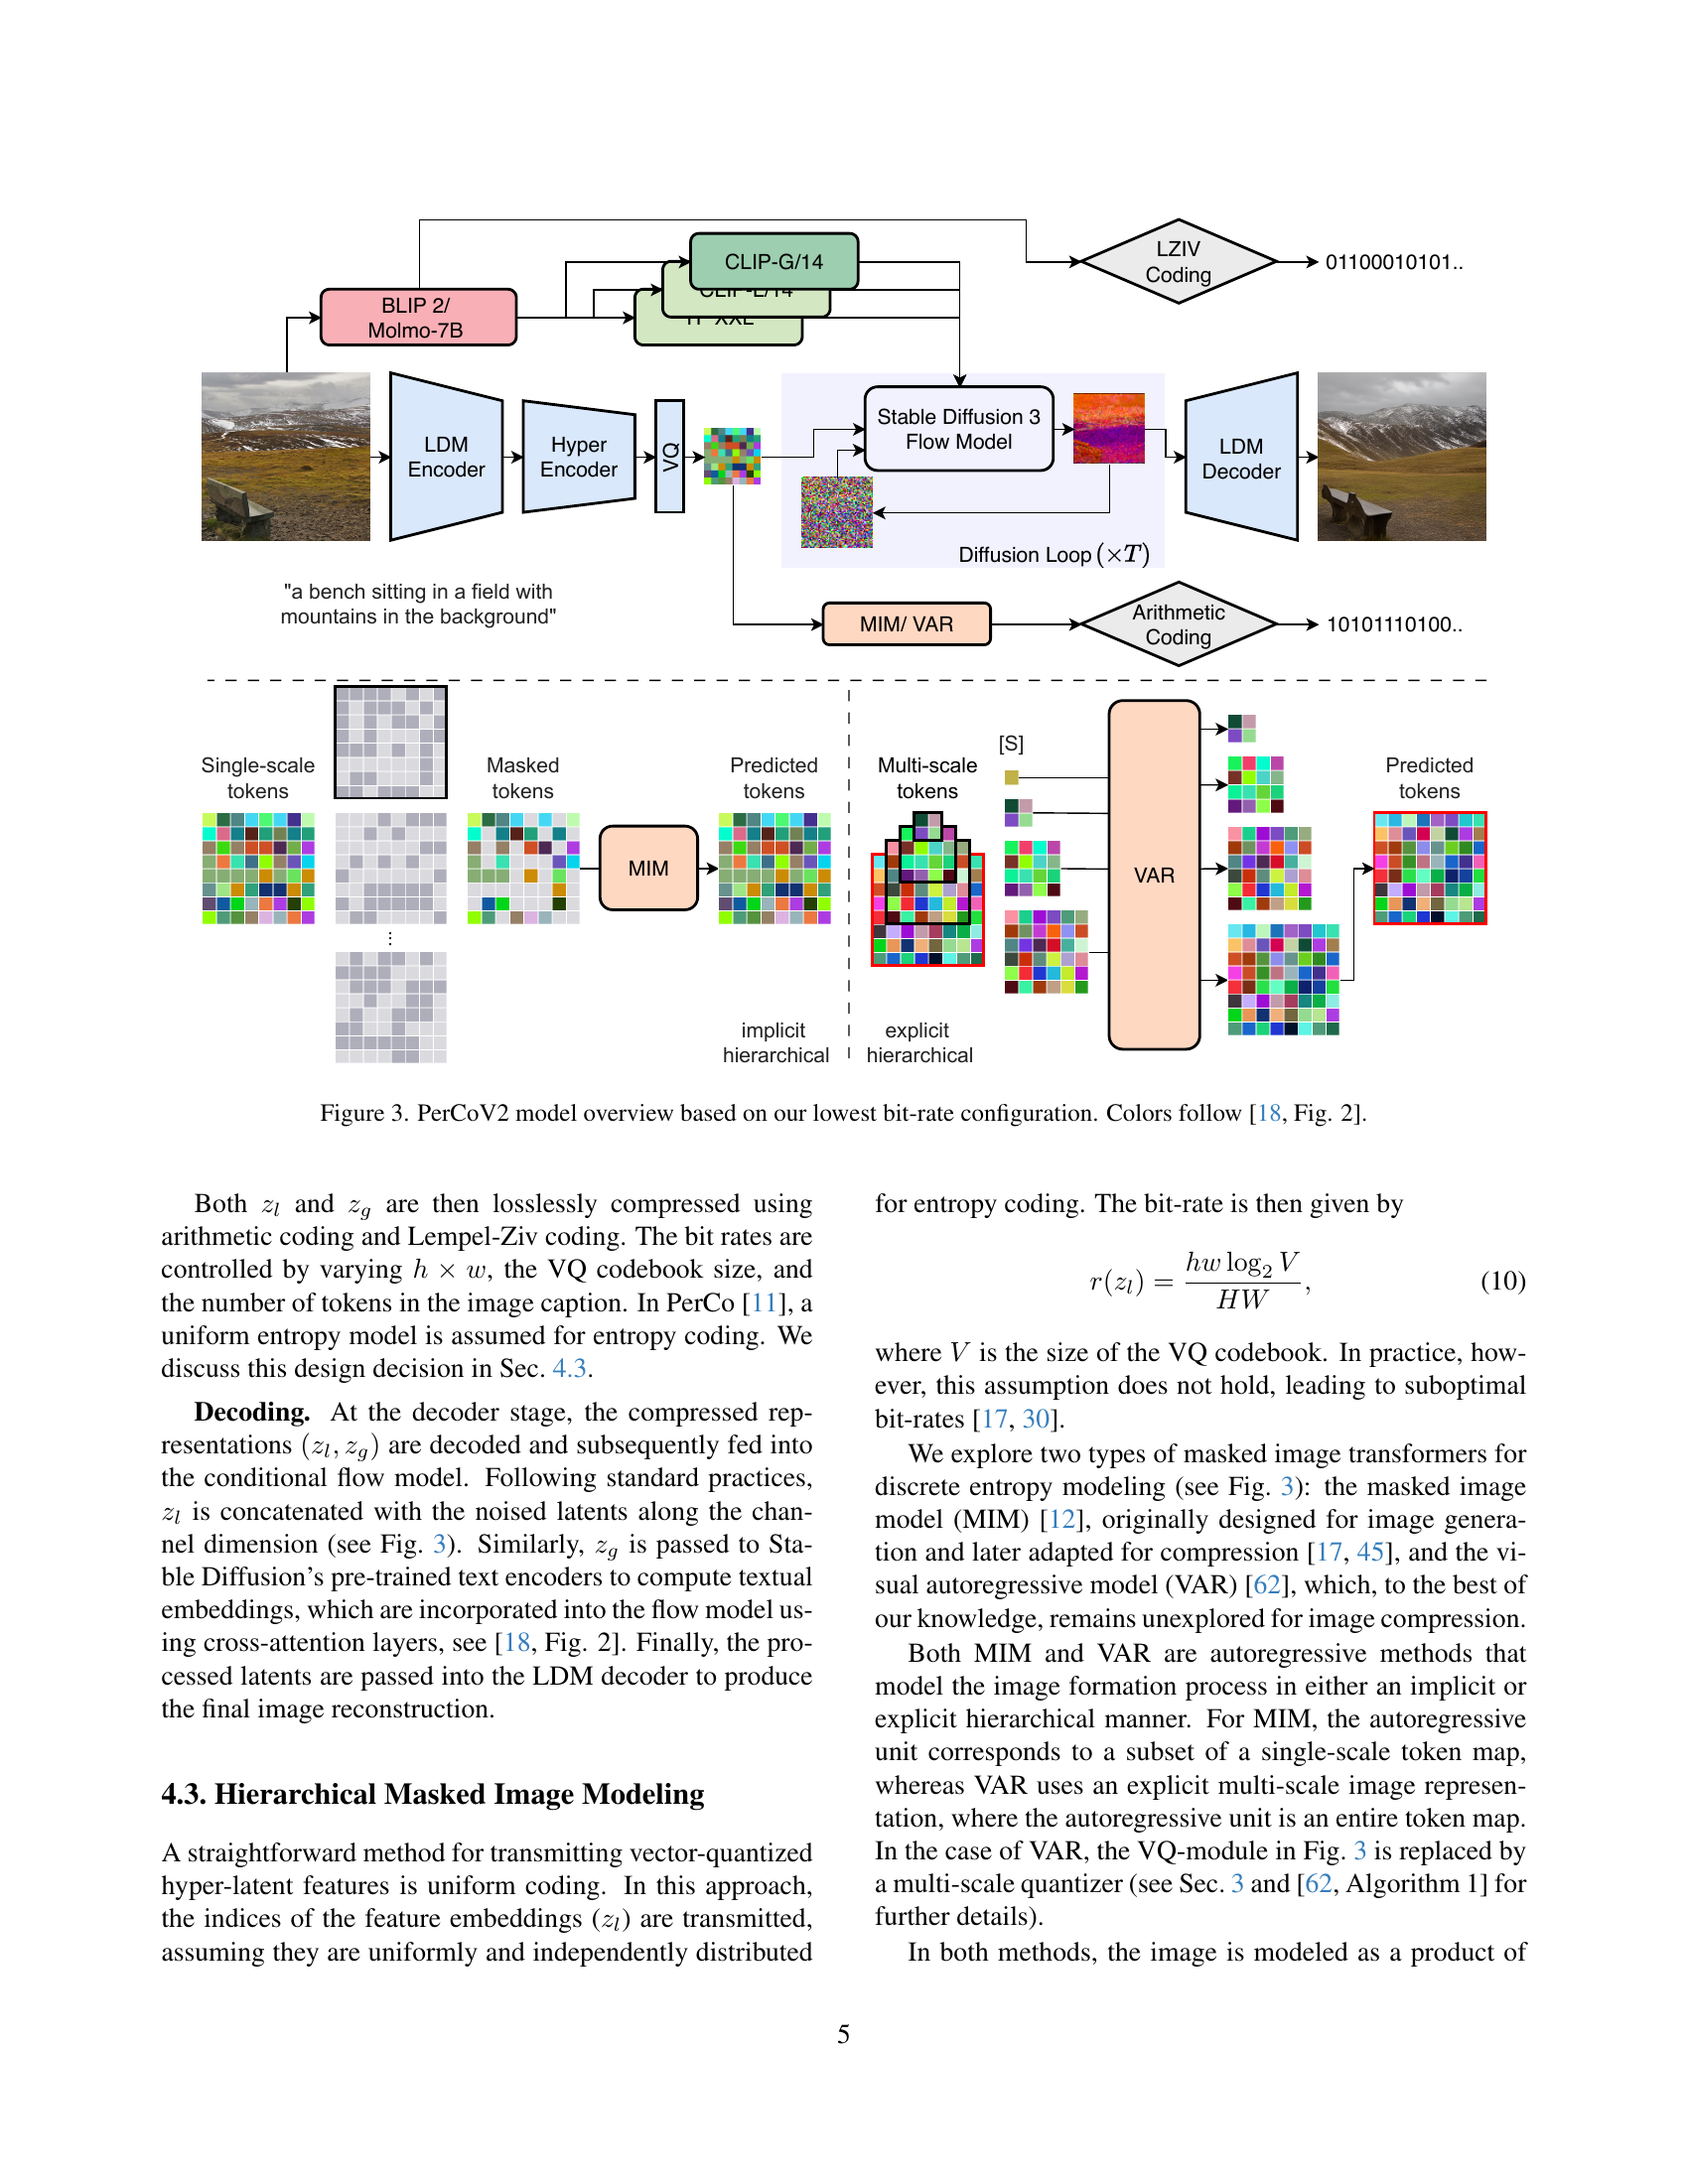
🔼 This figure provides a detailed overview of the PerCoV2 model architecture, focusing on the configuration used for the lowest bit-rate settings. It illustrates the flow of data through the various components, starting with image input and text description. The encoder processes the image to extract both local features (vector-quantized hyper-latent representations) and global features (image captions). These features are then combined and compressed using arithmetic and Lempel-Ziv coding. The decoder reconstructs the image from the compressed representations using the Stable Diffusion 3 flow model and corresponding latent diffusion model. The figure highlights the use of an implicit hierarchical masked image model (MIM) or visual autoregressive model (VAR) for entropy modeling, showcasing a key innovation of the PerCoV2 model. Color coding is consistent with a previous work referenced in the caption.
read the caption
Figure 3: PerCoV2 model overview based on our lowest bit-rate configuration. Colors follow [18, Fig. 2].

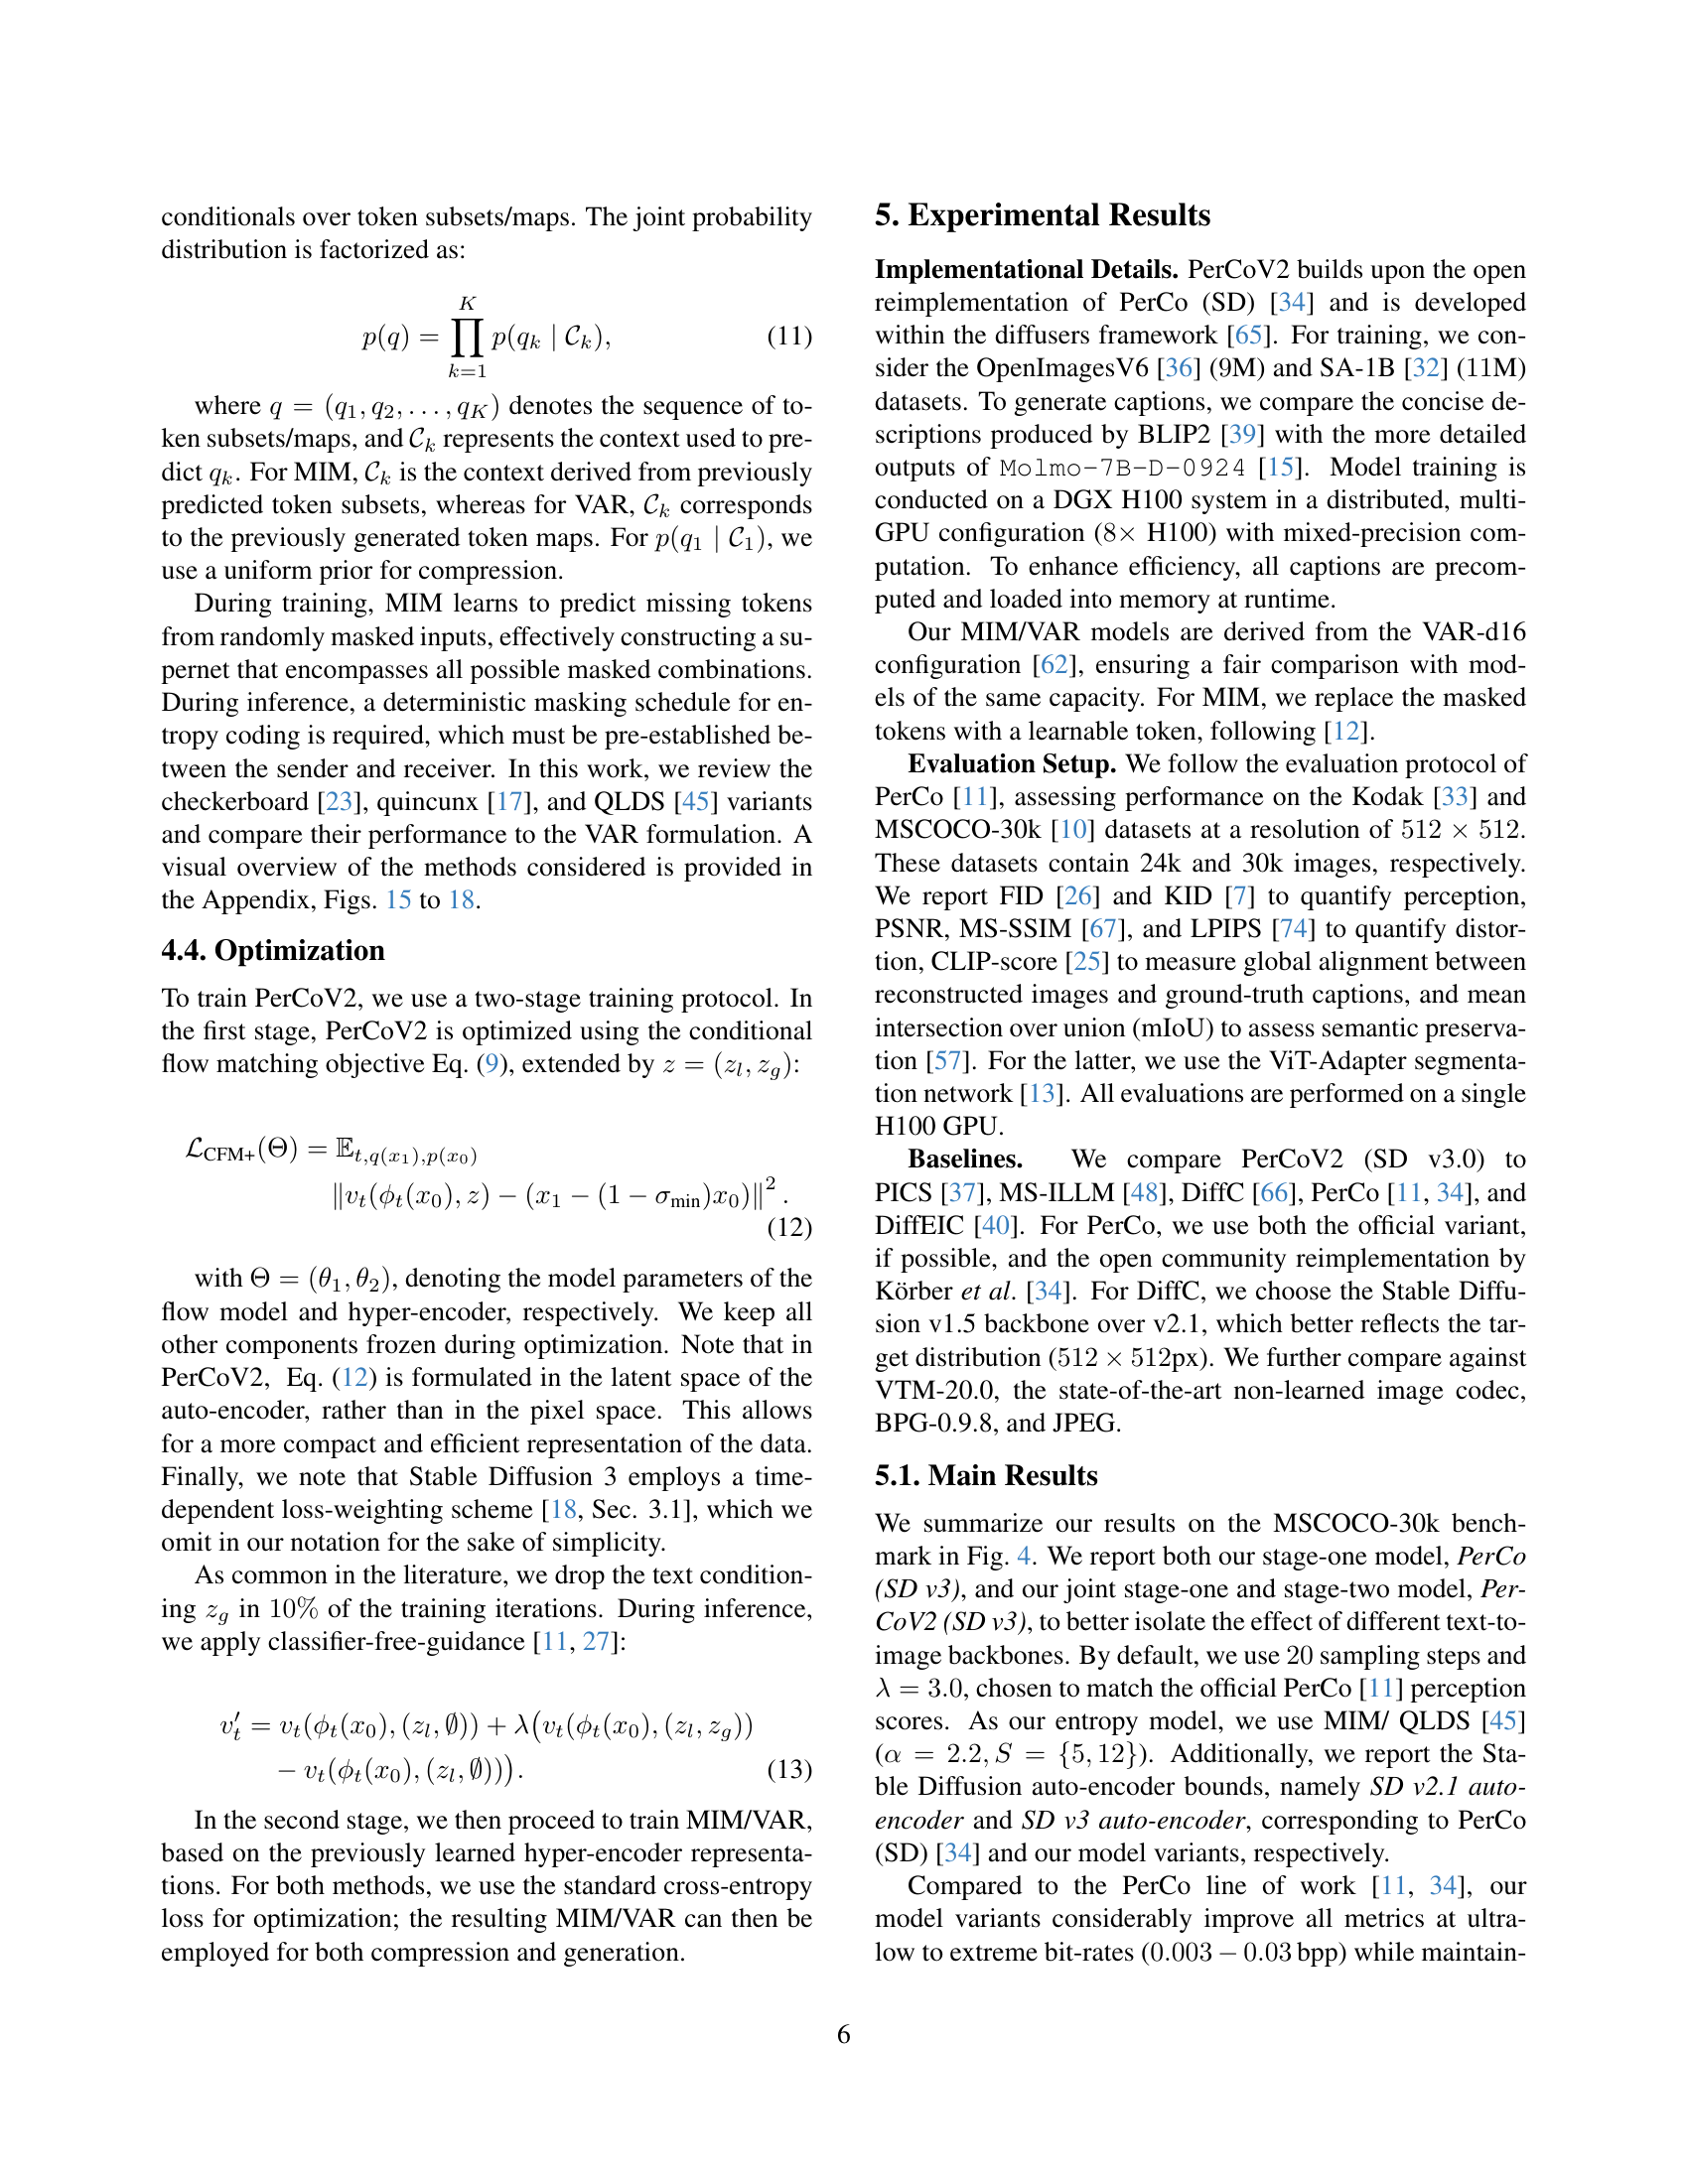
🔼 Figure 4 presents a comprehensive quantitative analysis of PerCoV2’s performance on the MSCOCO-30k benchmark dataset. It shows how various metrics change across different bitrates. The metrics shown include MS-SSIM and PSNR (measuring reconstruction quality), FID and KID (measuring perceptual quality), LPIPS (measuring perceptual distance), and mIoU (measuring semantic preservation). By comparing PerCoV2 to other state-of-the-art methods like PerCo (official and SD version), MS-ILLM and DiffEIC, across a range of bitrates, the figure highlights PerCoV2’s strengths in achieving a good balance between high image fidelity and superior perceptual quality, particularly at very low bitrates.
read the caption
Figure 4: Quantitative comparison of PerCoV2 on MSCOCO-30k.

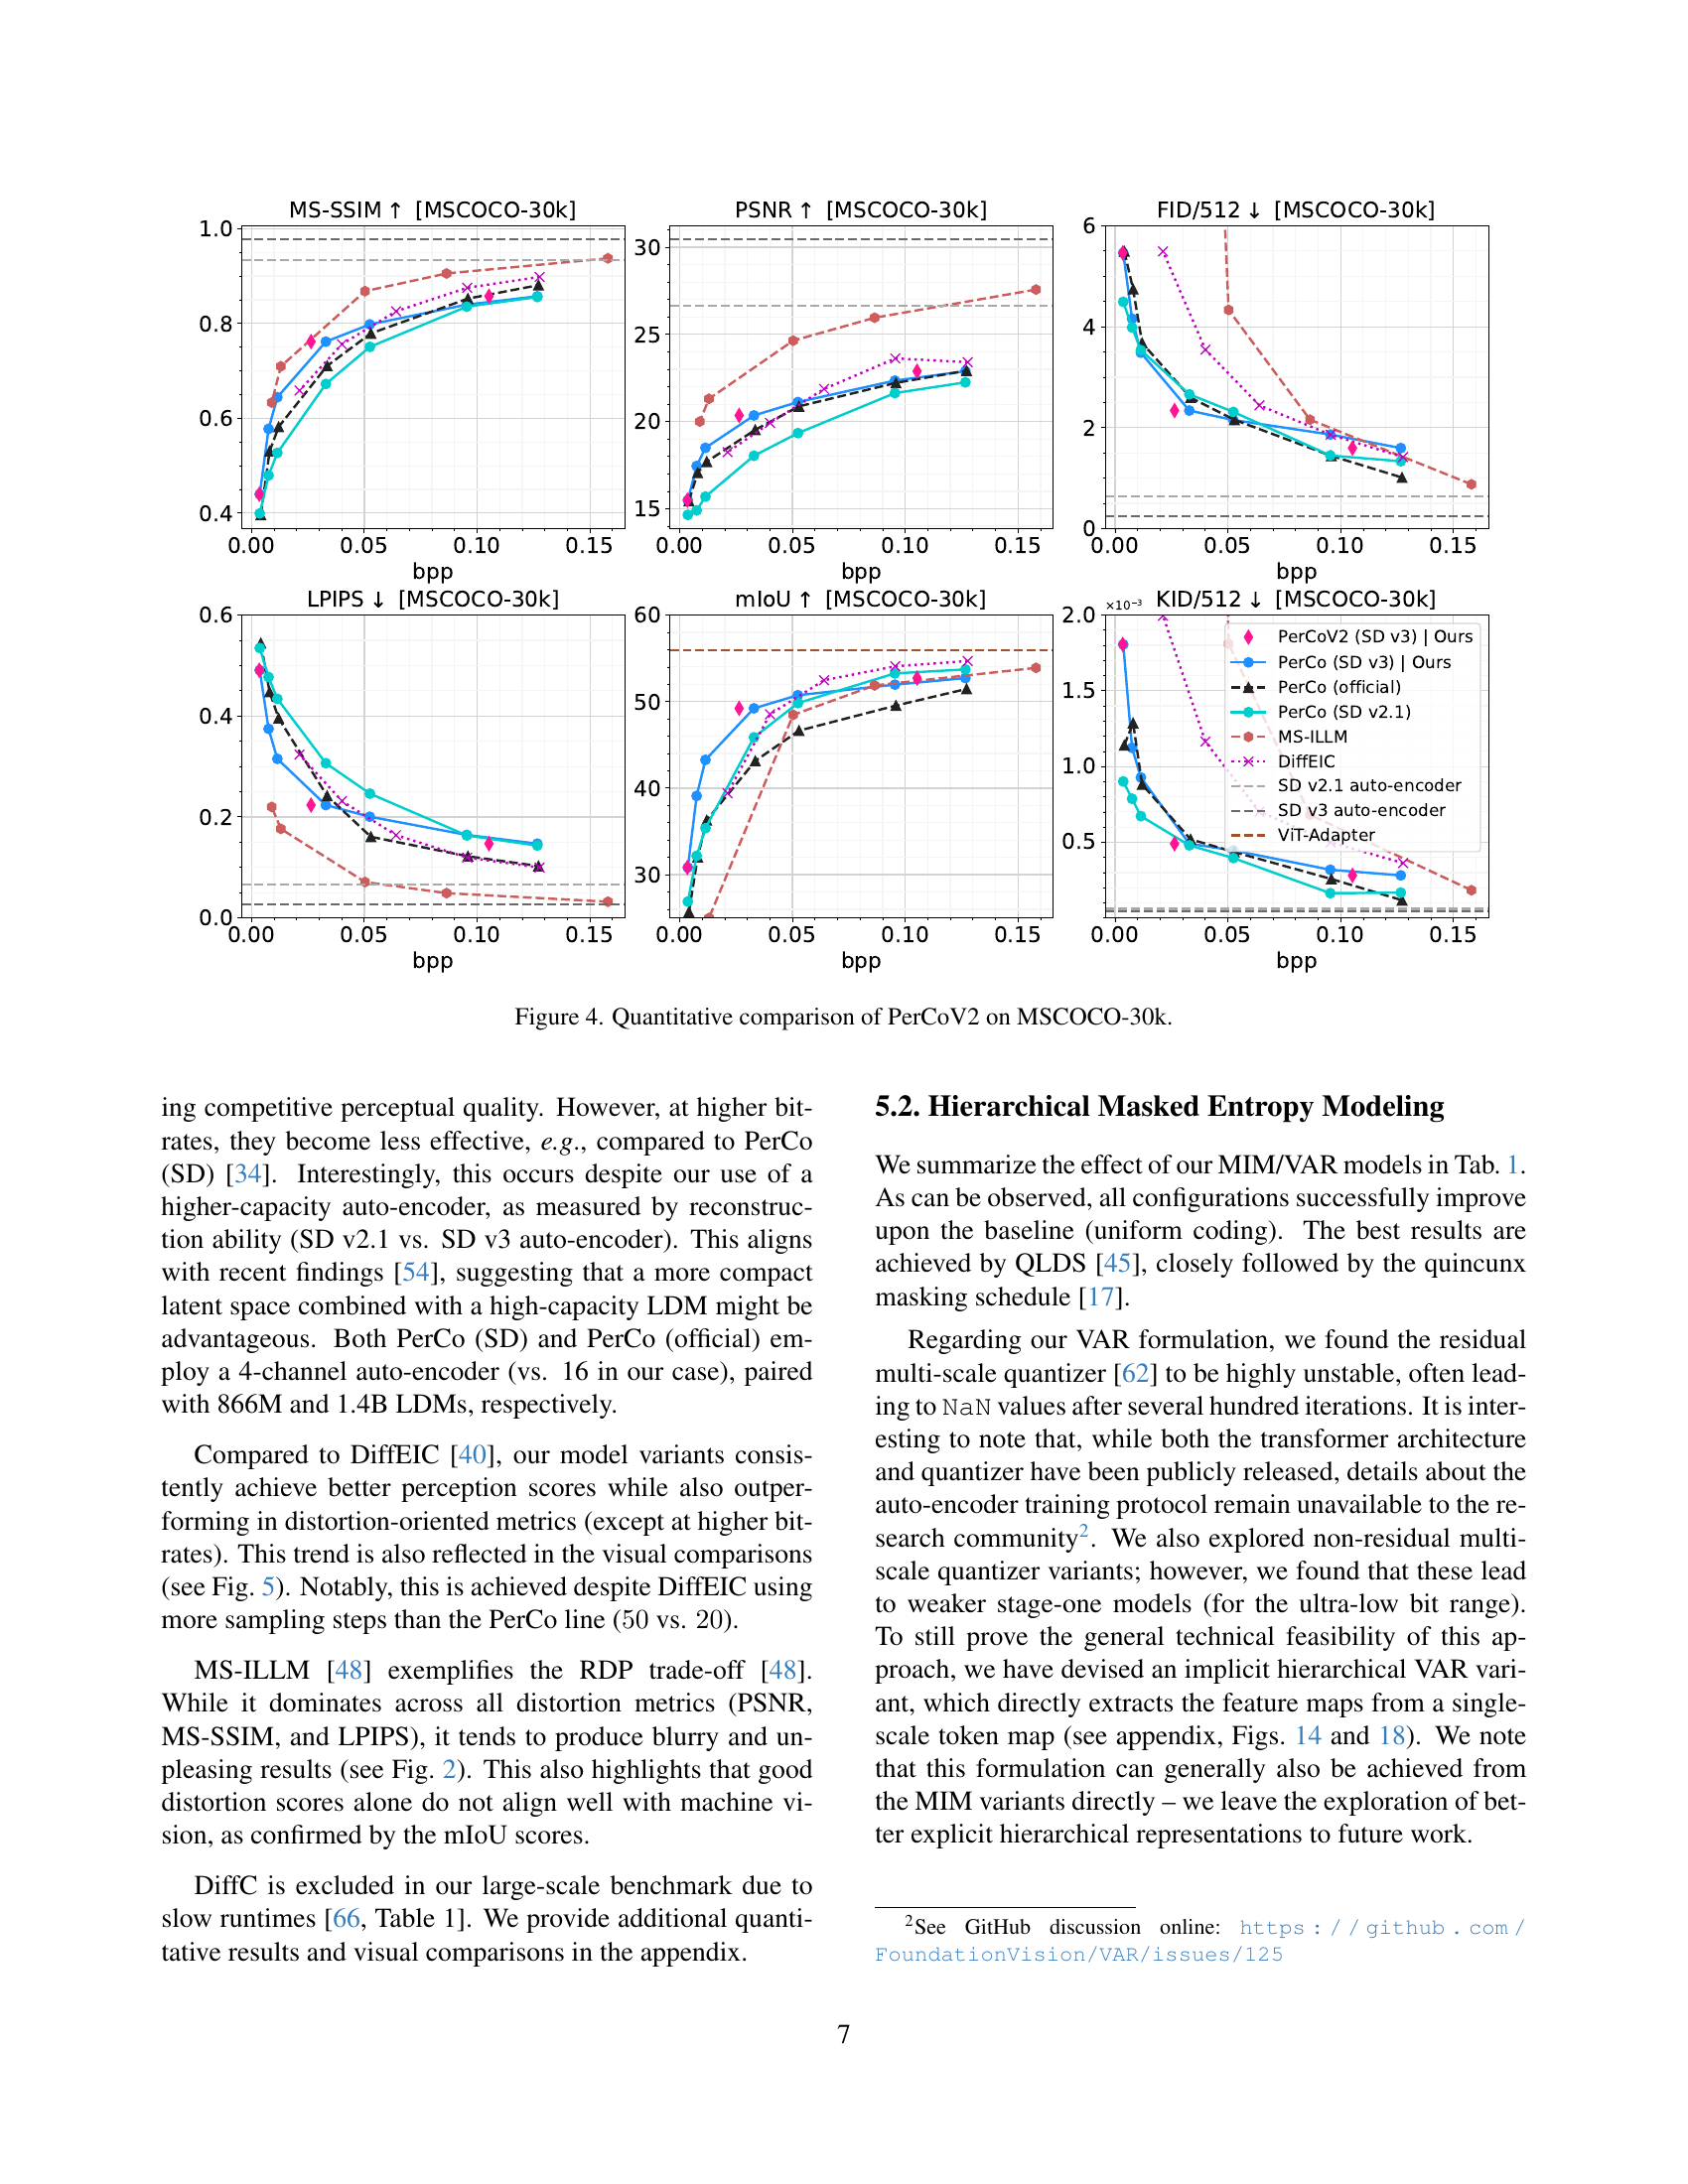
🔼 Figure 5 presents a visual comparison of image compression results using different methods on the Kodak dataset. The comparison focuses on an extreme bit-rate scenario, meaning that very few bits are used to represent each image. The original images are shown alongside reconstructions produced by PerCo (SD v2.1), DiffEIC, and PerCoV2 at various bitrates. The multiplicative factor (×) next to each bpp value indicates how many times larger the bitrate is compared to PerCoV2’s bitrate for that specific image.
read the caption
Figure 5: Visual comparison of PerCoV2 on the Kodak dataset at an extreme bit-rate configuration. Bit-rate increases relative to our method are indicated by (×)(\times)( × ). Best viewed electronically.

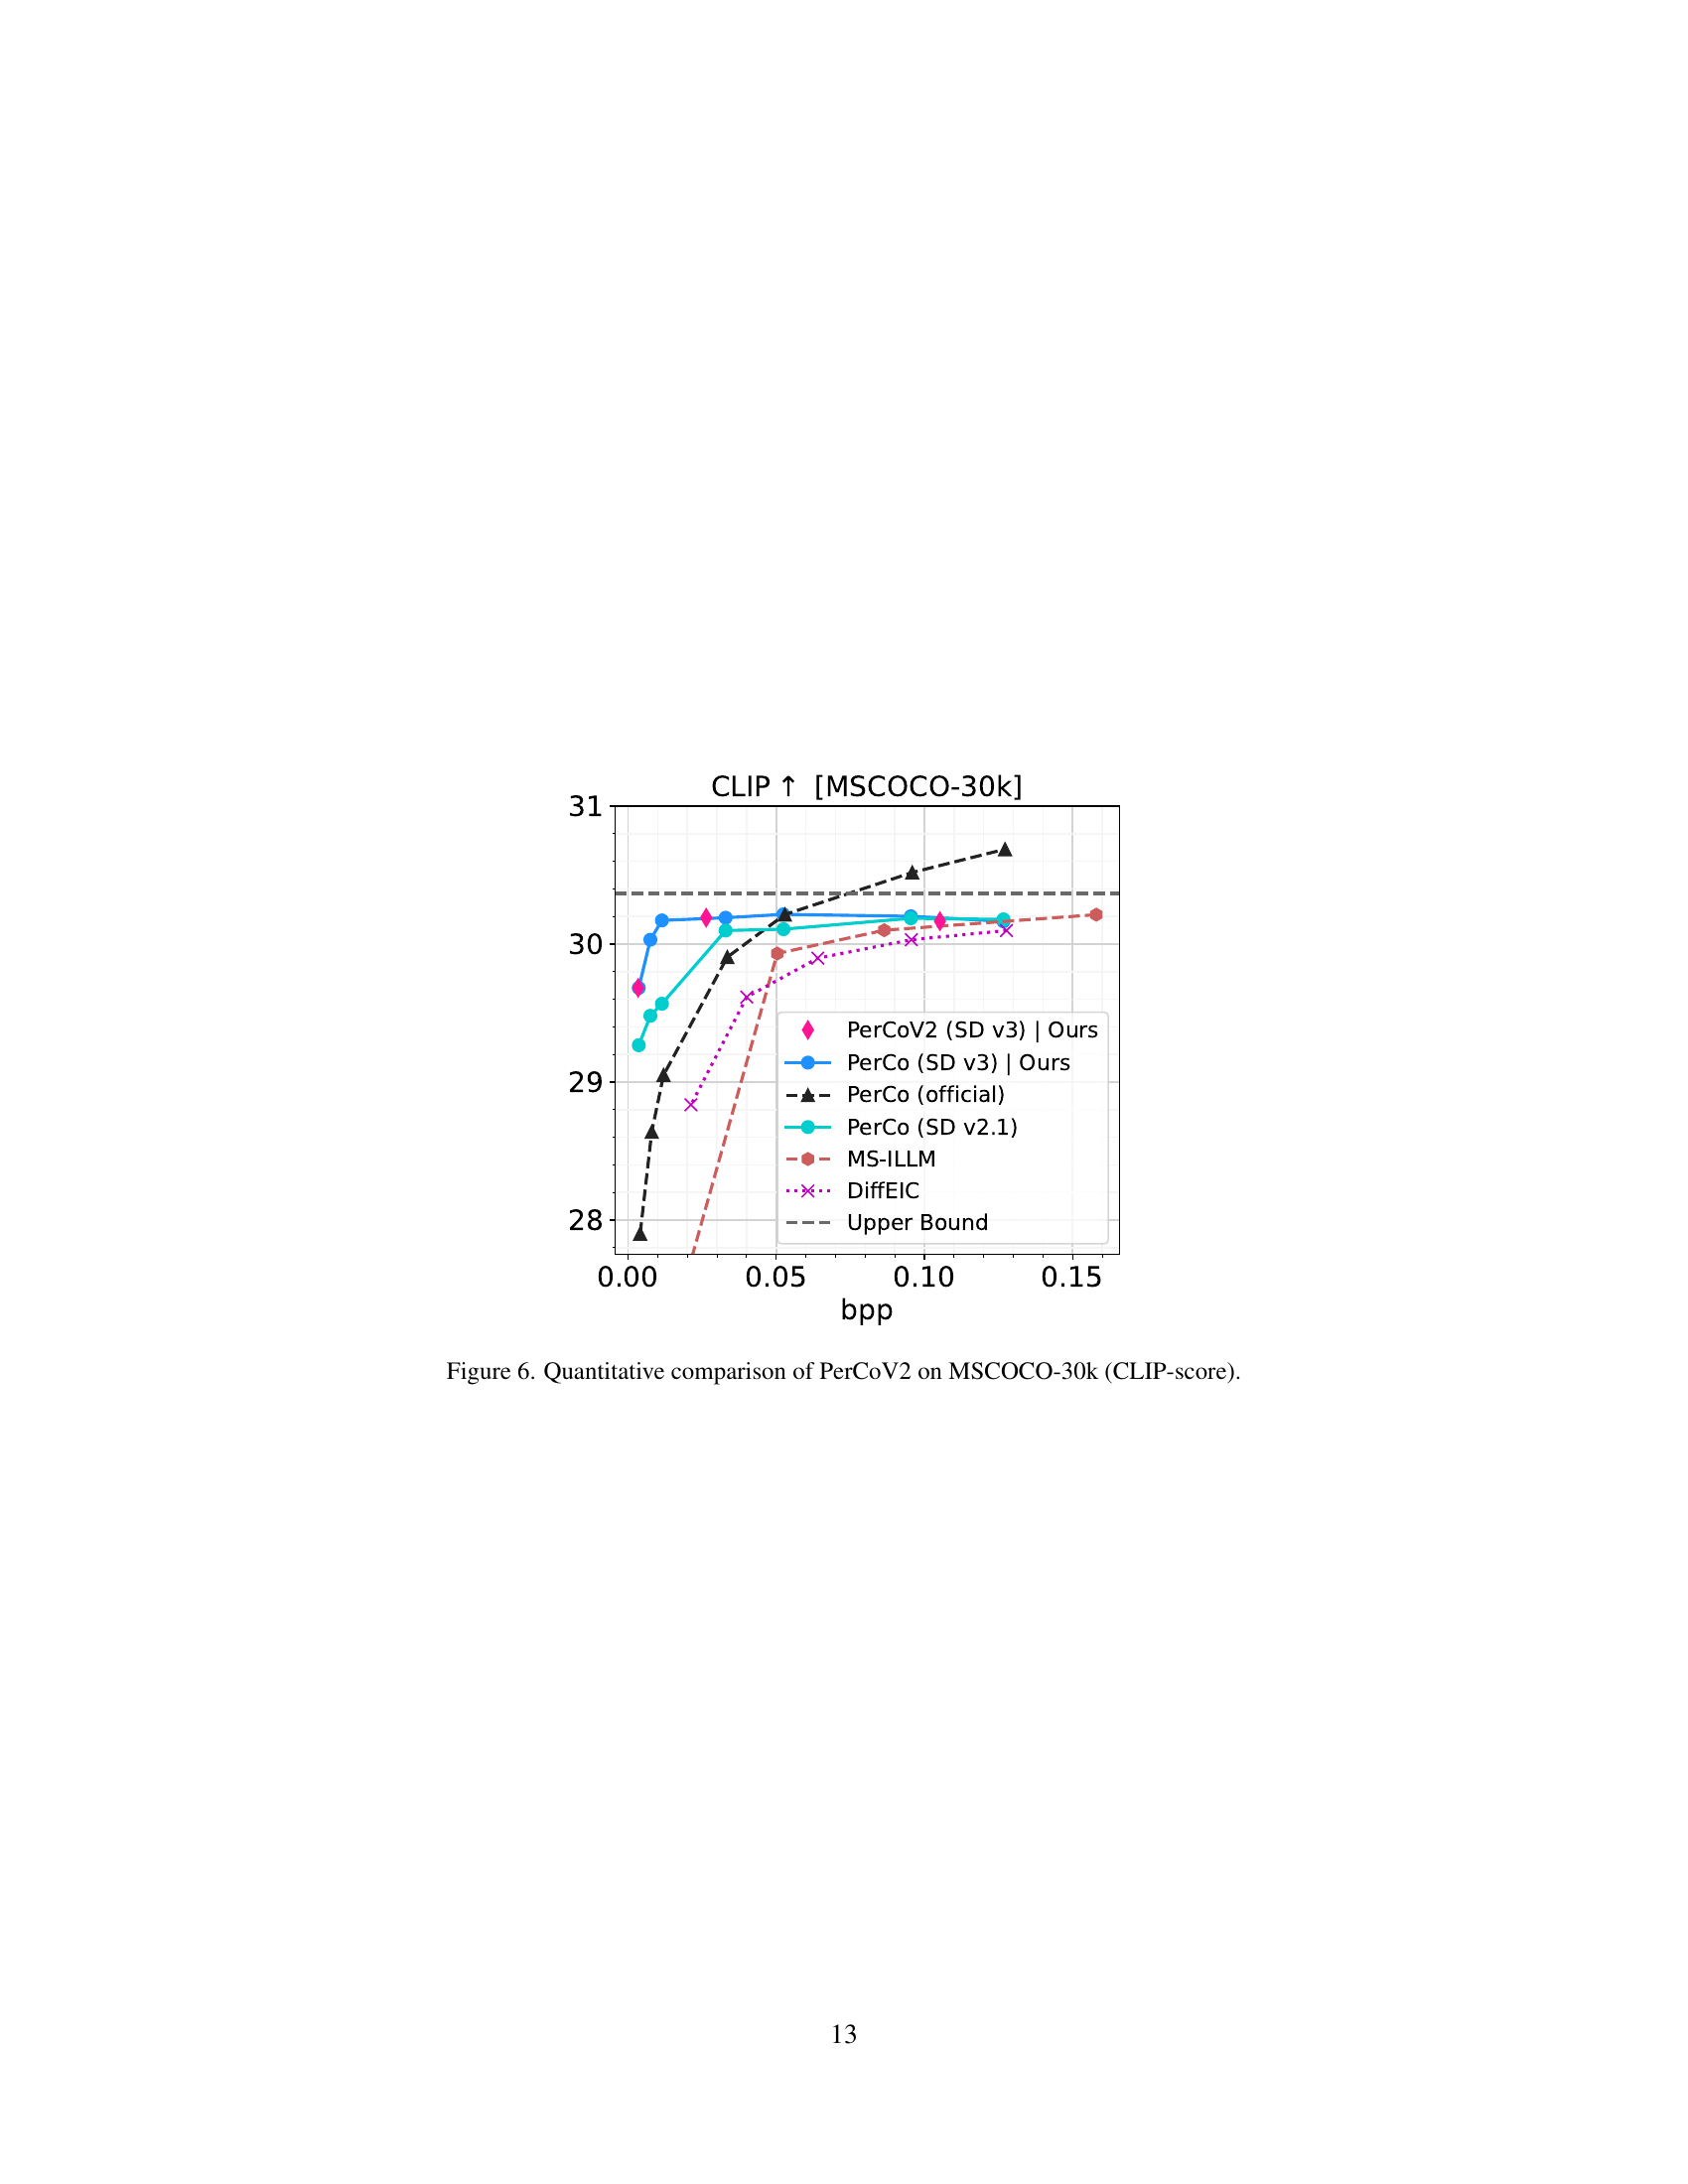
🔼 Figure 6 presents a graph comparing the CLIP scores achieved by different image compression methods on the MSCOCO-30k dataset. The CLIP score measures how well the compressed images align with their corresponding text captions, reflecting perceptual quality. The x-axis represents the bitrate (bpp), indicating the level of compression, while the y-axis shows the CLIP score. Multiple models are compared, including various PerCo versions (PerCoV2 and others), MS-ILLM, DiffEIC and an upper bound. The results illustrate the relative performance of each model in balancing compression efficiency with the preservation of perceptual similarity as measured by CLIP.
read the caption
Figure 6: Quantitative comparison of PerCoV2 on MSCOCO-30k (CLIP-score).

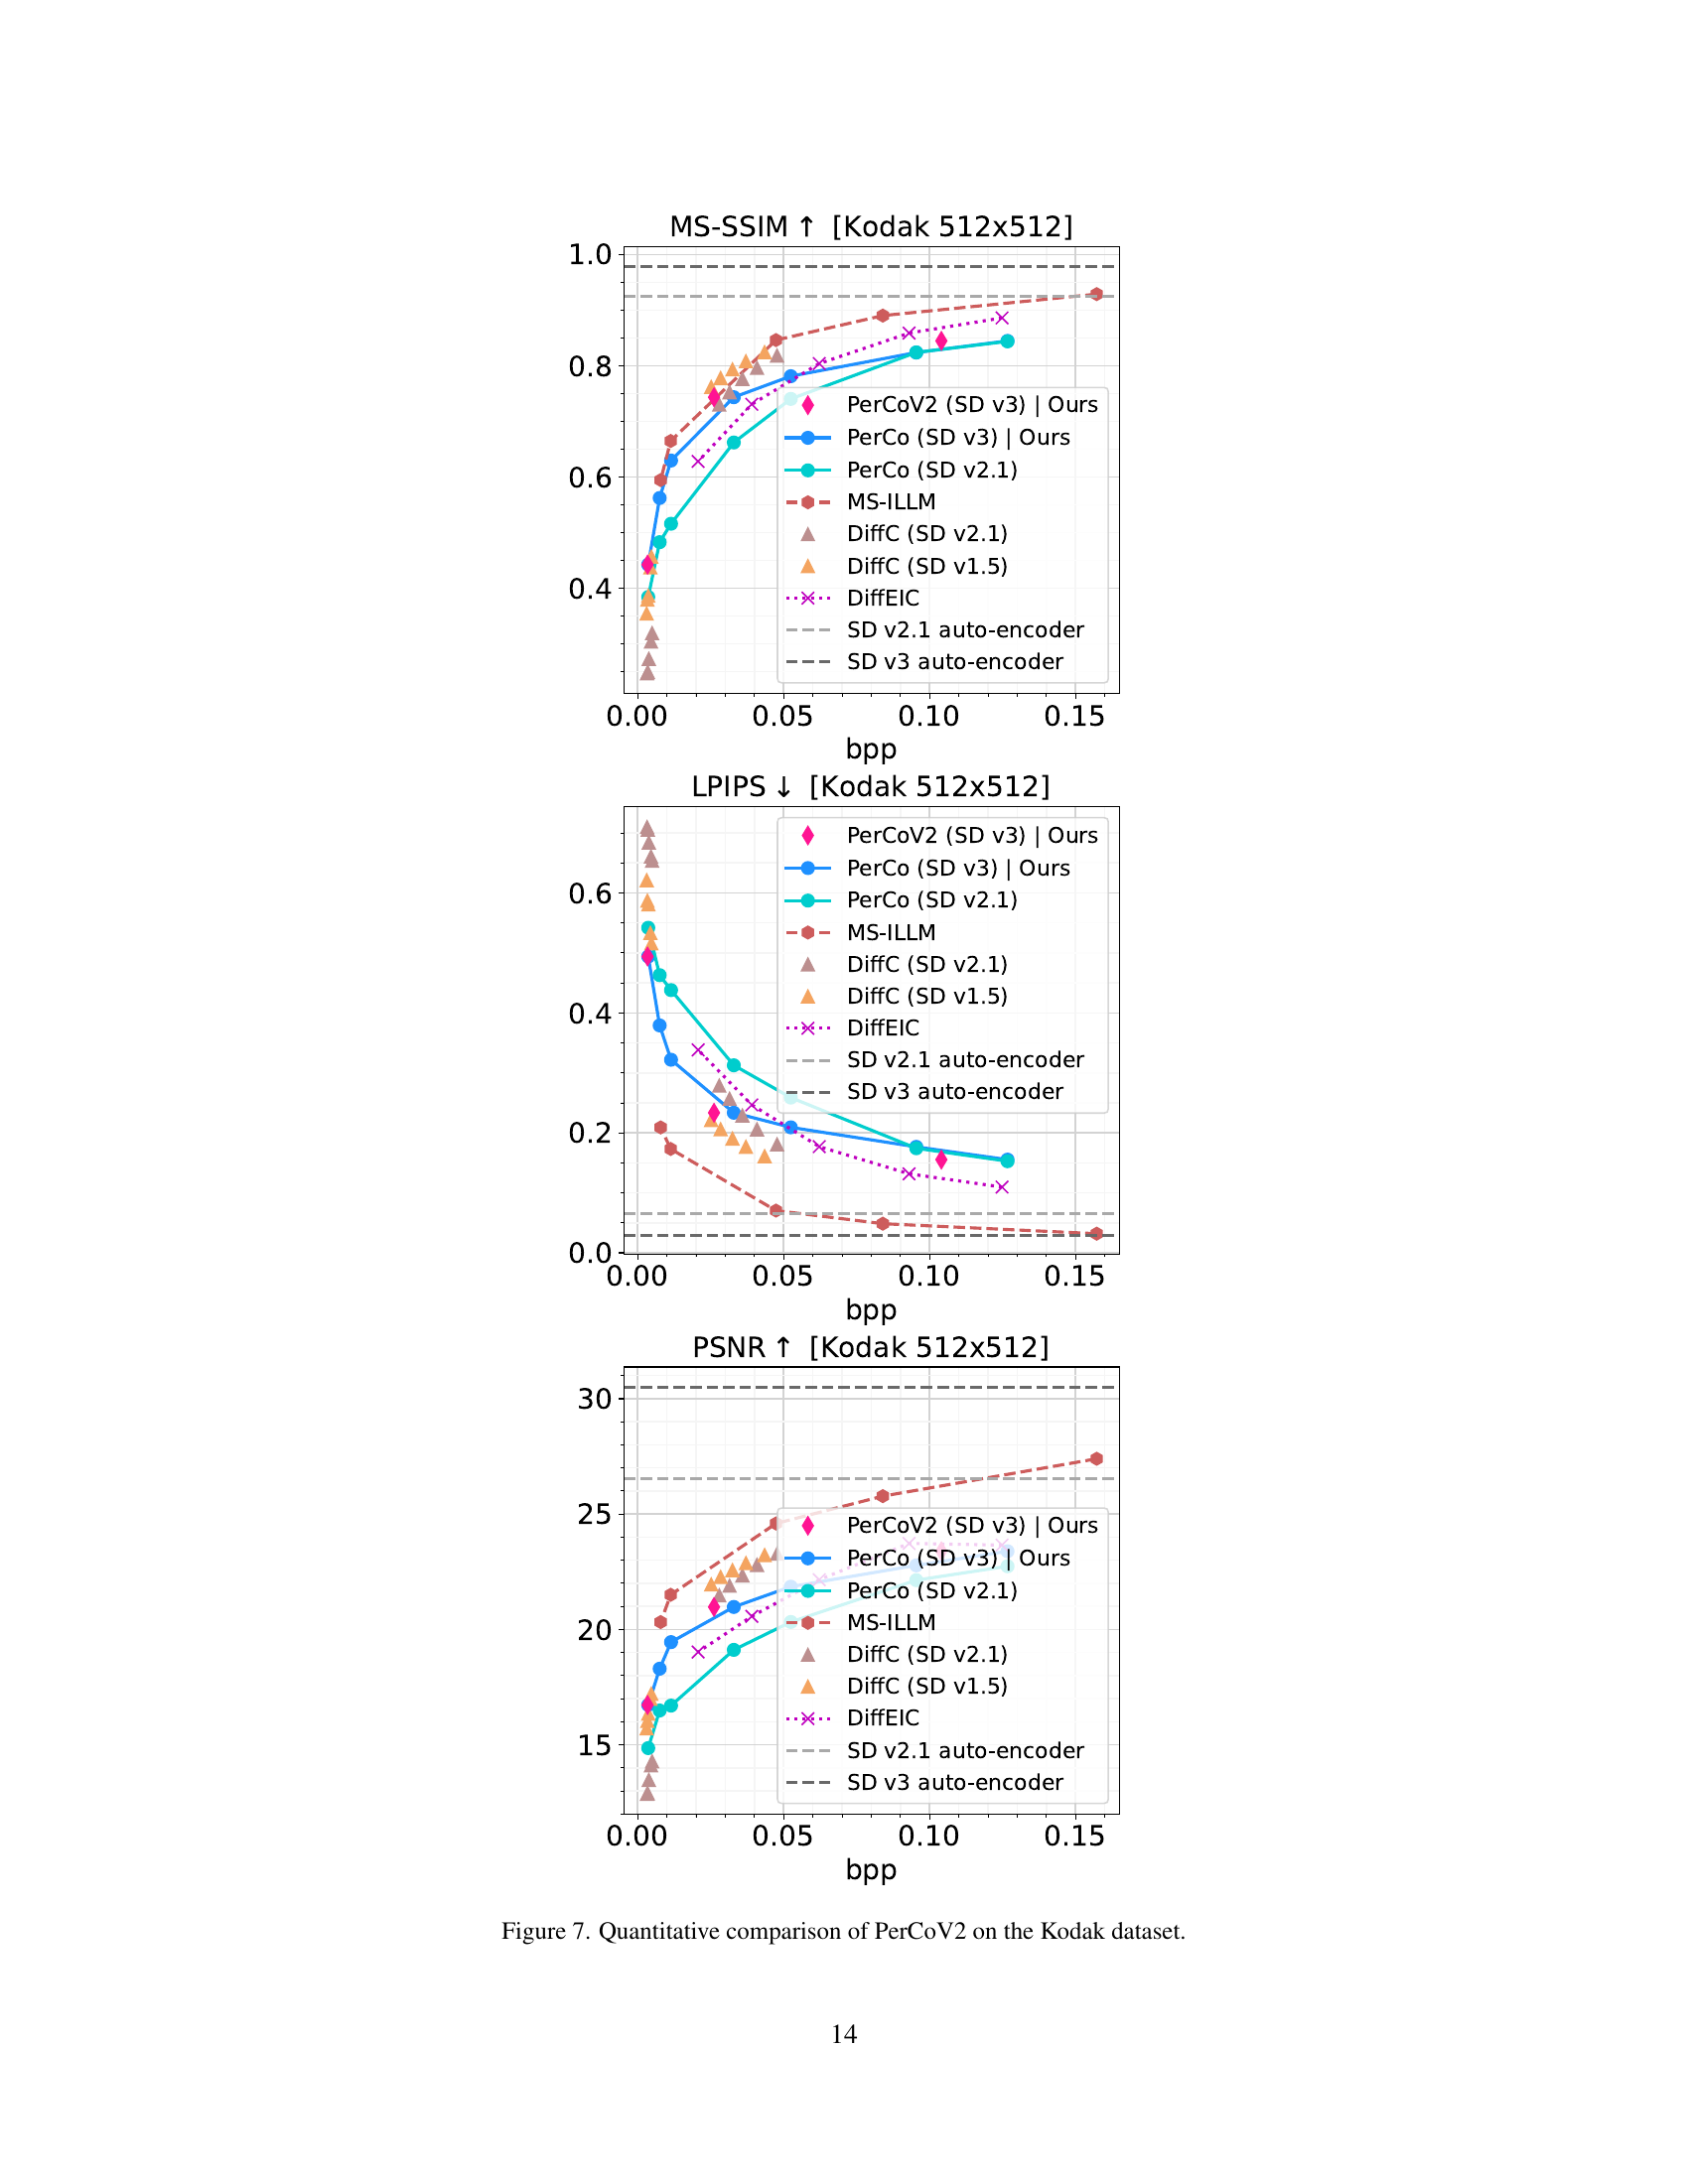
🔼 Figure 7 presents a quantitative comparison of the PerCoV2 image compression model’s performance on the Kodak image dataset. It displays the performance of PerCoV2 across various bit rates (bpp) using multiple metrics: Peak Signal-to-Noise Ratio (PSNR), which measures the difference between the original and compressed images; Learned Perceptual Image Patch Similarity (LPIPS), which assesses perceptual similarity; and Multi-Scale Structural Similarity Index (MS-SSIM), which considers the structural information in images at multiple scales. Also included are results for baselines such as PerCo (official and SD versions), MS-ILLM, and DiffC (SD v1.5 and v2.1) across the same metrics and bitrates. The figure allows for a visual comparison of PerCoV2’s performance relative to other state-of-the-art methods in terms of image fidelity and perceptual quality.
read the caption
Figure 7: Quantitative comparison of PerCoV2 on the Kodak dataset.

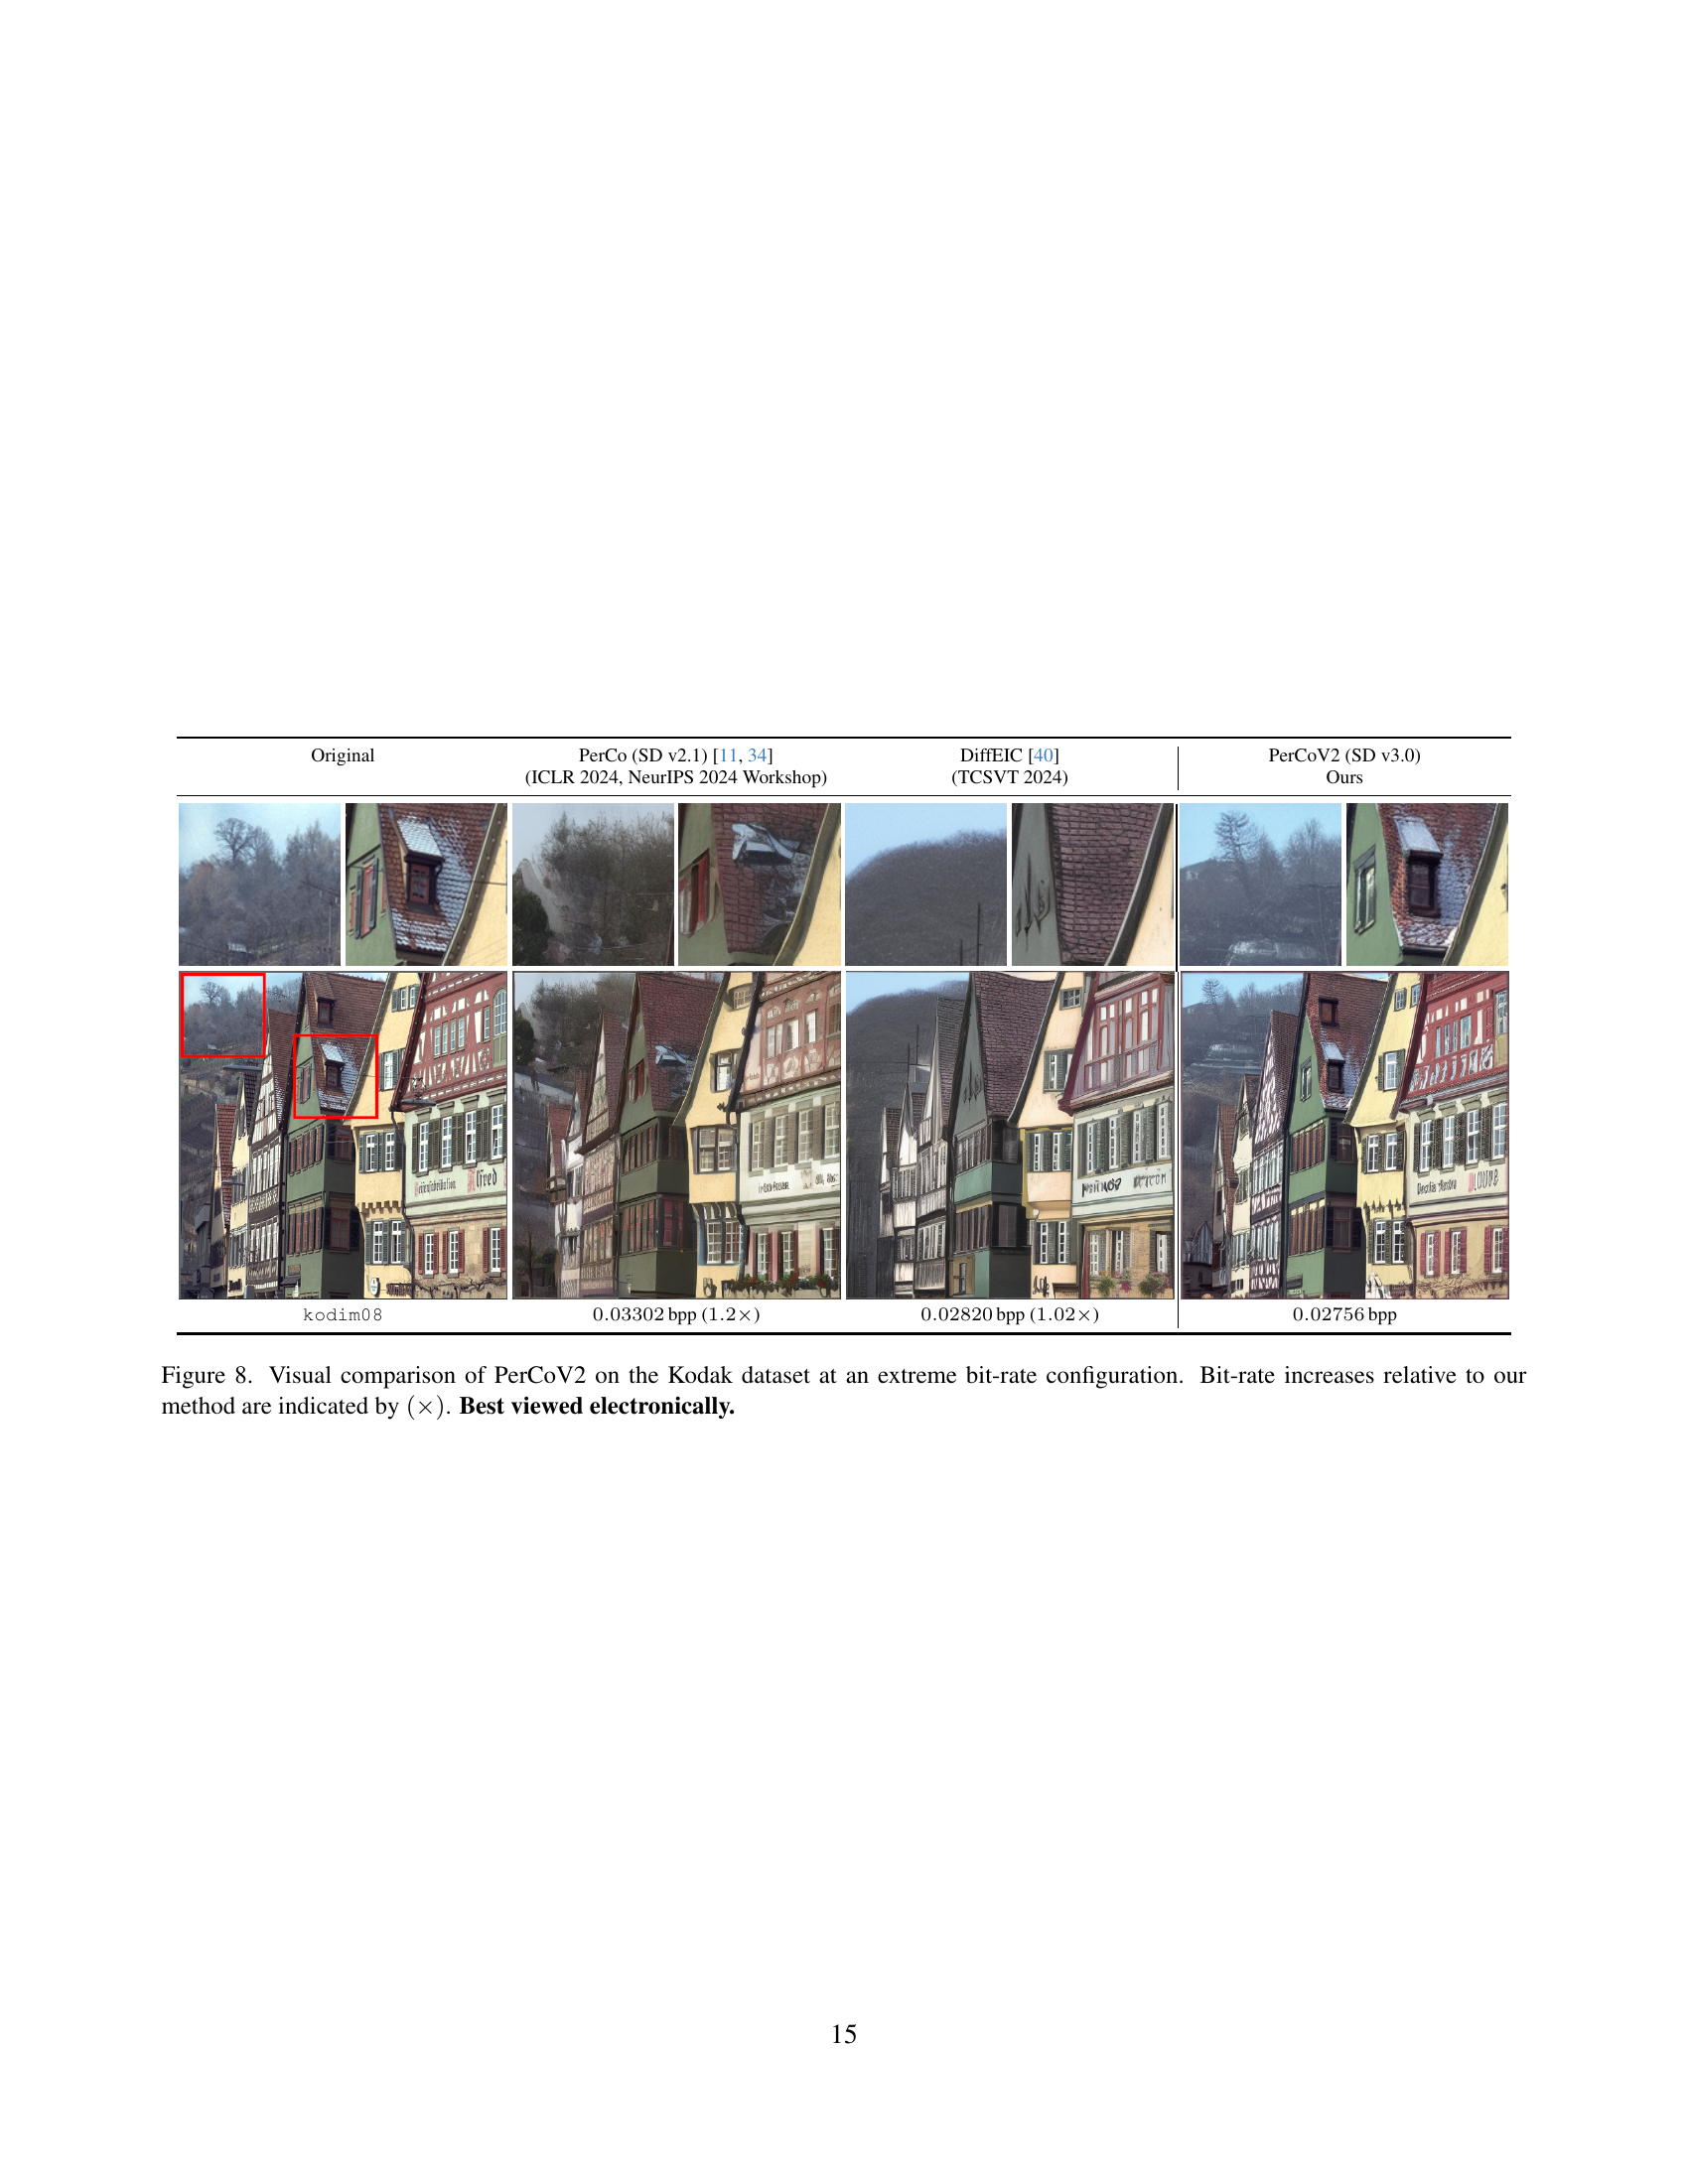
🔼 Figure 8 presents a visual comparison of image compression results using different methods on a subset of the Kodak image dataset. The comparison focuses on the extreme low-bit rate regime. The ‘Original’ images are shown alongside results from PerCo (SD v2.1) [11, 34], DiffEIC [40], and PerCoV2 (SD v3.0) [Ours]. Bit-rates are displayed, with values in parentheses showing the increase in bit-rate relative to PerCoV2. The figure highlights PerCoV2’s ability to achieve higher fidelity at lower bit rates. Best viewed electronically, due to subtle differences in image quality only apparent on screen.
read the caption
Figure 8: Visual comparison of PerCoV2 on the Kodak dataset at an extreme bit-rate configuration. Bit-rate increases relative to our method are indicated by (×)(\times)( × ). Best viewed electronically.

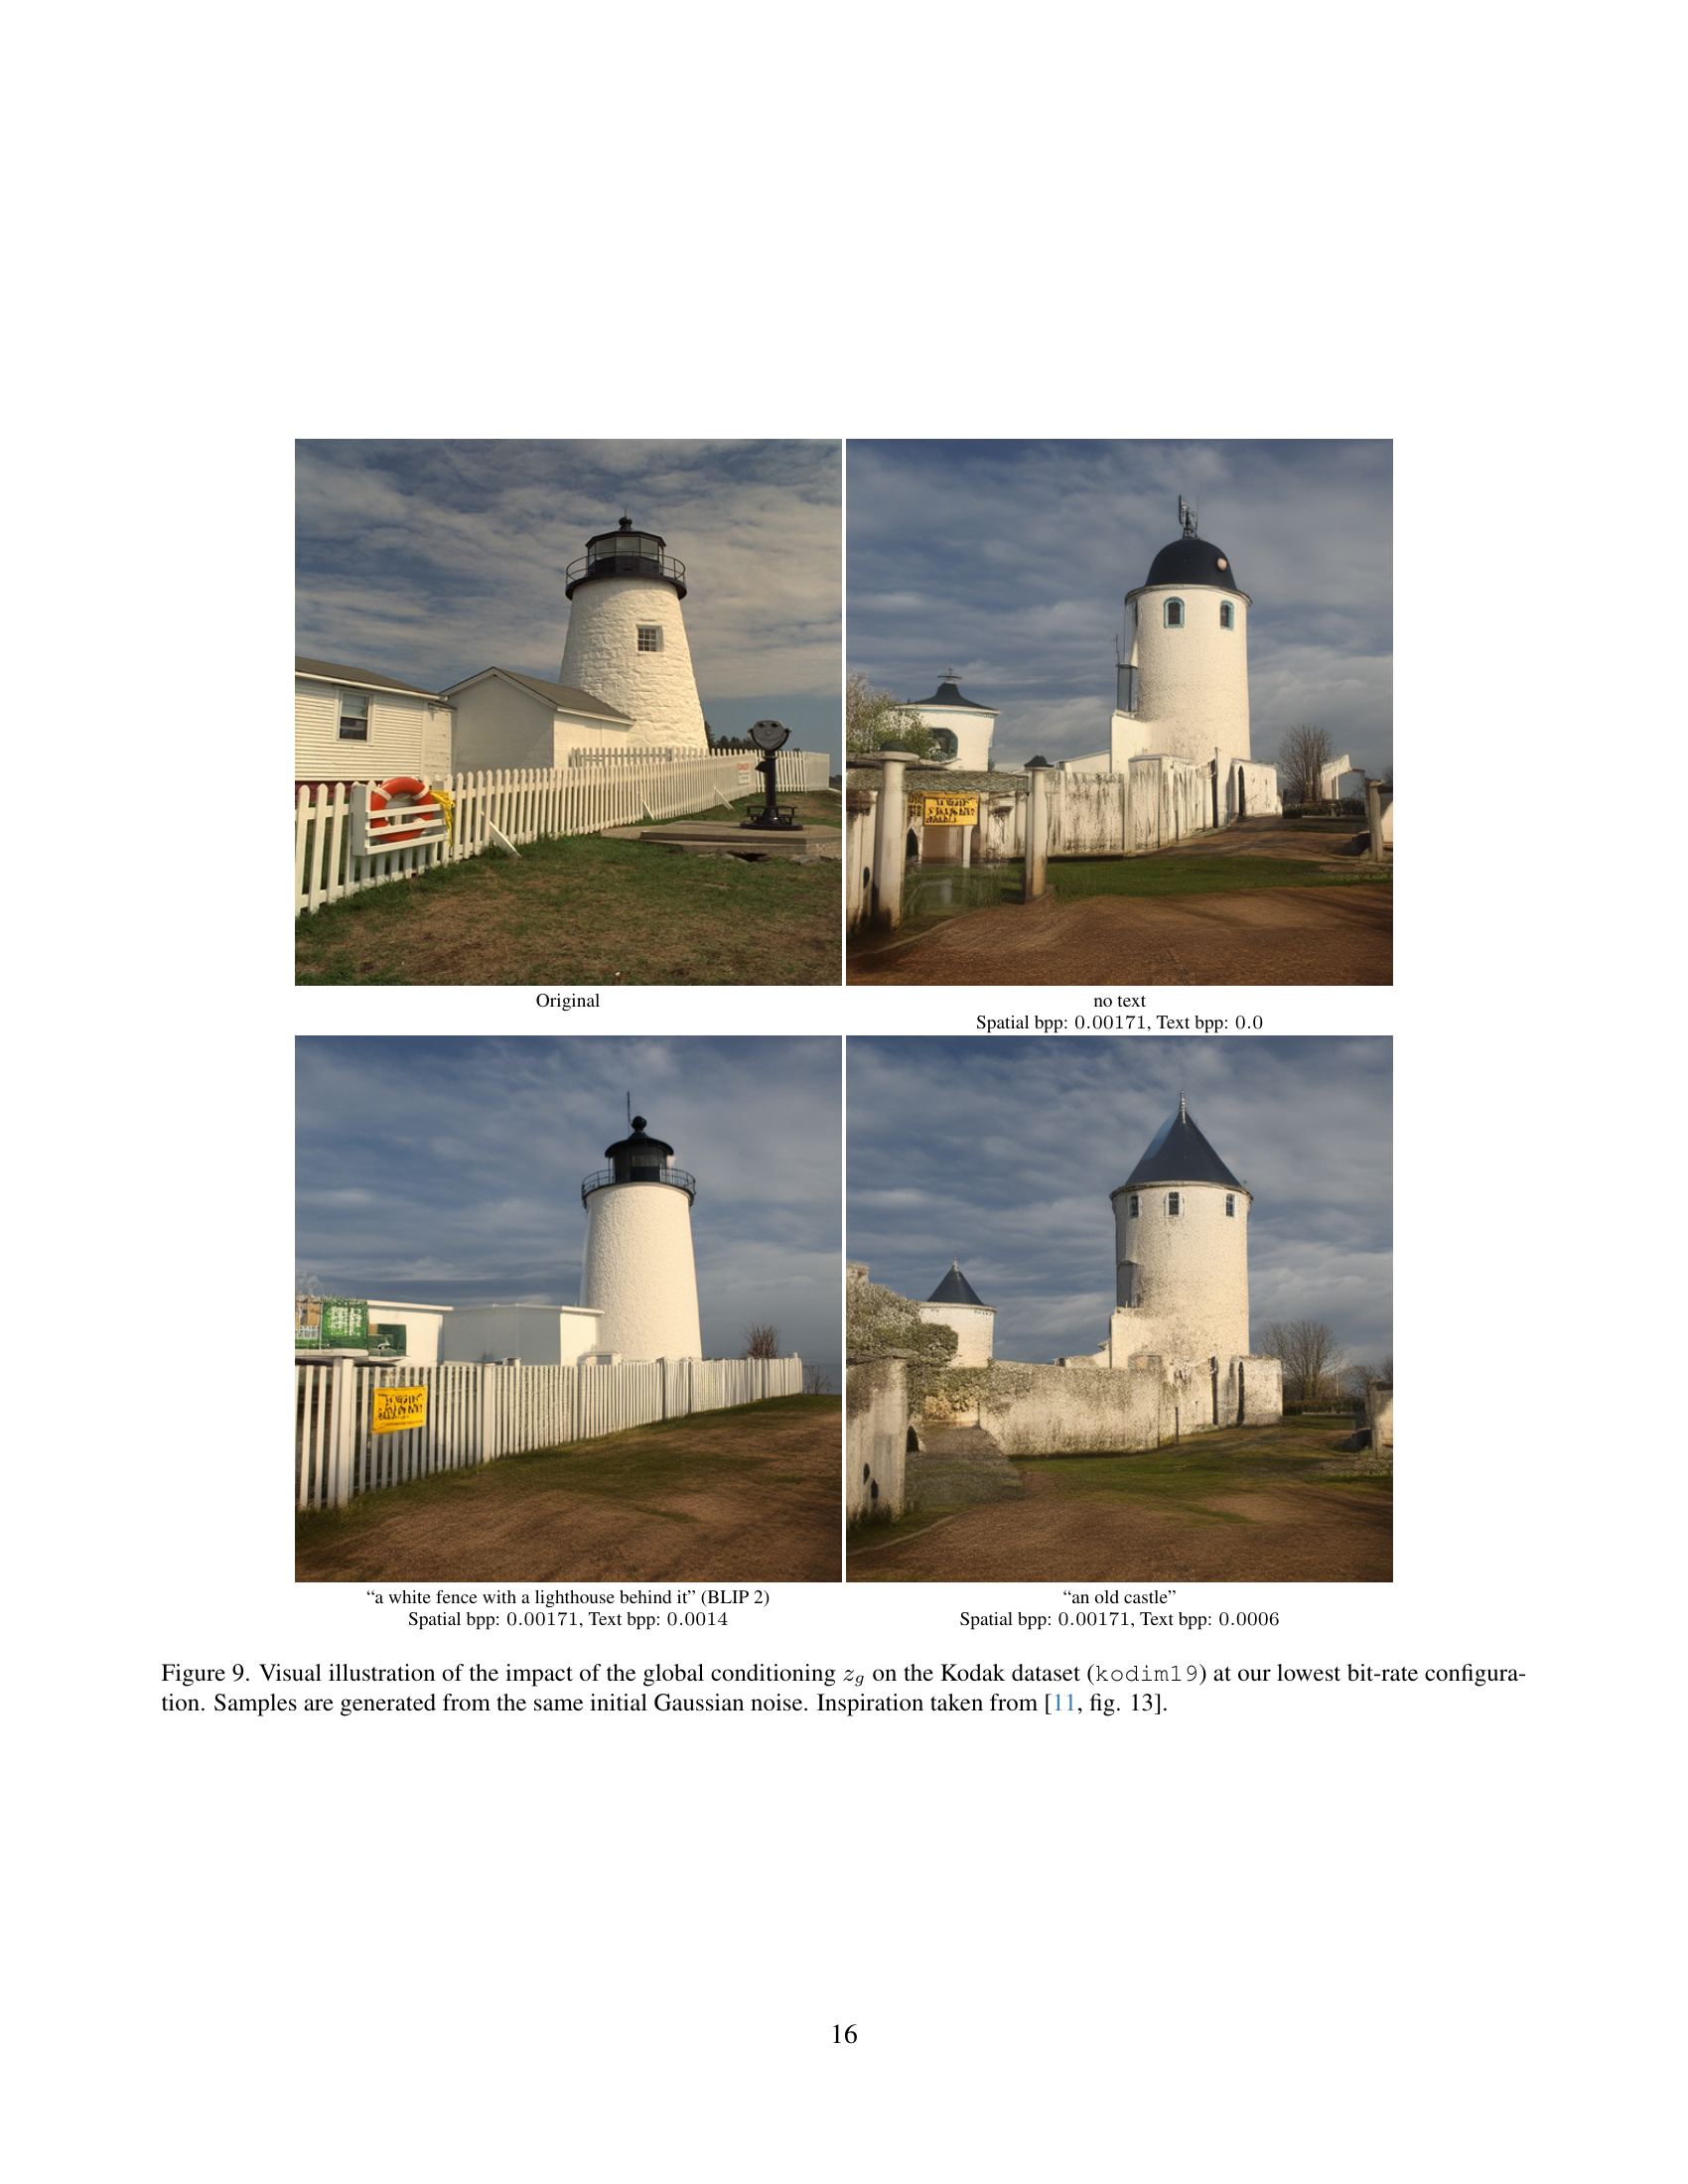
🔼 This figure demonstrates how the global conditioning, represented as zg, affects the image reconstruction in PerCoV2 at the lowest bit-rate. Two columns show reconstructions generated from the same initial Gaussian noise, but with different global conditioning. The left column uses only local features (zl), while the right column incorporates both local and global features. The difference highlights the contribution of global context to image quality at low bit-rates. This approach is inspired by similar work in [11, fig 13].
read the caption
Figure 9: Visual illustration of the impact of the global conditioning zgsubscript𝑧𝑔z_{g}italic_z start_POSTSUBSCRIPT italic_g end_POSTSUBSCRIPT on the Kodak dataset (kodim19) at our lowest bit-rate configuration. Samples are generated from the same initial Gaussian noise. Inspiration taken from [11, fig. 13].

🔼 This figure compares the image quality produced by PerCoV2 and DiffC, a competing method, at a very low bitrate. It shows example images of the Kodak dataset compressed using both methods, highlighting the visual differences in reconstruction quality. The goal is to demonstrate PerCoV2’s improved image fidelity even at extremely low bitrates, where bandwidth and storage are severely limited.
read the caption
Figure 10: Additional comparison with DiffC at ultra-low bit-rate setting.
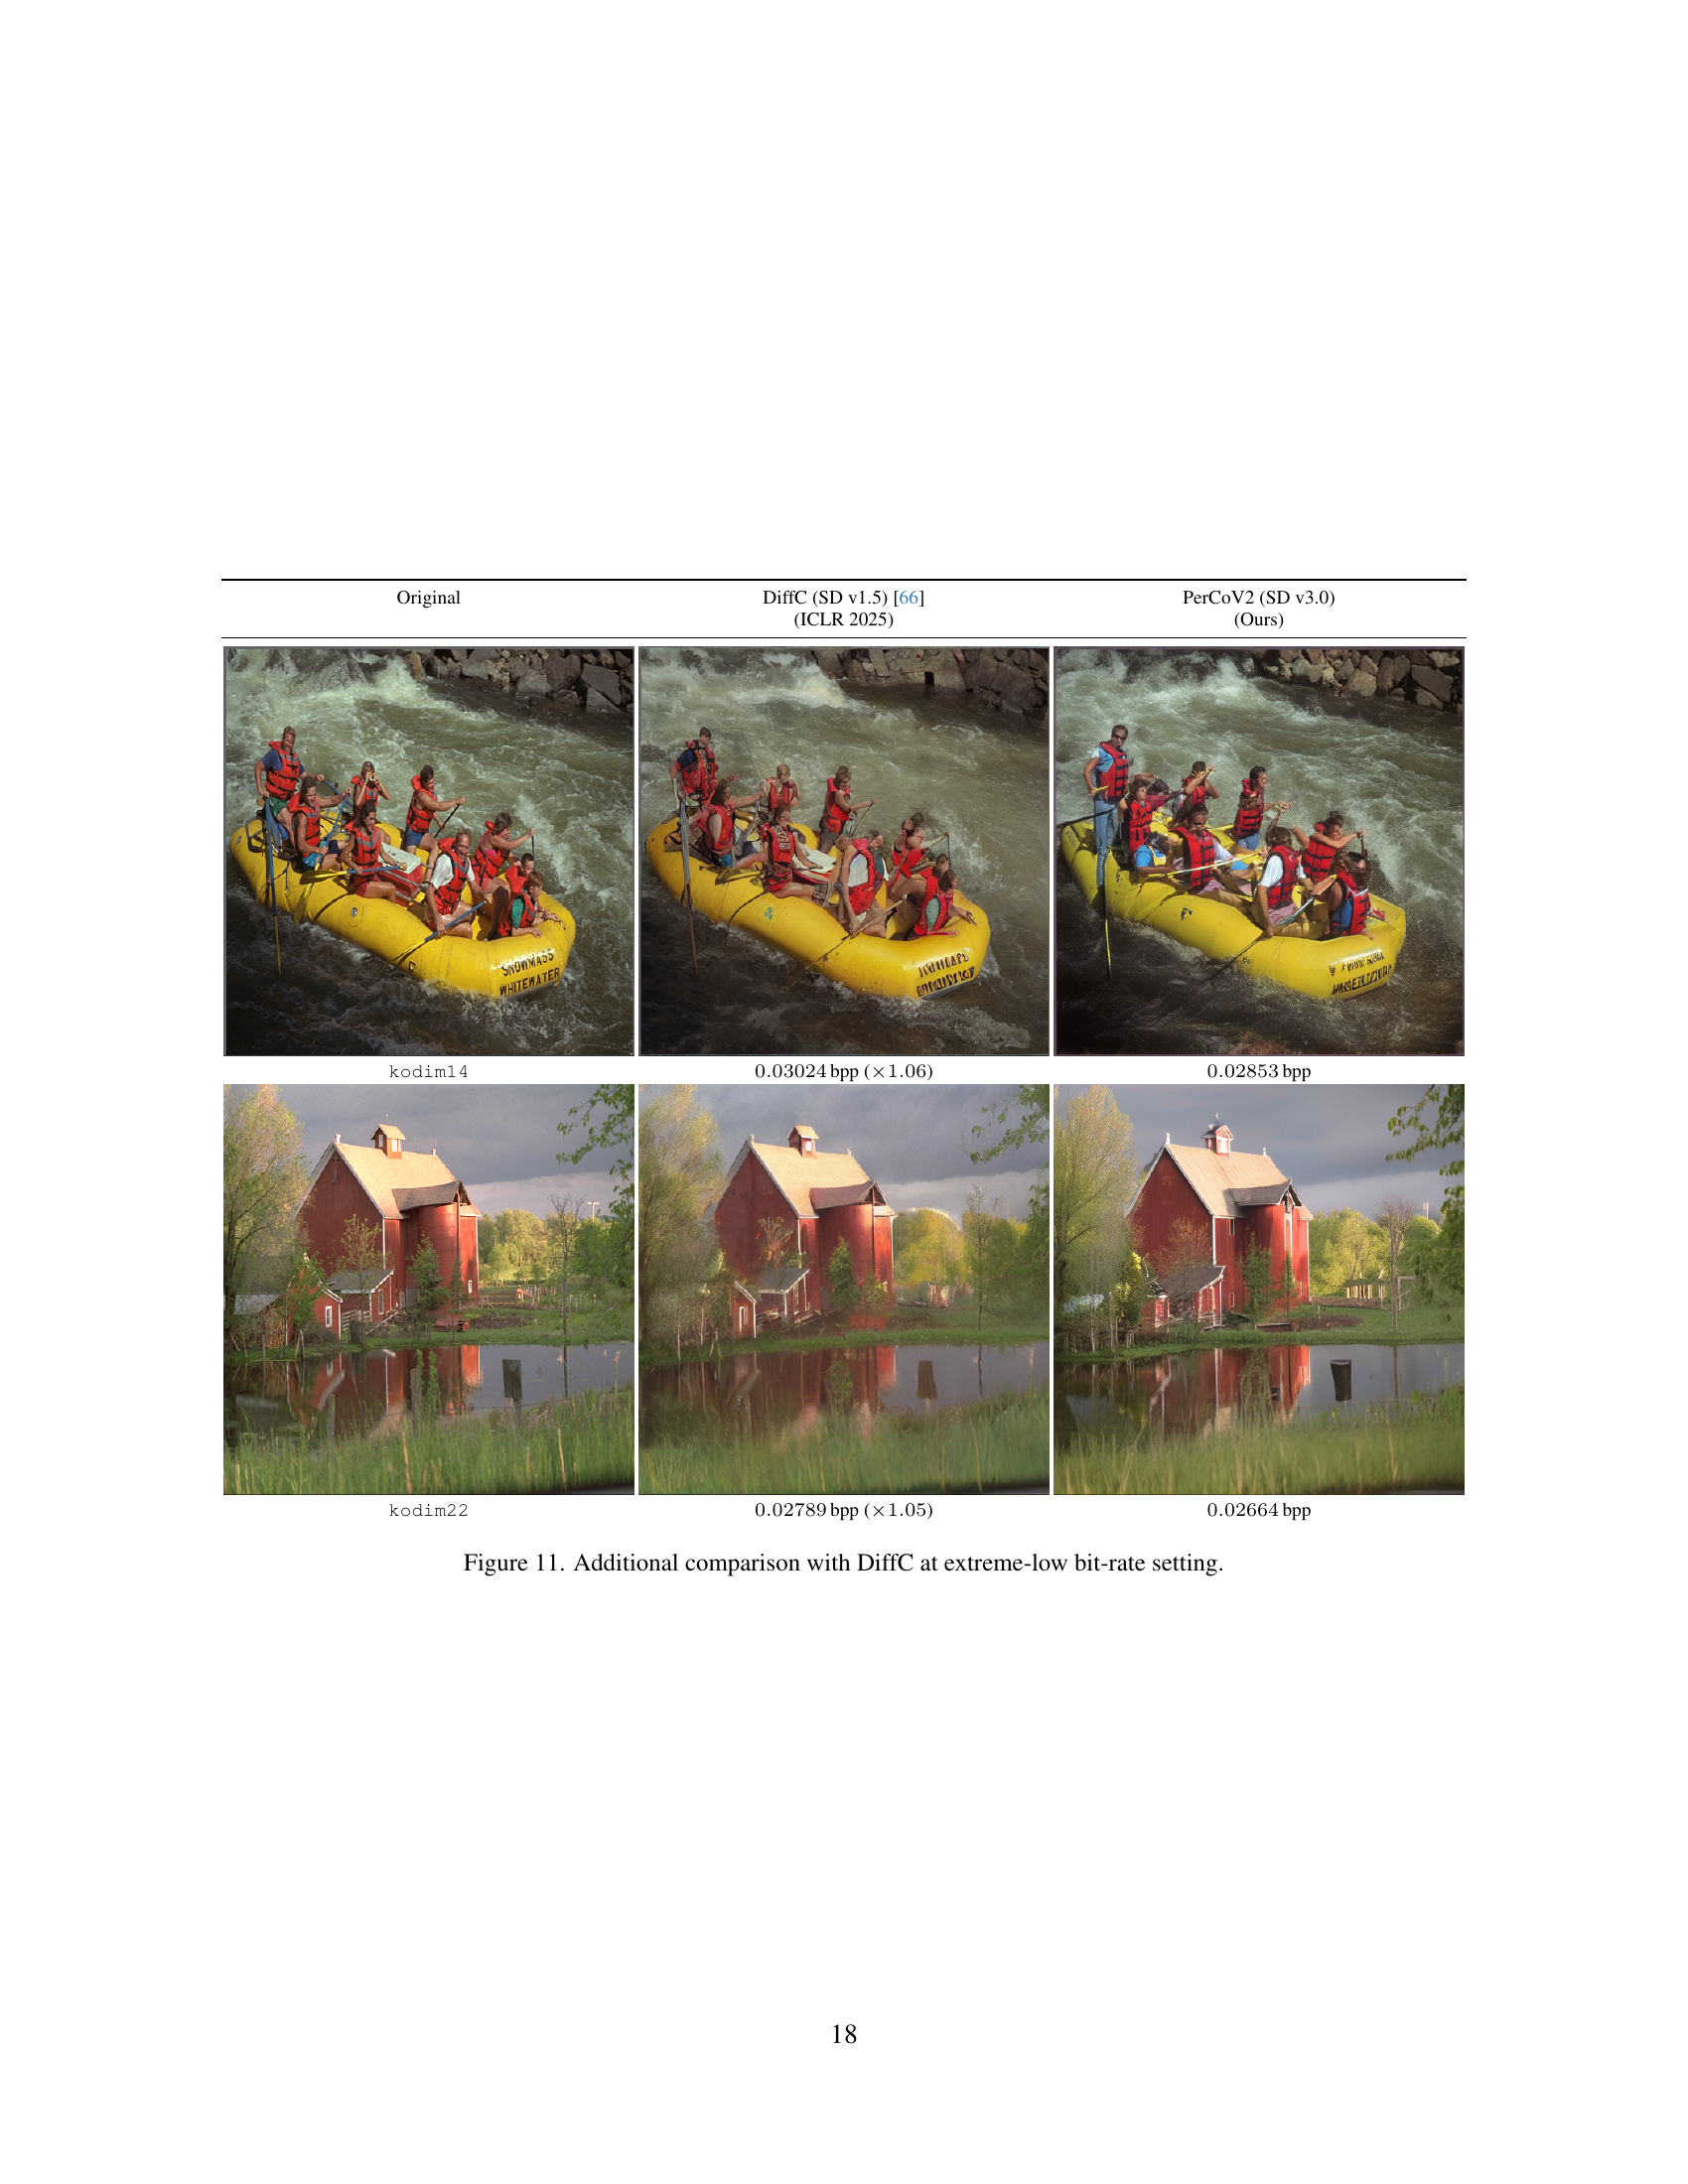
🔼 Figure 11 provides a visual comparison of PerCoV2 and DiffC, a competing image compression method, at extreme-low bit rates. It shows example images from the Kodak dataset (kodim14 and kodim22) alongside their reconstructions generated by each method. The goal is to showcase PerCoV2’s ability to reconstruct higher-fidelity images than DiffC at these challenging, very low bit rates. Bit rates are explicitly shown for each image, highlighting PerCoV2’s compression efficiency.
read the caption
Figure 11: Additional comparison with DiffC at extreme-low bit-rate setting.

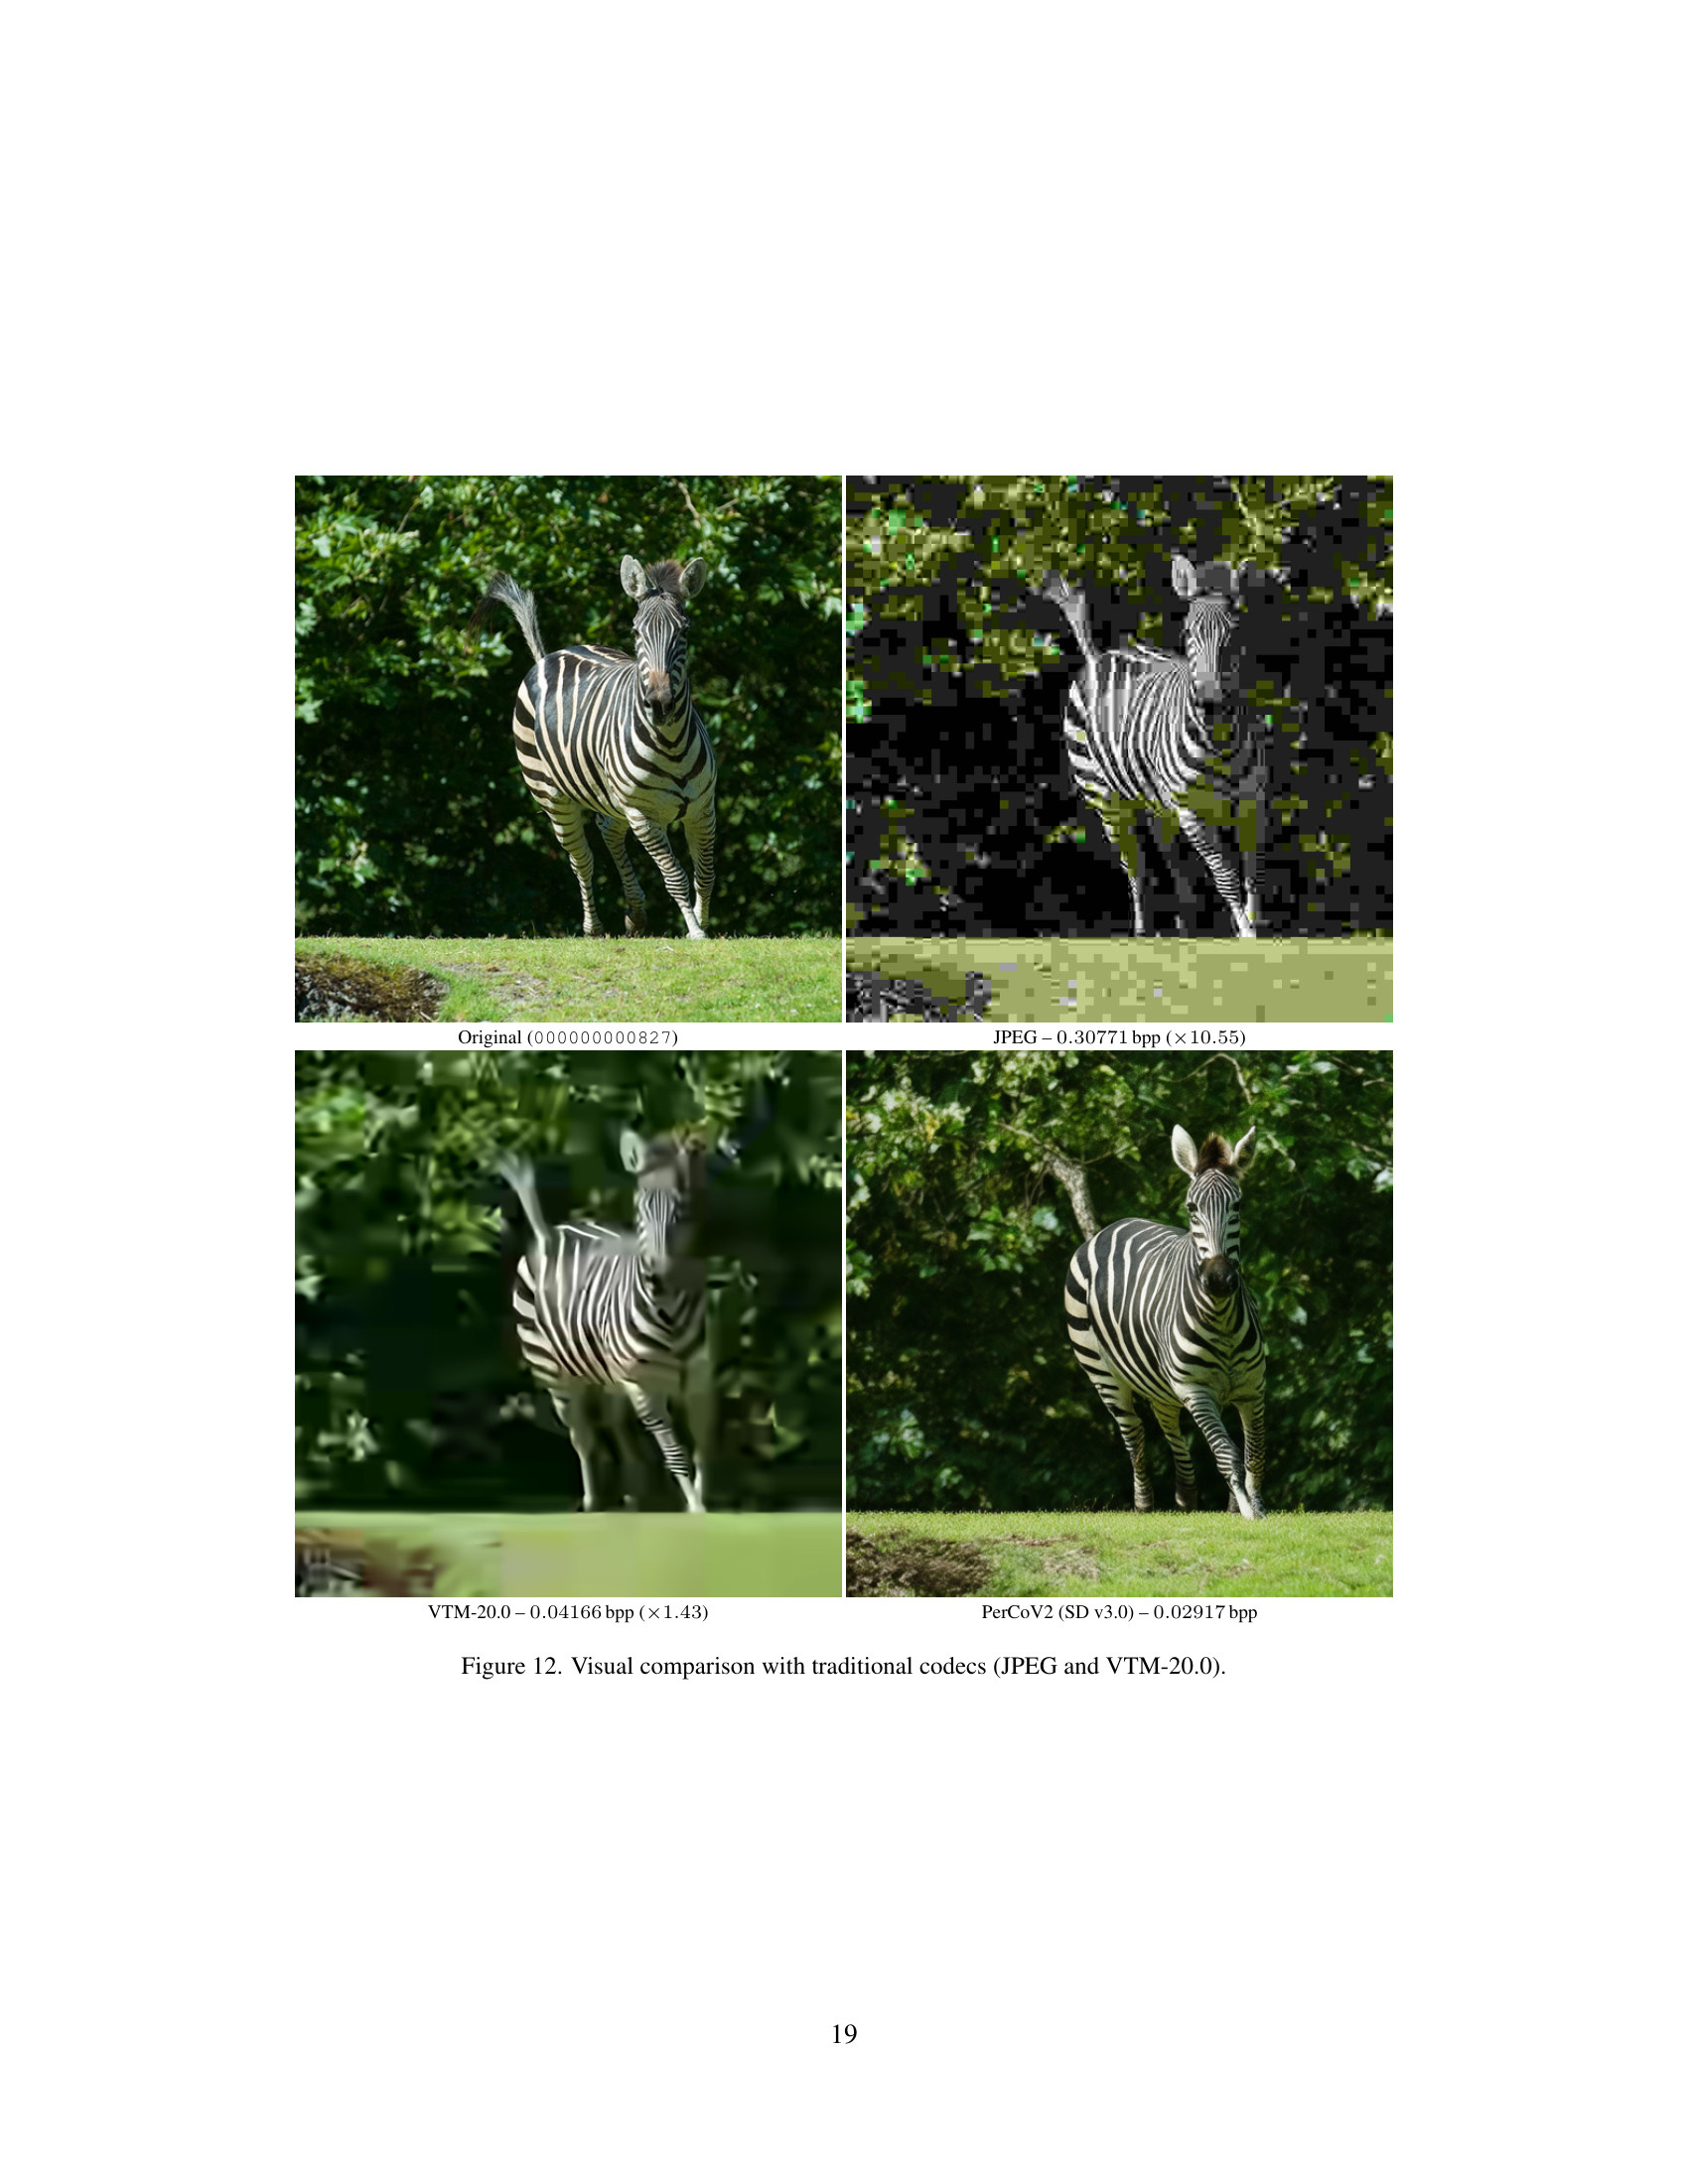
🔼 This figure compares the image compression results of PerCoV2 against JPEG and VTM-20.0, which are traditional codecs. It visually showcases how PerCoV2 performs in reconstructing the image compared to the widely used standard codecs, demonstrating its image quality at a specific bitrate.
read the caption
Figure 12: Visual comparison with traditional codecs (JPEG and VTM-20.0).

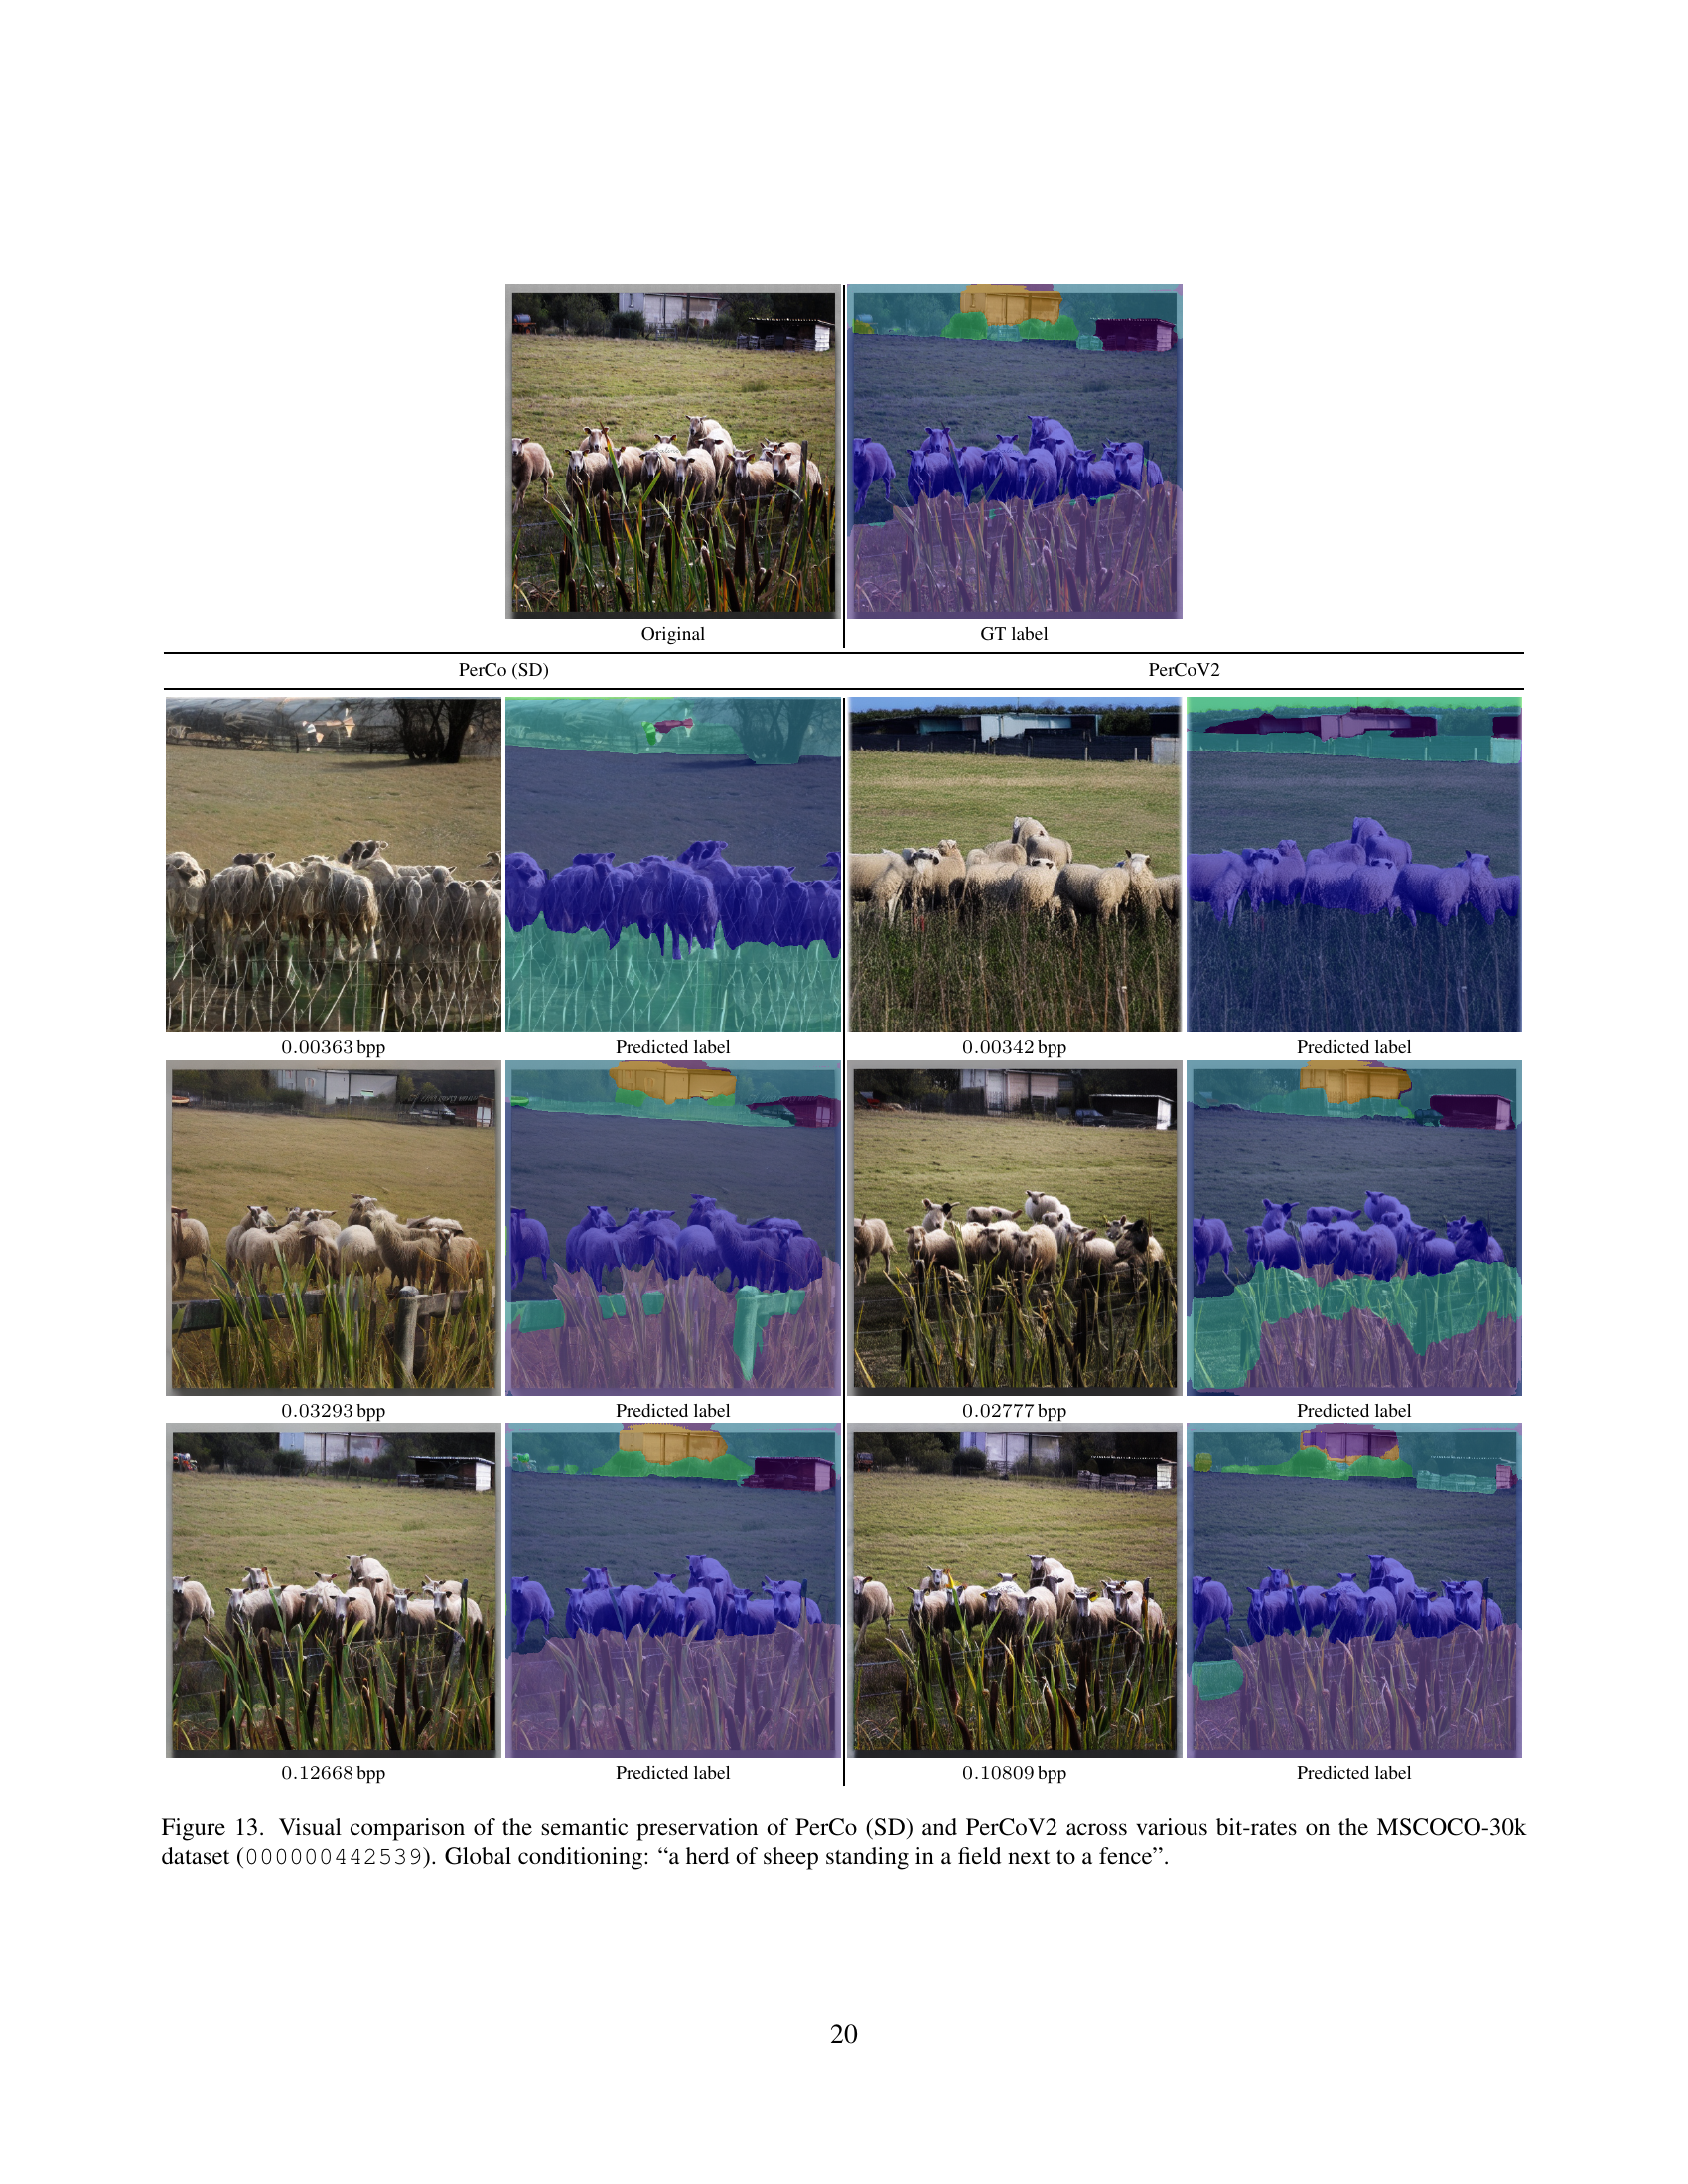
🔼 This figure compares the semantic preservation capabilities of PerCo (SD) and PerCoV2 across different bitrates. The image used is from the MSCOCO-30k dataset (image ID: 000000442539). The models are given the same global caption: “a herd of sheep standing in a field next to a fence”. The comparison shows how well each model maintains the accurate representation of the scene’s semantic content, such as the number and arrangement of sheep and the fence, as the bitrate and compression level decrease. This illustrates the impact of bitrate reduction on the fidelity of semantic information.
read the caption
Figure 13: Visual comparison of the semantic preservation of PerCo (SD) and PerCoV2 across various bit-rates on the MSCOCO-30k dataset (000000442539). Global conditioning: “a herd of sheep standing in a field next to a fence”.

🔼 This figure illustrates the architecture of the Implicit Hierarchical Visual Autoregressive model (VAR) used in PerCoV2 for entropy modeling. It shows how single-scale tokens are processed through a VAR model to generate predicted tokens at multiple scales. The process is implicit because the model doesn’t explicitly generate a full hierarchical representation of the image before prediction, rather, it implicitly models the image’s hierarchical structure during the prediction process itself. The ‘[S]’ symbol indicates a start token. The colors of the tokens represent their different contextual information.
read the caption
Figure 14: Implicit Hierarchical VAR (Ours).

🔼 This figure illustrates the checkerboard masking schedule used in the Hierarchical Masked Image Modeling method. The checkerboard pattern shows which parts of the image are masked (greyed out) and which parts are used for prediction (colored). The different image patches represent different stages or resolutions in the multi-scale image modeling process. The bit rates shown (e.g., 0.00302 bpp) indicate the compression efficiency at each masking configuration. The various configurations demonstrate the effect of the amount of masking on the final compression result.
read the caption
Figure 15: Checkerboard masking schedule [23].

🔼 Figure 16 illustrates the quincunx masking schedule used in the PerCoV2 model for hierarchical masked image modeling. The quincunx pattern masks image tokens in a staggered arrangement, making it different from the checkerboard pattern (which is a more regular grid-like masking). The varying numbers of masked tokens (4, 8, 16, 32, 64) at different bit rates (0.00217 bpp, 0.00229 bpp, 0.00253 bpp, 0.00305 bpp, 0.00385 bpp respectively) showcases how the model handles different levels of information loss during compression. This figure provides a visual representation of how the quincunx masking pattern is applied in the image and its impact on the bit-rate.
read the caption
Figure 16: Quincunx masking schedule [17].

🔼 Figure 17 shows the QLDS (Quasi-lexicographical Dynamic Scheduling) masking schedule used in the PerCoV2 model for hierarchical masked image modeling. The image shows a visual representation of the masking process at different stages. Each sub-image displays how a portion of the image is masked (greyed out) while the model predicts the values of those masked pixels based on the visible parts. Different stages show progressively more revealed image sections. The QLDS schedule is a specific algorithm for gradually unveiling masked regions within the image, optimizing the balance between prediction difficulty and overall decoding efficiency in the autoregressive process of the model.
read the caption
Figure 17: QLDS masking schedule [45].

🔼 Figure 18 shows the implicit hierarchical visual autoregressive (VAR) model’s masking schedule. Unlike explicit hierarchical methods which have separate, distinct stages, this approach integrates the multi-scale token maps implicitly. The figure visually represents the masking process, displaying how tokens at different scales are predicted sequentially in a hierarchical manner within the VAR framework. Each step in the process shows the tokens that are masked and subsequently predicted, contributing to the overall image reconstruction.
read the caption
Figure 18: Implicit VAR-based masking schedule (Ours).
Full paper#