TL;DR#
Vision-Language Models have shown promise in perception, but reasoning is limited by data scarcity. Existing datasets are restricted by focusing on specific data, relying on synthetic data, or covering elementary knowledge. To solve this issue, VisualWebInstruct introduces a method for creating diverse, high-quality datasets spanning various disciplines like math and chemistry. It employs Google Image Search, gathers HTML from 700K+ sources, and synthesizes 900K question-answer pairs.
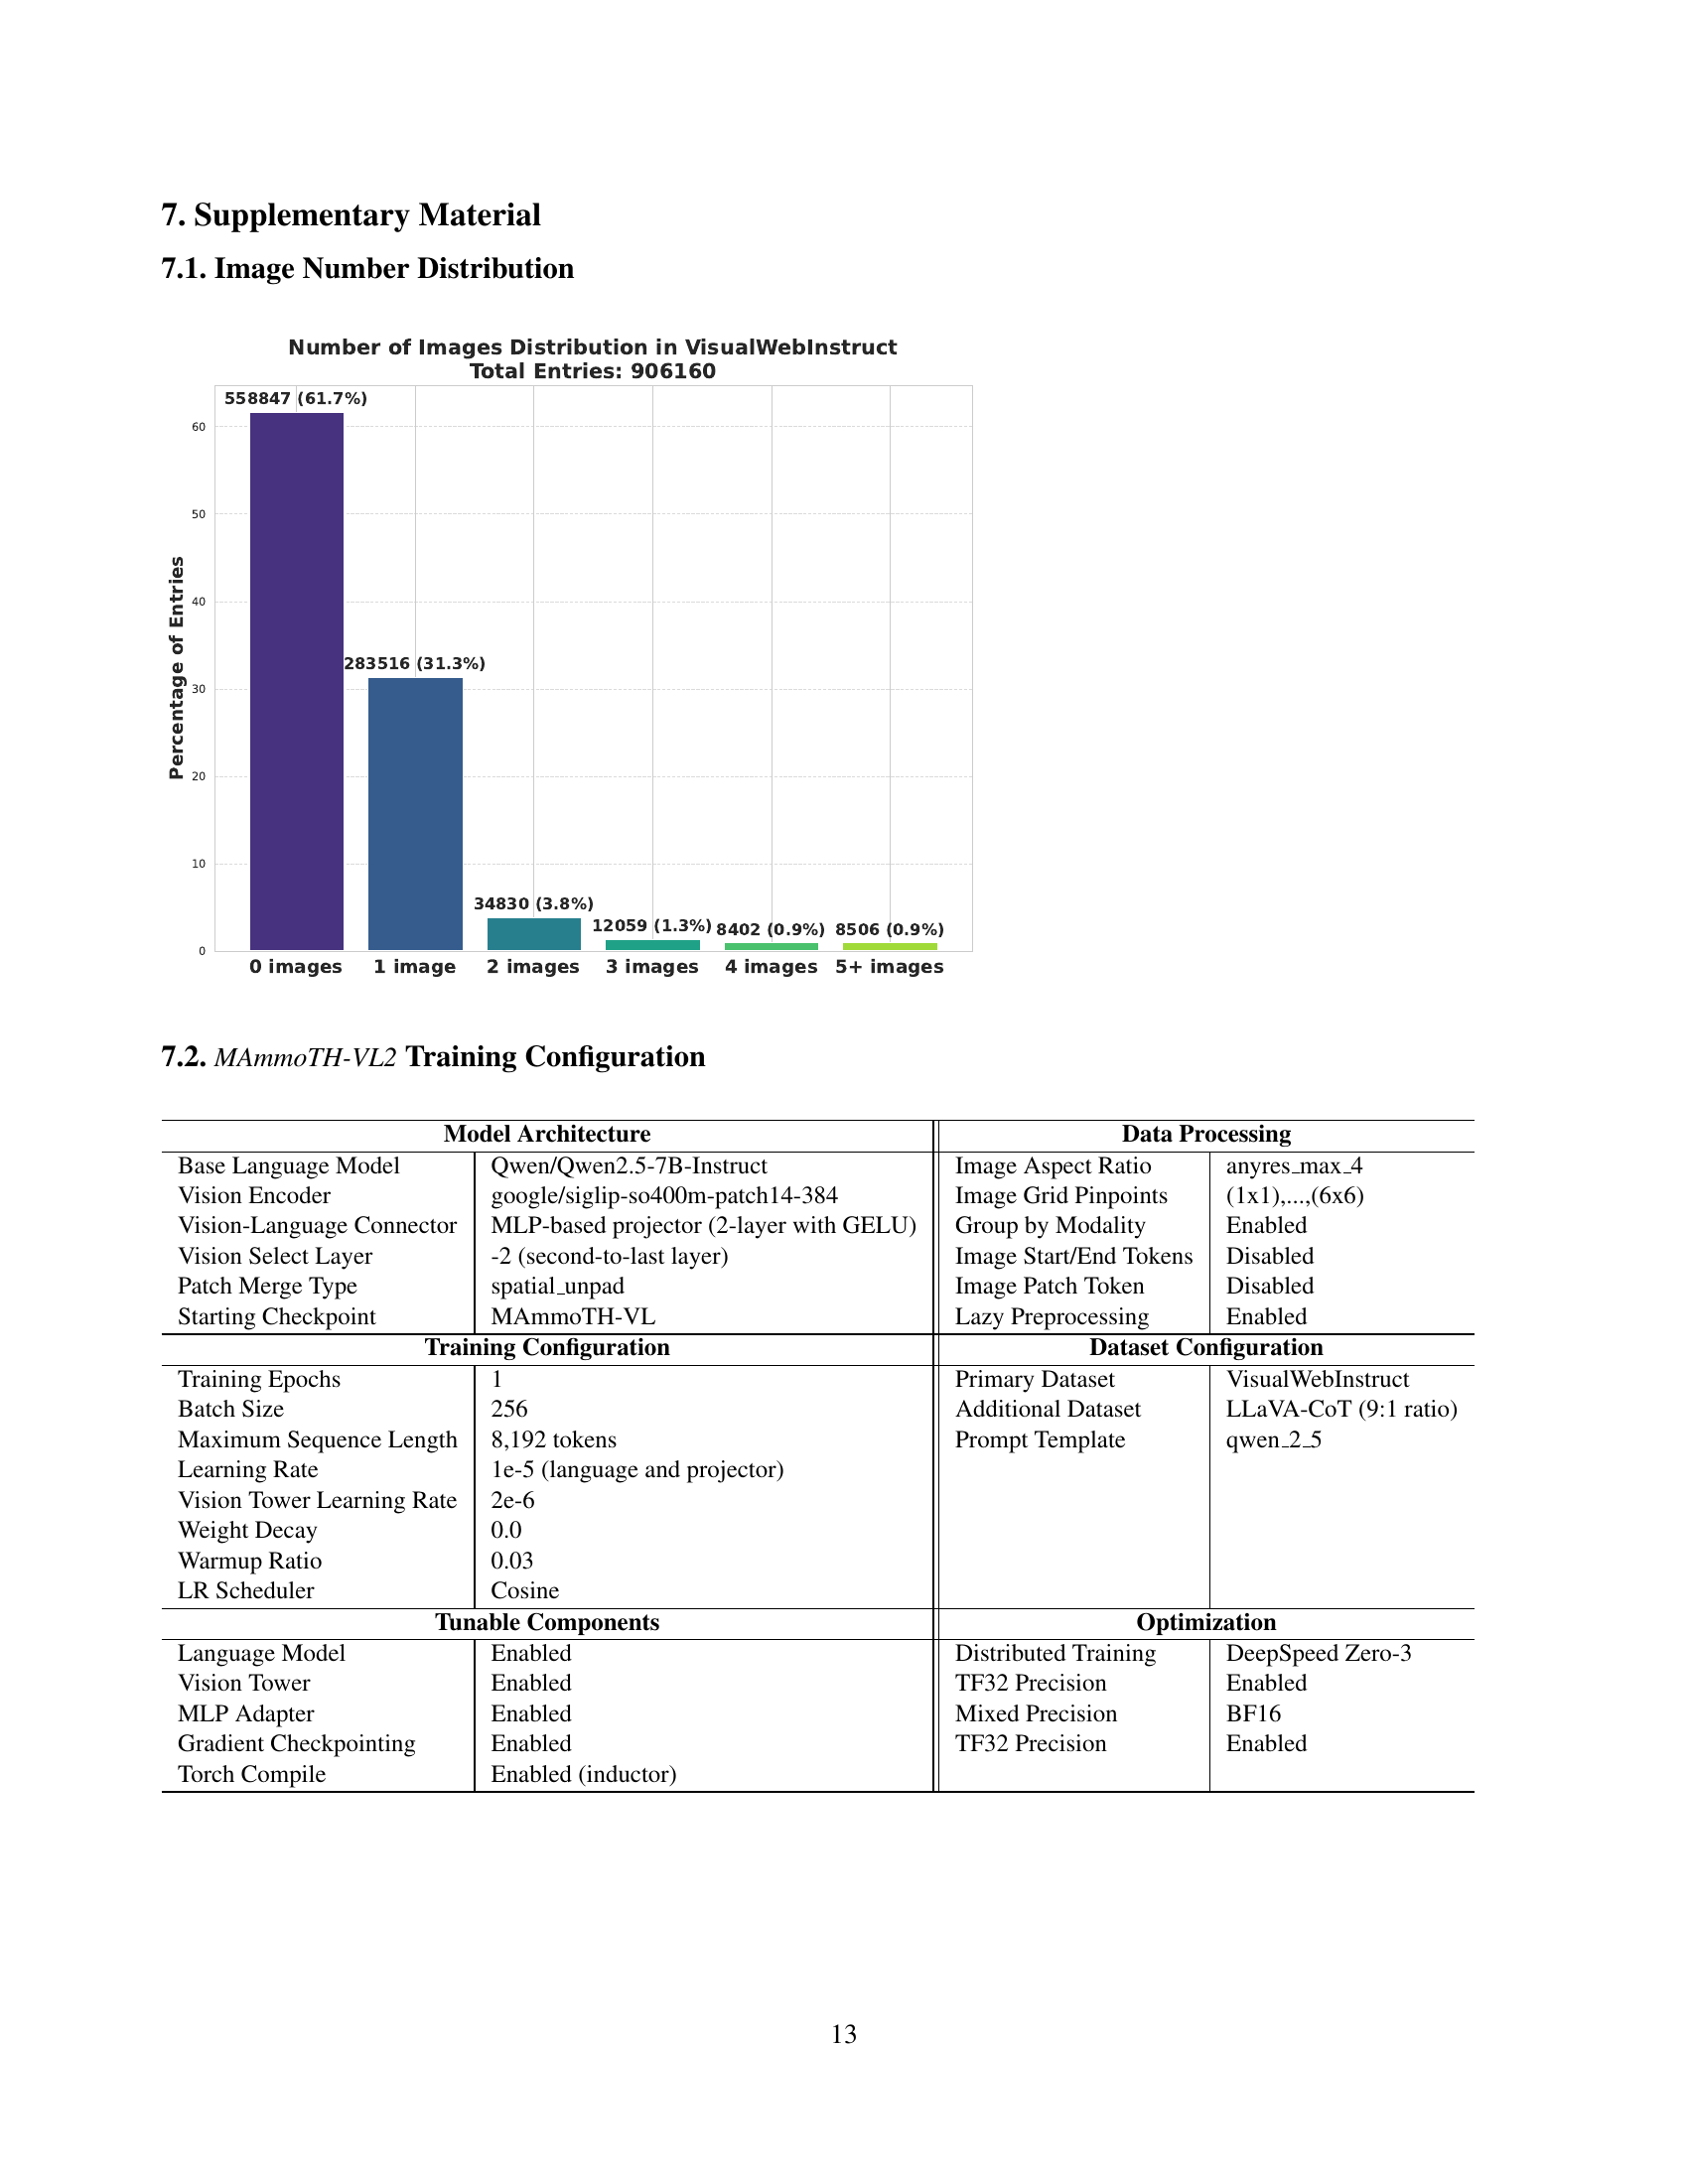
The study presents VisualWebInstruct, which uses search engines to create diverse datasets. Starting with 30,000 images, similar images are found via Google. HTML is collected and processed to build a dataset of 900K question-answer pairs, 40% visual. Fine-tuning models show gains, 10-20% from Llava-OV-mid and 5% from MAmmoTH-VL. MAmmoTH-VL2 is state-of-the-art, highlighting data’s impact on complex reasoning for VLMs.
Key Takeaways#
Why does it matter?#
This paper is important because it addresses the scarcity of high-quality, diverse data for training VLMs to enhance their reasoning abilities. By introducing a novel method for generating multimodal instruction data, it paves the way for creating more capable VLMs that can tackle complex real-world tasks and opens new avenues for research in multimodal learning and reasoning.
Visual Insights#
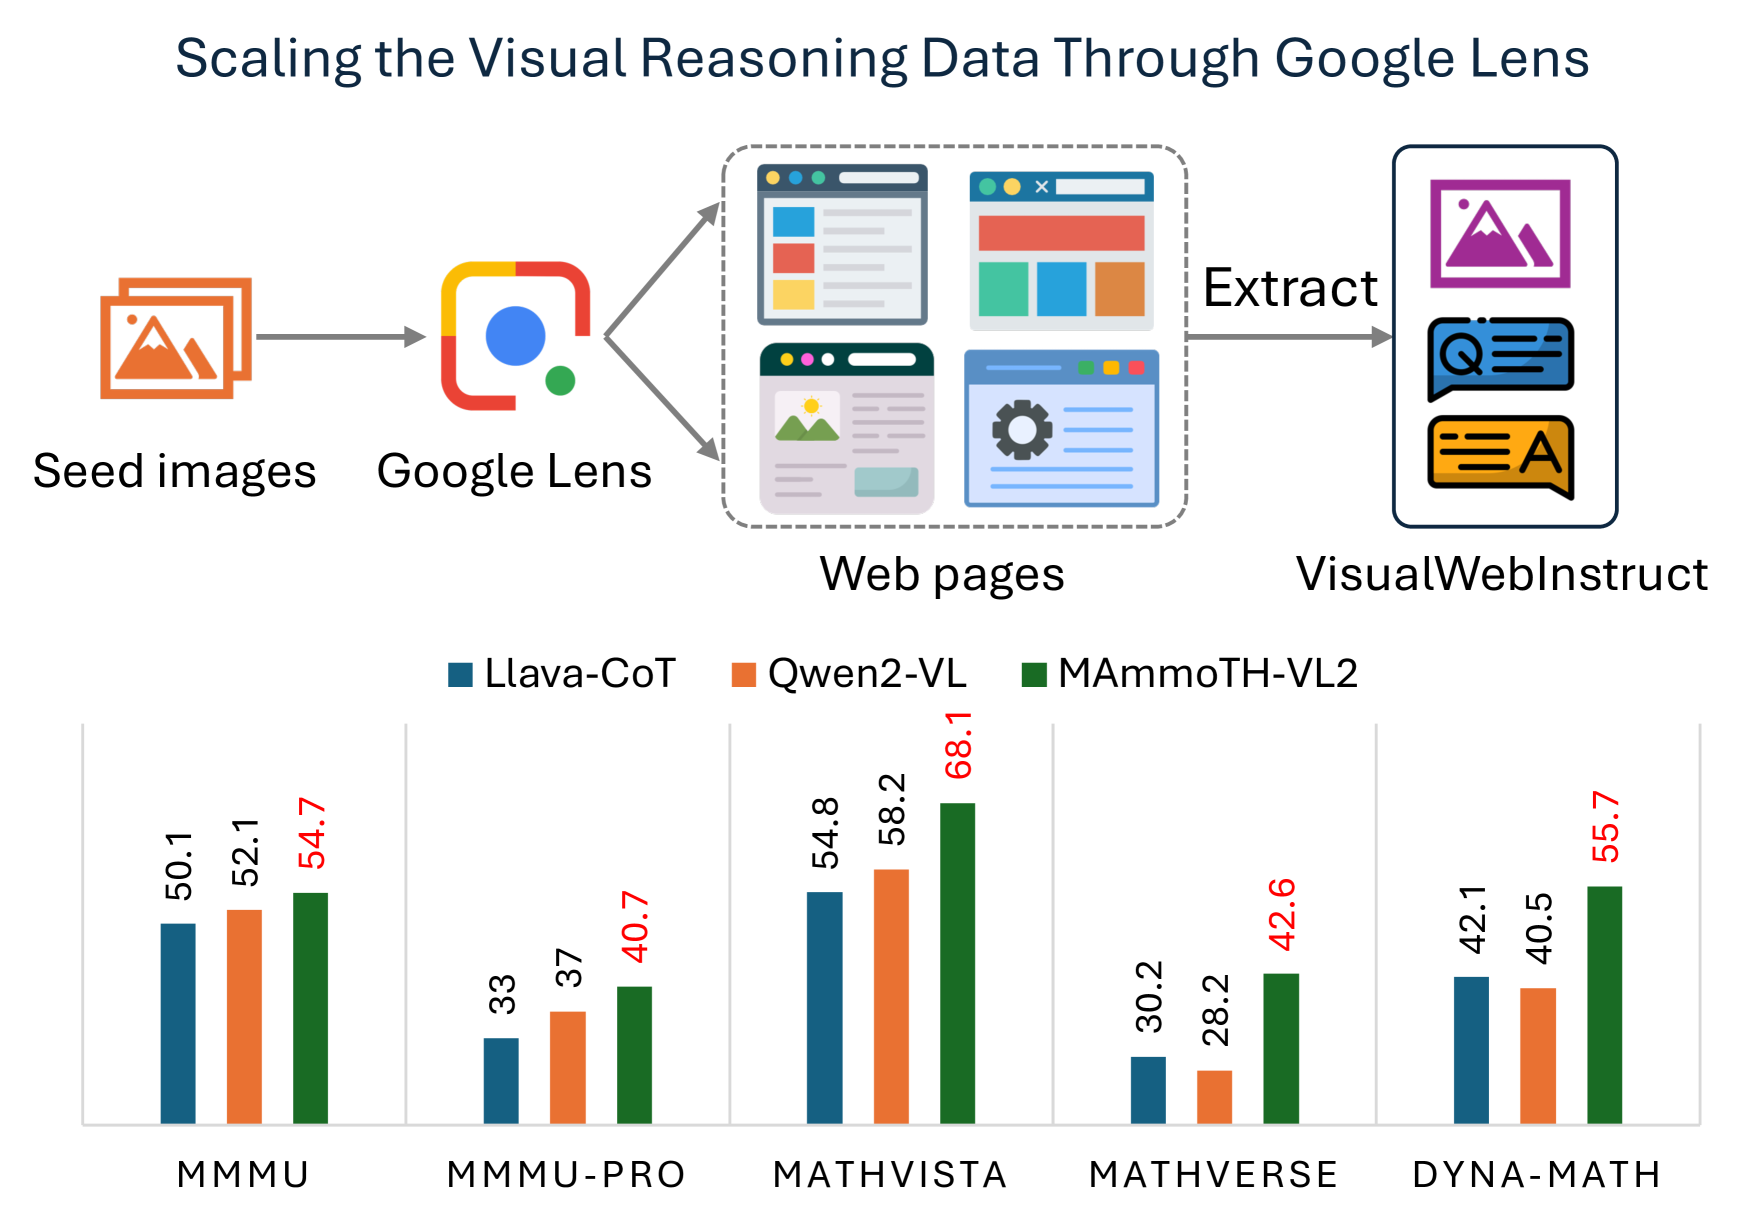
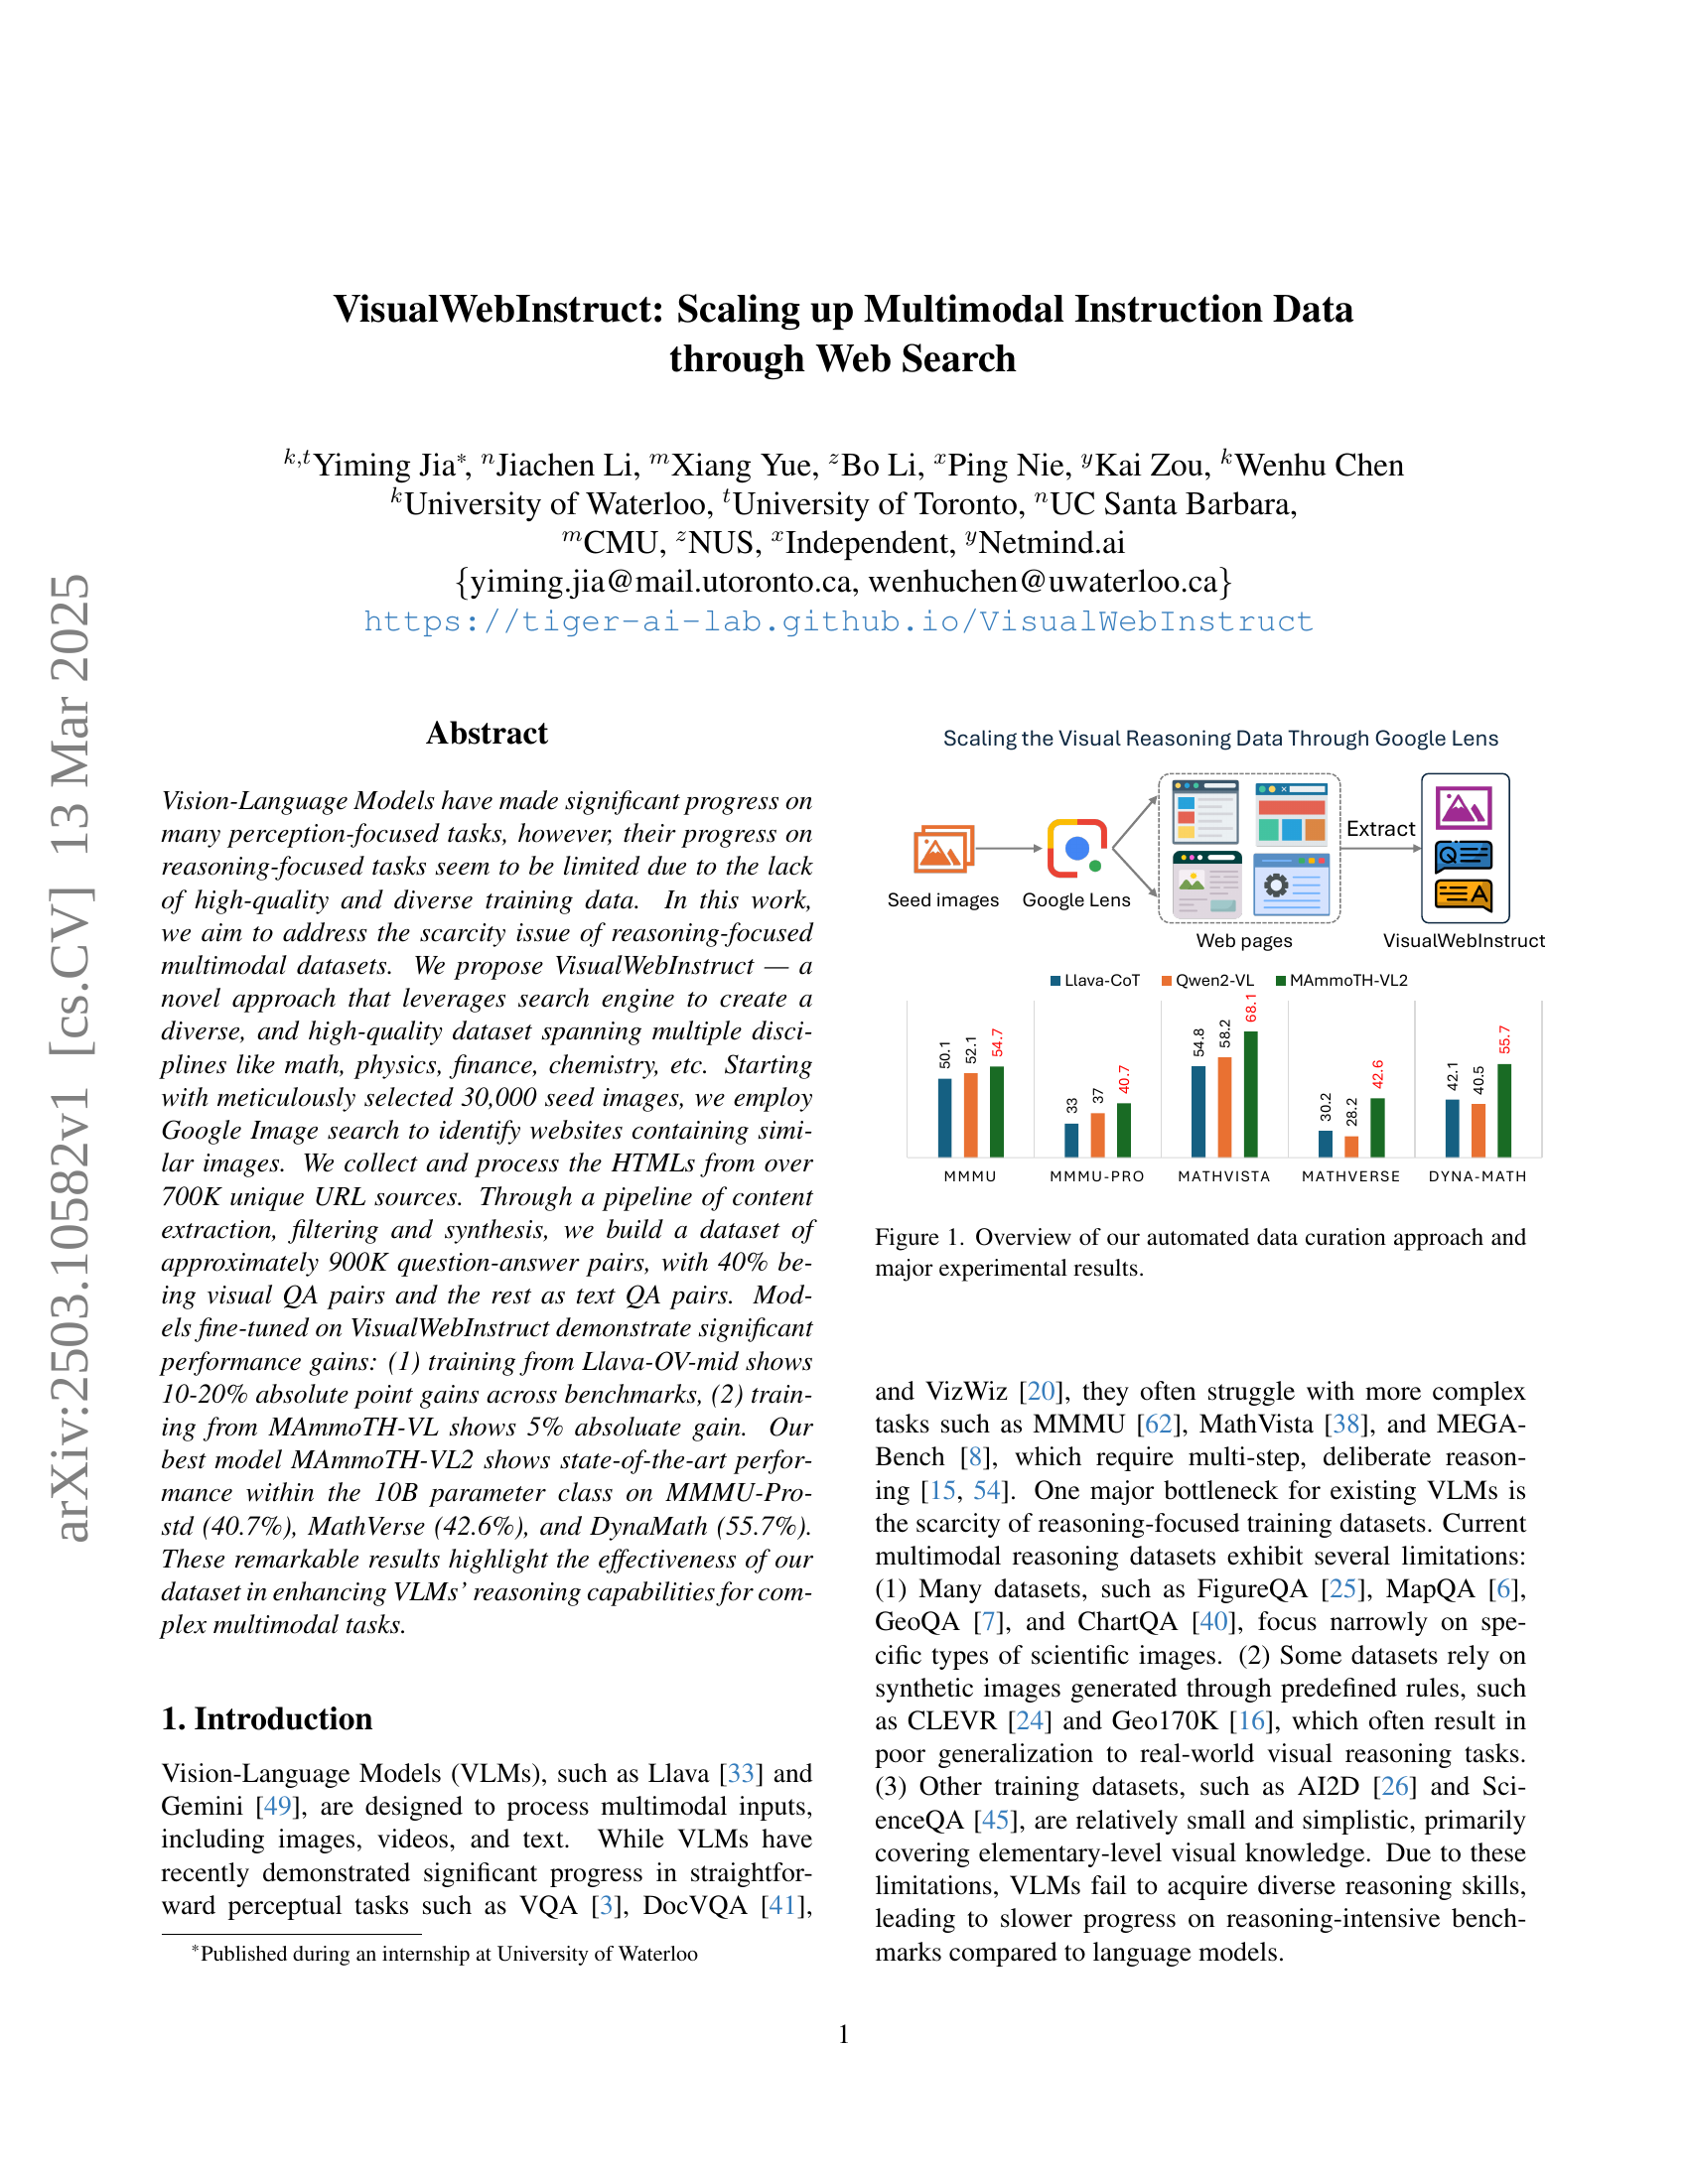
🔼 This figure illustrates the VisualWebInstruct dataset creation process and its impact. The pipeline starts with 30,000 seed images, uses Google Lens to find similar images on the web, extracts QA pairs from the resulting HTML, and filters for quality. The final dataset contains approximately 900k QA pairs. The bar charts show the performance gains achieved by fine-tuning language models (LLaVA-CoT, Qwen2-VL, and MAmmoTH-VL2) on this new dataset compared to their performance on several benchmarks (MMMU, MMMU-PRO, MathVista, and DynaMath). The improvements demonstrate the effectiveness of VisualWebInstruct in enhancing visual reasoning capabilities.
read the caption
Figure 1: Overview of our automated data curation approach and major experimental results.
| Dataset | Size | Source & Domains | Coverage |
| ScienceQA [45] | 21K | Elementary and high school science | Science Q&A, diagrams, K-12 Exam |
| IconQA [37] | 107K | Abstract diagrams and visual reasoning | Visual reasoning, diagrams |
| Geo170K [16] | 170K | Synthesized from LLMs | Geometry |
| CLEVR [24] | 700K | Synthesized from rules | Shapes |
| FigureQA [25] | 1.3M | Synthesized from rules | Bar, Line, Pie |
| ChartQA [40] | 23K | Charts from Staista, Pew, etc | Charts |
| Math360V [47] | 260K | FigureQA [25], CLEVR [24], IconQA [37], etc | Math reasoning, diagrams |
| Mulberry [60] | 260K | Geo3K [36], IconQA [37], ChartQA [40], ScienceQA [45], etc | Geo, Figure, Medical, K-12 Exam |
| Llava-CoT [57] | 100K | ChartQA [40], AI2D [26], GeoQA [7], CLEVR [24], etc | Geo, General VQA, K-12 Exam |
| VisualWebInstruct | 906K | Internet (Homework Website, Forums, etc) | All Above + College Exams |
🔼 This table compares the VisualWebInstruct dataset with other existing multimodal datasets, highlighting key differences in size, source, domains covered, and types of visual content. It shows that VisualWebInstruct is significantly larger and more diverse than existing datasets, encompassing a broader range of scientific disciplines and image types, making it particularly suitable for training vision-language models on complex reasoning tasks.
read the caption
Table 1: Comparison between our dataset and the existing datasets. VisualWebInstruct is the most diverse dataset with very broad coverage of disciplines and image types.
In-depth insights#
Web-scale VLM#
Web-scale Vision-Language Models (VLMs) represent a significant leap in AI, moving beyond limited datasets to harness the vastness of internet data. This scaling is crucial for several reasons. First, it provides VLMs with exposure to a much more diverse range of visual concepts, linguistic expressions, and real-world scenarios. This broader training base directly translates to improved generalization capabilities, allowing these models to perform effectively on a wider array of tasks and unseen data. Second, web-scale data enables VLMs to learn more nuanced and complex relationships between vision and language. They can capture subtle contextual cues and associations that would be impossible to discern from smaller, curated datasets. Third, the sheer volume of data helps to mitigate biases that may be present in smaller datasets. By training on a more representative sample of the world, web-scale VLMs can achieve fairer and more robust performance. However, the move to web-scale also presents significant challenges. Data quality becomes a major concern, as the internet contains a large amount of noisy, irrelevant, or even harmful information. Sophisticated data cleaning and filtering techniques are essential to ensure that VLMs are trained on high-quality data. Computational resources are also a major bottleneck, as training VLMs on web-scale datasets requires massive amounts of compute power and memory. Finally, ethical considerations become paramount, as web-scale VLMs may inadvertently learn and perpetuate biases present in the data, or be used for malicious purposes. Addressing these challenges requires careful attention to data curation, model design, and ethical oversight.
Data Curation#
Data curation in the context of training Vision-Language Models (VLMs) is crucial for enhancing their reasoning capabilities. The traditional reliance on human annotation, while providing high-precision data, suffers from scalability issues. Automated approaches, like leveraging web search, offer a solution to create diverse and high-quality datasets. The process typically involves starting with seed images, using them to identify relevant webpages via search engines like Google, and then extracting HTML content. This raw data undergoes a series of refinement steps including content extraction, filtering, and synthesis to generate question-answer pairs. The quality of extracted data is paramount, so techniques like filtering based on question validity and image relevance, and ensuring consistency among synthesized answers are necessary. This process has the potential to dramatically scale up the amount of reasoning-focused multimodal data available for training VLMs.
Instruct Tuning#
While the provided document does not explicitly contain a section titled “Instruct Tuning,” we can infer its relevance within the context of vision-language models (VLMs). Instruct tuning, in general, involves fine-tuning a pre-trained model using a dataset of instructions and corresponding desired outputs. This process significantly enhances the model’s ability to follow user commands, perform specific tasks, and generalize to unseen scenarios. In the context of VLMs, instruct tuning could be applied to improve the model’s ability to perform complex reasoning tasks based on visual and textual inputs. For instance, the VisualWebInstruct dataset, described in the paper, could be used to fine-tune VLMs using instruct tuning, where the instructions are questions about images and the outputs are the corresponding answers. This would enable the model to better understand the relationships between visual elements and textual descriptions, leading to improved performance on tasks such as visual question answering, image captioning, and visual reasoning. Effectiveness is shown in data augmentation which results in more capable vision language models.
Reasoning Gains#
Reasoning gains in multimodal models are significantly impacted by training data. High-quality, diverse datasets like VisualWebInstruct enhance reasoning by exposing models to various disciplines and problem types. Fine-tuning on such datasets demonstrably improves performance on benchmarks like MMMU and MathVista. The combination of web-sourced data with techniques like chain-of-thought further amplifies reasoning capabilities, allowing models to tackle complex, multi-step problems that require deliberate thought and visual context understanding. The effectiveness hinges on balancing data quality and diversity to facilitate broader generalization and prevent overfitting to specific domains.
Dataset Scaling#
Dataset scaling is a crucial aspect of training effective machine learning models, particularly for vision-language models (VLMs). The paper addresses the limitation of reasoning-focused datasets and proposes a novel approach, VisualWebInstruct, to scale up instruction data. Scaling involves using web search to gather a diverse dataset, including images from various disciplines. They start with 30K images and use Google Image Search to find similar images, extracting data from 700K unique URLs. The scaling aims to increase data quantity and diversity and improve the model’s ability to handle complex multimodal tasks. The use of web search is a clever way to overcome the data scarcity issue, enabling the creation of a large dataset without extensive human annotation. The dataset size and the comprehensive nature of web-derived data helps in enhancing the model’s reasoning capabilities
More visual insights#
More on figures

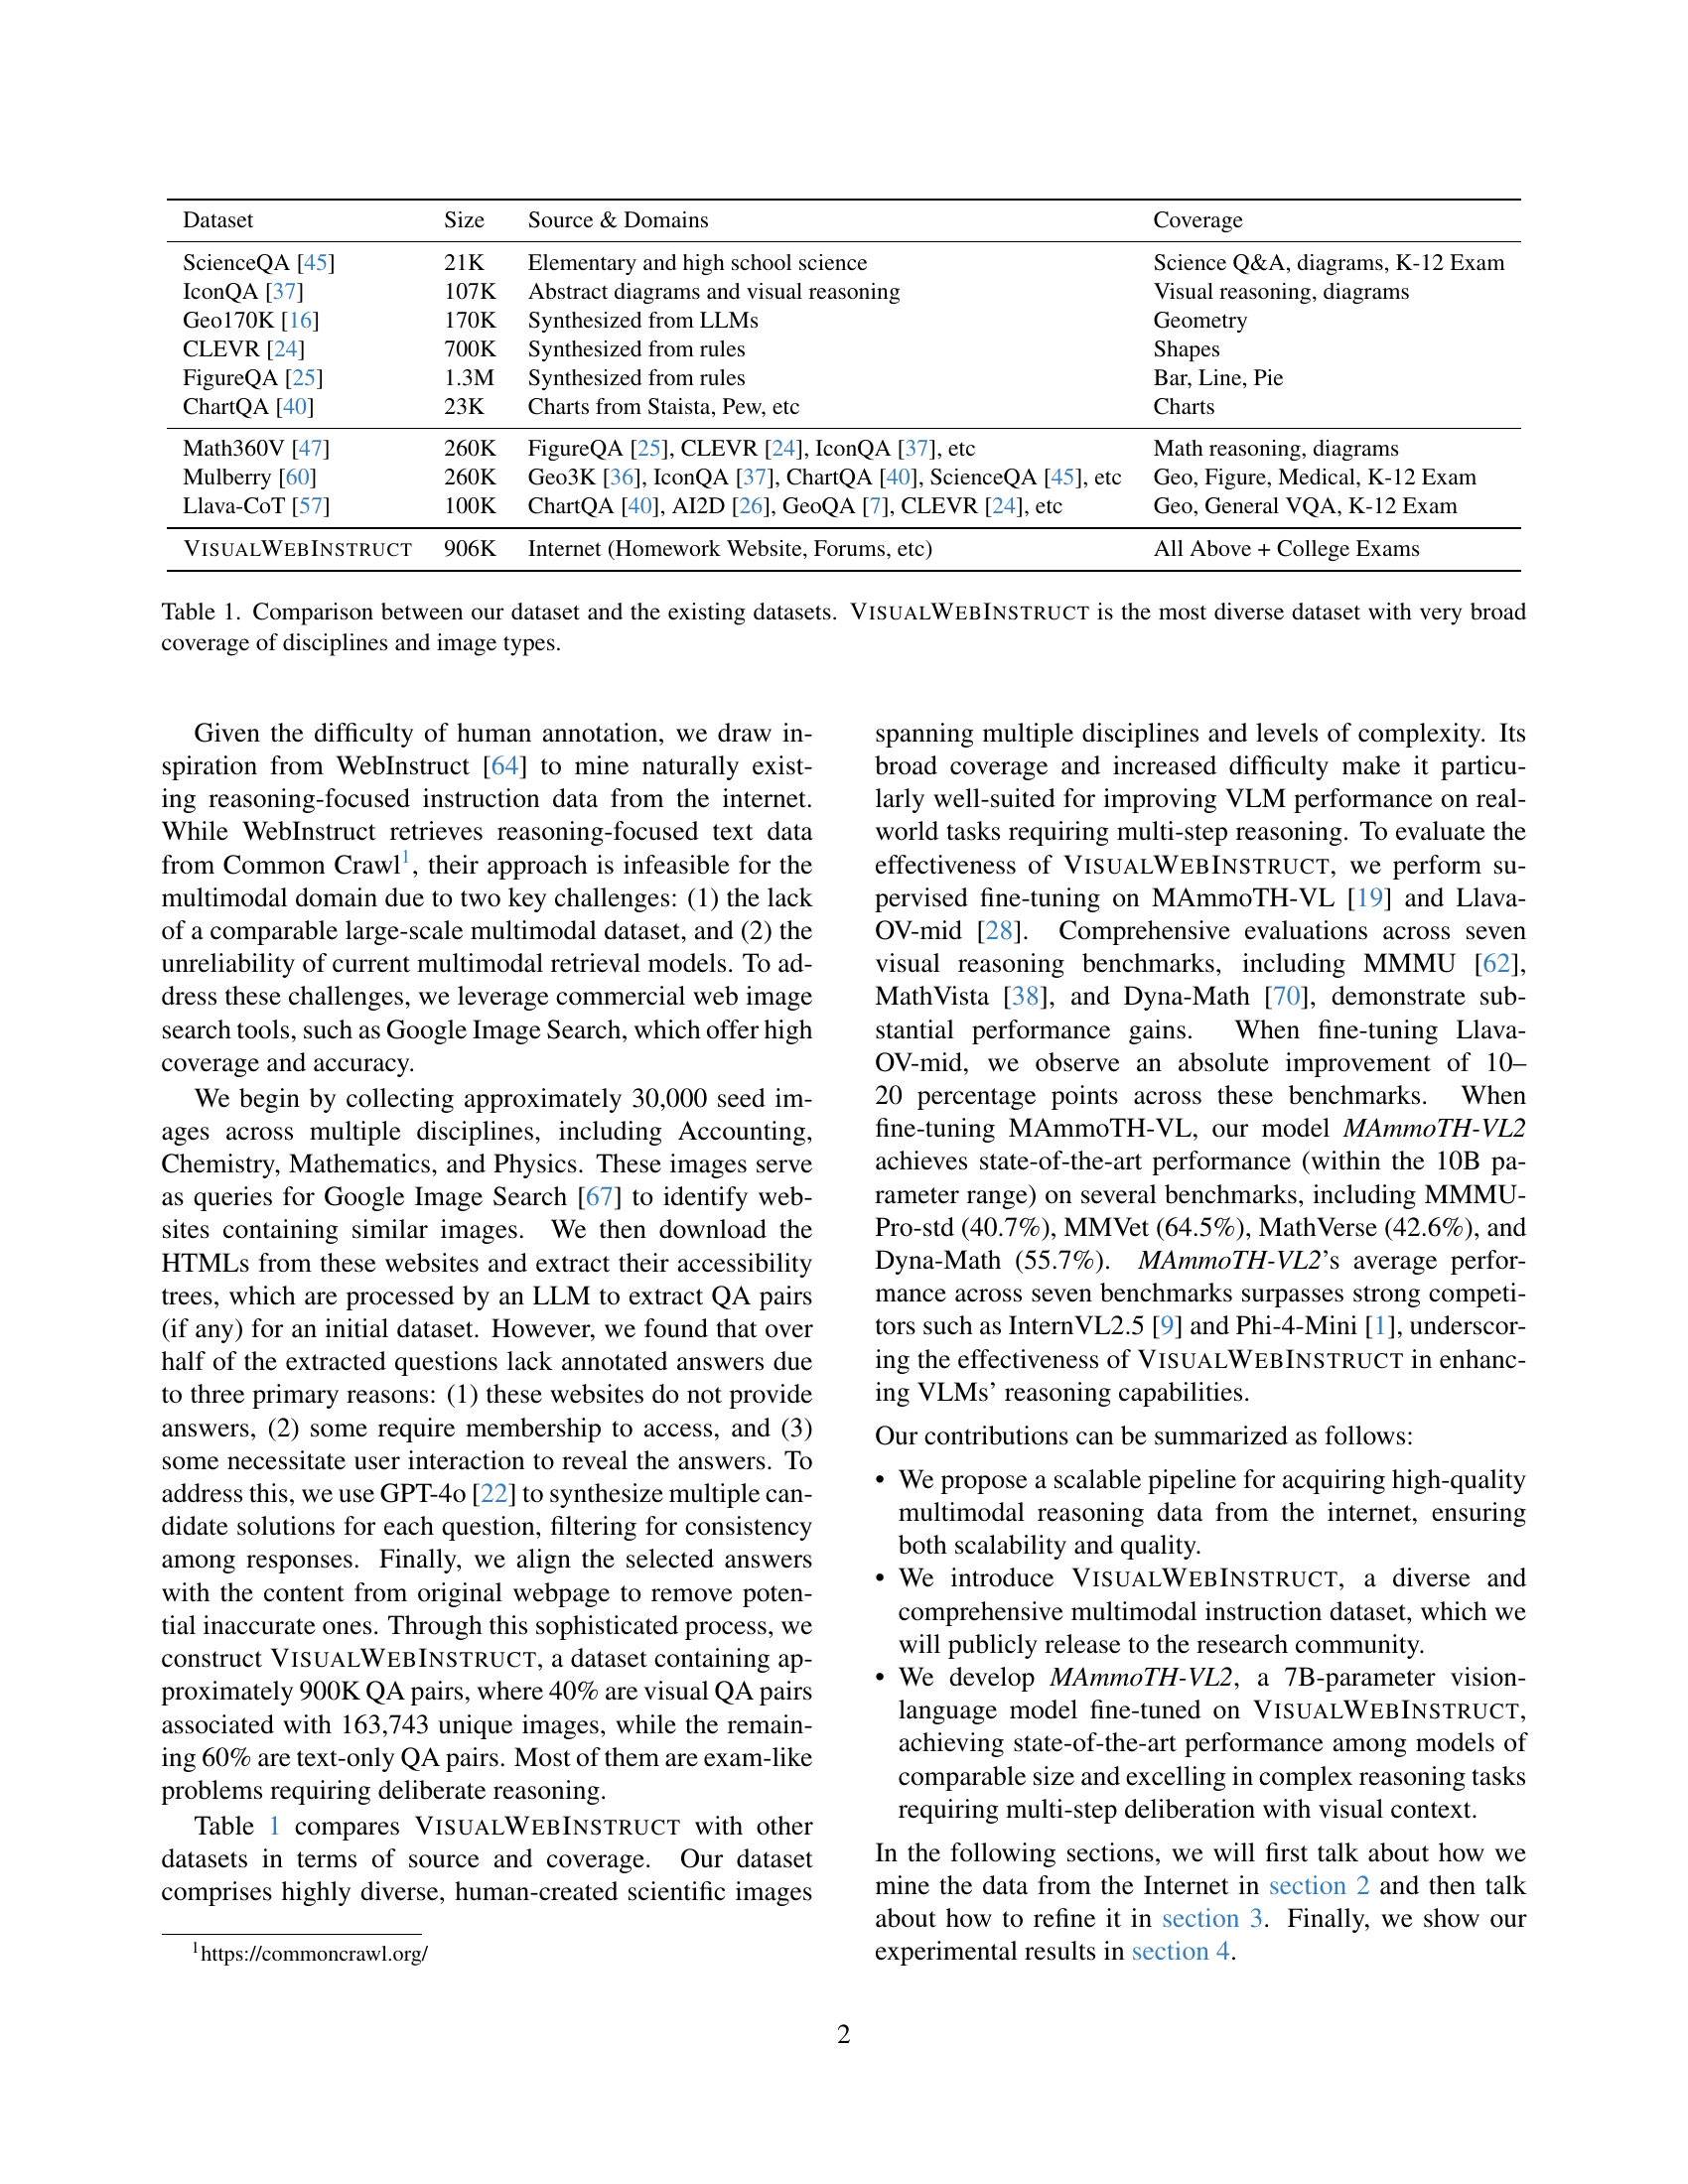
🔼 This figure details the two-stage pipeline used to create the VisualWebInstruct dataset. Stage 1 begins with seed images, uses Google Image Search to find related webpages, converts those pages into accessibility trees, extracts initial question-answer pairs, and then refines them. Stage 2 generates multiple synthesized answers to filter for consistency, aligning them with original web content to improve accuracy.
read the caption
Figure 2: Comprehensive Pipeline for VisualWebInstruct Dataset Generation. The workflow illustrates our multi-stage approach for creating high-quality multimodal instruction data. Stage 1: starting with seed images, we leverage Google Image search to identify relevant webpages, which are processed into accessibility trees. The raw QA pairs are extracted from the trees and refined through a post-processing step to ensure the vadality the data. Stage 2: we first generat multiple synthesized answers for consistency filtering, then align these with original web-sourced content to enhance the accuracy of the answers.

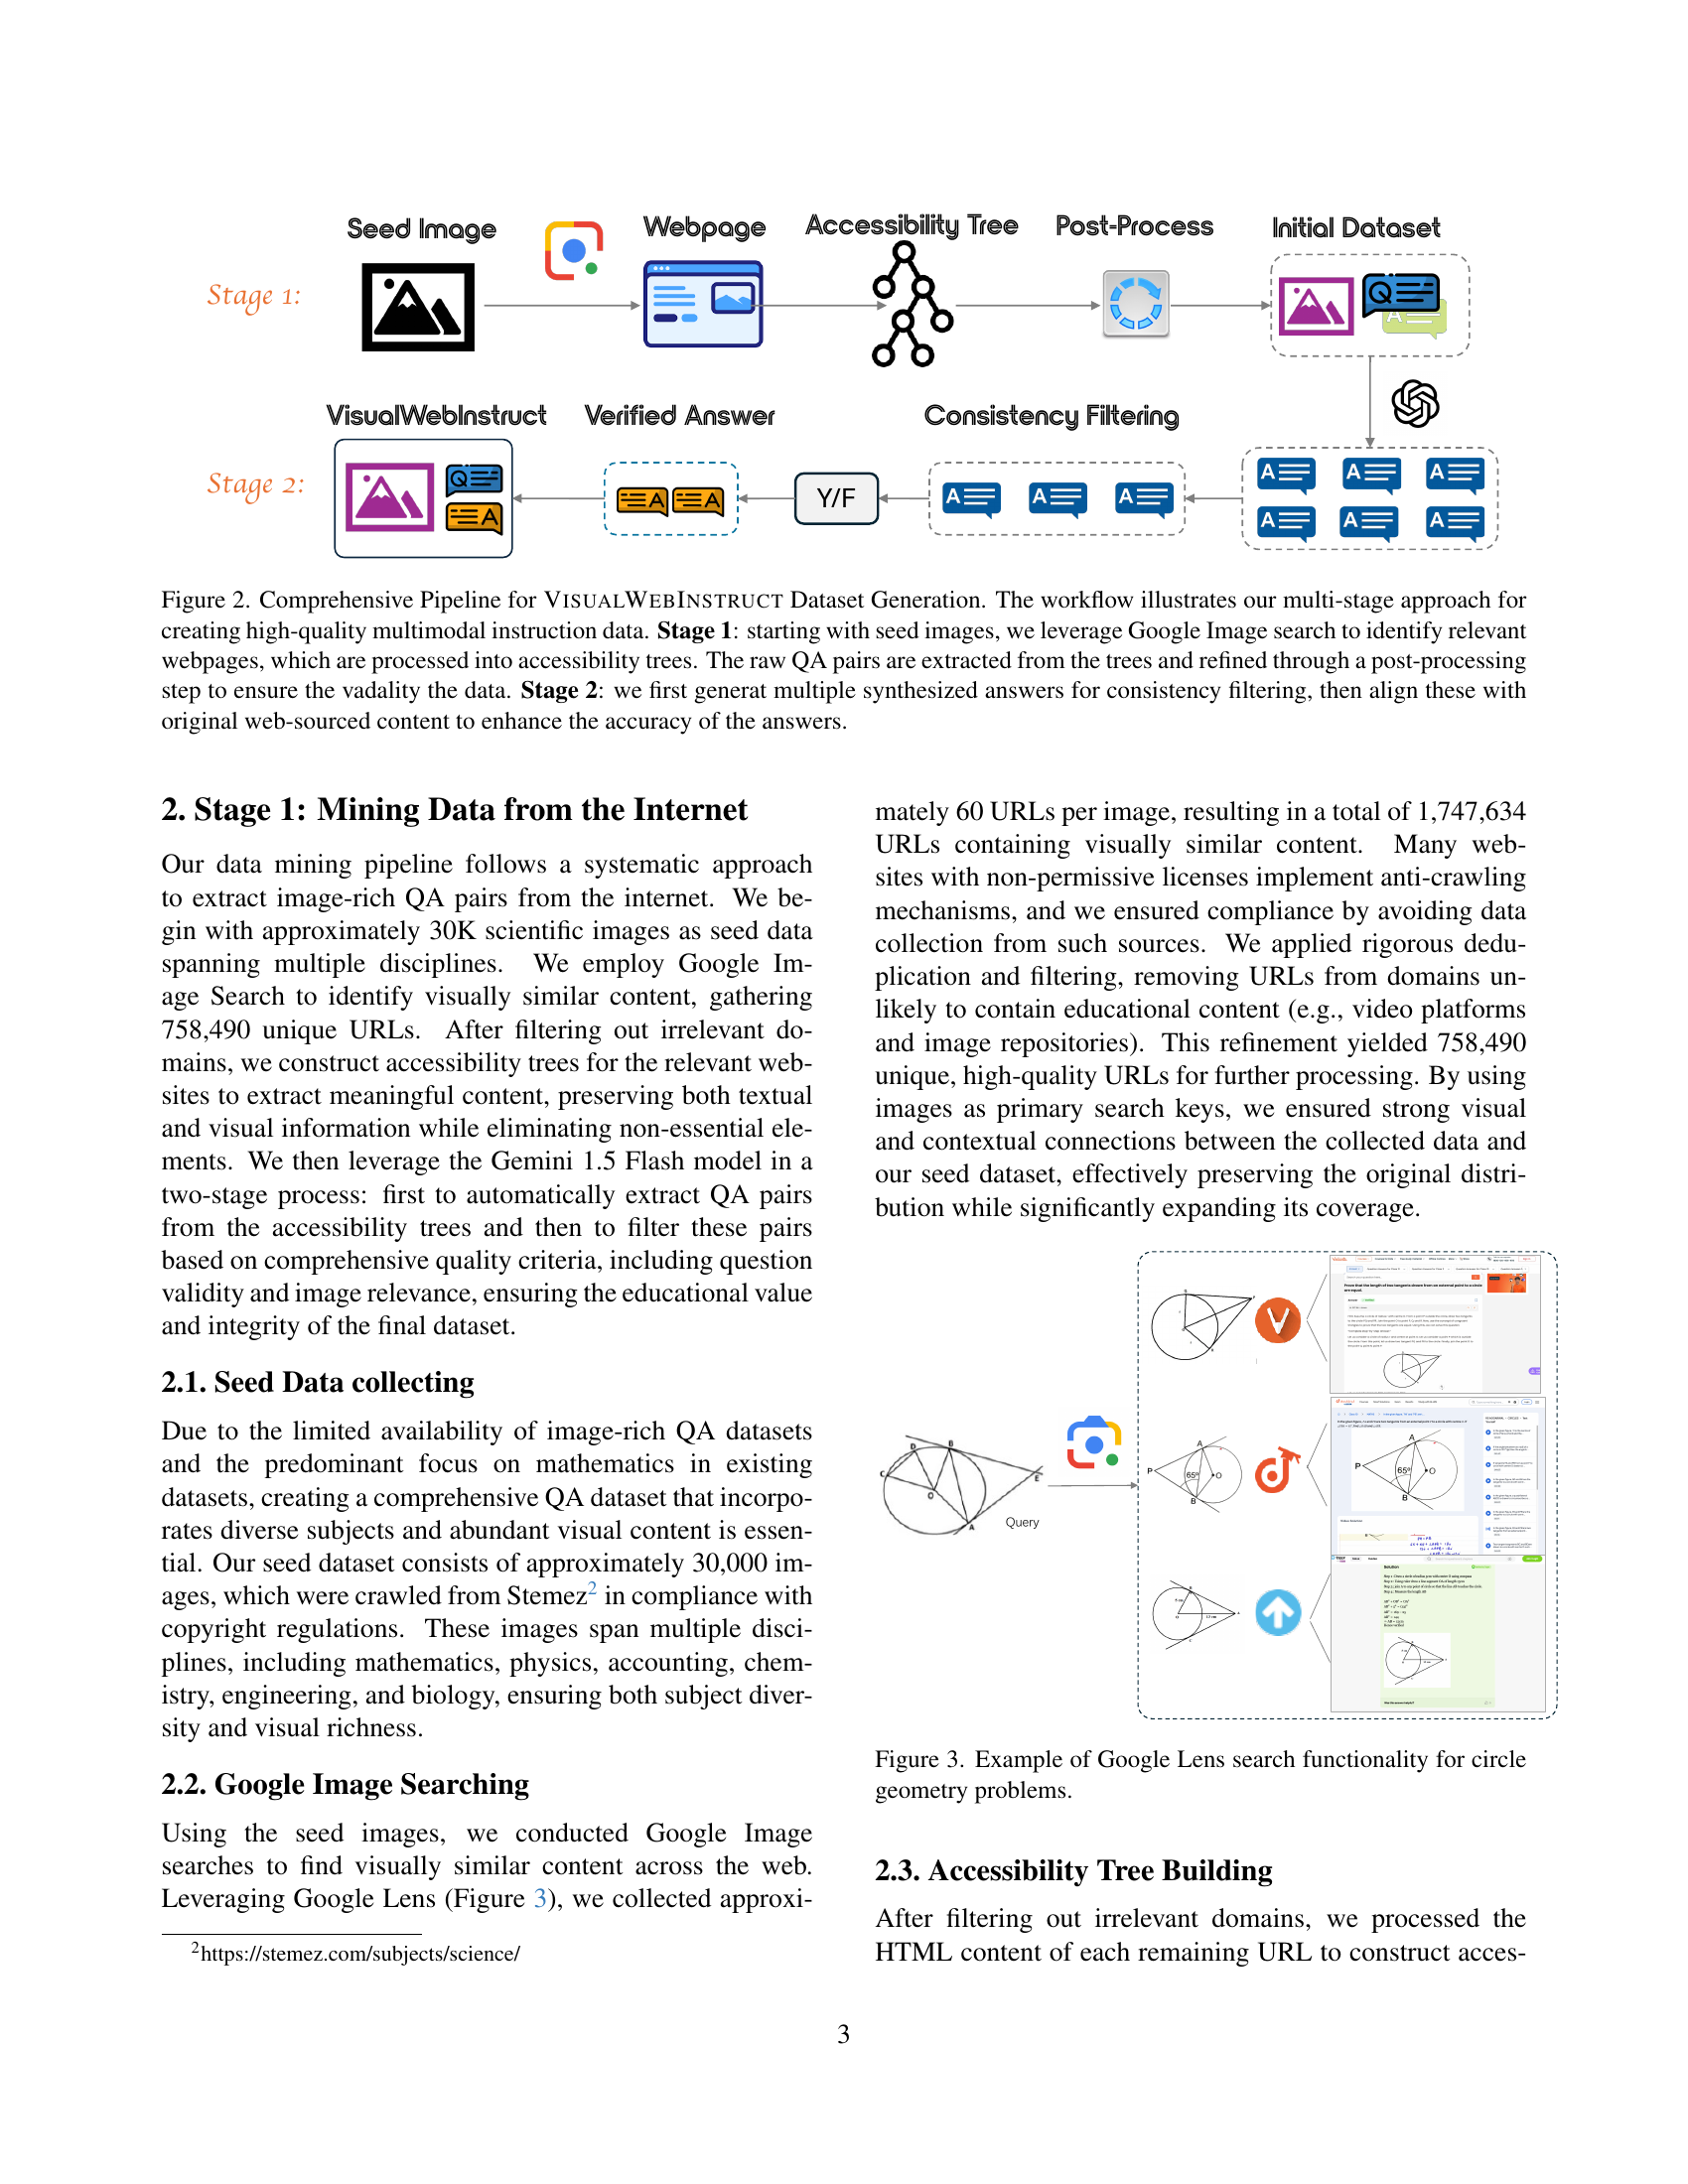
🔼 This figure shows how Google Lens was used to search for webpages containing images related to circle geometry problems. The query image (a circle diagram) is shown, illustrating how Google Lens’s image search capability was used to find relevant webpages for data collection. The process starts with a seed image as input, and the search engine returns a list of URLs to webpages containing visually similar content. These webpages were then used to extract the question answer pairs for creating the final dataset.
read the caption
Figure 3: Example of Google Lens search functionality for circle geometry problems.

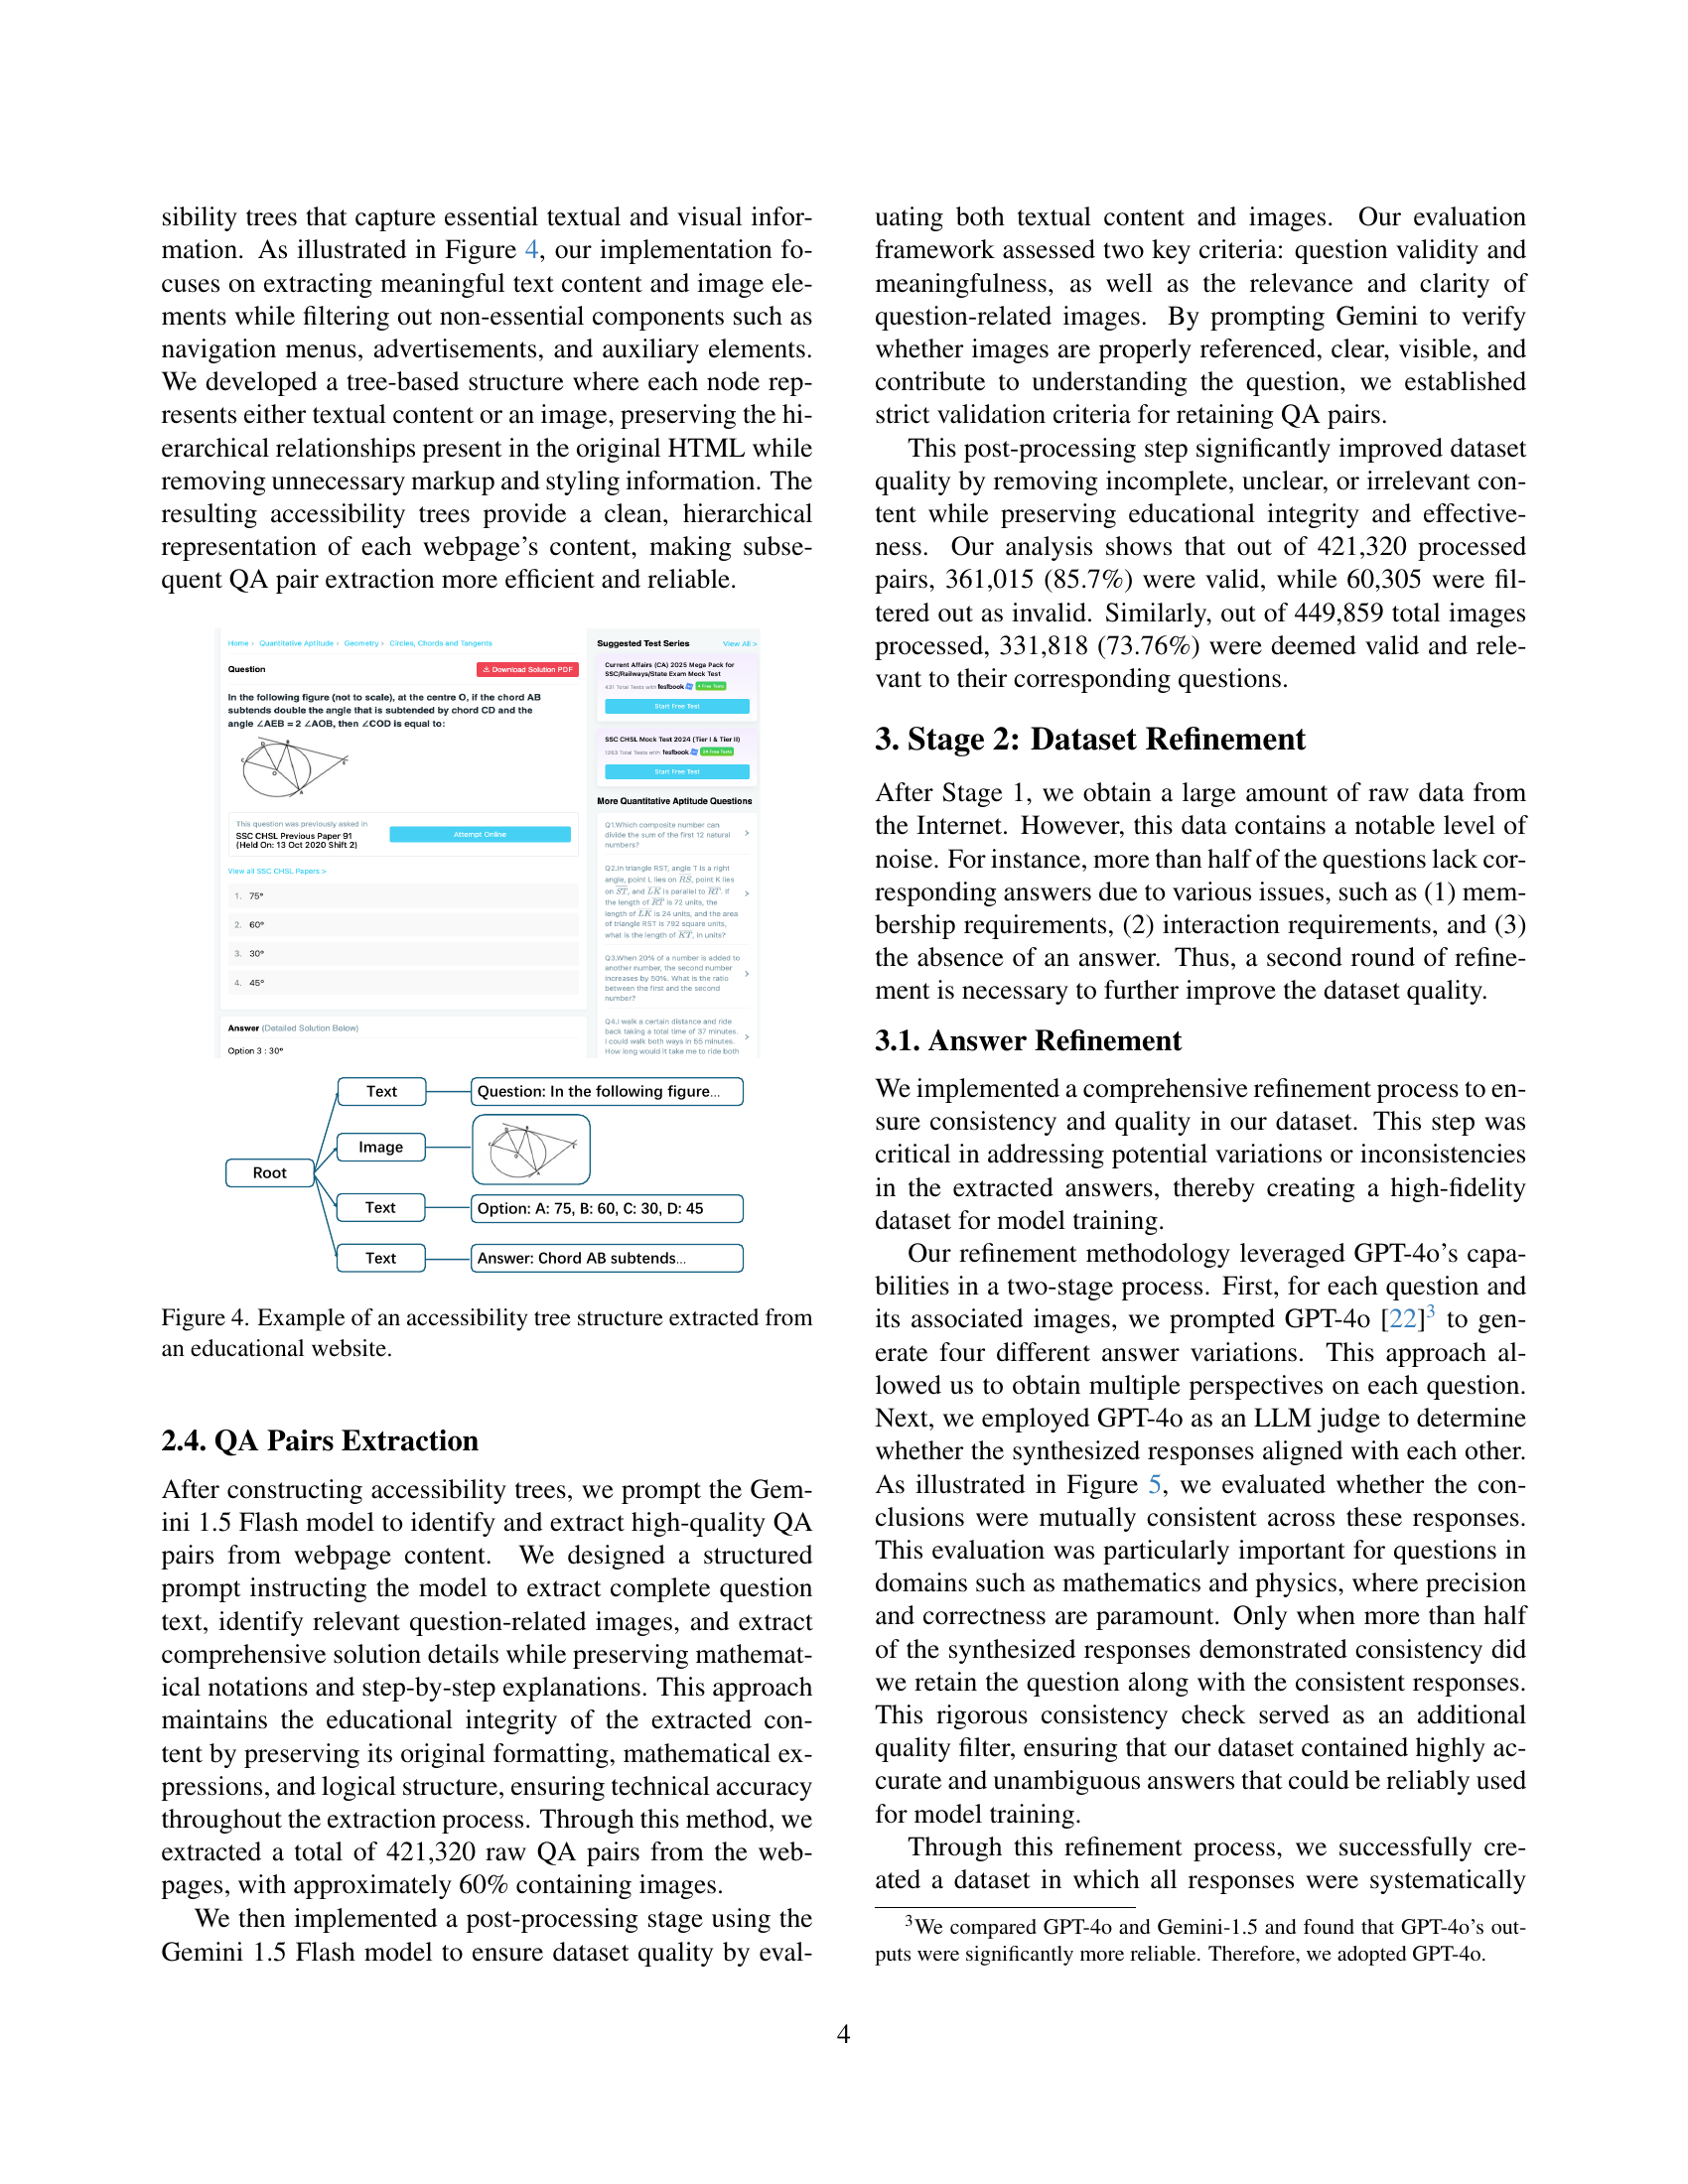
🔼 Figure 4 shows an example of how the authors extract structured data from an educational website. The figure presents an accessibility tree, a hierarchical representation of a webpage’s content. The tree nodes represent either textual content (questions, options, answers) or image elements. The tree structure is used to extract question-answer pairs, preserving the relationship between textual components and related images.
read the caption
Figure 4: Example of an accessibility tree structure extracted from an educational website.

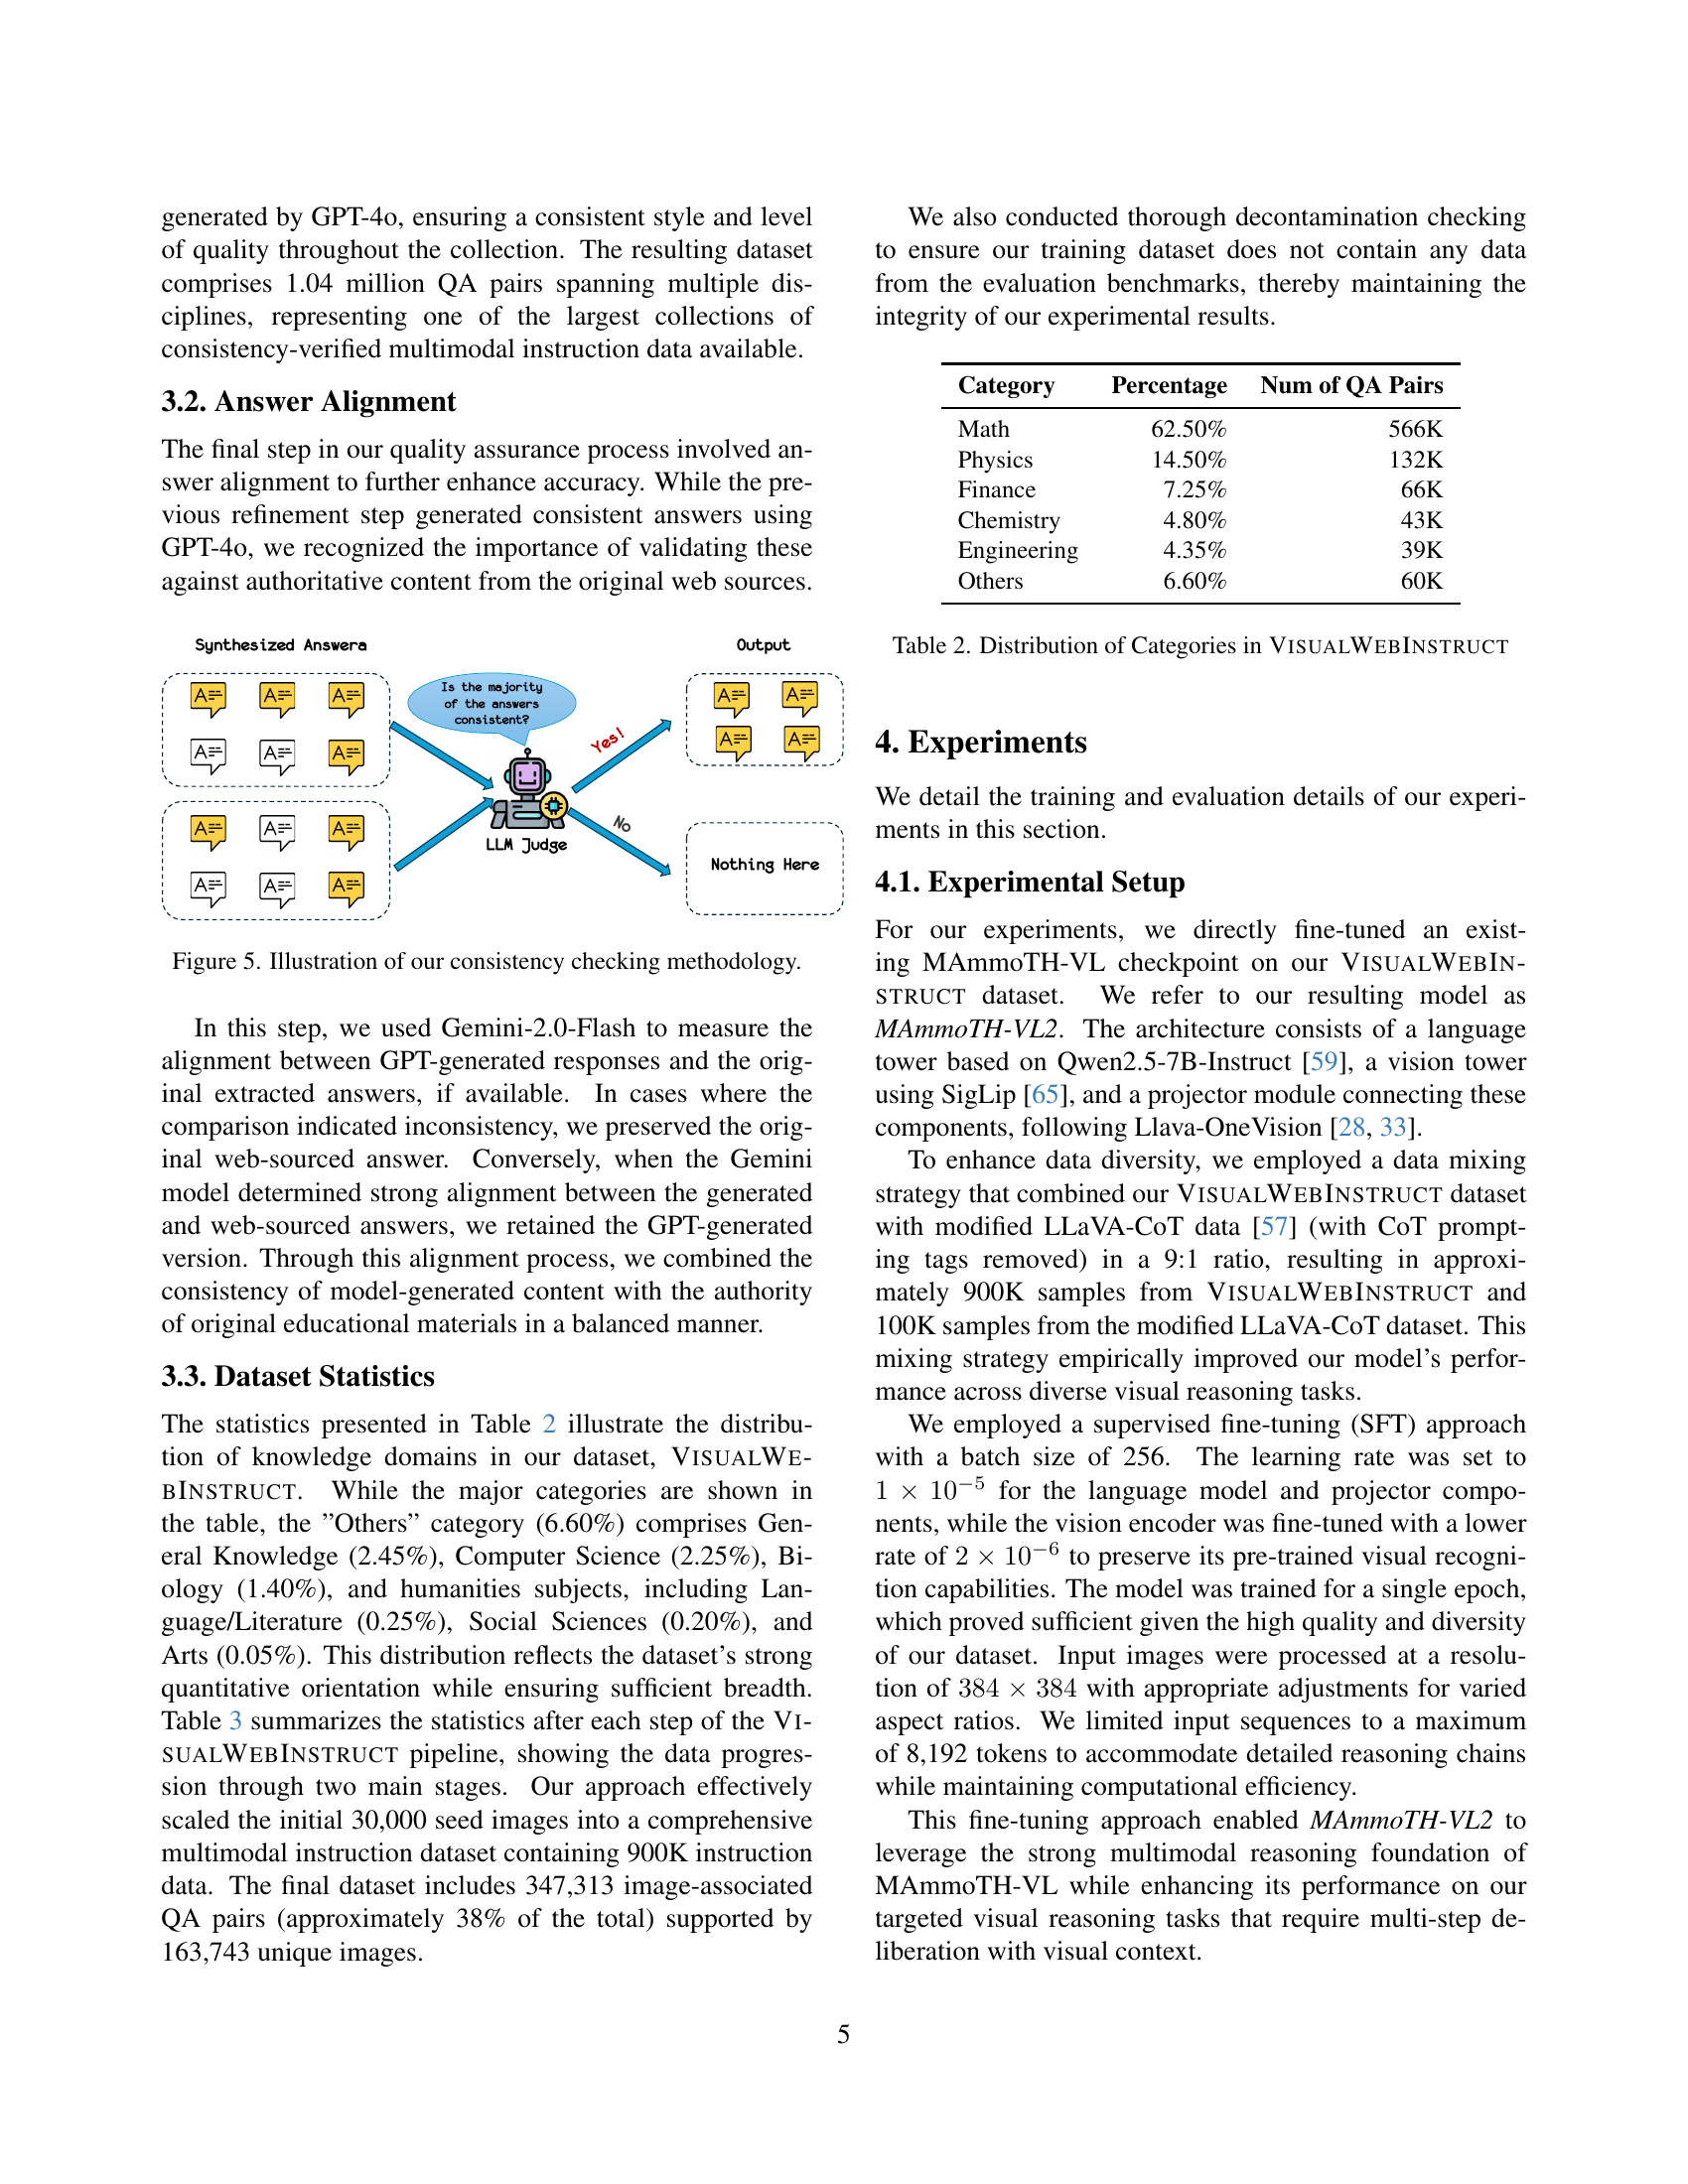
🔼 This figure illustrates the process of ensuring answer consistency in the VisualWebInstruct dataset. Multiple answers are generated for each question using GPT-40. Then, an LLM judge (also GPT-40) evaluates the consistency of these answers. Only questions with a majority of consistent answers are retained in the final dataset, improving the quality and reliability of the data.
read the caption
Figure 5: Illustration of our consistency checking methodology.
More on tables
| Category | Percentage | Num of QA Pairs |
|---|---|---|
| Math | 62.50% | 566K |
| Physics | 14.50% | 132K |
| Finance | 7.25% | 66K |
| Chemistry | 4.80% | 43K |
| Engineering | 4.35% | 39K |
| Others | 6.60% | 60K |
🔼 Table 2 shows the distribution of different categories of questions within the VisualWebInstruct dataset. The dataset covers multiple disciplines, with the majority of questions falling under mathematics (62.5%). Other significant categories include physics, finance, chemistry, and engineering, while a smaller ‘Others’ category encompasses subjects such as general knowledge, computer science, biology, and humanities.
read the caption
Table 2: Distribution of Categories in VisualWebInstruct
| Processing Stage | Total QA Pairs | Image-Associated QA | Unique Questions | Total Images | Unique Images |
|---|---|---|---|---|---|
| Stage 1: Mining Data from the Internet | |||||
| Seed Data Collection | - | - | - | 30,000 | 30,000 |
| QA Pairs Extraction | 421,320 | 248,643 | 421,320 | 552,269 | 362,728 |
| Post-Processing | 361,015 | 159,059 | 361,015 | 331,818 | 212,530 |
| Stage 2: Dataset Refinement | |||||
| Answer Refinement | 1,041,598 | 407,218 | 257,201 | 577,455 | 167,493 |
| Answer Alignment | 906,160 | 347,313 | 257,201 | 475,099 | 163,743 |
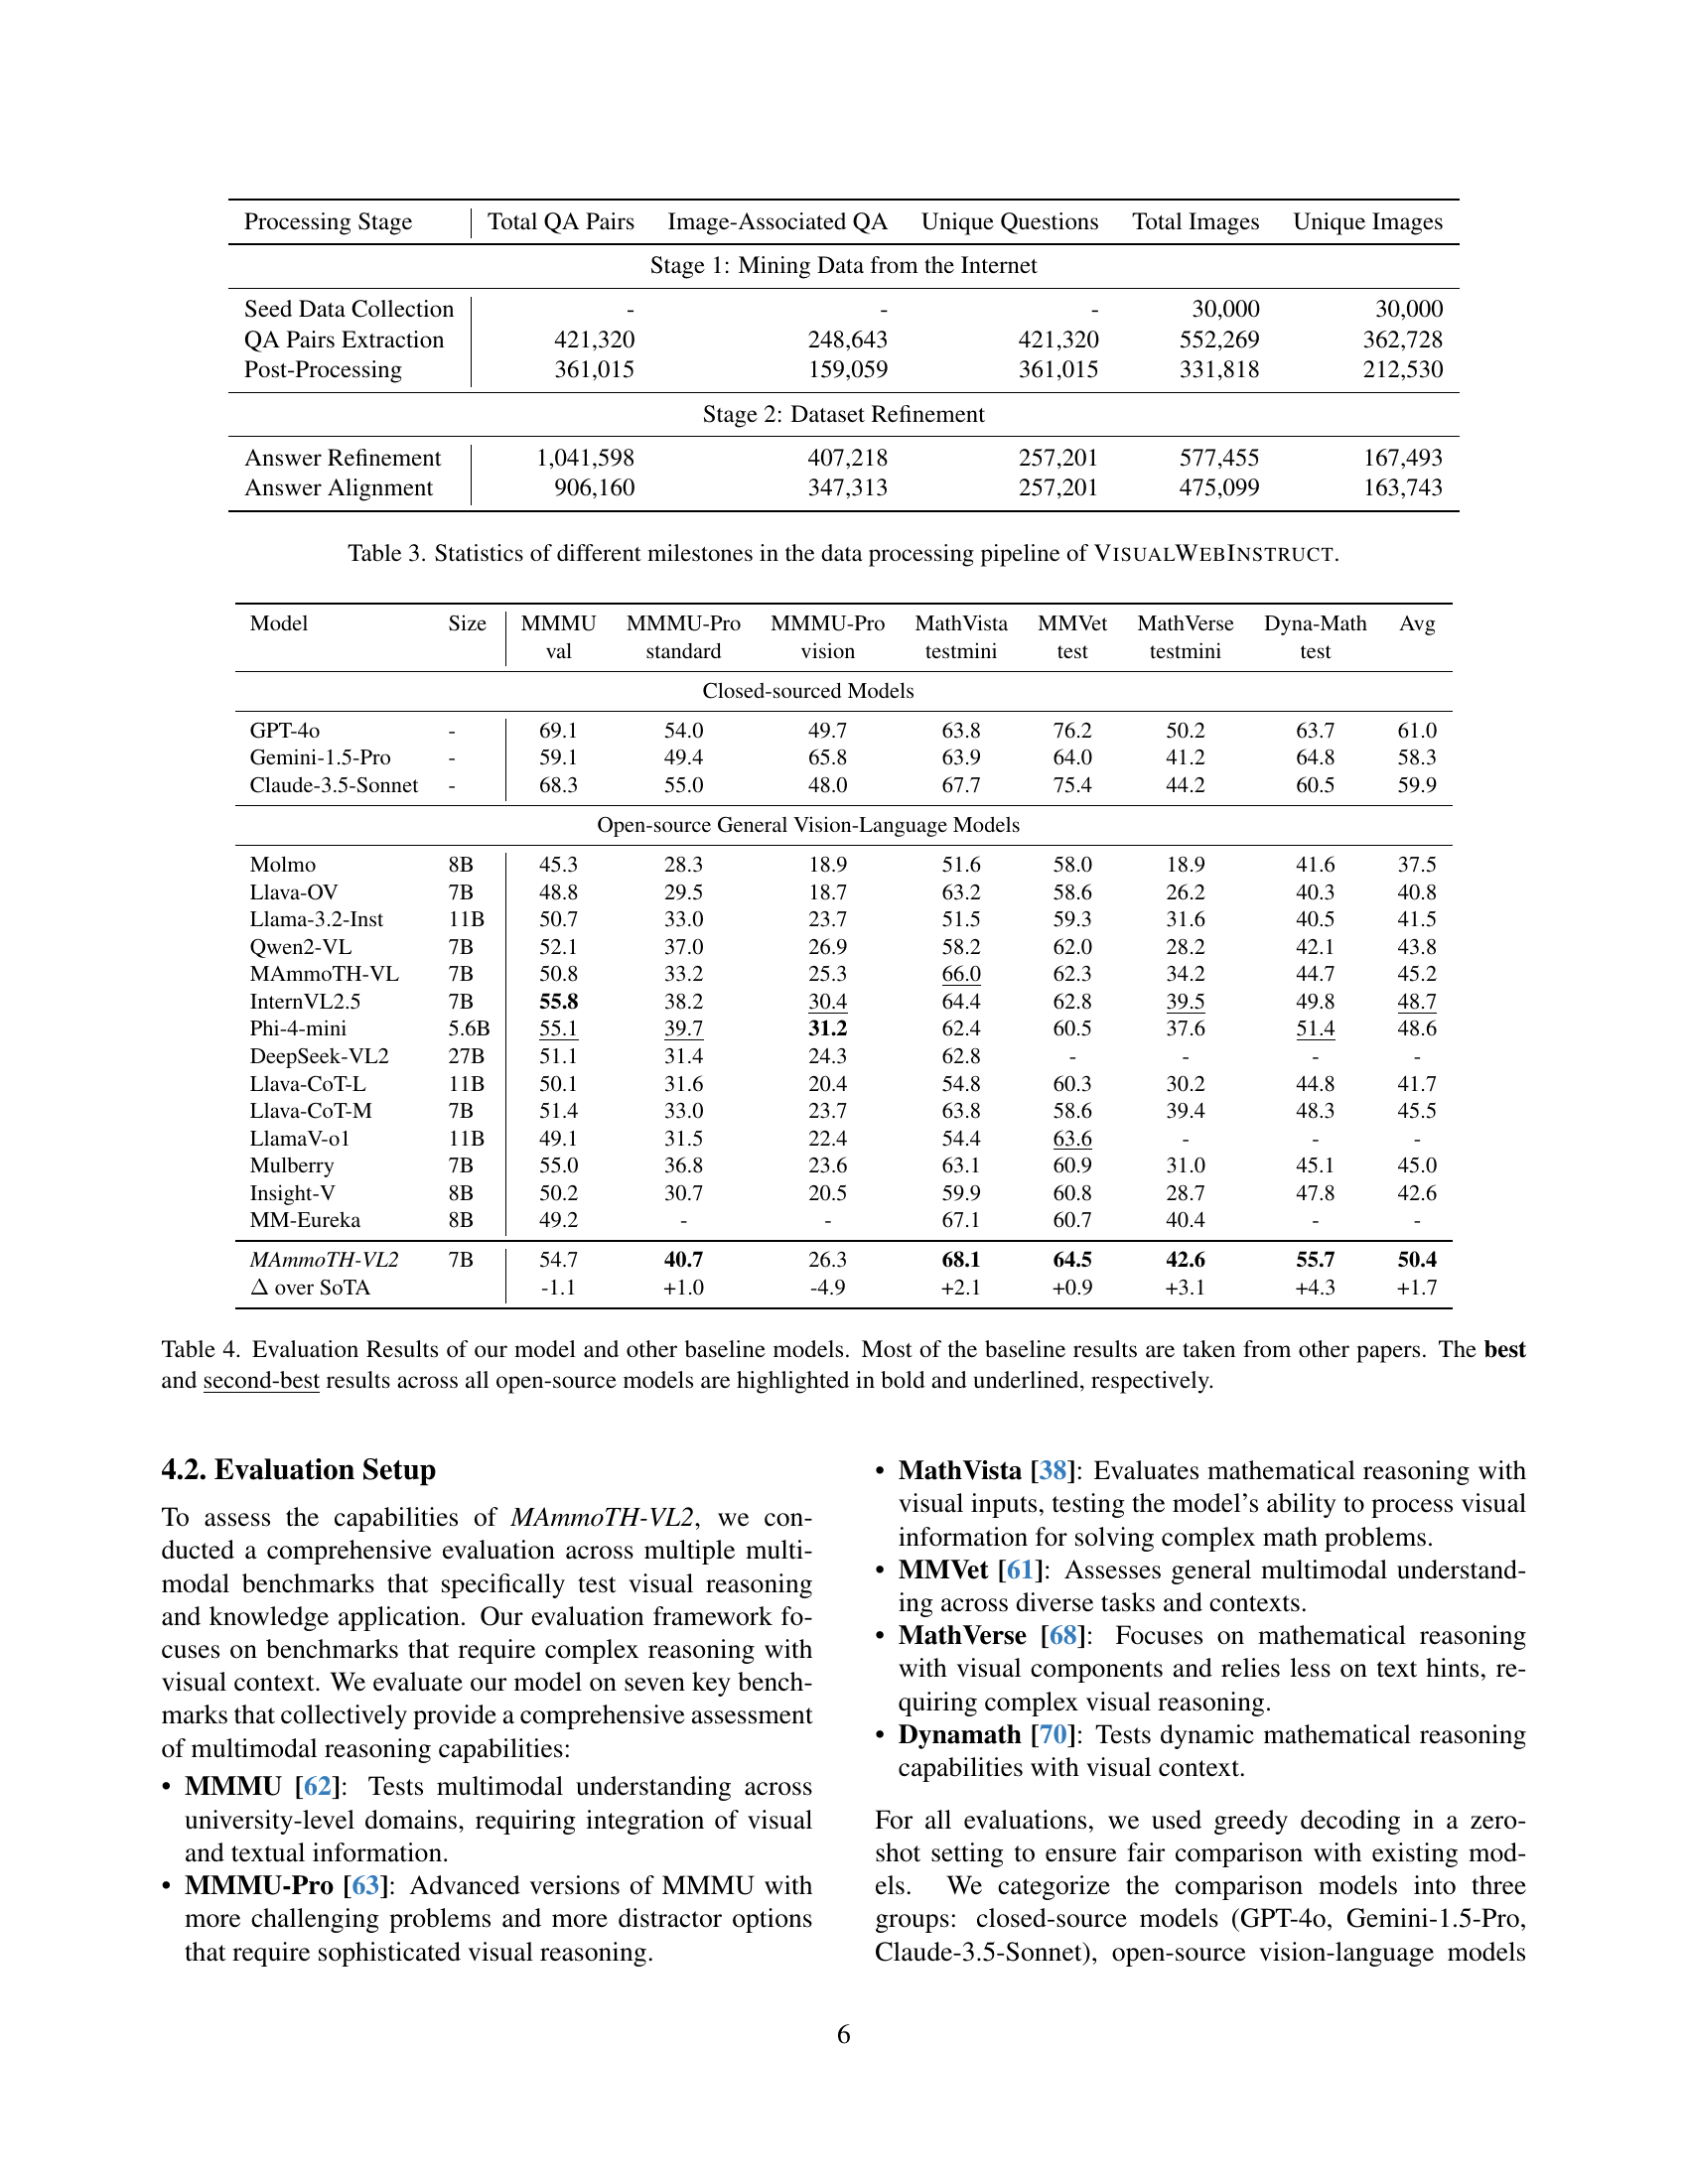
🔼 This table details the statistics of the VisualWebInstruct dataset creation pipeline. It shows the number of question-answer pairs, and images at different stages: initial data mining from the internet, post-processing for quality control, and answer refinement steps. The table illustrates the data’s evolution and the impact of various filtering and refinement steps on the dataset’s final size and composition.
read the caption
Table 3: Statistics of different milestones in the data processing pipeline of VisualWebInstruct.
| Model | Size | MMMU | MMMU-Pro | MMMU-Pro | MathVista | MMVet | MathVerse | Dyna-Math | Avg |
|---|---|---|---|---|---|---|---|---|---|
| val | standard | vision | testmini | test | testmini | test | |||
| Closed-sourced Models | |||||||||
| GPT-4o | - | 69.1 | 54.0 | 49.7 | 63.8 | 76.2 | 50.2 | 63.7 | 61.0 |
| Gemini-1.5-Pro | - | 59.1 | 49.4 | 65.8 | 63.9 | 64.0 | 41.2 | 64.8 | 58.3 |
| Claude-3.5-Sonnet | - | 68.3 | 55.0 | 48.0 | 67.7 | 75.4 | 44.2 | 60.5 | 59.9 |
| Open-source General Vision-Language Models | |||||||||
| Molmo | 8B | 45.3 | 28.3 | 18.9 | 51.6 | 58.0 | 18.9 | 41.6 | 37.5 |
| Llava-OV | 7B | 48.8 | 29.5 | 18.7 | 63.2 | 58.6 | 26.2 | 40.3 | 40.8 |
| Llama-3.2-Inst | 11B | 50.7 | 33.0 | 23.7 | 51.5 | 59.3 | 31.6 | 40.5 | 41.5 |
| Qwen2-VL | 7B | 52.1 | 37.0 | 26.9 | 58.2 | 62.0 | 28.2 | 42.1 | 43.8 |
| MAmmoTH-VL | 7B | 50.8 | 33.2 | 25.3 | 66.0 | 62.3 | 34.2 | 44.7 | 45.2 |
| InternVL2.5 | 7B | 55.8 | 38.2 | 30.4 | 64.4 | 62.8 | 39.5 | 49.8 | 48.7 |
| Phi-4-mini | 5.6B | 55.1 | 39.7 | 31.2 | 62.4 | 60.5 | 37.6 | 51.4 | 48.6 |
| DeepSeek-VL2 | 27B | 51.1 | 31.4 | 24.3 | 62.8 | - | - | - | - |
| Llava-CoT-L | 11B | 50.1 | 31.6 | 20.4 | 54.8 | 60.3 | 30.2 | 44.8 | 41.7 |
| Llava-CoT-M | 7B | 51.4 | 33.0 | 23.7 | 63.8 | 58.6 | 39.4 | 48.3 | 45.5 |
| LlamaV-o1 | 11B | 49.1 | 31.5 | 22.4 | 54.4 | 63.6 | - | - | - |
| Mulberry | 7B | 55.0 | 36.8 | 23.6 | 63.1 | 60.9 | 31.0 | 45.1 | 45.0 |
| Insight-V | 8B | 50.2 | 30.7 | 20.5 | 59.9 | 60.8 | 28.7 | 47.8 | 42.6 |
| MM-Eureka | 8B | 49.2 | - | - | 67.1 | 60.7 | 40.4 | - | - |
| MAmmoTH-VL2 | 7B | 54.7 | 40.7 | 26.3 | 68.1 | 64.5 | 42.6 | 55.7 | 50.4 |
| over SoTA | -1.1 | +1.0 | -4.9 | +2.1 | +0.9 | +3.1 | +4.3 | +1.7 | |
🔼 This table presents a comprehensive comparison of the performance of various vision-language models, including the authors’ model (MAmmoTH-VL2), across seven different visual reasoning benchmarks. The benchmarks cover a range of tasks and complexity levels, assessing the models’ capabilities in handling various aspects of visual reasoning. The table highlights the superior performance of the authors’ model compared to other open-source models, particularly in mathematical reasoning tasks. Results from closed-source models are also included for context. The best and second-best performances among open-source models are clearly indicated.
read the caption
Table 4: Evaluation Results of our model and other baseline models. Most of the baseline results are taken from other papers. The best and second-best results across all open-source models are highlighted in bold and underlined, respectively.
| Training Data | MMMU | MMMU-Pro | MMMU-Pro | MathVista | MMVet | MathVerse | Dyna-Math | Avg |
|---|---|---|---|---|---|---|---|---|
| val | standard | vision | testmini | test | testmini | test | ||
| Training from LLava-OV-mid | ||||||||
| - | 40.1 | 21.2 | 12.2 | 36.0 | 32.1 | 18.1 | 24.4 | 26.3 |
| Llava-CoT | 40.8 | 25.8 | 14.6 | 45.7 | 47.5 | 27.2 | 33.9 | 33.6 |
| Ours | 45.3 | 31.5 | 20.9 | 43.9 | 57.6 | 27.4 | 40.3 | 38.1 |
| Ours+Llava-CoT | 47.6 | 31.6 | 20.9 | 48.8 | 51.7 | 34.9 | 42.3 | 39.7 |
| Training from MAmmoTH-VL | ||||||||
| - | 50.8 | 34.8 | 25.3 | 66.0 | 62.3 | 34.2 | 44.7 | 45.4 |
| Llava-CoT | 51.4 | 35.2 | 24.6 | 63.8 | 58.7 | 39.4 | 48.3 | 45.9 |
| Ours | 52.6 | 38.6 | 29.0 | 65.9 | 61.8 | 39.4 | 55.7 | 49.0 |
| Ours+Llava-CoT | 54.7 | 40.7 | 26.3 | 68.1 | 64.5 | 42.6 | 55.7 | 50.4 |
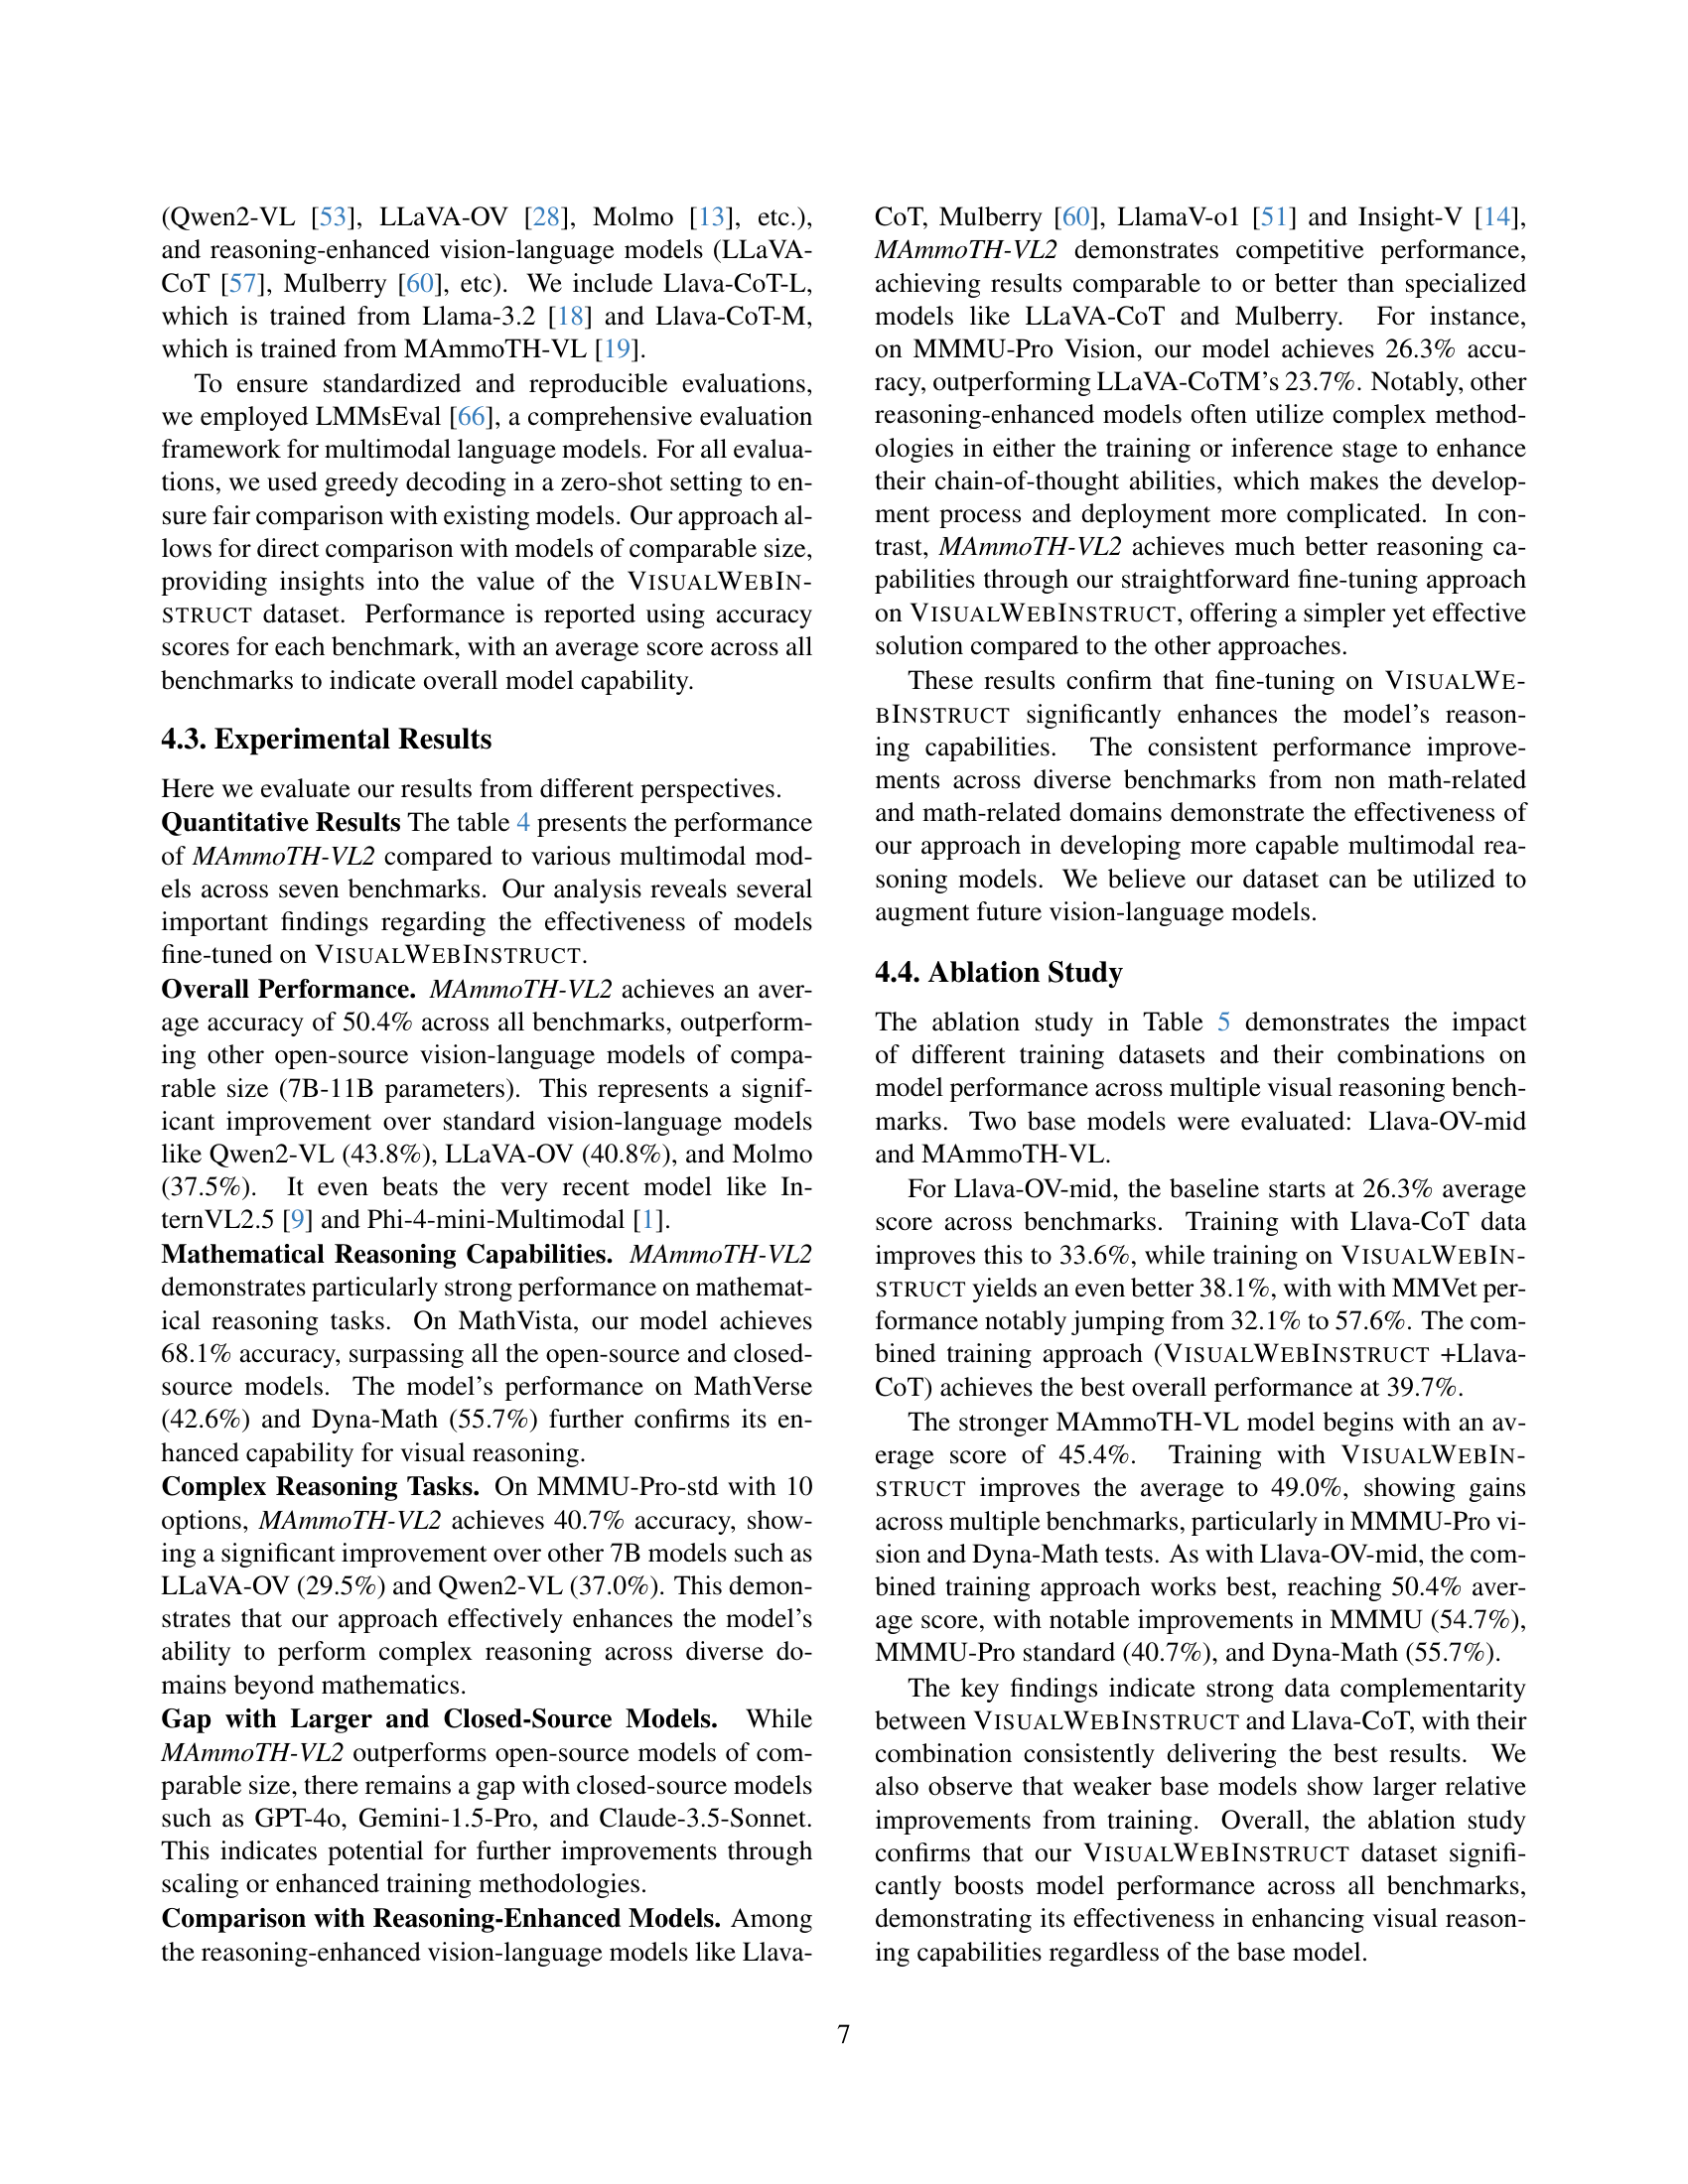
🔼 This table presents the ablation study results, showing the impact of different training data and their combinations on model performance. It compares two base models, Llava-OV-mid and MAmmoTH-VL, trained using various datasets: Llava-CoT, VisualWebInstruct, and a combination of both. The results are presented as average scores across seven benchmarks (MMMU, MMMU-Pro, MathVista, MMVet, MathVerse, DynaMath) for each training configuration. The best performance for each base model is highlighted in bold, illustrating the contribution of the VisualWebInstruct dataset and data mixing strategies to improved performance on various visual reasoning tasks.
read the caption
Table 5: Ablation Results of our experiments. We show experimental results from different backbones to show the impact of consistency filtering and data mixing with Llava-CoT. For each base model, the best performance is highlighted in bold.
Full paper#