TL;DR#
As the number of publicly available models grows, navigating and analyzing these repositories becomes increasingly challenging. Existing model documentation is often incomplete. This limitation hinders the discovery of valuable models and the understanding of the machine learning landscape. To address these issues, this work focuses on charting a preliminary atlas of models within the Hugging Face repository. Visualizations reveal intricate structures and trends in the relationships between these models.
To address the challenge, the paper introduces a novel atlas charting method that identifies and leverages common patterns in model repositories. This enables accurate mapping of previously undocumented regions. The paper makes its dataset, code, and interactive atlas publicly available. This enables trend analysis, measuring model impact, predicting model attributes, and recovering the lineage of models in large repositories. The results demonstrate significant improvements in atlas structure recovery and attribute prediction, paving the way for more effective model discovery and utilization.
Key Takeaways#
Why does it matter?#
This paper introduces a novel atlas and charting method for Hugging Face models, revealing hidden model relationships and improving attribute prediction. This work provides insights that can help researchers better navigate and utilize the growing number of available models, optimize resource allocation, and explore novel model training paradigms.
Visual Insights#

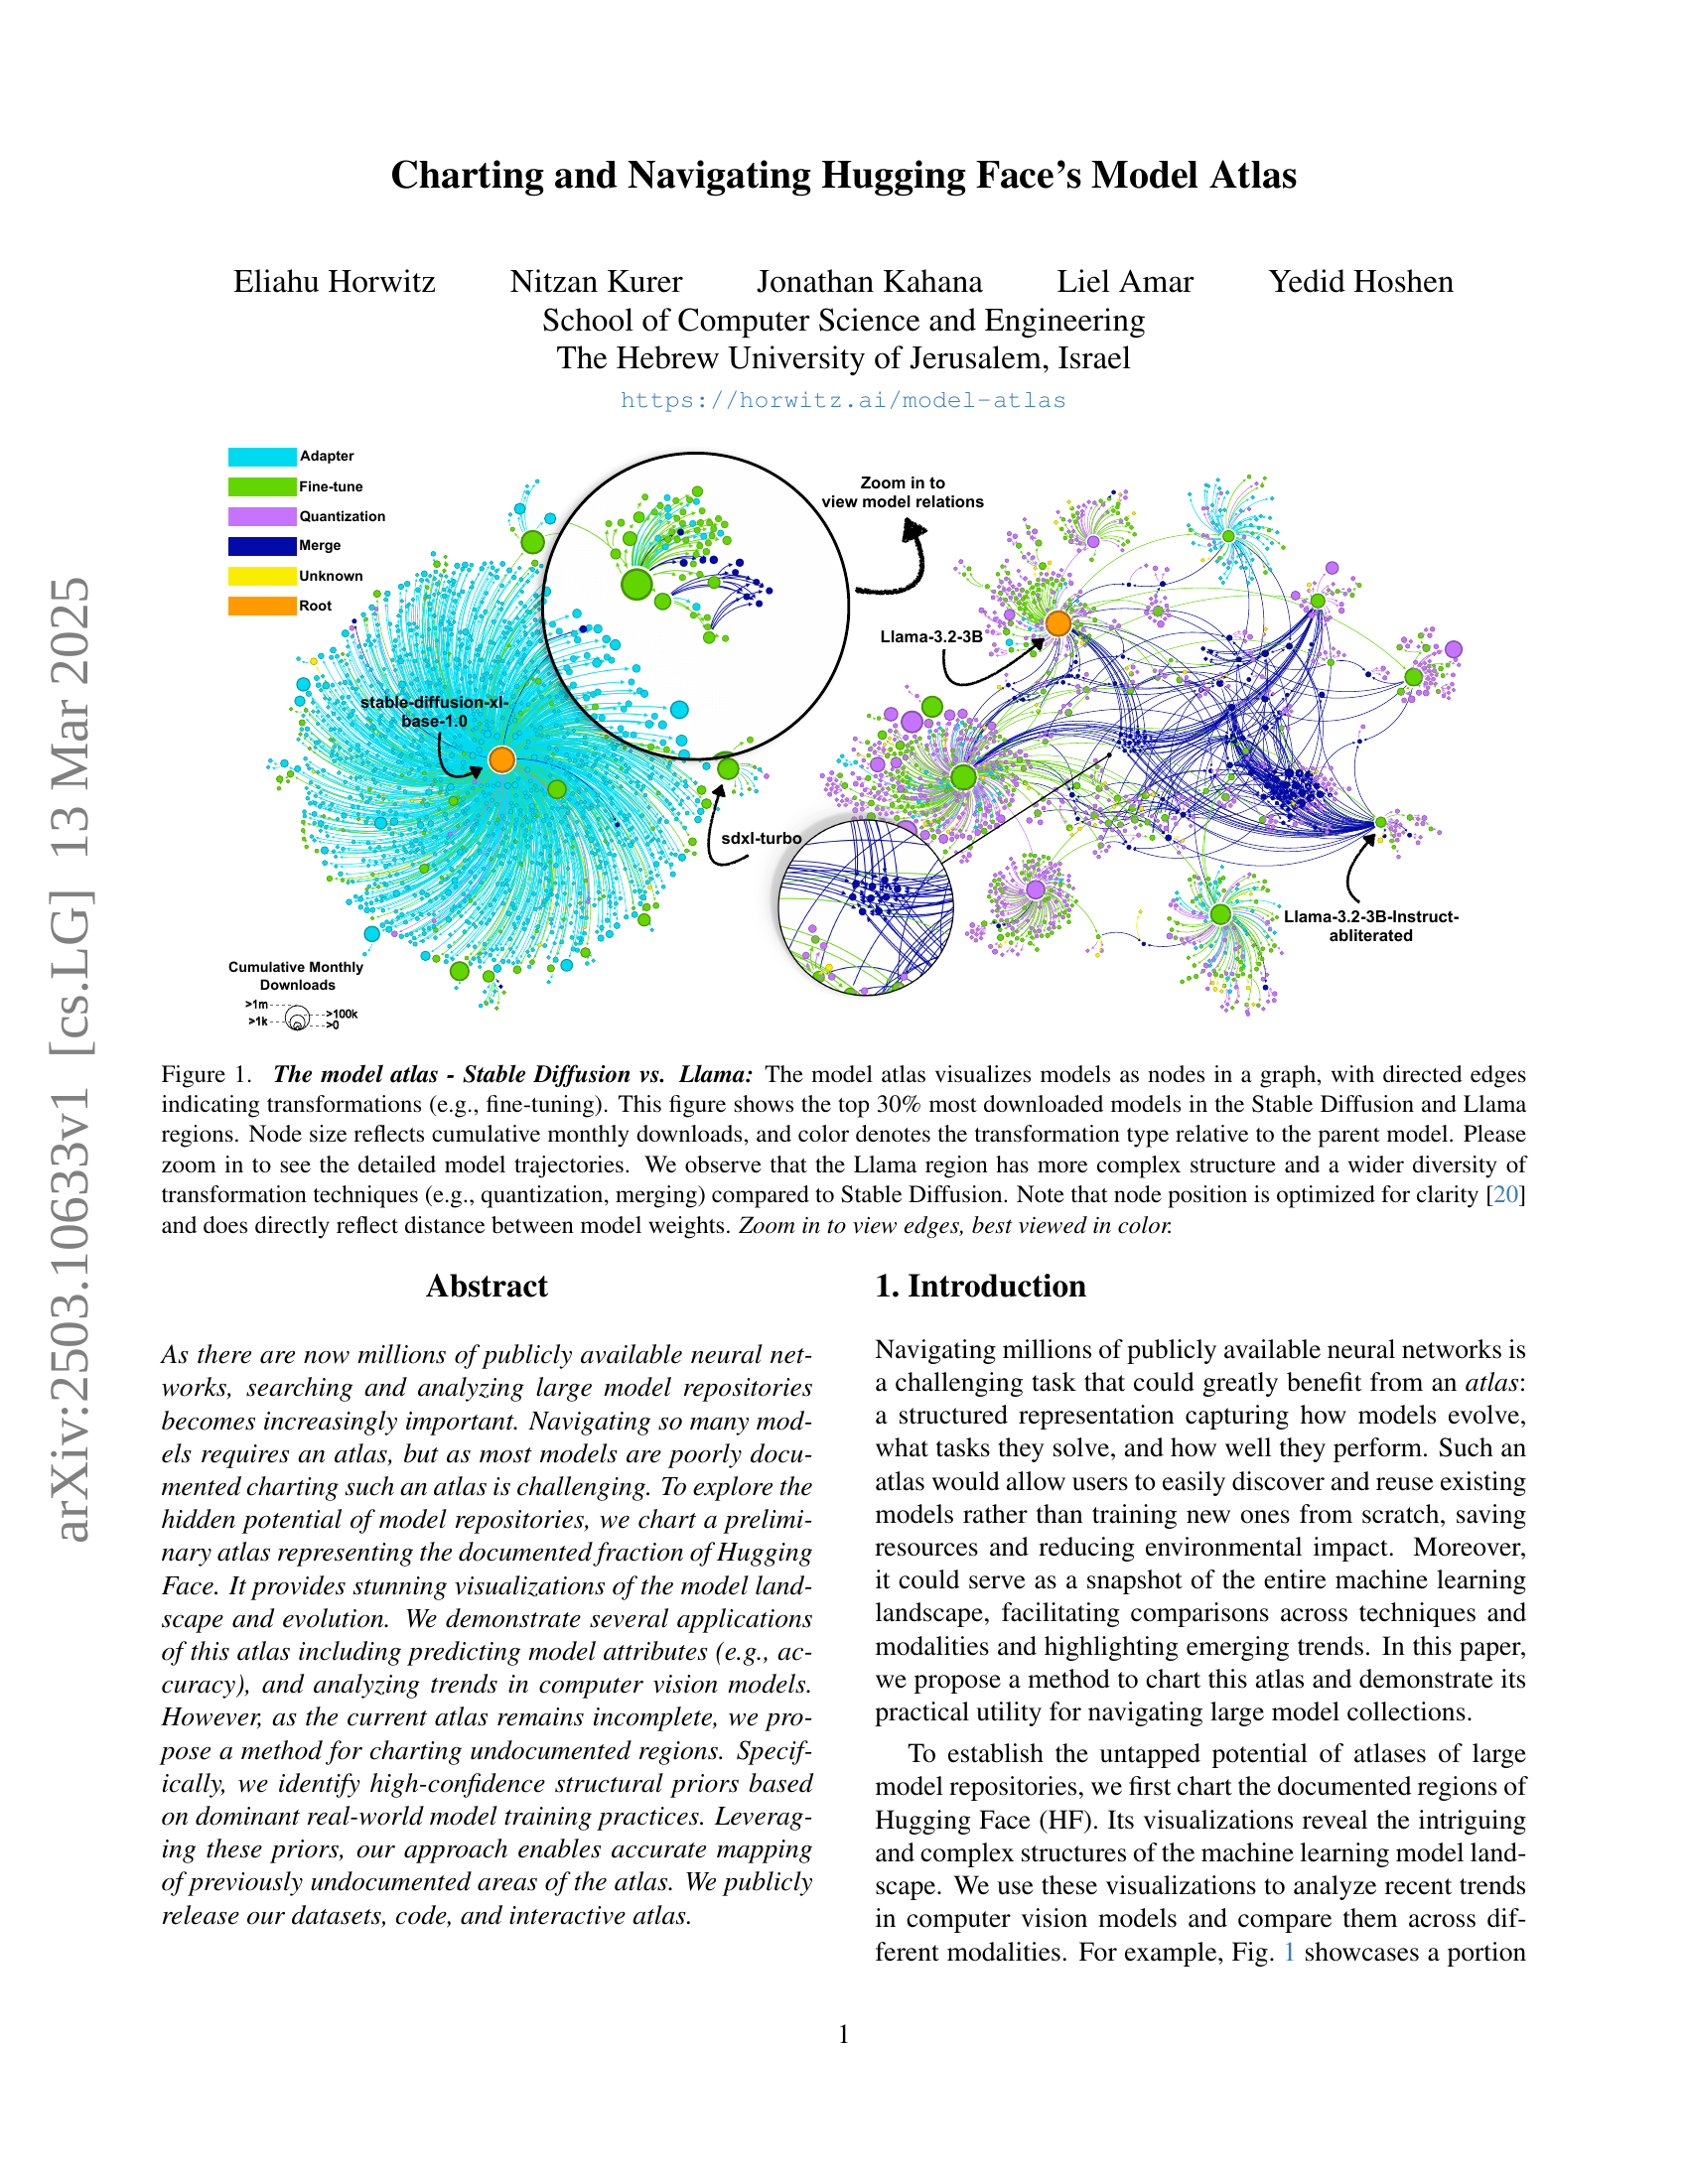
🔼 This figure visualizes a graph representation of machine learning models from the Hugging Face model repository, focusing on the Stable Diffusion and Llama model families. Nodes represent individual models, with their size corresponding to the cumulative number of monthly downloads. Directed edges connect models, showing the lineage of transformations applied (e.g., fine-tuning, quantization, merging). The color of an edge indicates the type of transformation. By comparing the two model families, the visualization highlights differences in model complexity and the types of transformations used, revealing that Llama models exhibit a richer diversity of transformation techniques and a more complex structure than Stable Diffusion models.
read the caption
Figure 1: The model atlas - Stable Diffusion vs. Llama: The model atlas visualizes models as nodes in a graph, with directed edges indicating transformations (e.g., fine-tuning). This figure shows the top 30% most downloaded models in the Stable Diffusion and Llama regions. Node size reflects cumulative monthly downloads, and color denotes the transformation type relative to the parent model. Please zoom in to see the detailed model trajectories. We observe that the Llama region has more complex structure and a wider diversity of transformation techniques (e.g., quantization, merging) compared to Stable Diffusion. Note that node position is optimized for clarity [20] and does directly reflect distance between model weights. Zoom in to view edges, best viewed in color.
 |  |
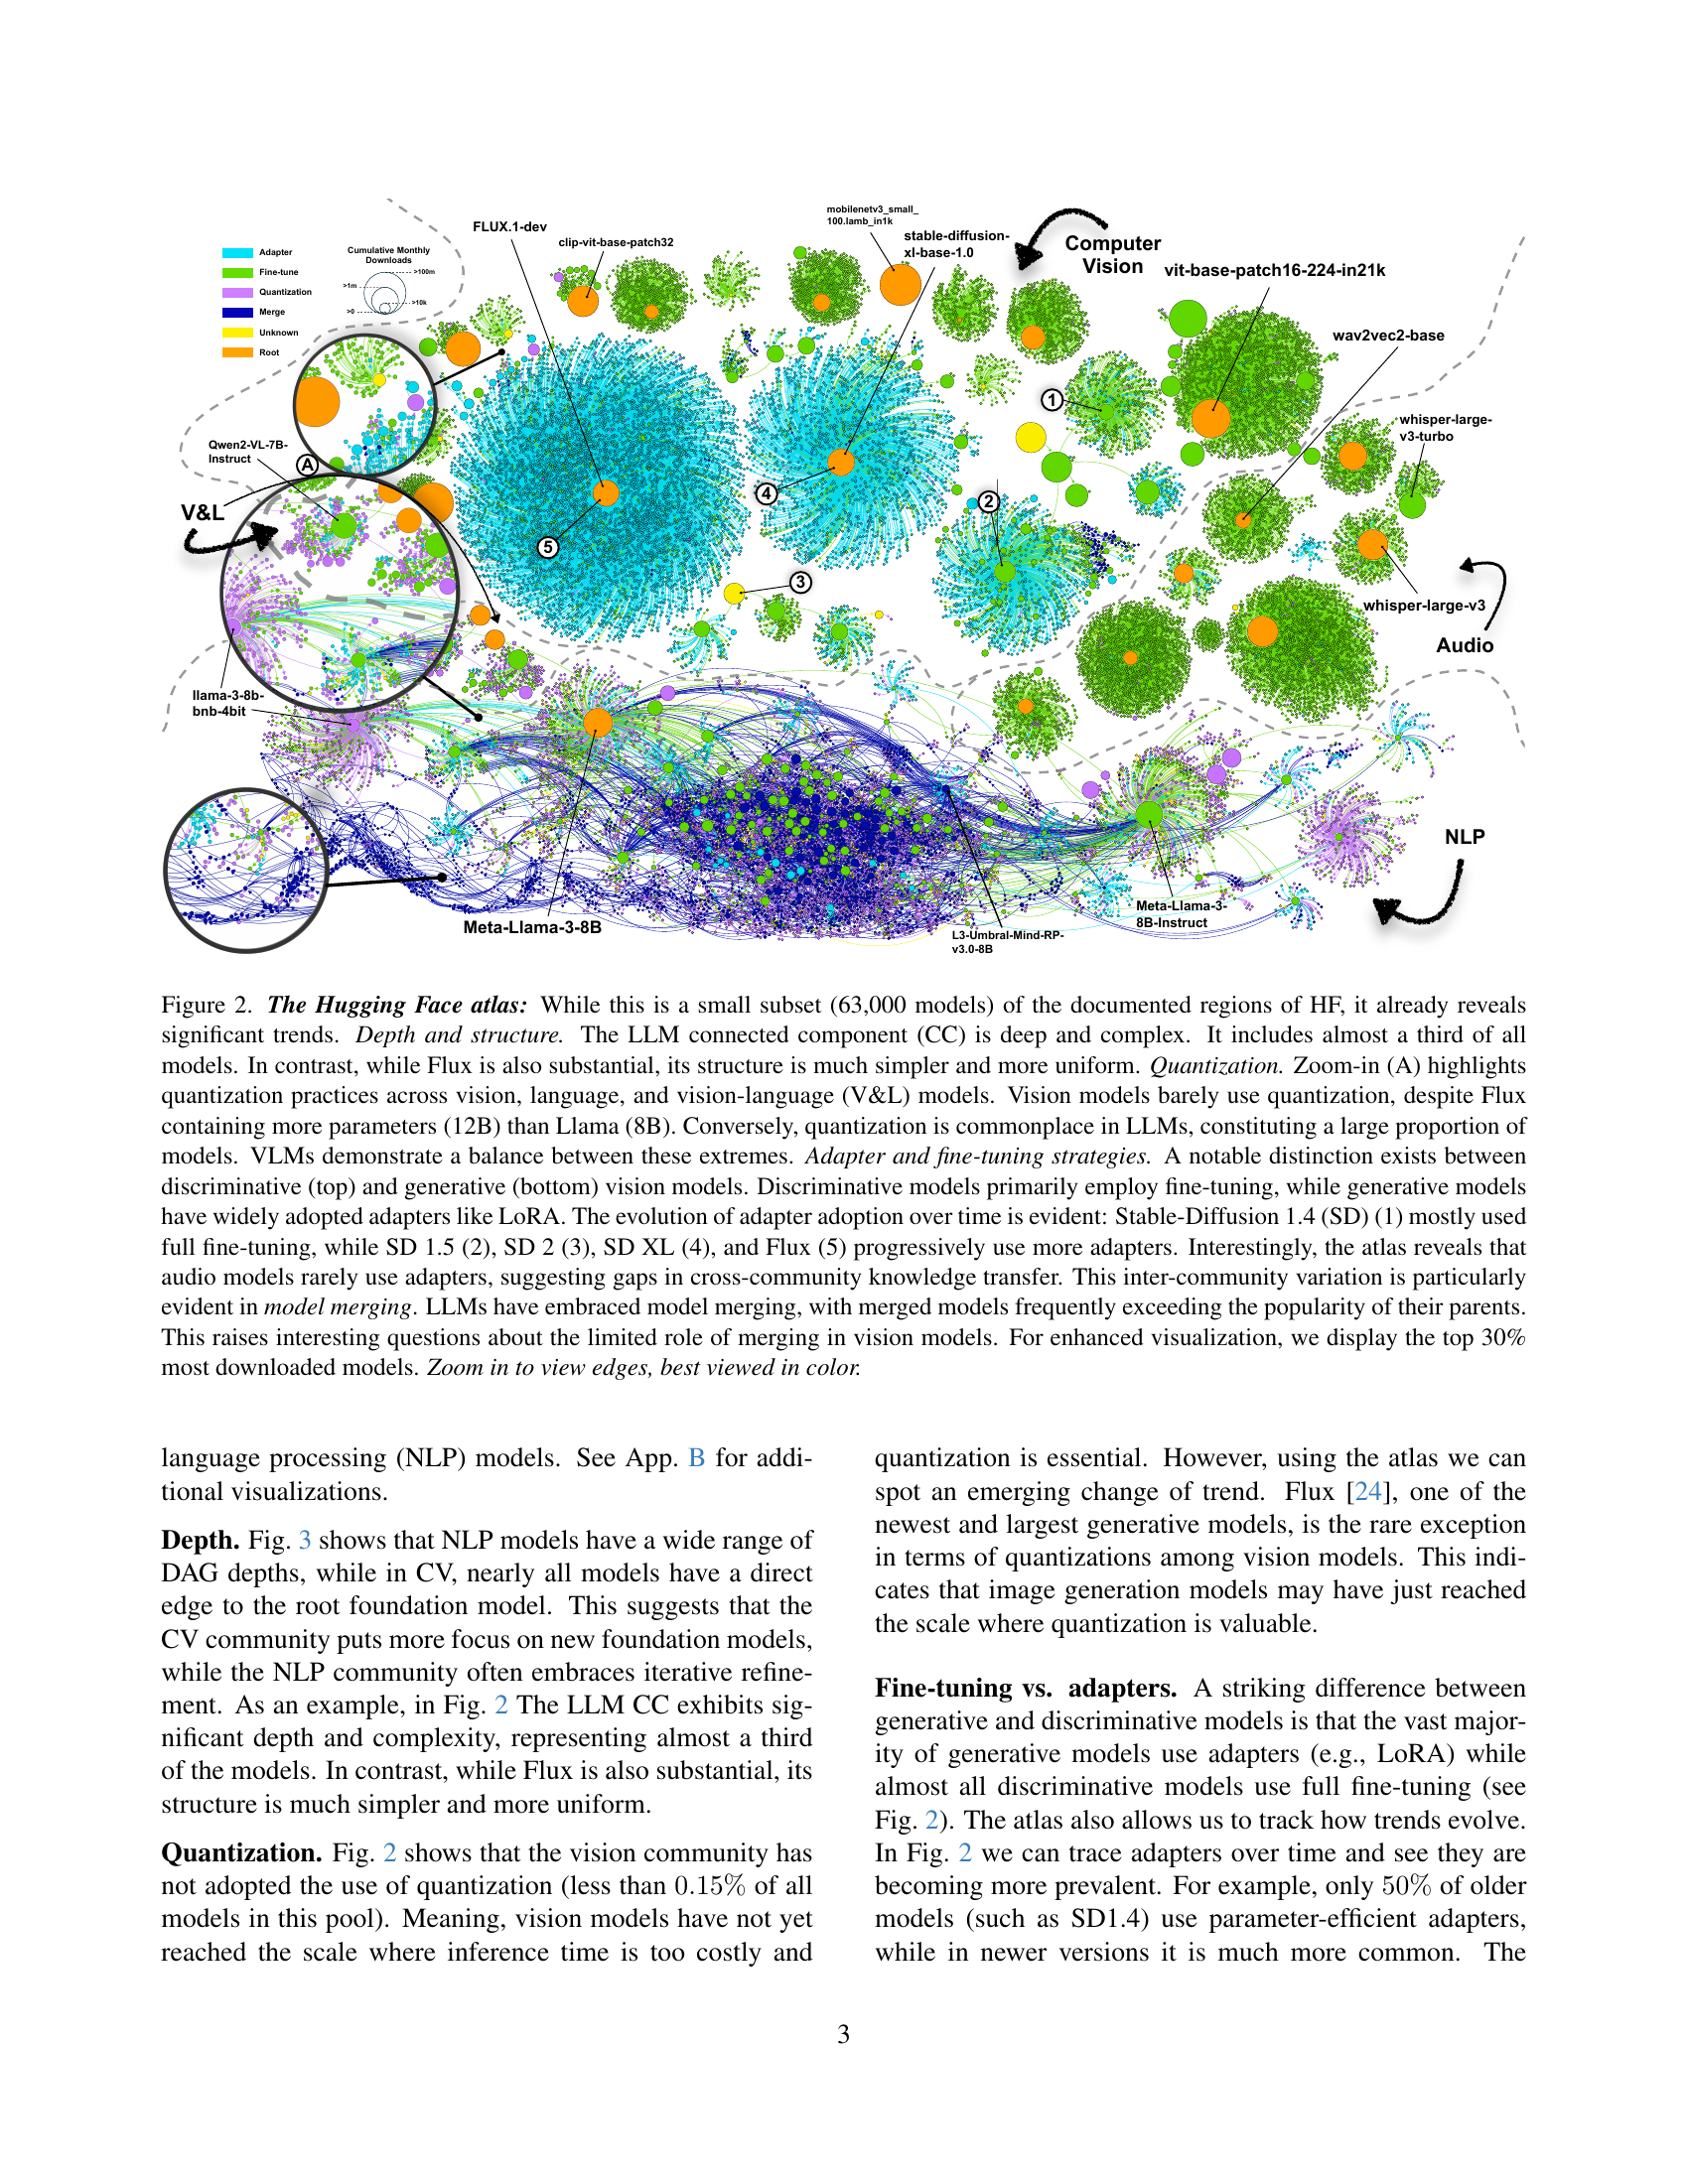
🔼 This table presents a comparison of model attribute prediction using two methods: a baseline approach that uses the majority label and an atlas-based approach that leverages the model’s relationships within the atlas. Part (a) shows the results for predicting model accuracy using the Mistral-7B CC dataset, comparing mean squared error (MSE), mean absolute error (MAE), and correlation between predicted and actual accuracy values for different numbers of nearest neighbors considered in the atlas-based prediction. Part (b) shows the prediction accuracy for other model attributes (pipeline tag, library name, model type, license, and relation type), comparing the atlas-based approach’s results with a simple graph average baseline. The atlas-based approach significantly improves prediction accuracy for all attributes over the baseline method.
read the caption
Table 1: Atlas-based documentation imputation: Using atlas structure improves prediction of model accuracy and other attributes, compared to naively using the majority label. In (b), we report the prediction accuracy.
In-depth insights#
HF Atlas: Overview#
The Hugging Face (HF) Atlas, as conceived in this research, represents a significant advancement in navigating and understanding the complex landscape of pre-trained models. It aims to create a structured representation of the HF repository, capturing relationships between models based on their evolution, tasks, and performance. This is crucial because the sheer volume of models (millions) makes manual discovery and analysis impractical. The atlas uses a directed acyclic graph (DAG) to visualize model lineages, where nodes represent models and edges indicate transformations like fine-tuning or quantization. The research highlights the limitations of relying solely on model documentation (Model Cards), which is often incomplete. The atlas, therefore, acts as a knowledge graph, providing insights into model trends, accuracy prediction, and heritage recovery. Visualizations of the atlas reveal interesting patterns, such as the differing adoption of techniques (quantization, adapters) across modalities (vision vs. language). The atlas facilitates a deeper understanding of model relationships and dependencies.
Charting HF: Method#
Charting a model repository like Hugging Face (HF) requires a robust methodology to map the complex relationships between models. The method should address challenges like incomplete documentation, model duplication, and diverse transformation techniques (fine-tuning, quantization, merging). Handling duplicates and near-duplicates, which can skew distance-based approaches, is also crucial. The method also needs to take account of temporal dependencies, where the creation timestamp is a crucial piece of information, parent models typically have earlier upload times than their children; thus incorporating temporal dynamics becomes essential for accurately inferring model lineage. A sophisticated method will classify patterns, such as “fan” or “snake”, from weight distance, identifying hyper parameter sweeps (fan) and checkpoint trajectories (snake). This involves efficient distance metric calculation between model weights and handling merges, which create non-tree DAG structures. Efficient charting also needs to handle situations where model weights variance is low. A good method should classify structure to distinguish between model types.
ML Trend Analysis#
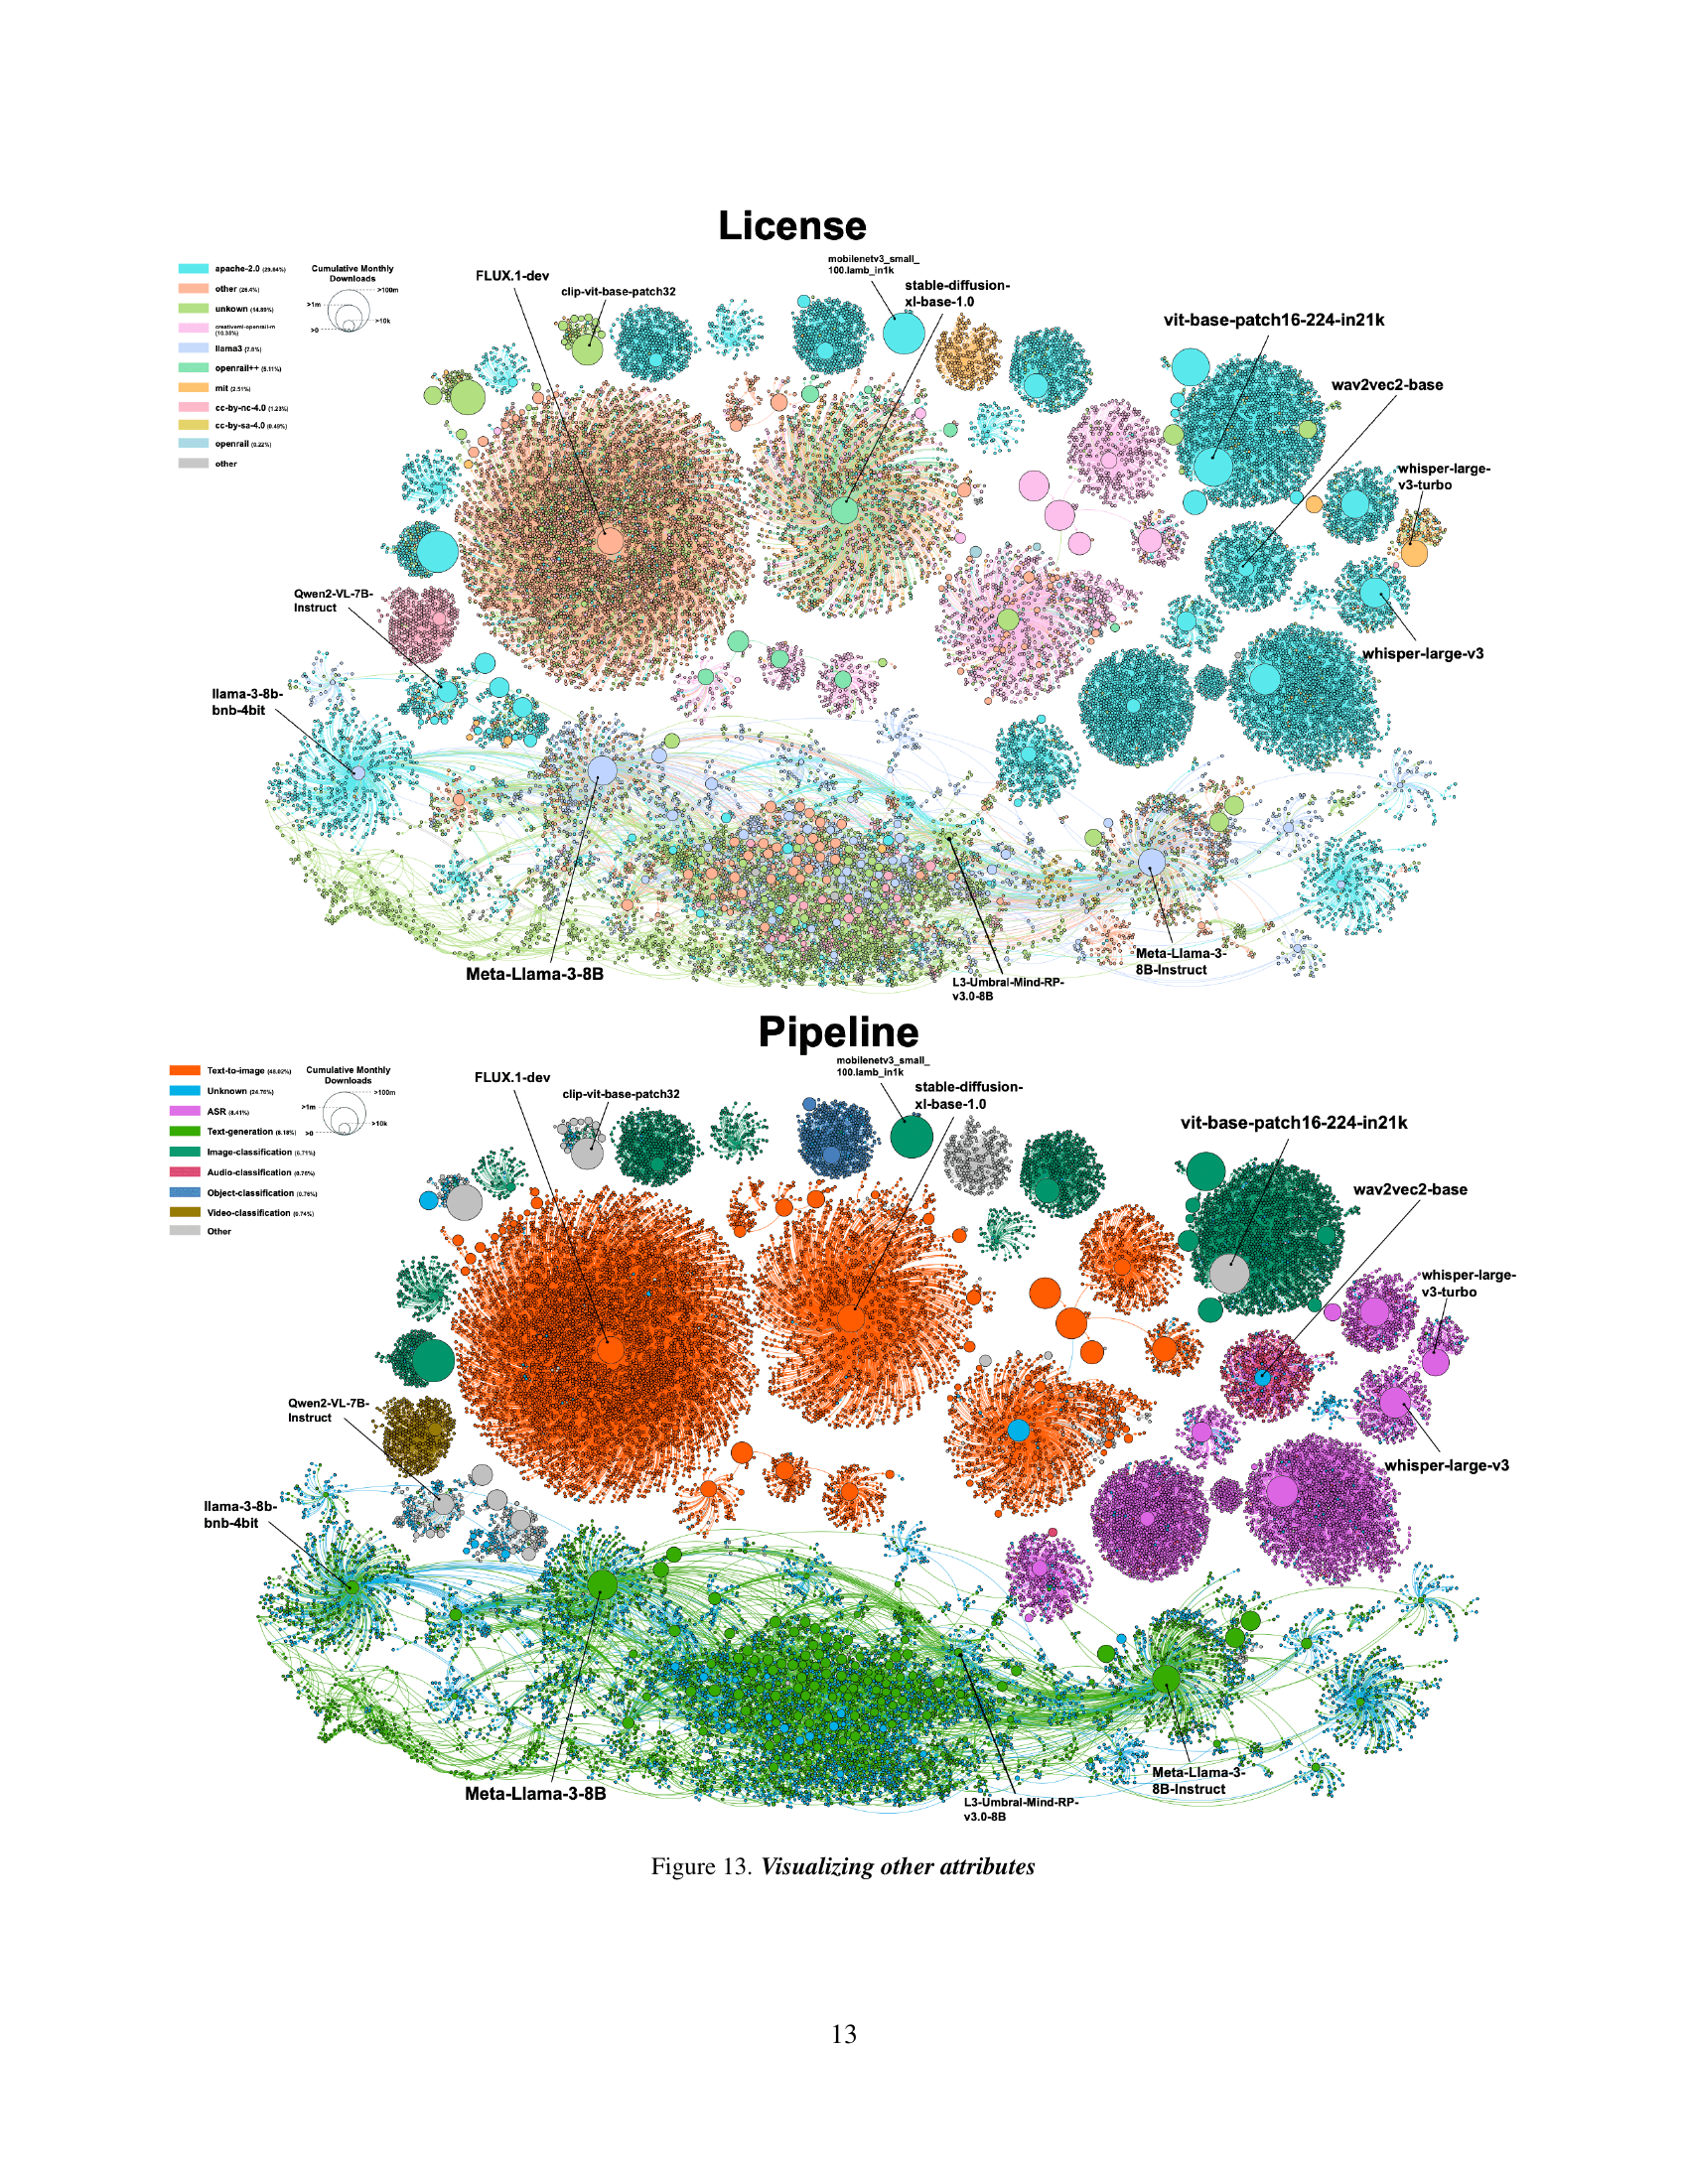
Model repository atlases offer a structured view of ML evolution, showing relationships, tasks, and performance. Hugging Face (HF), the largest public model repository, shows complex model landscape with intriguing structures. Visualizations expose trends in computer vision (CV) and natural language processing (NLP). NLP models exhibit greater DAG depth, suggesting iterative refinement, while CV models often directly link to foundation models. Quantization is common in LLMs, but emerging in vision (e.g., Flux). Fine-tuning dominates discriminative vision models; generative models increasingly adopt adapters. Merging is more prevalent in NLP than CV. These atlases offer valuable insights for analyzing model impact, tracing lineage, and charting undocumented areas of the model landscape. The research also suggests that the atlas structure can predict model attributes, improve model impact measurement, and helps in restoring removed models.
Accuracy Prediction#
The section on accuracy prediction highlights a crucial aspect of model repositories: the often-missing or incomplete accuracy metrics. Given that users prioritize accurate models, this is a significant limitation. The paper’s approach leverages the model DAG structure to predict accuracy, using nearest neighbors in the atlas. This is insightful, as it suggests that models derived from similar origins or with similar transformations tend to exhibit comparable performance. The use of average nearest neighbor accuracy improves over simply relying on the majority label. This reveals a potential for ’transfer learning’ of accuracy metrics, where knowledge about one model’s performance can inform expectations about related models, even when direct evaluation data is scarce. Effectively imputing such metrics could greatly enhance model discoverability and selection within large repositories.
IP Tracking Atlas#
Intellectual Property (IP) tracking is critical in AI. An atlas helps determine model usage and data dependencies, crucial for rights management. If a model has a specific license or uses particular data, all descendants are affected. Completing the atlas improves IP integrity and prevents unauthorized use, ensuring compliance and proper attribution. This aids in preventing copyright infringements and ensuring fairness in model deployment and usage.
More visual insights#
More on figures

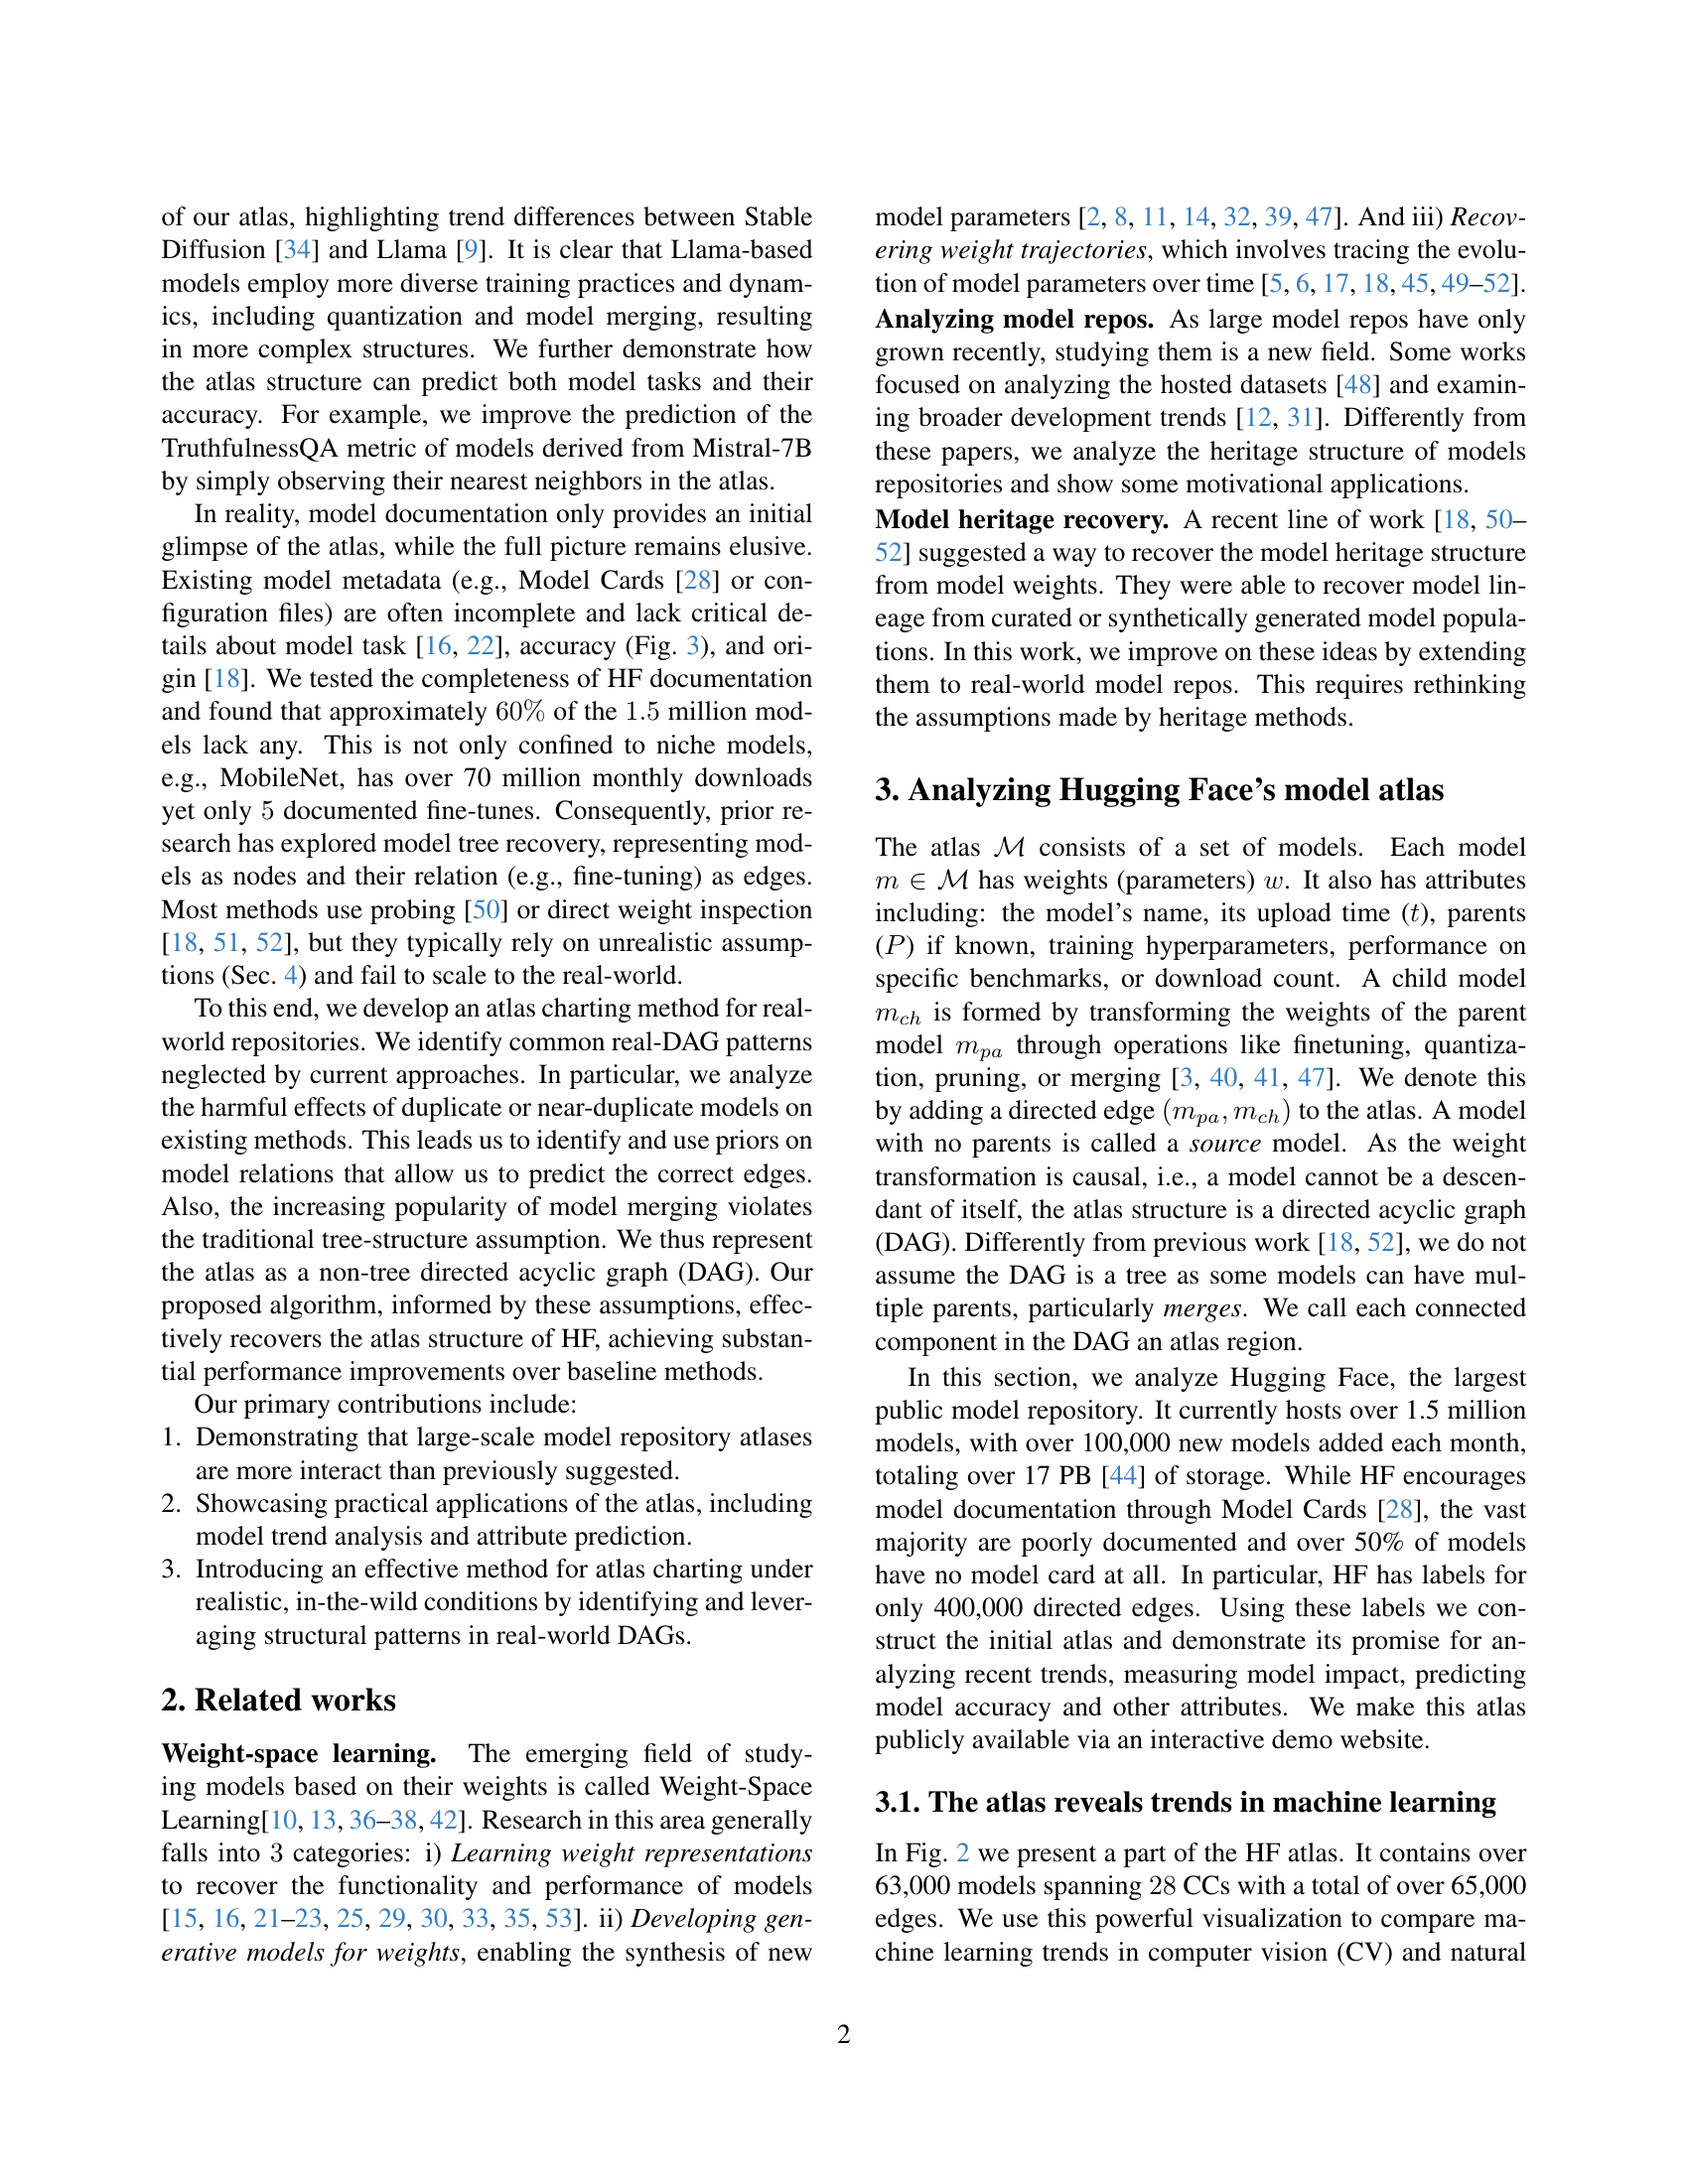
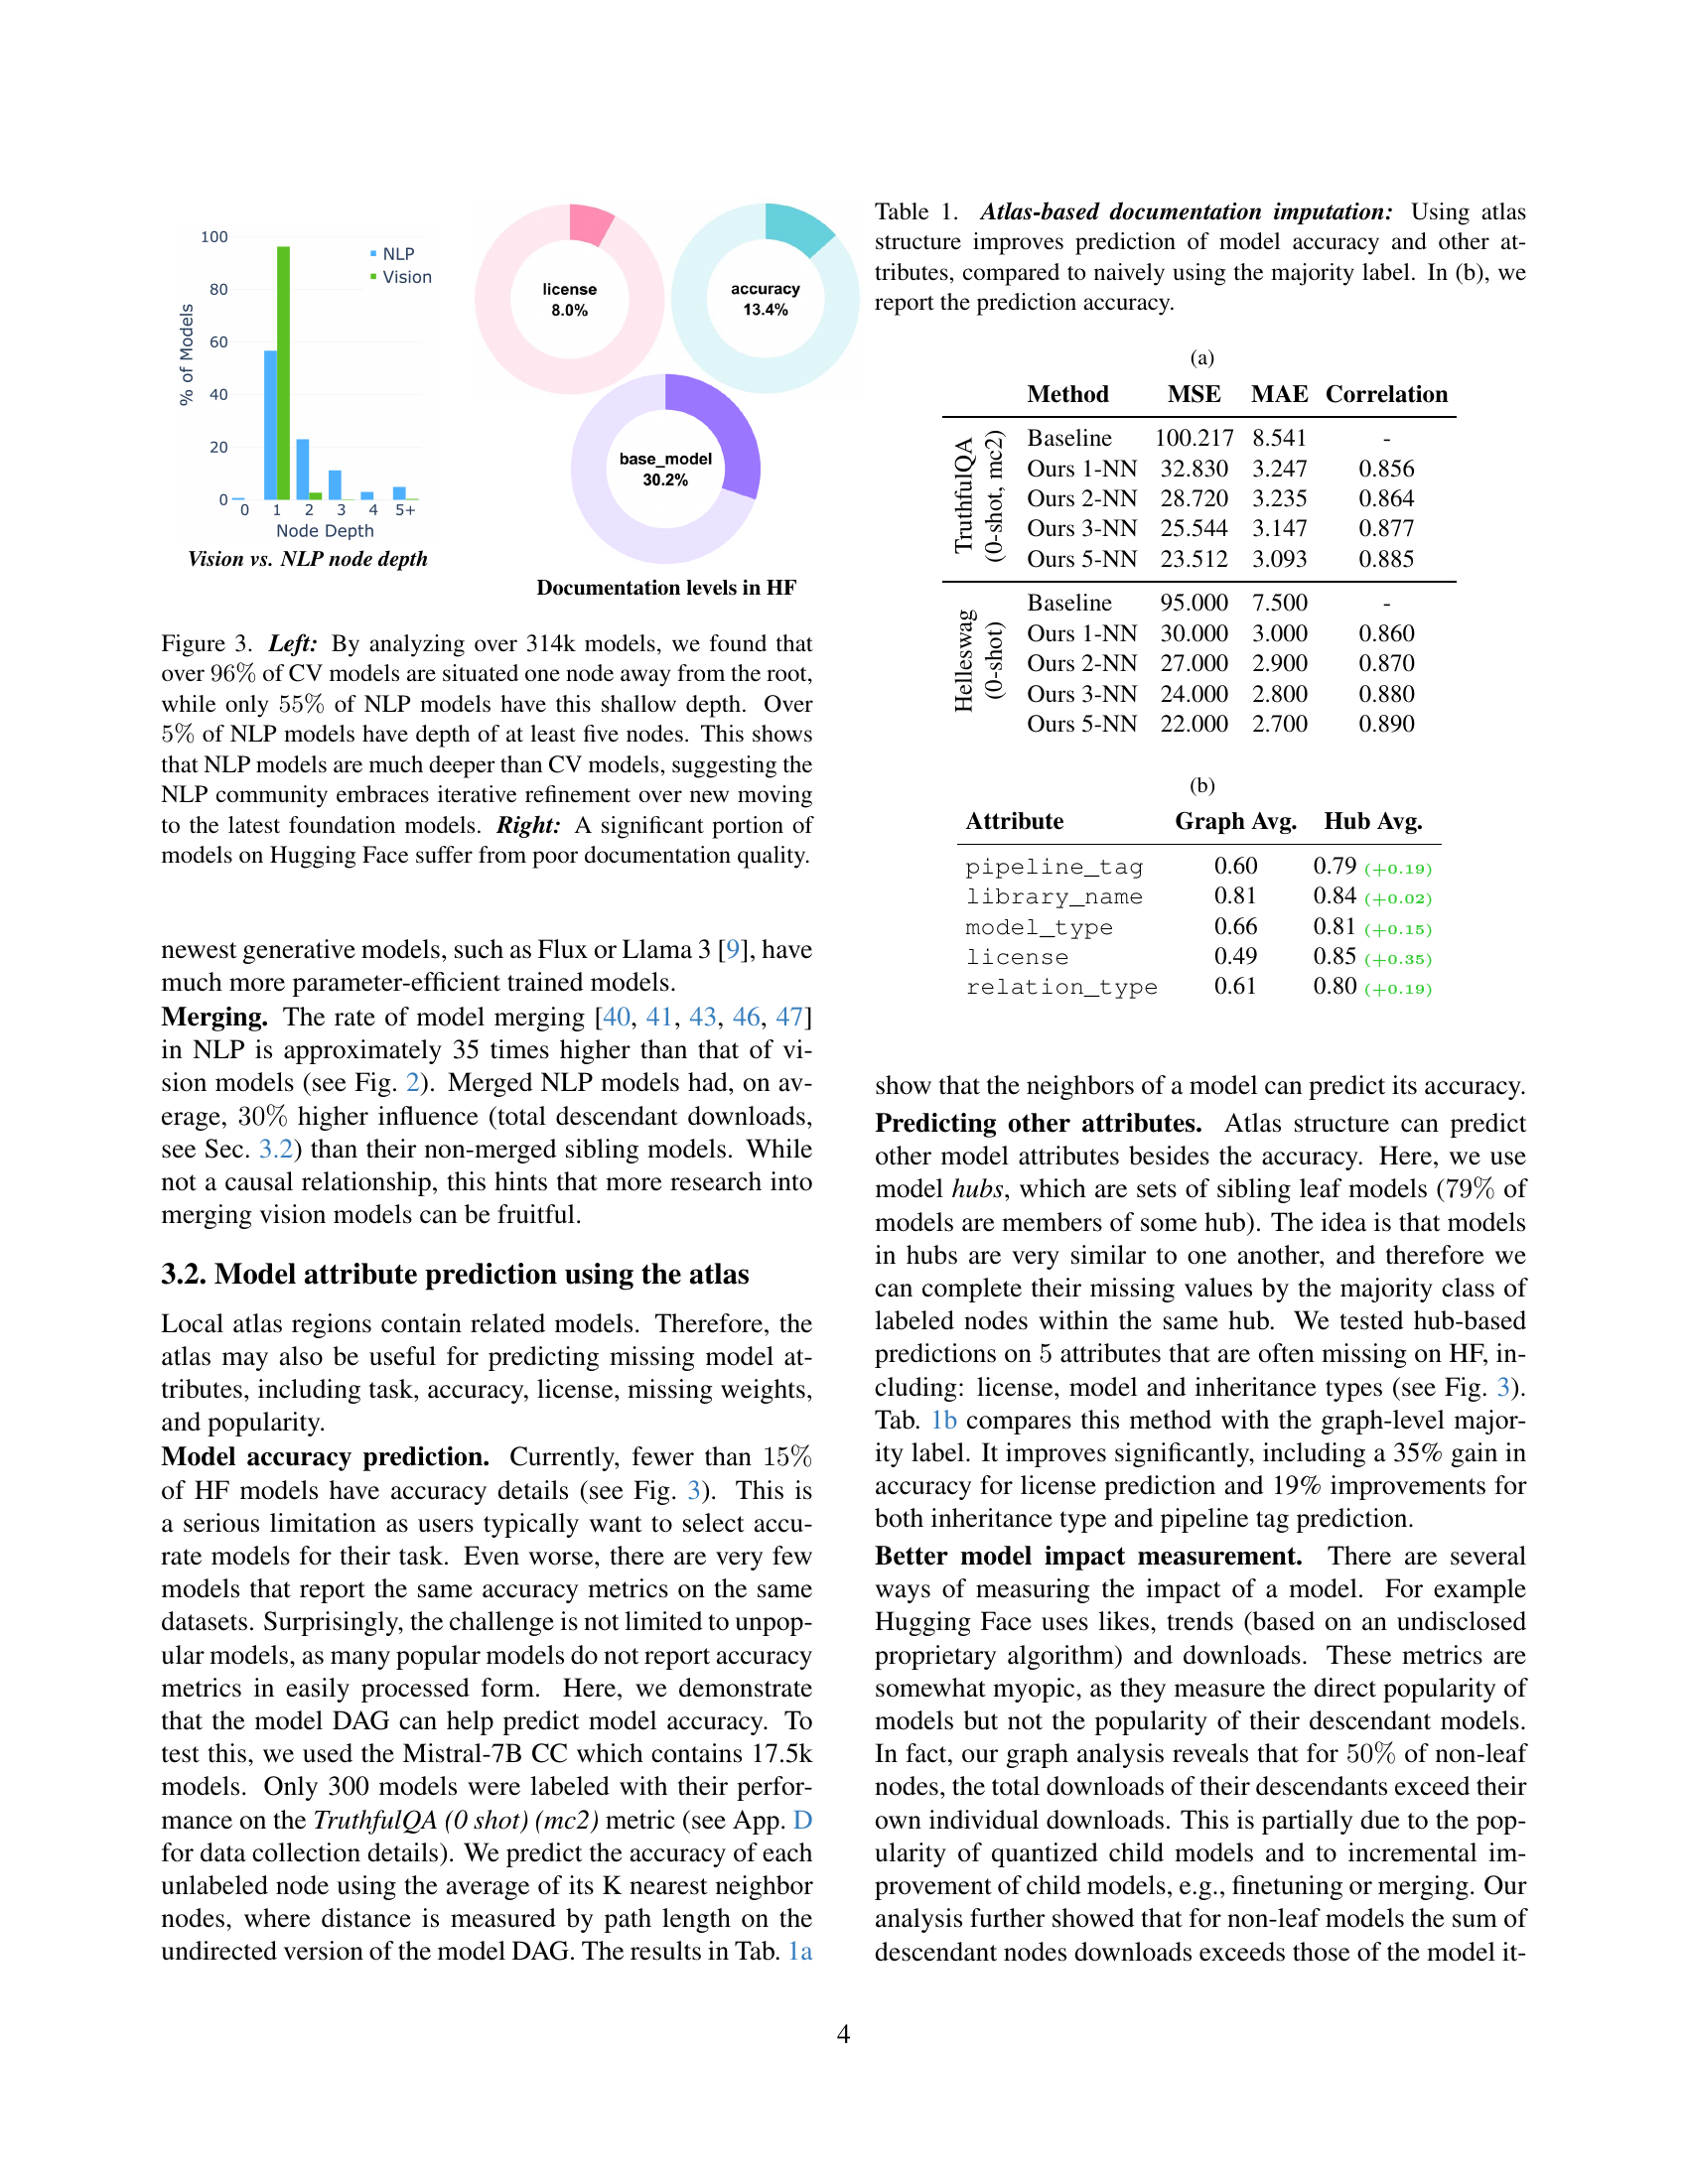
🔼 Figure 2 visualizes a portion of the Hugging Face model atlas, showcasing the relationships between 63,000 models. The visualization highlights several key trends: the depth and complexity of Large Language Model (LLM) lineages compared to simpler structures like Flux; the prevalence of quantization in LLMs versus its near absence in vision models; and differing fine-tuning strategies between discriminative and generative vision models (discriminative models favor fine-tuning, while generative models use adapters like LoRA). The figure also shows how adapter usage has increased over time in certain model families (Stable Diffusion) and how LLMs utilize model merging more often than other model types. The visualization includes nodes representing models and edges indicating transformations. Node sizes represent model popularity (top 30% of downloads shown), and colors represent transformation types. Zooming in is necessary to fully appreciate the details.
read the caption
Figure 2: The Hugging Face atlas: While this is a small subset (63,000 models) of the documented regions of HF, it already reveals significant trends. Depth and structure. The LLM connected component (CC) is deep and complex. It includes almost a third of all models. In contrast, while Flux is also substantial, its structure is much simpler and more uniform. Quantization. Zoom-in (A) highlights quantization practices across vision, language, and vision-language (V&L) models. Vision models barely use quantization, despite Flux containing more parameters (12B) than Llama (8B). Conversely, quantization is commonplace in LLMs, constituting a large proportion of models. VLMs demonstrate a balance between these extremes. Adapter and fine-tuning strategies. A notable distinction exists between discriminative (top) and generative (bottom) vision models. Discriminative models primarily employ fine-tuning, while generative models have widely adopted adapters like LoRA. The evolution of adapter adoption over time is evident: Stable-Diffusion 1.4 (SD) (1) mostly used full fine-tuning, while SD 1.5 (2), SD 2 (3), SD XL (4), and Flux (5) progressively use more adapters. Interestingly, the atlas reveals that audio models rarely use adapters, suggesting gaps in cross-community knowledge transfer. This inter-community variation is particularly evident in model merging. LLMs have embraced model merging, with merged models frequently exceeding the popularity of their parents. This raises interesting questions about the limited role of merging in vision models. For enhanced visualization, we display the top 30% most downloaded models. Zoom in to view edges, best viewed in color.

🔼 This figure is a combined visualization showing two key aspects of the Hugging Face model repository. The left panel presents a bar chart comparing the depth of model trees in Computer Vision (CV) and Natural Language Processing (NLP). It reveals that the vast majority (over 96%) of CV models have a shallow tree structure, with most being only one node away from the root. Conversely, NLP models exhibit significantly greater depth, with over 5% having a depth of five or more nodes. This highlights a key difference in the model development approach between the two communities: CV leans towards using new foundation models, while NLP favors iterative refinement and building upon existing models. The right panel of the figure shows a pie chart illustrating the level of documentation available for models in the Hugging Face repository. It demonstrates that a substantial portion of models lack complete documentation.
read the caption
Figure 3: Left: By analyzing over 314k models, we found that over 96%percent9696\%96 % of CV models are situated one node away from the root, while only 55%percent5555\%55 % of NLP models have this shallow depth. Over 5%percent55\%5 % of NLP models have depth of at least five nodes. This shows that NLP models are much deeper than CV models, suggesting the NLP community embraces iterative refinement over new moving to the latest foundation models. Right: A significant portion of models on Hugging Face suffer from poor documentation quality.

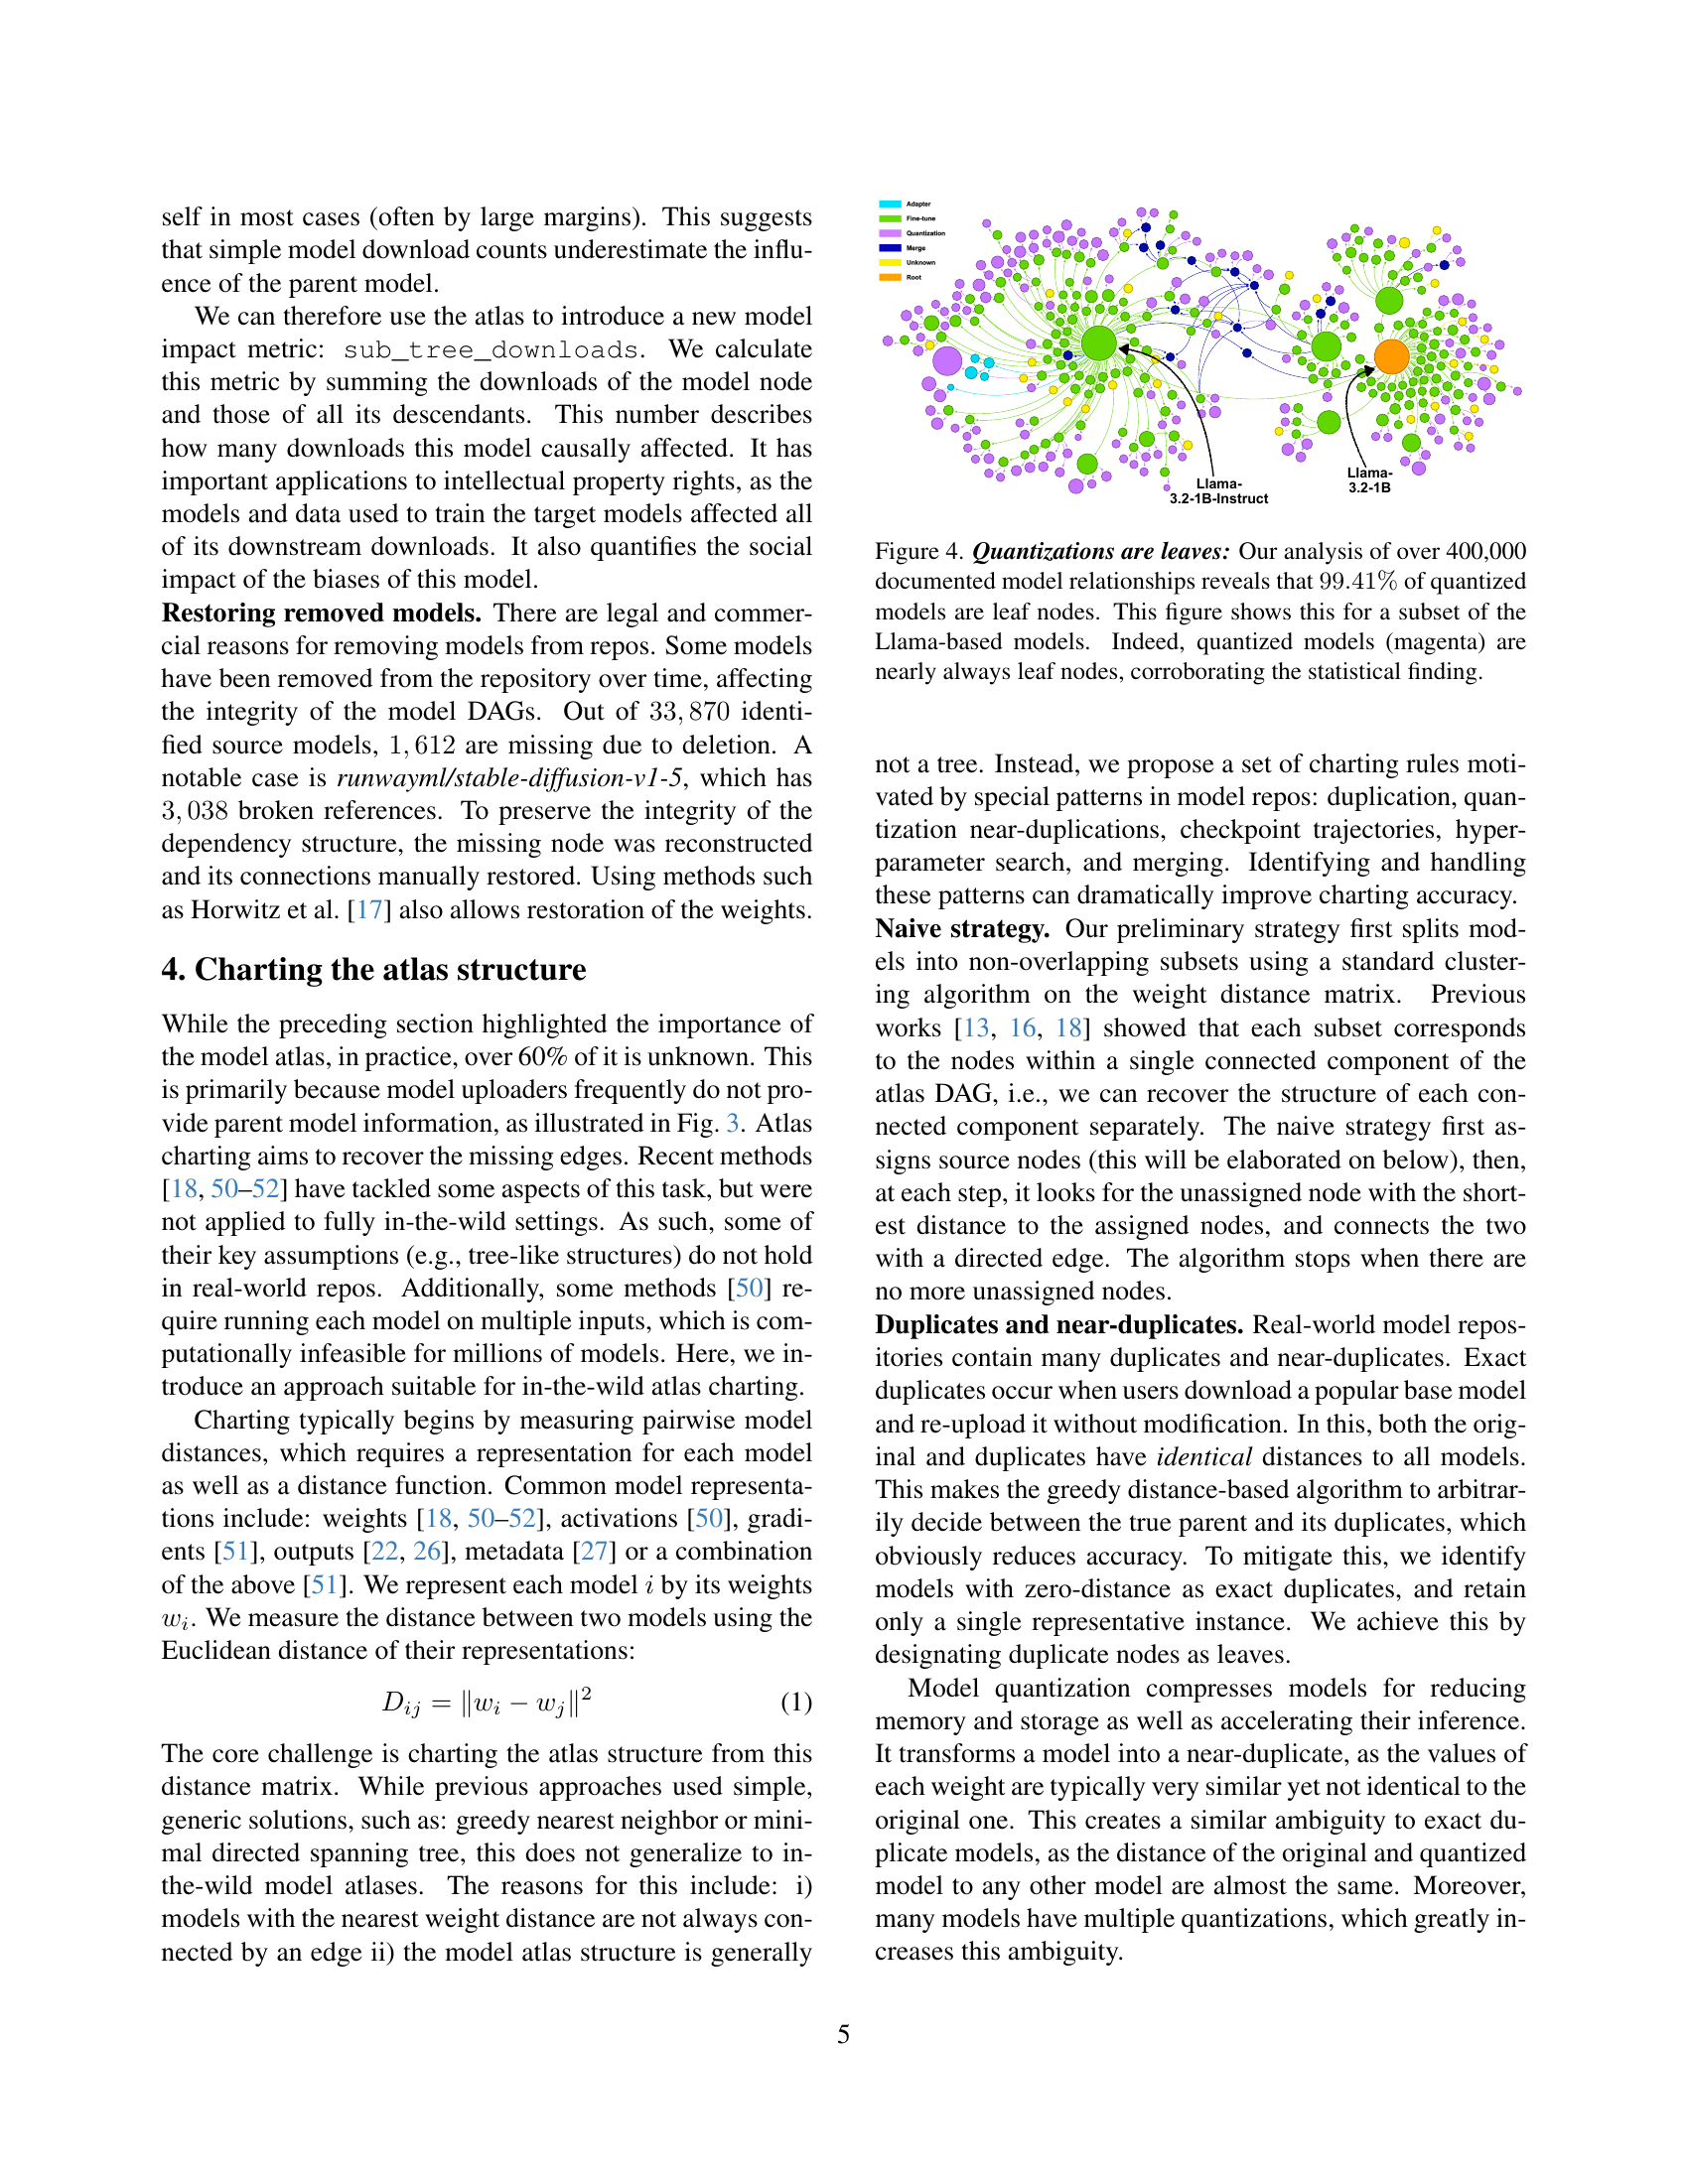
🔼 This figure visualizes a subset of Llama-based models from the Hugging Face model repository to demonstrate a key observation: quantized models rarely have child models (i.e., they are leaf nodes). An analysis of over 400,000 model relationships showed that 99.41% of quantized models are leaf nodes. The figure uses color-coding (magenta) to highlight the quantized models, providing visual confirmation of this statistical finding. This suggests that quantized models are typically not further modified or used as bases for creating other models, possibly due to performance reasons.
read the caption
Figure 4: Quantizations are leaves: Our analysis of over 400,000 documented model relationships reveals that 99.41%percent99.4199.41\%99.41 % of quantized models are leaf nodes. This figure shows this for a subset of the Llama-based models. Indeed, quantized models (magenta) are nearly always leaf nodes, corroborating the statistical finding.

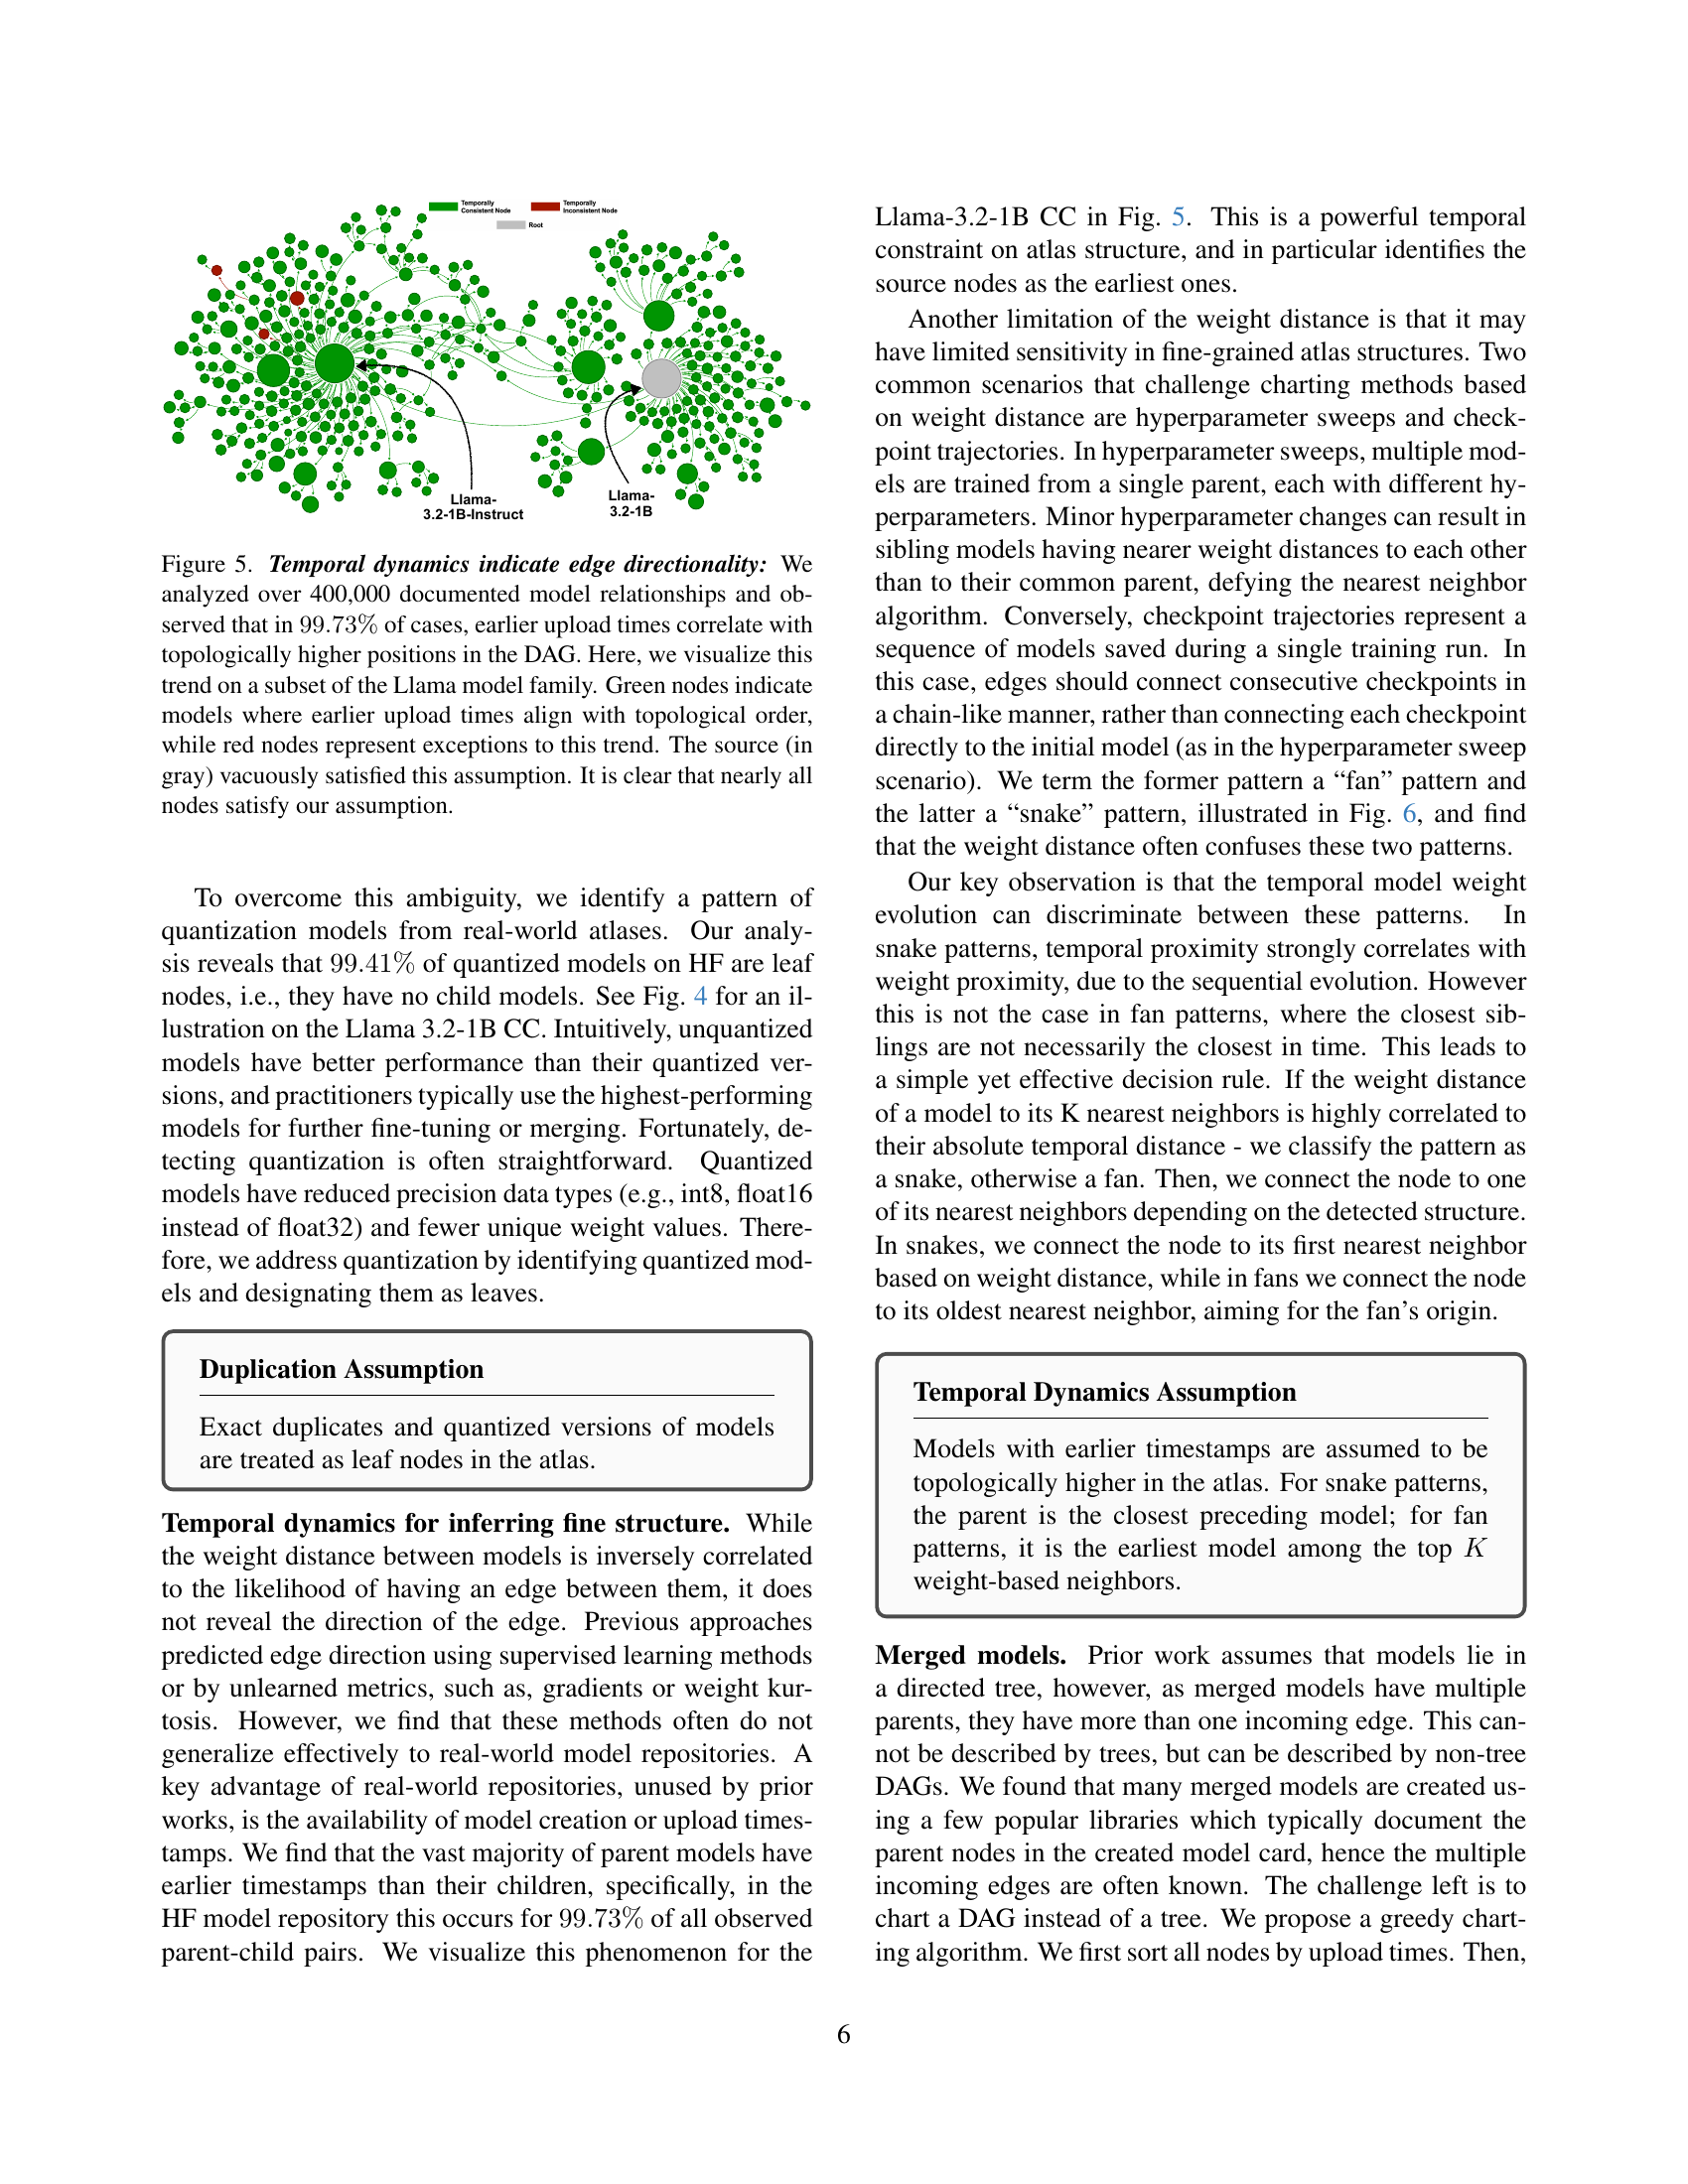
🔼 This figure demonstrates the strong correlation between model upload time and their position within the directed acyclic graph (DAG) structure of the model atlas. By analyzing over 400,000 documented model relationships, the authors found that in 99.73% of cases, models uploaded earlier appear higher in the DAG hierarchy. The visualization focuses on a subset of the Llama model family, using green nodes to represent models that adhere to this temporal ordering and red nodes for exceptions. The single source model is shown in gray. The overwhelming prevalence of green nodes supports the temporal relationship as a strong indicator of the model lineage within the atlas.
read the caption
Figure 5: Temporal dynamics indicate edge directionality: We analyzed over 400,000 documented model relationships and observed that in 99.73%percent99.7399.73\%99.73 % of cases, earlier upload times correlate with topologically higher positions in the DAG. Here, we visualize this trend on a subset of the Llama model family. Green nodes indicate models where earlier upload times align with topological order, while red nodes represent exceptions to this trend. The source (in gray) vacuously satisfied this assumption. It is clear that nearly all nodes satisfy our assumption.

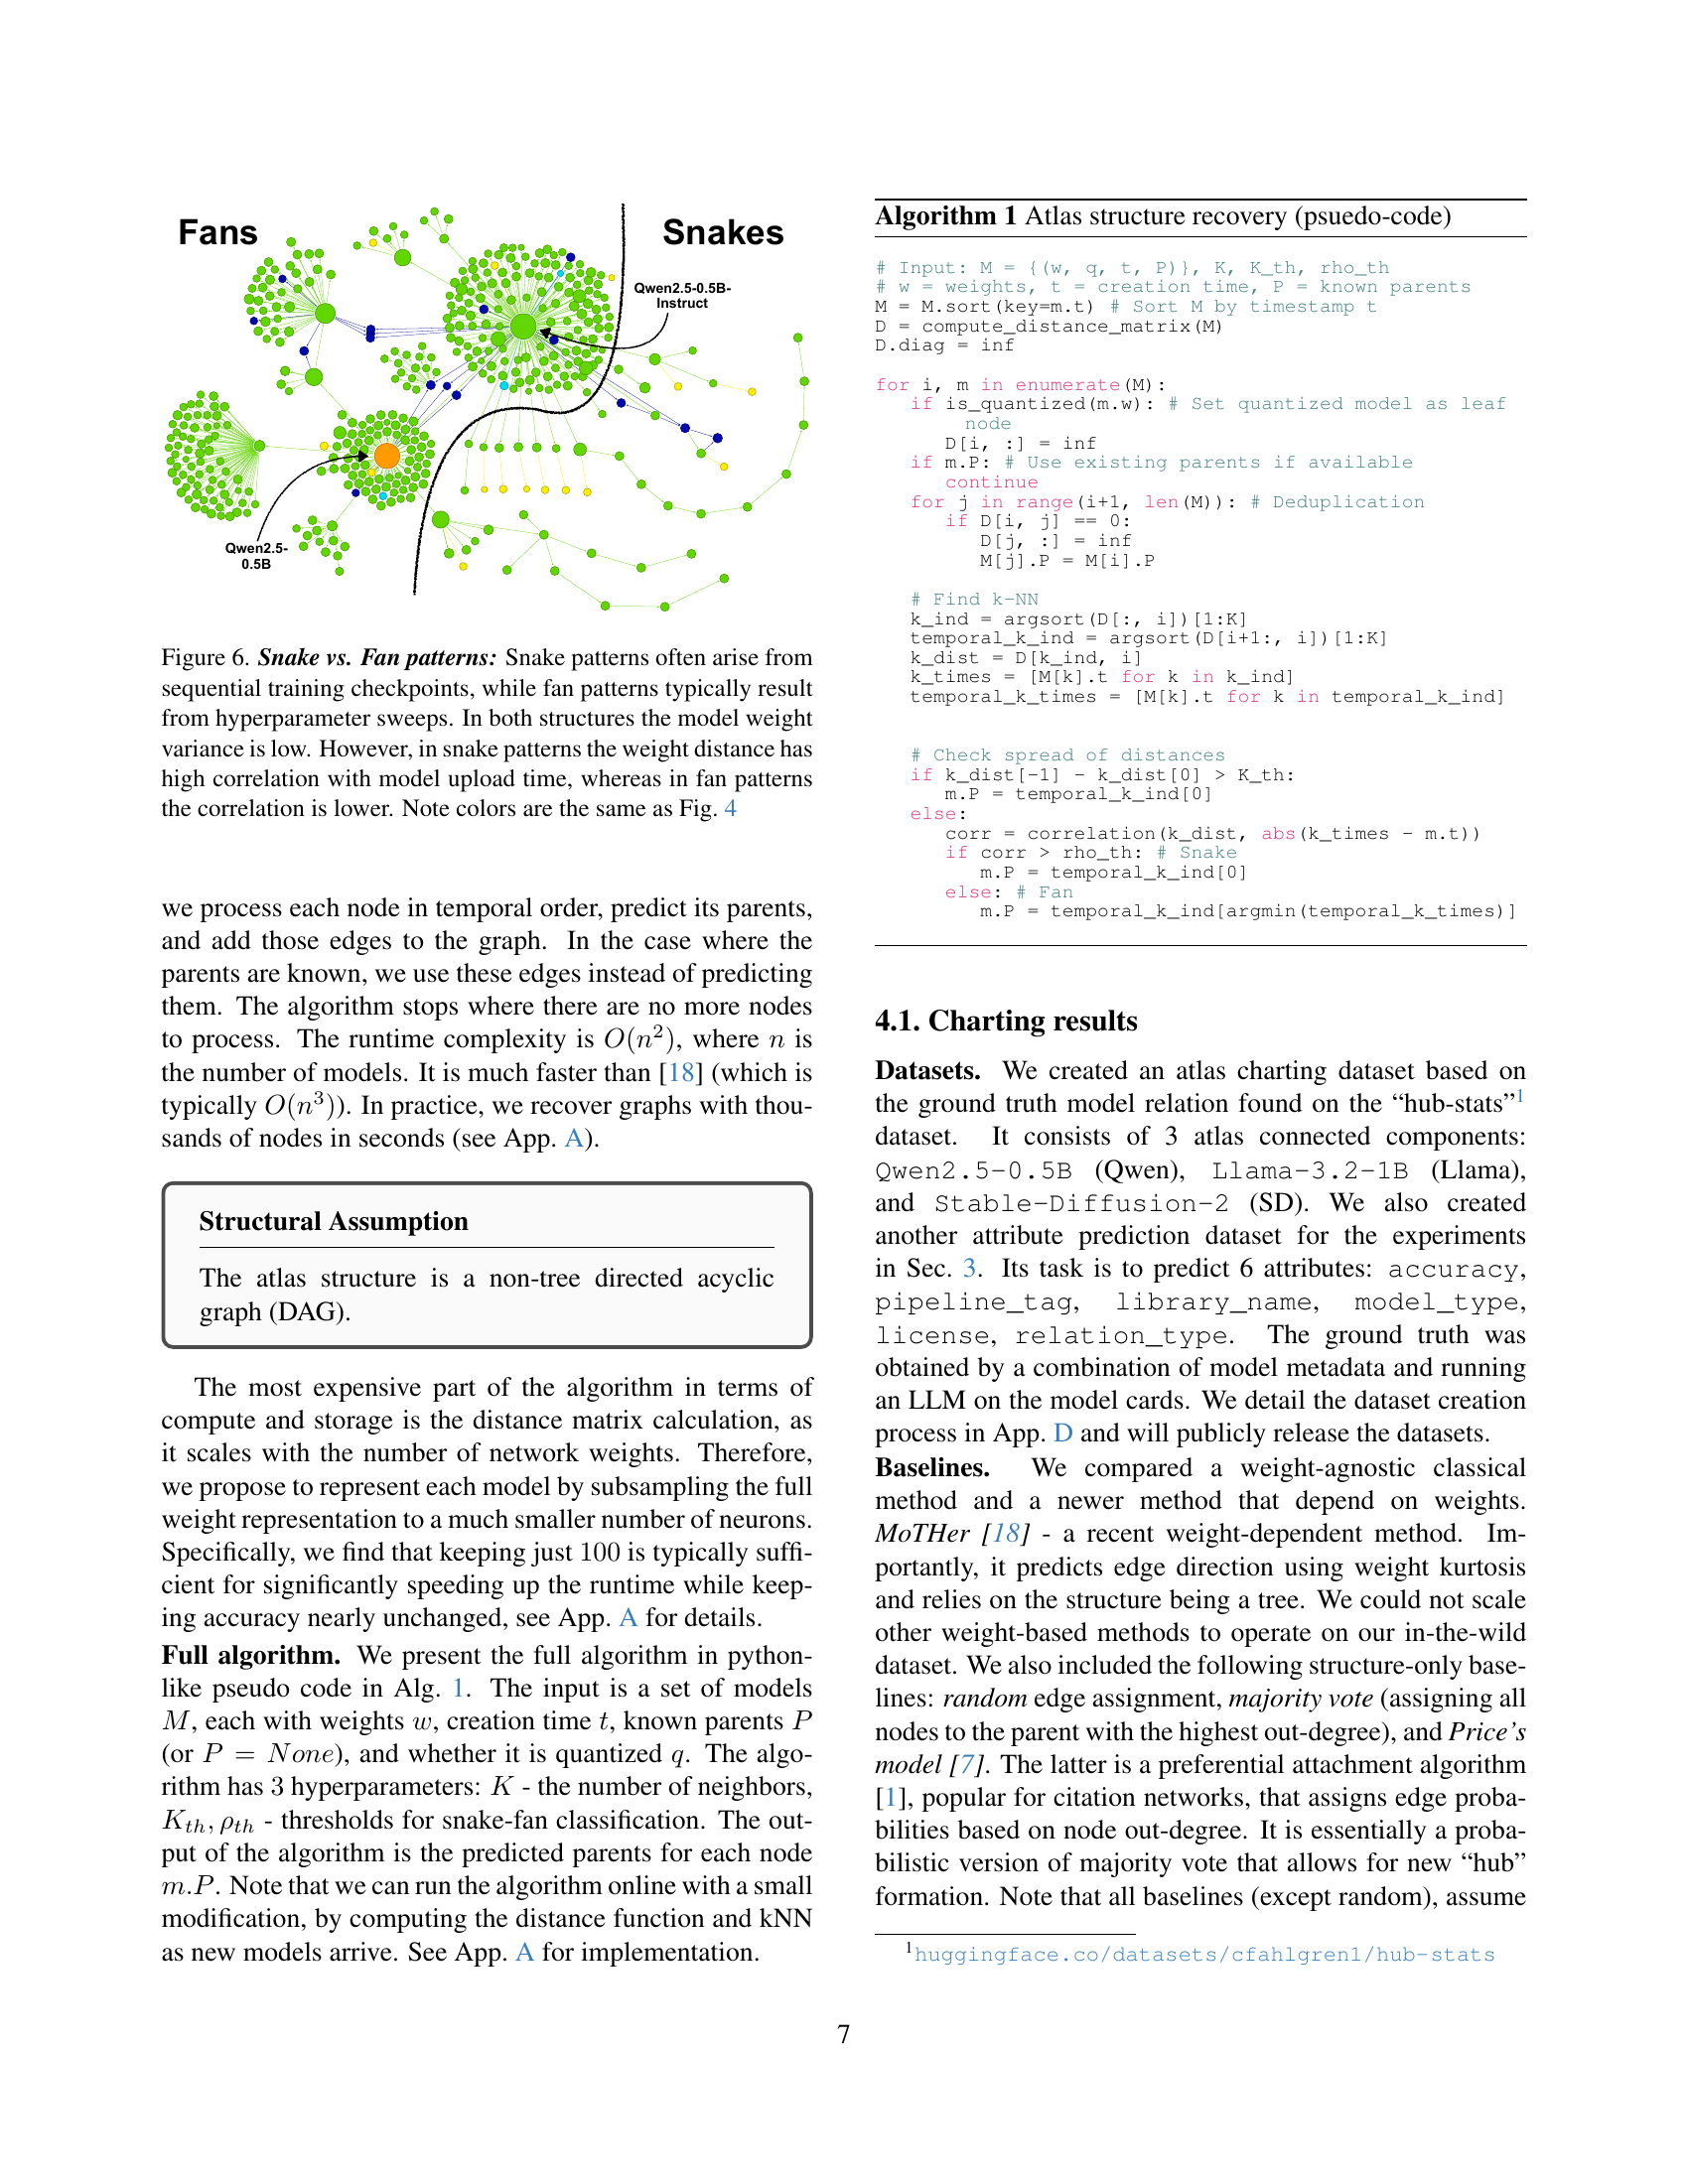
🔼 This figure illustrates two distinct patterns observed in the evolution of machine learning models: ‘snake’ and ‘fan’ patterns. Snake patterns represent sequential model development, such as during checkpointing in training, where subsequent models exhibit minor changes and have weights highly correlated with their creation times. Fan patterns emerge from hyperparameter sweeps where several models are trained with slightly different hyperparameters from a common ancestor; these models show low weight variance but have less correlation between their weight distance and creation times. The figure visually compares the two patterns, highlighting how these temporal and structural differences can be used to differentiate between models developed through iterative refinement versus those generated by exploring different hyperparameters.
read the caption
Figure 6: Snake vs. Fan patterns: Snake patterns often arise from sequential training checkpoints, while fan patterns typically result from hyperparameter sweeps. In both structures the model weight variance is low. However, in snake patterns the weight distance has high correlation with model upload time, whereas in fan patterns the correlation is lower. Note colors are the same as Fig. 4

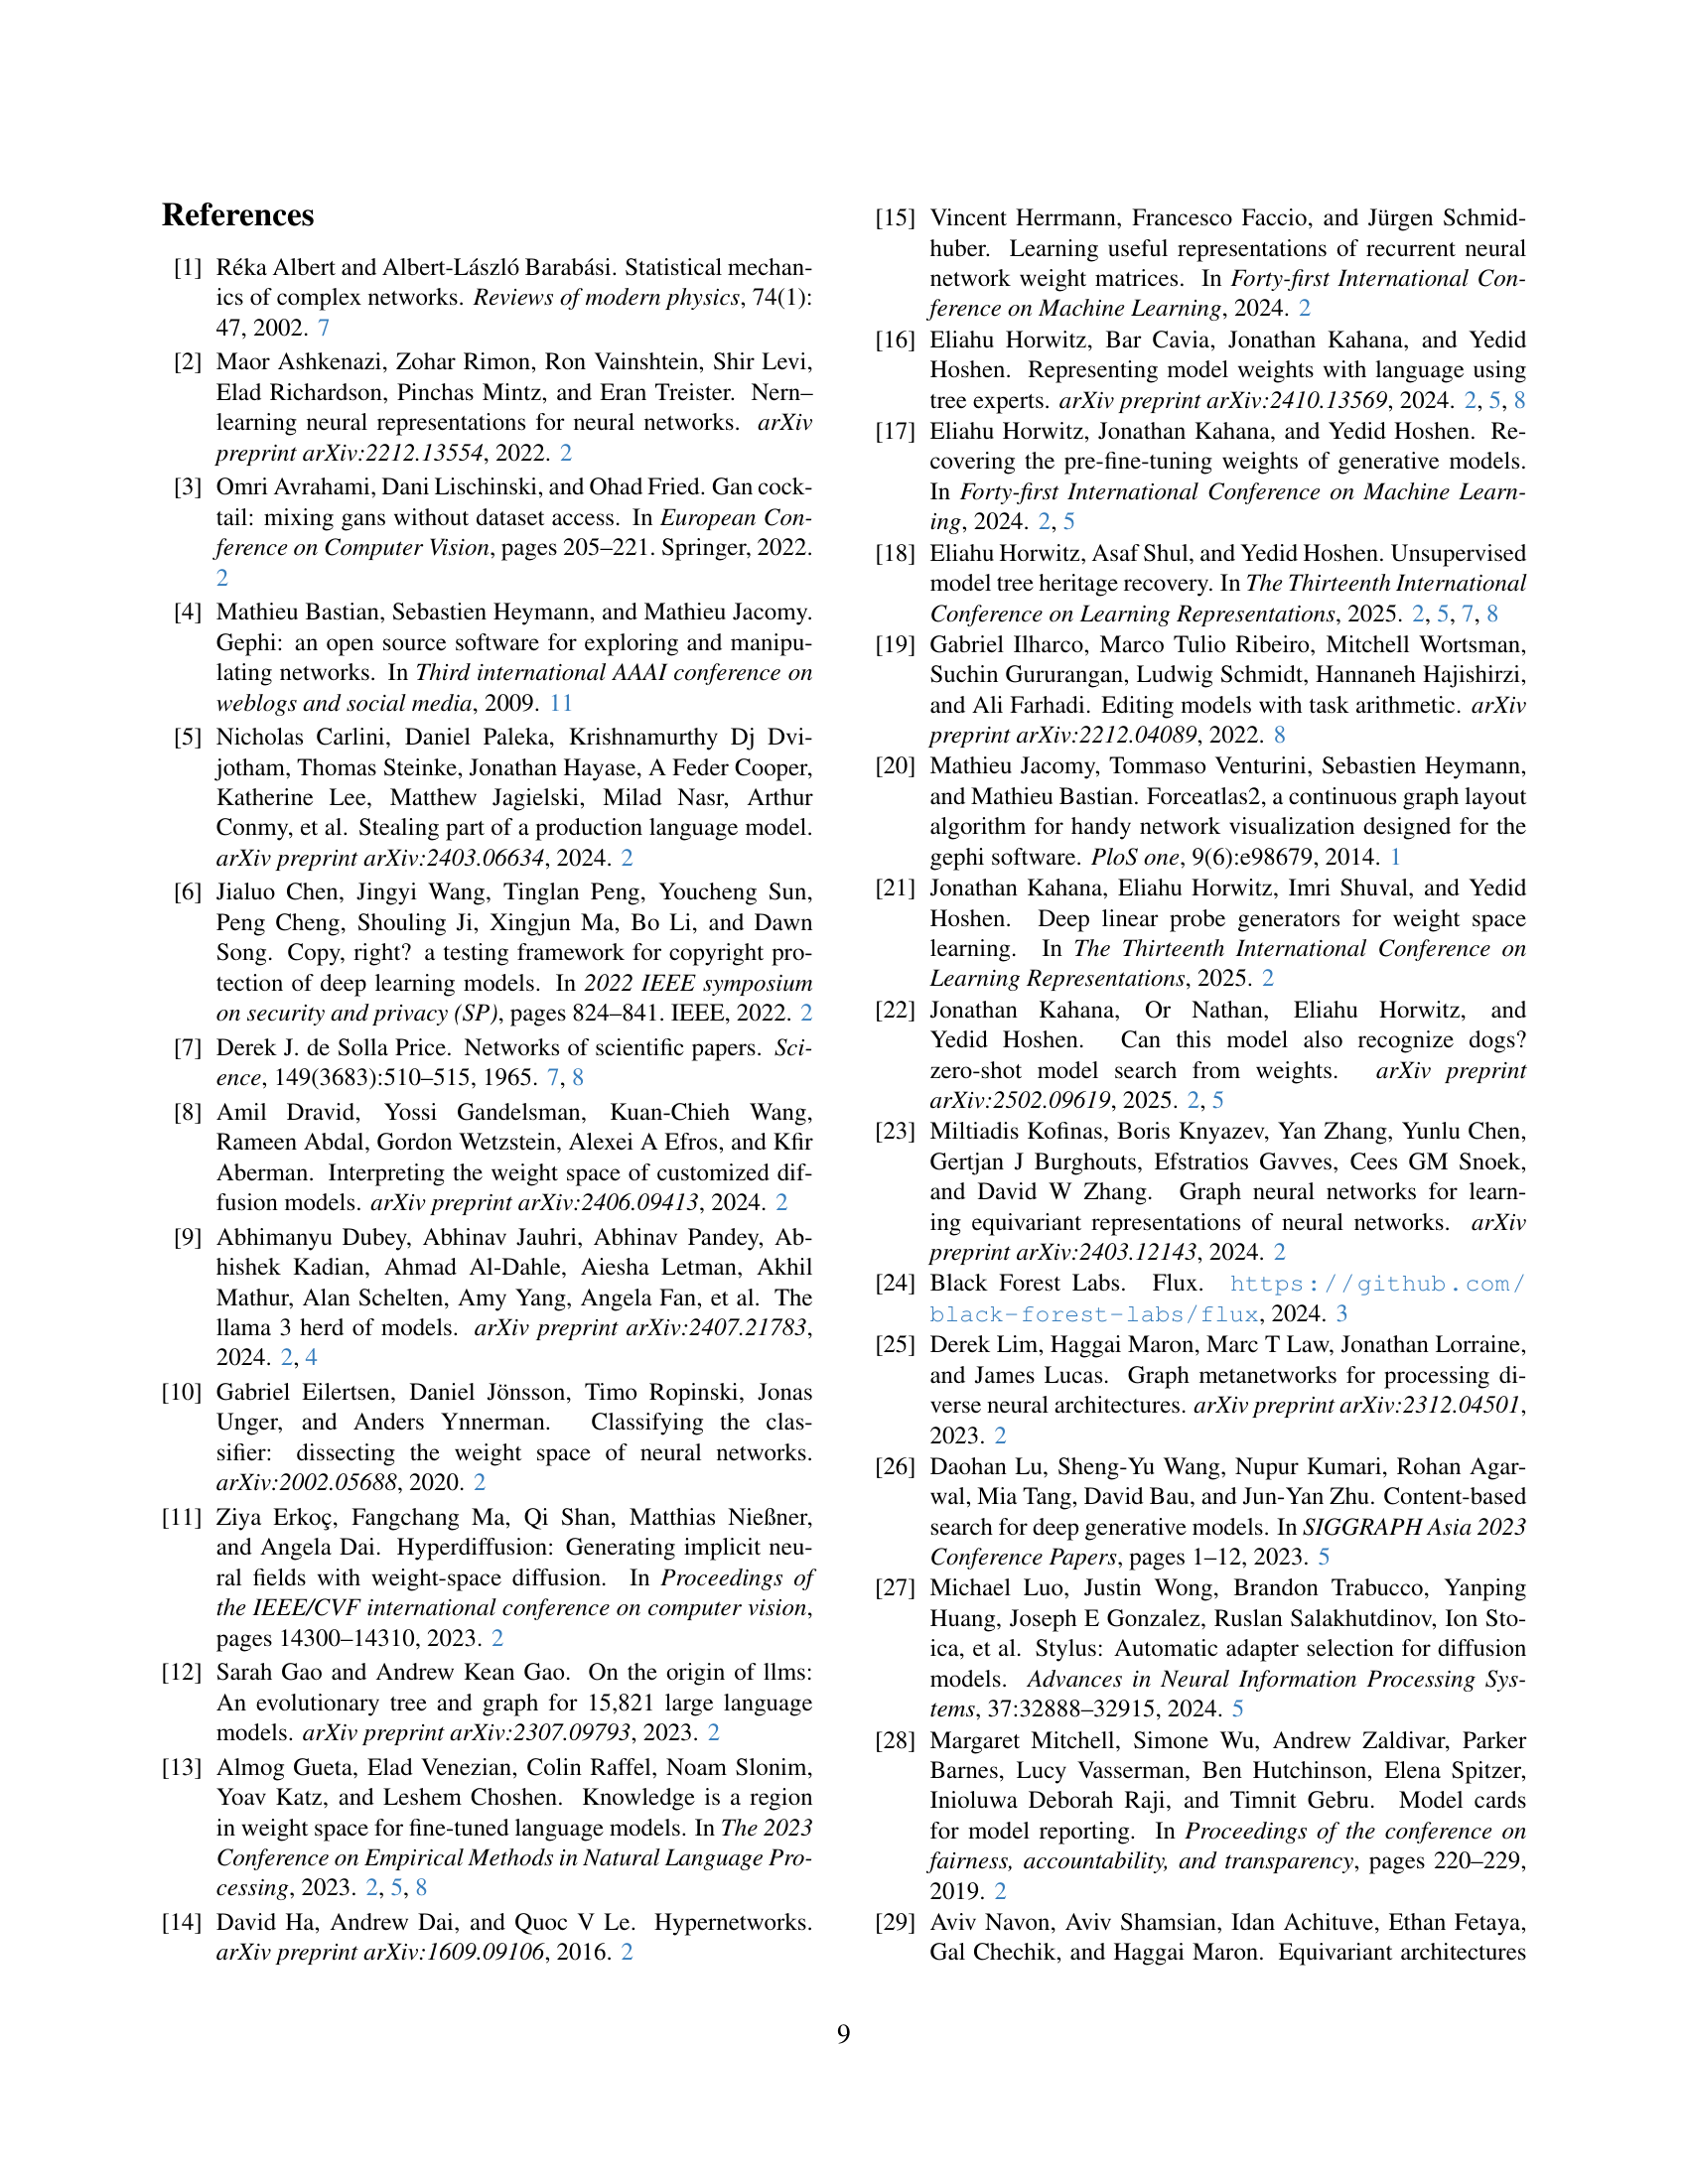
🔼 This figure shows the relationship between the number of neurons used and the accuracy of the model. The x-axis represents the number of neurons, and the y-axis represents the model accuracy. Multiple lines represent different model types (SD, Qwen, Llama). The graph shows that while increasing the number of neurons generally improves accuracy, the gains diminish at higher neuron counts. The plot highlights that using 100 neurons offers a strong balance between achieving high accuracy and managing computational resources.
read the caption
Figure 7: Number of neurons: Accuracy as a function of the number of neurons, indeed, 100 presents a good tradeoff between performance and resources.

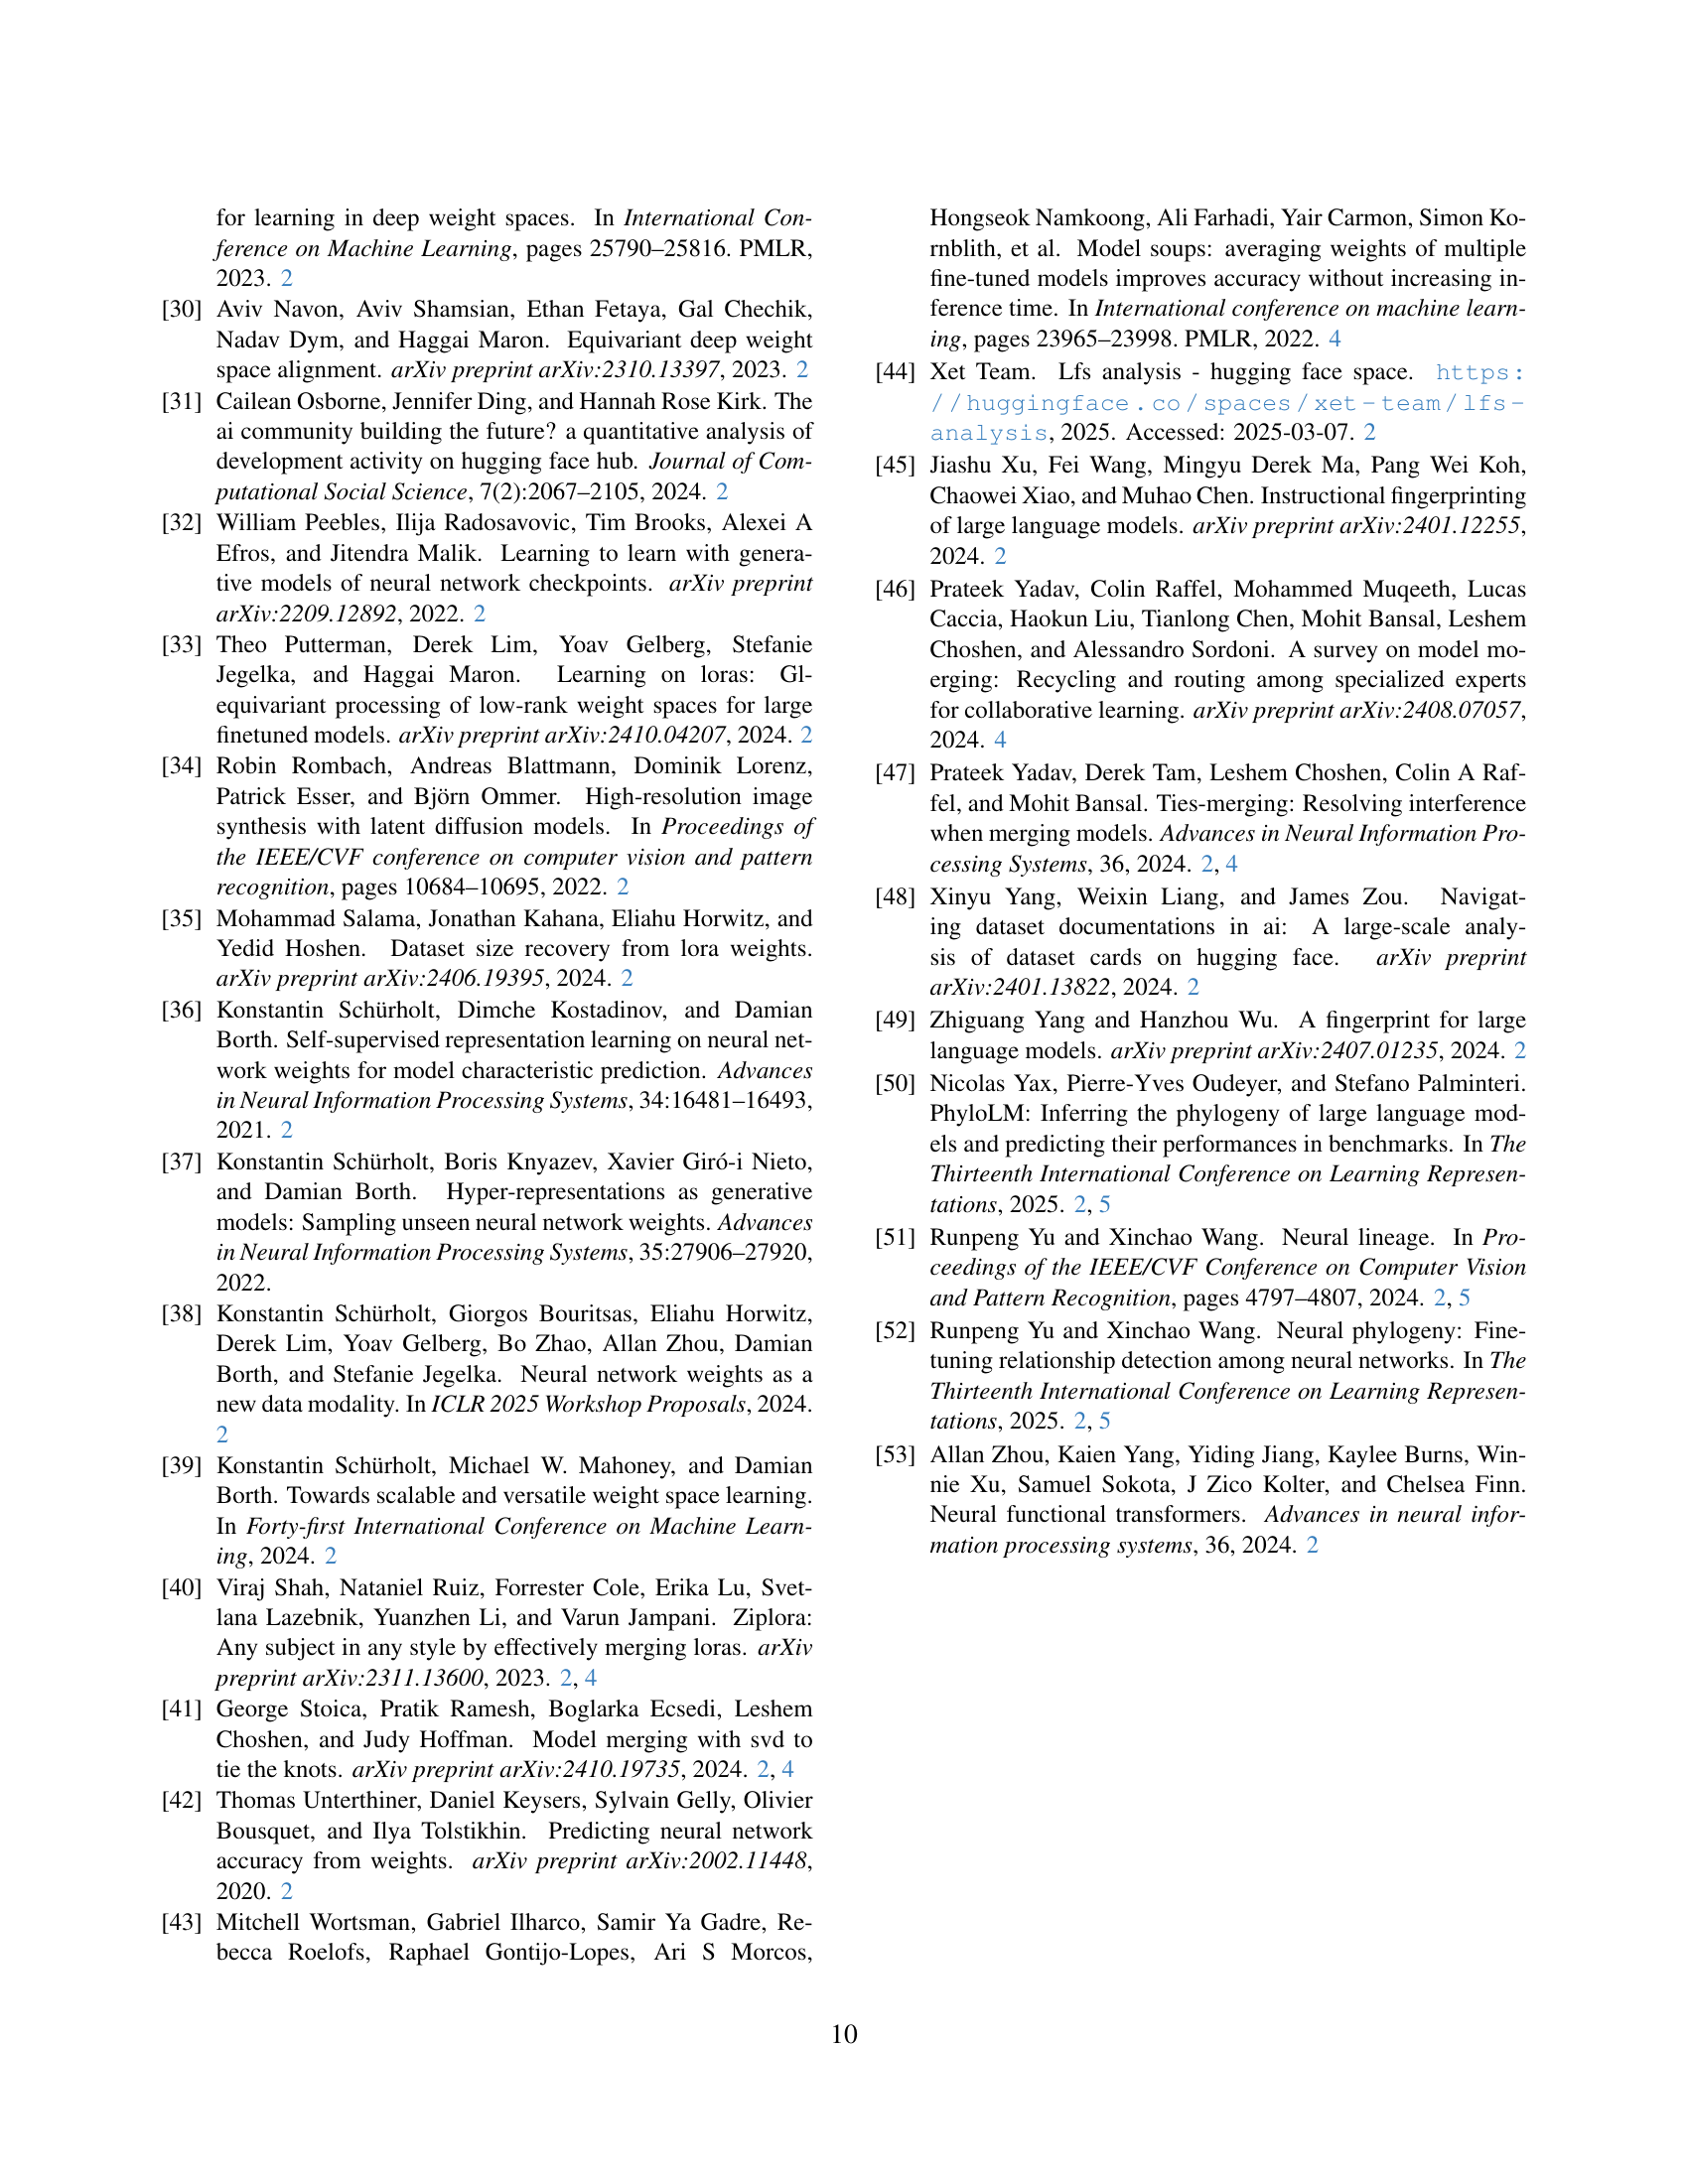
🔼 This bar chart visualizes the distribution of various model relation types within the dataset used in the study. It shows the proportions of different types of relationships between models, such as ‘Adapter’, ‘Fine-tune’, ‘Quantization’, ‘Merge’, ‘Root’, and ‘Unknown’. This provides insight into the predominant ways models are derived or modified from one another within the Hugging Face repository.
read the caption
Figure 8: Relation type in our dataset

🔼 This figure shows the level of documentation completeness for models within the Hugging Face model repository. It visually represents the percentage of models that have complete documentation for various attributes, such as the model’s license, the type of model, the pipeline it’s used in, and its base model. The visualization highlights the significant incompleteness in model documentation, which is a key challenge addressed by the paper.
read the caption
Figure 9: Documentation level in Hugging Face

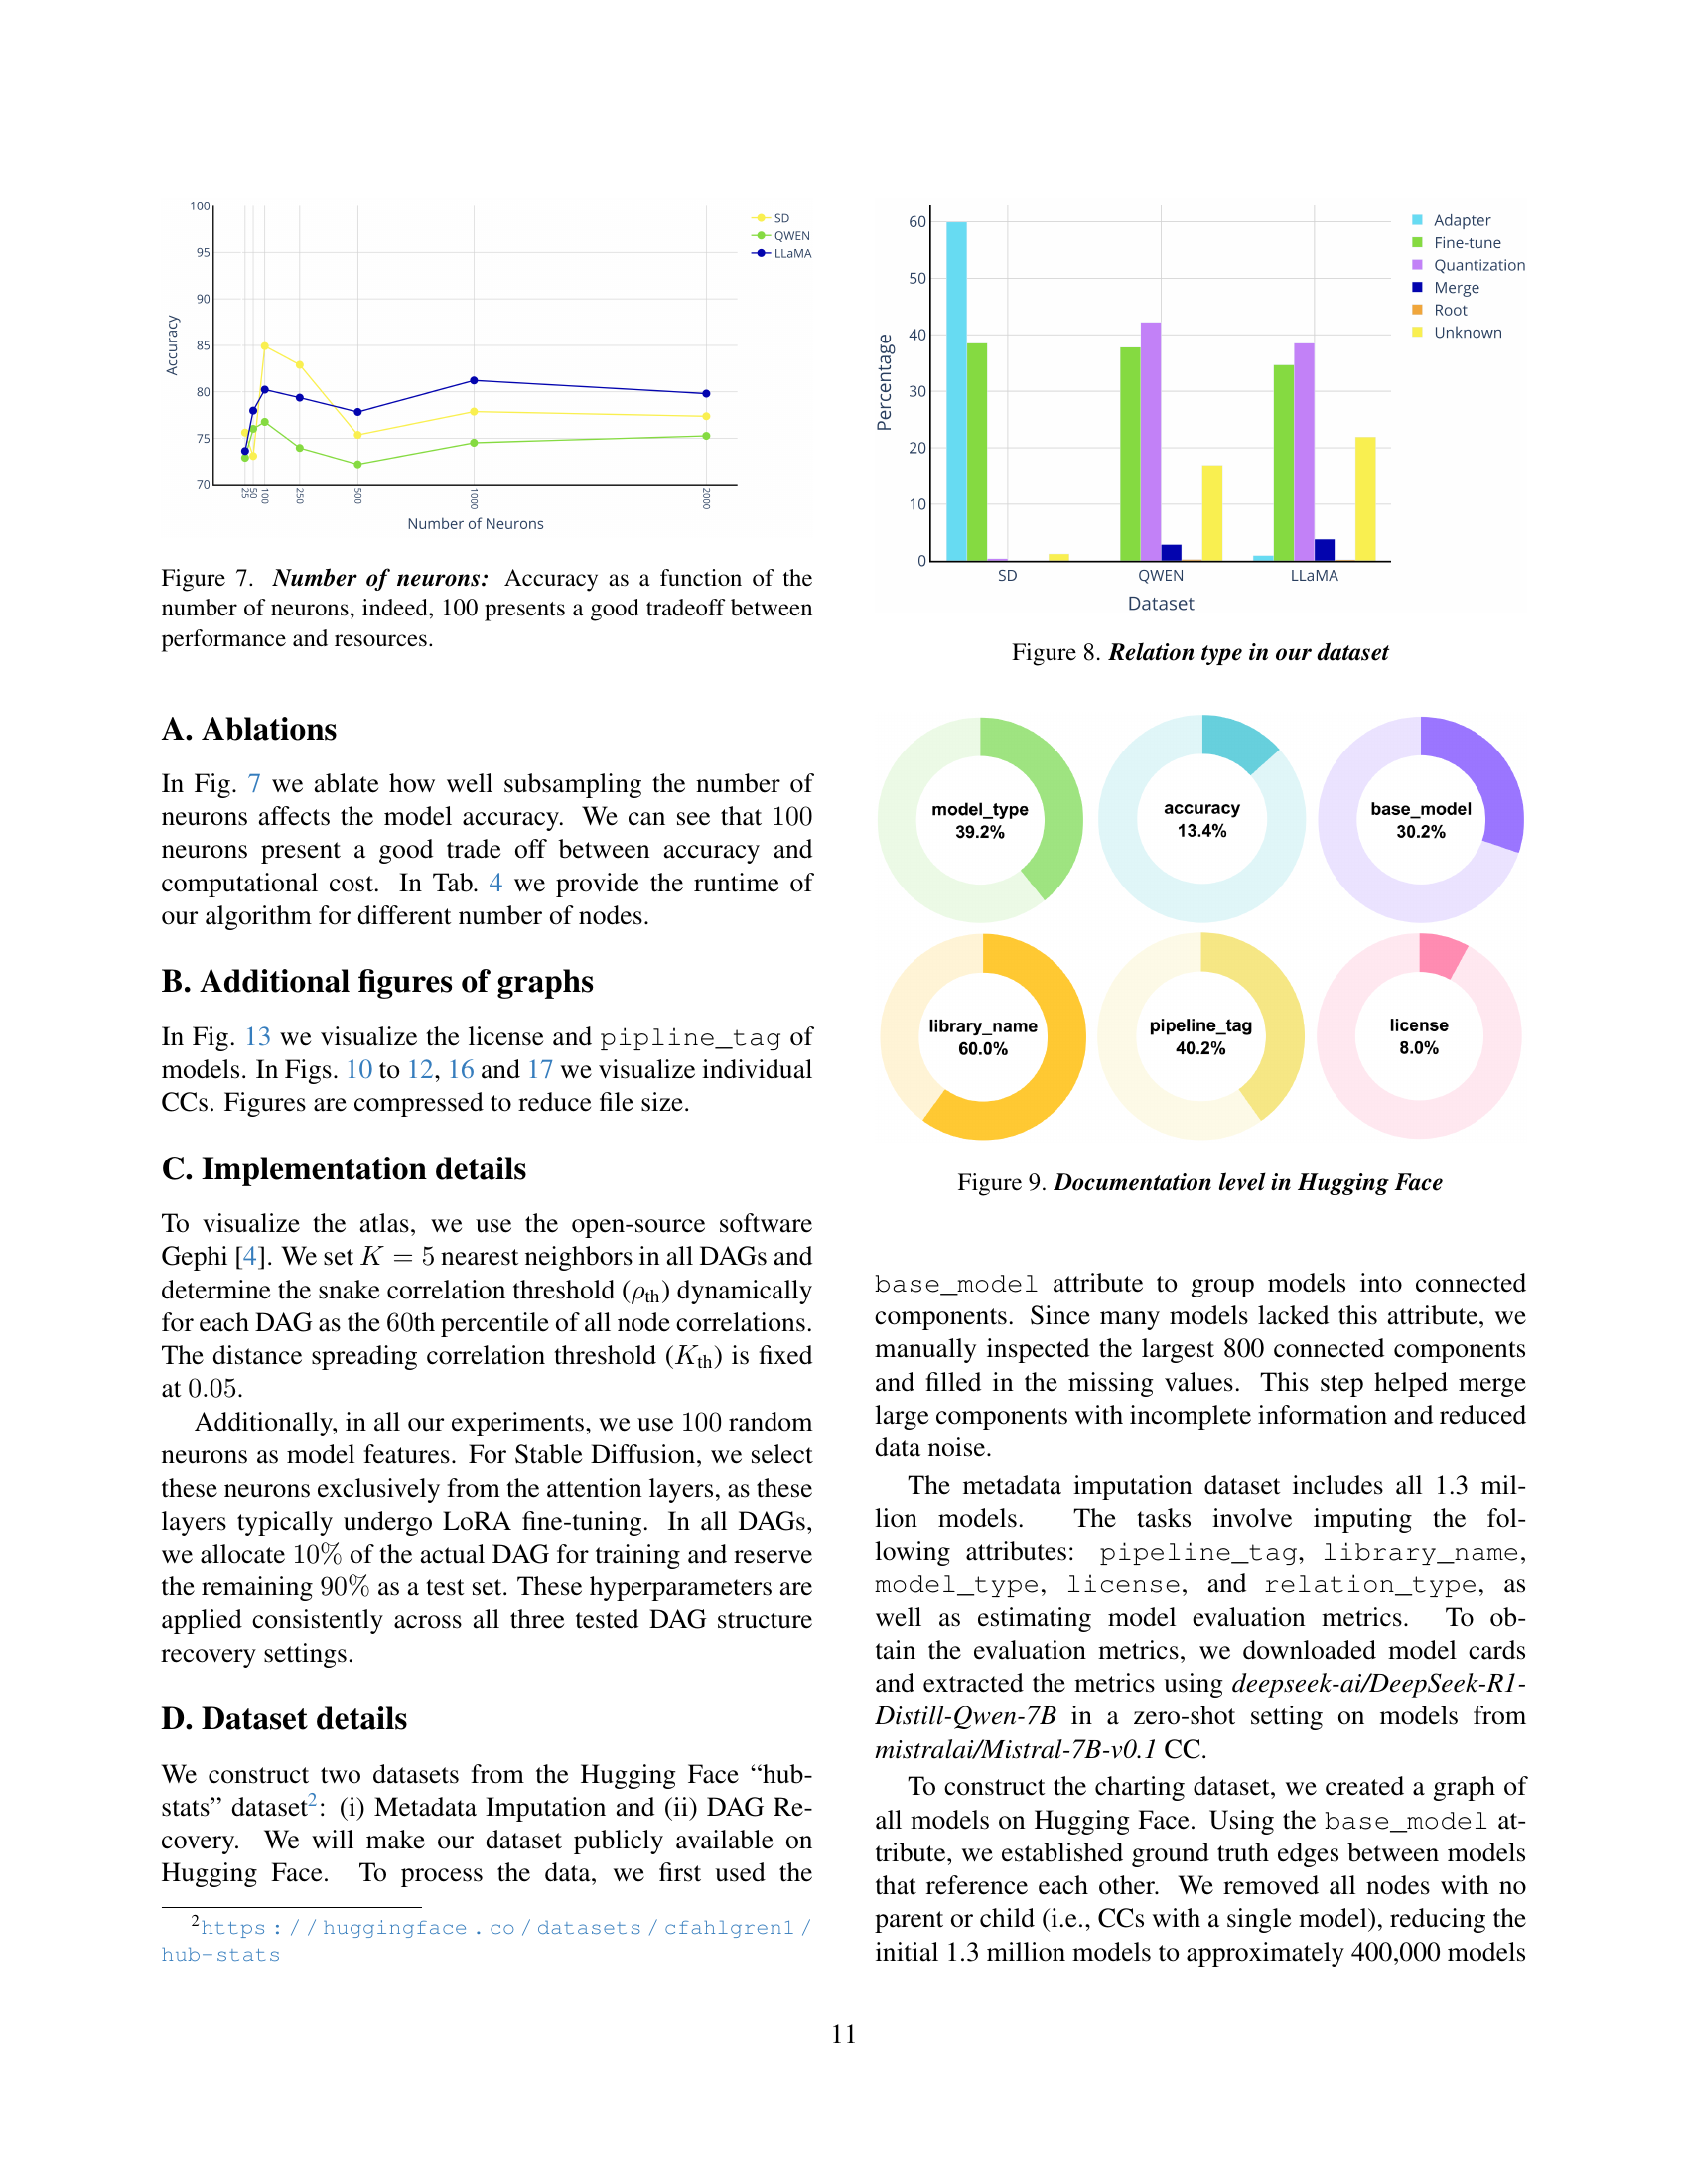
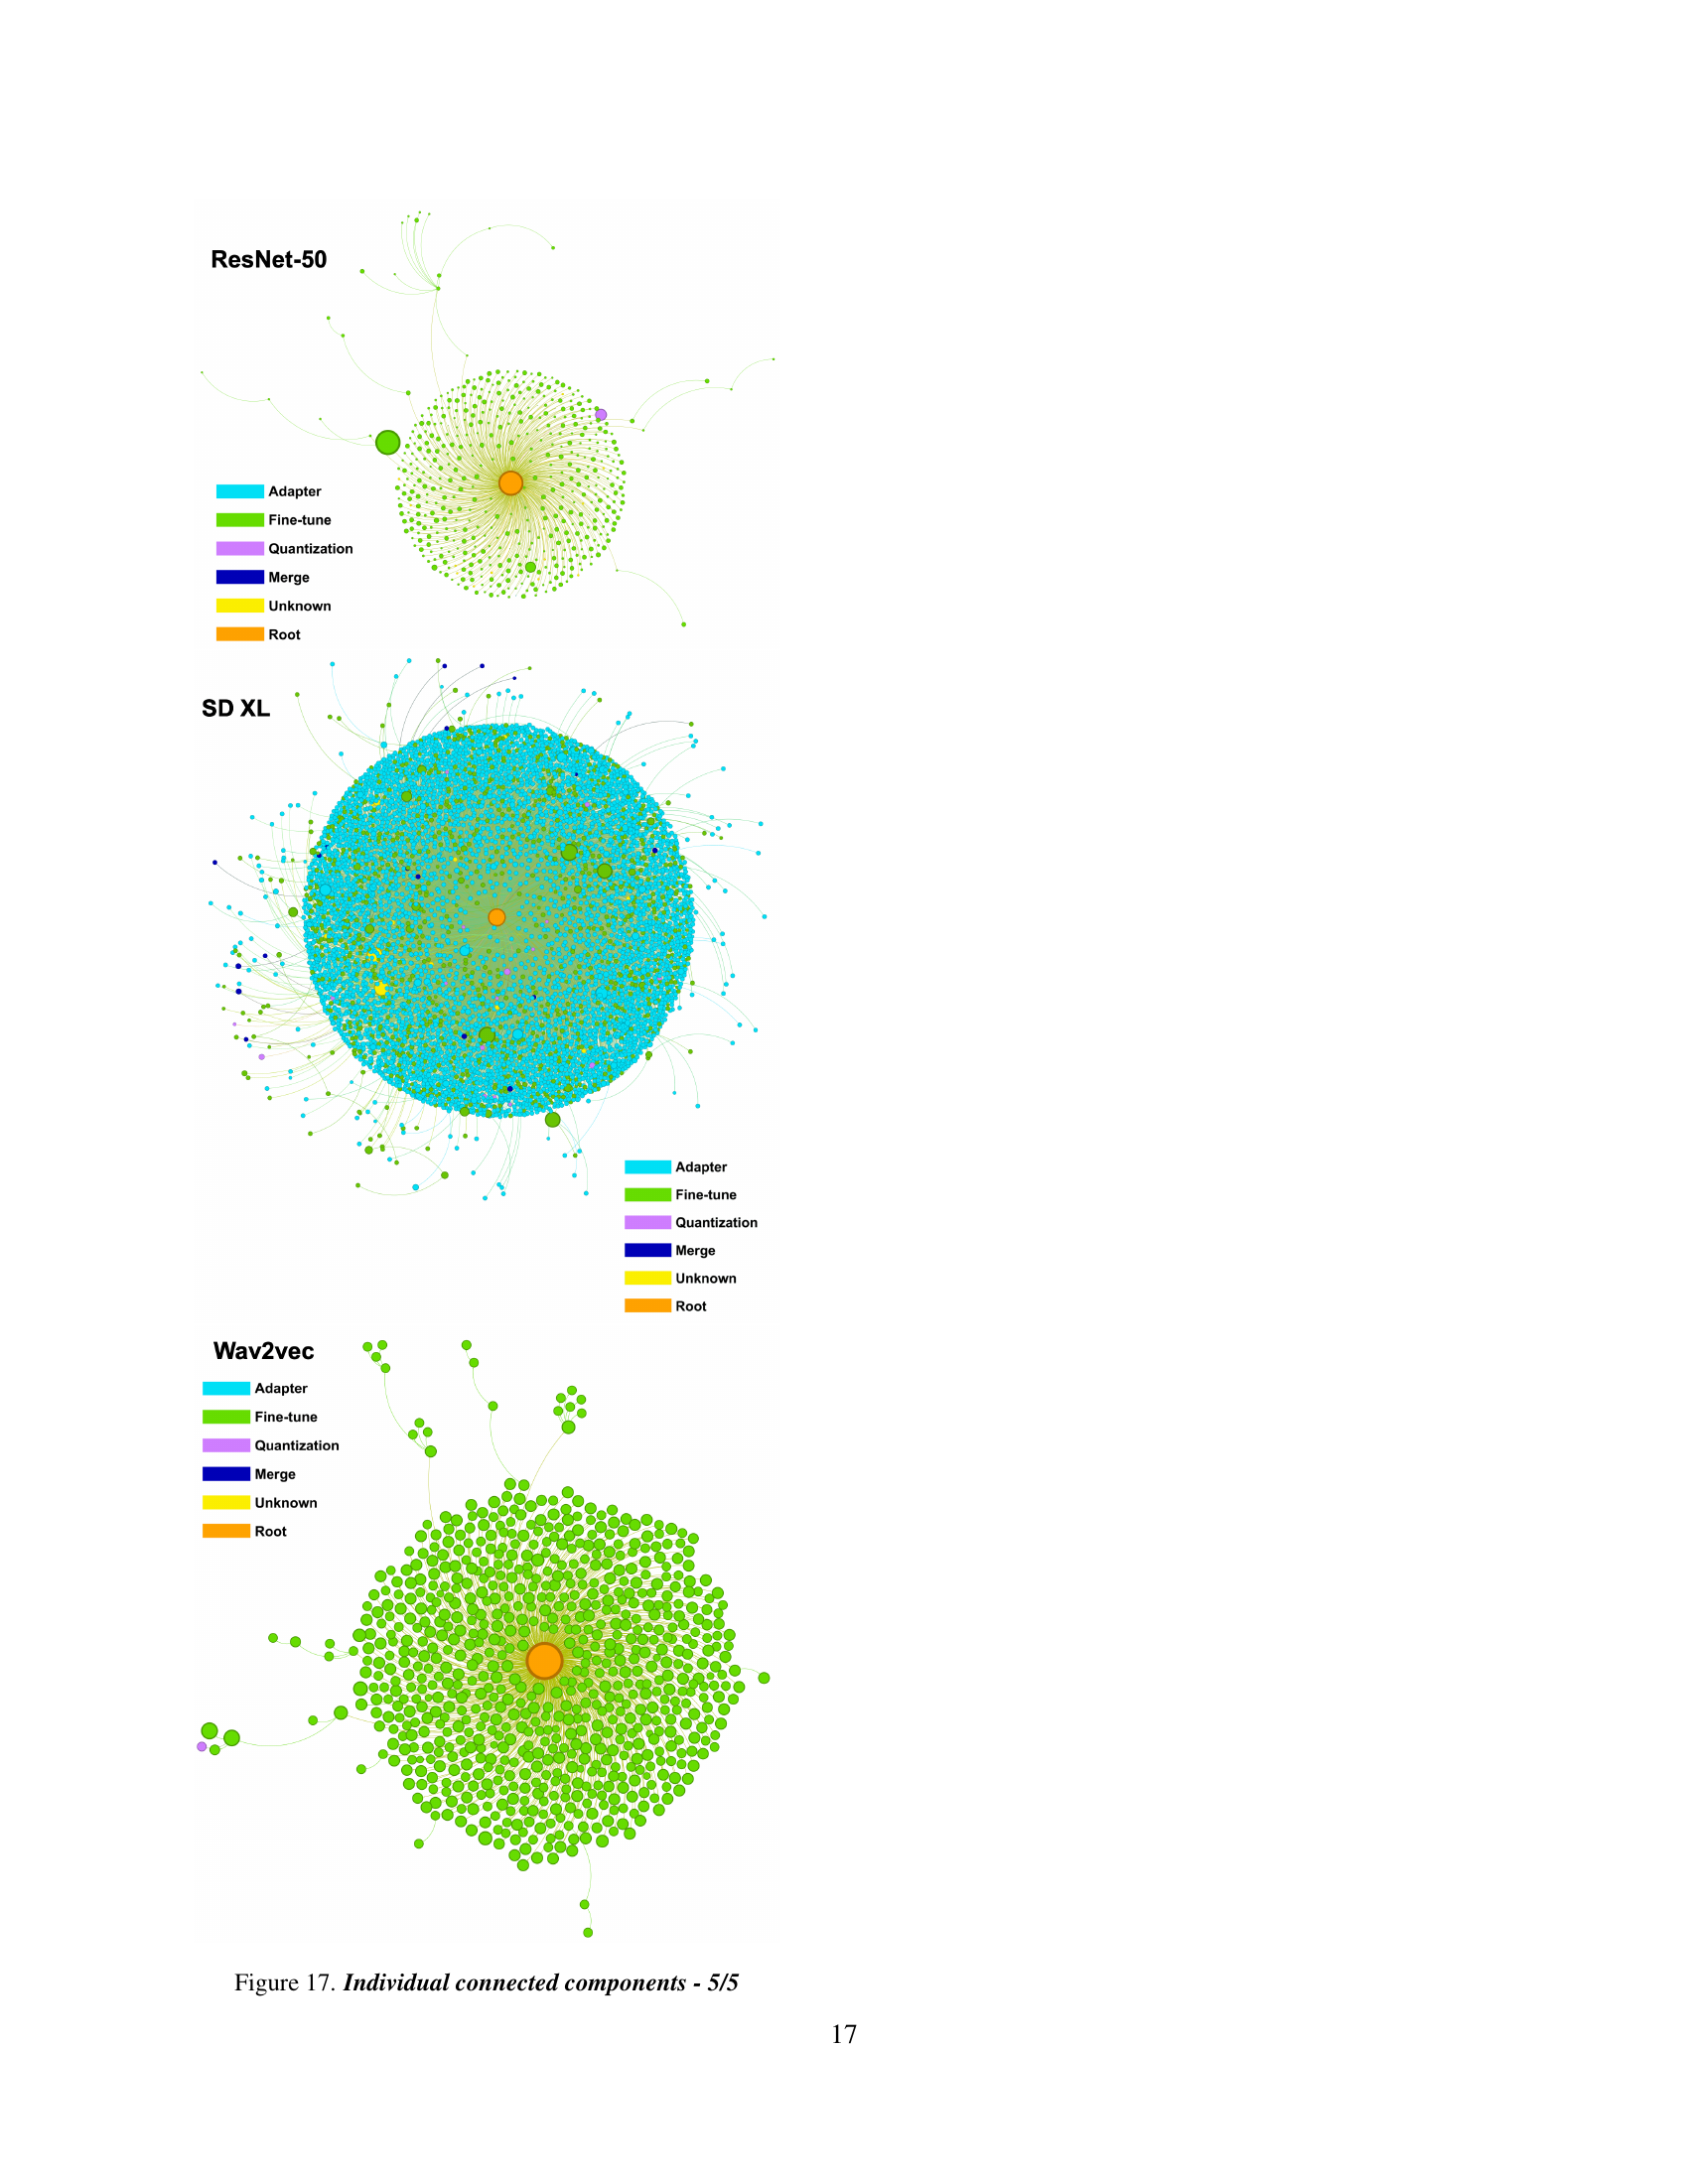
🔼 This figure is part of a series visualizing different connected components within a larger model atlas. It shows a specific subgraph of the atlas, highlighting the relationships between various models. Nodes represent individual models, edges represent relationships (such as fine-tuning or adaptation), node size likely indicates a metric like download count or usage, and node color likely represents the type of model relationship. This particular subgraph likely focuses on a subset of models related to computer vision or a similar domain, given the names of some models visible in other related figures in the paper.
read the caption
Figure 10: Individual connected components - 1/5

🔼 This figure shows one of five individual connected components from the Hugging Face model atlas. It visualizes the relationships between different machine learning models within this specific component. Nodes represent individual models, and edges indicate the relationships (e.g., fine-tuning, adaptation) between them. Node size might correspond to a metric like the number of downloads, and color coding could represent the type of relationship or model attributes. This provides a detailed view of the evolution and connections within a subset of the larger model landscape.
read the caption
Figure 11: Individual connected components - 2/5
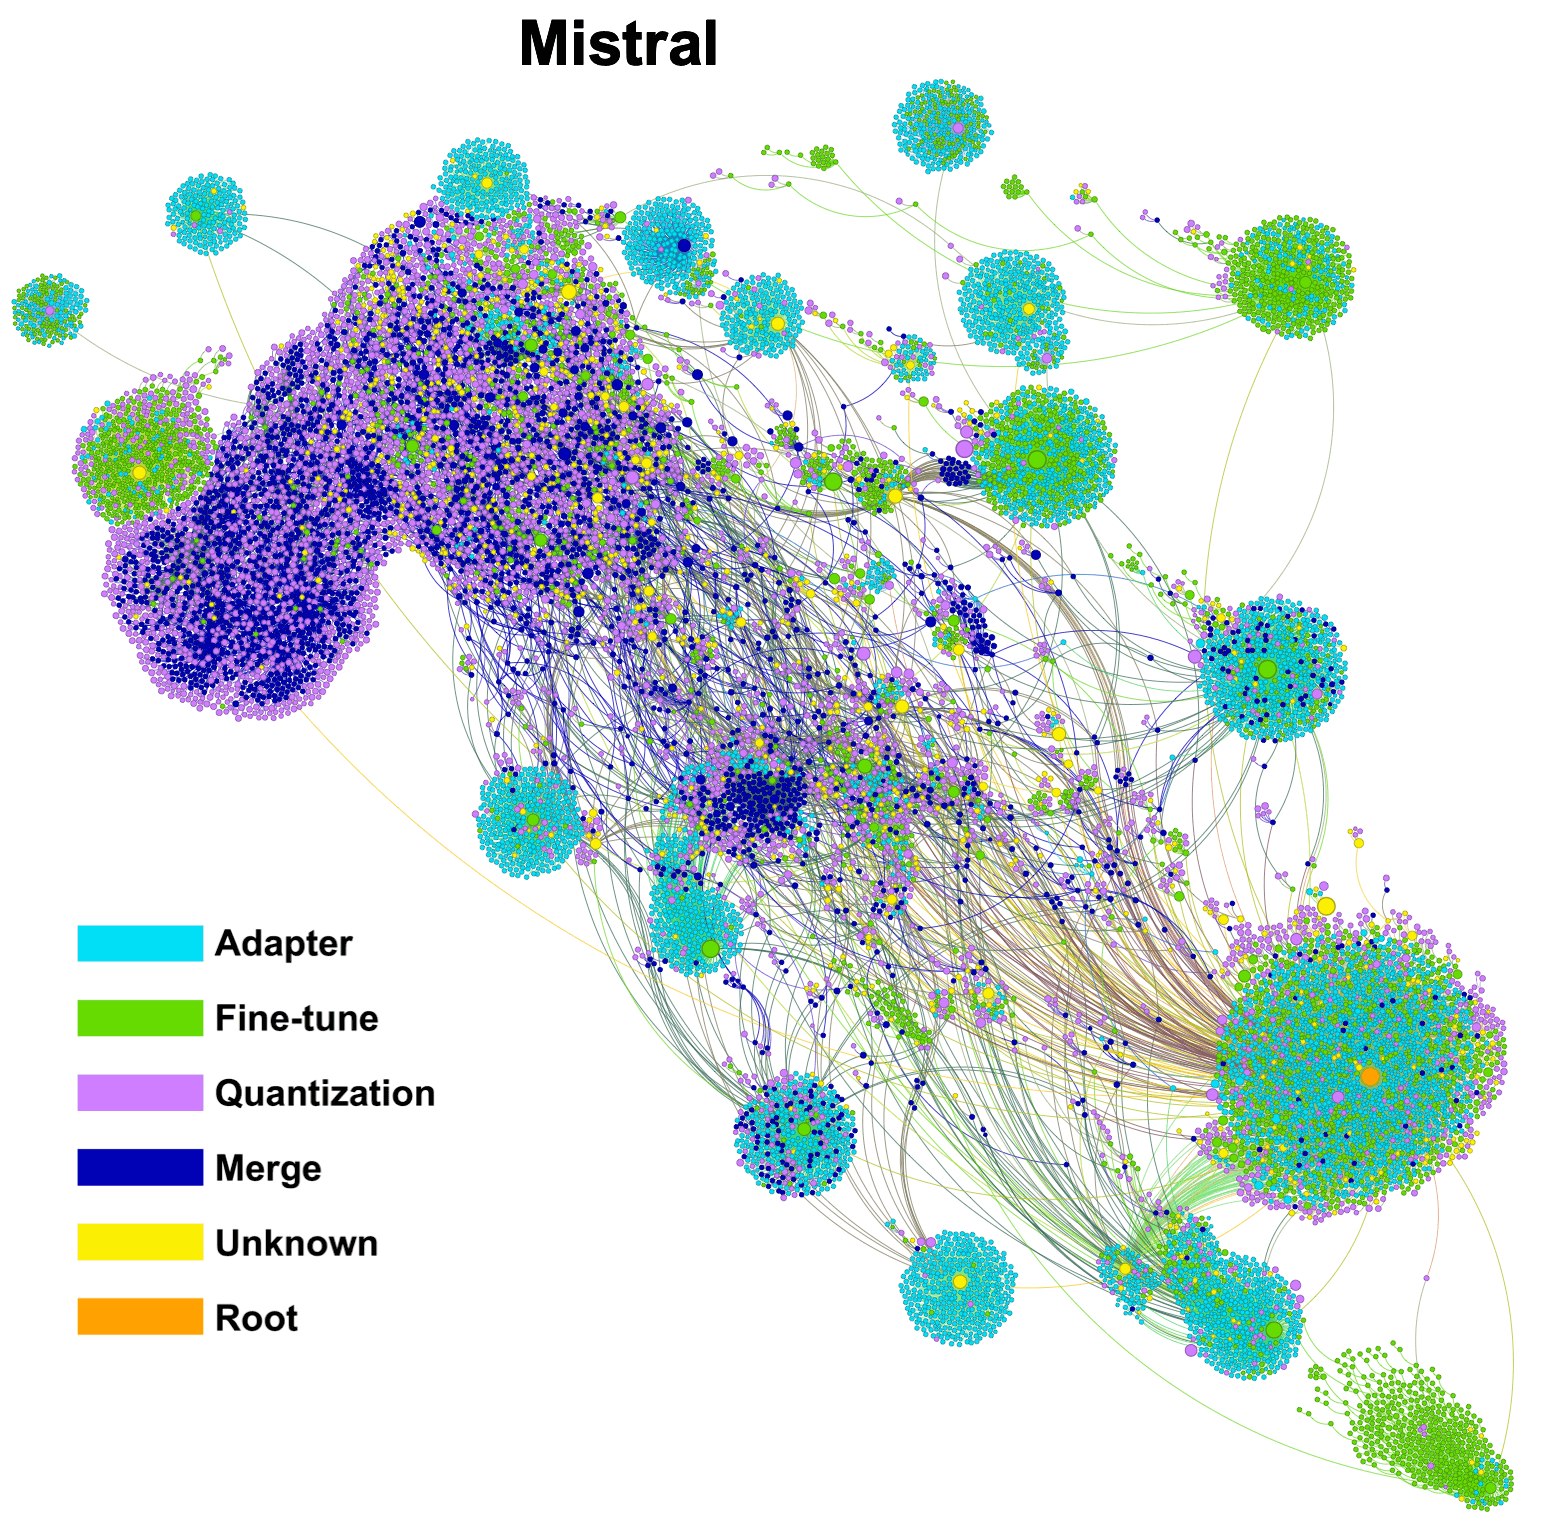
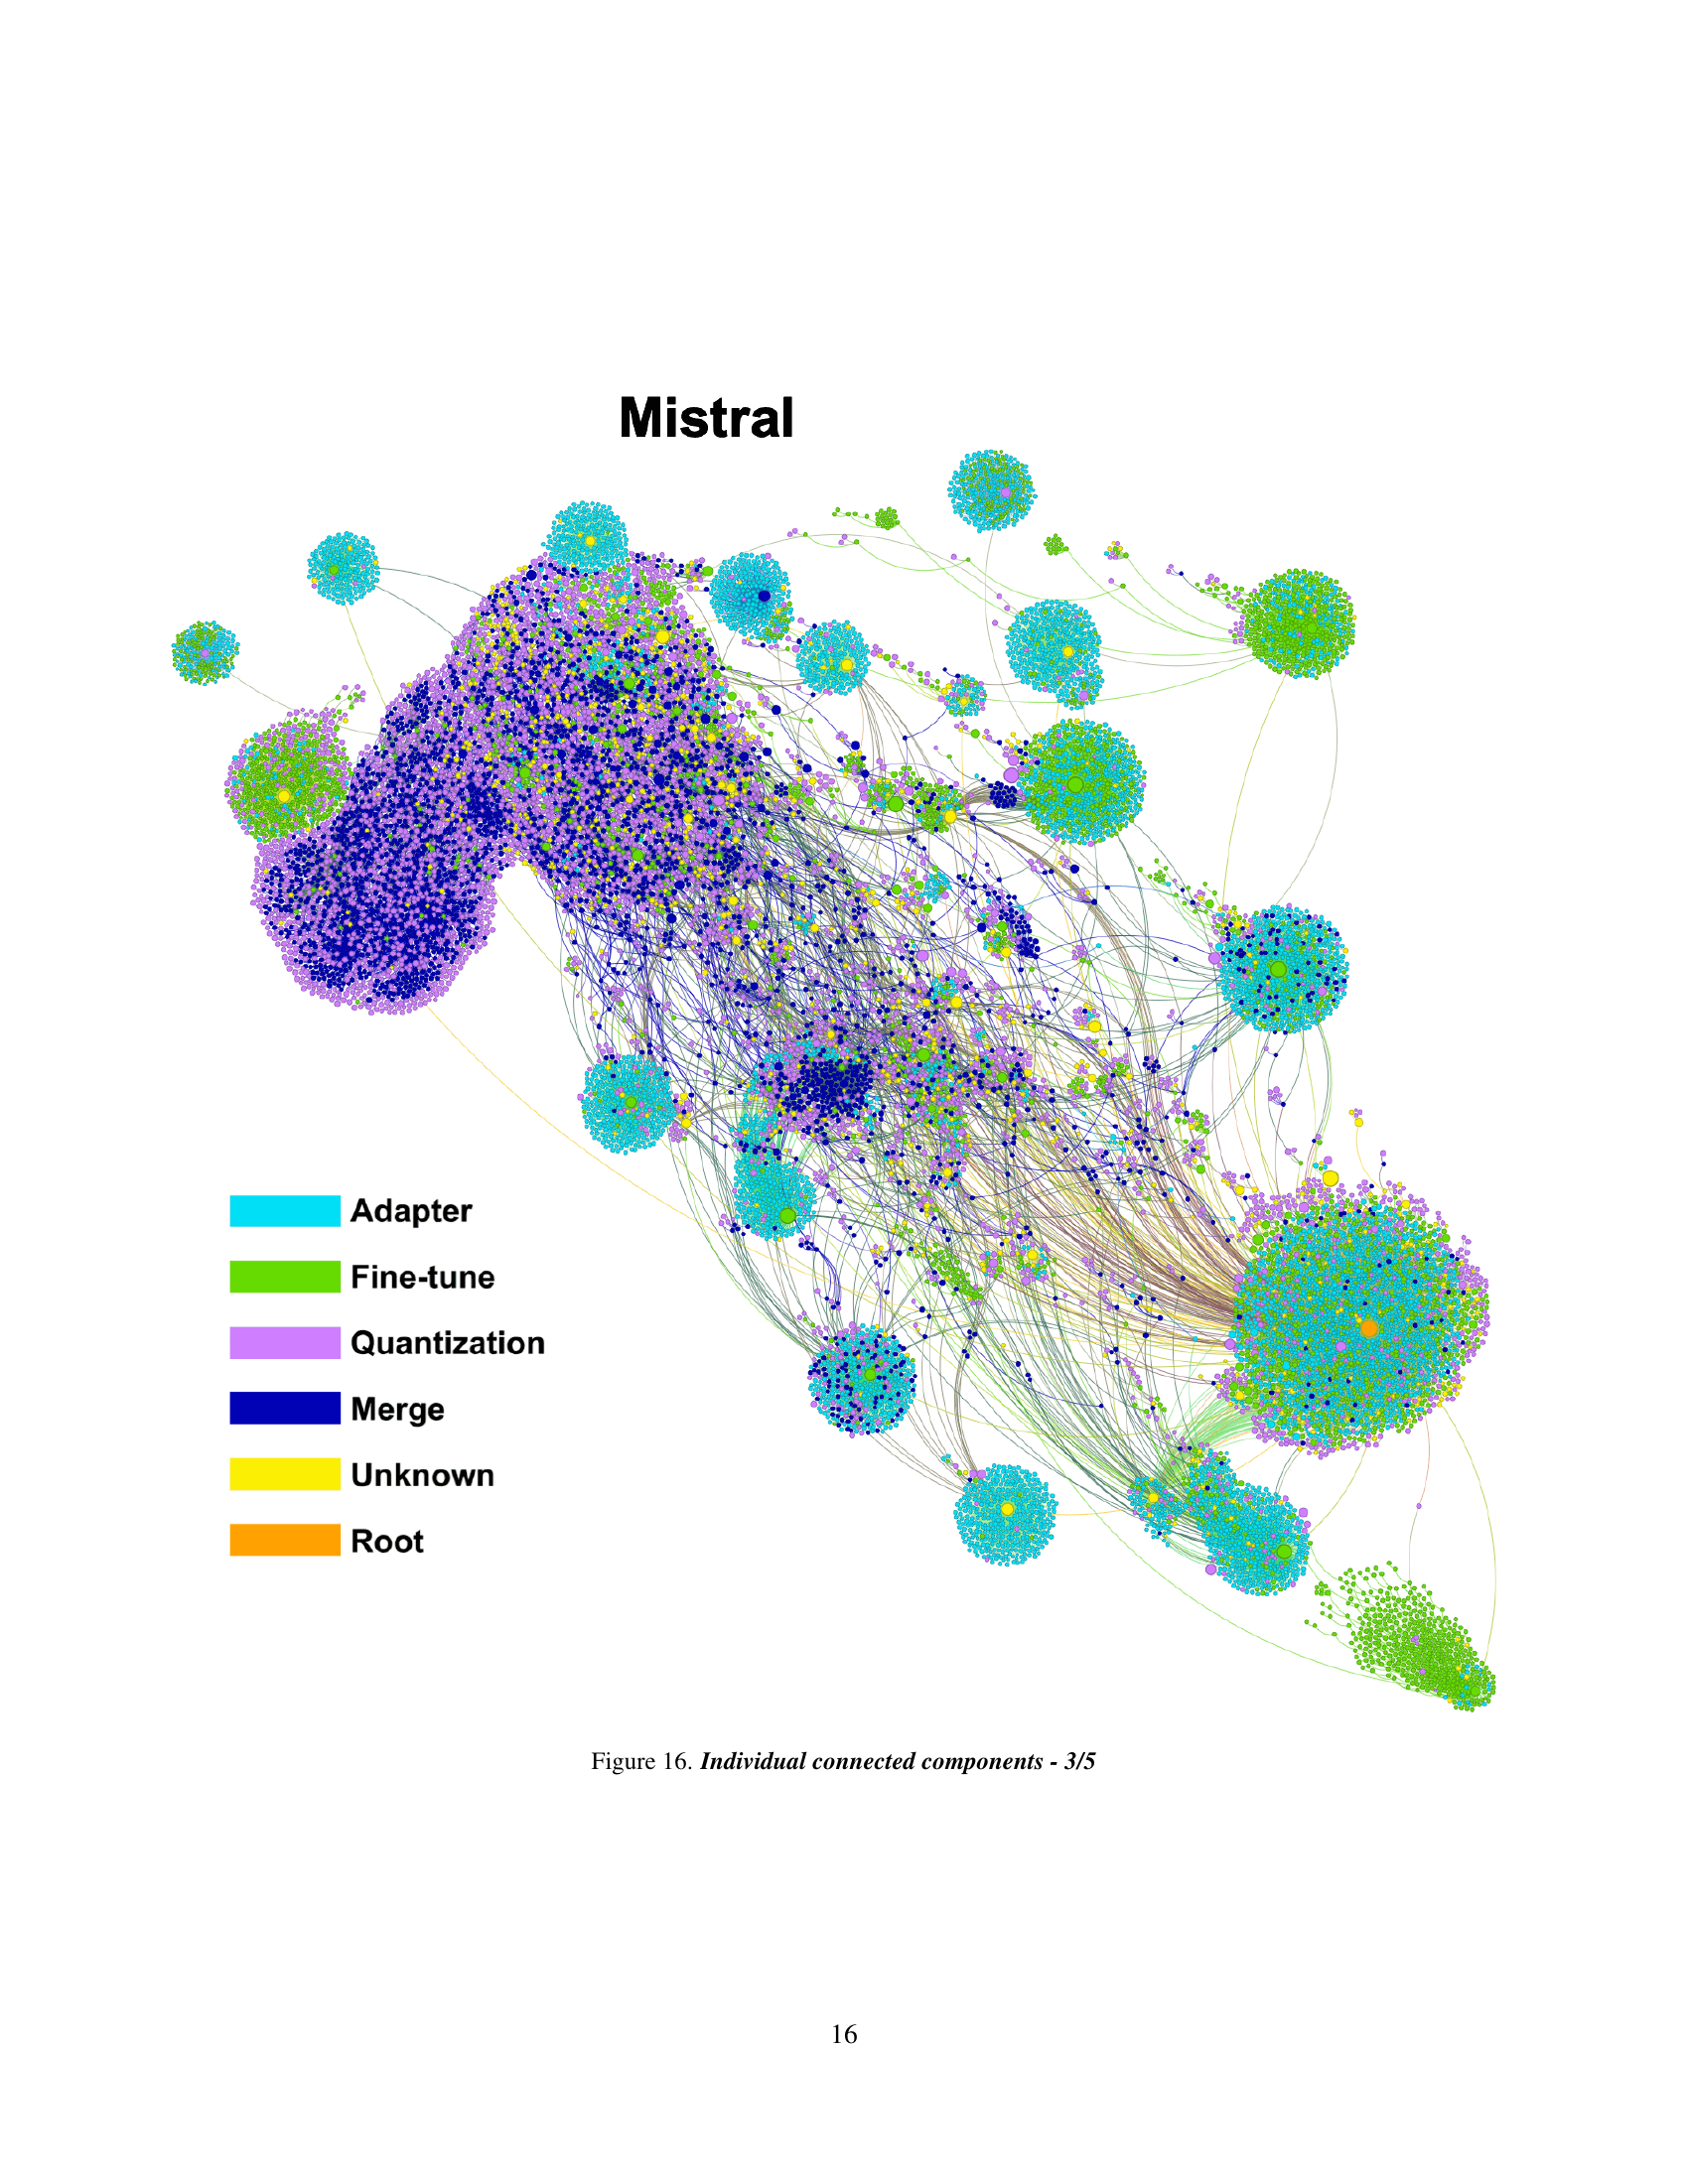
🔼 This figure is part of a series visualizing different connected components within a larger model atlas. It displays a specific subset of the atlas, showing the relationships between models (nodes) and the transformations applied between them (edges). The visualization highlights the structure and complexity of a particular area of the model landscape, potentially showing relationships such as fine-tuning, quantization, or merging, allowing the reader to trace the lineage of models and understand how they evolved. Node sizes and colors likely represent additional metadata such as model popularity or type of transformation.
read the caption
Figure 12: Individual connected components - 3/5
More on tables
| Method | MSE | MAE | Correlation | |
|---|---|---|---|---|
| TruthfulQA (0-shot, mc2) | Baseline | 100.217 | 8.541 | - |
| Ours 1-NN | 32.830 | 3.247 | 0.856 | |
| Ours 2-NN | 28.720 | 3.235 | 0.864 | |
| Ours 3-NN | 25.544 | 3.147 | 0.877 | |
| Ours 5-NN | 23.512 | 3.093 | 0.885 | |
| Helleswag (0-shot) | Baseline | 95.000 | 7.500 | - |
| Ours 1-NN | 30.000 | 3.000 | 0.860 | |
| Ours 2-NN | 27.000 | 2.900 | 0.870 | |
| Ours 3-NN | 24.000 | 2.800 | 0.880 | |
| Ours 5-NN | 22.000 | 2.700 | 0.890 |
🔼 Table 1a presents the results of predicting model accuracy using the atlas. The baseline uses the average accuracy of all models. The ‘Ours’ rows show the Mean Squared Error (MSE), Mean Absolute Error (MAE), and correlation obtained by using the K-nearest neighbors in the atlas to predict the accuracy of a model. Different values of K (1, 2, 3, and 5) are tested to determine the optimal number of neighbors for prediction.
read the caption
(a)
| Attribute | Graph Avg. | Hub Avg. |
|---|---|---|
| pipeline_tag | 0.60 | 0.79 |
| library_name | 0.81 | 0.84 |
| model_type | 0.66 | 0.81 |
| license | 0.49 | 0.85 |
| relation_type | 0.61 | 0.80 |
🔼 Table 1b presents the results of predicting model attributes using the atlas structure. It compares the performance of using the graph average and the hub average methods for predicting five different model attributes: pipeline tag, library name, model type, license, and relation type. The ‘Graph Avg.’ column shows the accuracy achieved by simply using the majority label across all nodes in the graph, while the ‘Hub Avg.’ column displays the accuracy achieved by employing a hub-based prediction approach, where the majority label within a hub (a set of sibling leaf nodes) is used to predict the attributes of the unlabeled nodes within that hub. The numbers in parentheses in the ‘Hub Avg.’ column indicate the improvement in accuracy achieved by the hub-based method compared to the graph average method. This table demonstrates the significant improvement in attribute prediction accuracy provided by the hub-based approach over the simpler graph-average approach, particularly for attributes like license.
read the caption
(b)
| Method | Qwen | Llama | SD |
|---|---|---|---|
| Random - root | 1.77 | 1.84 | 0.22 |
| Random | 0.98 | 0.67 | 0.75 |
| Majority | 15.03 | 25.00 | 36.75 |
| Price’s [7] | 2.28 | 5.08 | 8.50 |
| MoTHer [18] | 32.81 | 19.32 | 50.51 |
| Ours | 78.87 | 80.44 | 85.10 |
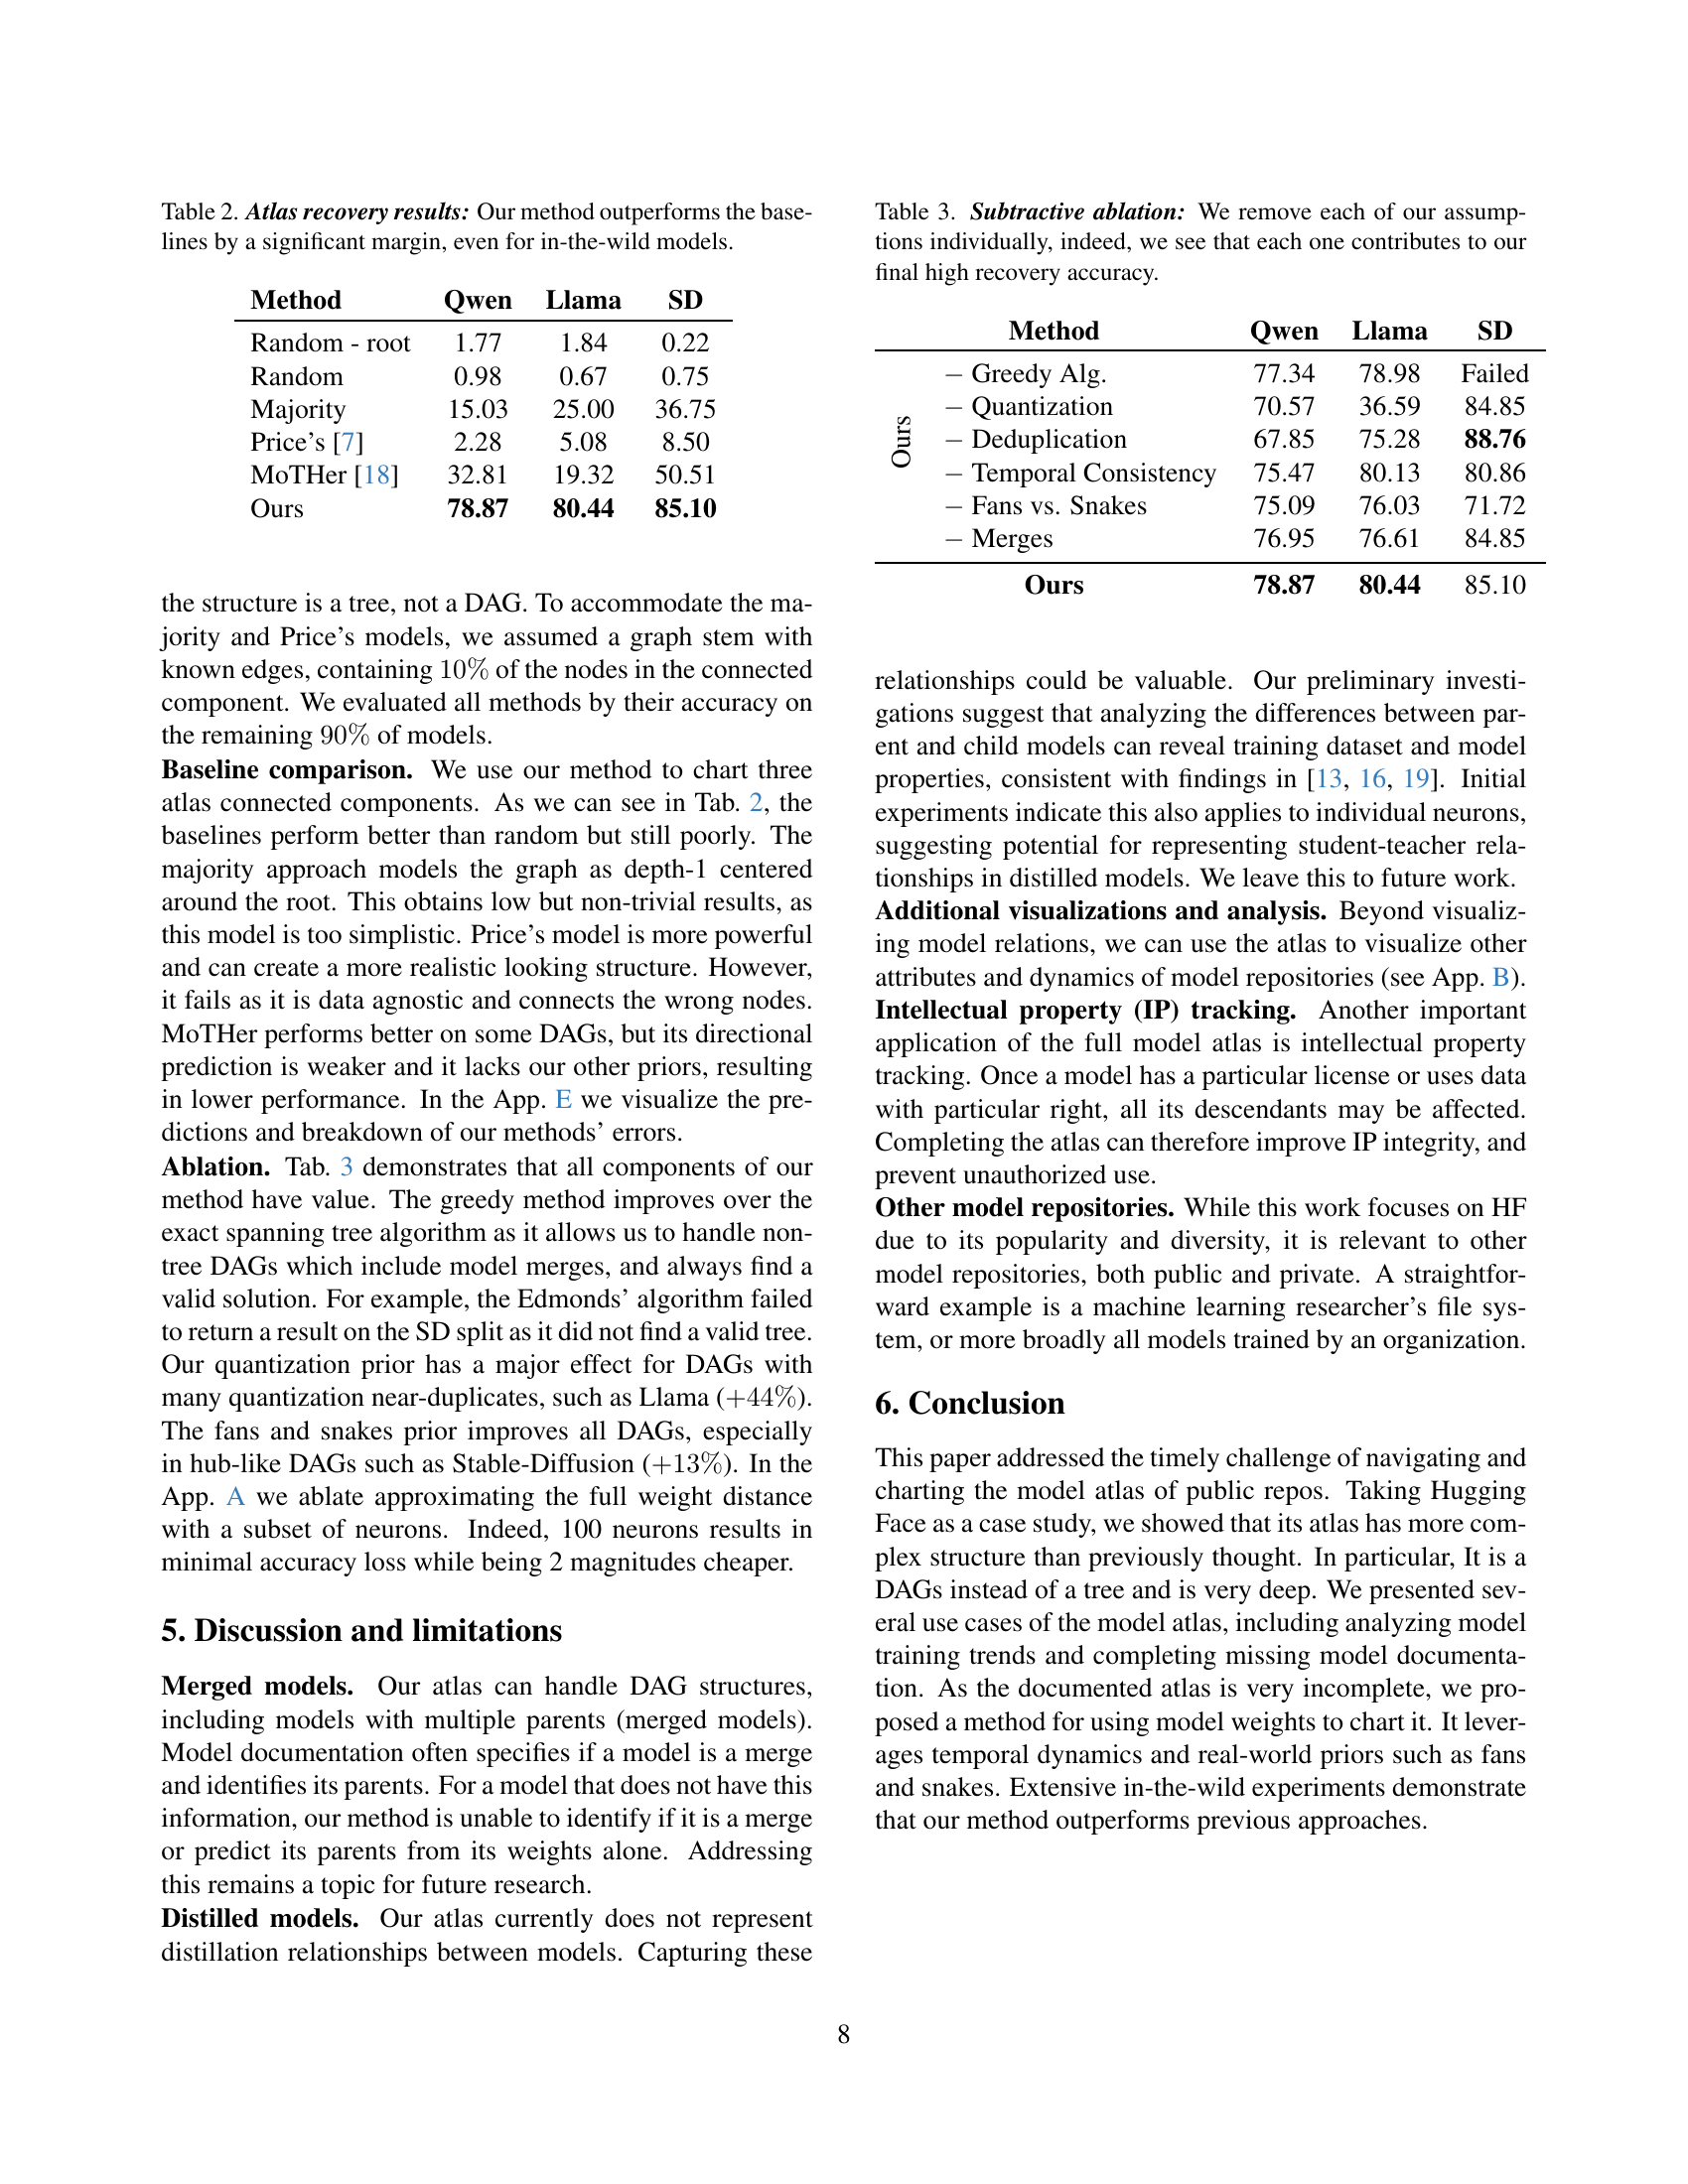
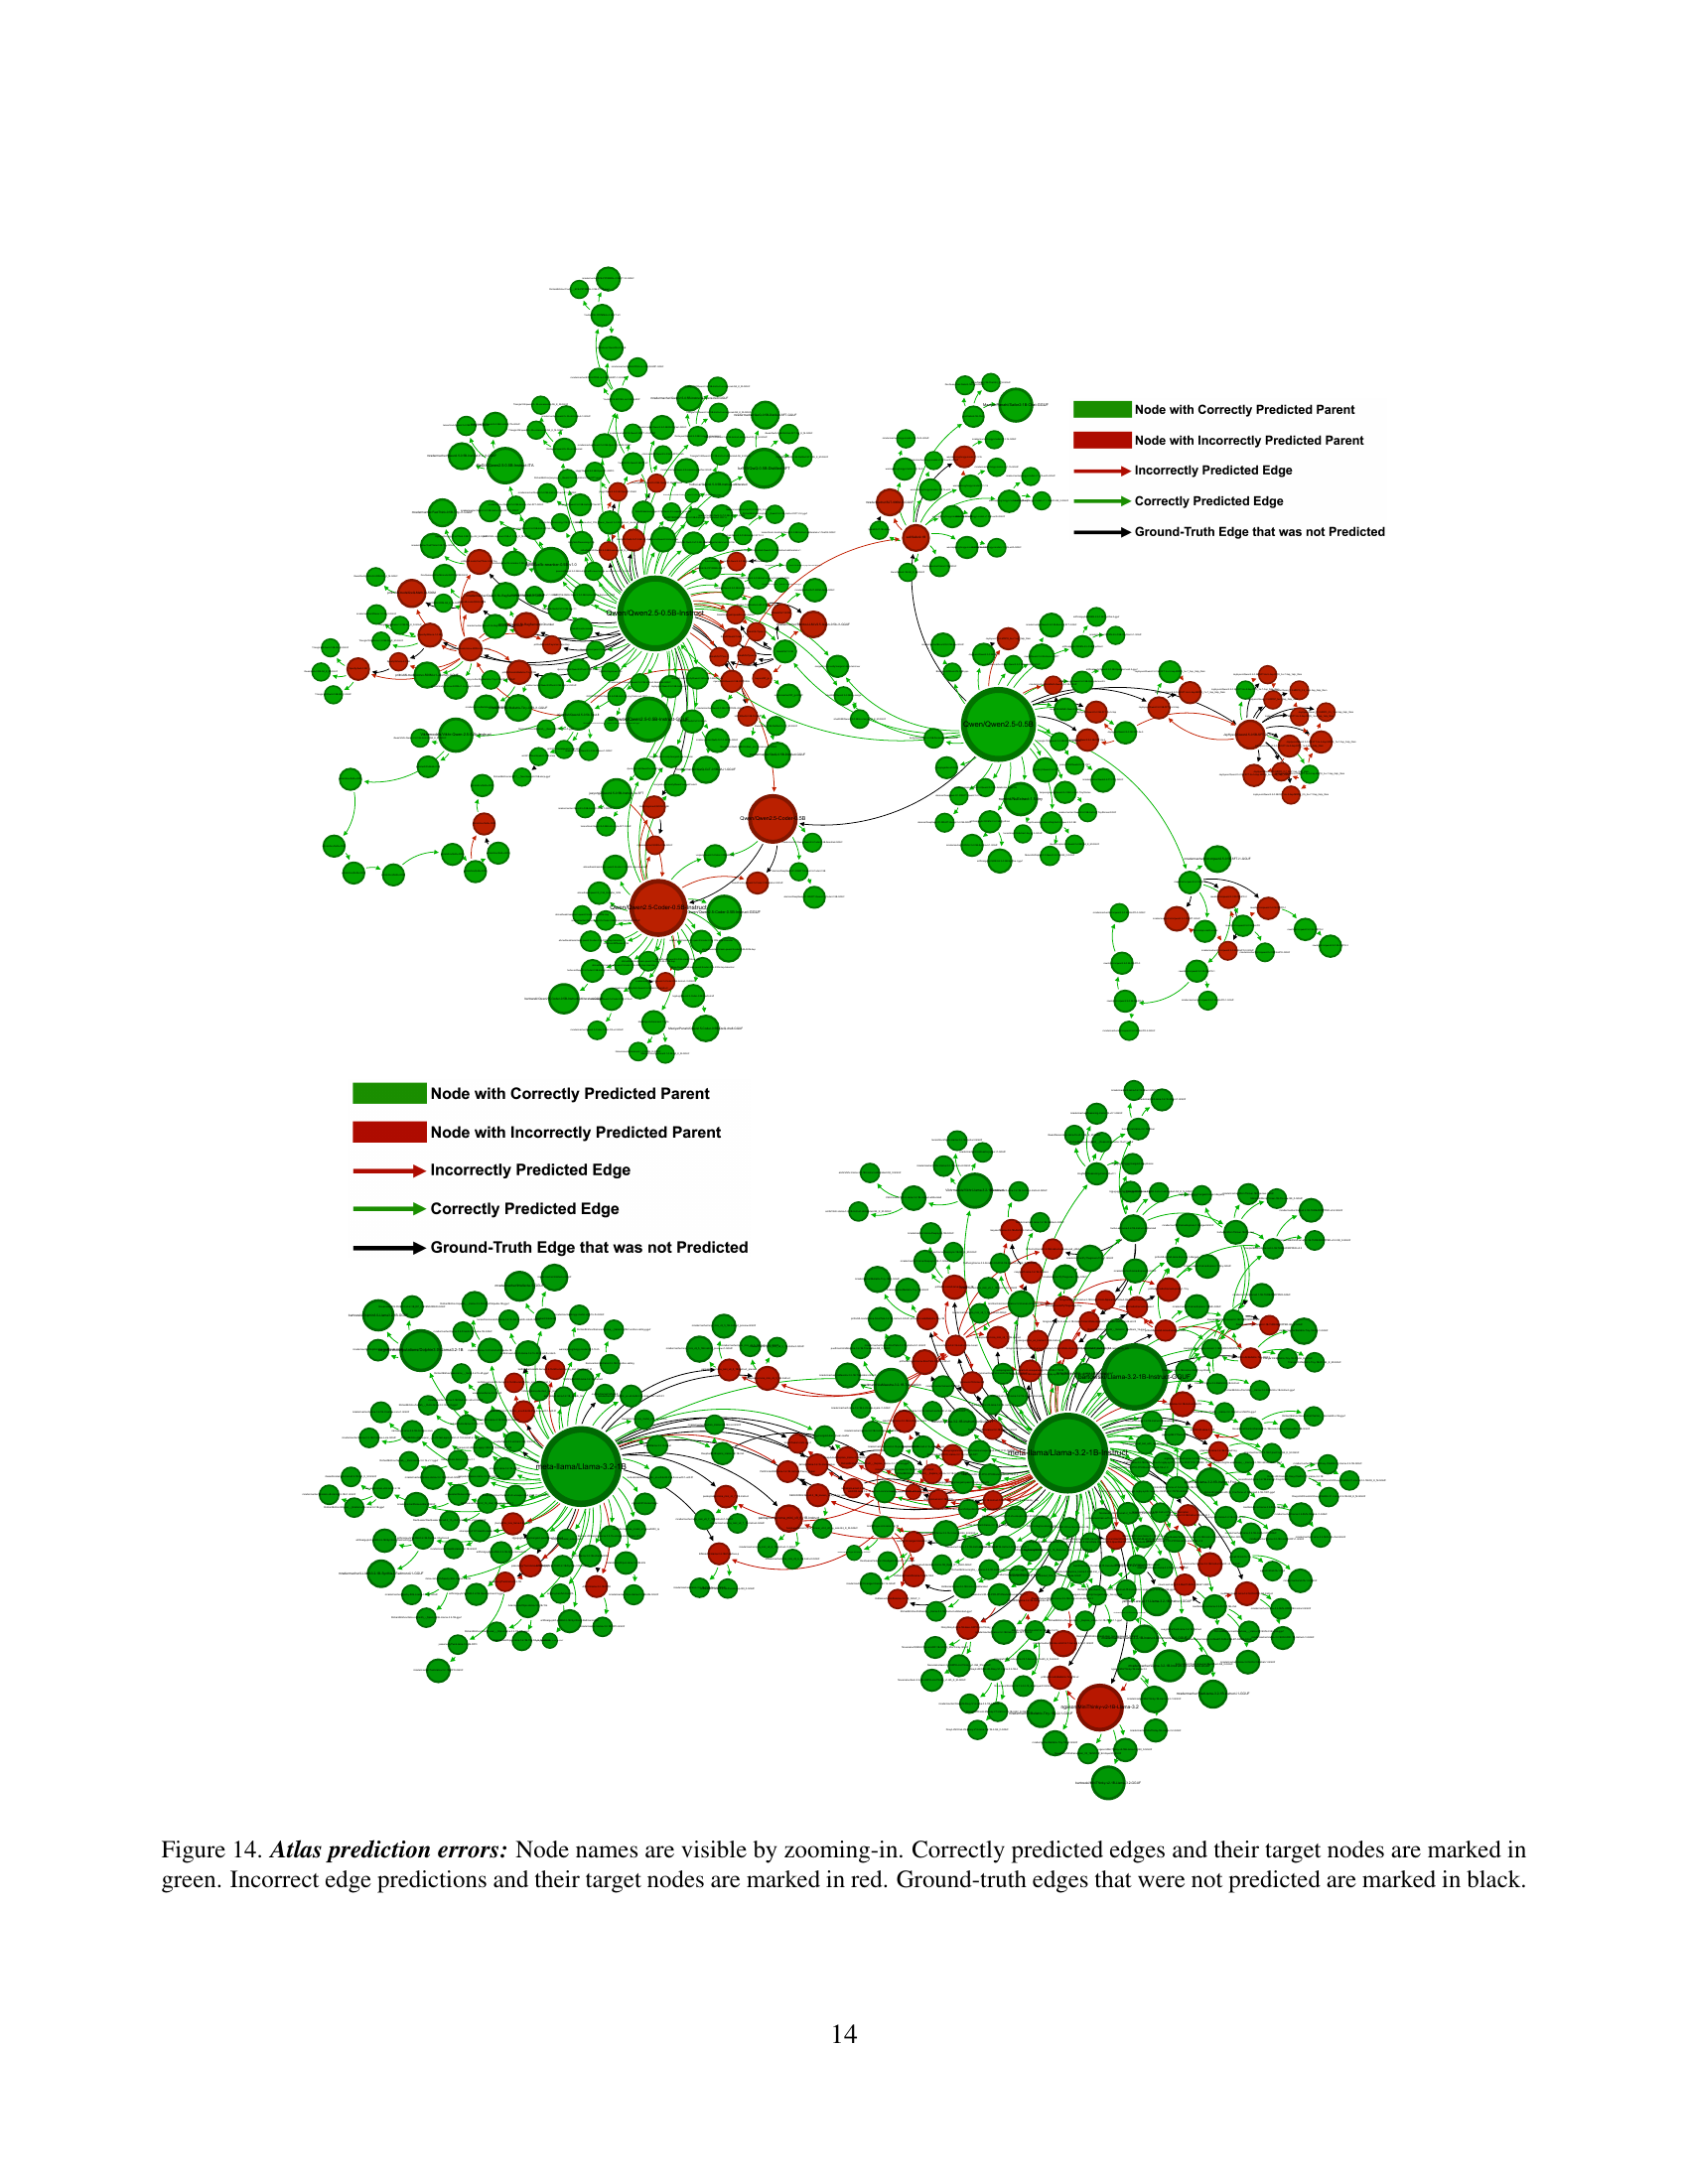
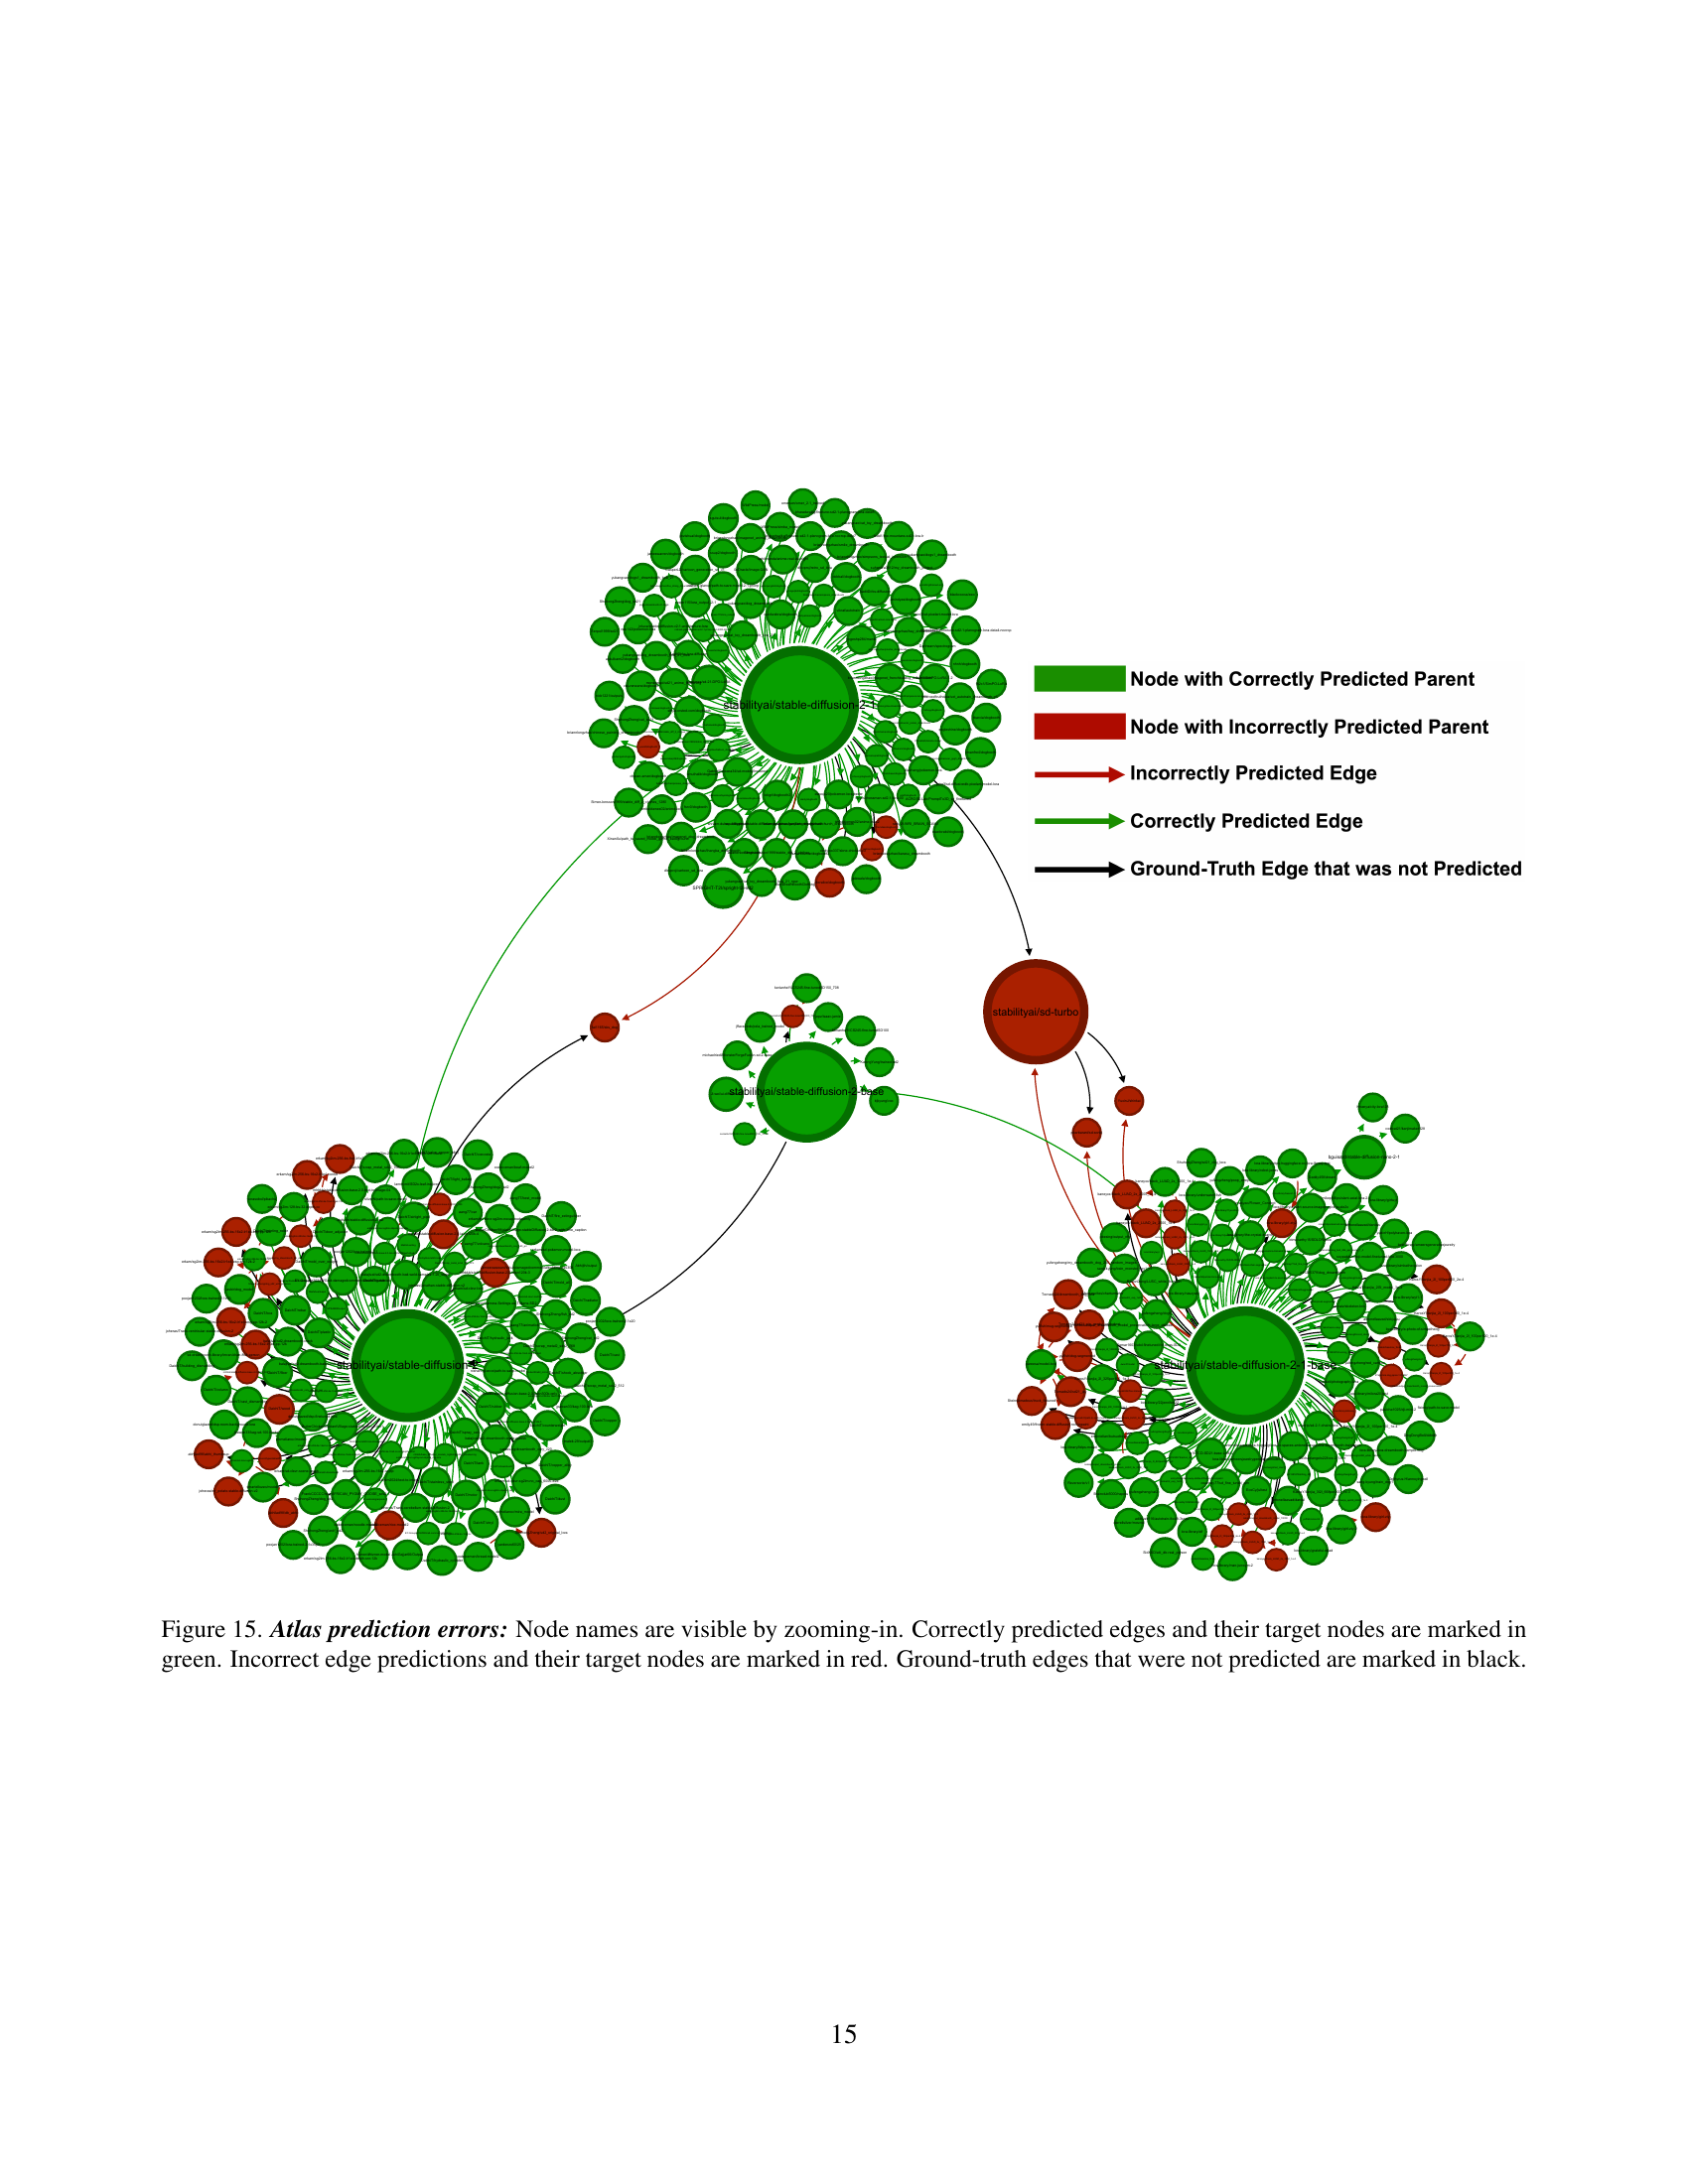
🔼 This table presents the results of an experiment evaluating the accuracy of different methods for recovering the structure of a model atlas. The atlas, representing relationships between various machine learning models, is incomplete in real-world scenarios (in-the-wild). The table compares the performance of the authors’ novel method against several baselines (Random, Majority, Price’s algorithm, and MoTHer), quantifying their success rates in correctly identifying relationships between models in three separate dataset components (Qwen, Llama, and SD). The results demonstrate the superior performance of the authors’ method.
read the caption
Table 2: Atlas recovery results: Our method outperforms the baselines by a significant margin, even for in-the-wild models.
| Method | Qwen | Llama | SD | |
|---|---|---|---|---|
| Ours | Greedy Alg. | 77.34 | 78.98 | Failed |
| Quantization | 70.57 | 36.59 | 84.85 | |
| Deduplication | 67.85 | 75.28 | 88.76 | |
| Temporal Consistency | 75.47 | 80.13 | 80.86 | |
| Fans vs. Snakes | 75.09 | 76.03 | 71.72 | |
| Merges | 76.95 | 76.61 | 84.85 | |
| Ours | 78.87 | 80.44 | 85.10 | |
🔼 This ablation study investigates the individual contributions of different assumptions made in the atlas charting method. By systematically removing each assumption (greedy algorithm, quantization prior, deduplication, temporal consistency, snake/fan classification, and handling merges), the table quantifies the impact on the accuracy of recovering the atlas structure across three distinct model families (Qwen, Llama, and SD). The results demonstrate that each assumption plays a significant role in achieving high recovery accuracy, highlighting the importance of these components in the overall methodology.
read the caption
Table 3: Subtractive ablation: We remove each of our assumptions individually, indeed, we see that each one contributes to our final high recovery accuracy.
| of Nodes | Time (sec) |
|---|---|
| 0.01 | |
| 0.06 | |
| 0.58 | |
| 19.1 |
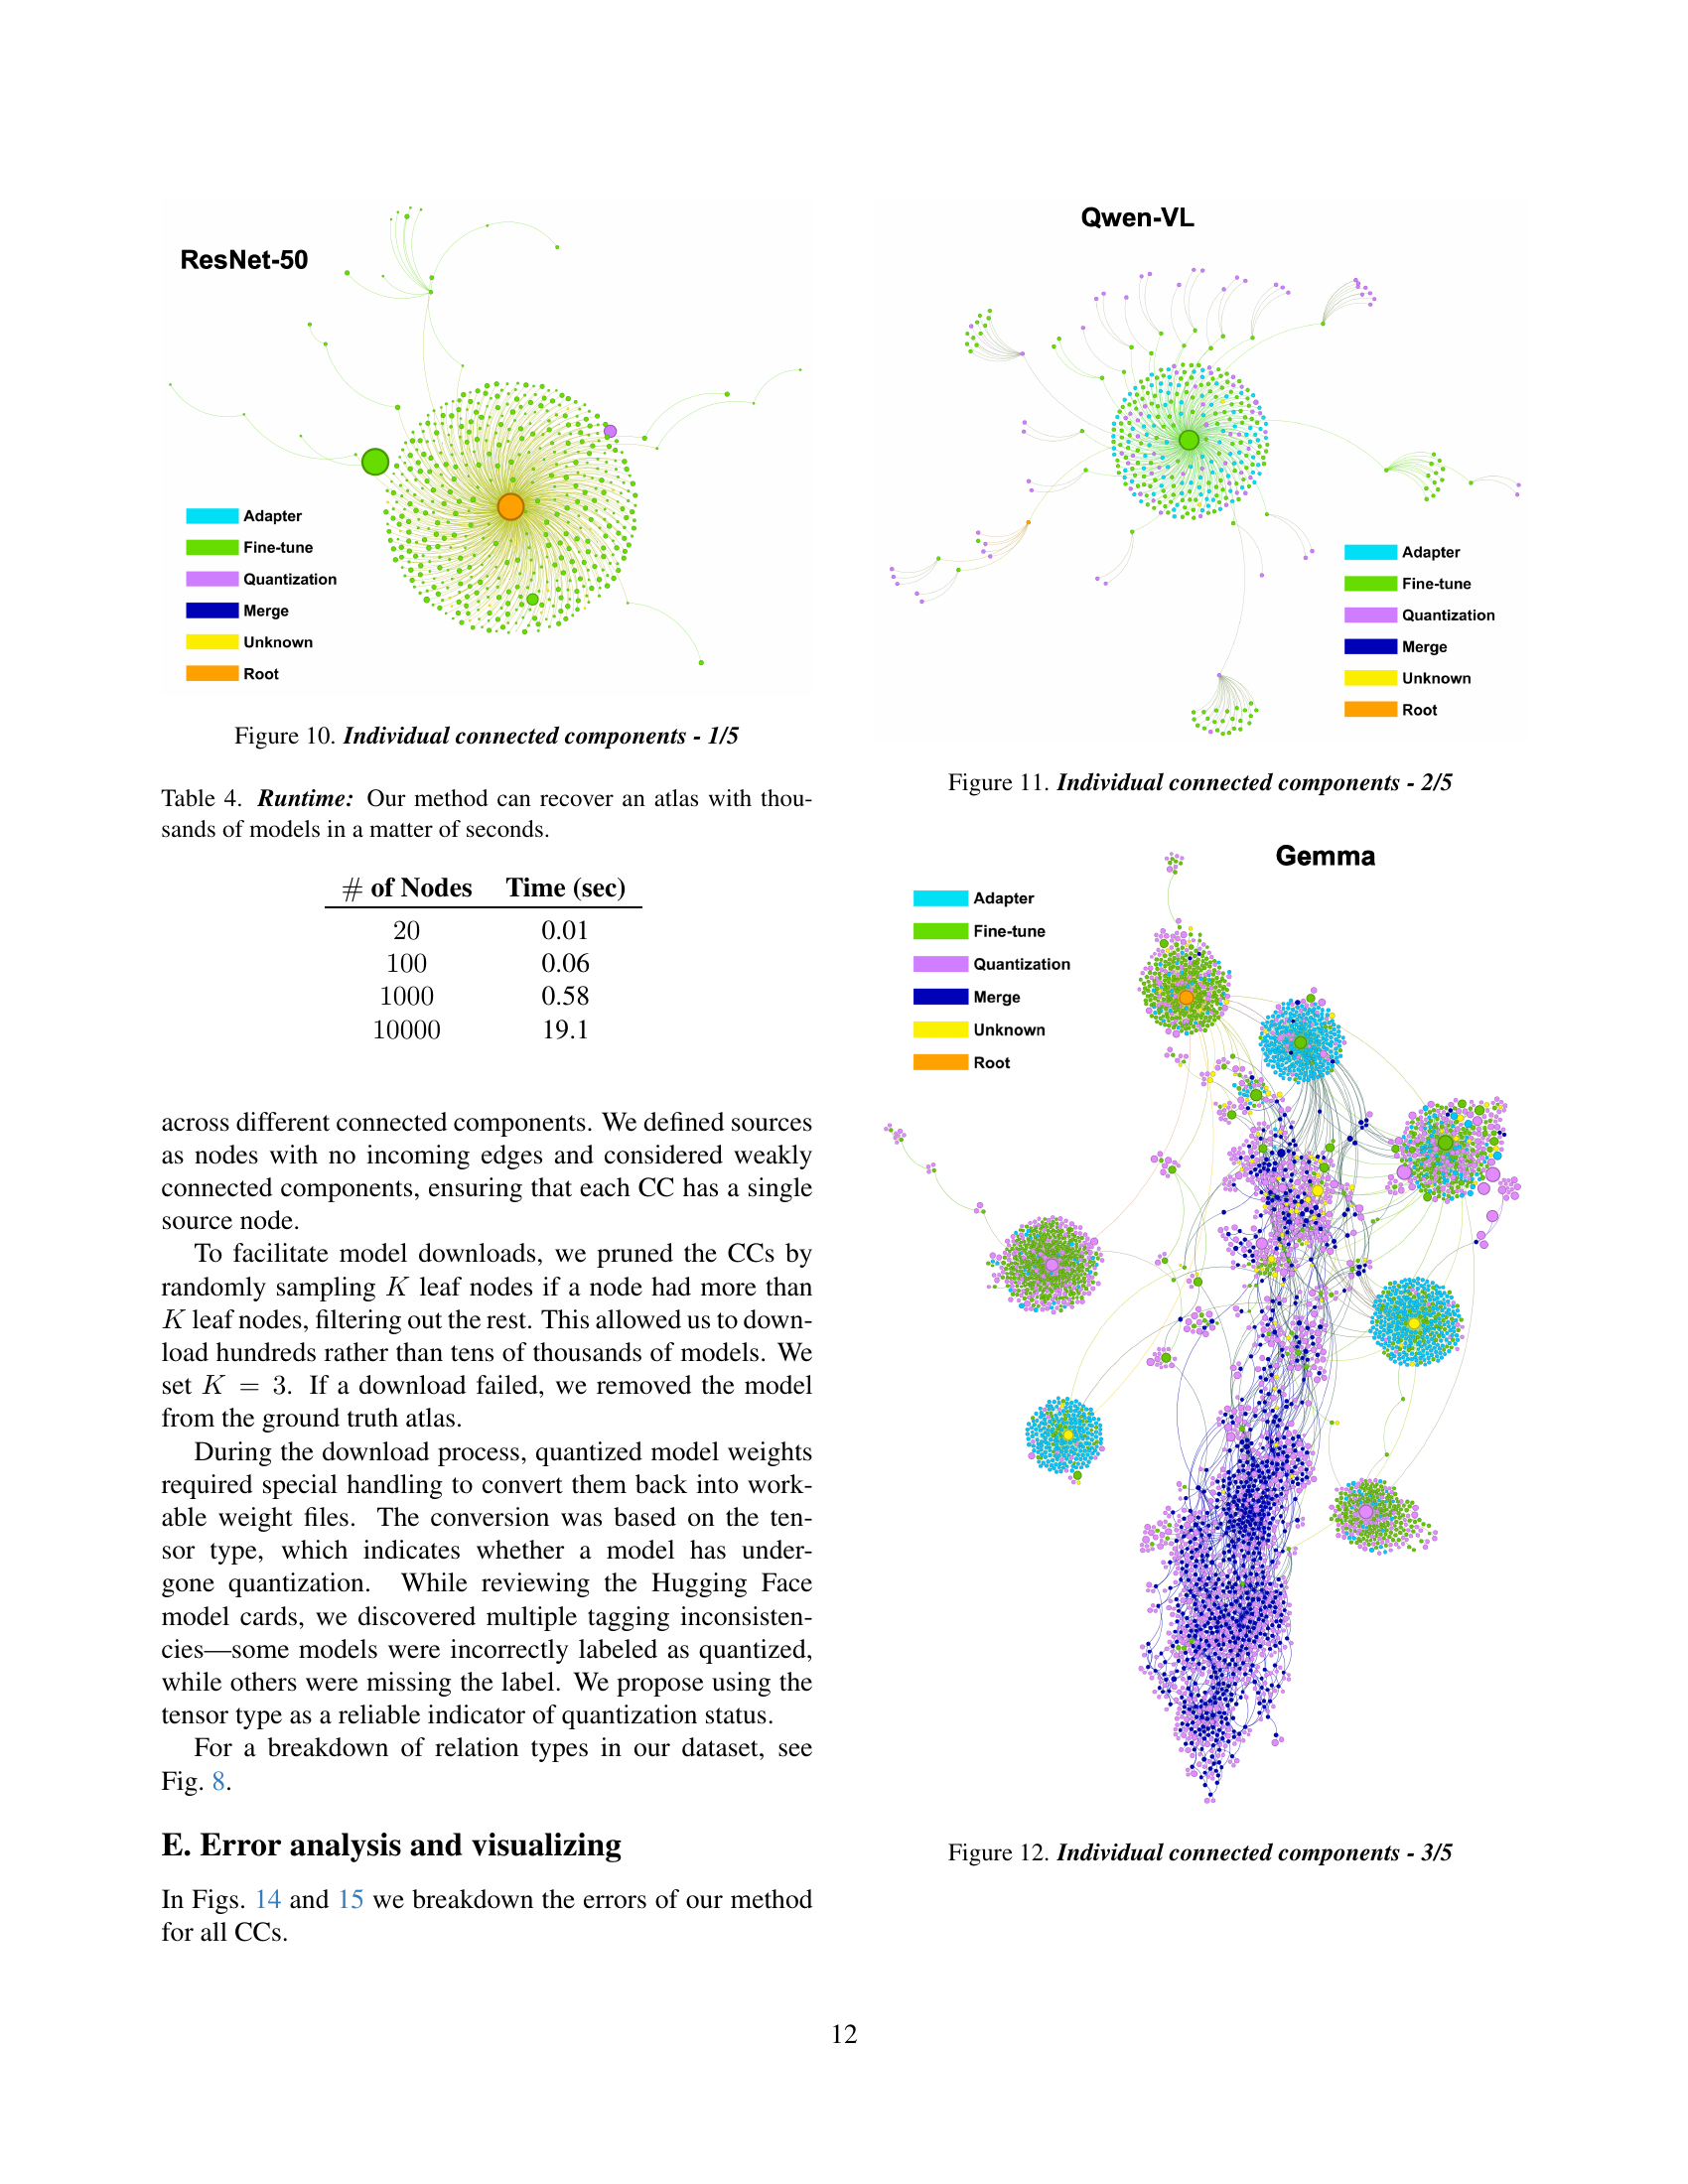
🔼 This table presents the runtime performance of the proposed atlas charting method for varying numbers of models. It demonstrates the scalability and efficiency of the approach, showing that even with thousands of models, the atlas can be reconstructed in a matter of seconds. This highlights the practical applicability of the method to large-scale model repositories.
read the caption
Table 4: Runtime: Our method can recover an atlas with thousands of models in a matter of seconds.
Full paper#