TL;DR#
Current autoregressive models use a raster-order paradigm, overlooking spatial/temporal locality in visuals. Tokens correlate more strongly with adjacent ones. To address this, the paper introduces Neighboring Autoregressive Modeling (NAR). It reframes generation as progressive outpainting using a near-to-far “next-neighbor prediction” mechanism. Tokens decode based on Manhattan distance from the initial token.
NAR uses dimension-oriented decoding heads for parallel adjacent token prediction. All tokens adjacent to decoded tokens are processed in parallel during inference, cutting model forward steps. Experiments show that NAR boosts throughput and improves FID/FVD scores for image/video tasks. It also outperforms models with larger parameter counts while using less training data, showing the approach’s efficiency and effectiveness.
Key Takeaways#
Why does it matter?#
This paper introduces a novel autoregressive modeling paradigm, addressing limitations in existing visual generation methods and opens avenues for future research in efficient and high-quality image and video synthesis, pushing the boundaries of AI-driven creative tasks. The NAR’s efficiency and quality trade-offs provide valuable insights for researchers seeking to enhance visual content creation.
Visual Insights#

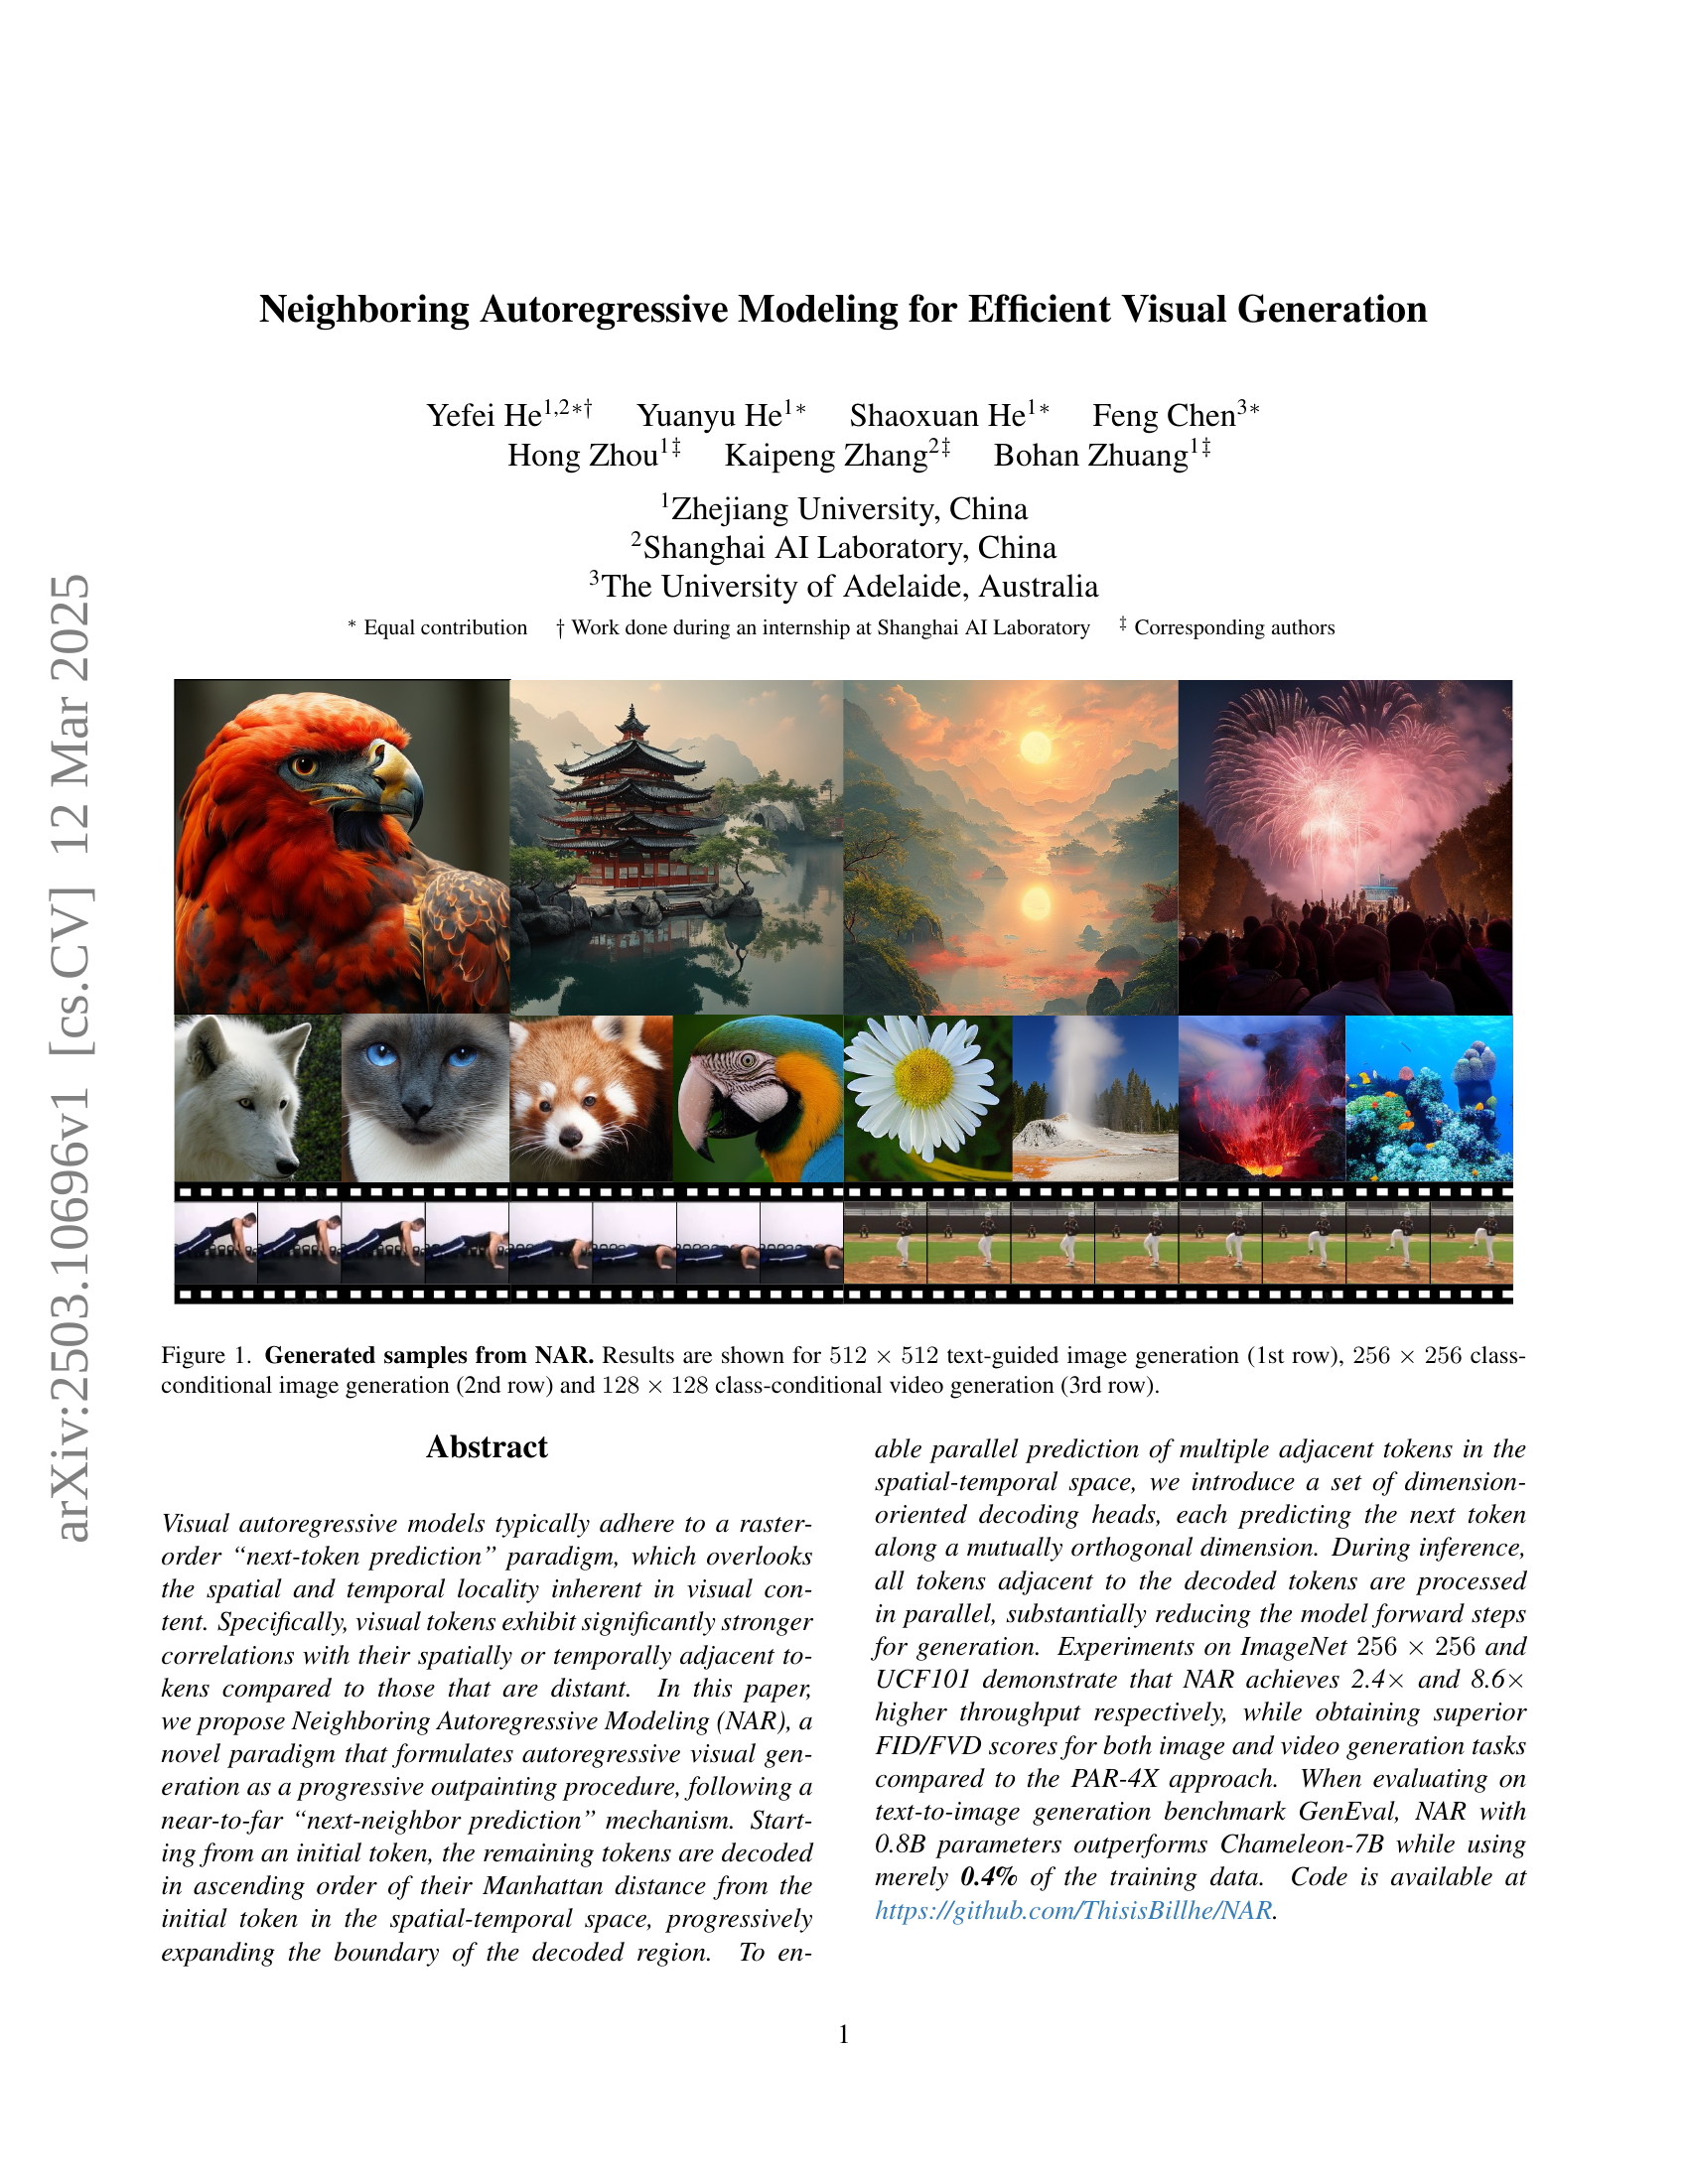
🔼 Figure 1 presents image samples generated using the Neighboring Autoregressive Modeling (NAR) method. The top row showcases examples of 512x512 pixel text-guided image generation, where the model creates images based on textual descriptions. The middle row displays 256x256 pixel images generated under class-conditional conditions, meaning the model produces images belonging to a specific predefined category. The bottom row shows frames from 128x128 pixel videos generated using class-conditional video generation. This figure demonstrates the model’s ability to generate various visual content across different resolutions and generation paradigms.
read the caption
Figure 1: Generated samples from NAR. Results are shown for 512×512512512512\times 512512 × 512 text-guided image generation (1st row), 256×256256256256\times 256256 × 256 class-conditional image generation (2nd row) and 128×128128128128\times 128128 × 128 class-conditional video generation (3rd row).
| Tokenizer | Type | Model | Params | FID | IS | Precision | Recall | Steps |
| ||
| VQVAE-108M (rFID=1.00) | VAR | VAR-d16 | 310M | 3.30 | 274.4 | 0.84 | 0.51 | 10 | 129.3 | ||
| VAR-d20 | 600M | 2.57 | 302.6 | 0.83 | 0.56 | 10 | 77.6 | ||||
| VAR-d24 | 1.0B | 2.09 | 312.9 | 0.82 | 0.59 | 10 | 50.6 | ||||
| VAR-d30 | 2.0B | 1.92 | 323.1 | 0.82 | 0.59 | 10 | 29.9 | ||||
| VQVAE-72M (rFID=2.19) | AR | LlamaGen-B | 111M | 5.46 | 193.6 | 0.84 | 0.46 | 256 | 117.9 | ||
| LlamaGen-L | 343M | 3.80 | 248.3 | 0.83 | 0.52 | 256 | 47.1 | ||||
| LlamaGen-XL | 775M | 3.39 | 227.1 | 0.81 | 0.54 | 256 | 23.7 | ||||
| LlamaGen-XXL | 1.4B | 3.09 | 253.6 | 0.83 | 0.53 | 256 | 14.1 | ||||
| PAR | PAR-B-4X | 111M | 6.21 | 204.4 | 0.86 | 0.39 | 67 | 174.1 | |||
| PAR-L-4X | 343M | 4.32 | 189.4 | 0.87 | 0.43 | 67 | 93.8 | ||||
| PAR-XL-4X | 775M | 3.50 | 234.4 | 0.84 | 0.49 | 67 | 53.9 | ||||
| PAR-XXL-4X | 1.4B | 3.20 | 288.3 | 0.86 | 0.50 | 67 | 33.9 | ||||
| NAR | NAR-B | 130M | 4.65 | 212.3 | 0.83 | 0.47 | 31 | 419.7 | |||
| NAR-M | 290M | 3.27 | 257.5 | 0.82 | 0.53 | 31 | 248.5 | ||||
| NAR-L | 372M | 3.06 | 263.9 | 0.81 | 0.53 | 31 | 195.4 | ||||
| NAR-XL | 816M | 2.70 | 277.5 | 0.81 | 0.58 | 31 | 98.1 | ||||
| NAR-XXL | 1.46B | 2.58 | 293.5 | 0.82 | 0.57 | 31 | 56.9 |
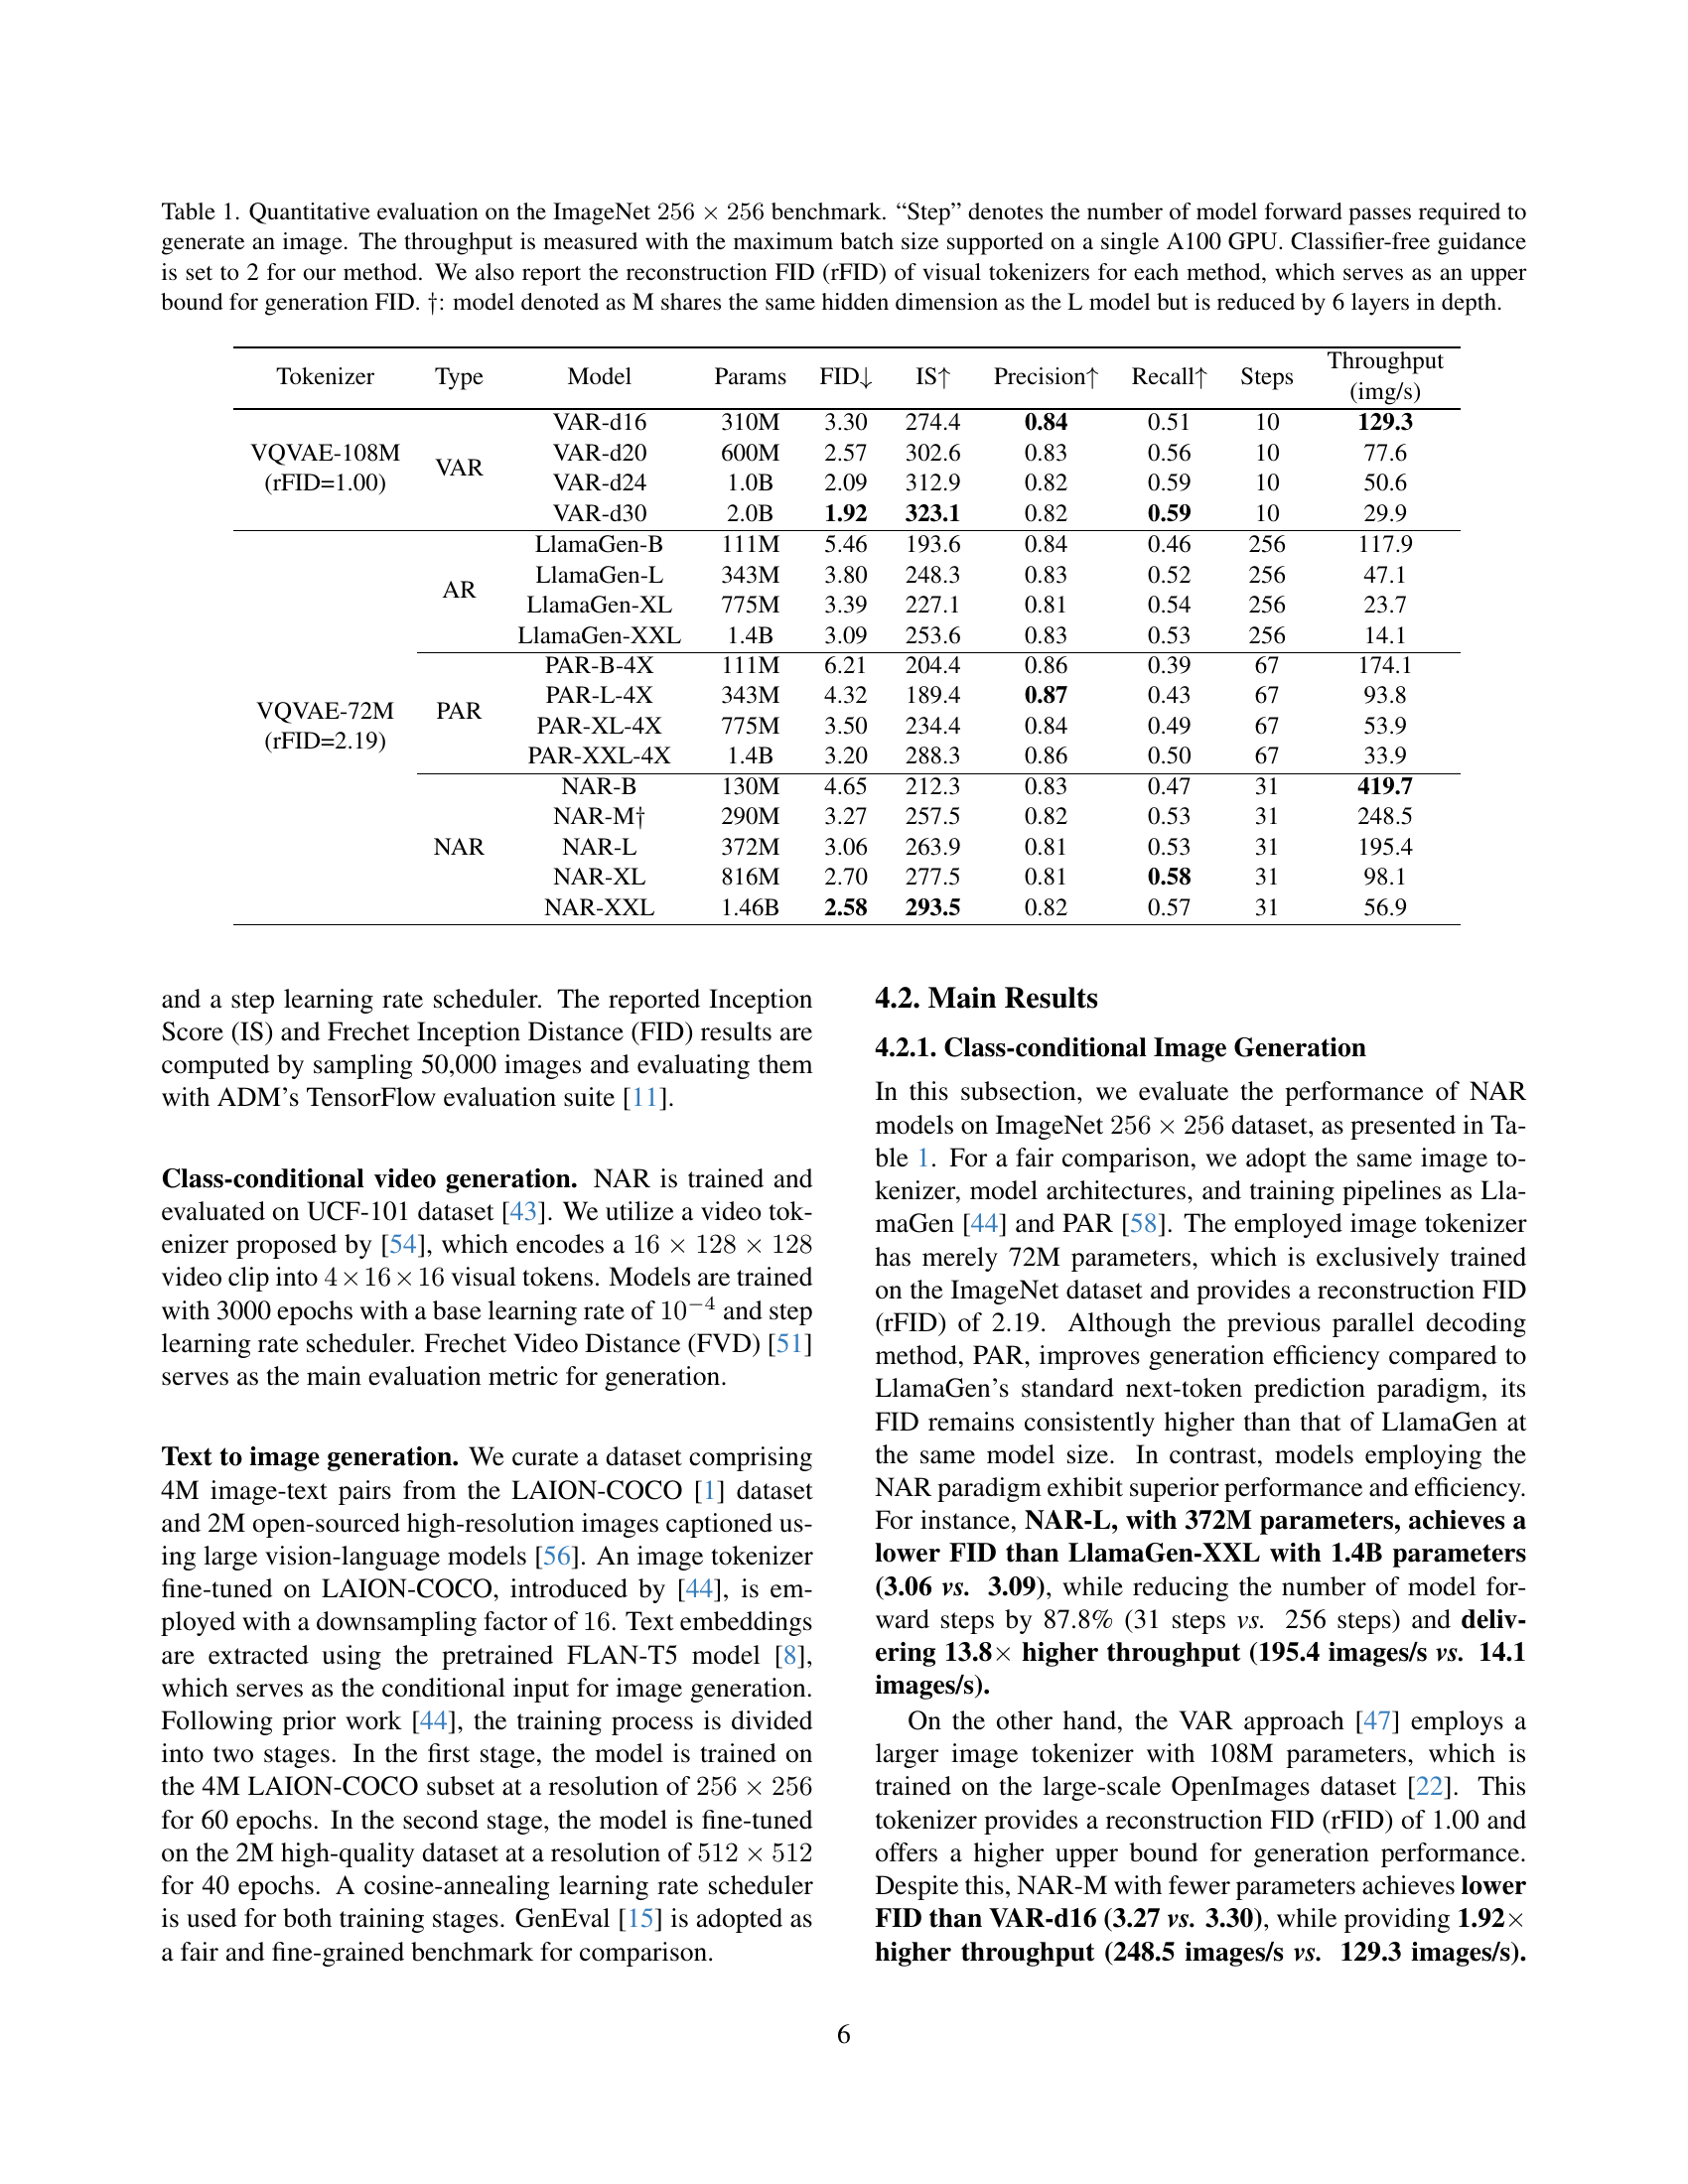
🔼 This table presents a quantitative comparison of various autoregressive image generation models on the ImageNet 256x256 dataset. Key metrics evaluated include FID (Fréchet Inception Distance), which measures the quality of generated images by comparing them to real images, and IS (Inception Score), indicating the diversity and quality of the generated images. Other important metrics are Precision, Recall, the number of Steps (model forward passes) needed to generate a single image, and Throughput (images per second). The table includes results from different model sizes and variations of autoregressive approaches (e.g., Vanilla AR, VAR, PAR, NAR) allowing for a comprehensive analysis of generation efficiency and image quality. The reconstruction FID (rFID) of the visual tokenizers used is also reported, serving as an upper bound for the generation FID. One model variation (‘M’) uses the same hidden dimension as its ‘L’ counterpart but with a reduced depth (6 fewer layers).
read the caption
Table 1: Quantitative evaluation on the ImageNet 256×256256256256\times 256256 × 256 benchmark. “Step” denotes the number of model forward passes required to generate an image. The throughput is measured with the maximum batch size supported on a single A100 GPU. Classifier-free guidance is set to 2 for our method. We also report the reconstruction FID (rFID) of visual tokenizers for each method, which serves as an upper bound for generation FID. ††\dagger†: model denoted as M shares the same hidden dimension as the L model but is reduced by 6 layers in depth.
In-depth insights#
Locality Matters#
Locality matters significantly impacts efficiency and quality in visual generation. Visual data exhibits strong correlations between spatially and temporally adjacent elements, unlike raster-scan approaches. Exploiting this locality through methods like neighboring autoregressive modeling (NAR) boosts performance. NAR models predict nearby tokens, preserving visual coherence and enabling parallel processing. Dimension-oriented decoding heads further optimize this by handling diverse dimensions. Such methods enhance throughput and reduce generation steps, improving both speed and visual fidelity. Prioritizing locality allows models to capture fine-grained details and global structures efficiently, leading to more coherent and aesthetically pleasing visual outputs.
NAR Paradigm#
The Neighboring Autoregressive Modeling (NAR) paradigm introduces a novel approach to visual generation, contrasting with traditional raster-order methods. It leverages spatial-temporal locality, decoding tokens in a near-to-far manner, resembling an outpainting process. Key to NAR is the use of dimension-oriented decoding heads, enabling parallel prediction of adjacent tokens, significantly speeding up the generation process. This design addresses the limitations of standard next-token prediction by modeling distinct conditional distributions along orthogonal dimensions. NAR demonstrates superior efficiency and quality, achieving better FID/FVD scores with fewer generation steps. The approach reduces training overhead, working well with existing tokenizers. NAR represents a promising direction for autoregressive visual generation.
Parallel Decoding#
Parallel decoding offers substantial gains in generation speed, addressing a key bottleneck in autoregressive models. This technique allows for the simultaneous generation of multiple image tokens. Models like SJD retain raster order but predict consecutive tokens. PAR divides image tokens and predicts tokens with spatial distance. VAR generates tokens from coarse to fine scales using a next-scale prediction. NAR uses a set of dimension-oriented decoding heads, each predicting the next token. NAR supports parallel decoding; once tokens are decoded, all adjacent tokens can be generated, thus improving generation efficiency by parallel processing for high-performance and efficient image generation.
Reduced Steps#
The concept of “Reduced Steps” is paramount in the context of efficient visual generation, as autoregressive models traditionally require a large number of sequential steps to generate a high-resolution image. Reducing these steps directly translates to faster generation times and lower computational costs. Various strategies aim to achieve this, such as parallel decoding or predicting multiple tokens at once. However, the effectiveness of step reduction hinges on preserving spatial and temporal coherence within the generated content. Overly aggressive step reduction can lead to context loss and degraded image quality. The paradigm must strike a balance between computational efficiency and visual fidelity to ensure practical applicability.
Code Available#
The authors make their code publicly available, which is a crucial step for reproducibility and further research in the field of efficient visual generation. By releasing the code, they are allowing other researchers and practitioners to build upon their work, validate their findings, and explore new applications of Neighboring Autoregressive Modeling (NAR). This open-source approach fosters collaboration and accelerates advancements in the domain. The link to the code repository is provided, enabling seamless access for anyone interested in experimenting with NAR. Having the code available is valuable, allowing other researchers to understand the implementation details, experiment with different parameters, and potentially extend the method to other tasks or datasets. This also facilitates the comparison with other autoregressive visual generation techniques. The released code will likely include the model architecture, training scripts, and evaluation metrics used in the paper, further enhancing its accessibility and impact.
More visual insights#
More on figures

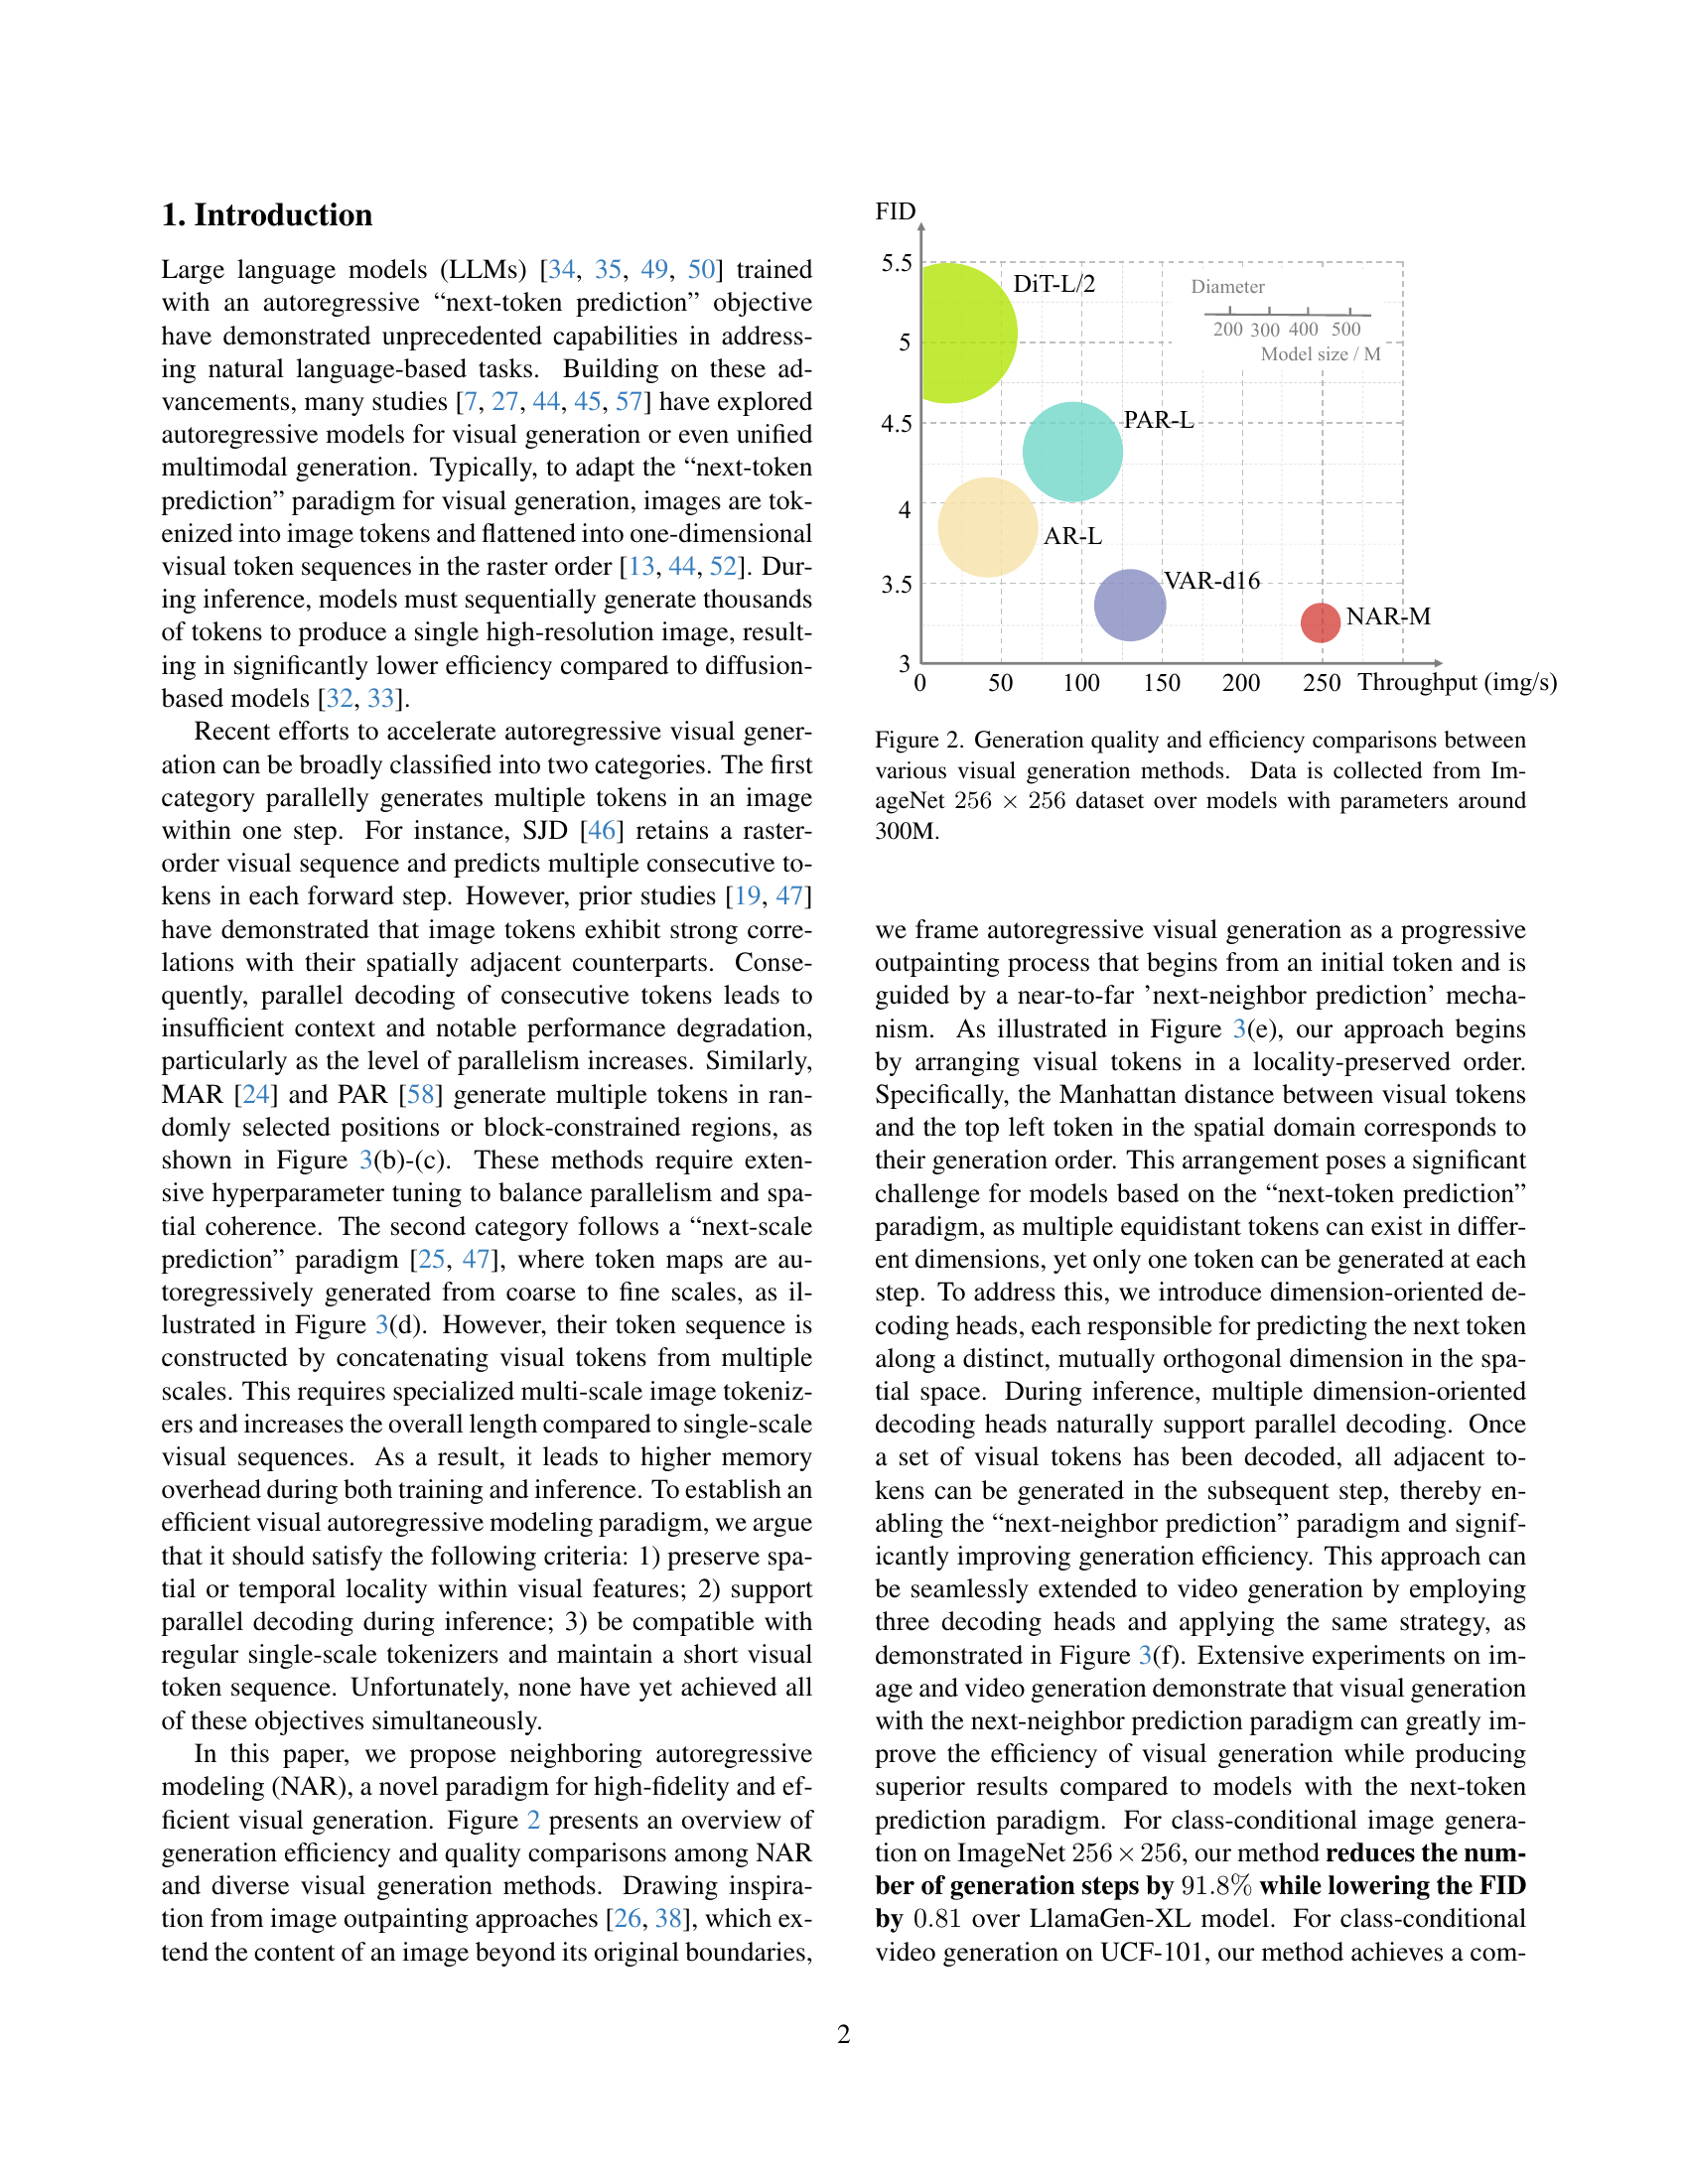
🔼 Figure 2 presents a comparison of the generation quality and efficiency of different visual generation models. The models all have approximately 300 million parameters. The comparison is based on results from the ImageNet 256x256 dataset. The figure shows that NAR-M achieves a balance between high image quality and high generation speed, outperforming other models.
read the caption
Figure 2: Generation quality and efficiency comparisons between various visual generation methods. Data is collected from ImageNet 256×256256256256\times 256256 × 256 dataset over models with parameters around 300M.

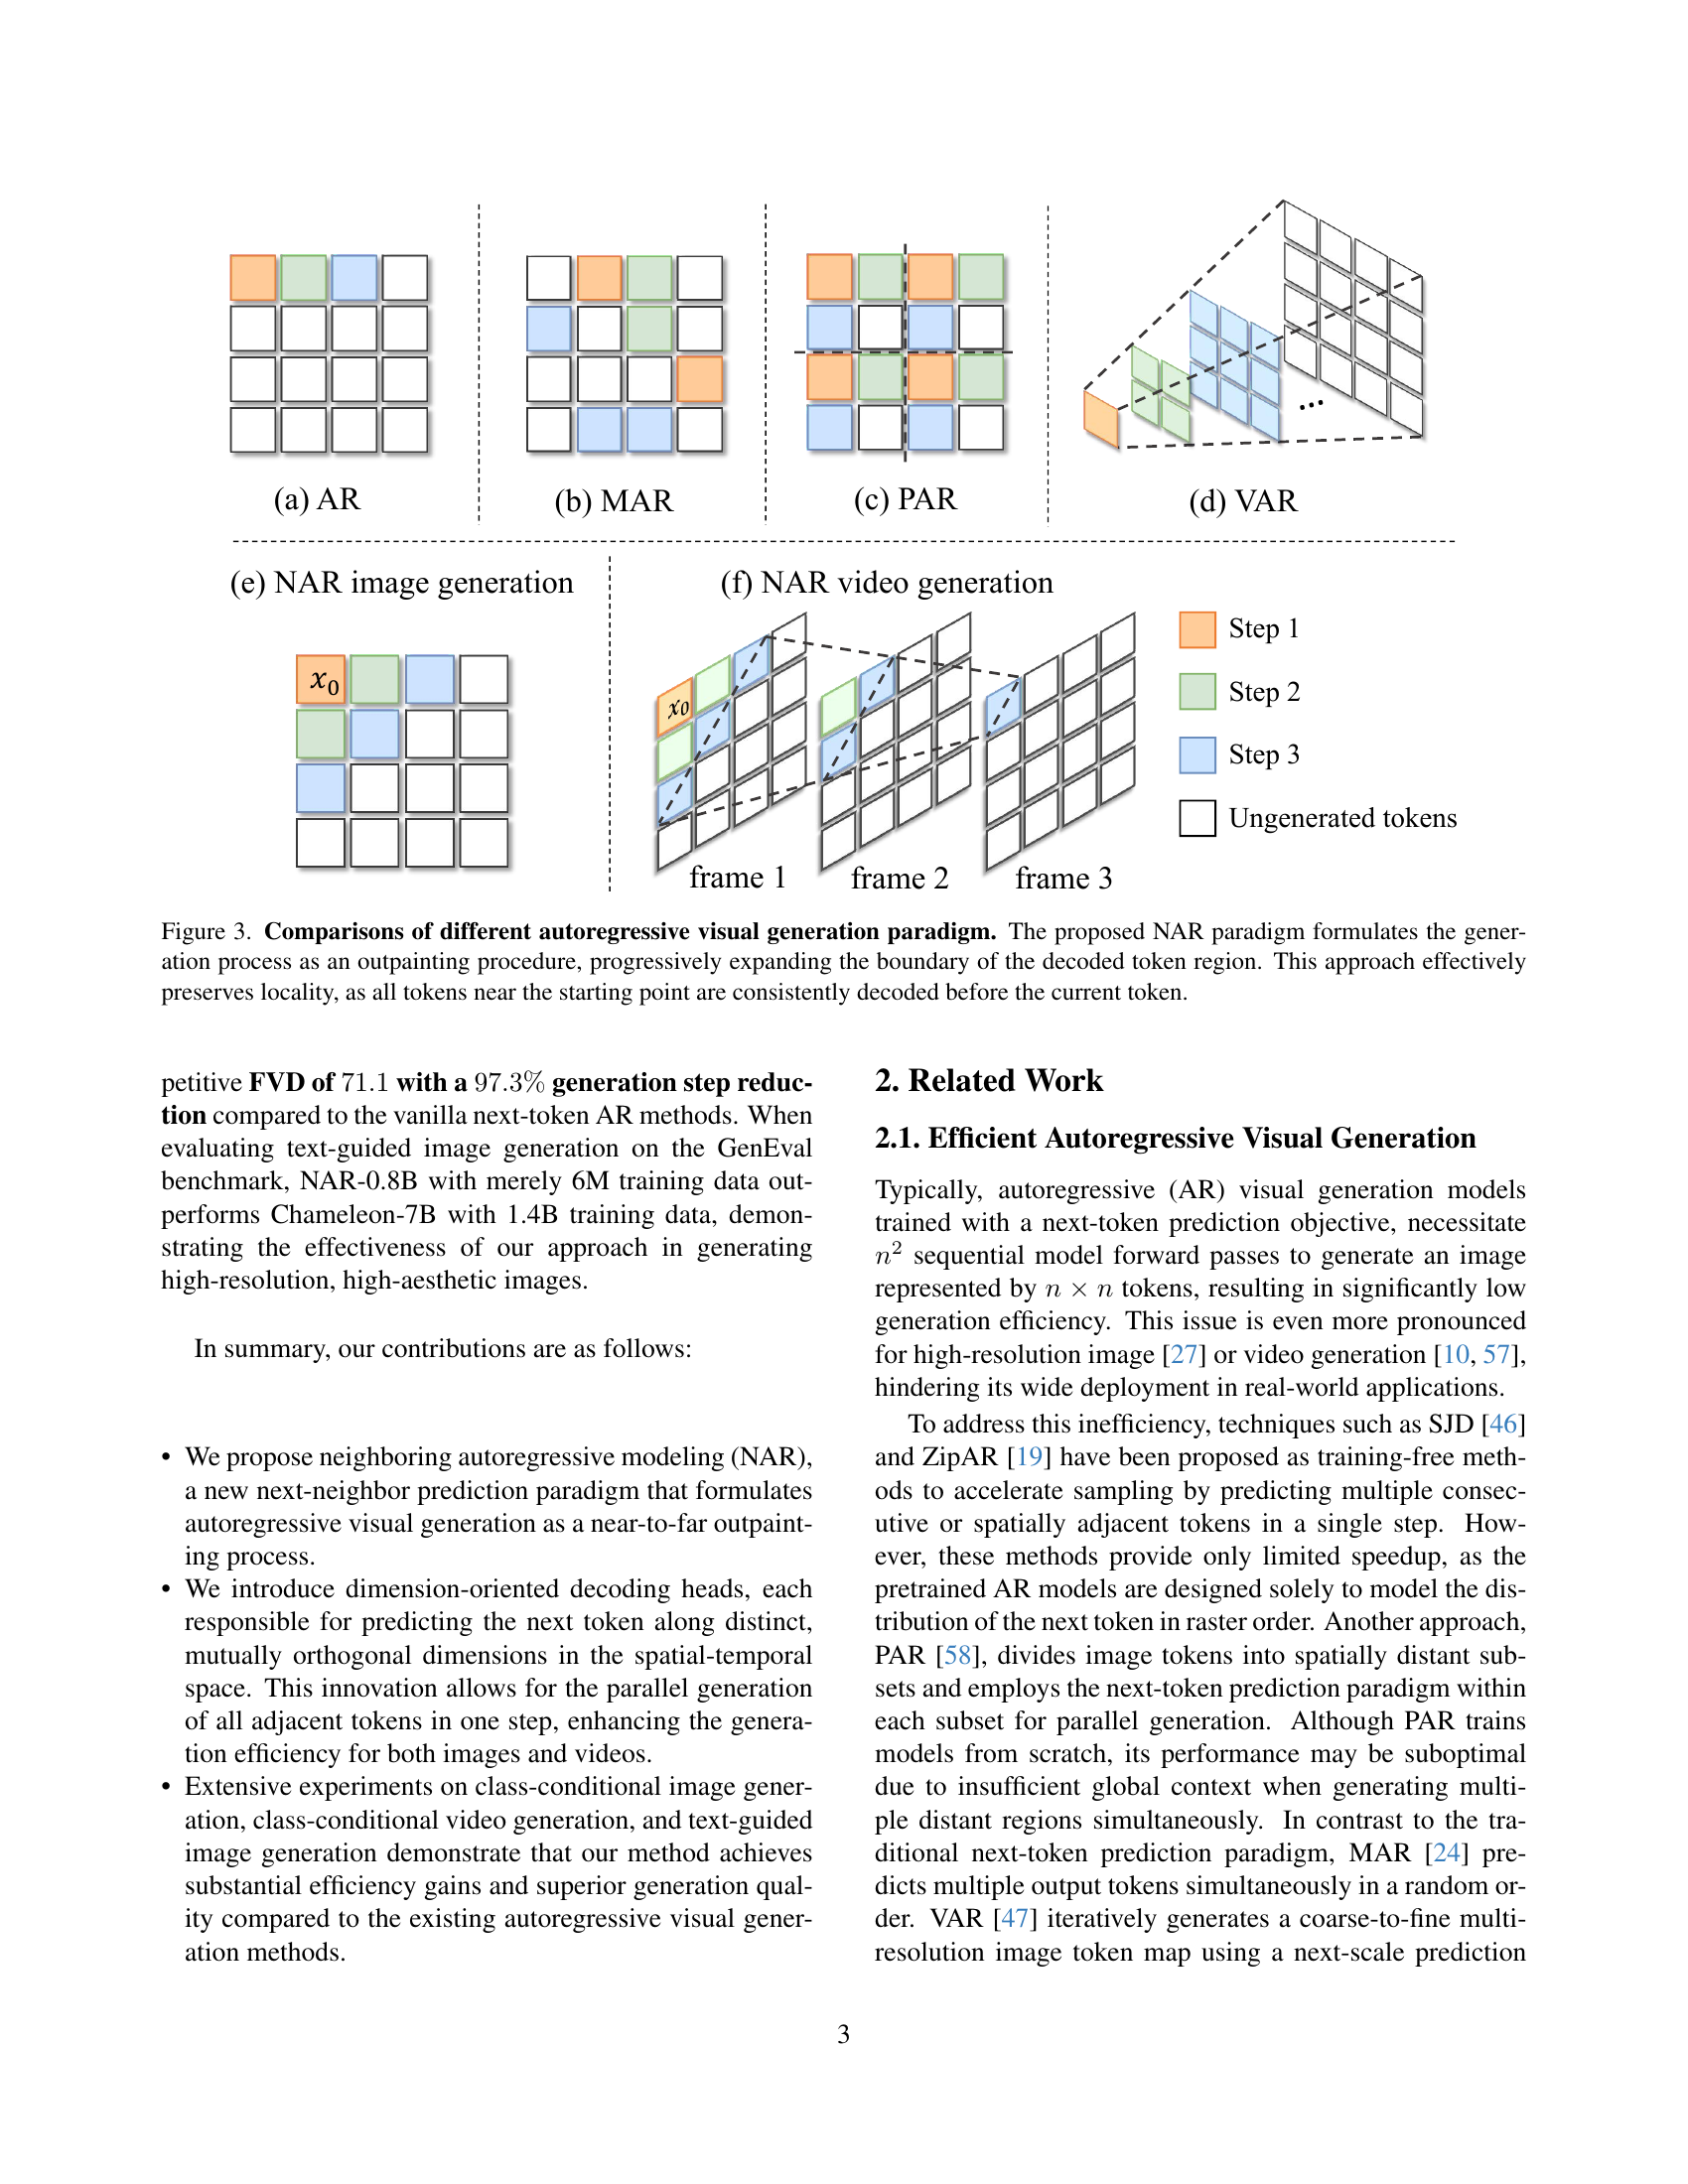
🔼 This figure compares different autoregressive visual generation methods, highlighting their generation processes. It illustrates how traditional methods (AR, MAR, PAR, VAR) generate images in raster or random order, often lacking spatial coherence and efficiency. In contrast, the proposed NAR (Neighboring Autoregressive) method progressively generates the image like an ‘outpainting’, starting from an initial token and expanding outwards. This approach is shown to improve efficiency and maintain spatial consistency, as adjacent pixels are generated before more distant pixels.
read the caption
Figure 3: Comparisons of different autoregressive visual generation paradigm. The proposed NAR paradigm formulates the generation process as an outpainting procedure, progressively expanding the boundary of the decoded token region. This approach effectively preserves locality, as all tokens near the starting point are consistently decoded before the current token.

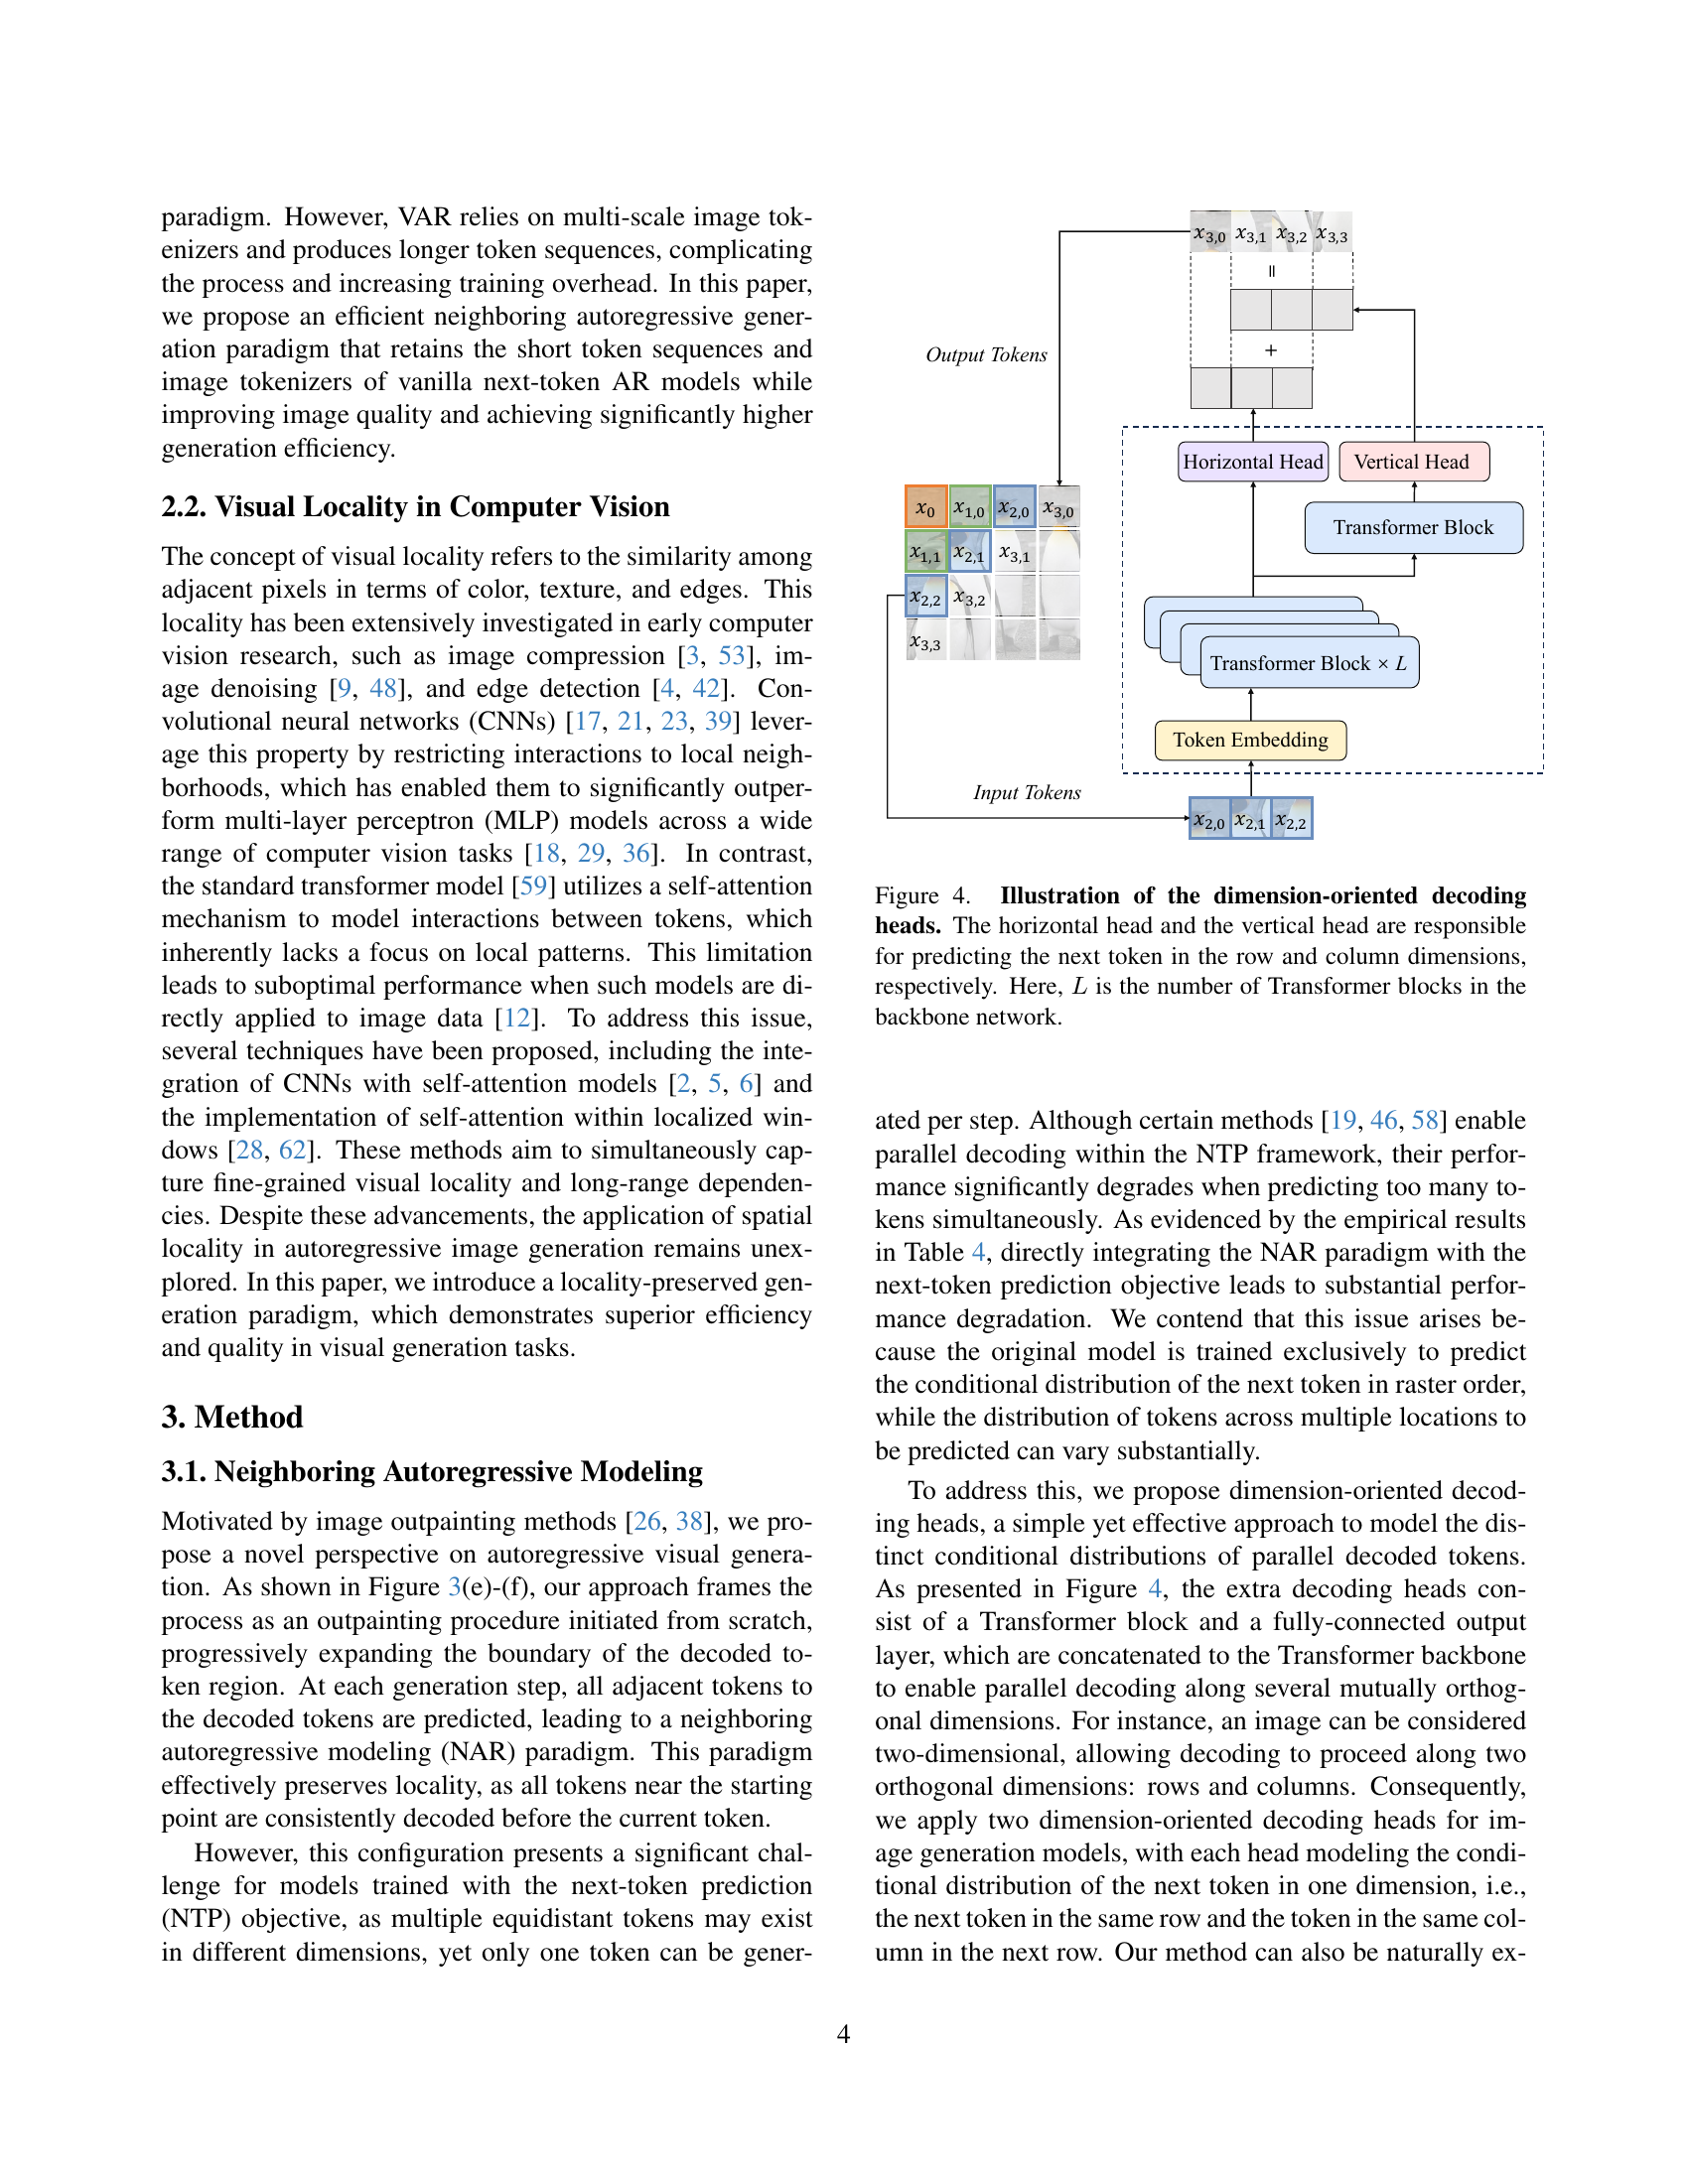
🔼 This figure illustrates the architecture of the dimension-oriented decoding heads in the Neighboring Autoregressive Modeling (NAR) framework. Two heads process the input tokens in parallel. The horizontal head predicts the next token along the row dimension (horizontally), while the vertical head predicts the next token along the column dimension (vertically). Both heads utilize a backbone network consisting of L Transformer blocks, which process the input embeddings to generate the predictions. This parallel processing significantly speeds up inference by predicting multiple tokens simultaneously.
read the caption
Figure 4: Illustration of the dimension-oriented decoding heads. The horizontal head and the vertical head are responsible for predicting the next token in the row and column dimensions, respectively. Here, L𝐿Litalic_L is the number of Transformer blocks in the backbone network.

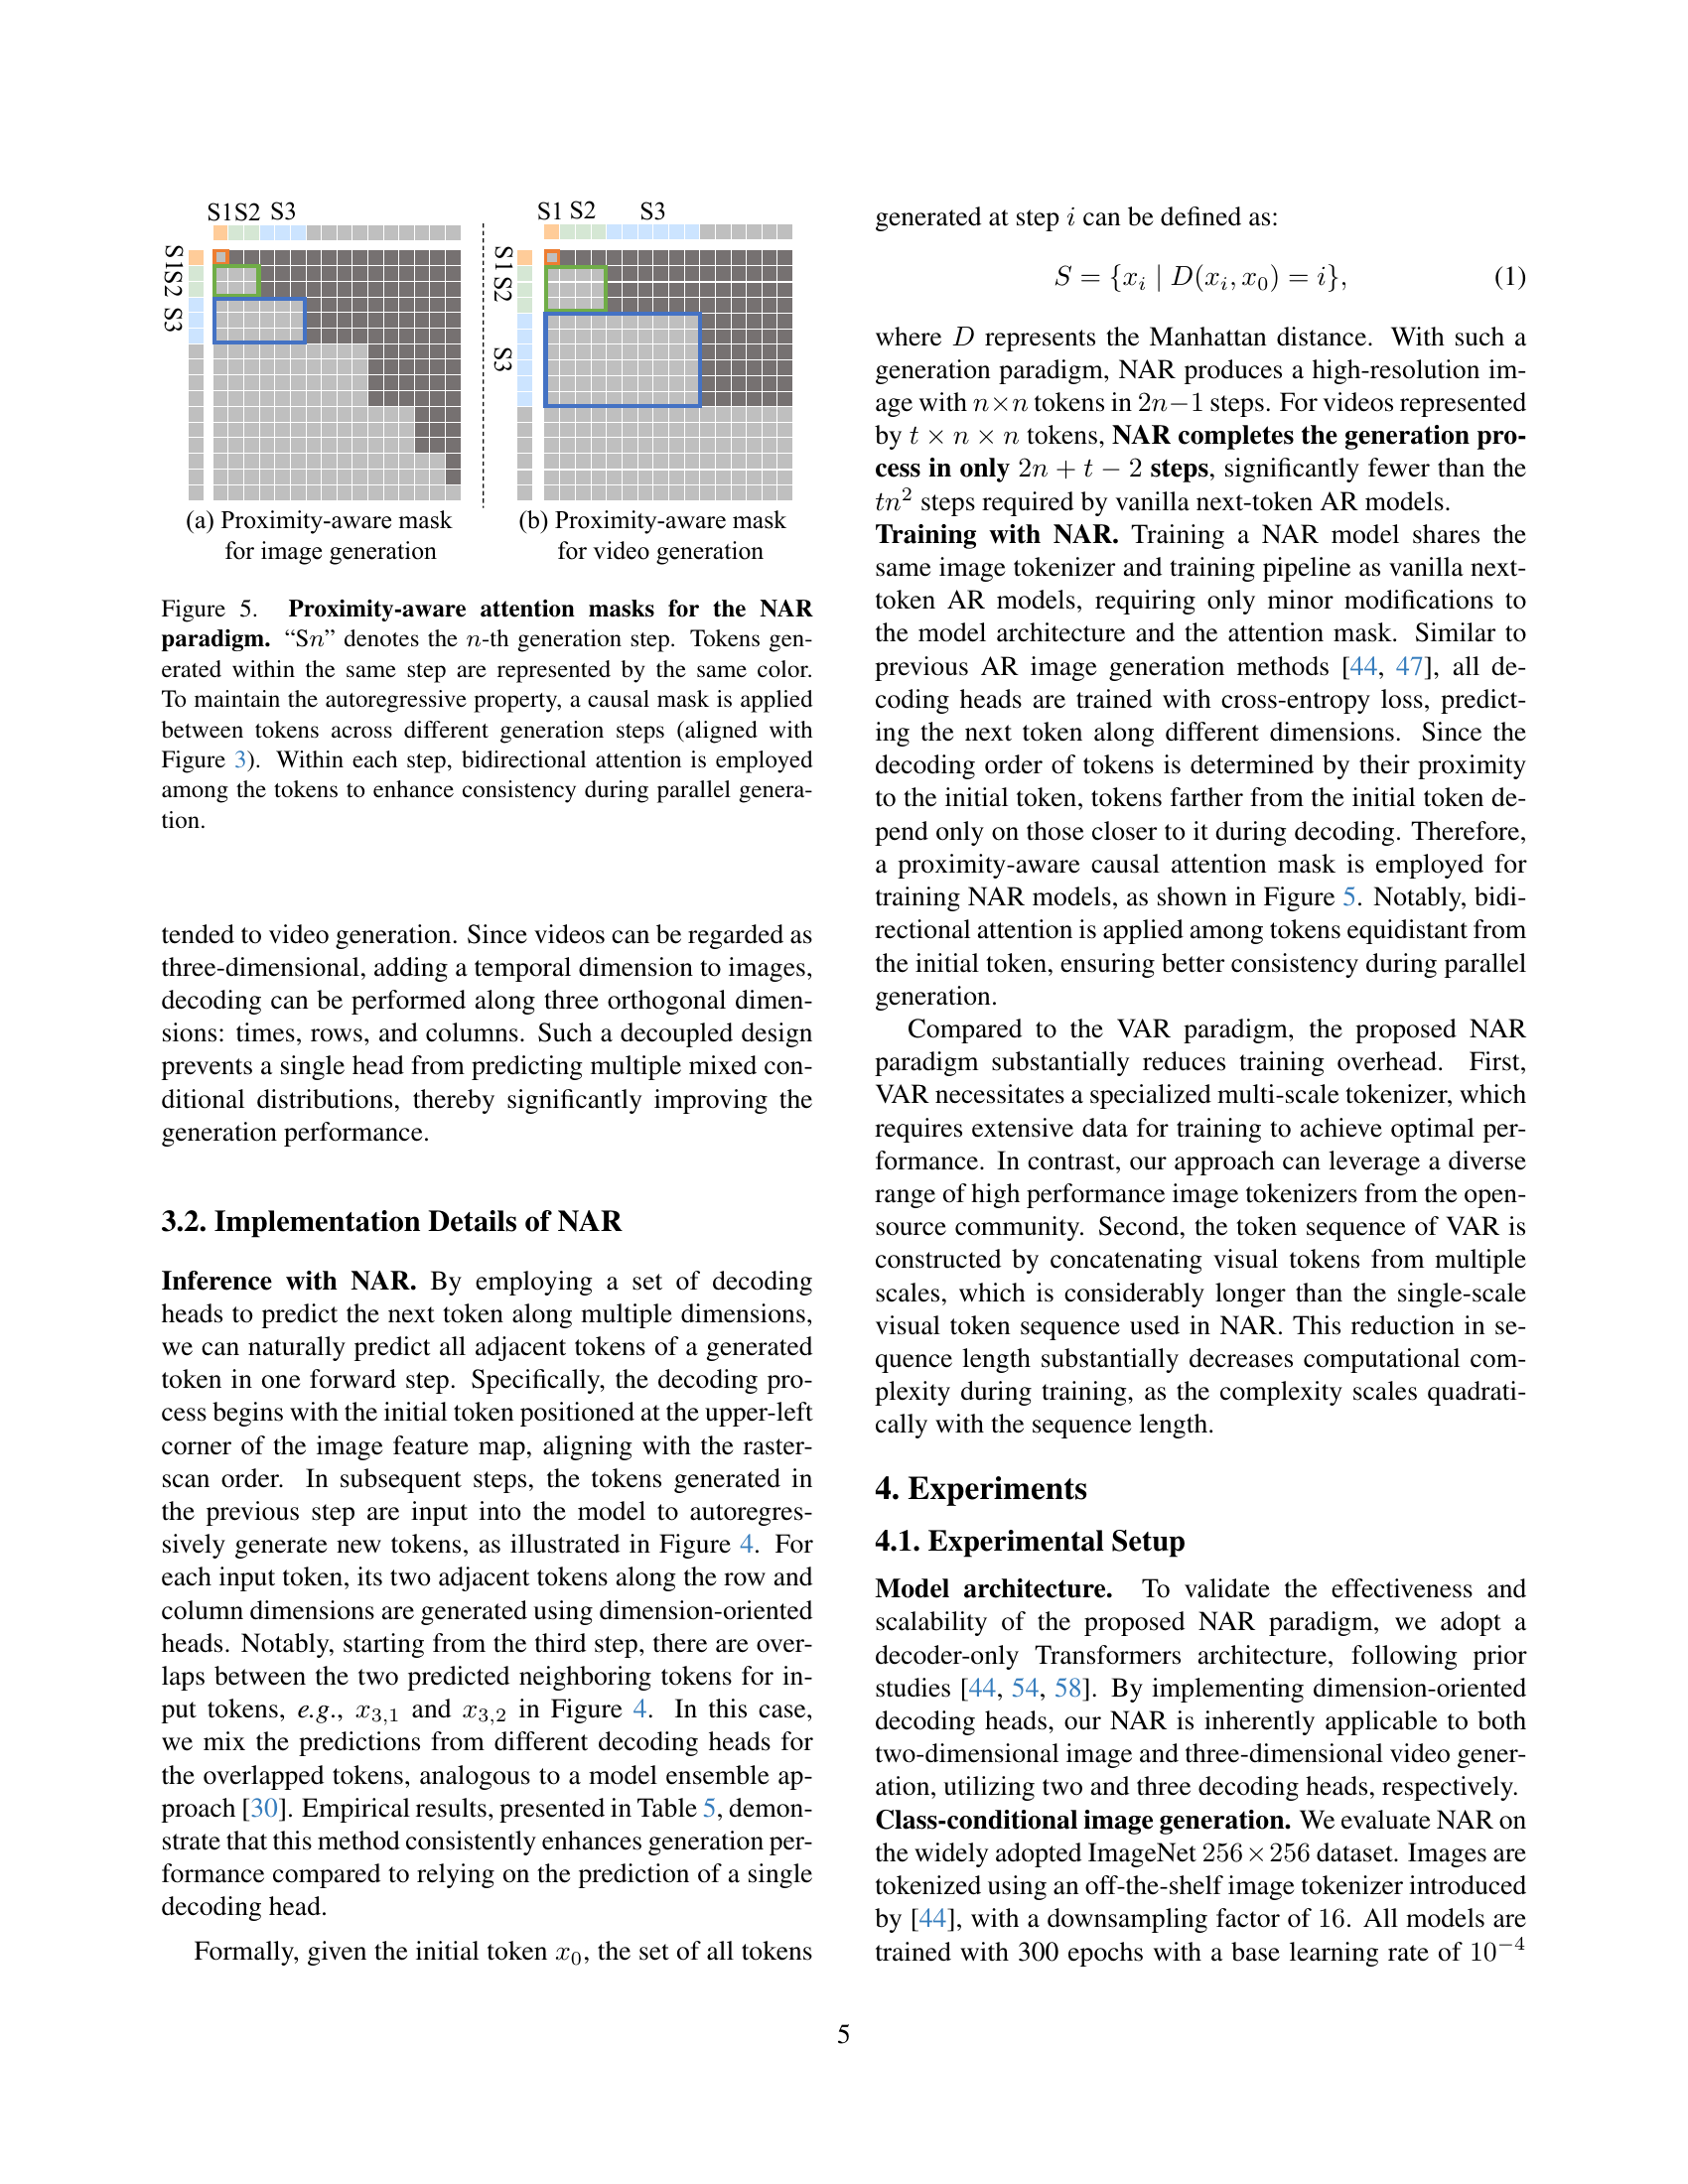
🔼 This figure illustrates the attention masks used in the Neighboring Autoregressive Modeling (NAR) framework. It highlights how the model handles spatial relationships between image tokens during parallel generation. The different colors represent tokens generated simultaneously in the same step, demonstrating the parallel aspect of NAR. The causal masking ensures the autoregressive property of the model, preventing future tokens from influencing the generation of past tokens. Bidirectional attention within each step fosters consistency by allowing tokens within the same generation step to interact with each other, regardless of their position relative to the starting point.
read the caption
Figure 5: Proximity-aware attention masks for the NAR paradigm. “Sn𝑛nitalic_n” denotes the n𝑛nitalic_n-th generation step. Tokens generated within the same step are represented by the same color. To maintain the autoregressive property, a causal mask is applied between tokens across different generation steps (aligned with Figure 3). Within each step, bidirectional attention is employed among the tokens to enhance consistency during parallel generation.
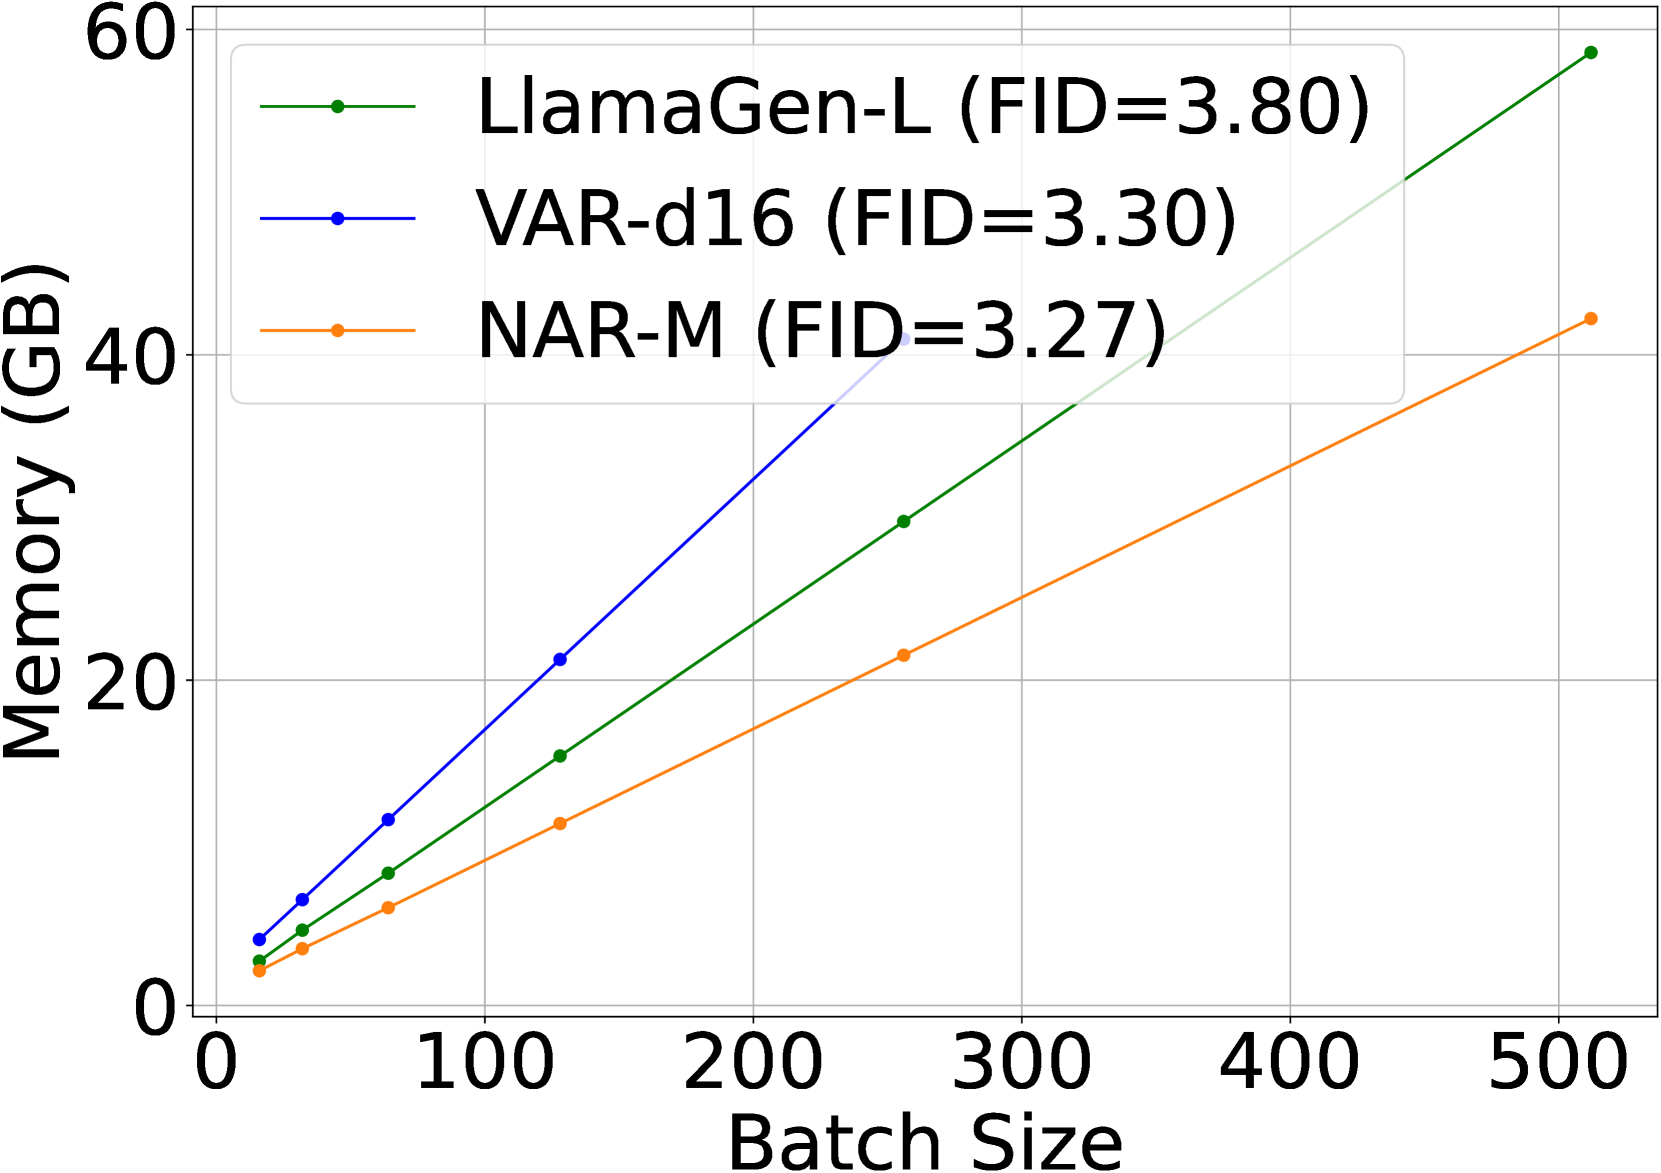
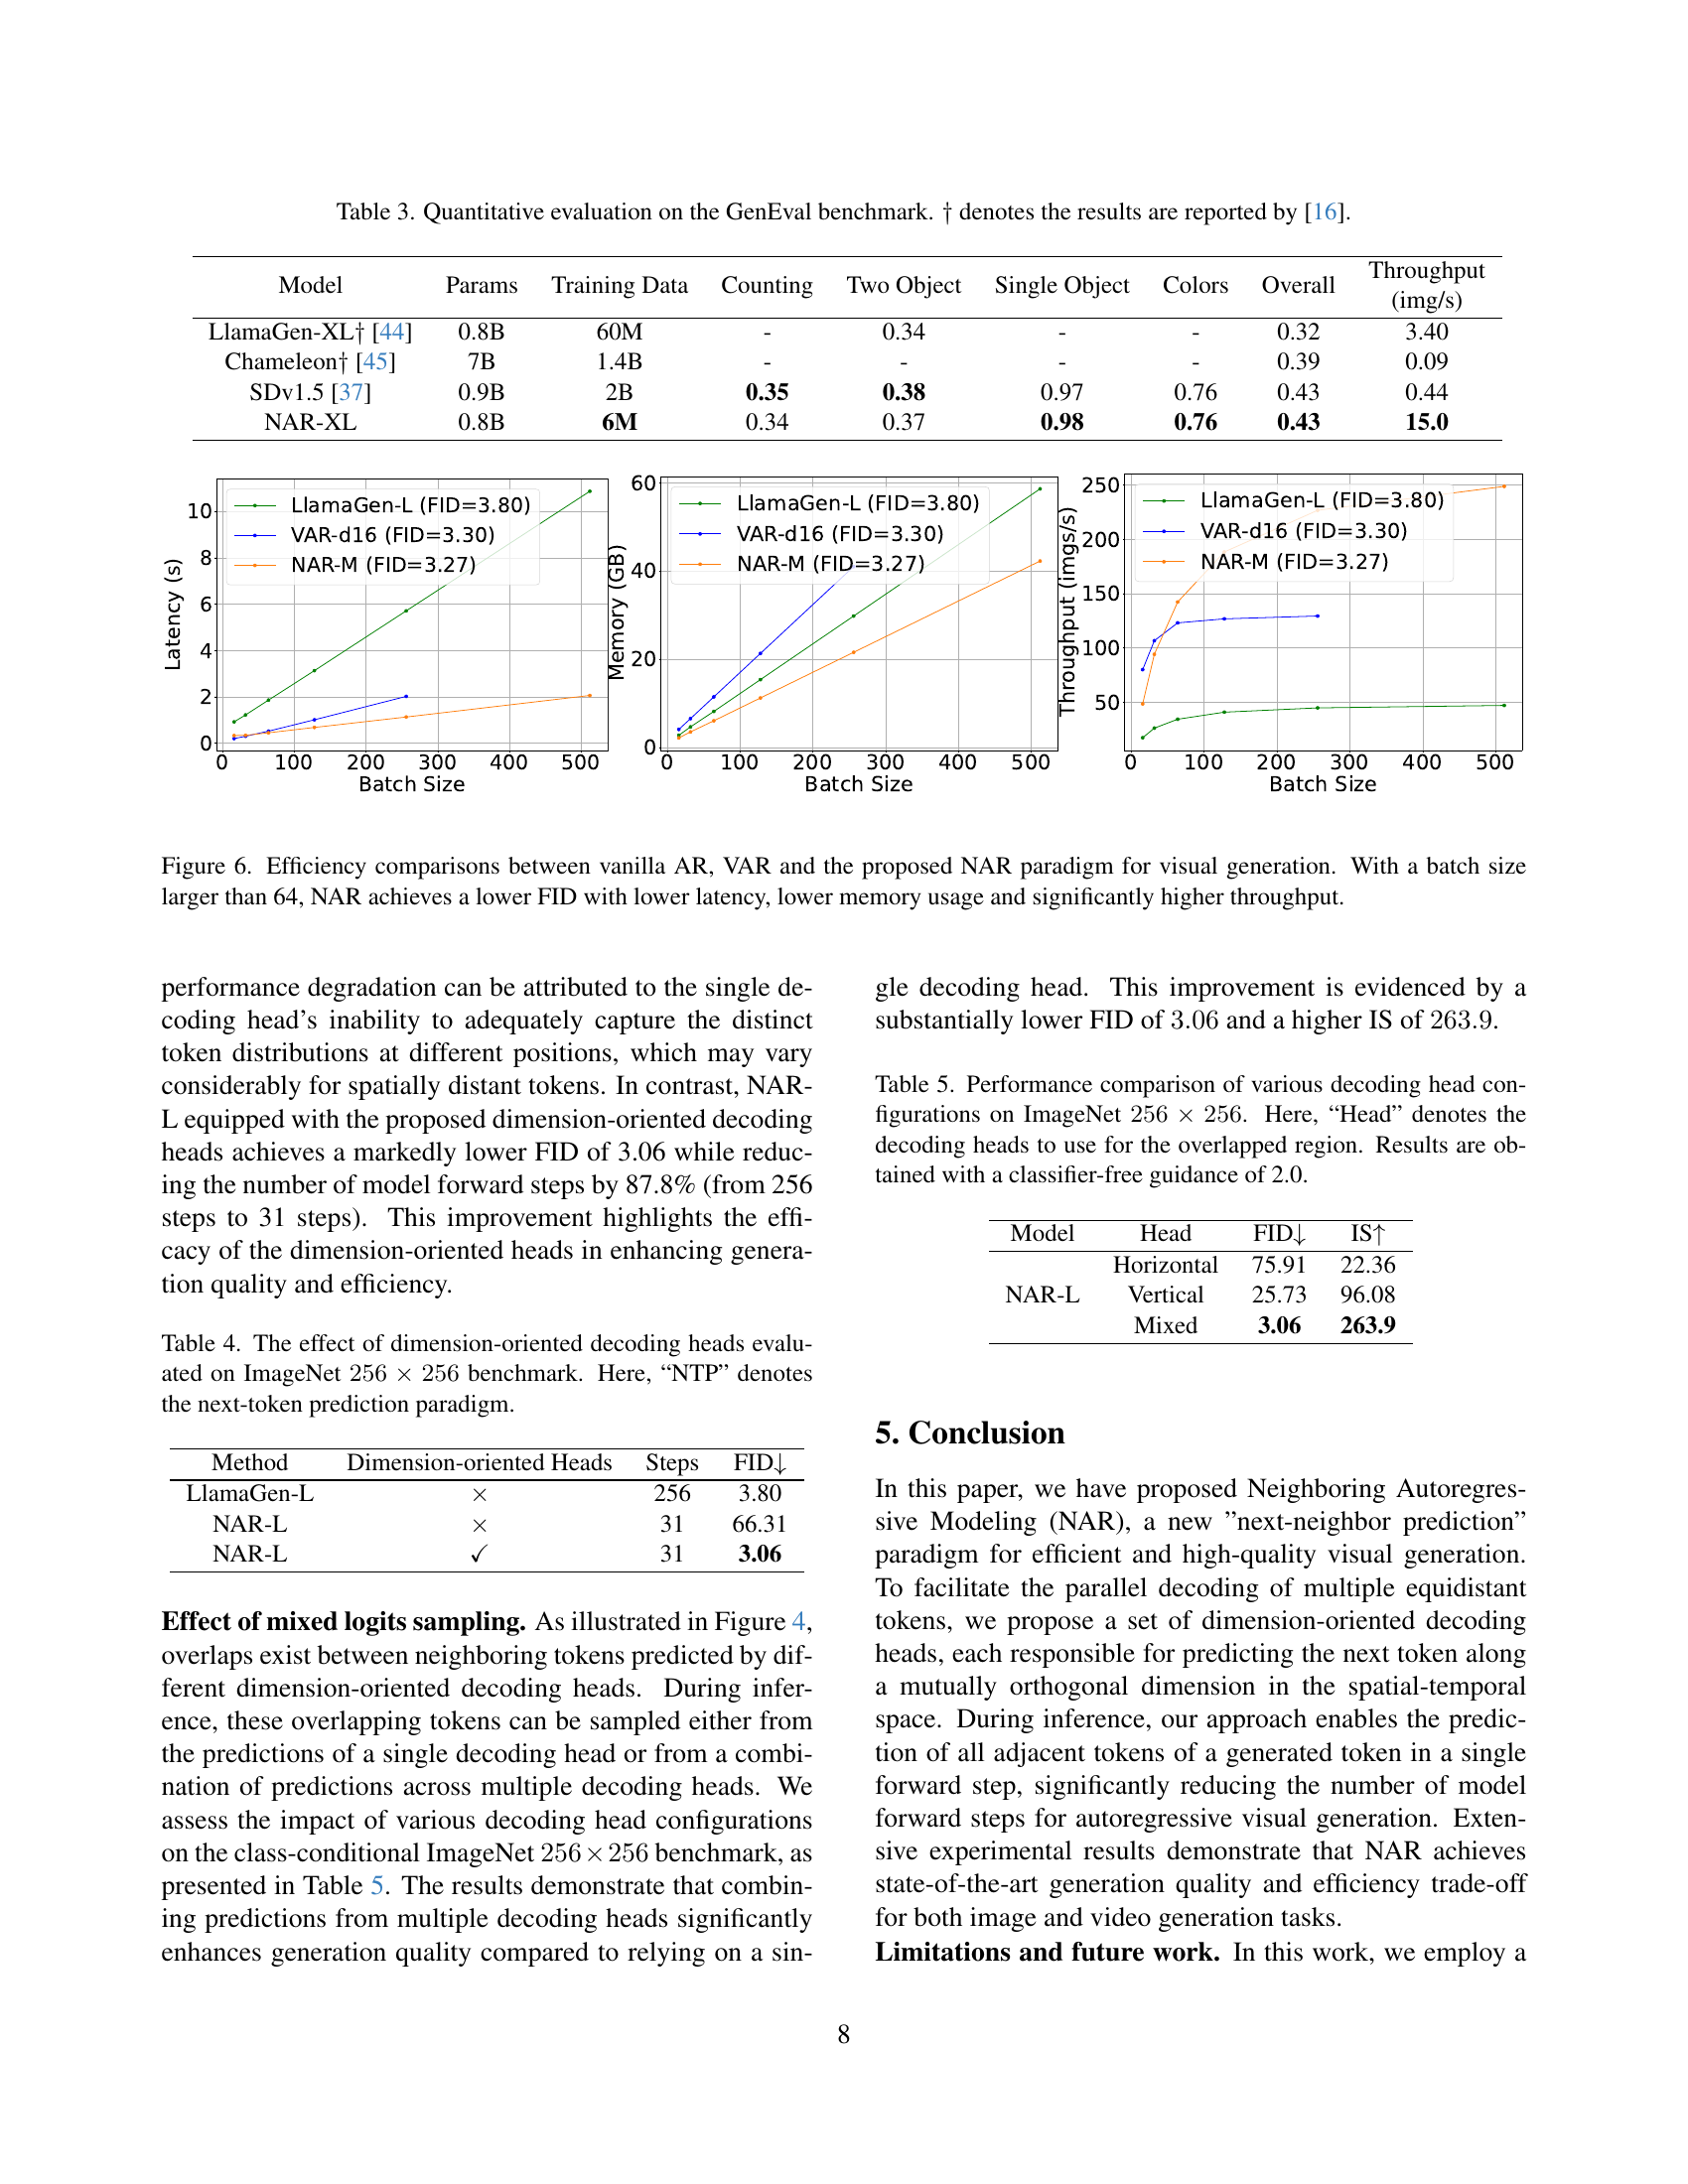
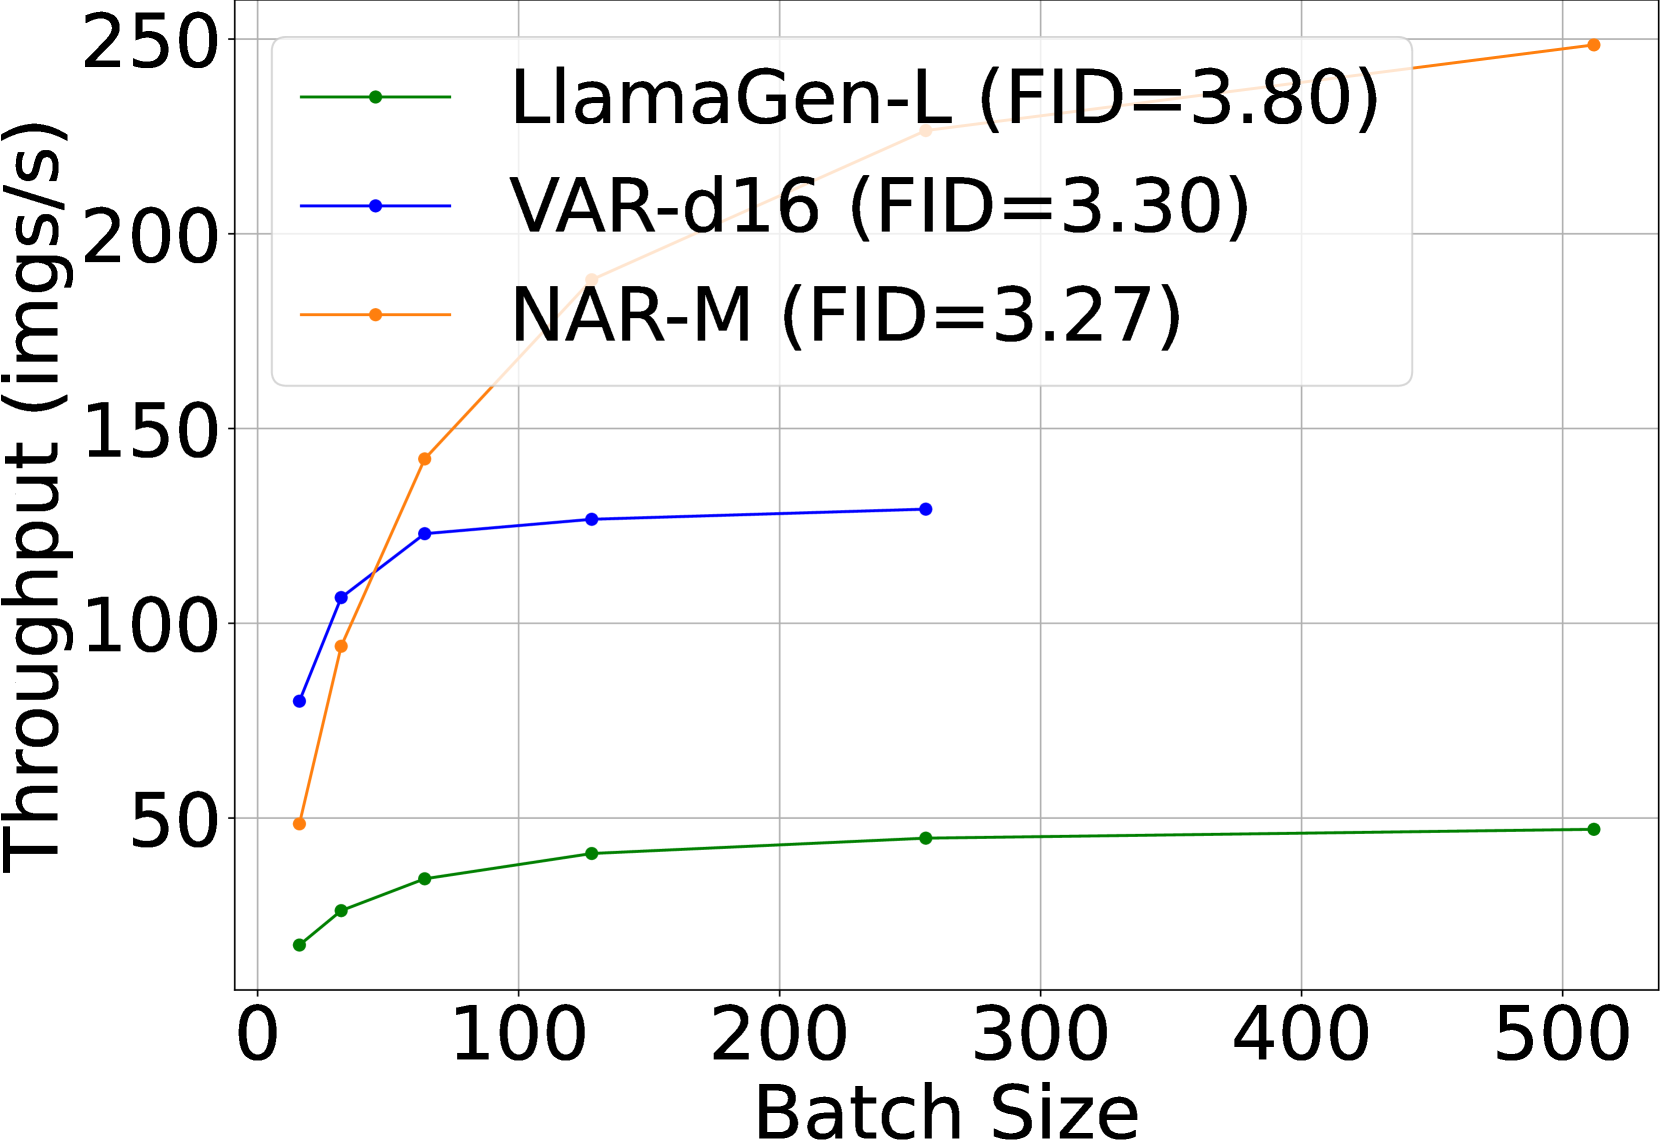
🔼 Figure 6 presents a comparison of the efficiency of three different autoregressive image generation methods: vanilla AR, VAR, and the proposed NAR. The comparison is shown across three metrics: latency (the time it takes to generate an image), GPU memory usage, and throughput (images generated per second). For batch sizes exceeding 64, NAR demonstrates superior performance, achieving a lower FID (Fréchet Inception Distance, a measure of image quality), reduced latency, lower memory consumption, and substantially increased throughput. This indicates that NAR offers a more efficient and effective approach to autoregressive image generation, especially when dealing with larger batch sizes.
read the caption
Figure 6: Efficiency comparisons between vanilla AR, VAR and the proposed NAR paradigm for visual generation. With a batch size larger than 64, NAR achieves a lower FID with lower latency, lower memory usage and significantly higher throughput.
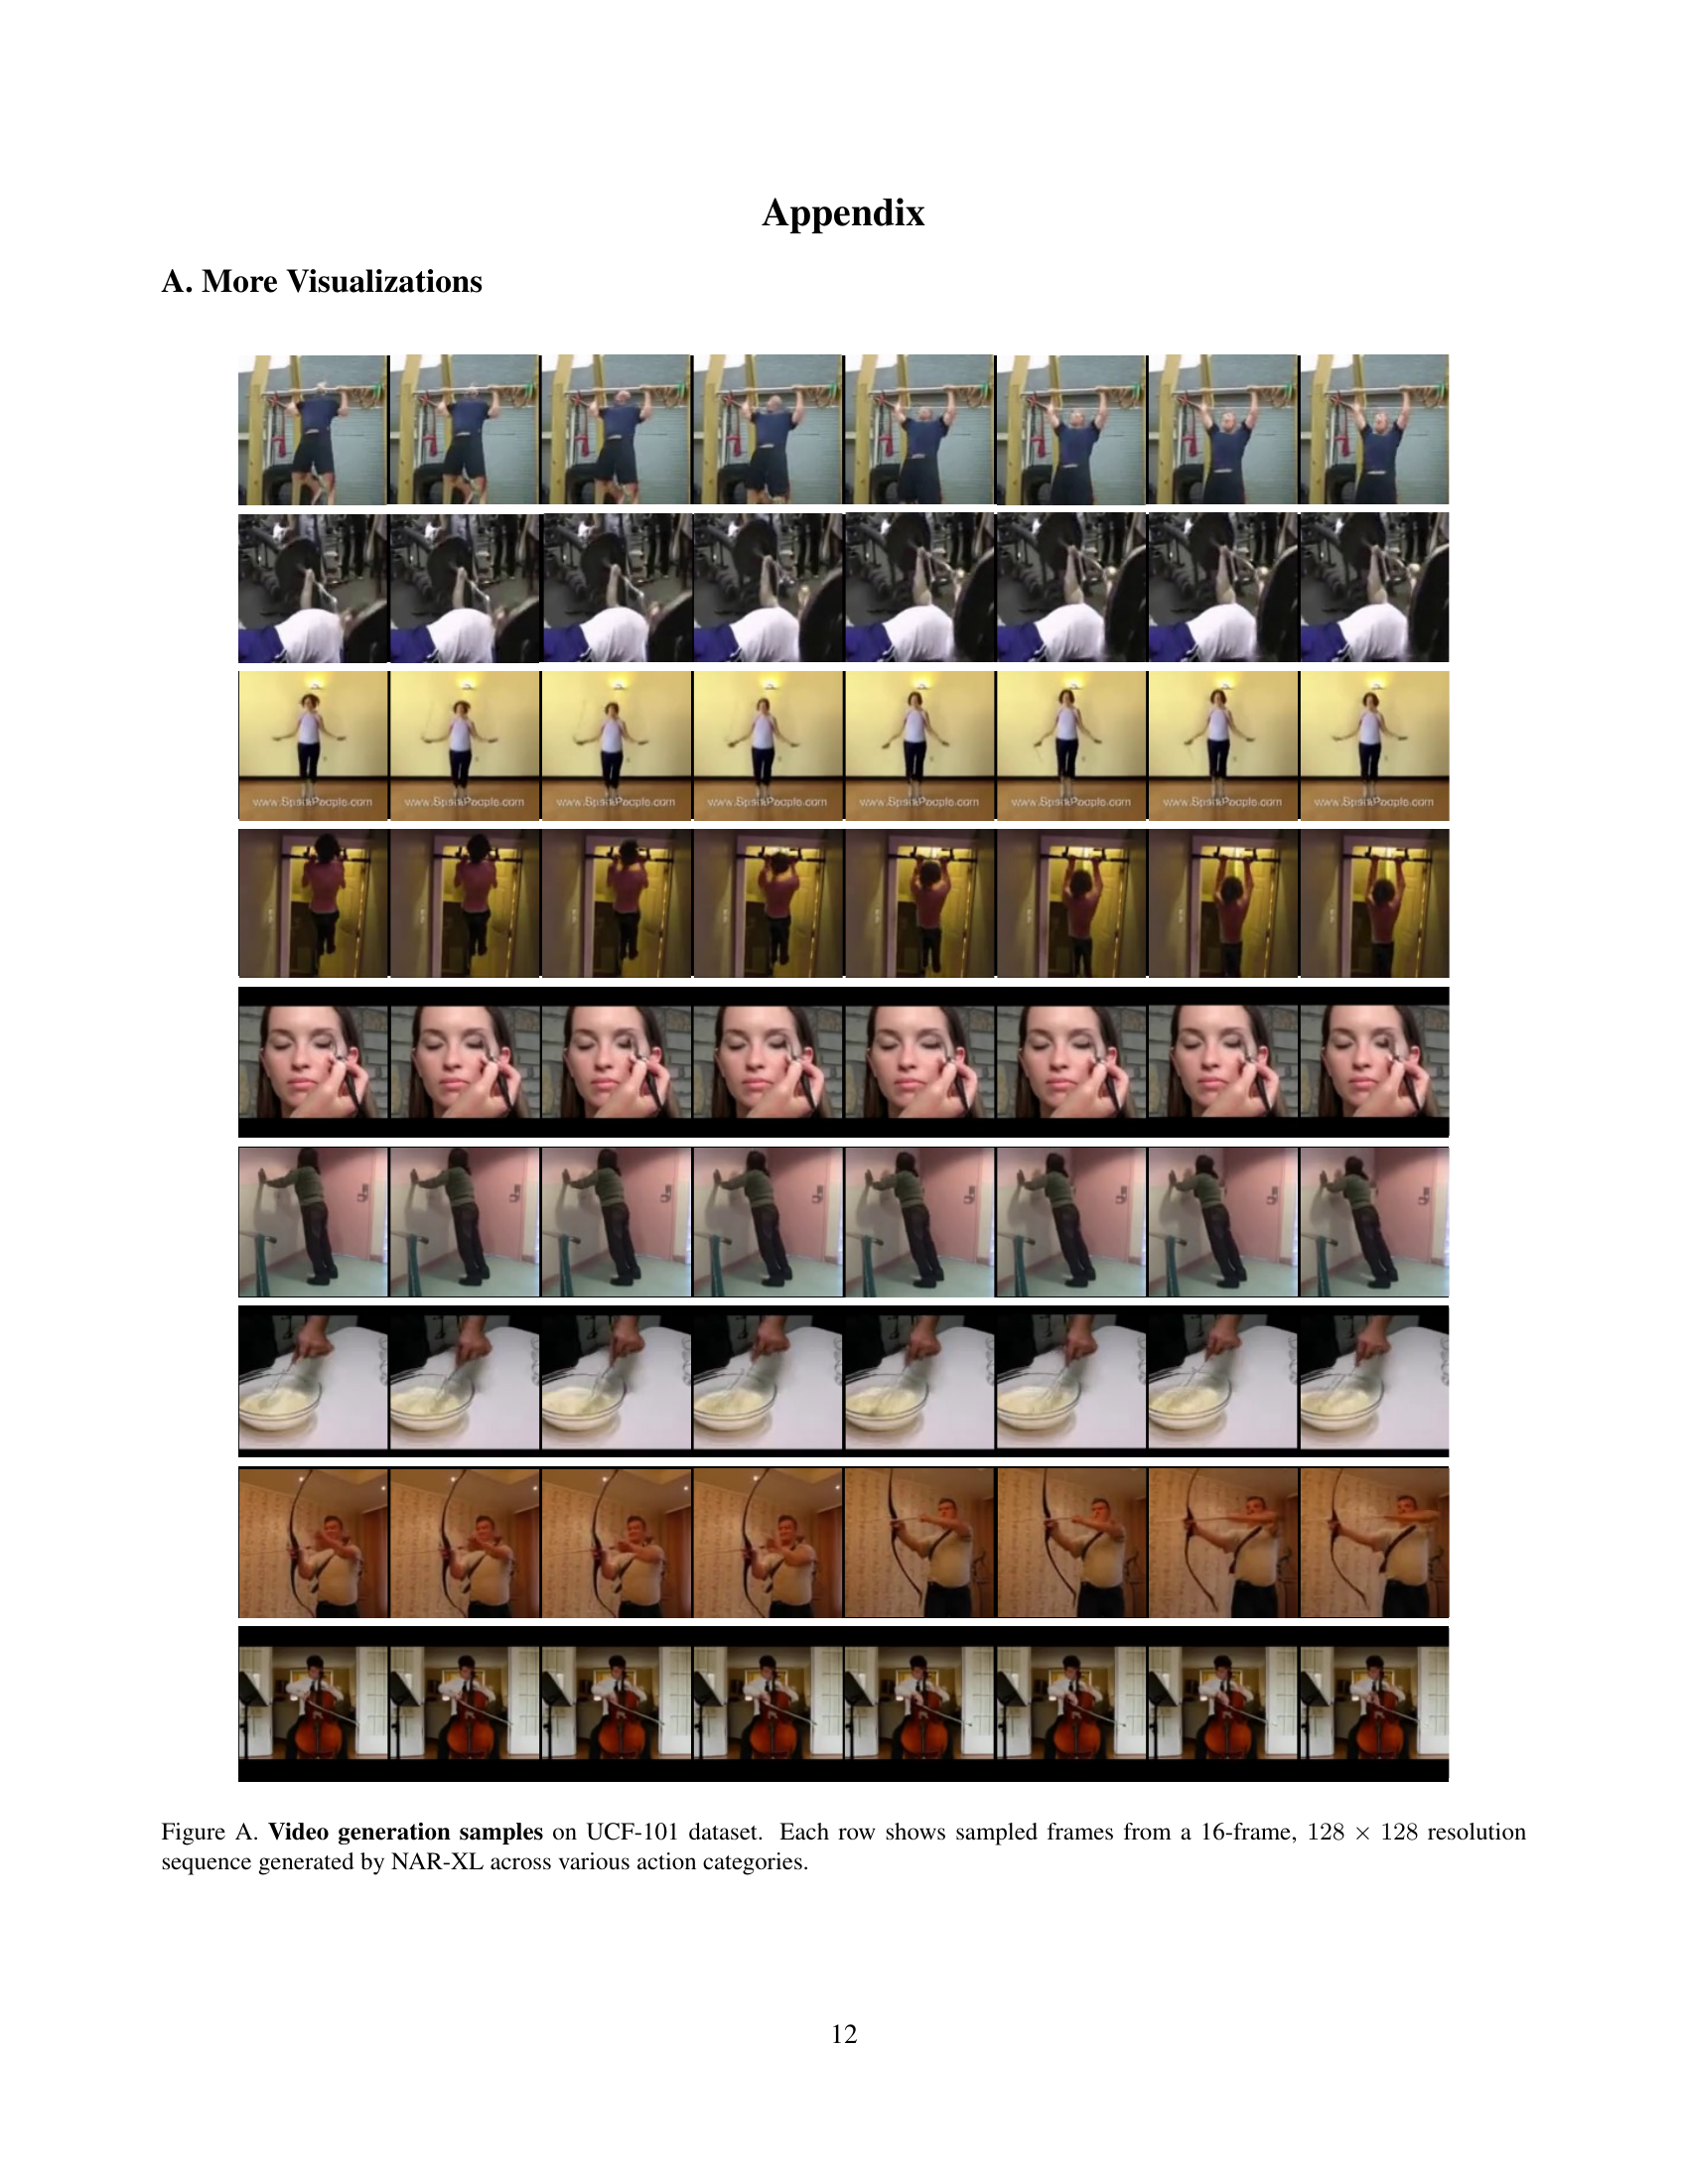
🔼 This figure visualizes video generation results from the NAR-XL model on the UCF-101 dataset. Each row presents a sequence of 16 frames from a short video, each frame sized at 128x128 pixels. The videos represent diverse action categories, showcasing the model’s ability to generate coherent and visually consistent videos across different actions.
read the caption
Figure A: Video generation samples on UCF-101 dataset. Each row shows sampled frames from a 16-frame, 128×128128128128\times 128128 × 128 resolution sequence generated by NAR-XL across various action categories.

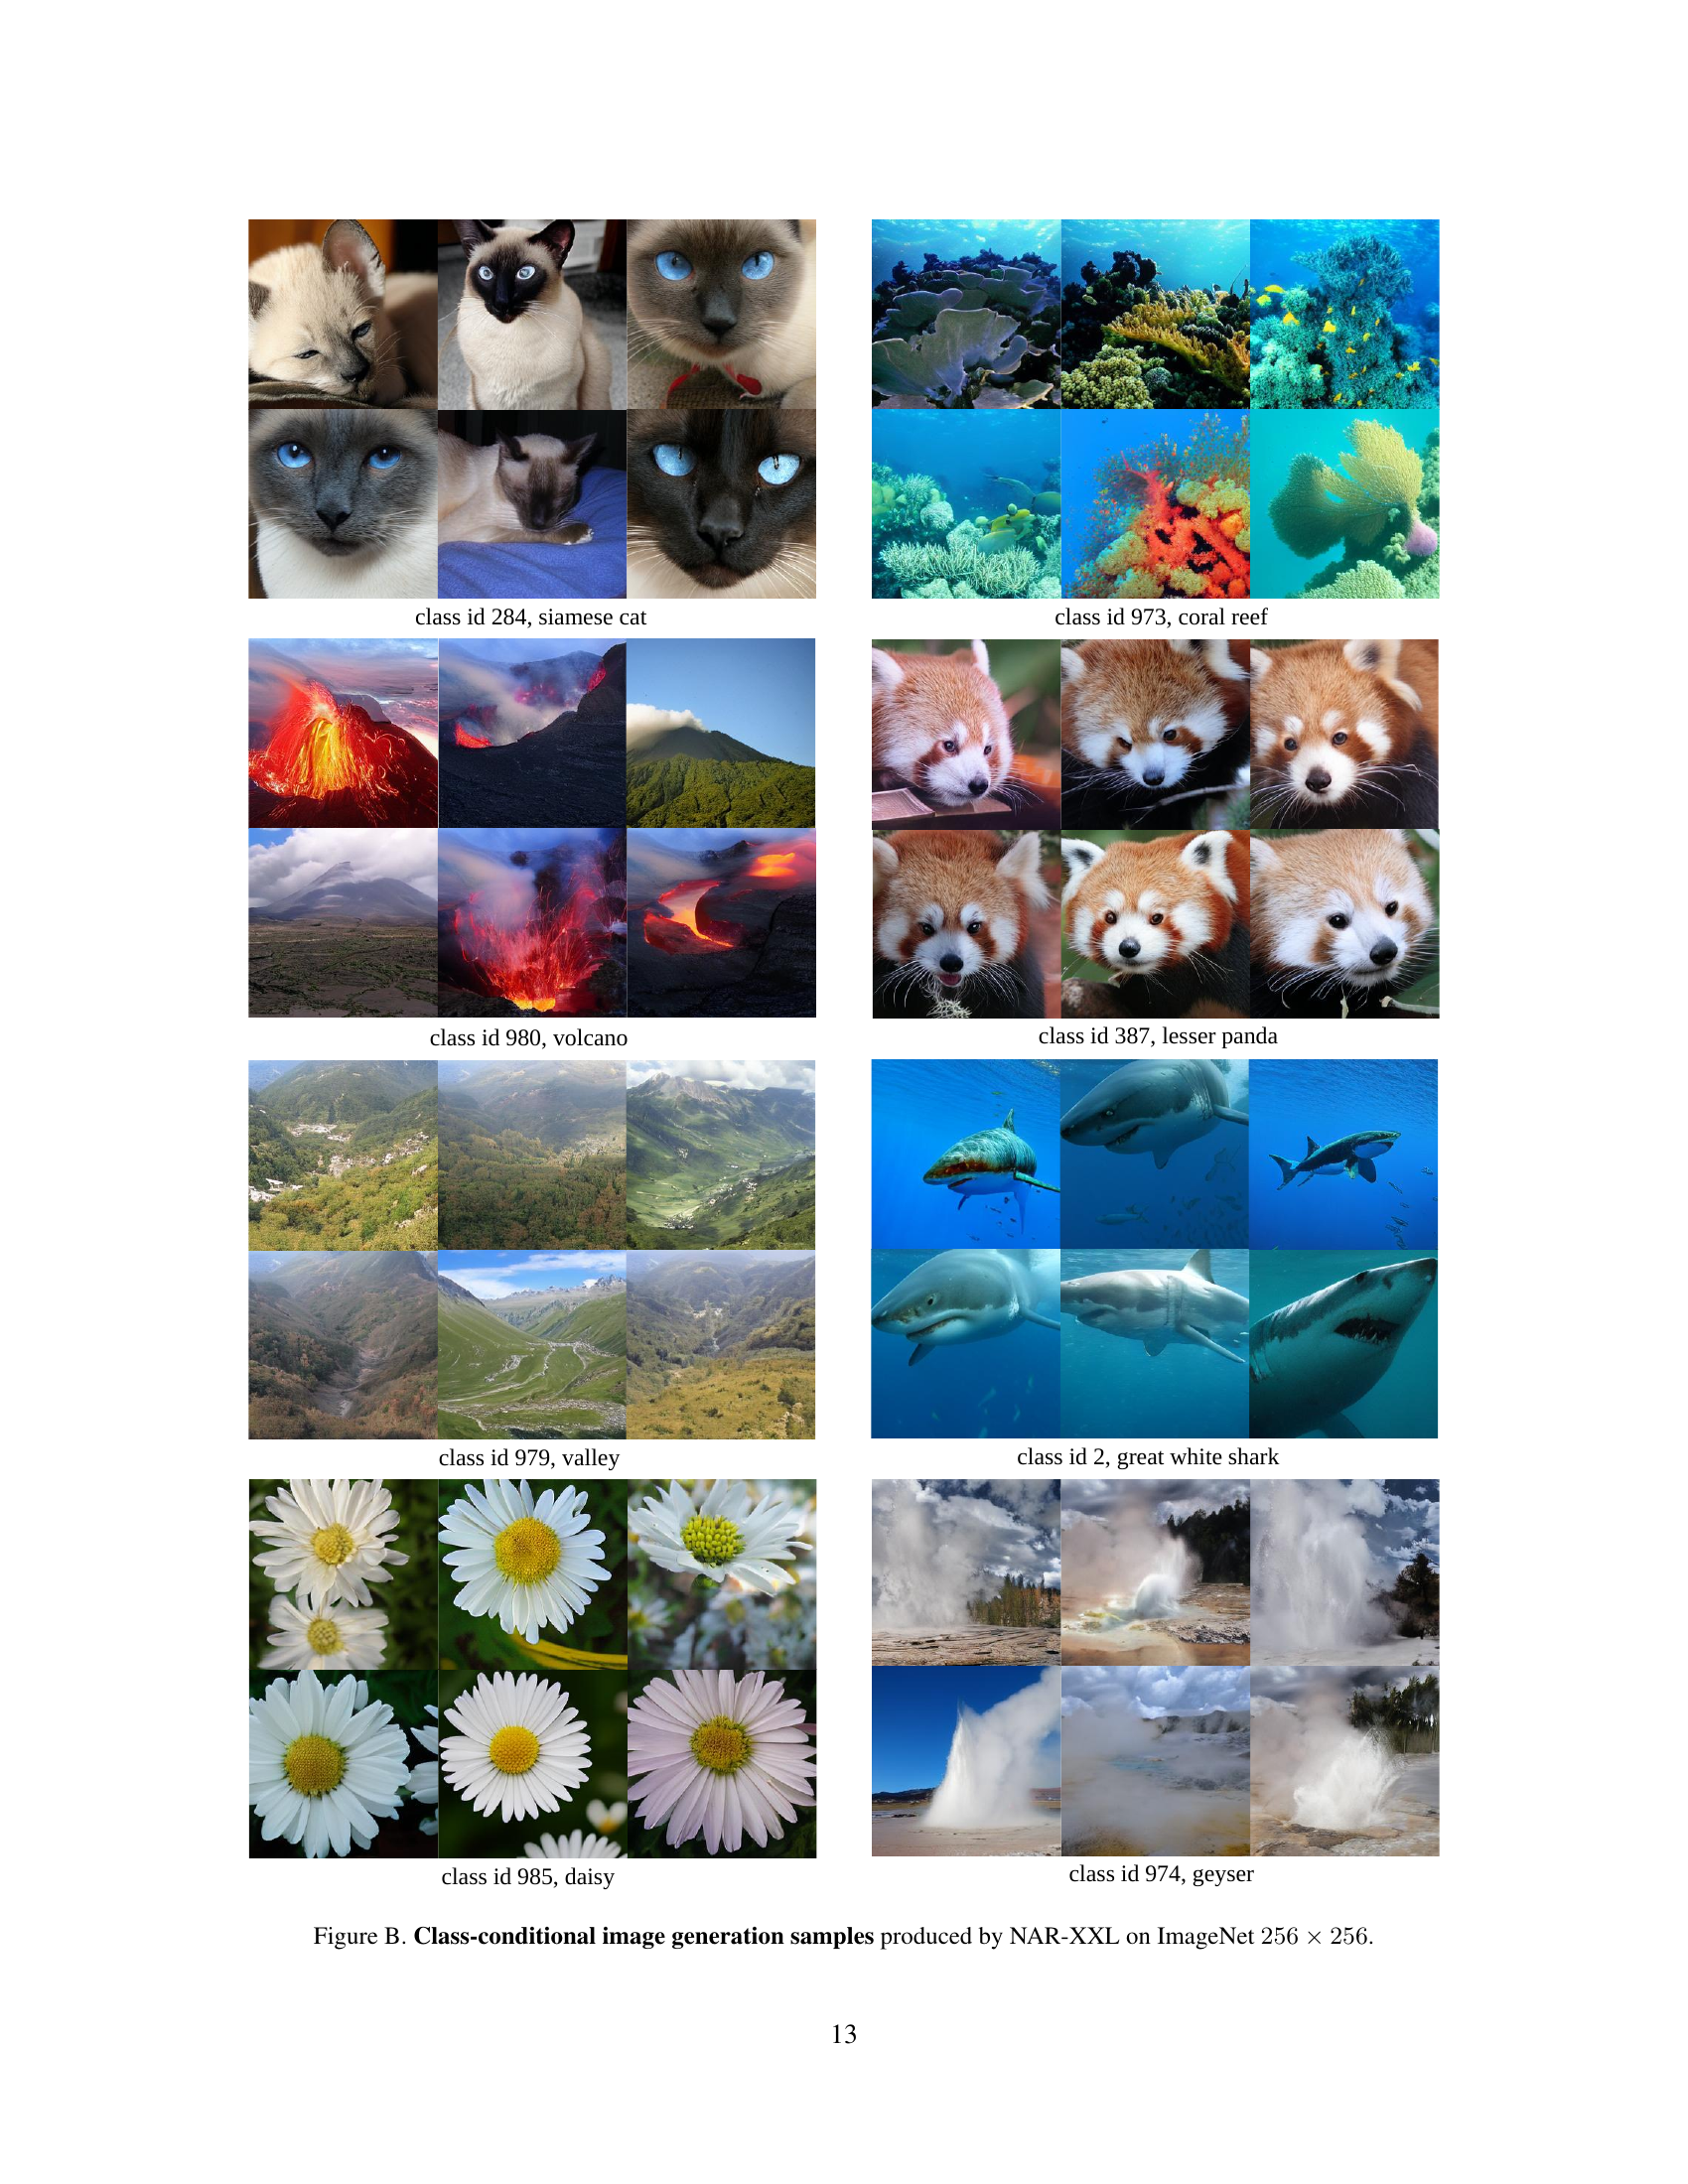
🔼 This figure shows several example images generated by the NAR-XXL model, demonstrating its ability to generate images conditioned on a class label. Each set of images shows different variations of the same object class generated from the same class label. The classes shown include siamese cat, coral reef, volcano, lesser panda, valley, great white shark, daisy, and geyser. This showcases the model’s capacity to produce visually diverse outputs belonging to the same class.
read the caption
Figure B: Class-conditional image generation samples produced by NAR-XXL on ImageNet 256×256256256256\times 256256 × 256.

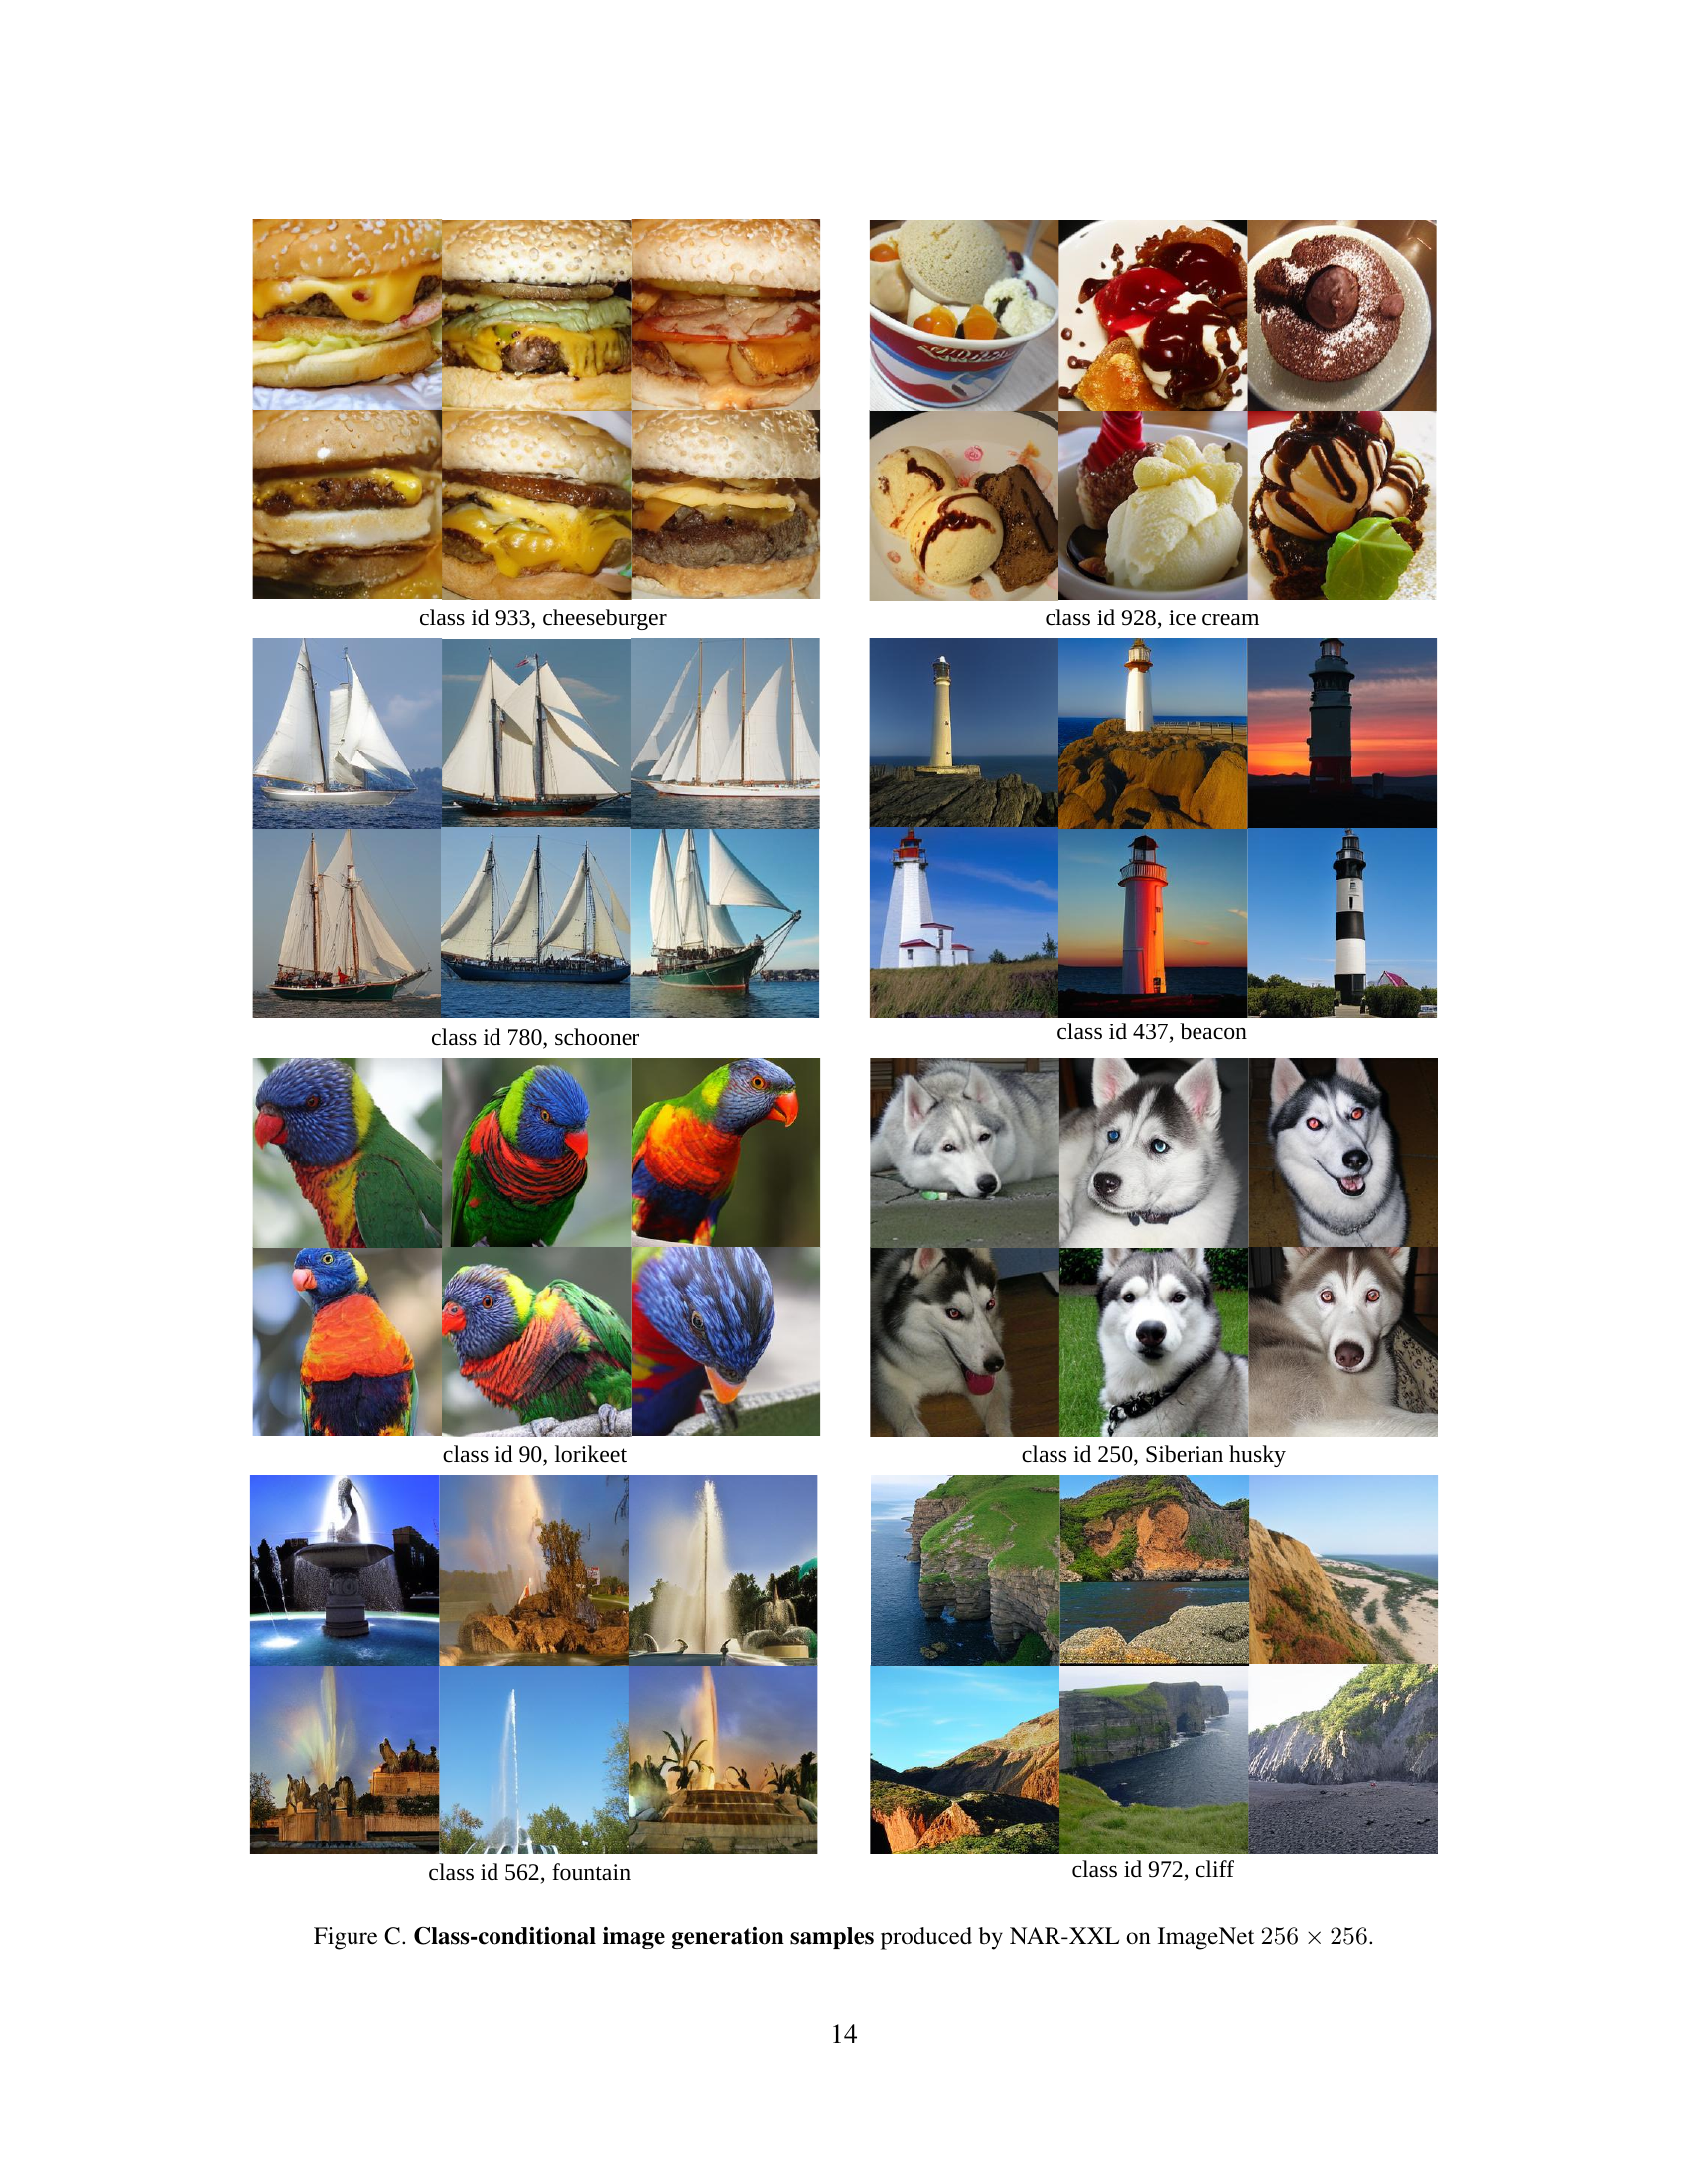
🔼 This figure showcases several examples of images generated by the NAR-XXL model (Neighboring Autoregressive Model, extra-large size). Each example demonstrates the model’s ability to generate high-quality, class-conditional images of 256x256 pixels. The images are grouped by class (e.g., cheeseburger, ice cream, schooner), showing the variety and detail within each class that the model produces.
read the caption
Figure C: Class-conditional image generation samples produced by NAR-XXL on ImageNet 256×256256256256\times 256256 × 256.

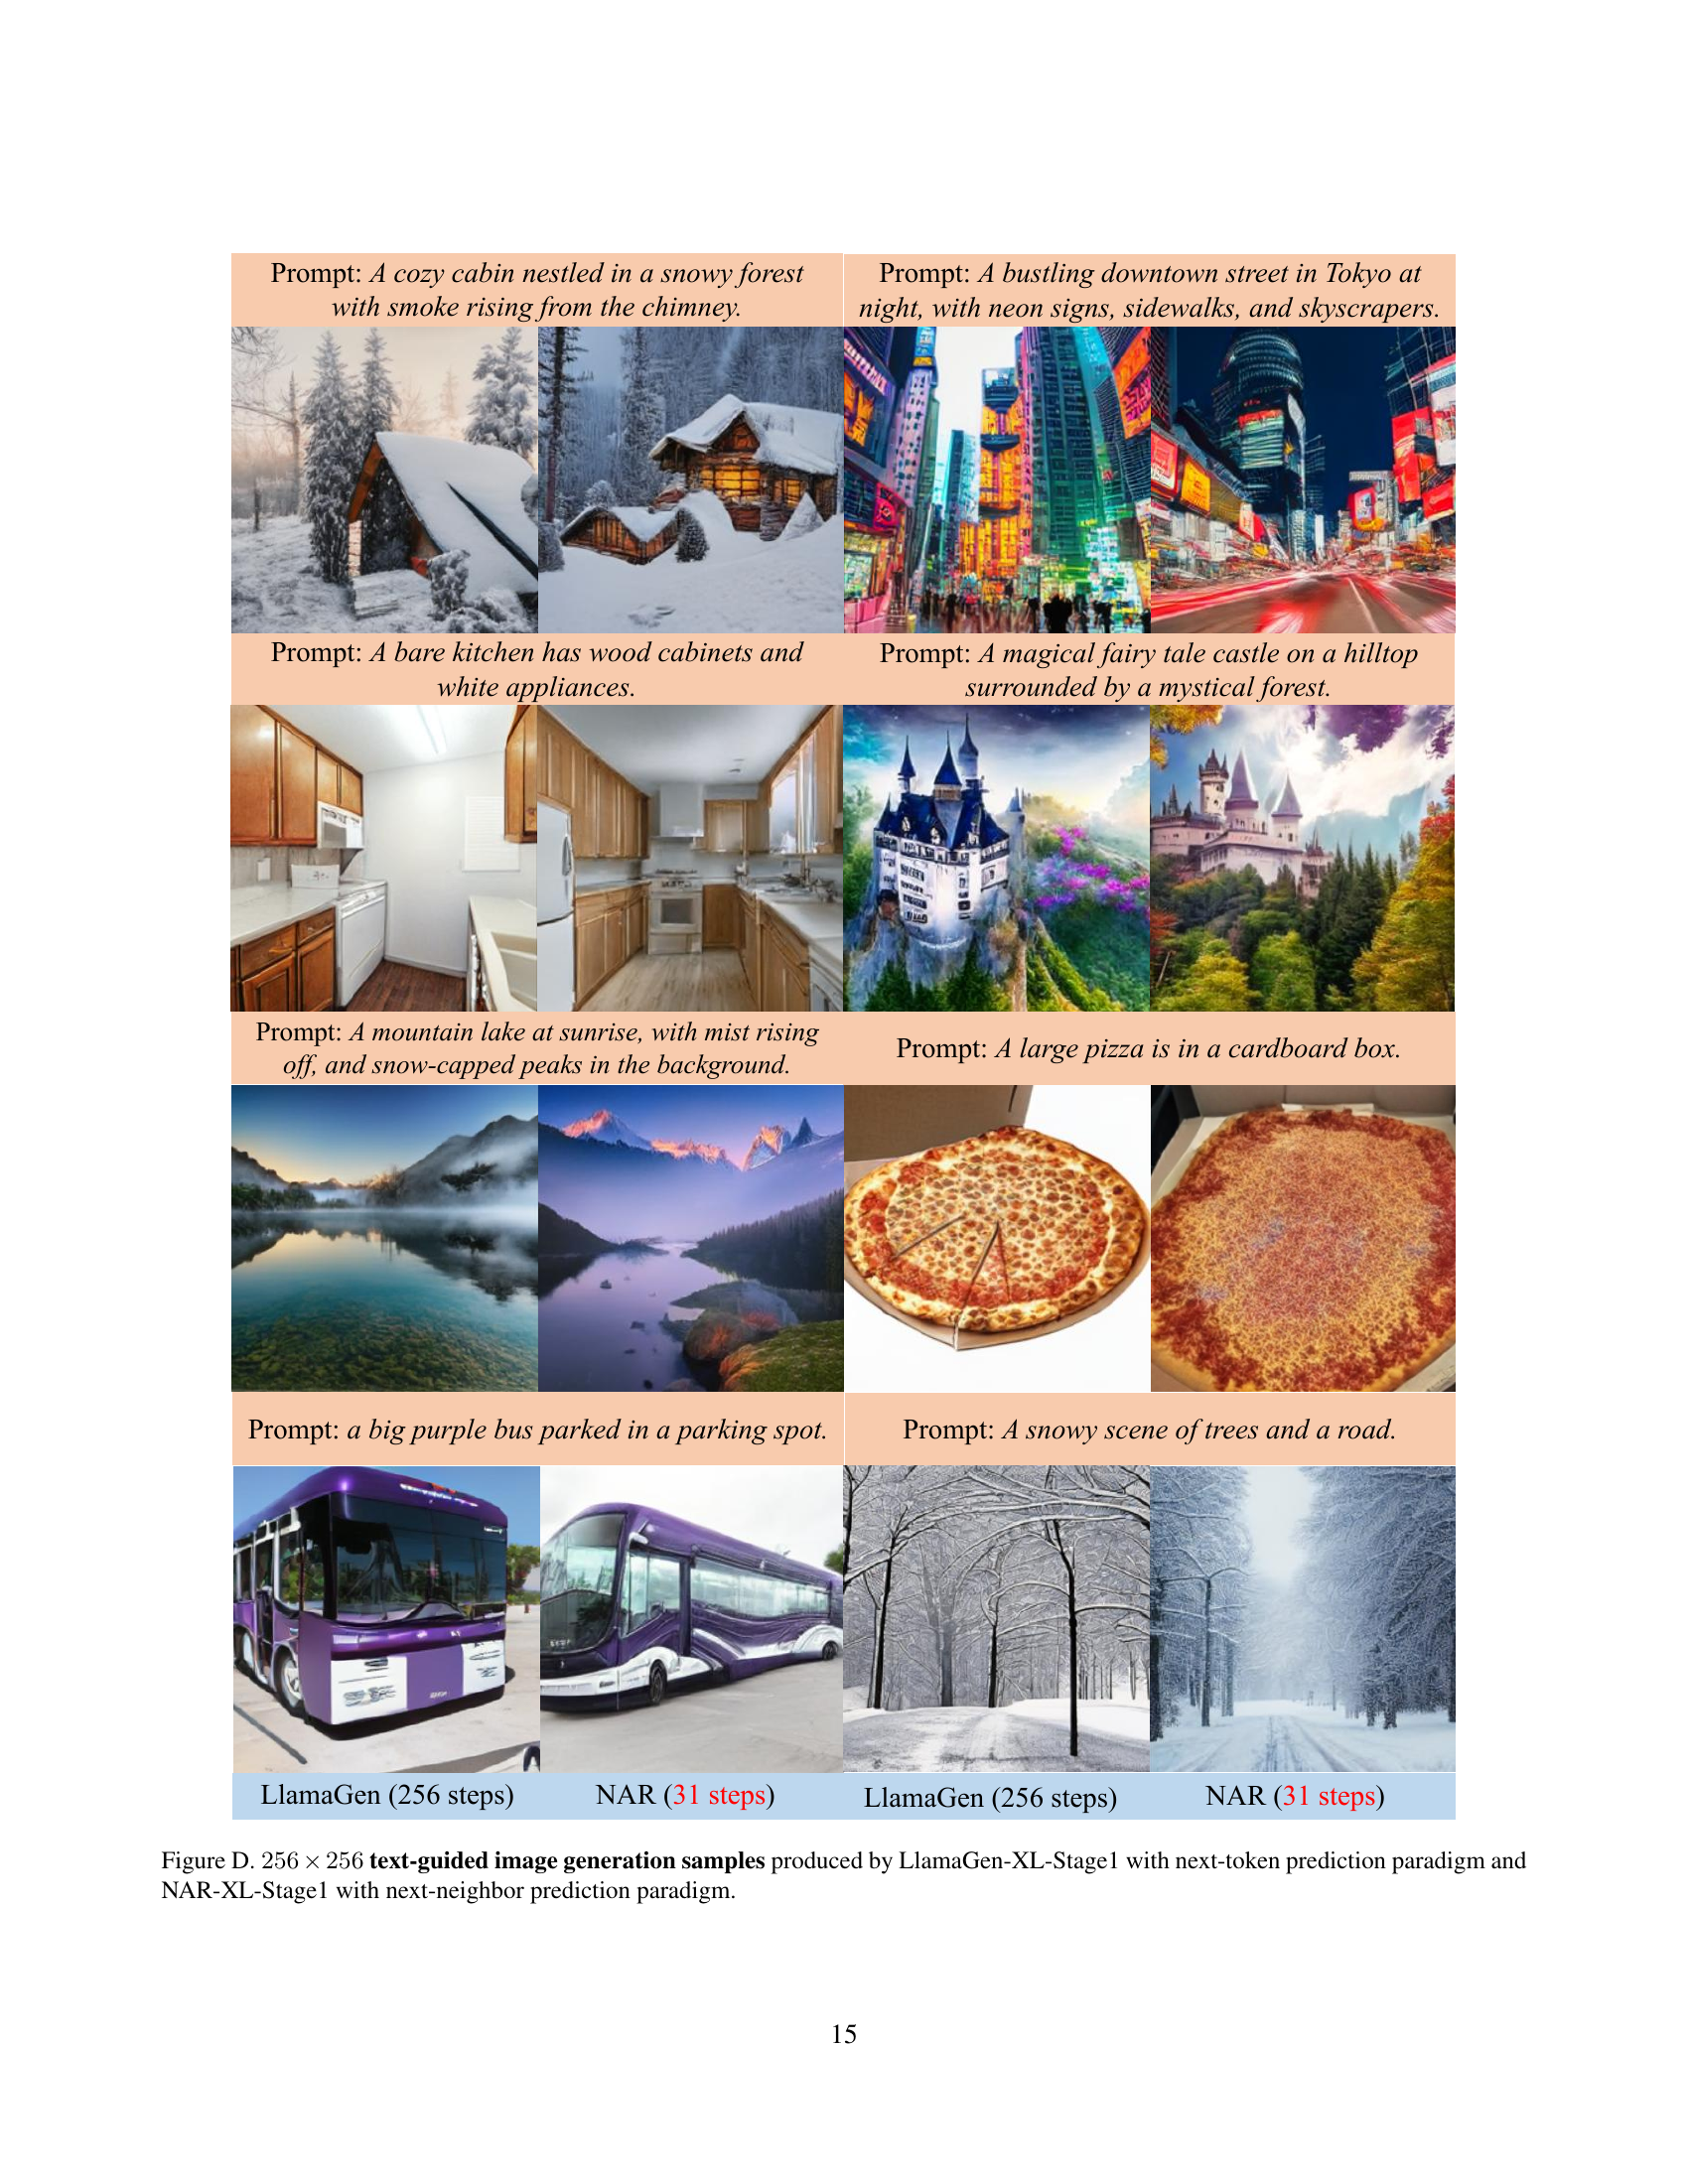
🔼 This figure displays a comparison of image generation results between two models: LlamaGen-XL-Stage1 and NAR-XL-Stage1. Both models generated 256x256 pixel images based on text prompts, but they employed different generation methods. LlamaGen-XL-Stage1 utilizes the standard ’next-token’ prediction approach, sequentially predicting each pixel one by one. In contrast, NAR-XL-Stage1 employs a more efficient ’next-neighbor’ prediction approach, which allows parallel processing and reduces the number of steps needed for generation. The figure visually showcases the differences in image quality and generation efficiency between these two methods.
read the caption
Figure D: 256×256256256256\times 256256 × 256 text-guided image generation samples produced by LlamaGen-XL-Stage1 with next-token prediction paradigm and NAR-XL-Stage1 with next-neighbor prediction paradigm.

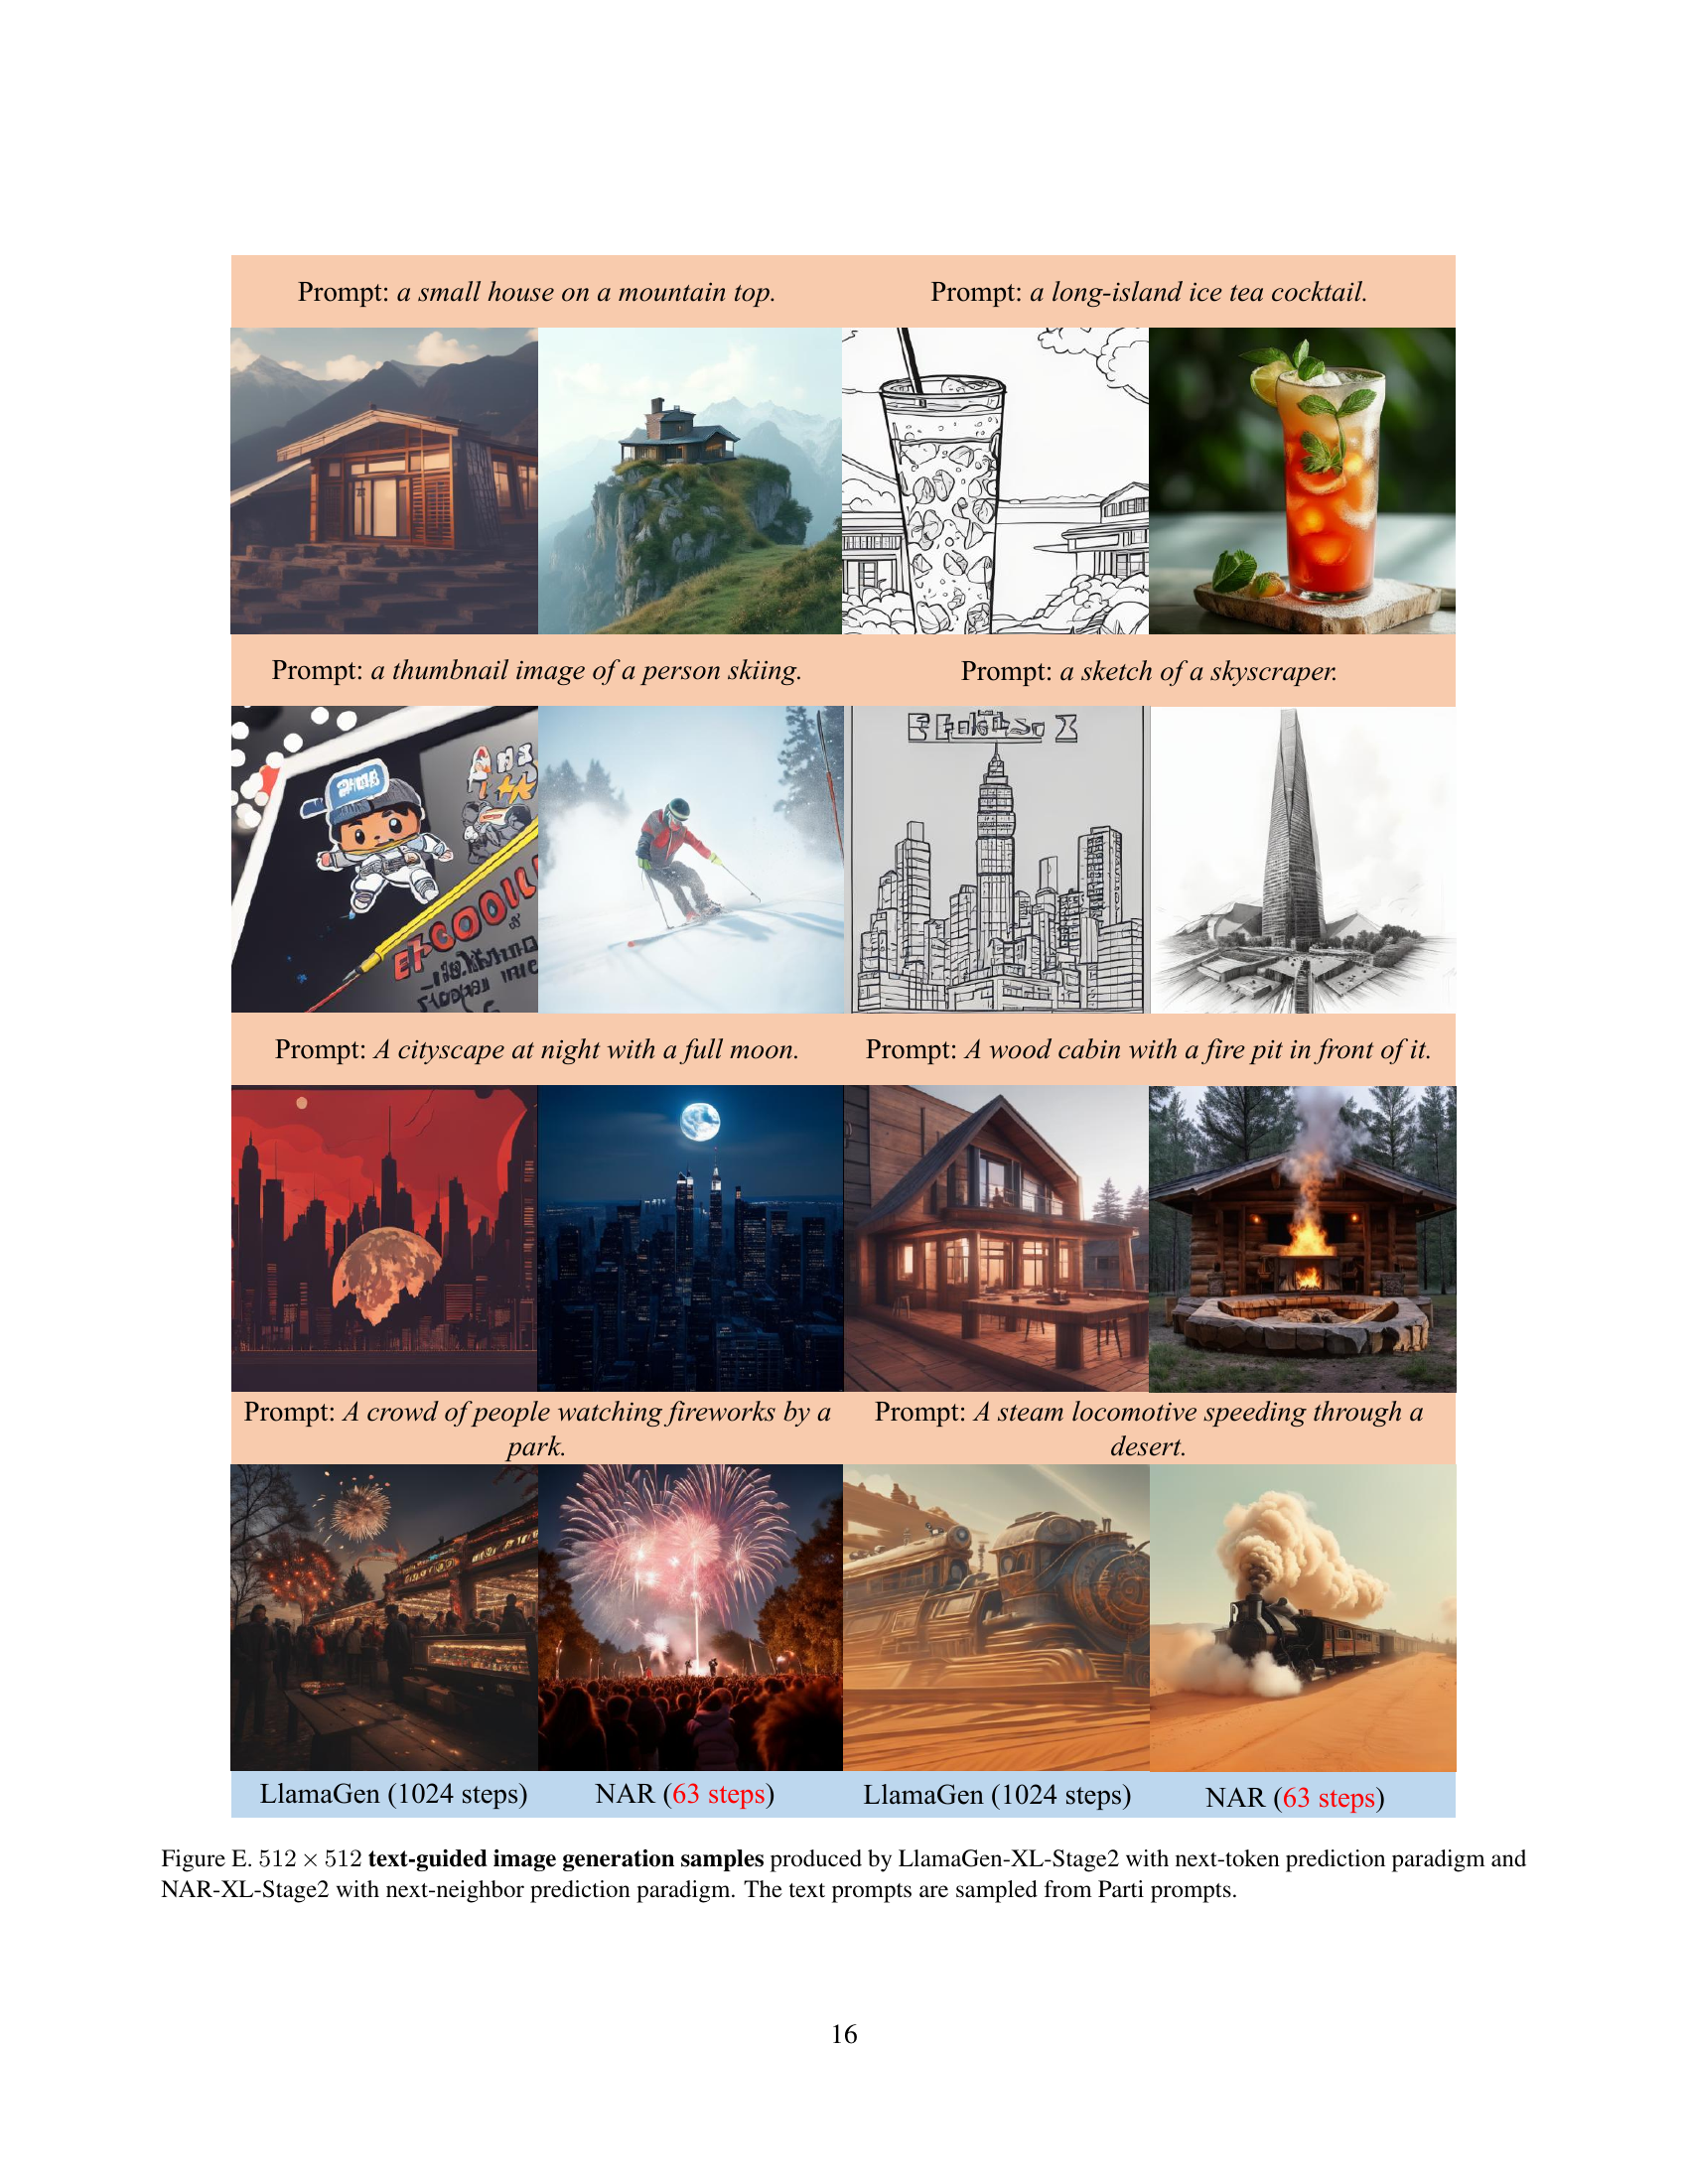
🔼 Figure E shows a comparison of image generation results between LlamaGen-XL-Stage2 (a model using the traditional next-token prediction approach) and NAR-XL-Stage2 (a model utilizing the novel next-neighbor prediction paradigm proposed in the paper). Both models were tasked with generating 512x512 pixel images based on text prompts sourced from the Parti dataset. The figure visually demonstrates the differences in image quality and the efficiency of the two methods.
read the caption
Figure E: 512×512512512512\times 512512 × 512 text-guided image generation samples produced by LlamaGen-XL-Stage2 with next-token prediction paradigm and NAR-XL-Stage2 with next-neighbor prediction paradigm. The text prompts are sampled from Parti prompts.
More on tables
| Throughput |
| (img/s) |
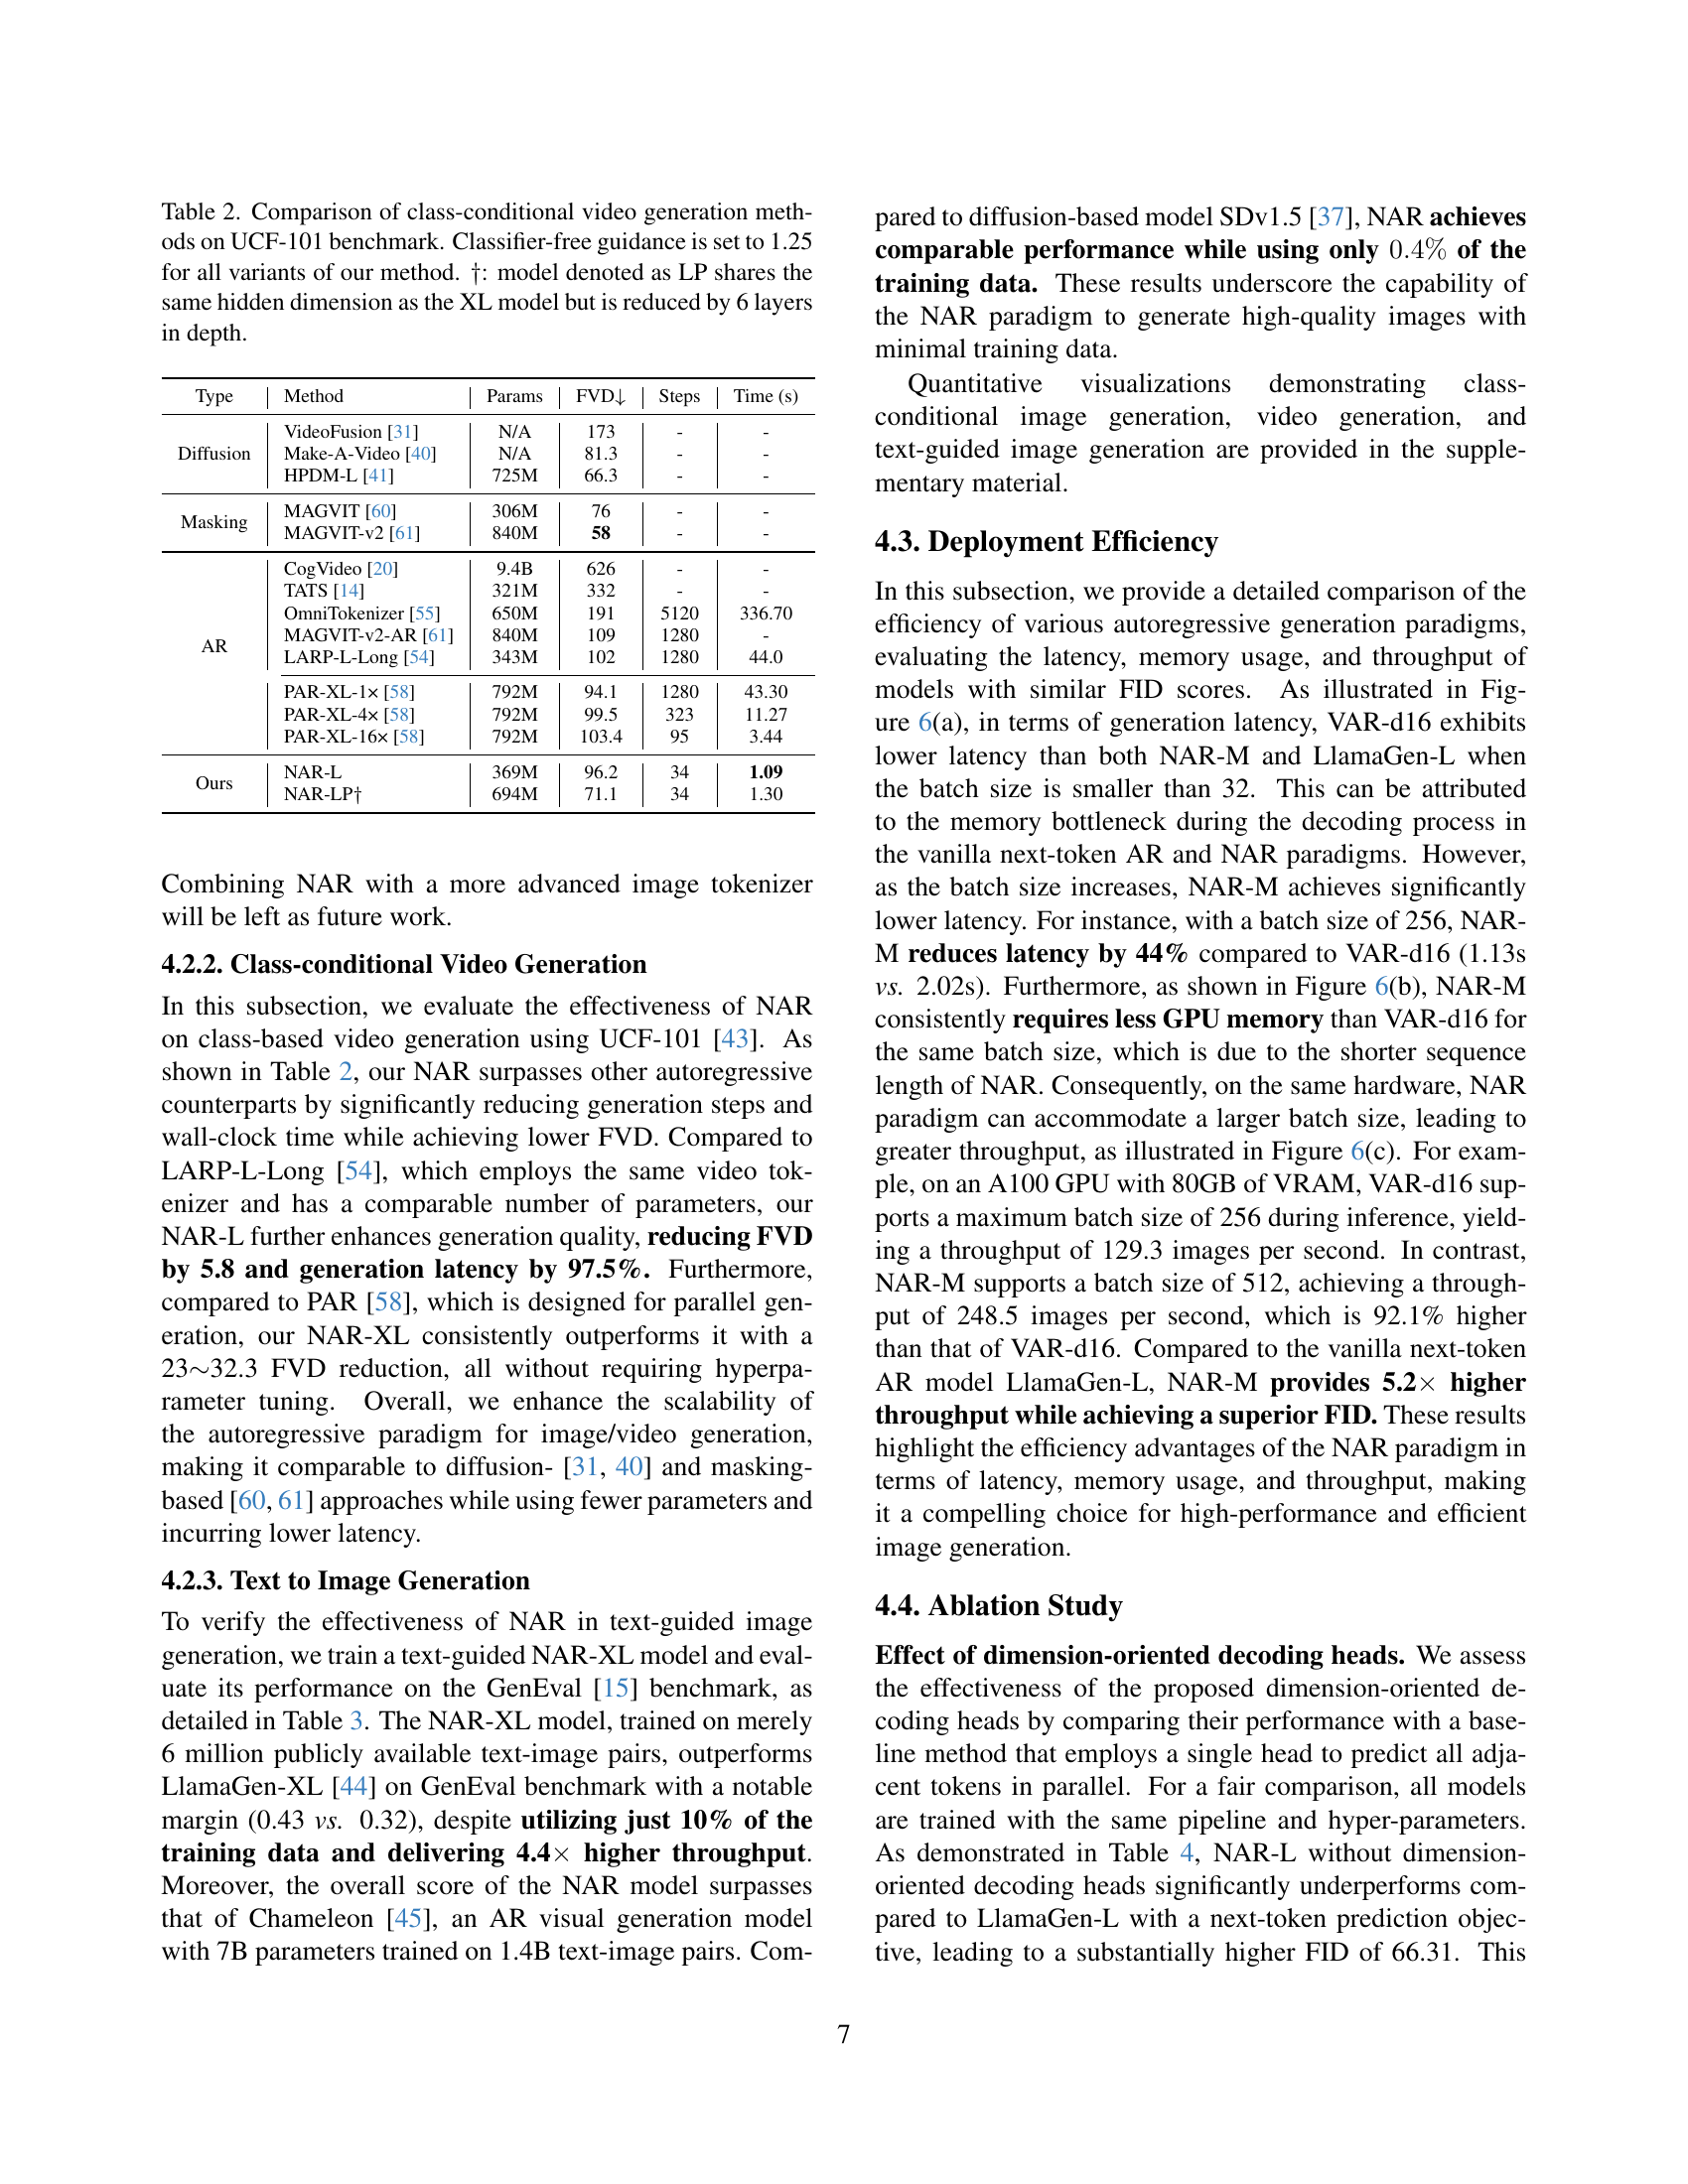
🔼 Table 2 presents a comparison of different class-conditional video generation methods evaluated on the UCF-101 benchmark. The table focuses on the efficiency and quality of these methods. Key metrics compared include the Frechet Video Distance (FVD), which measures the difference between generated and real videos, the number of steps required for video generation, and the total time taken for the process. The table also includes model parameters for each method to contextualize the performance differences. A note indicates that a particular model (LP) is a variant of the XL model, but it’s smaller due to the removal of six layers, allowing for a comparison of performance with a reduced model size.
read the caption
Table 2: Comparison of class-conditional video generation methods on UCF-101 benchmark. Classifier-free guidance is set to 1.25 for all variants of our method. ††\dagger†: model denoted as LP shares the same hidden dimension as the XL model but is reduced by 6 layers in depth.
| Type | Method | Params | FVD | Steps | Time (s) |
|---|---|---|---|---|---|
| Diffusion | VideoFusion [31] | N/A | 173 | - | - |
| Make-A-Video [40] | N/A | 81.3 | - | - | |
| HPDM-L [41] | 725M | 66.3 | - | - | |
| Masking | MAGVIT [60] | 306M | 76 | - | - |
| MAGVIT-v2 [61] | 840M | 58 | - | - | |
| AR | CogVideo [20] | 9.4B | 626 | - | - |
| TATS [14] | 321M | 332 | - | - | |
| OmniTokenizer [55] | 650M | 191 | 5120 | 336.70 | |
| MAGVIT-v2-AR [61] | 840M | 109 | 1280 | - | |
| LARP-L-Long [54] | 343M | 102 | 1280 | 44.0 | |
| PAR-XL-1× [58] | 792M | 94.1 | 1280 | 43.30 | |
| PAR-XL-4× [58] | 792M | 99.5 | 323 | 11.27 | |
| PAR-XL-16× [58] | 792M | 103.4 | 95 | 3.44 | |
| Ours | NAR-L | 369M | 96.2 | 34 | 1.09 |
| NAR-LP | 694M | 71.1 | 34 | 1.30 |
🔼 Table 3 presents a quantitative comparison of different models on the GenEval benchmark, a standardized evaluation for text-to-image generation. The table shows how various models perform across different aspects of image generation, such as the ability to generate images corresponding to counts, objects (single and two), and colors specified in the text prompts. It also reports overall performance scores, providing a comprehensive assessment of each model’s accuracy and effectiveness in understanding and translating textual descriptions into visual representations. The results highlighted in this table are particularly useful for comparing the performance of different models on a diverse range of text-to-image generation tasks.
read the caption
Table 3: Quantitative evaluation on the GenEval benchmark. ††\dagger† denotes the results are reported by [16].
| Model | Params | Training Data | Counting | Two Object | Single Object | Colors | Overall |
| ||
|---|---|---|---|---|---|---|---|---|---|---|
| LlamaGen-XL [44] | 0.8B | 60M | - | 0.34 | - | - | 0.32 | 3.40 | ||
| Chameleon [45] | 7B | 1.4B | - | - | - | - | 0.39 | 0.09 | ||
| SDv1.5 [37] | 0.9B | 2B | 0.35 | 0.38 | 0.97 | 0.76 | 0.43 | 0.44 | ||
| NAR-XL | 0.8B | 6M | 0.34 | 0.37 | 0.98 | 0.76 | 0.43 | 15.0 |
🔼 This table presents the ablation study results on the effect of using dimension-oriented decoding heads in the NAR model for image generation. It compares the performance of the NAR model with and without dimension-oriented decoding heads, evaluated on the ImageNet 256x256 benchmark. The results show the FID scores and the number of steps taken for generation. The ‘NTP’ (next-token prediction) paradigm is used as a baseline for comparison. The comparison highlights the impact of the proposed dimension-oriented heads on the model’s performance in terms of both image quality (FID) and efficiency (number of steps).
read the caption
Table 4: The effect of dimension-oriented decoding heads evaluated on ImageNet 256×256256256256\times 256256 × 256 benchmark. Here, “NTP” denotes the next-token prediction paradigm.
| Throughput |
| (img/s) |
🔼 This table presents a comparison of different configurations for decoding heads in the Neighboring Autoregressive Modeling (NAR) method, specifically focusing on their impact on the quality of image generation on the ImageNet 256x256 dataset. The experiment uses a classifier-free guidance of 2.0. The configurations vary in which decoding heads are used for overlapping tokens (i.e., tokens that are predicted by more than one head). The table shows the FID (Fréchet Inception Distance) and IS (Inception Score) for each configuration, lower FID indicating better quality.
read the caption
Table 5: Performance comparison of various decoding head configurations on ImageNet 256×256256256256\times 256256 × 256. Here, “Head” denotes the decoding heads to use for the overlapped region. Results are obtained with a classifier-free guidance of 2.0.
Full paper#