TL;DR#
Constructing Generalized Knowledge Graphs (GKG), including knowledge, event, and common-sense graphs, is vital for NLP. Current methods build these graphs separately, missing holistic benefits. Challenges arise from task differences, impacting resource use. This paper tackles the issue by proposing a unified framework, aiming to streamline GKG construction and enhance resource efficiency. This involves gathering & categorizing data from 15 sub-tasks across the 3 types of graphs.
The proposed GKG-LLM uses a 3-stage curriculum learning fine-tuning, iteratively injecting knowledge from different graph types. It begins with KG, enhances with EKG, and generalizes with CKG. Experiments show GKG-LLM improves construction across in-domain, OOD, and counter-task data. This framework promotes parameter efficiency and leverages shared knowledge to advance GKG construction and facilitate more unified NLP workflows.
Key Takeaways#
Why does it matter?#
This paper addresses a critical need for a unified approach to GKG construction, offering a resource-efficient and holistic solution. The GKG-LLM framework’s success in handling diverse graph types and datasets, including OOD data, highlights its generalizability and potential for broader application. This will influence future research towards more integrated and adaptable knowledge graph technologies.
Visual Insights#

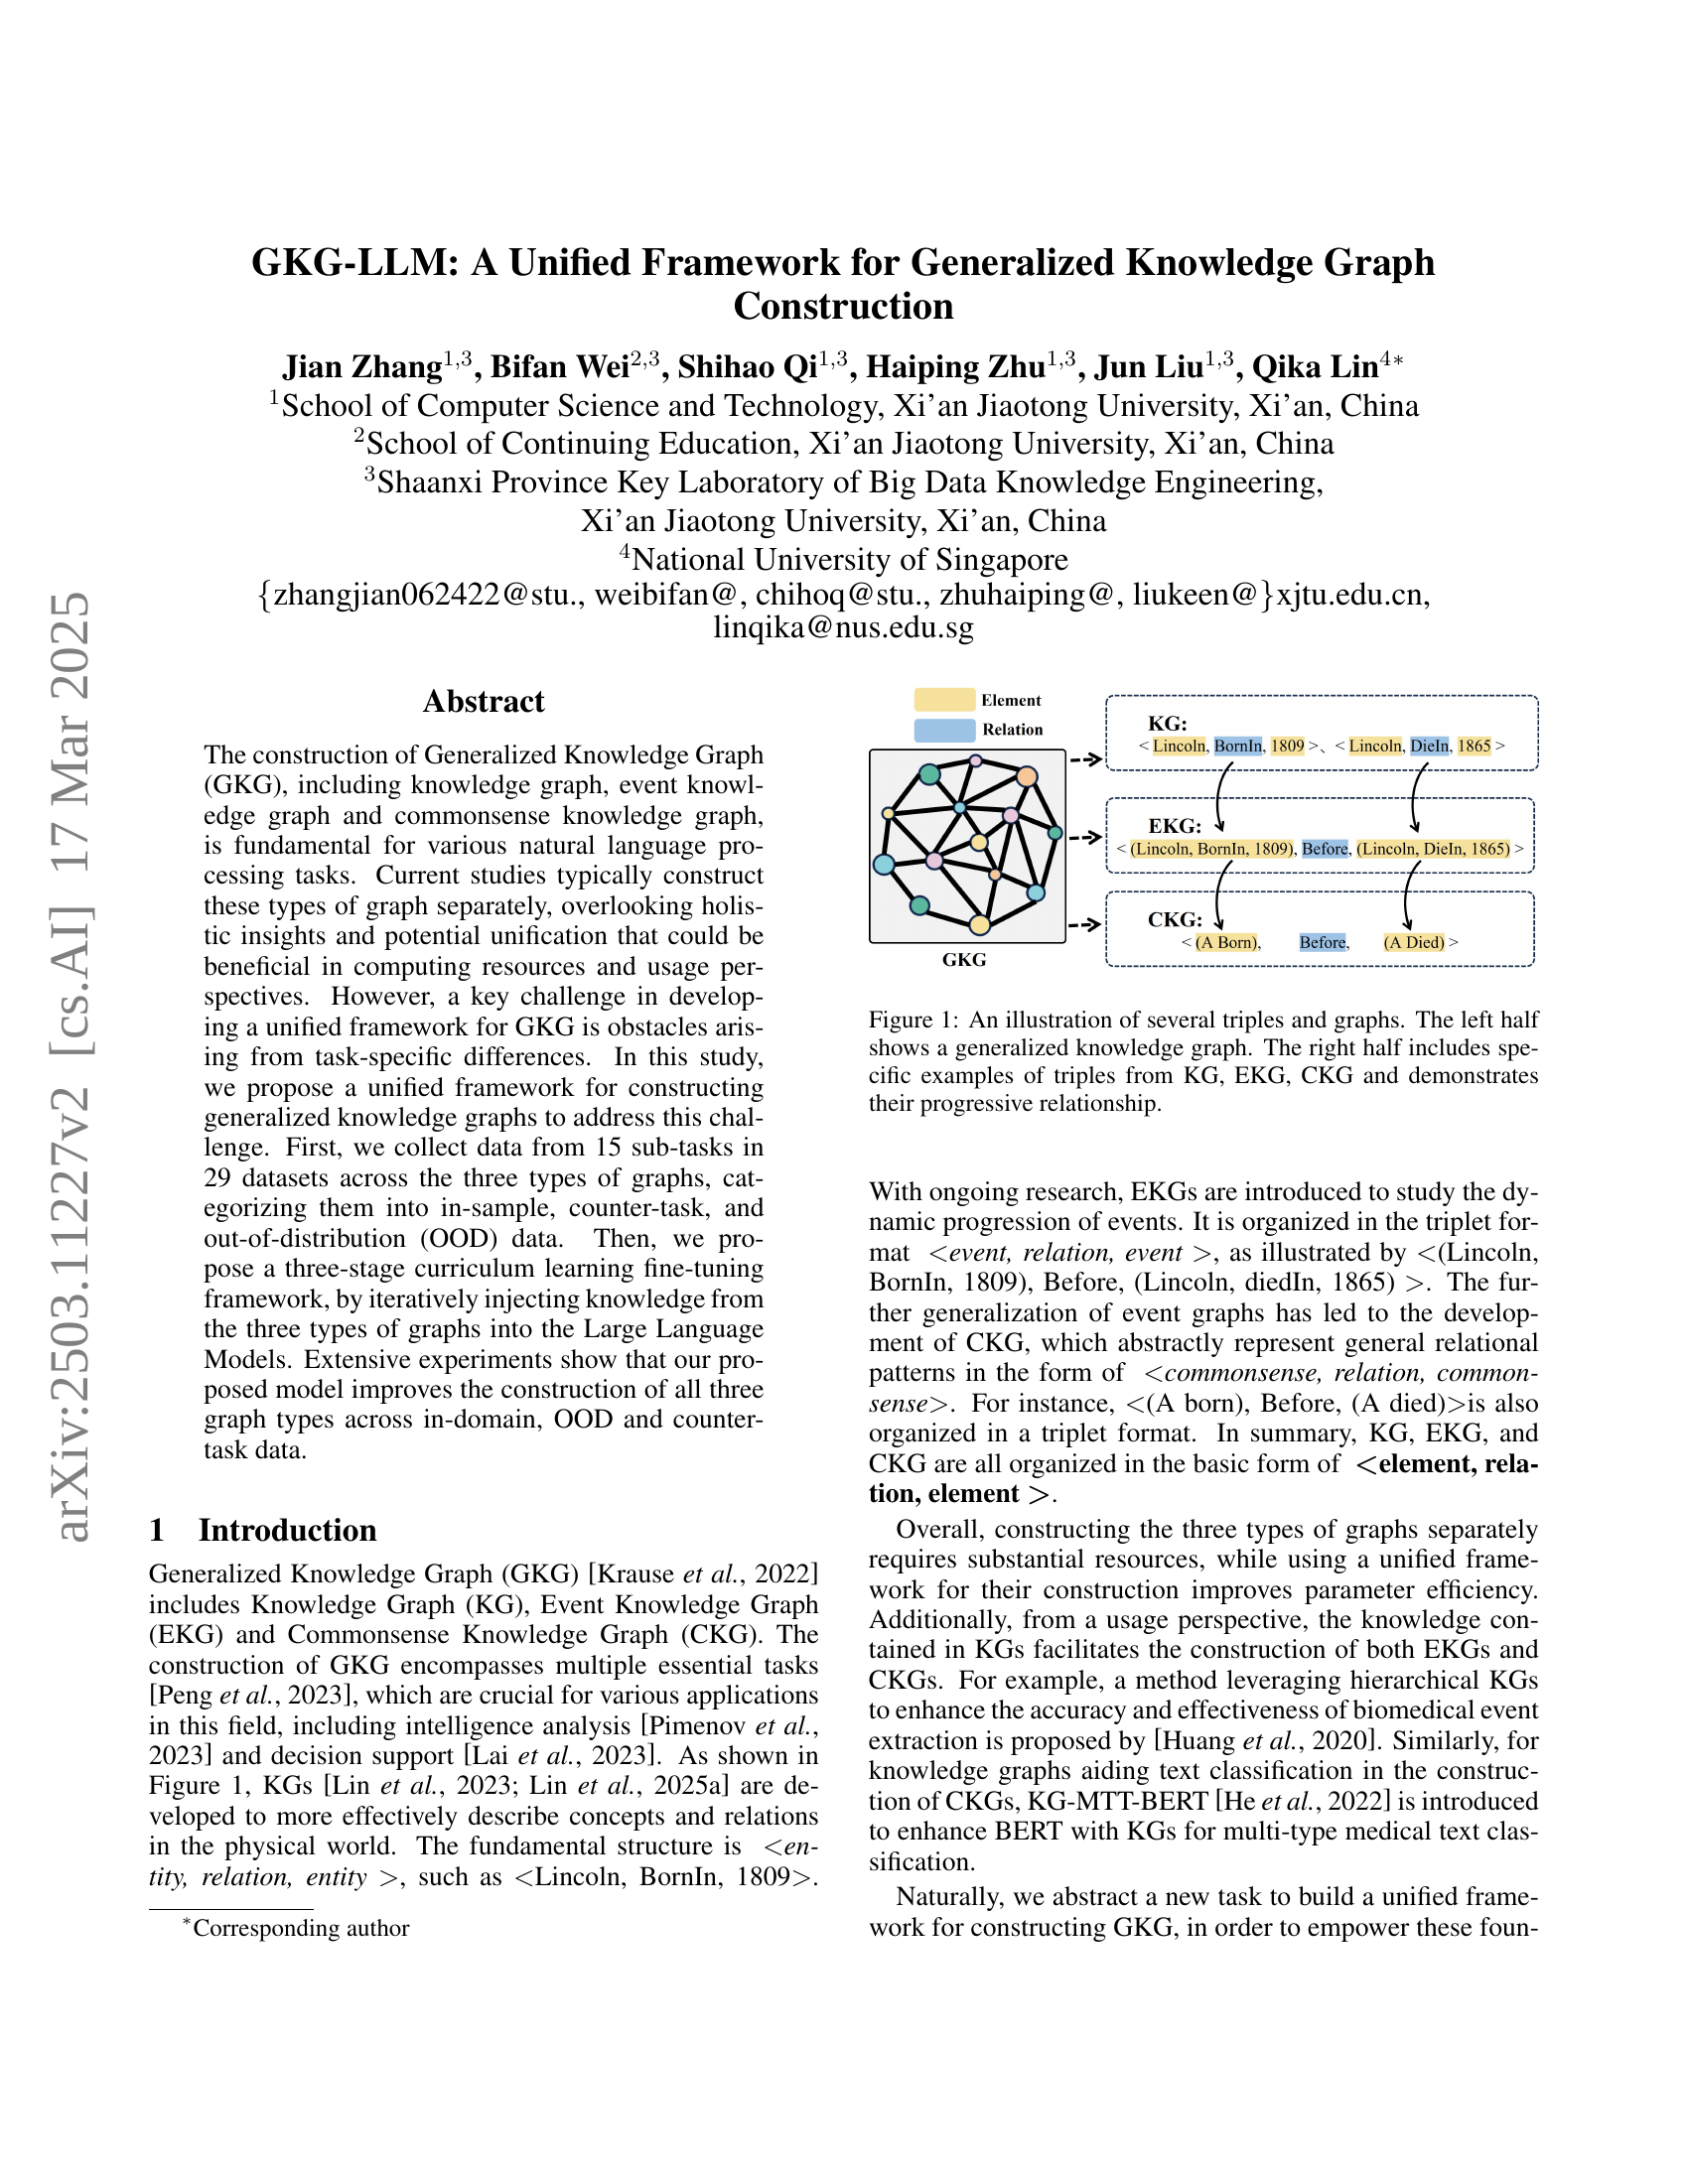
🔼 Figure 1 illustrates the concept of a Generalized Knowledge Graph (GKG) and its constituent parts: Knowledge Graphs (KGs), Event Knowledge Graphs (EKGs), and Commonsense Knowledge Graphs (CKGs). The left side shows a visual representation of the GKG, highlighting its interconnected nature. The right side provides concrete examples of triples (subject, predicate, object) from each graph type, demonstrating how they build upon one another in terms of complexity and scope. KGs represent facts about entities and their relationships. EKGs extend this by modeling events and their temporal relationships. CKGs further generalize these concepts, focusing on abstract commonsense relationships.
read the caption
Figure 1: An illustration of several triples and graphs. The left half shows a generalized knowledge graph. The right half includes specific examples of triples from KG, EKG, CKG and demonstrates their progressive relationship.
| Graphs | Tasks | Datasets | GPT- | Claude- | Gemini- | LlaMA- | Single- | Integrated- | GKG- | |
| 4 | 3 | 1.5 | 2-GKG | 3-Instruct | SFT | SFT | LLM | |||
| KG | SRE | NYT | 64.94 | 66.76 | 68.59 | 78.18 | 55.12 | 74.39 | 79.32 | 80.63 |
| FRE | FewRel | 26.28 | 27.45 | 30.20 | 89.45 | 22.64 | 78.65 | 86.74 | 90.48 | |
| TACRED | 18.85 | 20.23 | 22.43 | 86.71 | 12.74 | 70.66 | 84.66 | 88.96 | ||
| DRE | DOCRED | 38.84 | 36.28 | 42.63 | 83.18 | 34.63 | 74.53 | 83.61 | 85.71 | |
| JE&RE | FewRel | 6.32 | 5.44 | 7.52 | 42.05 | 3.20 | 26.76 | 30.56 | 34.32 | |
| NYT | 6.22 | 5.85 | 8.36 | 53.33 | 0.0 | 40.16 | 48.66 | 52.27 | ||
| EKG | SED | ACE2005 | 17.50 | 8.57 | 22.40 | 32.47 | 0.0 | 22.74 | 34.32 | 80.63 |
| DED | WIKIEVENTS | 16.54 | 9.14 | 14.87 | 24.87 | 18.62 | 29.59 | 23.84 | 39.86 | |
| DEAE | WIKIEVENTS | 42.58 | 53.41 | 47.69 | 70.46 | 41.76 | 63.38 | 69.30 | 75.22 | |
| RAMS | 13.84 | 5.70 | 38.49 | 48.33 | 30.74 | 53.43 | 52.09 | 63.62 | ||
| ETRE | MATRES | 39.97 | 36.62 | 38.51 | 62.94 | 22.79 | 37.91 | 44.26 | 71.51 | |
| ESL | 64.24 | 47.65 | 42.18 | 68.96 | 21.67 | 74.06 | 67.63 | 75.33 | ||
| TB-Dense | 43.73 | 36.58 | 42.43 | 52.89 | 36.55 | 49.30 | 51.23 | 53.54 | ||
| Causal-TB | 6.67 | 8.01 | 8.74 | 42.79 | 16.43 | 37.35 | 49.83 | 45.26 | ||
| MAVEN-ERE | 43.80 | 21.73 | 42.10 | 71.55 | 40.29 | 37.35 | 75.44 | 81.95 | ||
| TCR∗ | 15.43 | 18.74 | 25.34 | 24.88 | 24.71 | 20.68 | 22.09 | 26.45 | ||
| ECRE | ESL | 28.57 | 19.26 | 55.21 | 75.33 | 26.33 | 62.92 | 78.74 | 84.89 | |
| MAVEN-ERE | 51.98 | 11.36 | 43.38 | 76.48 | 13.37 | 78.91 | 88.59 | 90.18 | ||
| Causal-TB∗ | 39.67 | 41.23 | 43.44 | 33.94 | 30.02 | 48.41 | 48.80 | 55.79 | ||
| ESRE | HiEve | 38.81 | 30.92 | 48.83 | 55.60 | 48.61 | 57.64 | 58.01 | 58.61 | |
| MAVEN-ERE | 40.09 | 13.12 | 38.09 | 44.37 | 33.49 | 39.11 | 37.30 | 48.49 | ||
| CKG | NER | CoNLL | 15.94 | 14.46 | 18.27 | 77.50 | 15.60 | 64.74 | 70.53 | 82.30 |
| AG | CNNDM | 30 | 28 | 22 | 36 | 18 | 35 | 35 | 45 | |
| XSum | 33 | 26 | 29 | 28 | 9 | 24 | 30 | 38 | ||
| LI | SNLI | 51.26 | 47.56 | 60.38 | 69.51 | 44.50 | 87.09 | 89.35 | 89.03 | |
| MNLI | 81.80 | 39.33 | 48.80 | 58.97 | 53.70 | 86.78 | 84.62 | 86.35 | ||
| TC | R8∗ | 72.26 | 36.43 | 66.58 | 65.27 | 58.89 | 28.83 | 58.64 | 69.33 | |
| R52 | 82.18 | 83.75 | 80.63 | 94.16 | 29.68 | 89.02 | 88.81 | 90.34 | ||
| Counter | NLG | WebNLG | 78 | 65 | 76 | 83 | 15 | 80 | 80 | 85 |
| Average Performance | 38.25 | 29.81 | 39.07 | 59.70 | 26.83 | 52.97 | 60.41 | 67.90 | ||
🔼 This table compares the performance of different large language models (LLMs) on various knowledge graph (KG) construction sub-tasks. It shows the performance of several LLMs (GPT-4, Claude-3, Gemini, Llama-2, Llama-3) and several methods developed by the authors (Single-SFT, Integrated-SFT, GKG-LLM) across different KG sub-task datasets. The best and second-best results for each sub-task are highlighted. The table also indicates which datasets are out-of-distribution (OOD) and notes that the Rough-L metric (percentage) is used for certain tasks instead of the standard F1-score. The GKG-LLM column presents the results of the authors’ proposed three-stage fine-tuning method.
read the caption
Table 1: Performance comparison across various datasets and tasks. The best result for each sub-task is highlighted in bold, while the second-best result is underlined. The OOD datasets are starred by *. ††\dagger† means the task is evaluated by metric Rough-L of percentage. The results for GPT-4, Claude-3, and Gemini-1.5 are obtained via their respective APIs. LlaMA-2-GKG, LlaMA-3-Instruct, Single-SFT, and Integrated-SFT are implemented by us. The GKG-LLM column represents the final model obtained after three-stage tuning.
In-depth insights#
Unified GKG-LLM#
The ‘Unified GKG-LLM’ concept, as presented, embodies a significant advancement in knowledge representation and utilization. The core idea is to integrate Knowledge Graphs (KG), Event Knowledge Graphs (EKG), and Commonsense Knowledge Graphs (CKG) into a single framework. This unification promises to address the limitations of constructing these graphs independently, which often leads to redundant resource consumption and a failure to leverage inherent interconnections. By creating a generalized knowledge graph (GKG) and a Large Language Model (LLM) based around it, this framework offers a more holistic approach to knowledge acquisition and application. One key advantage lies in the potential for improved parameter efficiency, as shared knowledge across KG, EKG, and CKG can be jointly learned. Moreover, the GKG facilitates better knowledge transfer, enabling insights from one graph type to enhance the construction and reasoning capabilities of others. The challenge, however, lies in managing the task-specific differences that initially led to the separate development of these graphs.
Curriculum Tuning#
Curriculum tuning is a key method for refining large language models (LLMs). It is a gradual training strategy. Starts with basic tasks, then introduces harder ones. Three types of graphs: KG, EKG, and CKG. KG builds foundational skills, EKG enhances specific abilities, CKG achieves generalization. Datasets are key. LLMs enhance real-world use. Diversity in instructions improves tasks
GKG Data Fusion#
GKG Data Fusion is an exciting area, offering ways to combine different knowledge sources. It tackles challenges like data heterogeneity and semantic inconsistencies to create a richer understanding. Fusion methods could involve entity resolution, relation alignment, and reasoning integration. Potential benefits includes more accurate knowledge inference and improved downstream task performance. Challenges remain in scaling these techniques to large and noisy datasets and ensuring the interpretability of fused knowledge graphs.
LoRA+ Tuning#
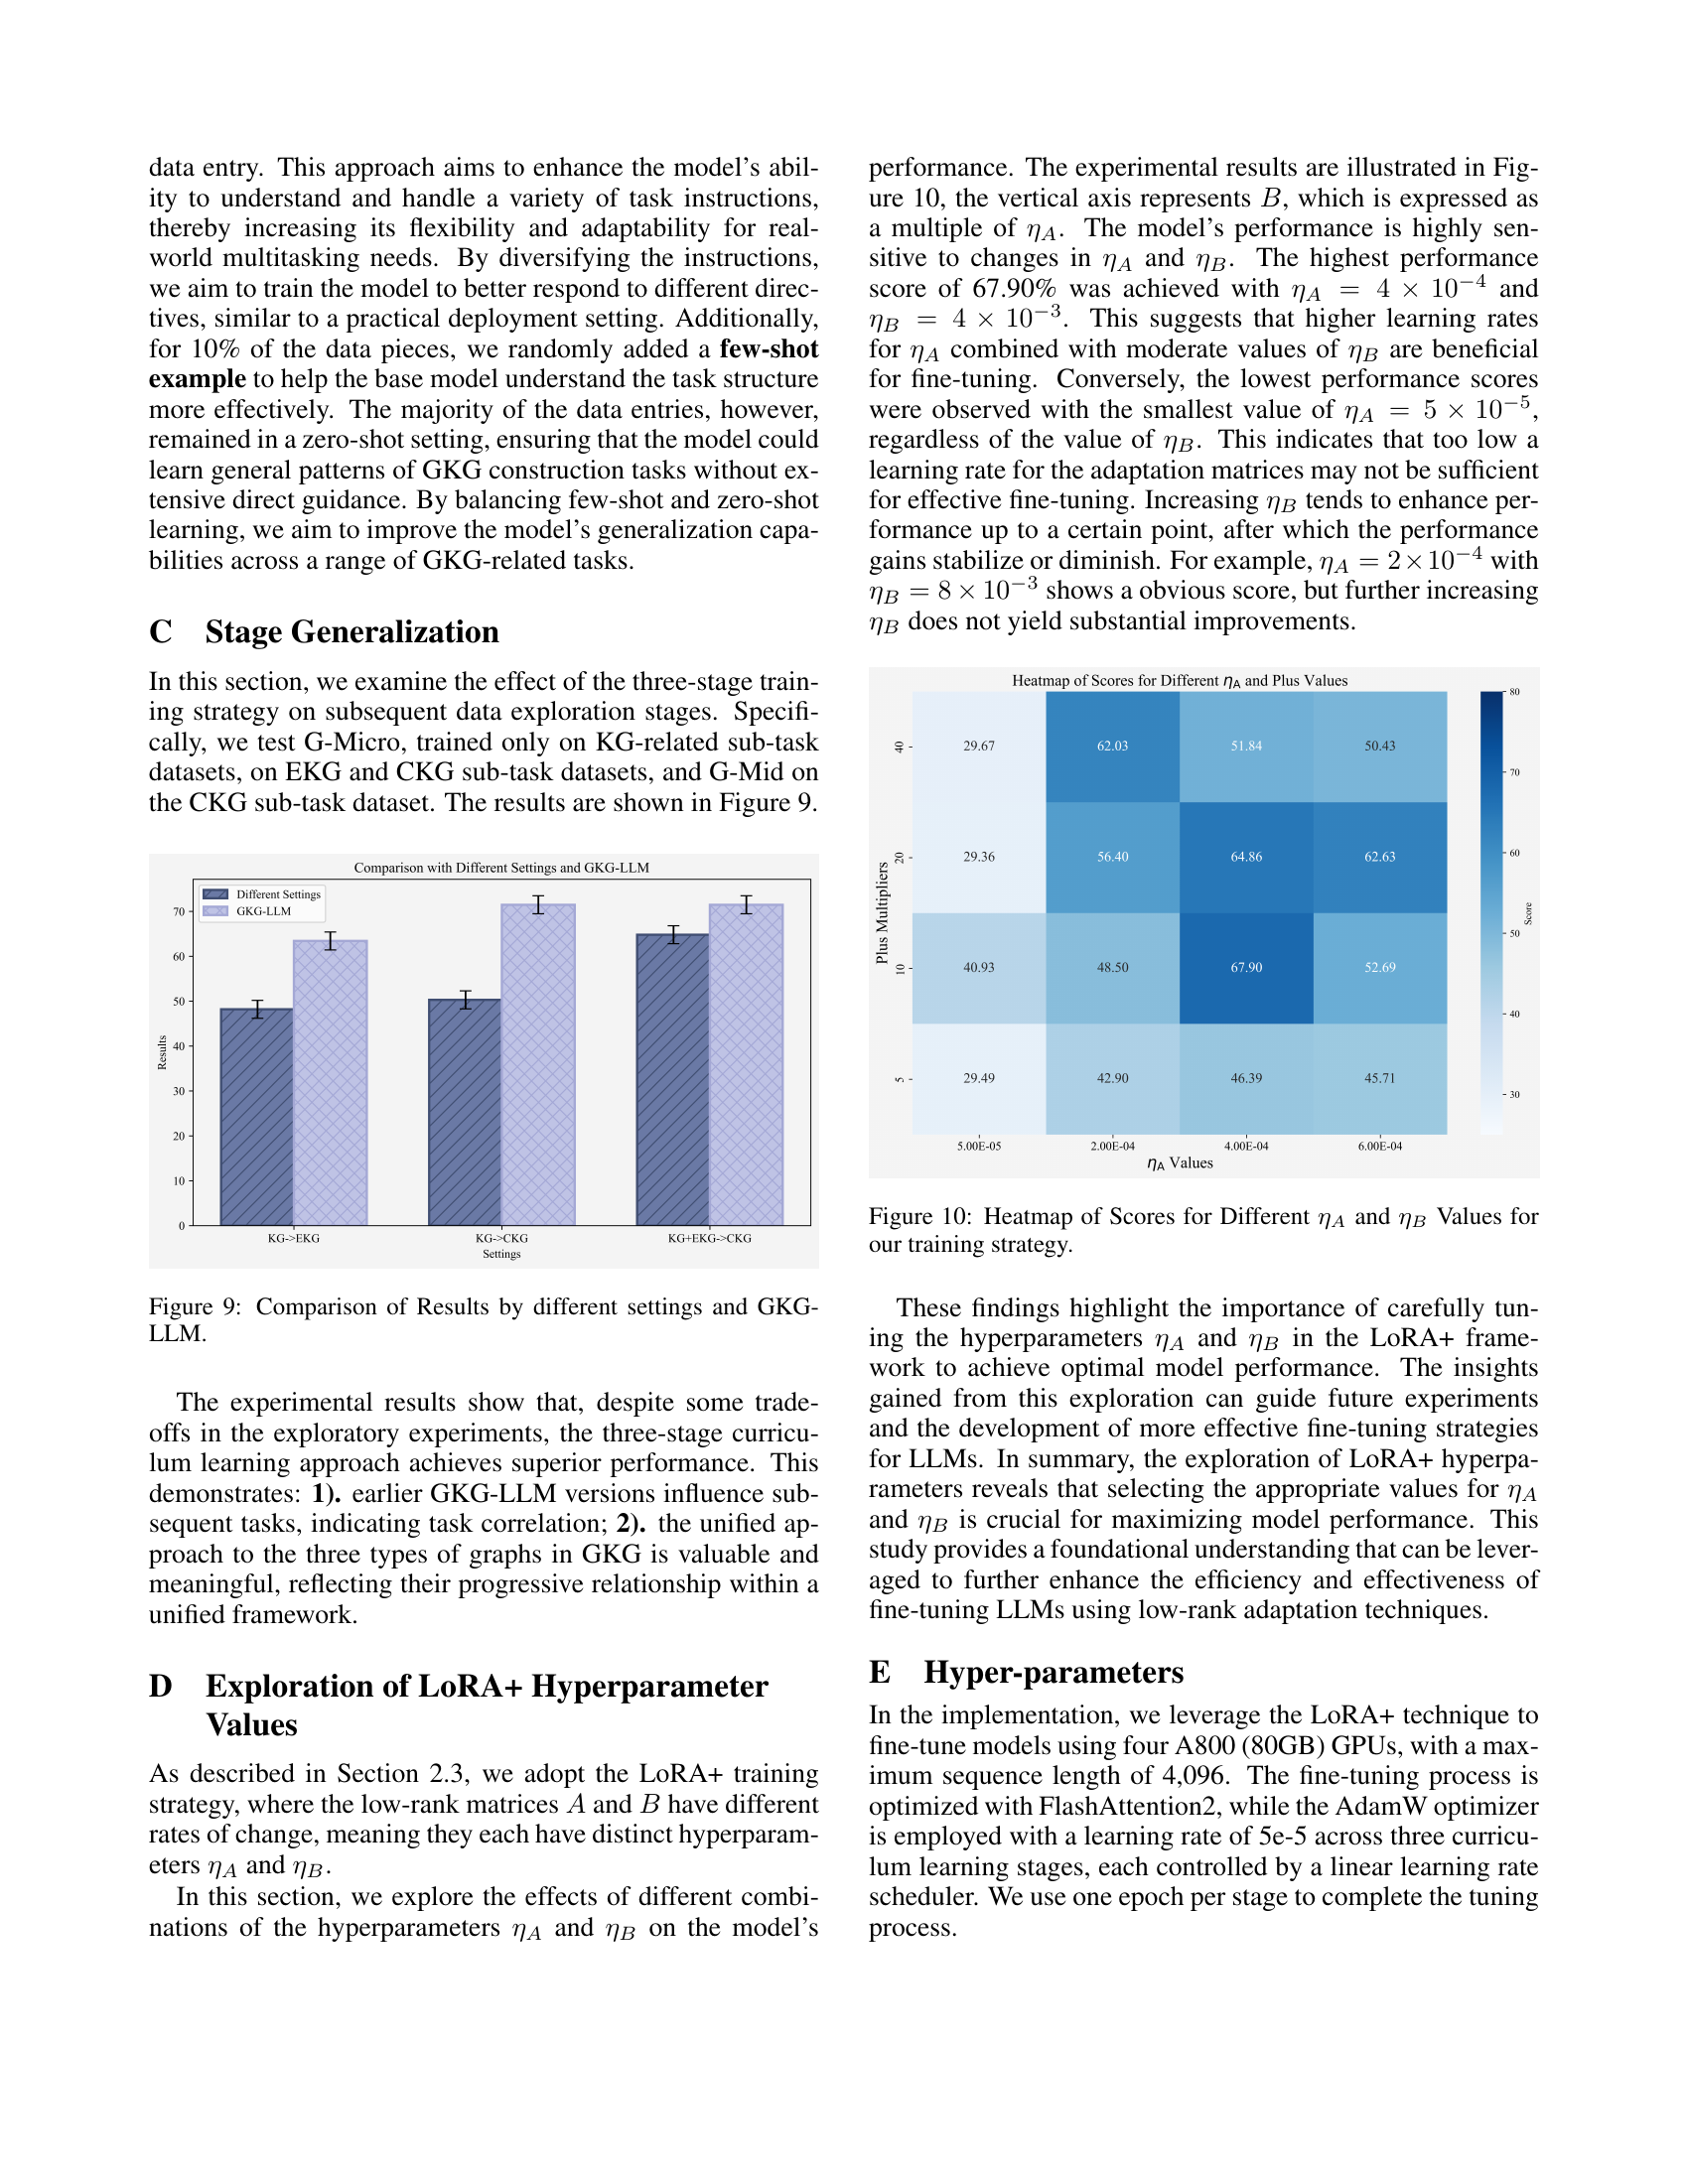
The research paper utilizes LoRA+ tuning, a refined version of LoRA, for efficient model fine-tuning within the GKG framework. LoRA+ accelerates convergence and enables adaptive GKG sub-task handling. The study explores the impact of varying the learning rates(ηΑ and ηΒ) associated with low-rank matrices. Findings highlight the significance of carefully tuning ηΑ and ηΒ values to optimize model performance. The results reveals that selecting the appropriate ηΑ and ηΒ values is crucial for maximizing model performance by efficiently fine-tuning large language models. This approach leverages low-rank adaptation techniques.
GKG: Future AI#
GKG (Generalized Knowledge Graph) has a strong potential for future AI. GKG facilitates a more holistic representation of knowledge, integrating diverse sources like knowledge graphs, event knowledge graphs, and common sense knowledge graphs. This unified framework enables AI systems to reason across different domains, improving decision-making and problem-solving. GKG’s ability to capture relationships between entities, events, and concepts, combined with advancements in large language models (LLMs), creates opportunities for developing more robust and adaptable AI systems. The development of GKG-LLMs are helping enhance knowledge extraction and representation capabilities of foundation models in specialized domains, especially in healthcare and other specialized areas.
More visual insights#
More on figures

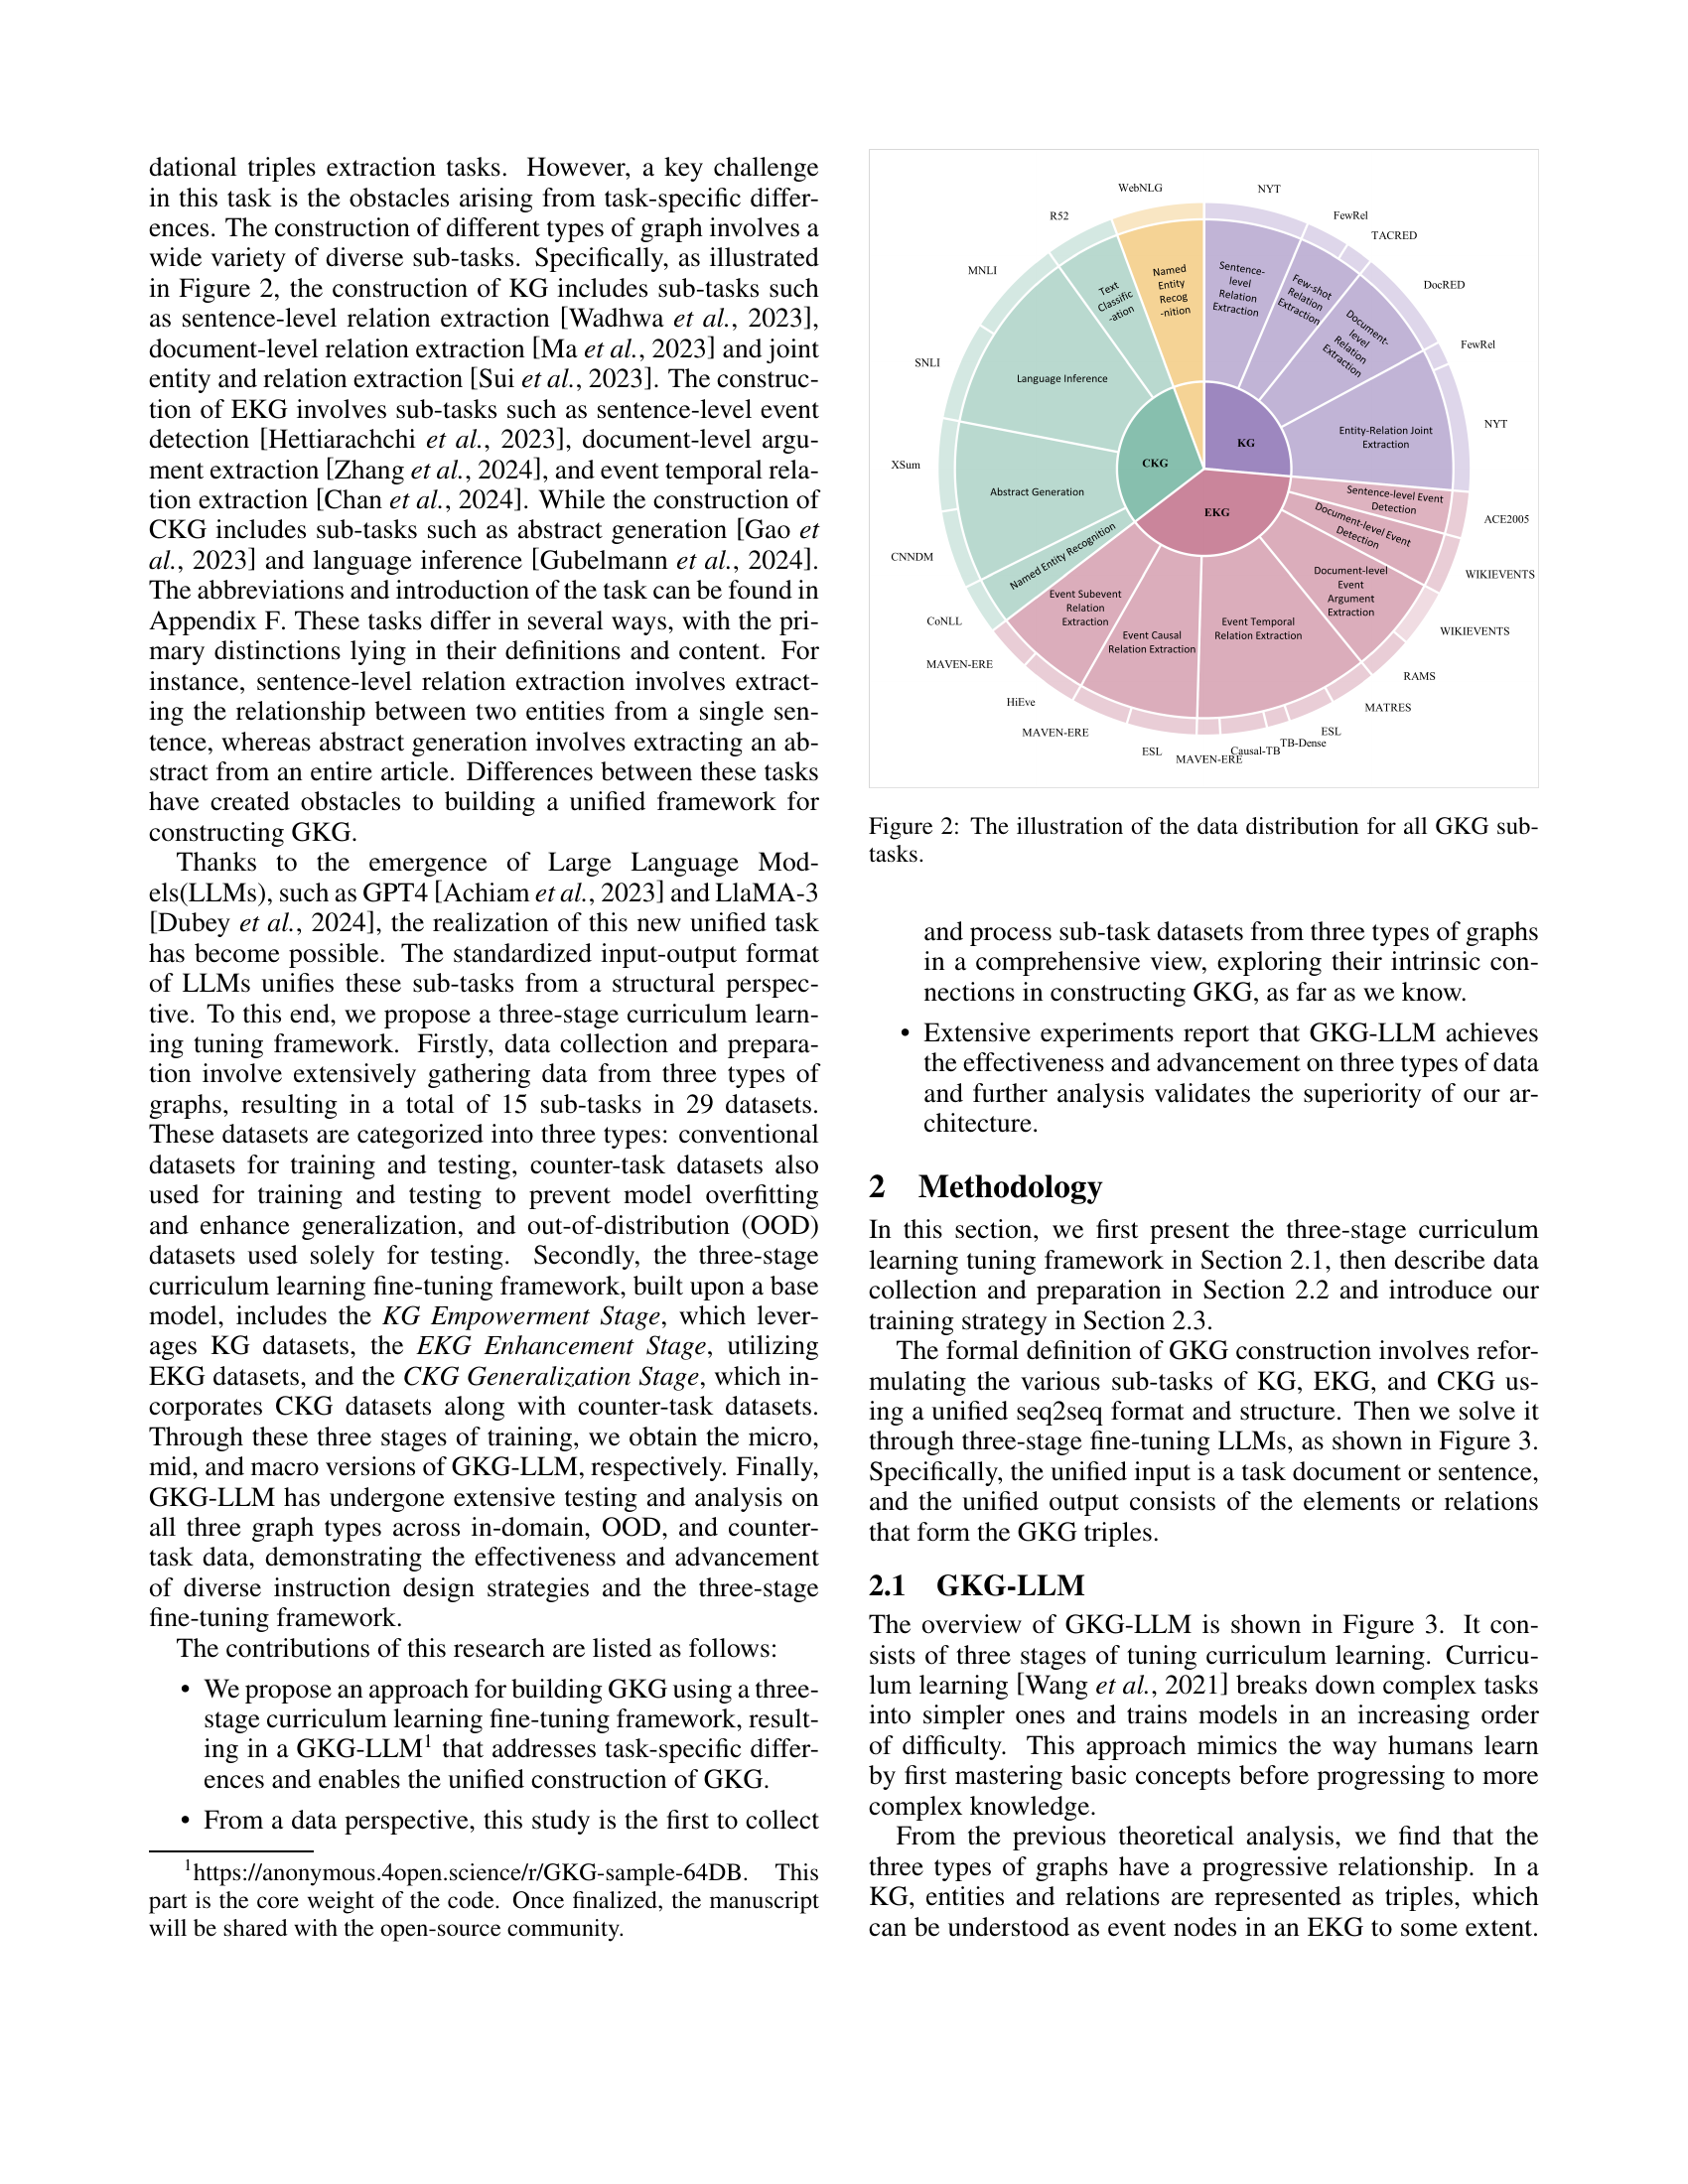
🔼 Figure 2 shows the distribution of the datasets used for training and evaluating the Generalized Knowledge Graph (GKG) construction task. It visually represents the various sub-tasks involved in constructing three types of graphs: Knowledge Graphs (KGs), Event Knowledge Graphs (EKGs), and Commonsense Knowledge Graphs (CKGs). Each sub-task is associated with one or more datasets, indicating the data sources utilized for that specific task. This figure provides a comprehensive overview of the data utilized for training and testing in the study, highlighting the diverse range of tasks and datasets involved in the GKG construction process.
read the caption
Figure 2: The illustration of the data distribution for all GKG sub-tasks.

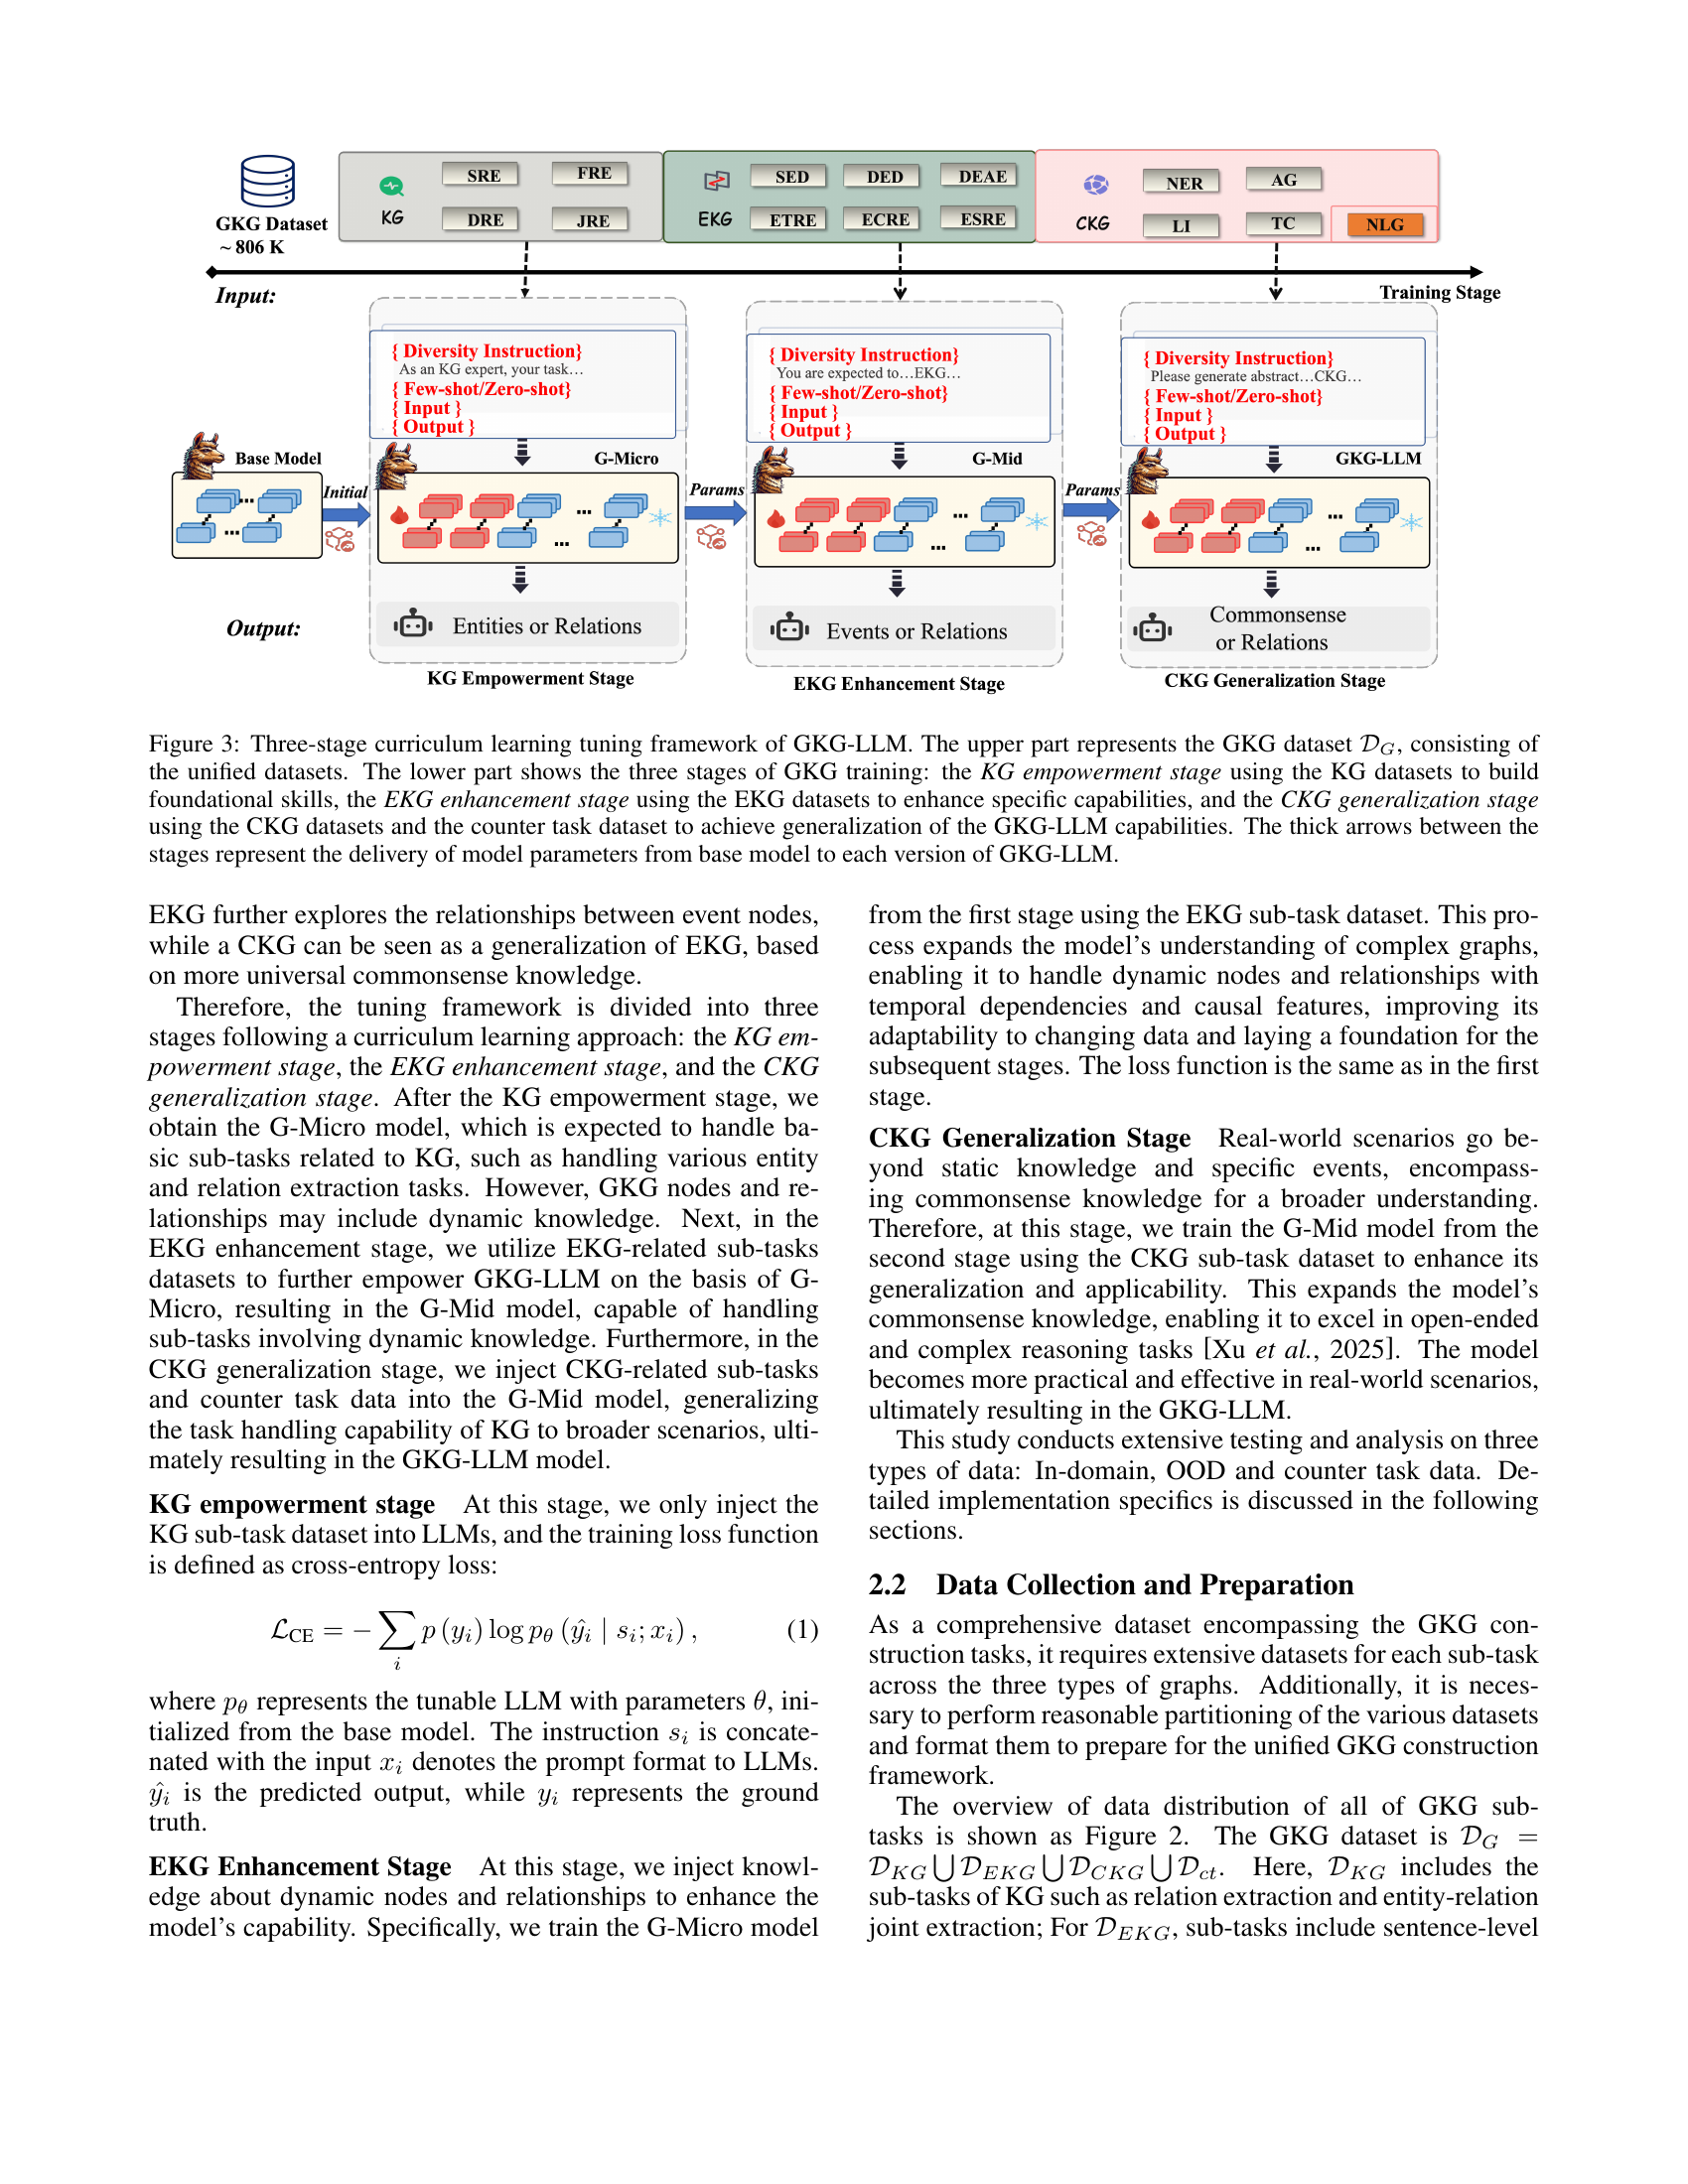
🔼 This figure illustrates the three-stage curriculum learning framework used to train the GKG-LLM model. The top section shows the unified GKG dataset (𝒟G) comprising data from KG, EKG, and CKG sub-tasks, as well as a counter task dataset. The bottom section details the three training stages: 1) KG Empowerment: foundational skills are built using KG datasets; 2) EKG Enhancement: specific capabilities are enhanced using EKG datasets; and 3) CKG Generalization: generalization is achieved using CKG and counter task datasets. Thick arrows indicate the transfer of model parameters between stages, starting from a base model to create the G-Micro, G-Mid, and finally, the GKG-LLM model.
read the caption
Figure 3: Three-stage curriculum learning tuning framework of GKG-LLM. The upper part represents the GKG dataset 𝒟Gsubscript𝒟𝐺\mathcal{D}_{G}caligraphic_D start_POSTSUBSCRIPT italic_G end_POSTSUBSCRIPT, consisting of the unified datasets. The lower part shows the three stages of GKG training: the KG empowerment stage using the KG datasets to build foundational skills, the EKG enhancement stage using the EKG datasets to enhance specific capabilities, and the CKG generalization stage using the CKG datasets and the counter task dataset to achieve generalization of the GKG-LLM capabilities. The thick arrows between the stages represent the delivery of model parameters from base model to each version of GKG-LLM.

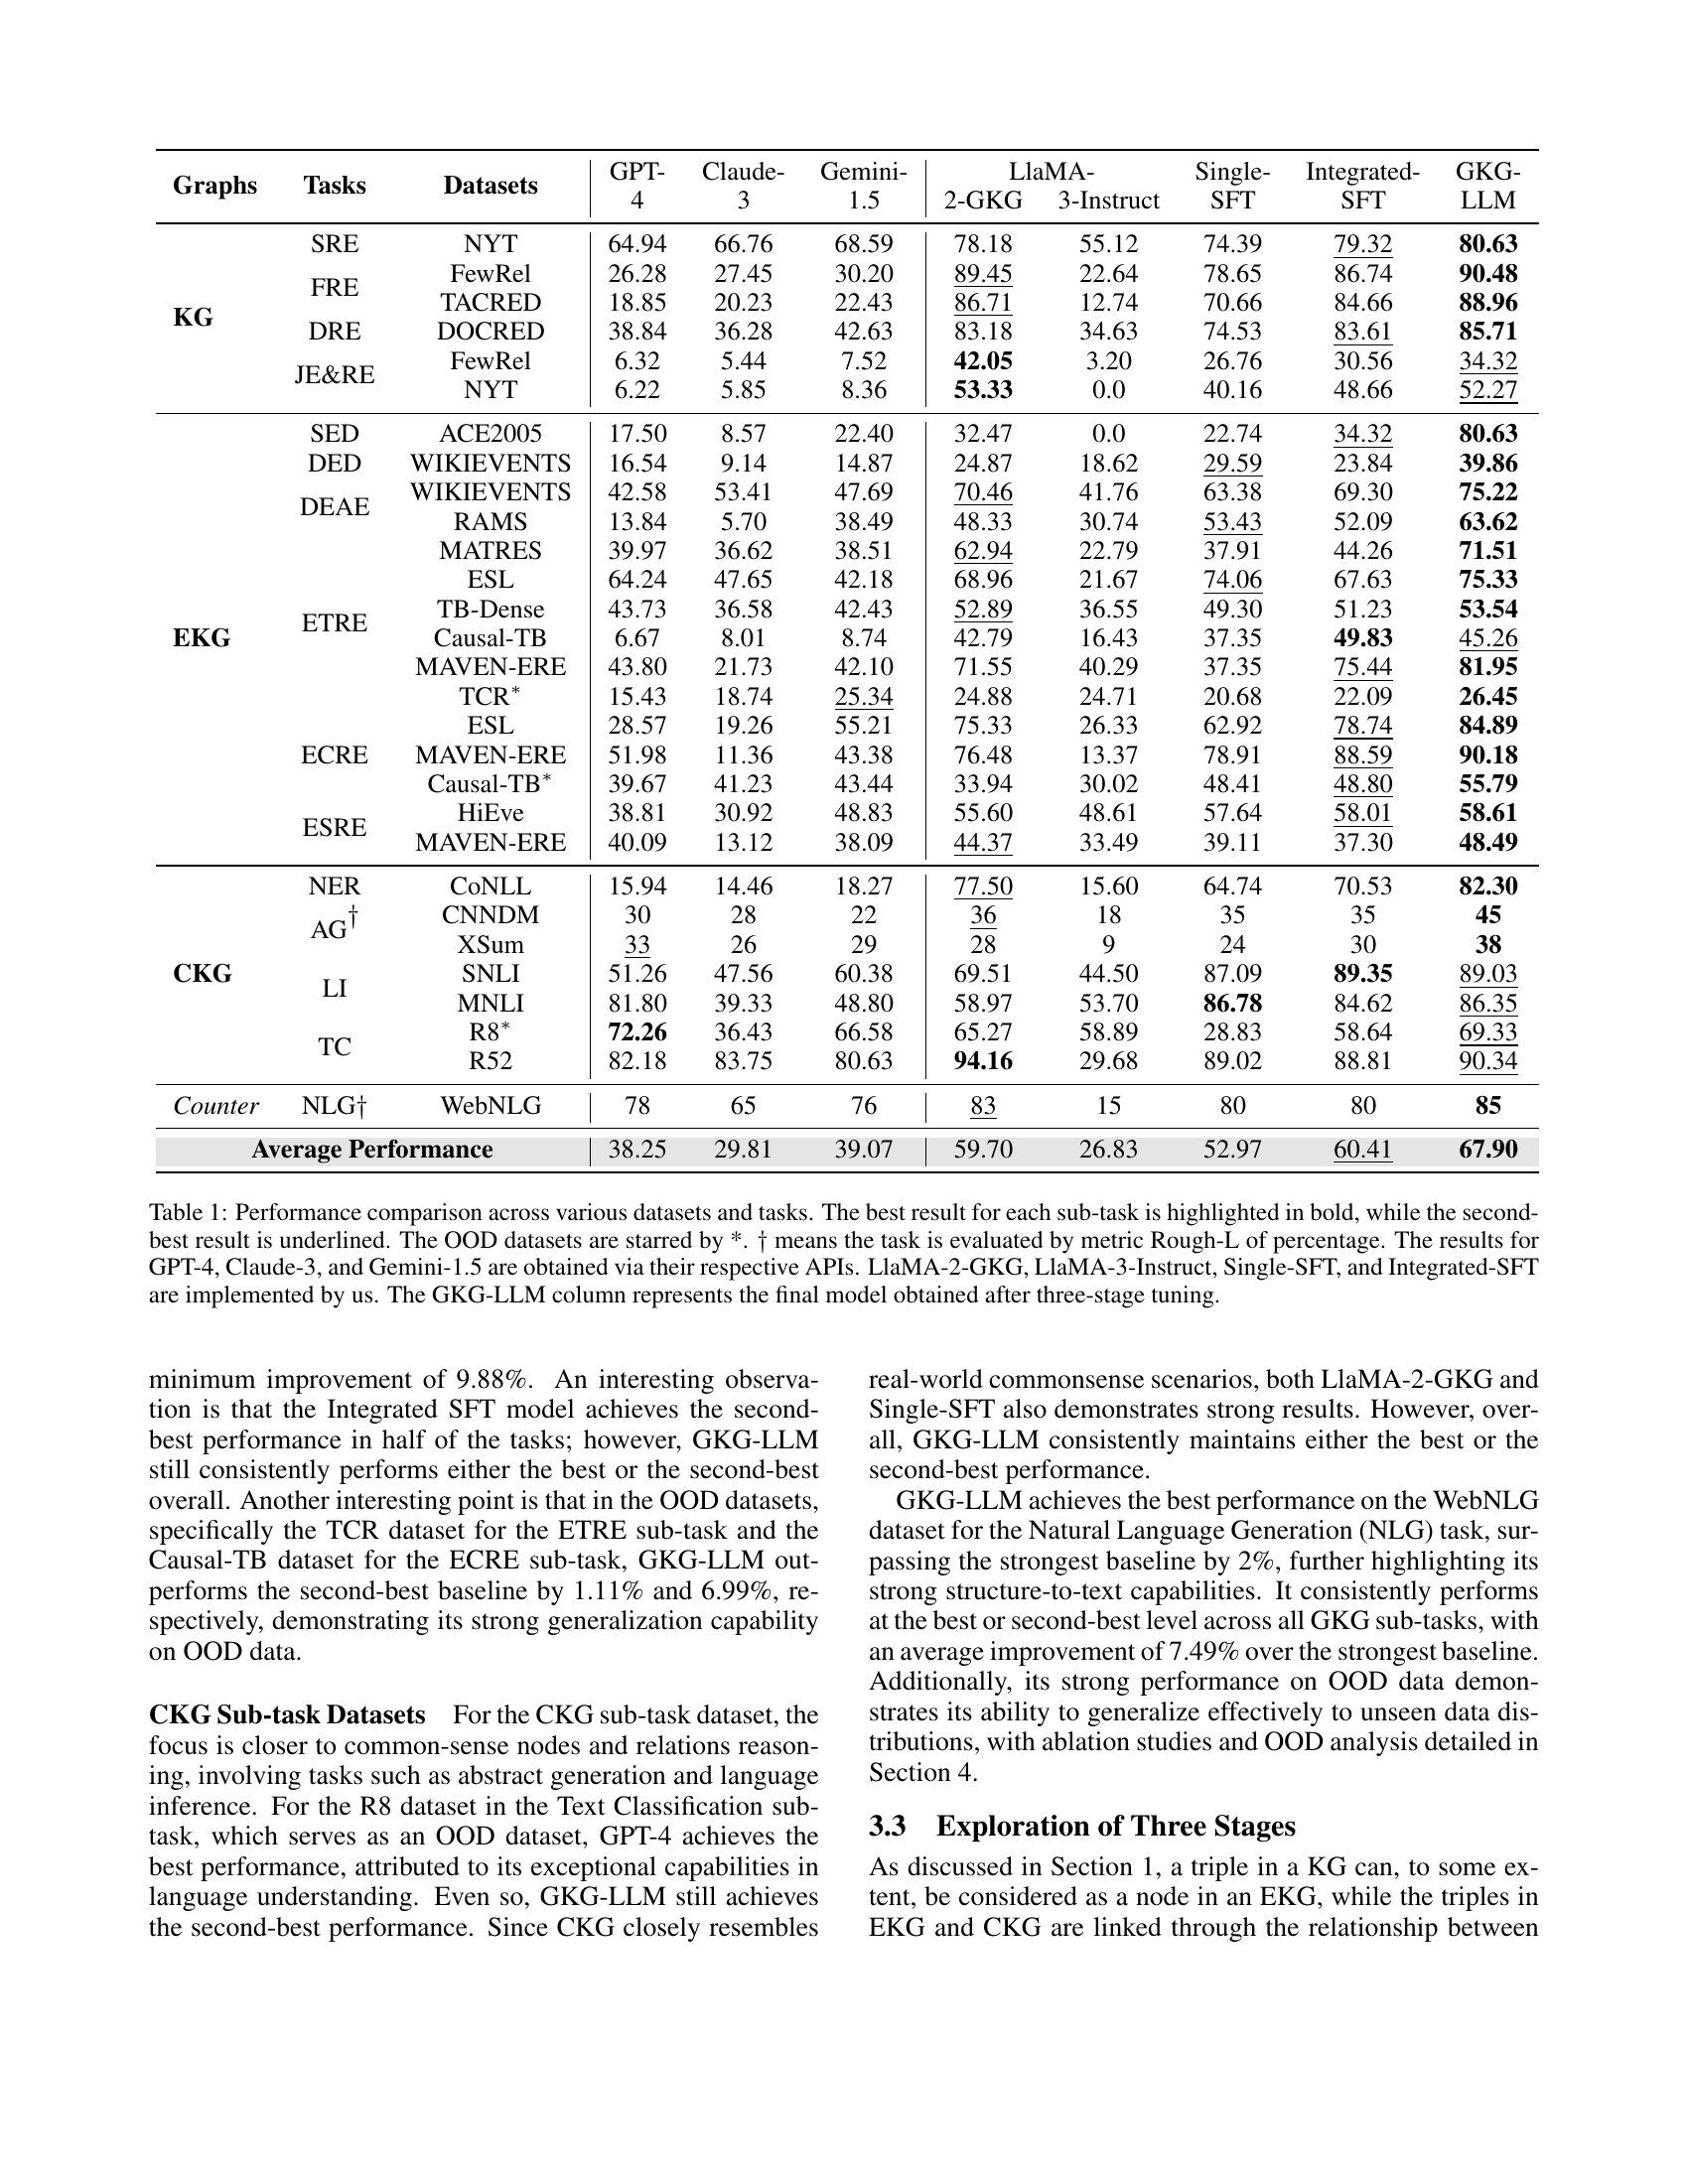
🔼 This figure displays the average performance across all tasks for three different fine-tuning orders: K-E-C (KG, EKG, then CKG), K-C-E (KG, CKG, then EKG), E-K-C (EKG, KG, then CKG), E-C-K (EKG, CKG, then KG), C-K-E (CKG, KG, then EKG), and C-E-K (CKG, EKG, then KG). The results show varying performance across the different sequences, demonstrating the impact of the chosen order on overall model performance. The K-E-C sequence used in the main study demonstrates the best overall performance, supporting the study’s methodology and indicating that a progressive training approach, starting with simpler knowledge graphs and progressing to more complex ones, yields the best results.
read the caption
Figure 4: Results of different fine-tuning orders. “K-E-C” means the fine-tuning order is KG, EKG and CKG. The following sets of experiments are similar to this one.

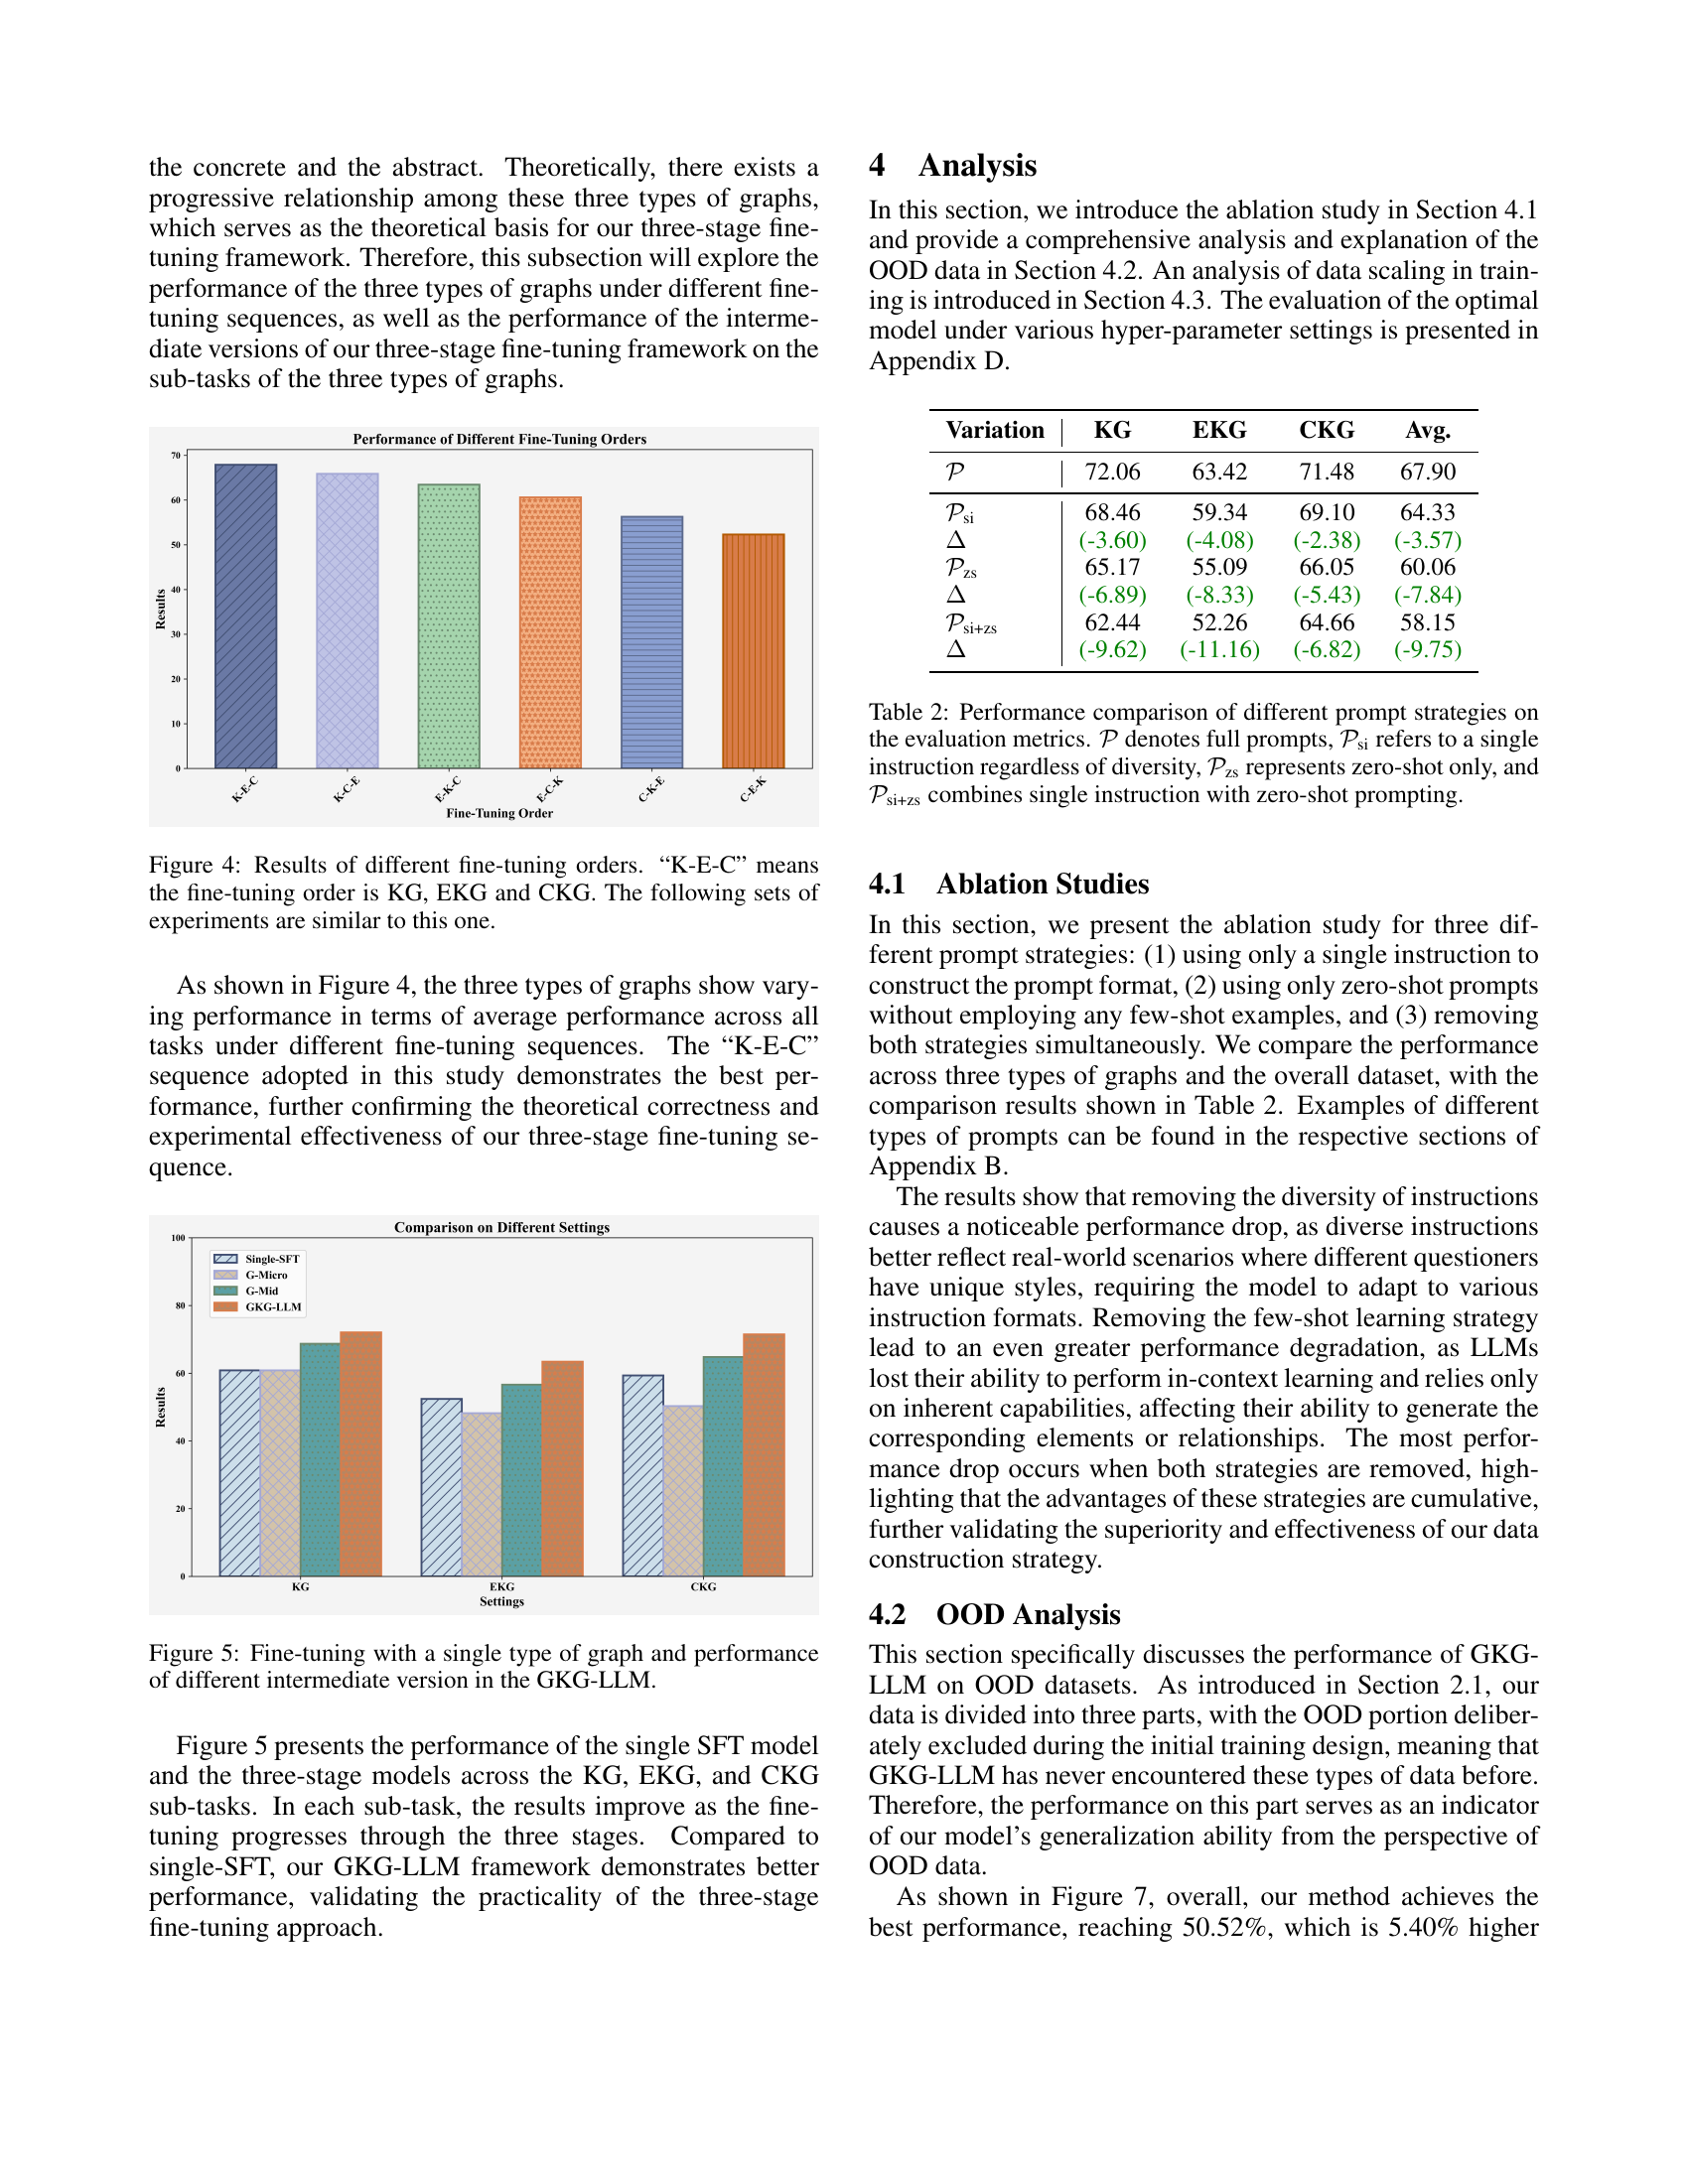
🔼 Figure 5 displays the performance comparison between using a single type of graph for fine-tuning and the three-stage fine-tuning approach of GKG-LLM. The graph shows performance across KG, EKG, and CKG sub-tasks. It demonstrates that the three-stage curriculum learning process (KG empowerment, EKG enhancement, CKG generalization) progressively improves the model’s capability across all three graph types, significantly outperforming the single-graph fine-tuning method.
read the caption
Figure 5: Fine-tuning with a single type of graph and performance of different intermediate version in the GKG-LLM.

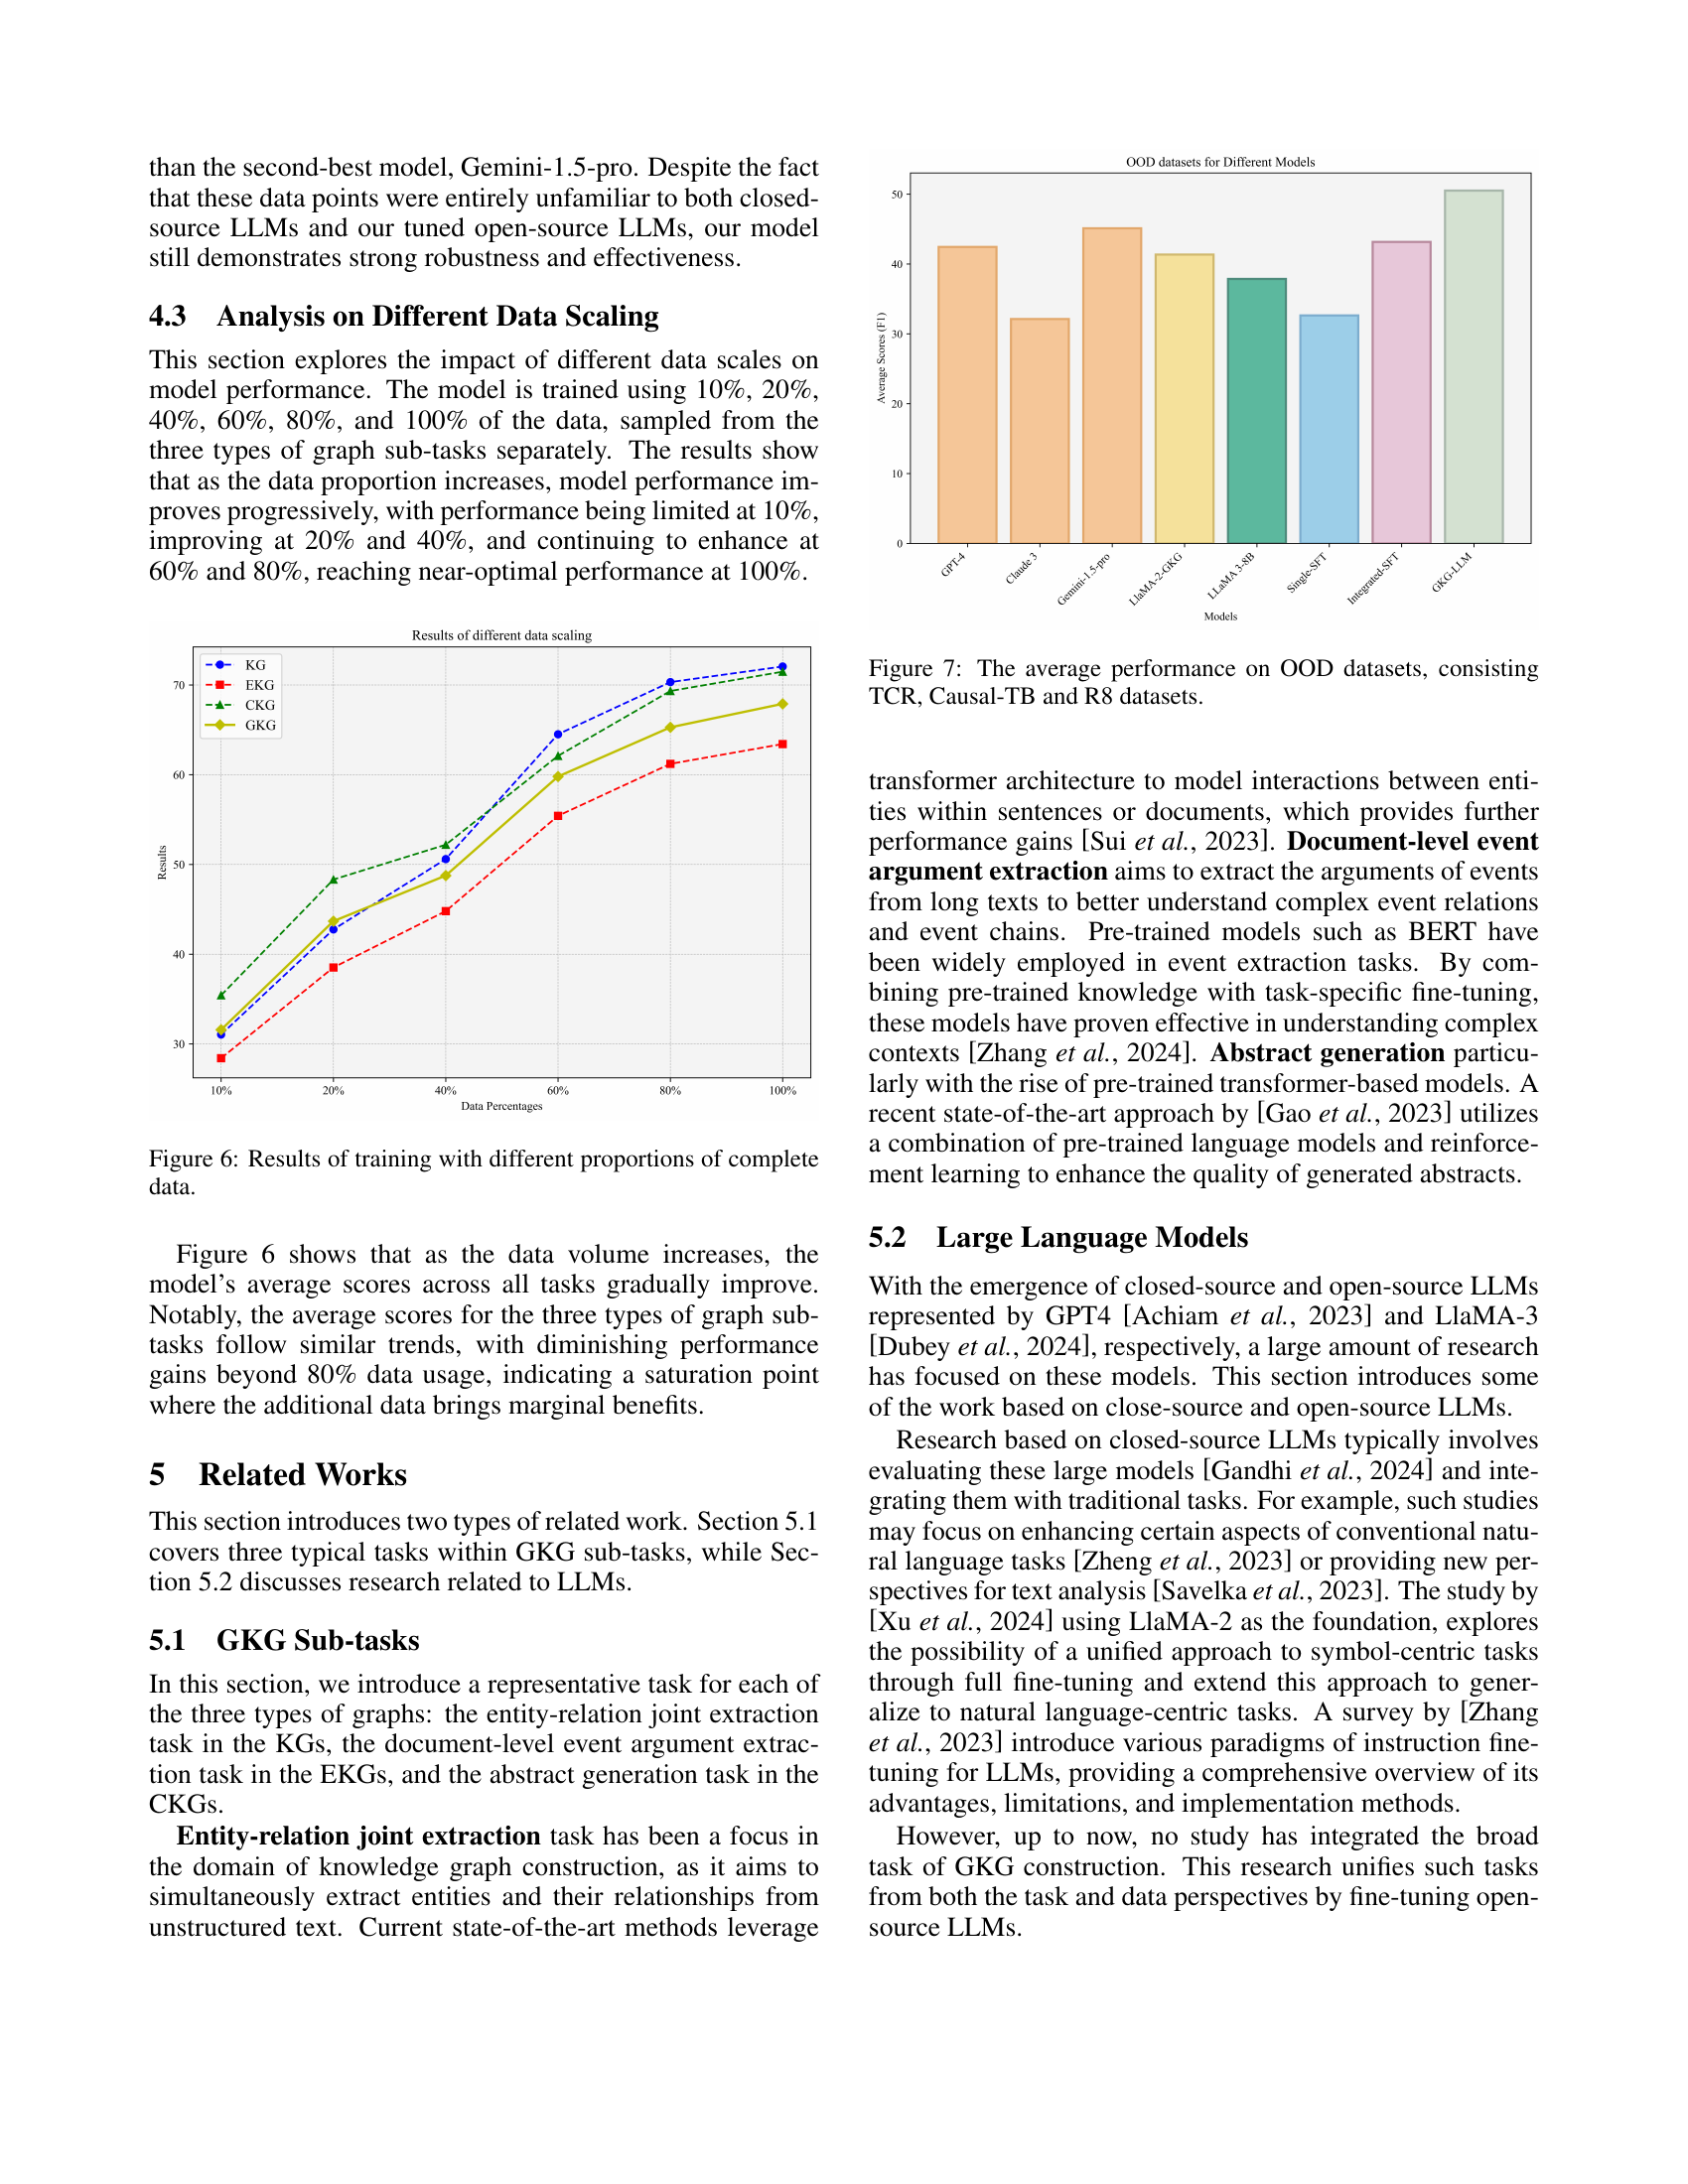
🔼 This figure displays the impact of varying training dataset sizes on the model’s performance. The x-axis represents the percentage of the complete dataset used for training (10%, 20%, 40%, 60%, 80%, and 100%). The y-axis shows the average F1 score achieved across all tasks. The figure demonstrates the relationship between the amount of training data and the model’s performance across three types of knowledge graph sub-tasks (KG, EKG, CKG), and an overall GKG average. It helps illustrate the point of diminishing returns in terms of performance gain as training data increases.
read the caption
Figure 6: Results of training with different proportions of complete data.

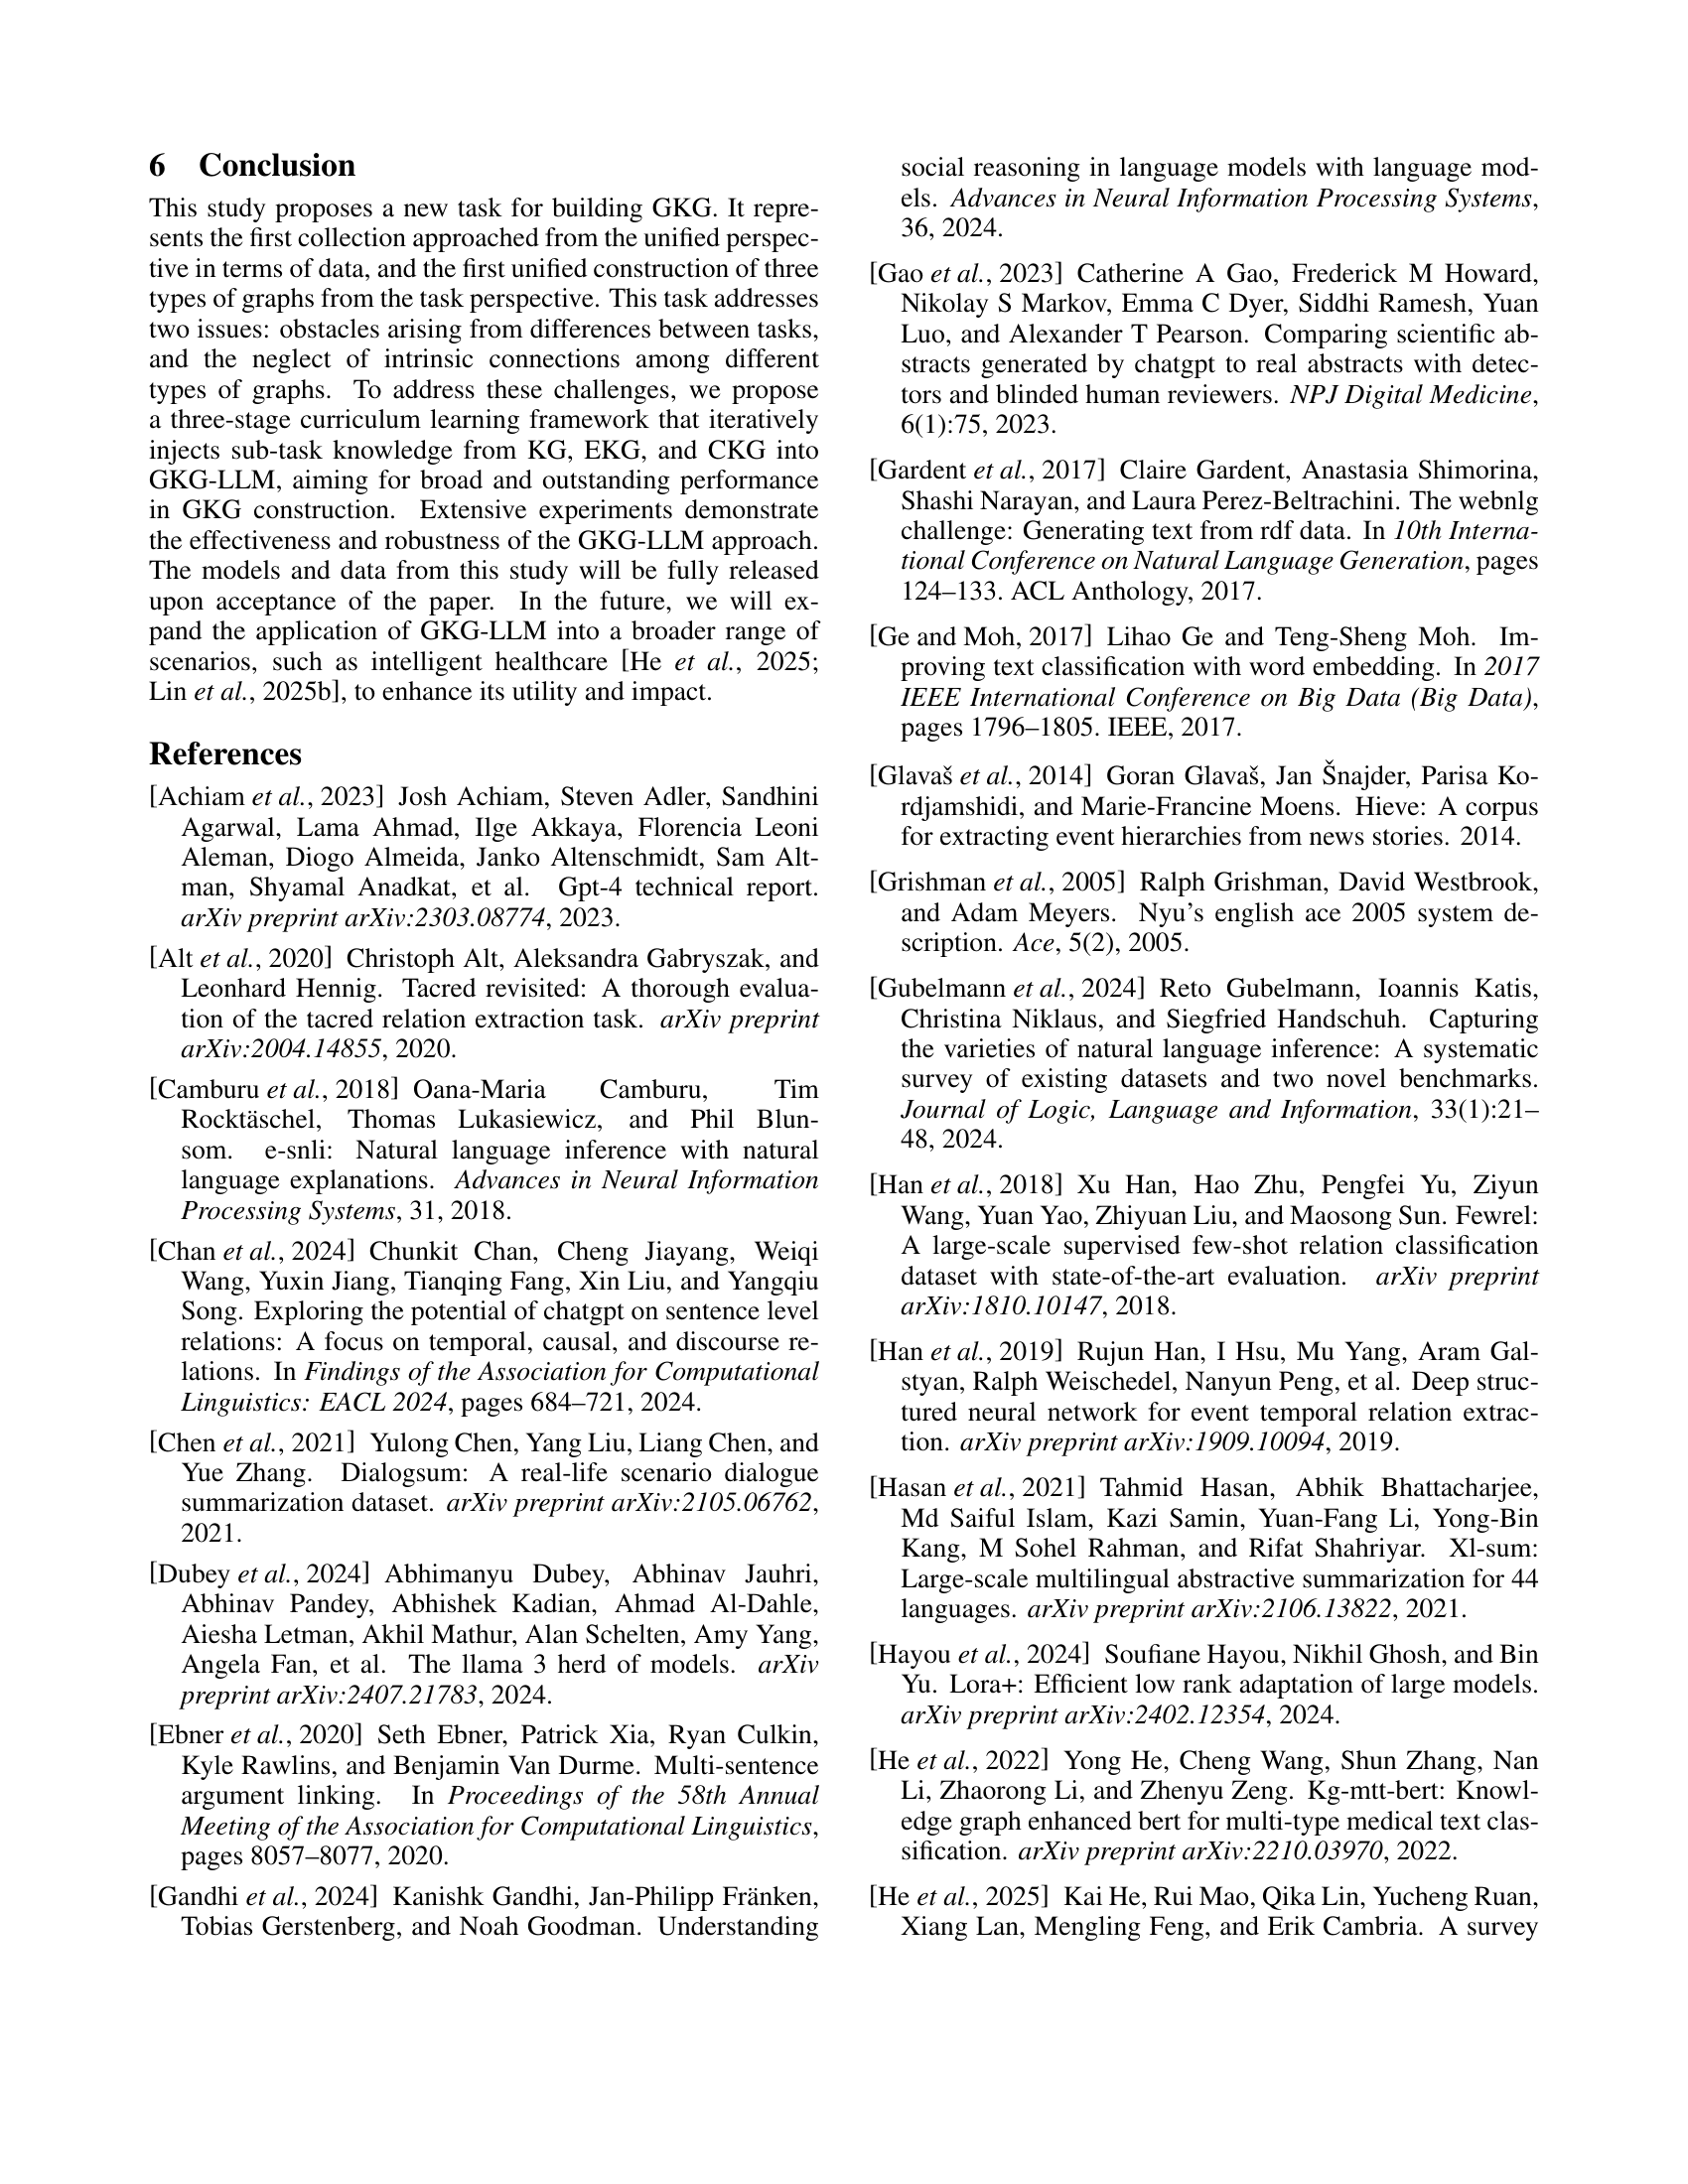
🔼 Figure 7 presents the average performance of various models on out-of-distribution (OOD) datasets. The OOD datasets used are TCR, Causal-TB, and R8, each representing a distinct and challenging test scenario. The figure displays the average F1 score (or other relevant metric) achieved by each model on these three datasets, allowing for a direct comparison of their robustness and generalization capabilities in handling unseen data.
read the caption
Figure 7: The average performance on OOD datasets, consisting TCR, Causal-TB and R8 datasets.

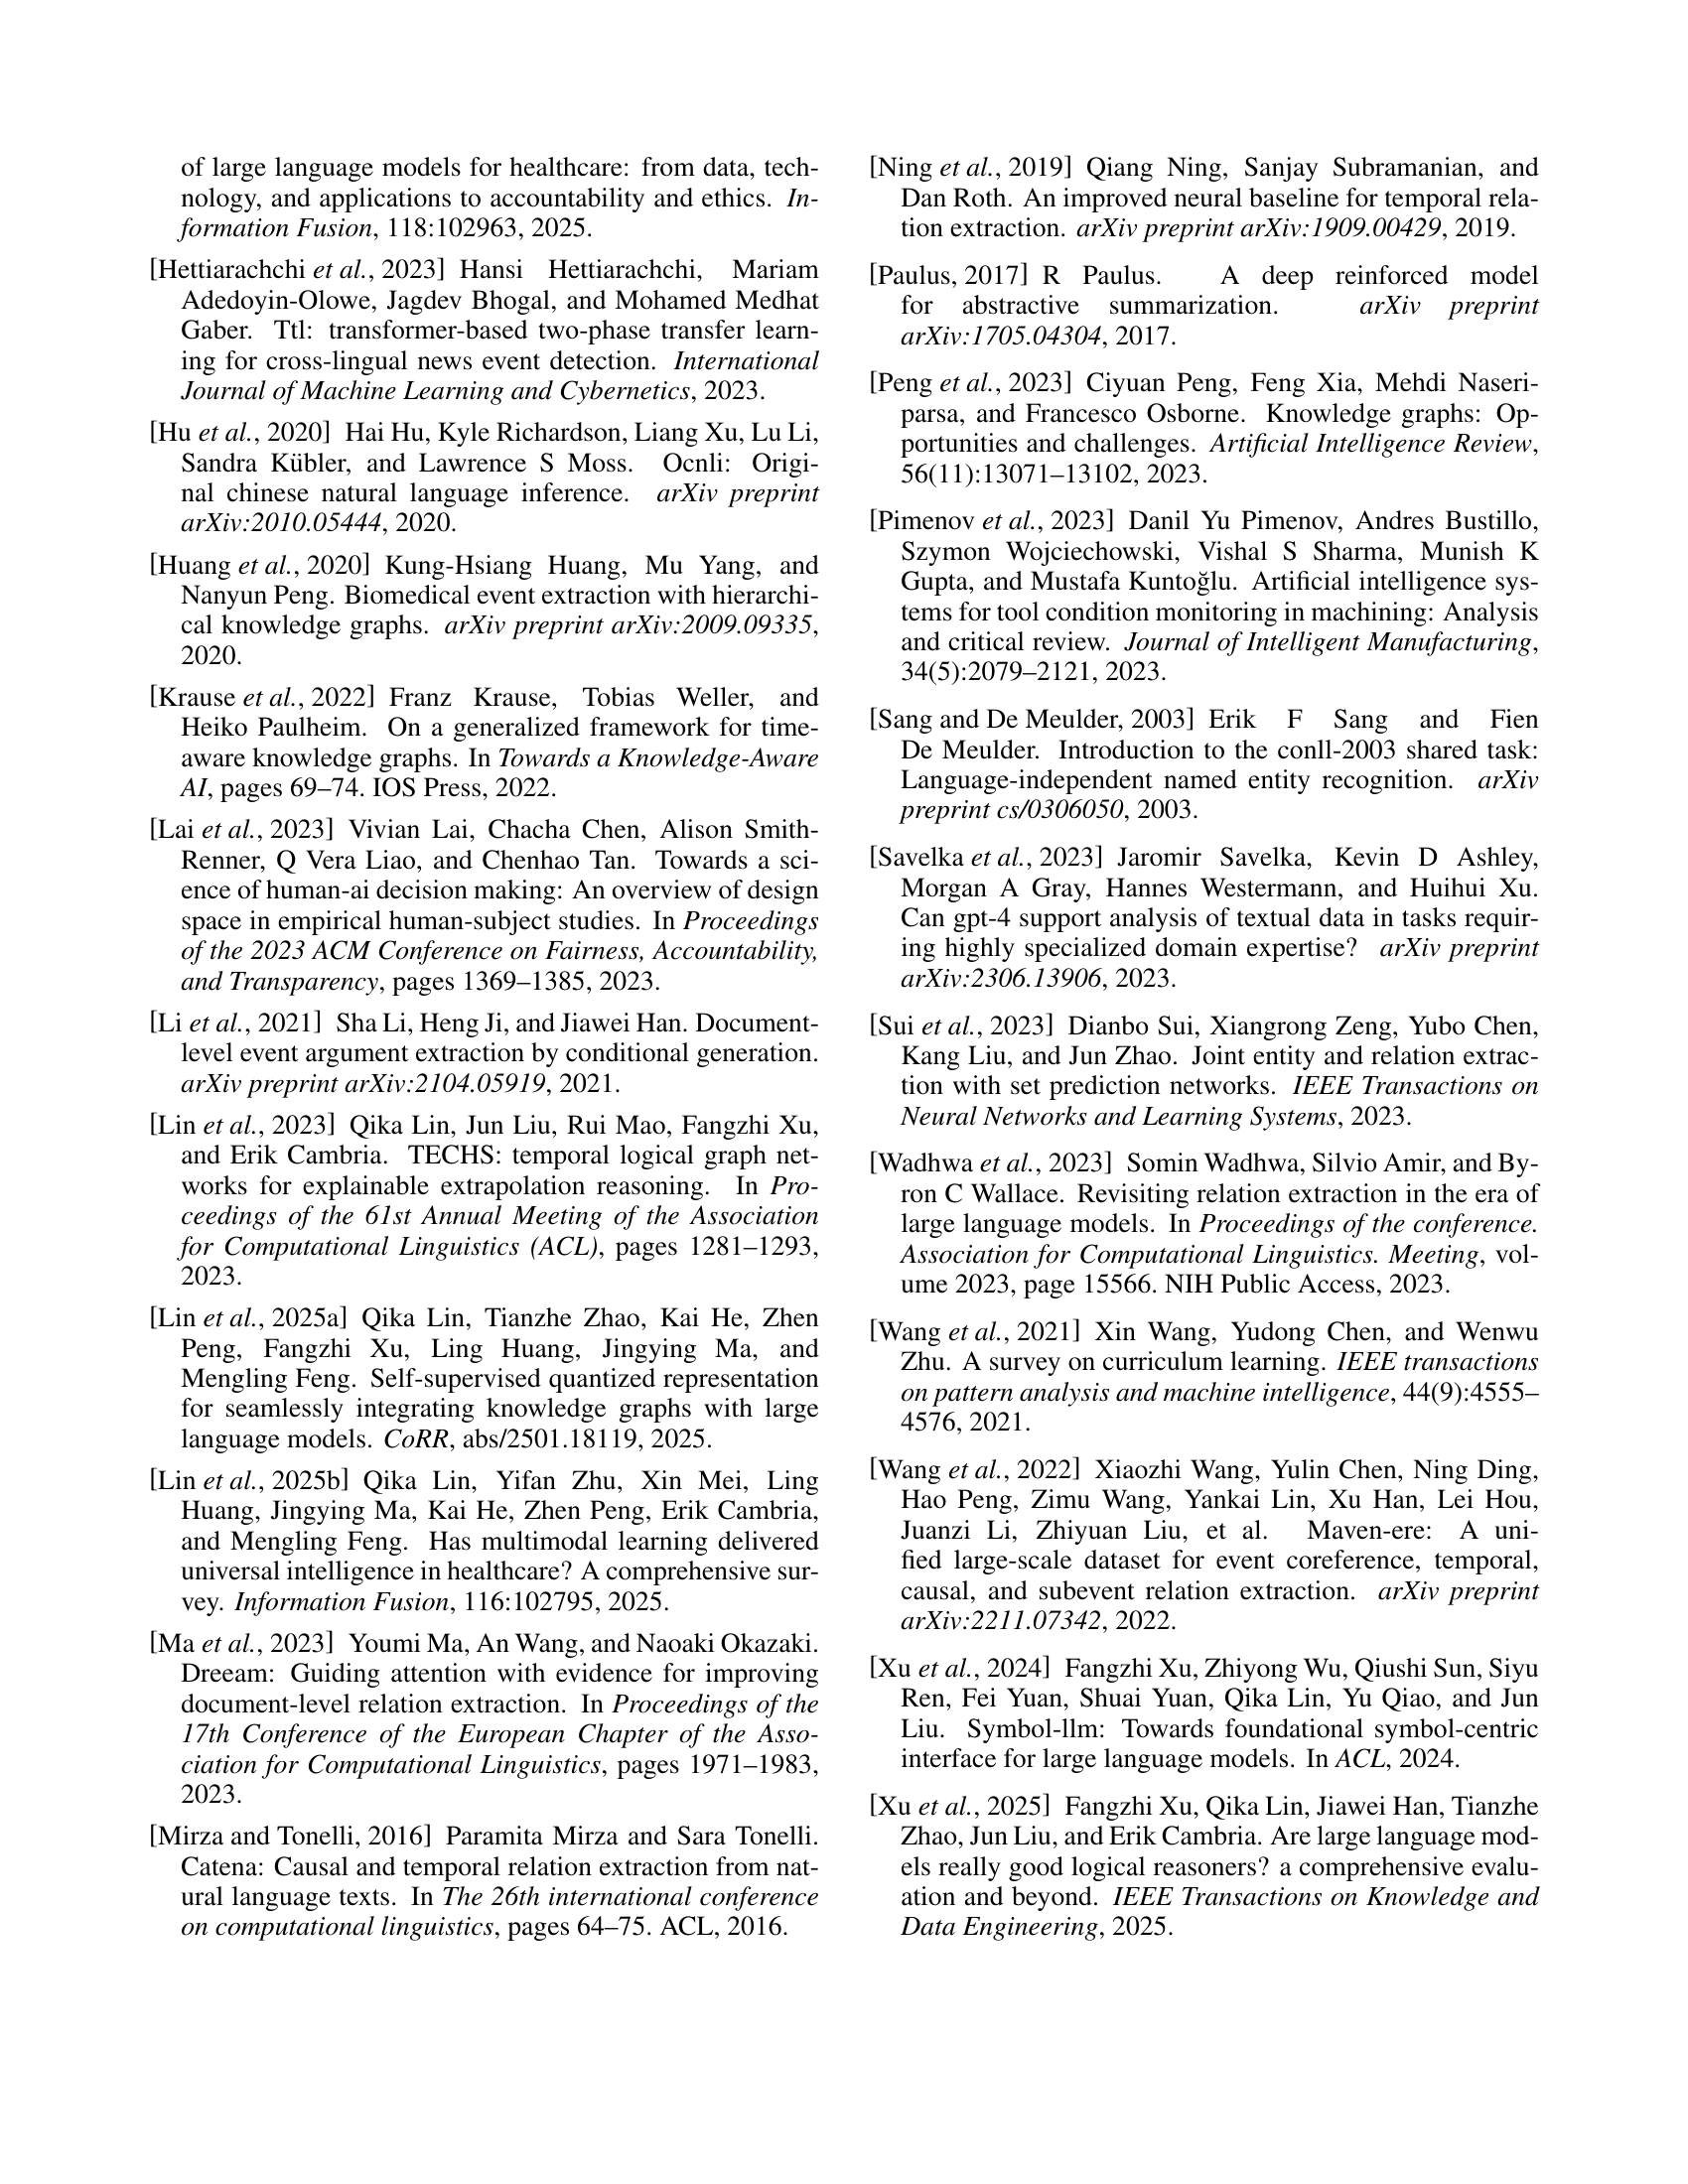
🔼 Figure 8 shows an example data entry from the WIKIEVENTS dataset, illustrating the standardized format used throughout the paper. Each data entry consists of five key fields: ‘ID’ uniquely identifies the specific data point; ‘instruction’ provides the task instructions given to the model; ‘few-shot/zero-shot’ indicates whether few-shot learning examples were provided; ‘input’ contains the input data given to the model for processing; and ‘output’ shows the expected output or ground truth. This standardized format enables the unified processing of diverse sub-tasks within the generalized knowledge graph (GKG) construction framework.
read the caption
Figure 8: An example from the WIKEVENTS dataset. It consists of five fields ID𝐼𝐷IDitalic_I italic_D, instruction sisubscript𝑠𝑖s_{i}italic_s start_POSTSUBSCRIPT italic_i end_POSTSUBSCRIPT, few-shot fs𝑓𝑠fsitalic_f italic_s / zero-shot zs𝑧𝑠zsitalic_z italic_s , input xisubscript𝑥𝑖x_{i}italic_x start_POSTSUBSCRIPT italic_i end_POSTSUBSCRIPT, and output yisubscript𝑦𝑖y_{i}italic_y start_POSTSUBSCRIPT italic_i end_POSTSUBSCRIPT.

🔼 Figure 9 displays a bar chart comparing the performance of three different model training strategies against the performance of the GKG-LLM model. The three strategies represent progressively more complex training approaches. The chart shows the average F1 scores achieved on three different types of knowledge graph sub-tasks (KG, EKG, CKG) for each model. This helps visualize how a three-stage curriculum learning approach enhances the model’s ability to handle various tasks compared to single-stage training methods.
read the caption
Figure 9: Comparison of Results by different settings and GKG-LLM.

🔼 This heatmap visualizes the performance of the GKG-LLM model under different hyperparameter settings for the LoRA+ fine-tuning technique. The x-axis represents the value of ηB (eta_B), and the y-axis represents the value of ηA (eta_A). Each cell in the heatmap shows the model’s performance (likely F1-score or accuracy) on the GKG construction task under the corresponding ηA and ηB values. The color intensity represents the performance level, with darker colors indicating better performance. This figure is crucial for determining the optimal hyperparameter combination to maximize the model’s effectiveness.
read the caption
Figure 10: Heatmap of Scores for Different ηAsubscript𝜂𝐴\eta_{A}italic_η start_POSTSUBSCRIPT italic_A end_POSTSUBSCRIPT and ηBsubscript𝜂𝐵\eta_{B}italic_η start_POSTSUBSCRIPT italic_B end_POSTSUBSCRIPT Values for our training strategy.
More on tables
| Variation | KG | EKG | CKG | Avg. |
|---|---|---|---|---|
| 72.06 | 63.42 | 71.48 | 67.90 | |
| 68.46 | 59.34 | 69.10 | 64.33 | |
| (-3.60) | (-4.08) | (-2.38) | (-3.57) | |
| 65.17 | 55.09 | 66.05 | 60.06 | |
| (-6.89) | (-8.33) | (-5.43) | (-7.84) | |
| 62.44 | 52.26 | 64.66 | 58.15 | |
| (-9.62) | (-11.16) | (-6.82) | (-9.75) |
🔼 This table compares the performance of four different prompting strategies on various tasks. The strategies are: using full prompts (𝒫), a single instruction regardless of diversity (𝒫si), zero-shot prompting only (𝒫zs), and combining a single instruction with zero-shot prompting (𝒫si+zs). The results are presented in terms of evaluation metrics (specified elsewhere in the paper) for each prompt strategy, showing how different instruction methods impact model performance.
read the caption
Table 2: Performance comparison of different prompt strategies on the evaluation metrics. 𝒫𝒫\mathcal{P}caligraphic_P denotes full prompts, 𝒫sisubscript𝒫si\mathcal{P}_{\text{si}}caligraphic_P start_POSTSUBSCRIPT si end_POSTSUBSCRIPT refers to a single instruction regardless of diversity, 𝒫zssubscript𝒫zs\mathcal{P}_{\text{zs}}caligraphic_P start_POSTSUBSCRIPT zs end_POSTSUBSCRIPT represents zero-shot only, and 𝒫si+zssubscript𝒫si+zs\mathcal{P}_{\text{si+zs}}caligraphic_P start_POSTSUBSCRIPT si+zs end_POSTSUBSCRIPT combines single instruction with zero-shot prompting.
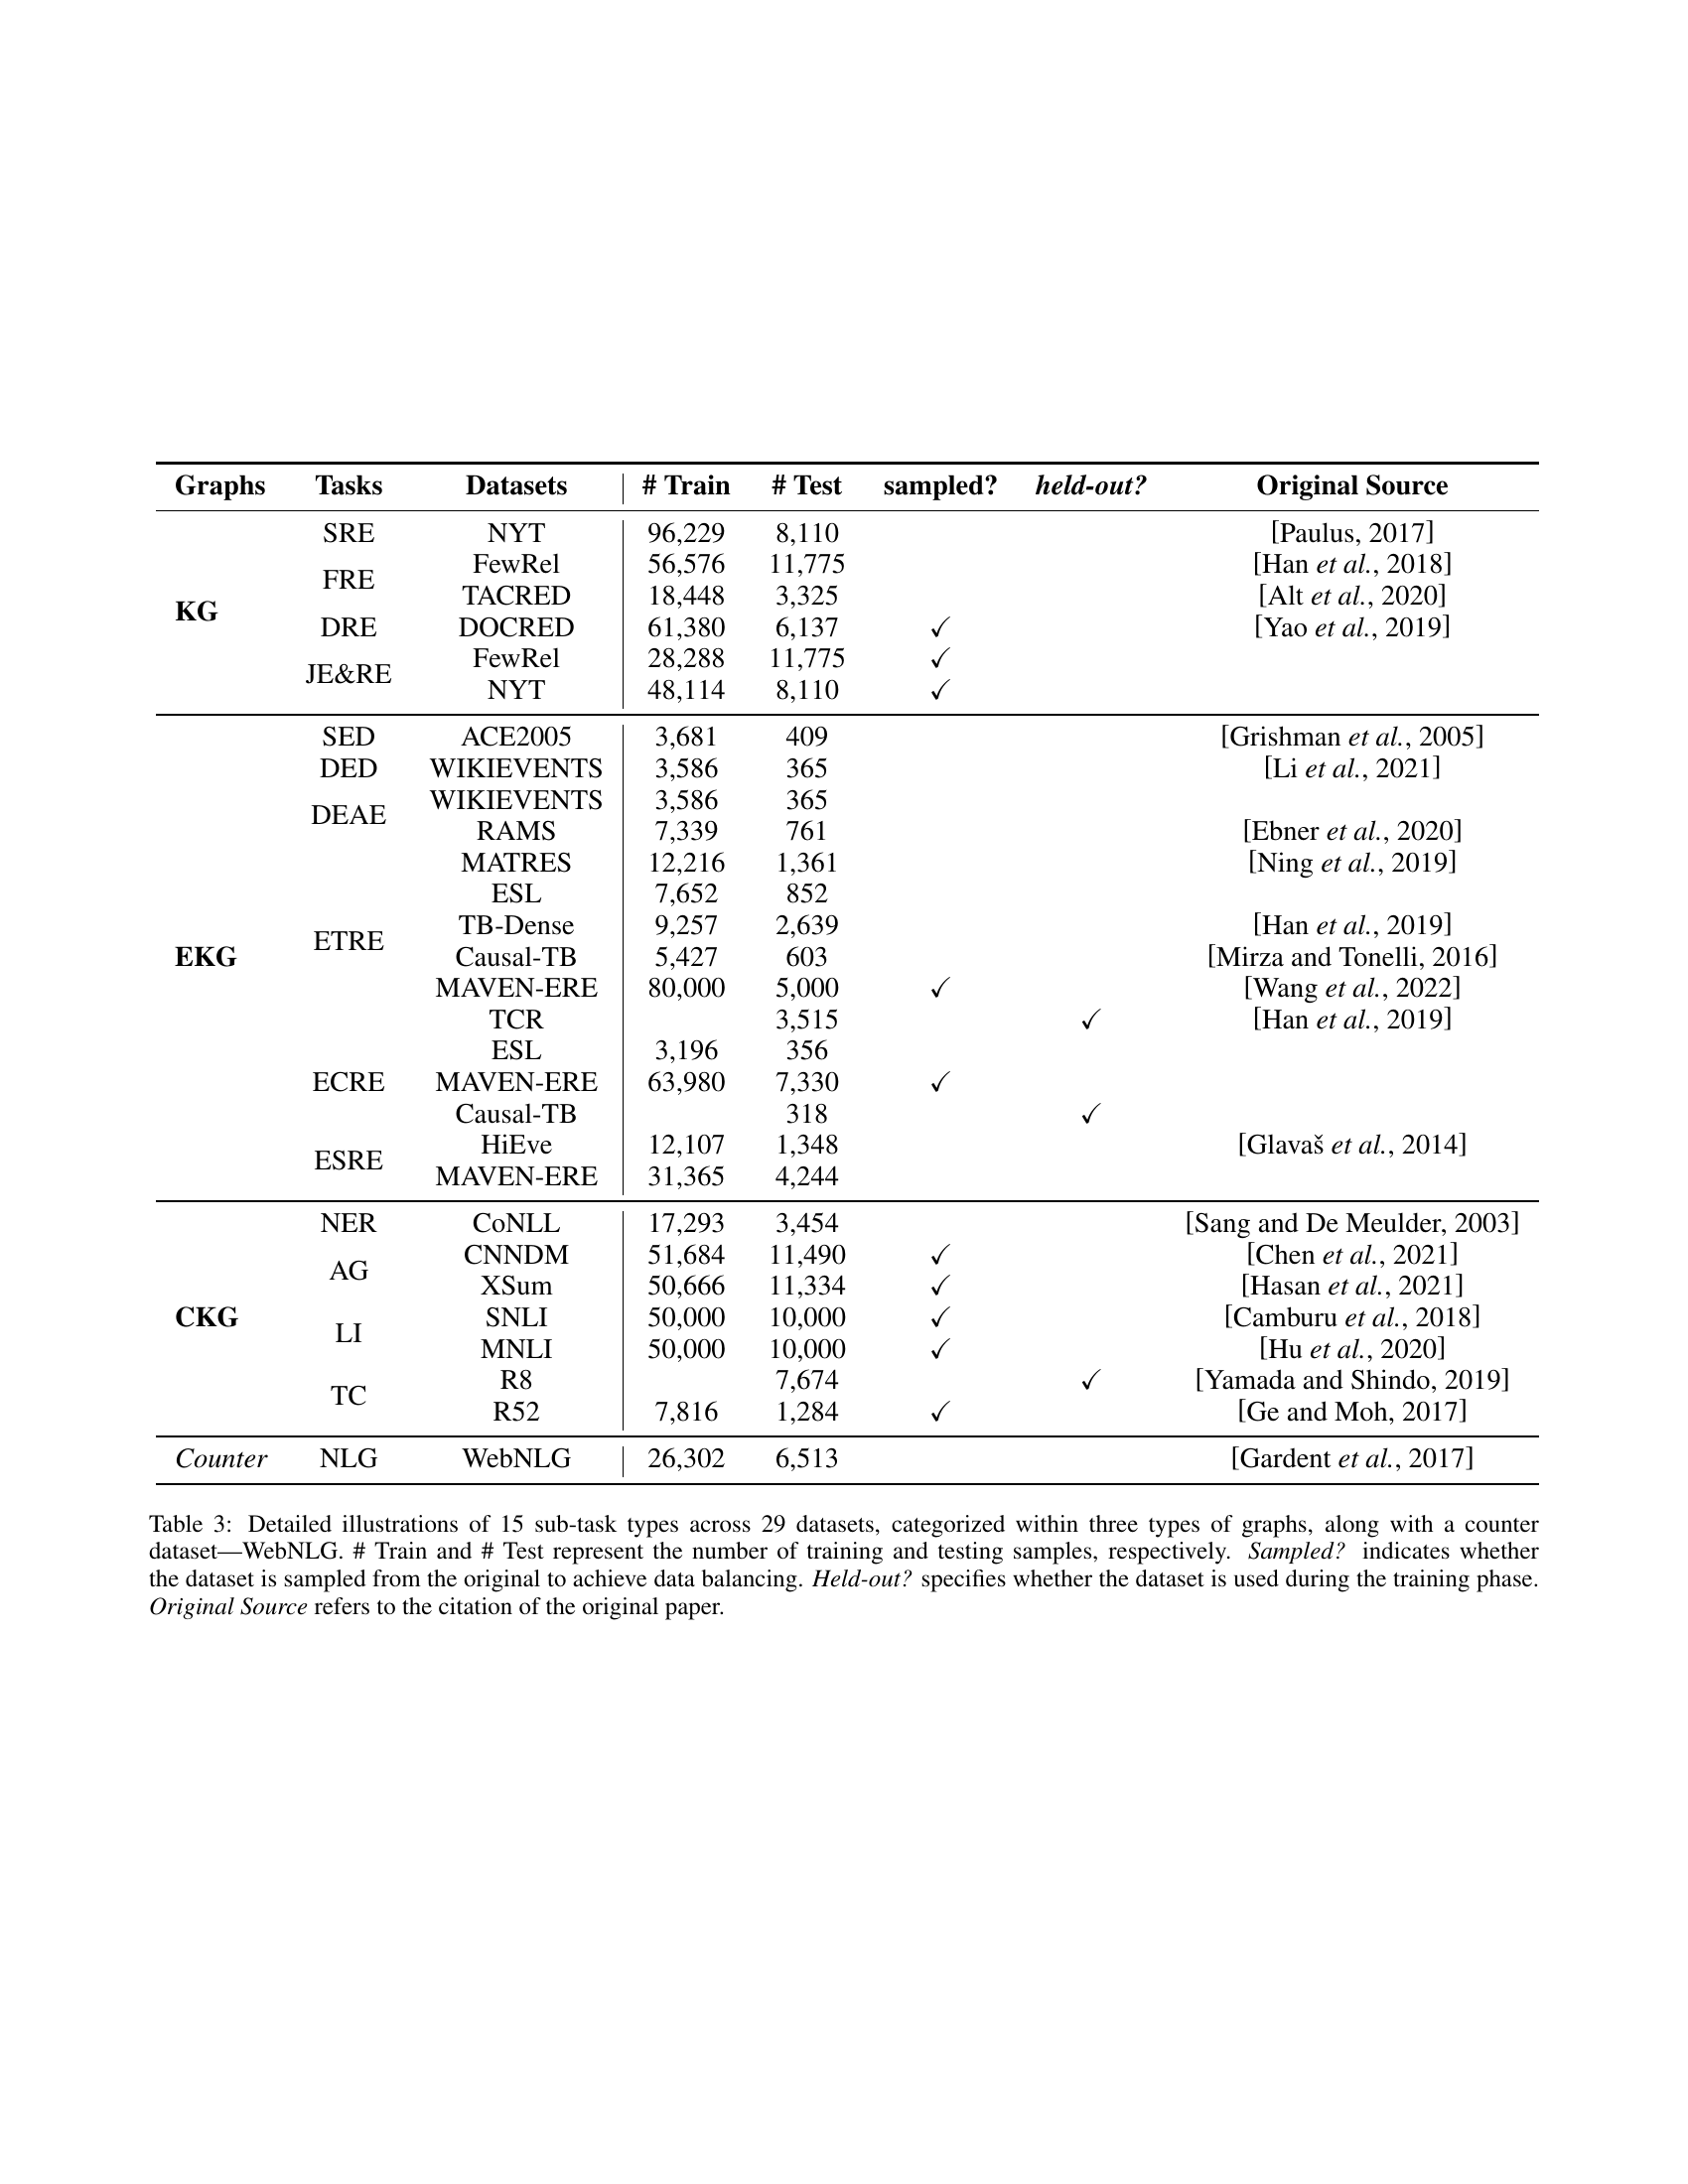
| Graphs | Tasks | Datasets | # Train | # Test | sampled? | held-out? | Original Source |
| KG | SRE | NYT | 96,229 | 8,110 | Paulus [2017] | ||
| FRE | FewRel | 56,576 | 11,775 | Han et al. [2018] | |||
| TACRED | 18,448 | 3,325 | Alt et al. [2020] | ||||
| DRE | DOCRED | 61,380 | 6,137 | ✓ | Yao et al. [2019] | ||
| JE&RE | FewRel | 28,288 | 11,775 | ✓ | |||
| NYT | 48,114 | 8,110 | ✓ | ||||
| EKG | SED | ACE2005 | 3,681 | 409 | Grishman et al. [2005] | ||
| DED | WIKIEVENTS | 3,586 | 365 | Li et al. [2021] | |||
| DEAE | WIKIEVENTS | 3,586 | 365 | ||||
| RAMS | 7,339 | 761 | Ebner et al. [2020] | ||||
| ETRE | MATRES | 12,216 | 1,361 | Ning et al. [2019] | |||
| ESL | 7,652 | 852 | |||||
| TB-Dense | 9,257 | 2,639 | Han et al. [2019] | ||||
| Causal-TB | 5,427 | 603 | Mirza and Tonelli [2016] | ||||
| MAVEN-ERE | 80,000 | 5,000 | ✓ | Wang et al. [2022] | |||
| TCR | 3,515 | ✓ | Han et al. [2019] | ||||
| ECRE | ESL | 3,196 | 356 | ||||
| MAVEN-ERE | 63,980 | 7,330 | ✓ | ||||
| Causal-TB | 318 | ✓ | |||||
| ESRE | HiEve | 12,107 | 1,348 | Glavaš et al. [2014] | |||
| MAVEN-ERE | 31,365 | 4,244 | |||||
| CKG | NER | CoNLL | 17,293 | 3,454 | Sang and De Meulder [2003] | ||
| AG | CNNDM | 51,684 | 11,490 | ✓ | Chen et al. [2021] | ||
| XSum | 50,666 | 11,334 | ✓ | Hasan et al. [2021] | |||
| LI | SNLI | 50,000 | 10,000 | ✓ | Camburu et al. [2018] | ||
| MNLI | 50,000 | 10,000 | ✓ | Hu et al. [2020] | |||
| TC | R8 | 7,674 | ✓ | Yamada and Shindo [2019] | |||
| R52 | 7,816 | 1,284 | ✓ | Ge and Moh [2017] | |||
| Counter | NLG | WebNLG | 26,302 | 6,513 | Gardent et al. [2017] |
🔼 This table details the datasets used in the paper, categorized by graph type (KG, EKG, CKG) and sub-task. It shows the number of training and testing samples for each dataset, whether the dataset was sampled to balance the data, whether it was held out (not used during training), and the original source of the dataset.
read the caption
Table 3: Detailed illustrations of 15 sub-task types across 29 datasets, categorized within three types of graphs, along with a counter dataset—WebNLG. # Train and # Test represent the number of training and testing samples, respectively. Sampled? indicates whether the dataset is sampled from the original to achieve data balancing. Held-out? specifies whether the dataset is used during the training phase. Original Source refers to the citation of the original paper.
Full paper#