TL;DR#
Reasoning in large language models (LLMs) is crucial for complex tasks, yet identifying process errors remains a challenge. Current process-level reward models (PRMs) benchmarks are text-based and focus on error detection, overlooking reasoning search scenarios. To address this gap, the paper introduces a comprehensive, multi-task, multimodal benchmark designed to systematically assess the effectiveness of PRMs in diverse scenarios.
The paper introduces MPBench, which employs three evaluation paradigms targeting specific roles of PRMs: Step Correctness, Answer Aggregation, and Reasoning Process Search. MPBench includes 9,745 fine-grained data instances. Experiments with 12 multimodal LLMs (MLLMs), including GPT-40 and Gemini-2.0, reveal performance characteristics and guide future multimodal PRM development.
Key Takeaways#
Why does it matter?#
This paper introduces a new benchmark, addressing the gap in multimodal PRM evaluation. It enhances research by providing tools to comprehensively assess and improve reasoning in MLLMs, enabling advancements in AI.
Visual Insights#

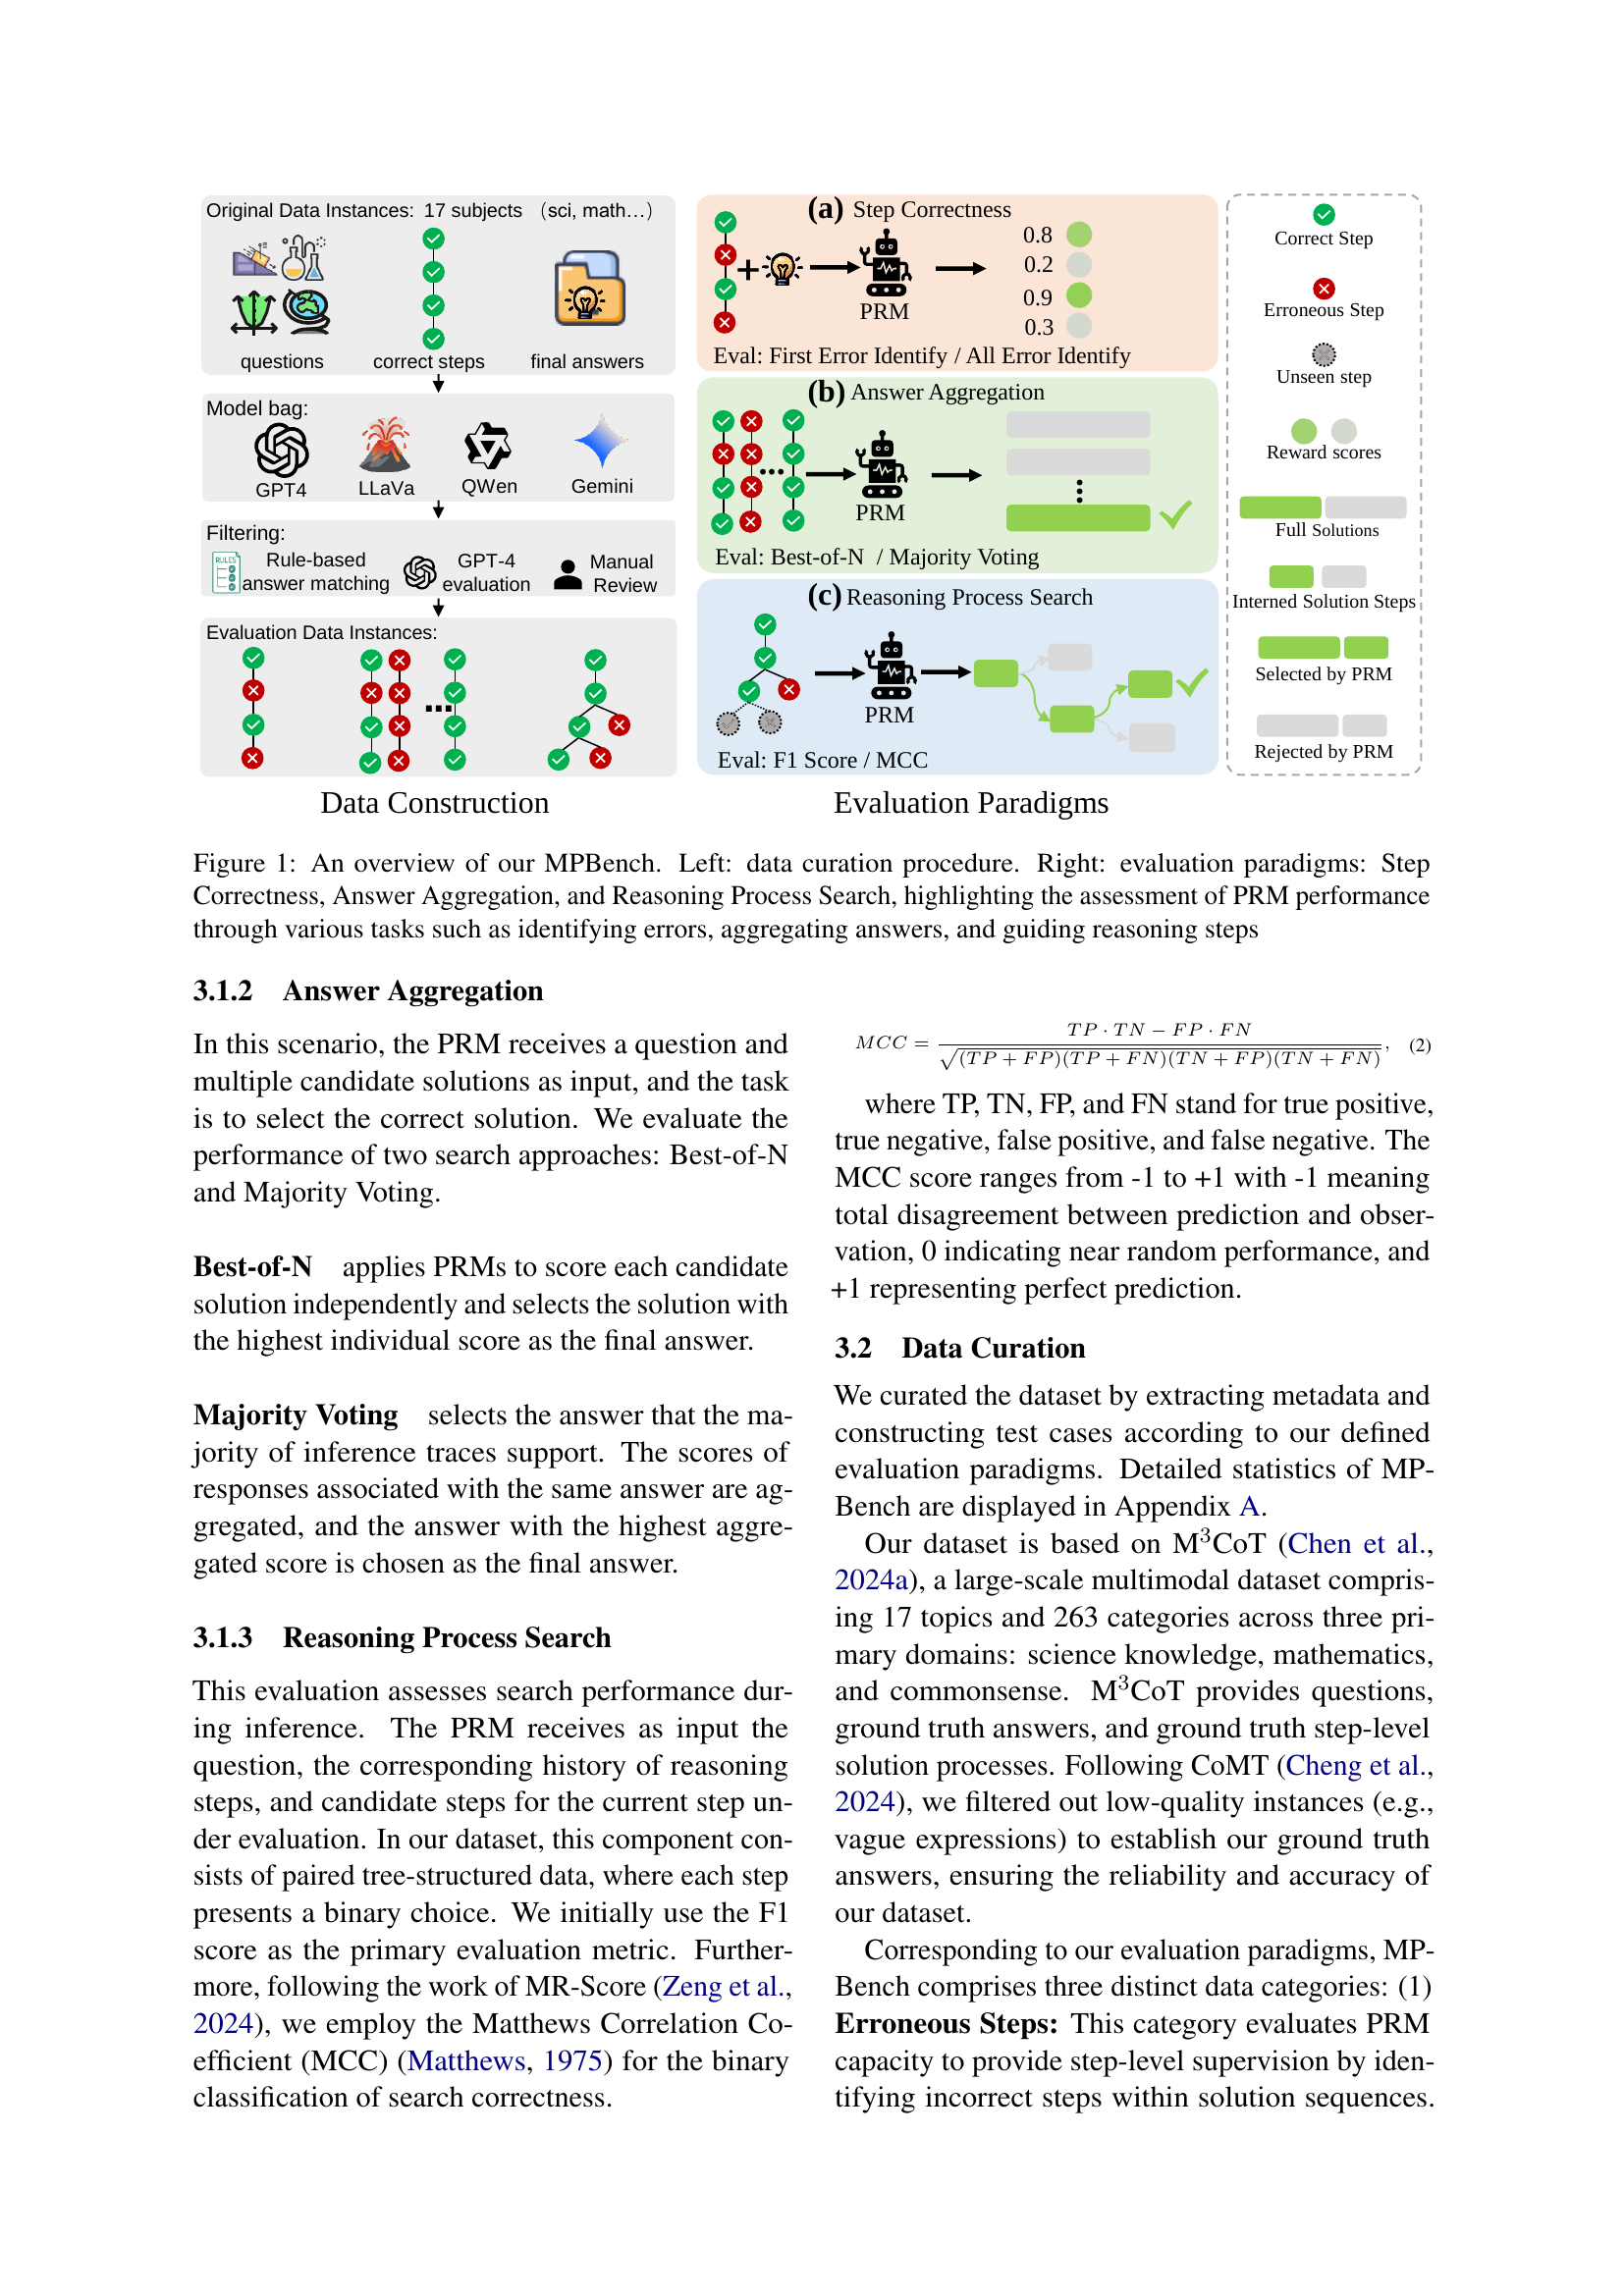
🔼 Figure 1 provides a comprehensive overview of MPBench, a novel multimodal benchmark for evaluating Process Reward Models (PRMs). The left side illustrates the data curation process, starting from original data instances (17 subjects, including science, math, and commonsense) encompassing questions, correct steps, and final answers. These undergo filtering (rule-based, GPT-4 review, and Gemini difficulty filter) and manual review to ensure quality and create evaluation data instances. The right side depicts the three core evaluation paradigms: Step Correctness (assessing the correctness of individual reasoning steps), Answer Aggregation (selecting the best solution from multiple candidates using PRM scores), and Reasoning Process Search (guiding the LLM to find optimal reasoning steps through PRM predictions). The figure highlights how MPBench systematically assesses PRM performance across these diverse scenarios, utilizing various tasks such as error identification, answer aggregation, and search guidance.
read the caption
Figure 1: An overview of our MPBench. Left: data curation procedure. Right: evaluation paradigms: Step Correctness, Answer Aggregation, and Reasoning Process Search, highlighting the assessment of PRM performance through various tasks such as identifying errors, aggregating answers, and guiding reasoning steps
|
|
|
| Annotator |
| |||||||||||
|---|---|---|---|---|---|---|---|---|---|---|---|---|---|---|---|---|
| MR-GSM8K Zeng et al. (2023) | ✗ | ✗ | 1 | ✓ | Human | 2,999 | ||||||||||
| CriticBench Lin et al. (2024) | ✗ | ✗ | 1 | ✗ | - | - | ||||||||||
| MathCheck-GSM Zhou et al. (2024) | ✗ | ✗ | 1 | ✓ | Synthetic | 516 | ||||||||||
| M3CoT Chen et al. (2024a) | ✗ | ✗ | 1 | ✓ | Human | 5,975 | ||||||||||
| ProcessBench Zheng et al. (2024) | ✓ | ✗ | 1 | ✓ | Human | 3,400 | ||||||||||
| PRMBench Song et al. (2025) | ✓ | ✗ | 1 | ✓ | Synthetic + Human | 6,216 | ||||||||||
| MPBench (Ours) | ✓ | ✓ | 3 | ✓ | Synthetic + Human | 9,745 |
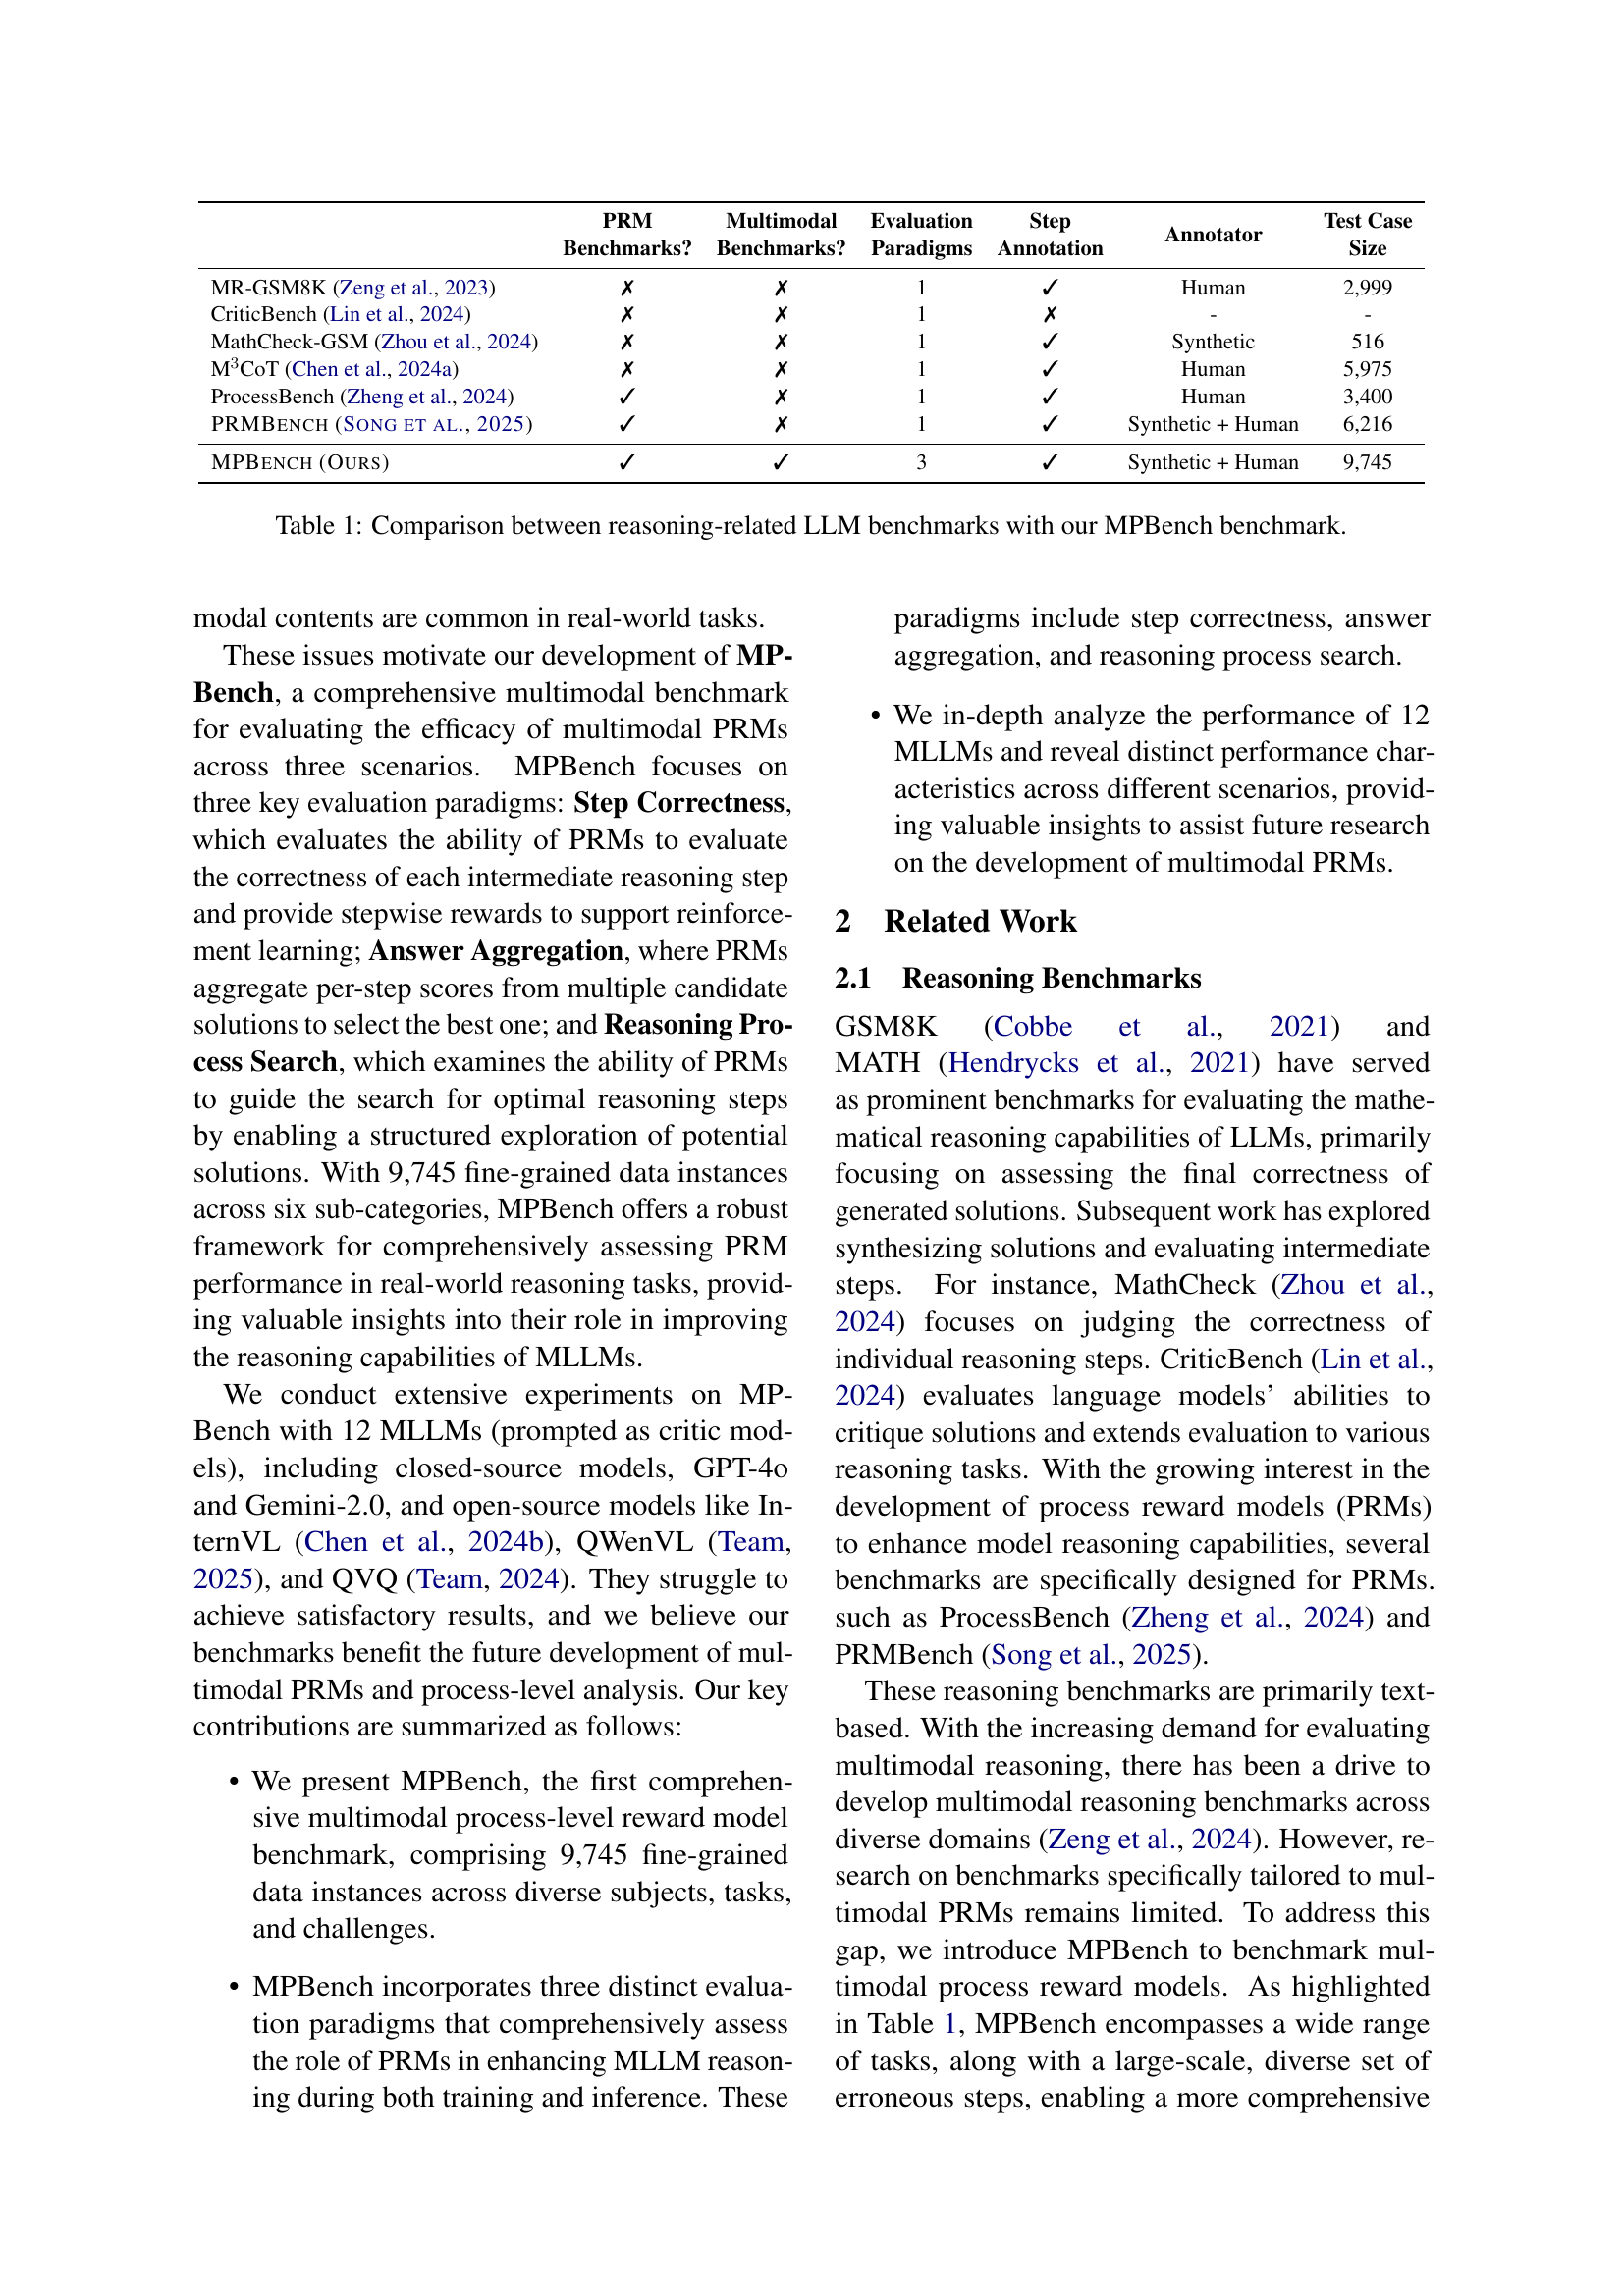
🔼 This table compares various reasoning-related Large Language Model (LLM) benchmarks, highlighting key differences and similarities. It covers aspects such as whether the benchmark is multimodal, the evaluation paradigms used, the type of annotation (human vs. synthetic), and the number of test cases. This allows for a direct comparison with the newly proposed MPBench, showcasing its unique strengths and how it advances beyond existing benchmarks.
read the caption
Table 1: Comparison between reasoning-related LLM benchmarks with our MPBench benchmark.
In-depth insights#
PRM Eval Needed#
Evaluating Process Reward Models (PRMs) comprehensively is vital. Existing benchmarks primarily focus on text-based error detection, neglecting crucial scenarios like reasoning search, which is essential for LLM inference. Furthermore, multimodal reasoning is often overlooked. This narrow evaluation scope hinders a deep understanding of PRMs’ potential. MPBench addresses this gap by introducing diverse evaluation paradigms such as Step Correctness, Answer Aggregation, and Reasoning Process Search within a multimodal context. These paradigms target specific roles of PRMs in enhancing LLM reasoning, assessing their ability to judge step correctness, aggregate solutions, and guide reasoning search. This comprehensive evaluation allows for more informed development and application of PRMs in complex reasoning tasks. The use of text only based dataset is not enough to cover complex reasoning scenarios.
MPBench:Multi PRM#
While “MPBench: Multi PRM” isn’t directly a heading, it represents the core contribution: a multimodal reasoning benchmark (MPBench) for Process Reward Models (PRMs). The paper addresses a gap in existing PRM evaluations, which are primarily text-based and lack comprehensive scenarios like reasoning search. MPBench likely introduces diverse tasks and evaluation paradigms to systematically assess PRM effectiveness. The “Multi” aspect likely signifies the benchmark’s multimodal nature, incorporating various data types beyond text, reflecting real-world complexity. It emphasizes a shift towards evaluating PRMs in more realistic settings and their ability to handle diverse inputs. Key innovations would center on defining tasks and metrics to measure how well PRMs guide reasoning, aggregate solutions, and identify errors across modalities. Ultimately, MPBench enables deeper understanding and development of PRMs for enhanced reasoning in multimodal applications.
Stepwise Analysis#
A “Stepwise Analysis” framework, within the context of multimodal reasoning, would likely involve dissecting complex problems into smaller, manageable steps. This approach is crucial for understanding how models process information, identify errors, and make decisions at each stage. The analysis would likely involve evaluating the correctness and relevance of each step, potentially using a scoring mechanism or a reward system to guide model behavior. Multimodal data adds complexity, requiring analysis of how different modalities (e.g., text, images) are integrated and processed sequentially. Crucially, identifying the failure points in a step-by-step manner allows for targeted improvements to the model’s reasoning capabilities. Error propagation and the impact of early mistakes on later steps would be a key area of investigation, potentially necessitating backtracking or alternative reasoning paths. Finally, analyzing the efficiency of the stepwise process, considering the number of steps and computational resources required, is paramount for practical applications.
Multimodal Lags#
The concept of “Multimodal Lags” is intriguing, suggesting potential asynchronies or misalignments between different modalities (e.g., text, image, audio) in AI systems. If such lags exist, they could critically impact the system’s ability to reason, understand, and respond appropriately. For example, a delay in processing visual information relative to textual input could lead to incorrect conclusions in a visual question-answering task. Addressing such lags would require careful consideration of processing speeds, data synchronization methods, and the relative importance assigned to different modalities. Furthermore, the optimal handling of multimodal lags may depend on the specific task – a small delay might be tolerable in one application but catastrophic in another. Finally, robust benchmarks are needed to quantify and characterize these lags and their impact on overall performance.
Scale Impacts#
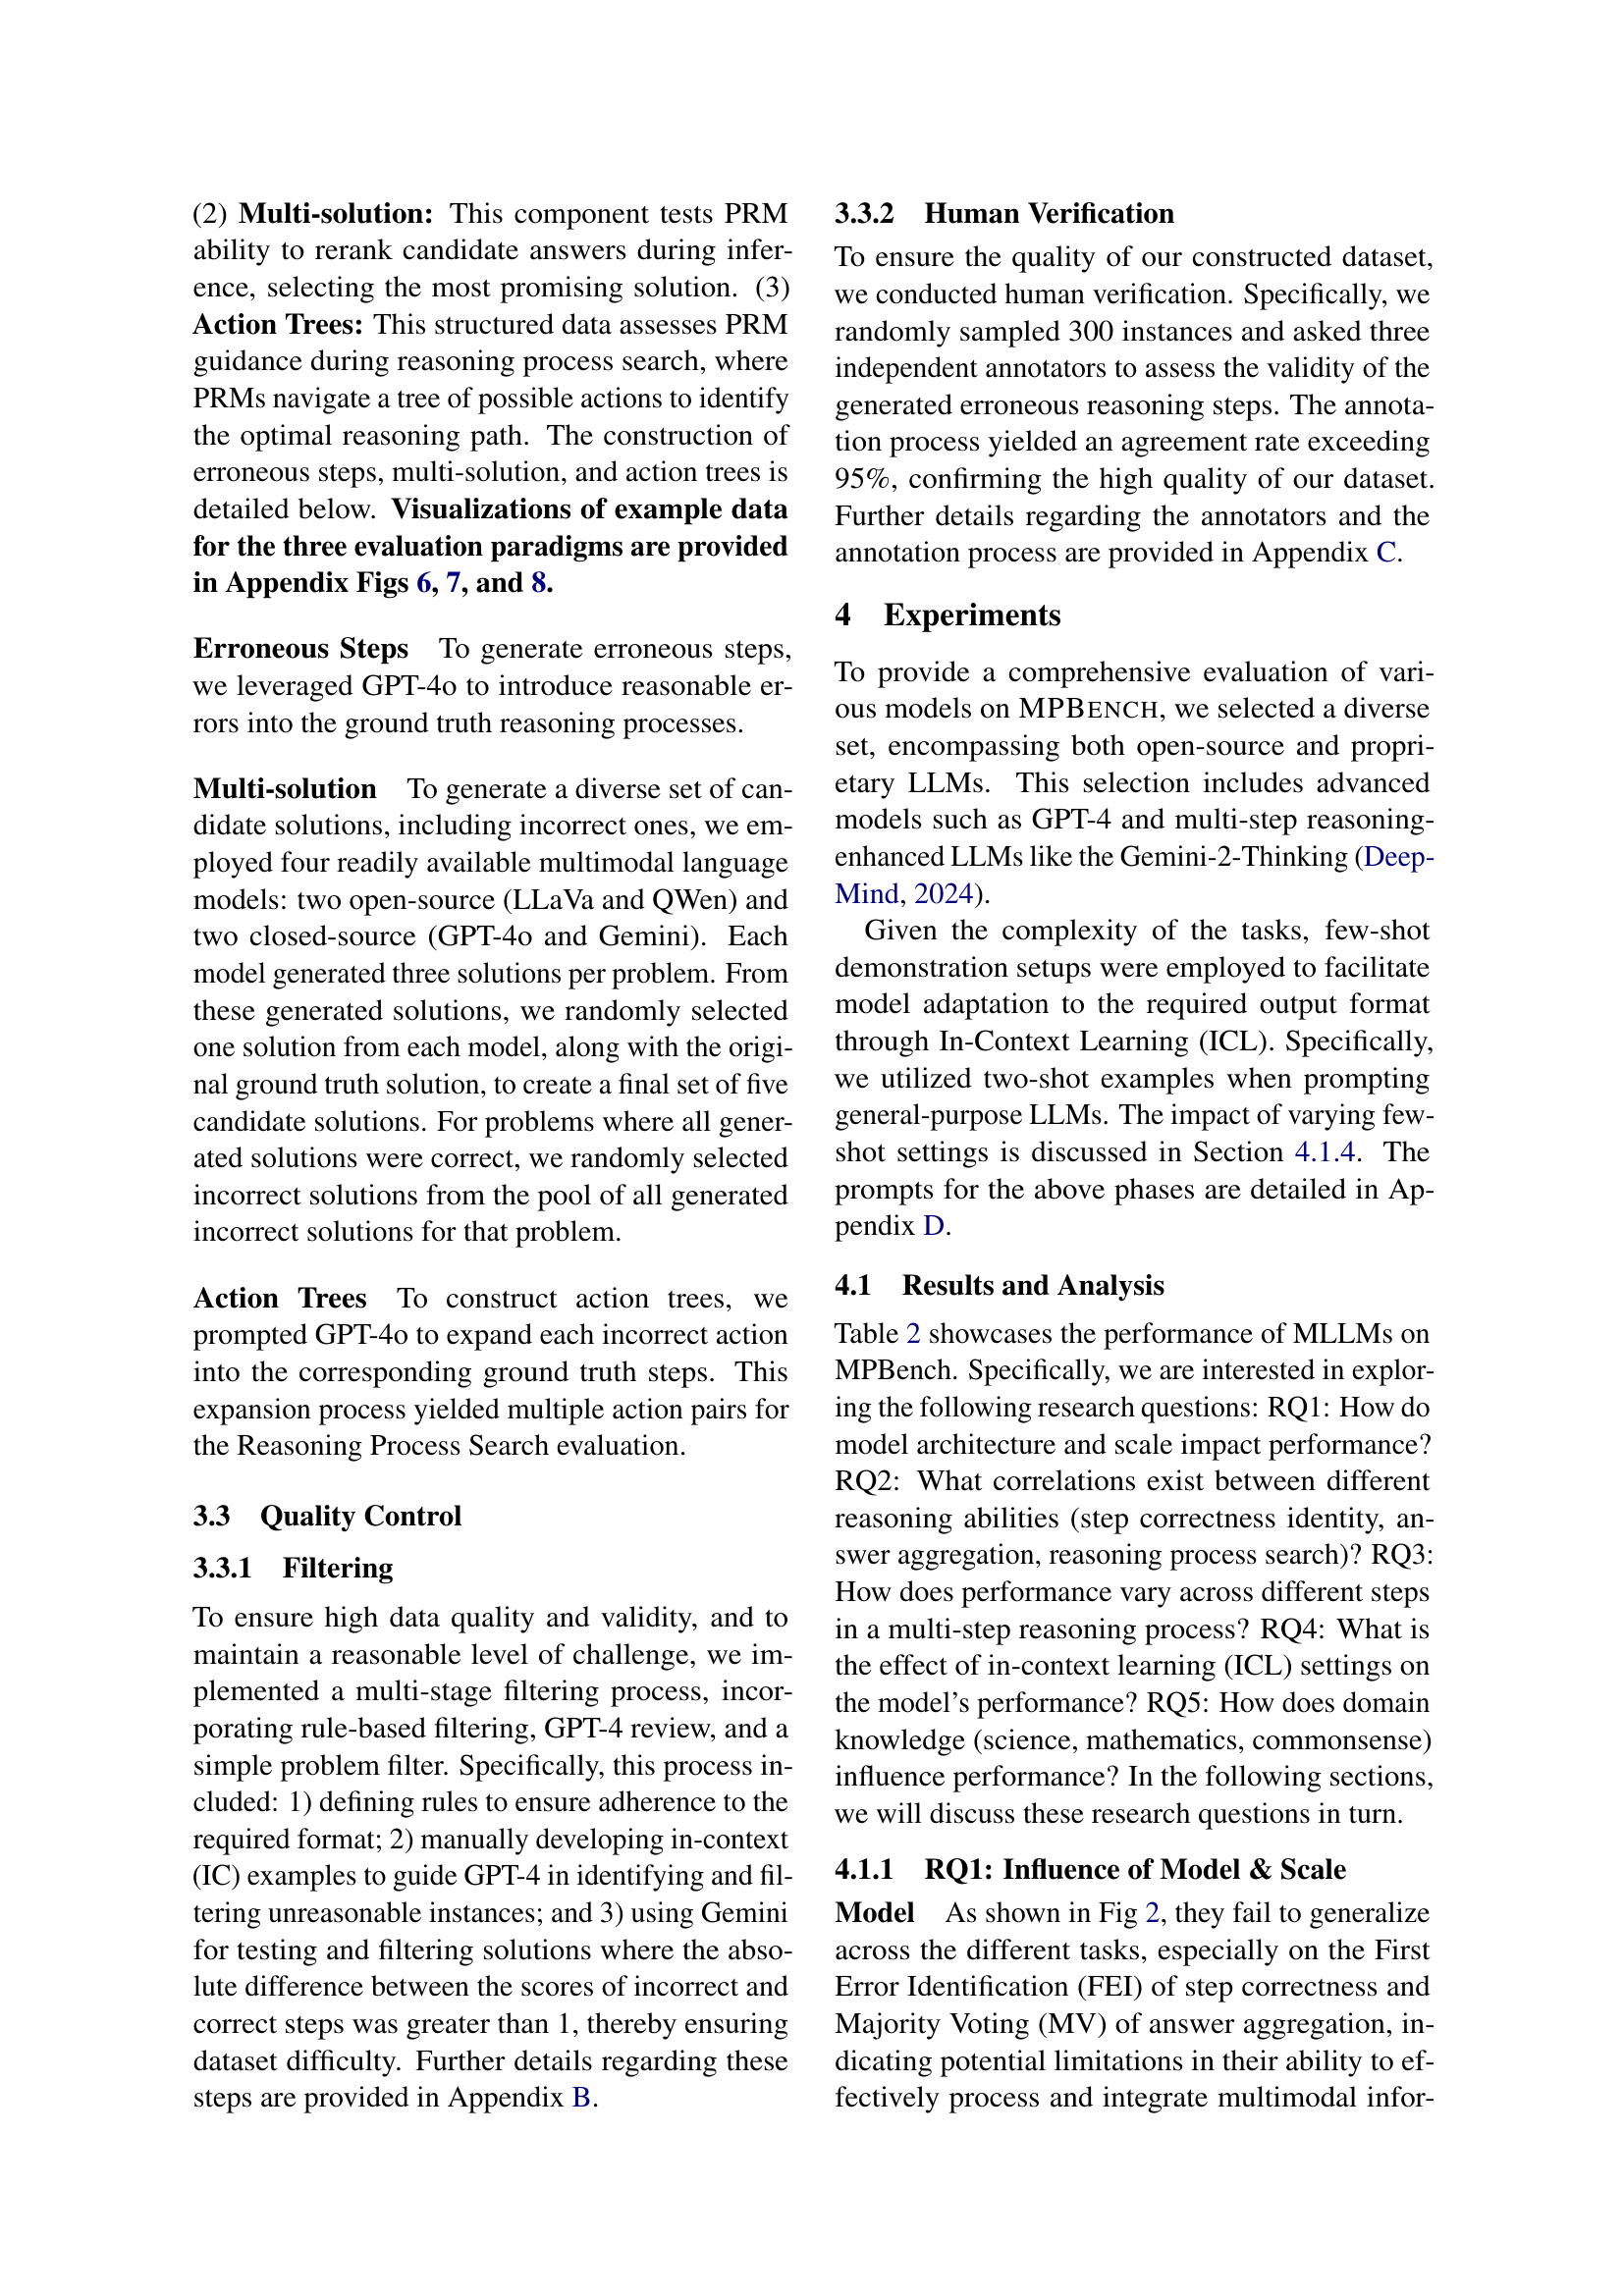
The section on scale impacts highlights that model performance on MPBench generally scales with size. This is particularly evident in Step Correctness and Reasoning Process Search, suggesting that larger models are better at learning correct/incorrect steps and navigating the solution space. Weaker models even perform below random chance on assessments. This indicates that a larger model capacity is crucial for complex reasoning, enabling better understanding of correct/incorrect steps and solution space navigation. The disproportionate impact of scale on Step Correctness and Search indicates that these tasks are cognitively demanding, requiring deeper reasoning and step-level evaluation.
More visual insights#
More on figures

🔼 This radar chart visualizes the performance breakdown of various LLMs (large language models) on the MPBench benchmark. Each LLM’s performance is assessed across multiple aspects of reasoning, including step correctness (FEI, AEI, Avg.), answer aggregation (BoN, MV, Avg.), and reasoning process search (F1, MCC, Avg.). The chart allows for a comparison of the relative strengths and weaknesses of each model in different reasoning tasks. The use of a radar chart enables a direct visual comparison of the models across all evaluation metrics.
read the caption
Figure 2: Performance breakdown on MPBench.

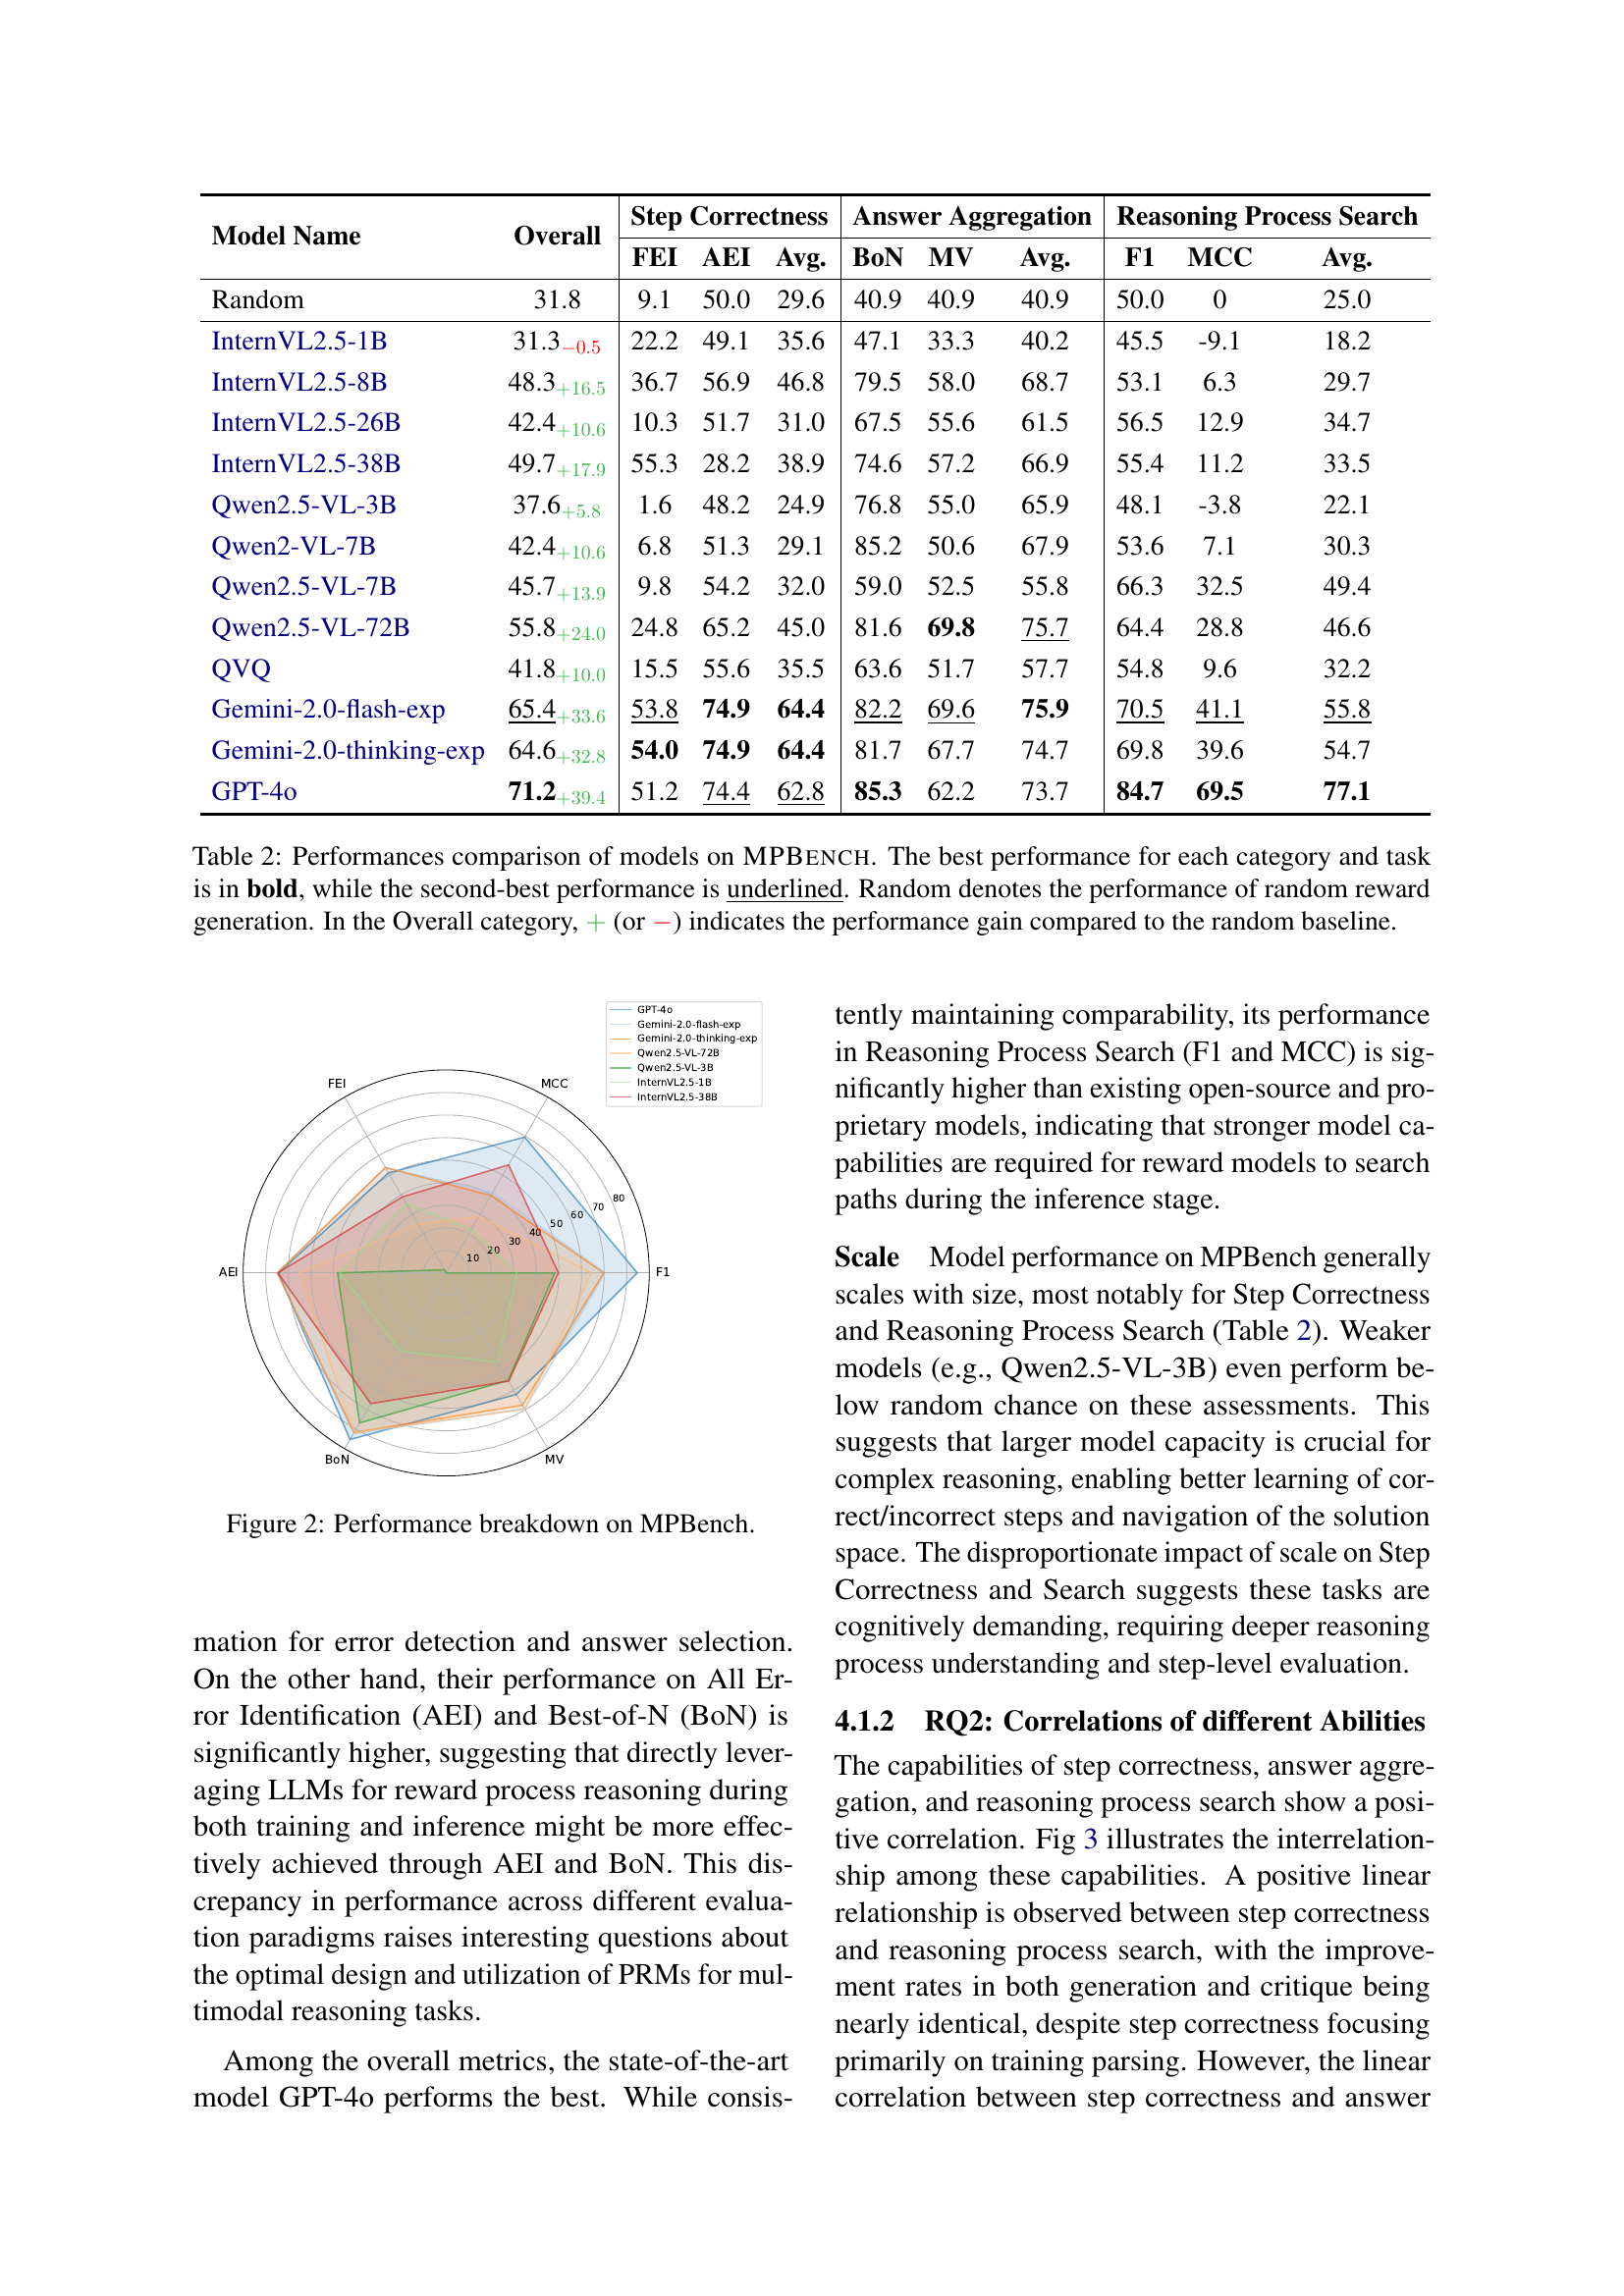
🔼 Figure 3 visualizes the correlation between three key evaluation paradigms in the MPBench benchmark: Step Correctness (SC), Answer Aggregation (AA), and Reasoning Process Search (RS). Each point represents a model’s performance across these three aspects. Blue lines show the fitted relationships between SC and AA, SC and RS, and AA and RS. A dashed red line represents the ideal growth line, whose slope reflects the ratio of random performance for each metric. This figure highlights how well-performing models tend to excel across all three evaluation paradigms, illustrating the interdependency of these reasoning capabilities.
read the caption
Figure 3: Interrelationship between a model’s capabilities in step correctness identify, answer aggregation, and reasoning process search. Each point on the graph represents a model, with coordinates indicating its performance in step correctness identify(SC), answer aggregation (AA), and reasoning process search (RS). The graph features fitted lines for the scatter plots, denoted by blue lines for SC/AA, SC/RS, and AA/RS, while a red dashed line represents the ideal growth line. The slope of this ideal growth line is the ratio of the random values of each metric.

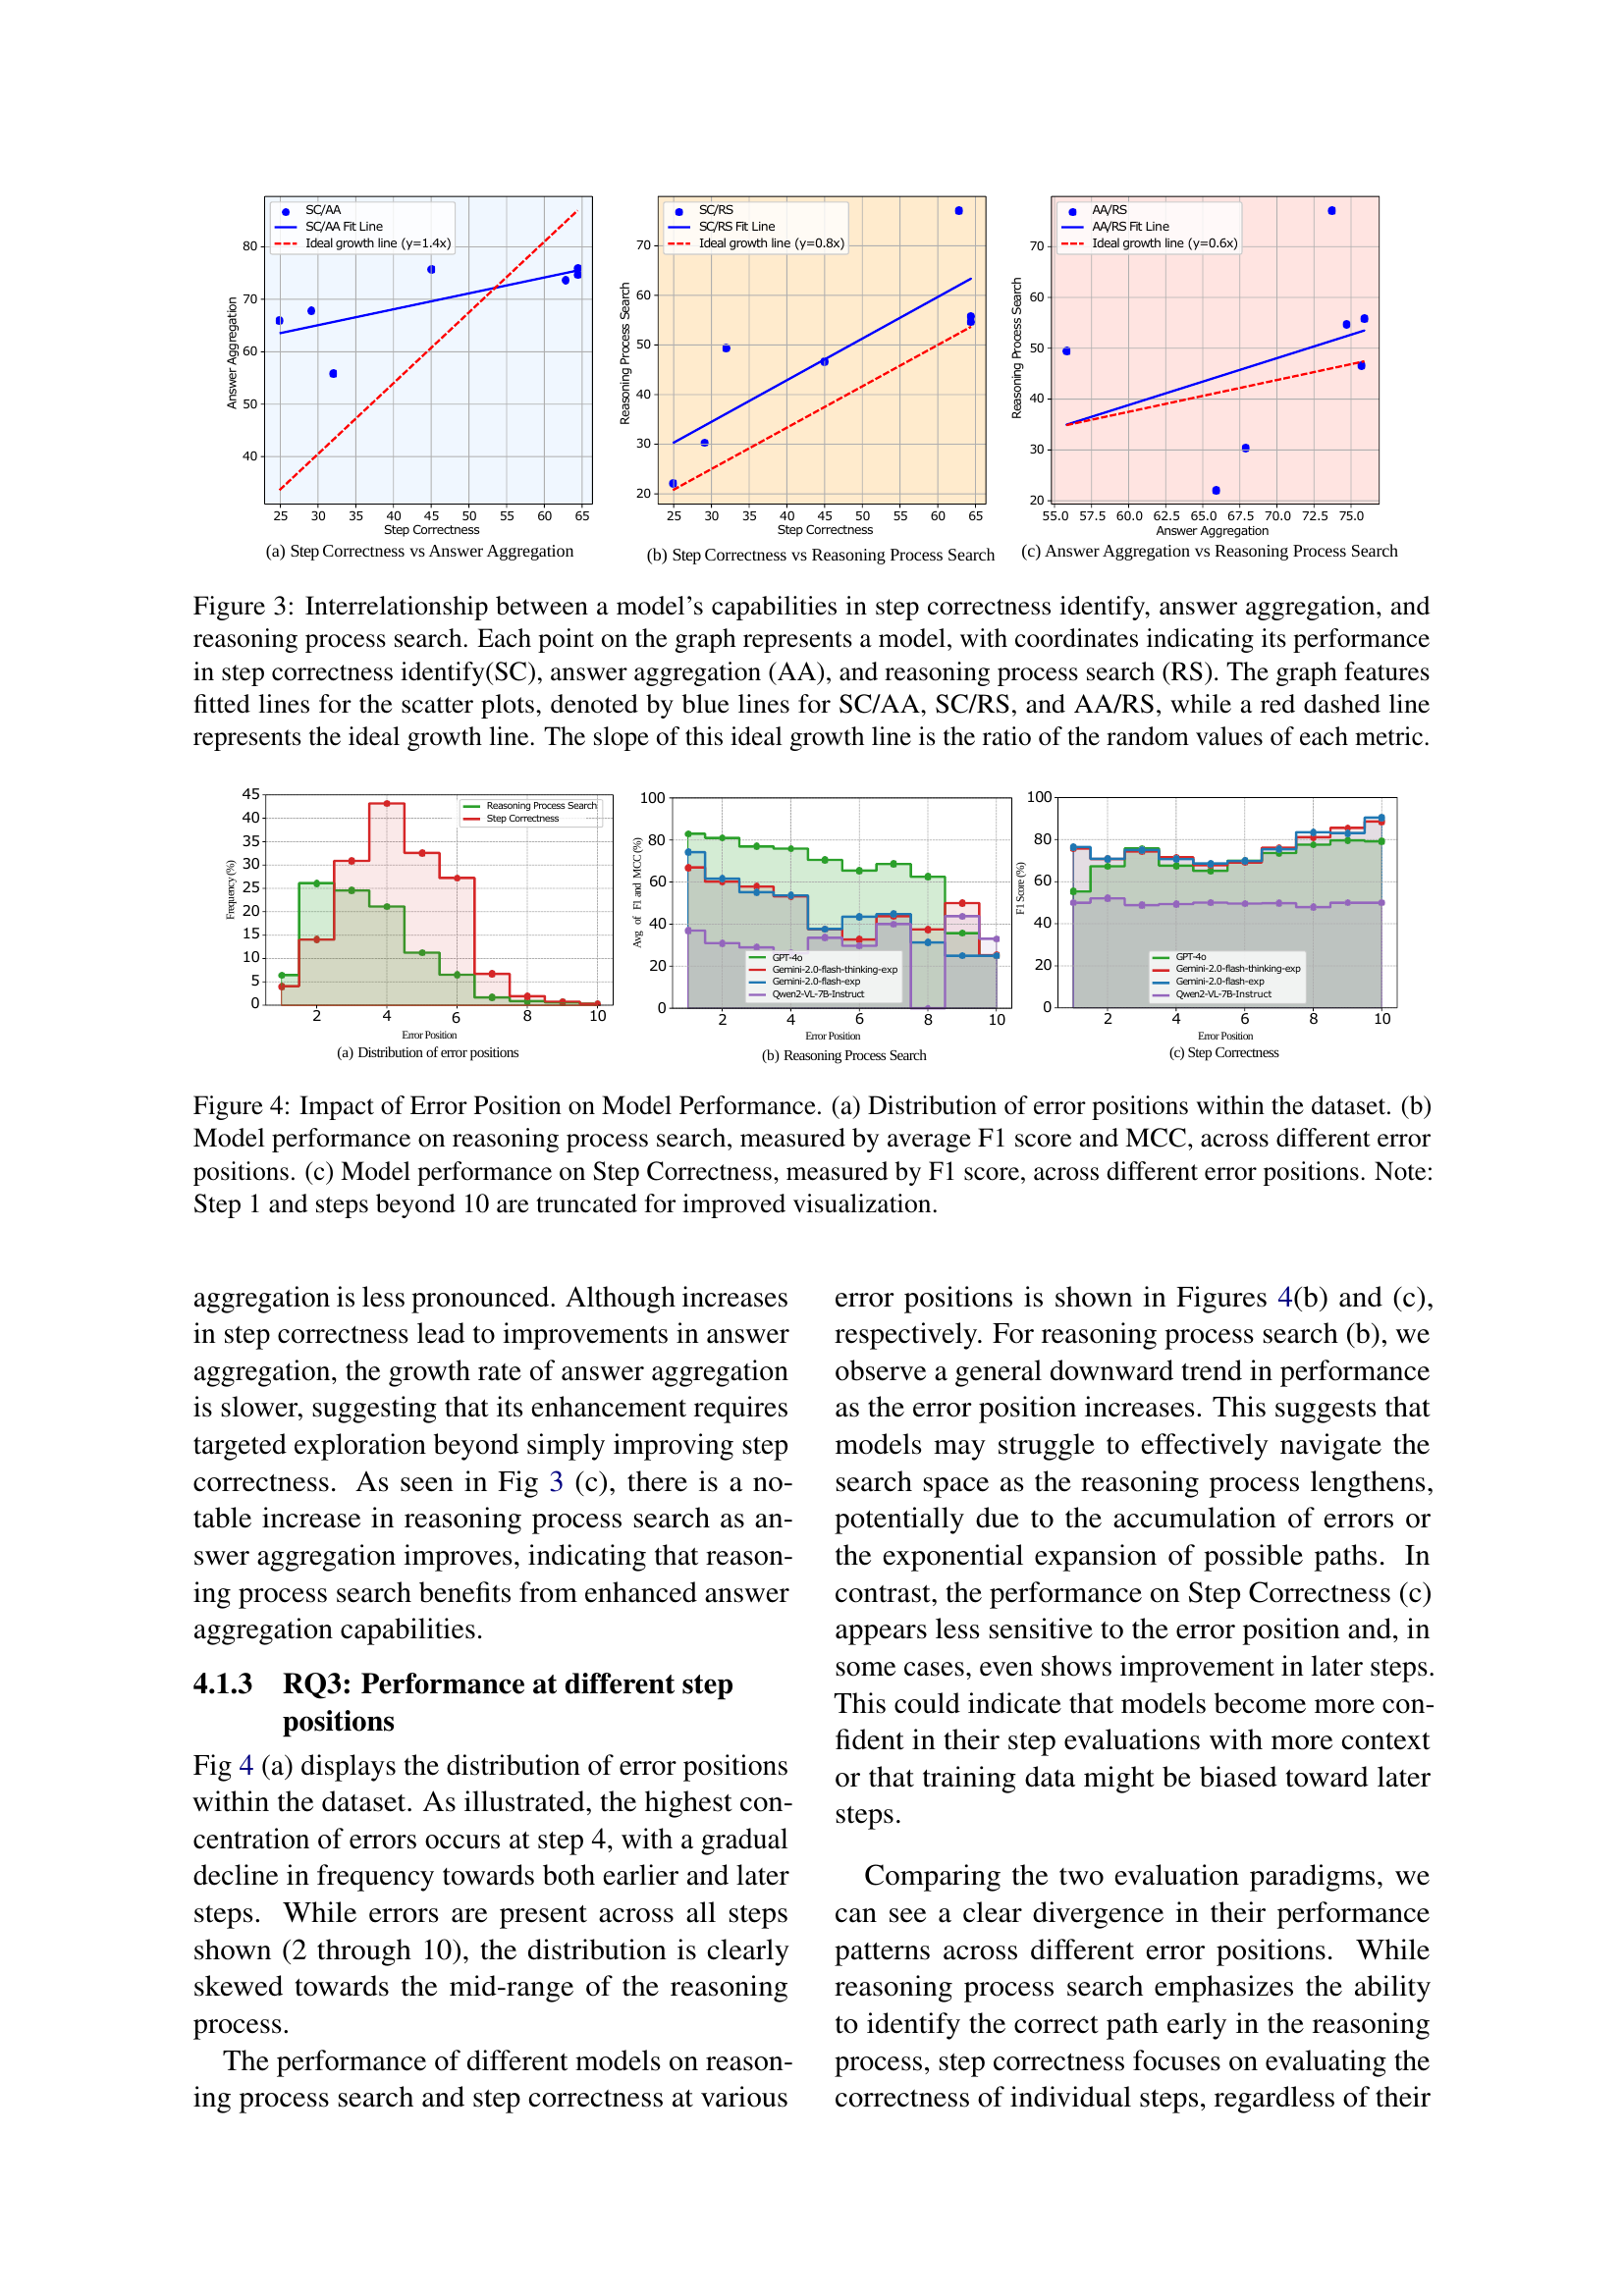
🔼 This figure analyzes how error position in a reasoning process affects model performance. Panel (a) shows the distribution of errors across different steps within the dataset. Panel (b) presents the model’s performance in reasoning process search, using average F1 score and Matthews Correlation Coefficient (MCC) to evaluate performance across different error positions. Panel (c) focuses specifically on step correctness, measuring performance with only the F1 score across various error positions. The analysis is limited to steps 2-10 for better visualization, excluding step 1 and steps beyond 10.
read the caption
Figure 4: Impact of Error Position on Model Performance. (a) Distribution of error positions within the dataset. (b) Model performance on reasoning process search, measured by average F1 score and MCC, across different error positions. (c) Model performance on Step Correctness, measured by F1 score, across different error positions. Note: Step 1 and steps beyond 10 are truncated for improved visualization.
More on tables
| PRM |
| Benchmarks? |
🔼 Table 2 presents a comprehensive comparison of the performance of various large language models (LLMs) on the MPBench benchmark. The table shows results across three key evaluation paradigms: Step Correctness (including First Error Identification and All Error Identification), Answer Aggregation (using Best-of-N and Majority Voting methods), and Reasoning Process Search. For each paradigm and sub-category, the table displays the F1 score, Matthews Correlation Coefficient (MCC), and average performance. The best performing LLM for each metric is shown in bold, while the second-best is underlined. A random baseline is also provided to show performance relative to chance, with the difference from the random baseline indicated in the ‘Overall’ column using a ‘+’ for improvement and a ‘-’ for worse performance.
read the caption
Table 2: Performances comparison of models on MPBench. The best performance for each category and task is in bold, while the second-best performance is underlined. Random denotes the performance of random reward generation. In the Overall category, +{\color[rgb]{0.22265625,0.7109375,0.2890625}\definecolor[named]{pgfstrokecolor% }{rgb}{0.22265625,0.7109375,0.2890625}+}+ (or −{\color[rgb]{1,0,0}\definecolor[named]{pgfstrokecolor}{rgb}{1,0,0}-}-) indicates the performance gain compared to the random baseline.
| Multimodal |
| Benchmarks? |
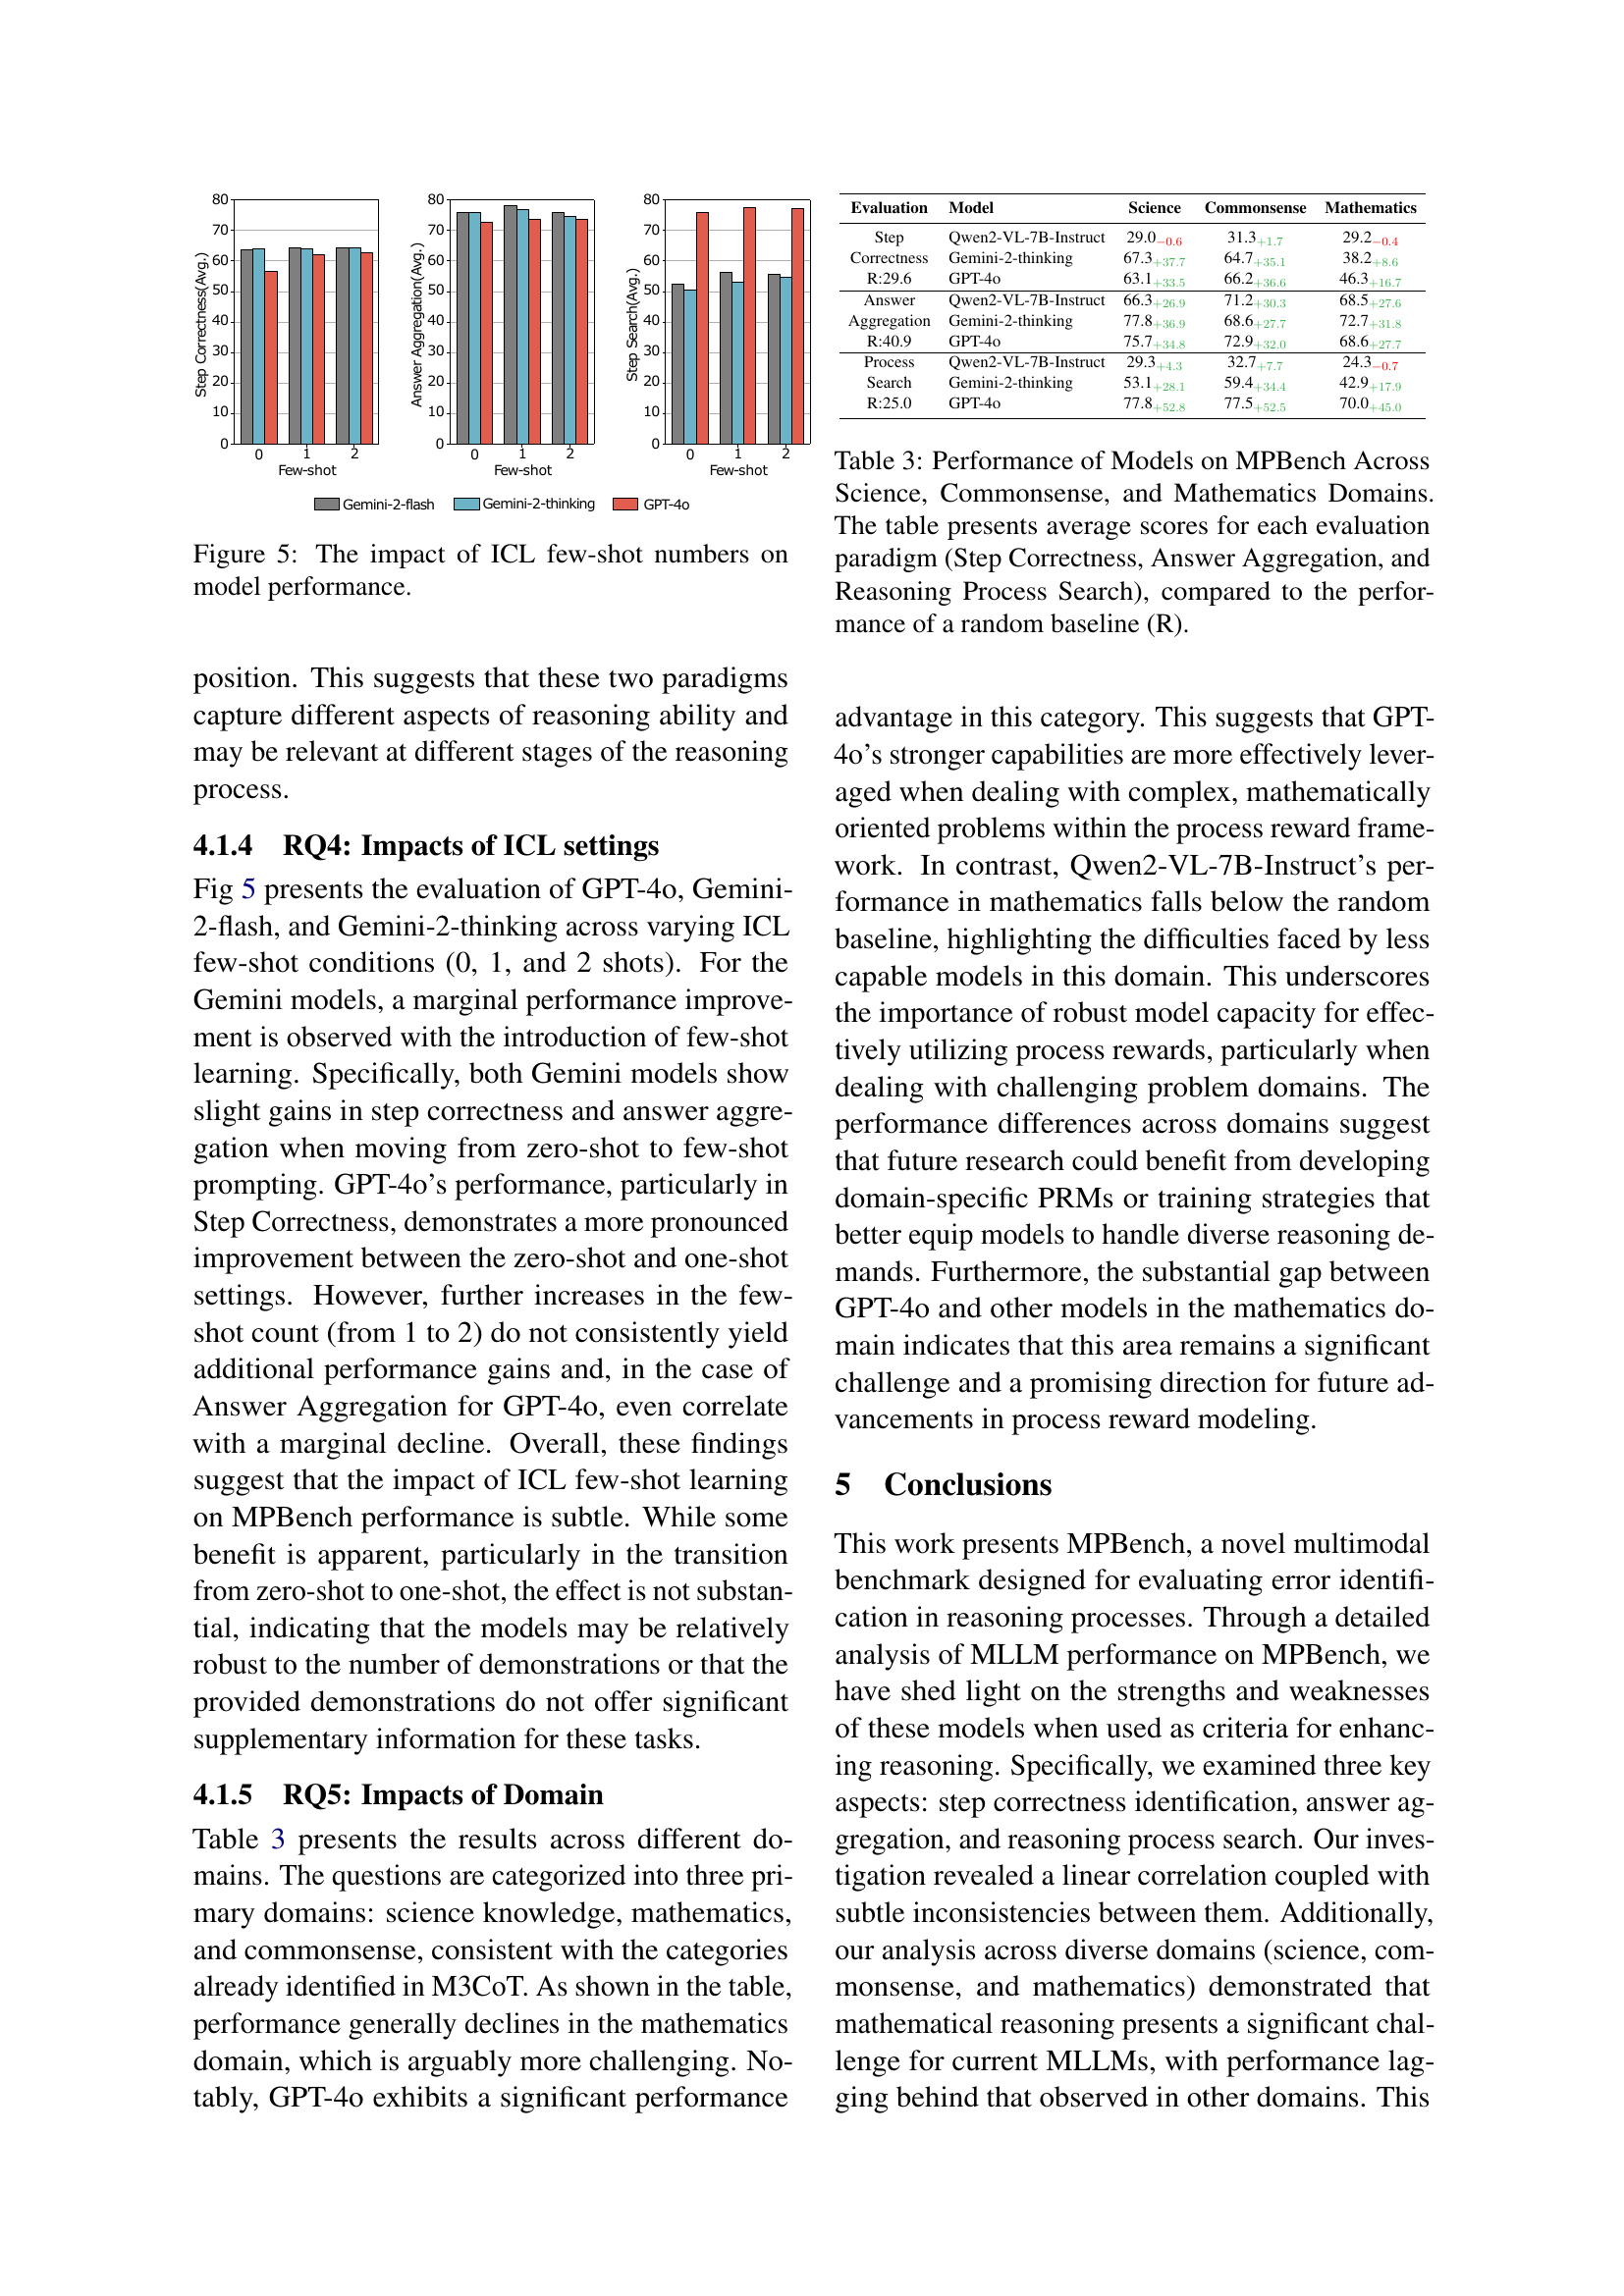
🔼 Table 3 presents a detailed comparison of various large language models’ performance on the MPBench benchmark, categorized by domain (Science, Commonsense, Mathematics). For each model, average scores are provided across three evaluation paradigms: Step Correctness (evaluating the accuracy of each step in a reasoning process), Answer Aggregation (assessing the ability to select the best solution from multiple candidates), and Reasoning Process Search (measuring the effectiveness of guiding the search for optimal solutions). A random baseline (R) is included for each paradigm and domain to provide a comparative reference, highlighting each model’s relative strengths and weaknesses across different reasoning tasks and domains.
read the caption
Table 3: Performance of Models on MPBench Across Science, Commonsense, and Mathematics Domains. The table presents average scores for each evaluation paradigm (Step Correctness, Answer Aggregation, and Reasoning Process Search), compared to the performance of a random baseline (R).
| Evaluation |
| Paradigms |
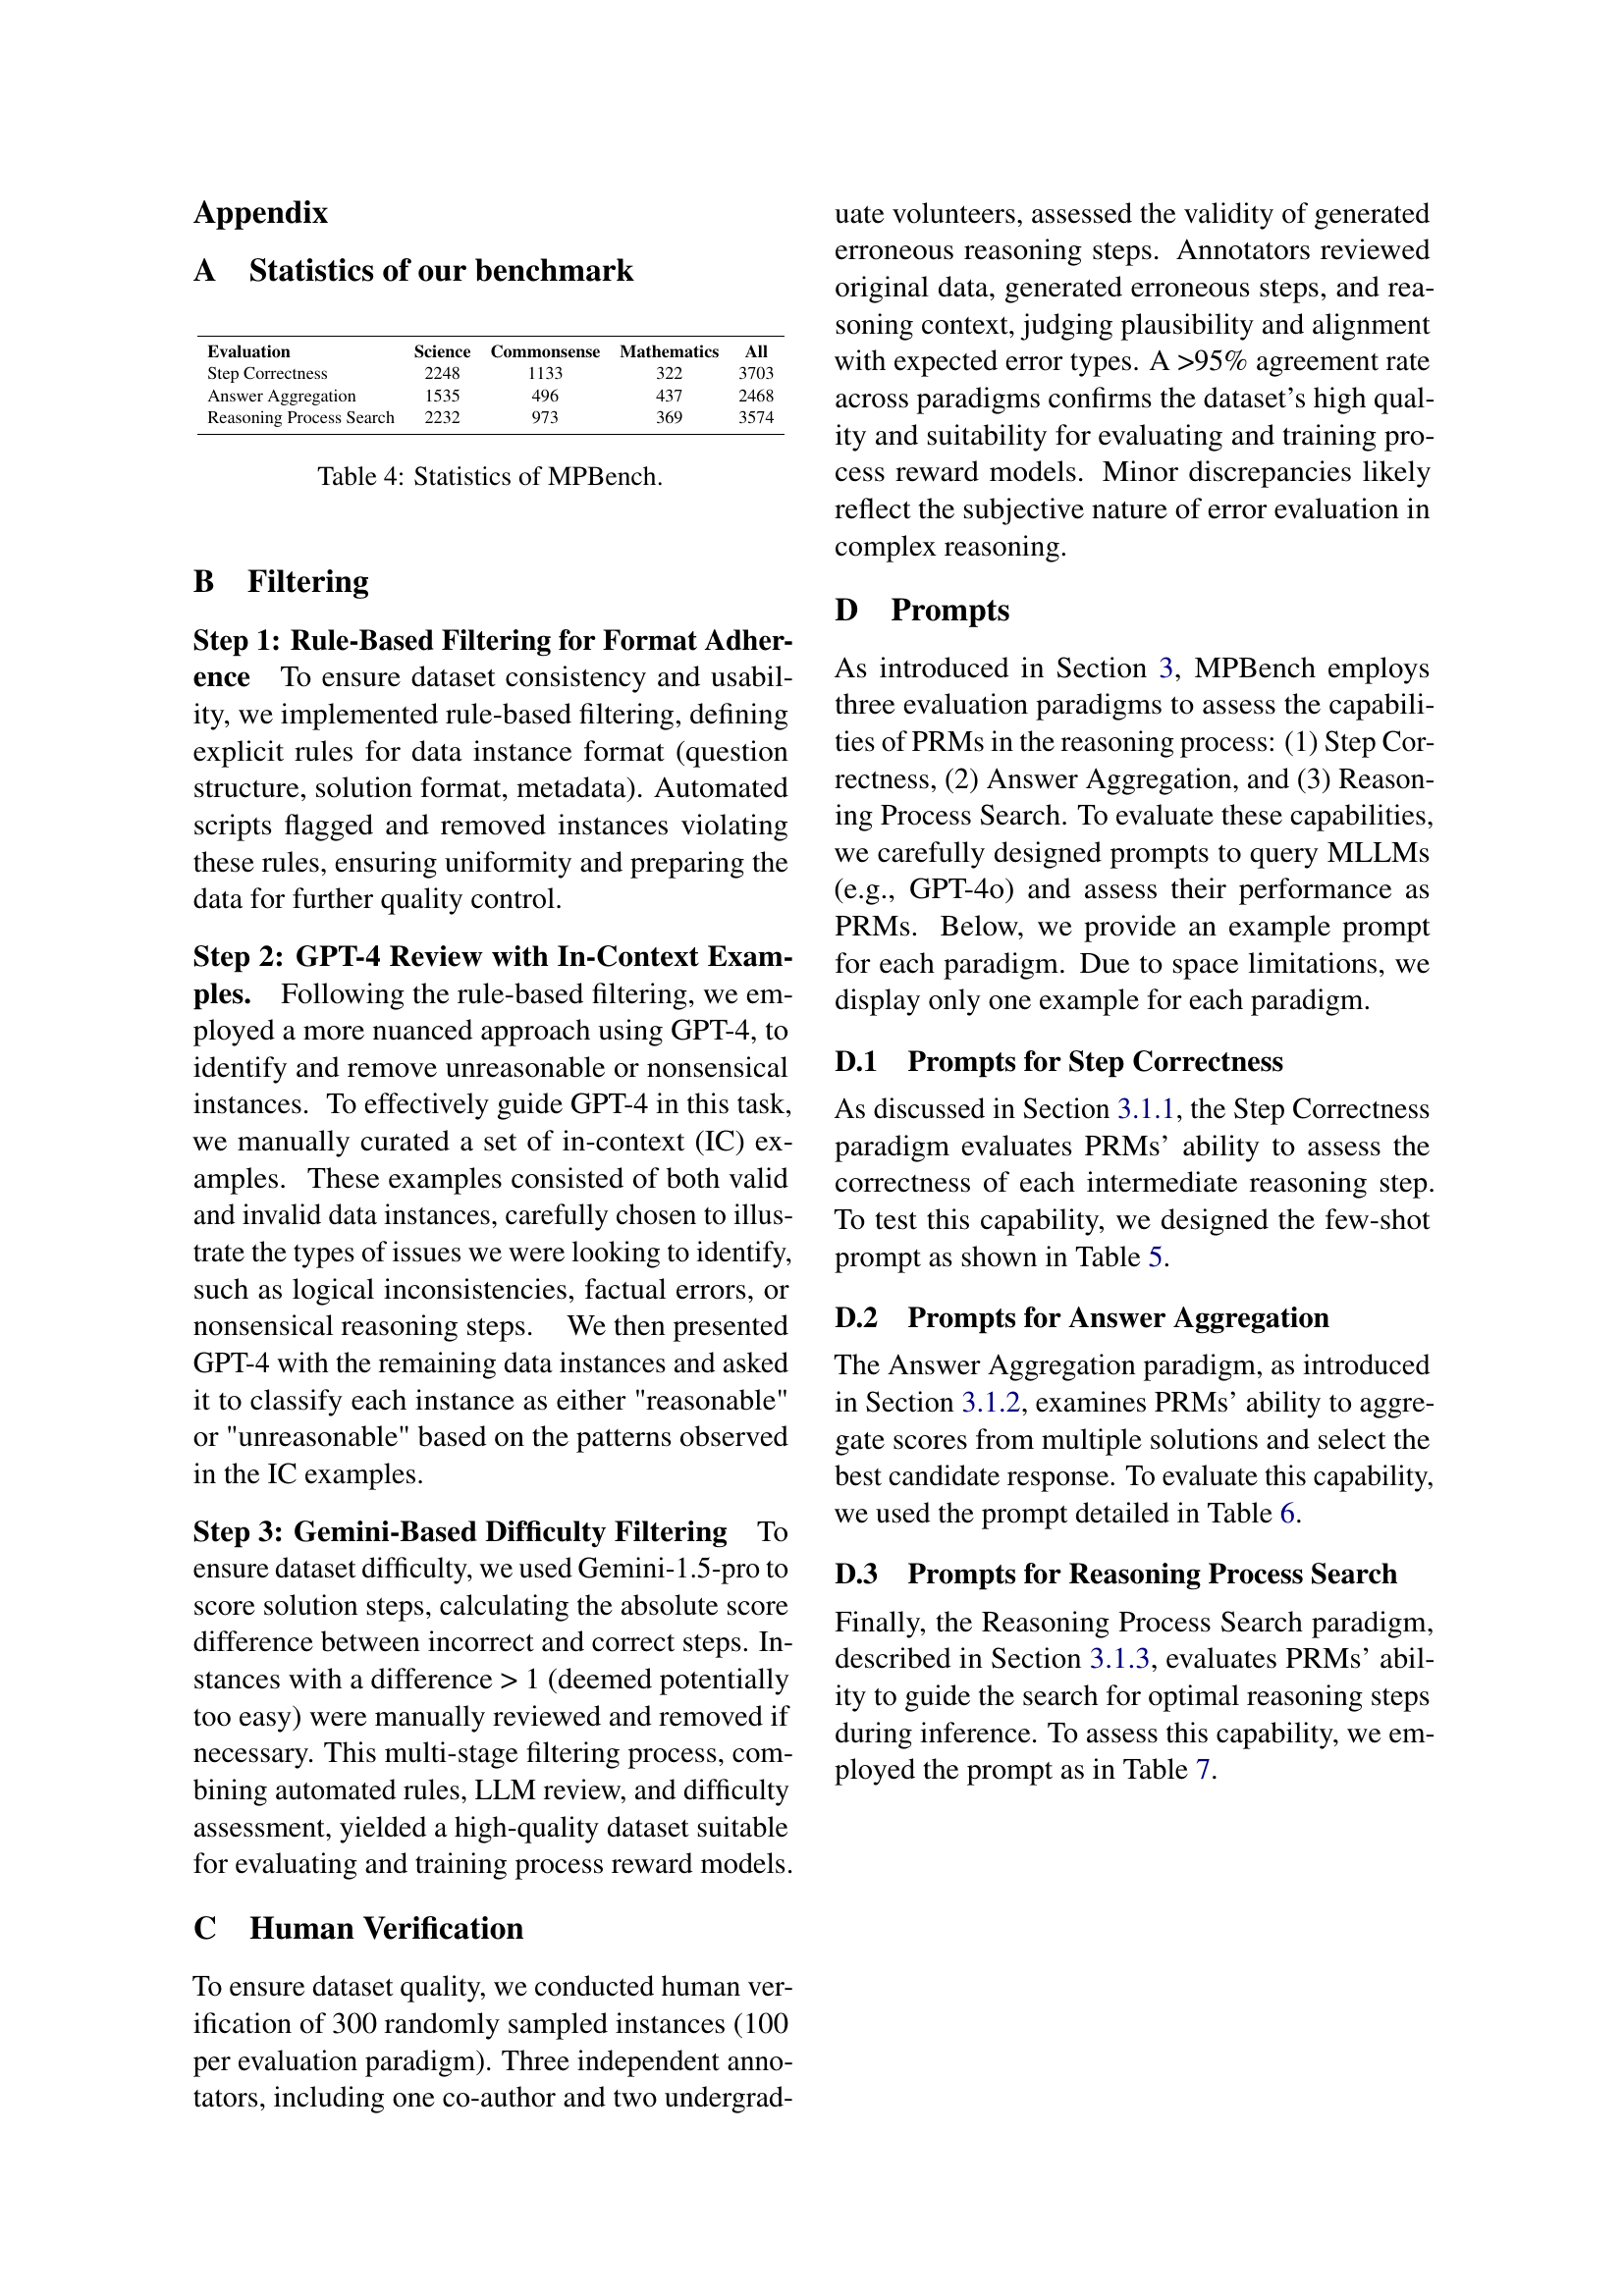
🔼 Table 4 provides a detailed breakdown of the MPBench dataset’s composition across different evaluation paradigms and domains. It shows the number of data instances (science, commonsense, mathematics) used for each of the three evaluation paradigms: Step Correctness, Answer Aggregation, and Reasoning Process Search. This gives a clear picture of the dataset’s balance and size across various task types and subject areas.
read the caption
Table 4: Statistics of MPBench.
| Step |
| Annotation |
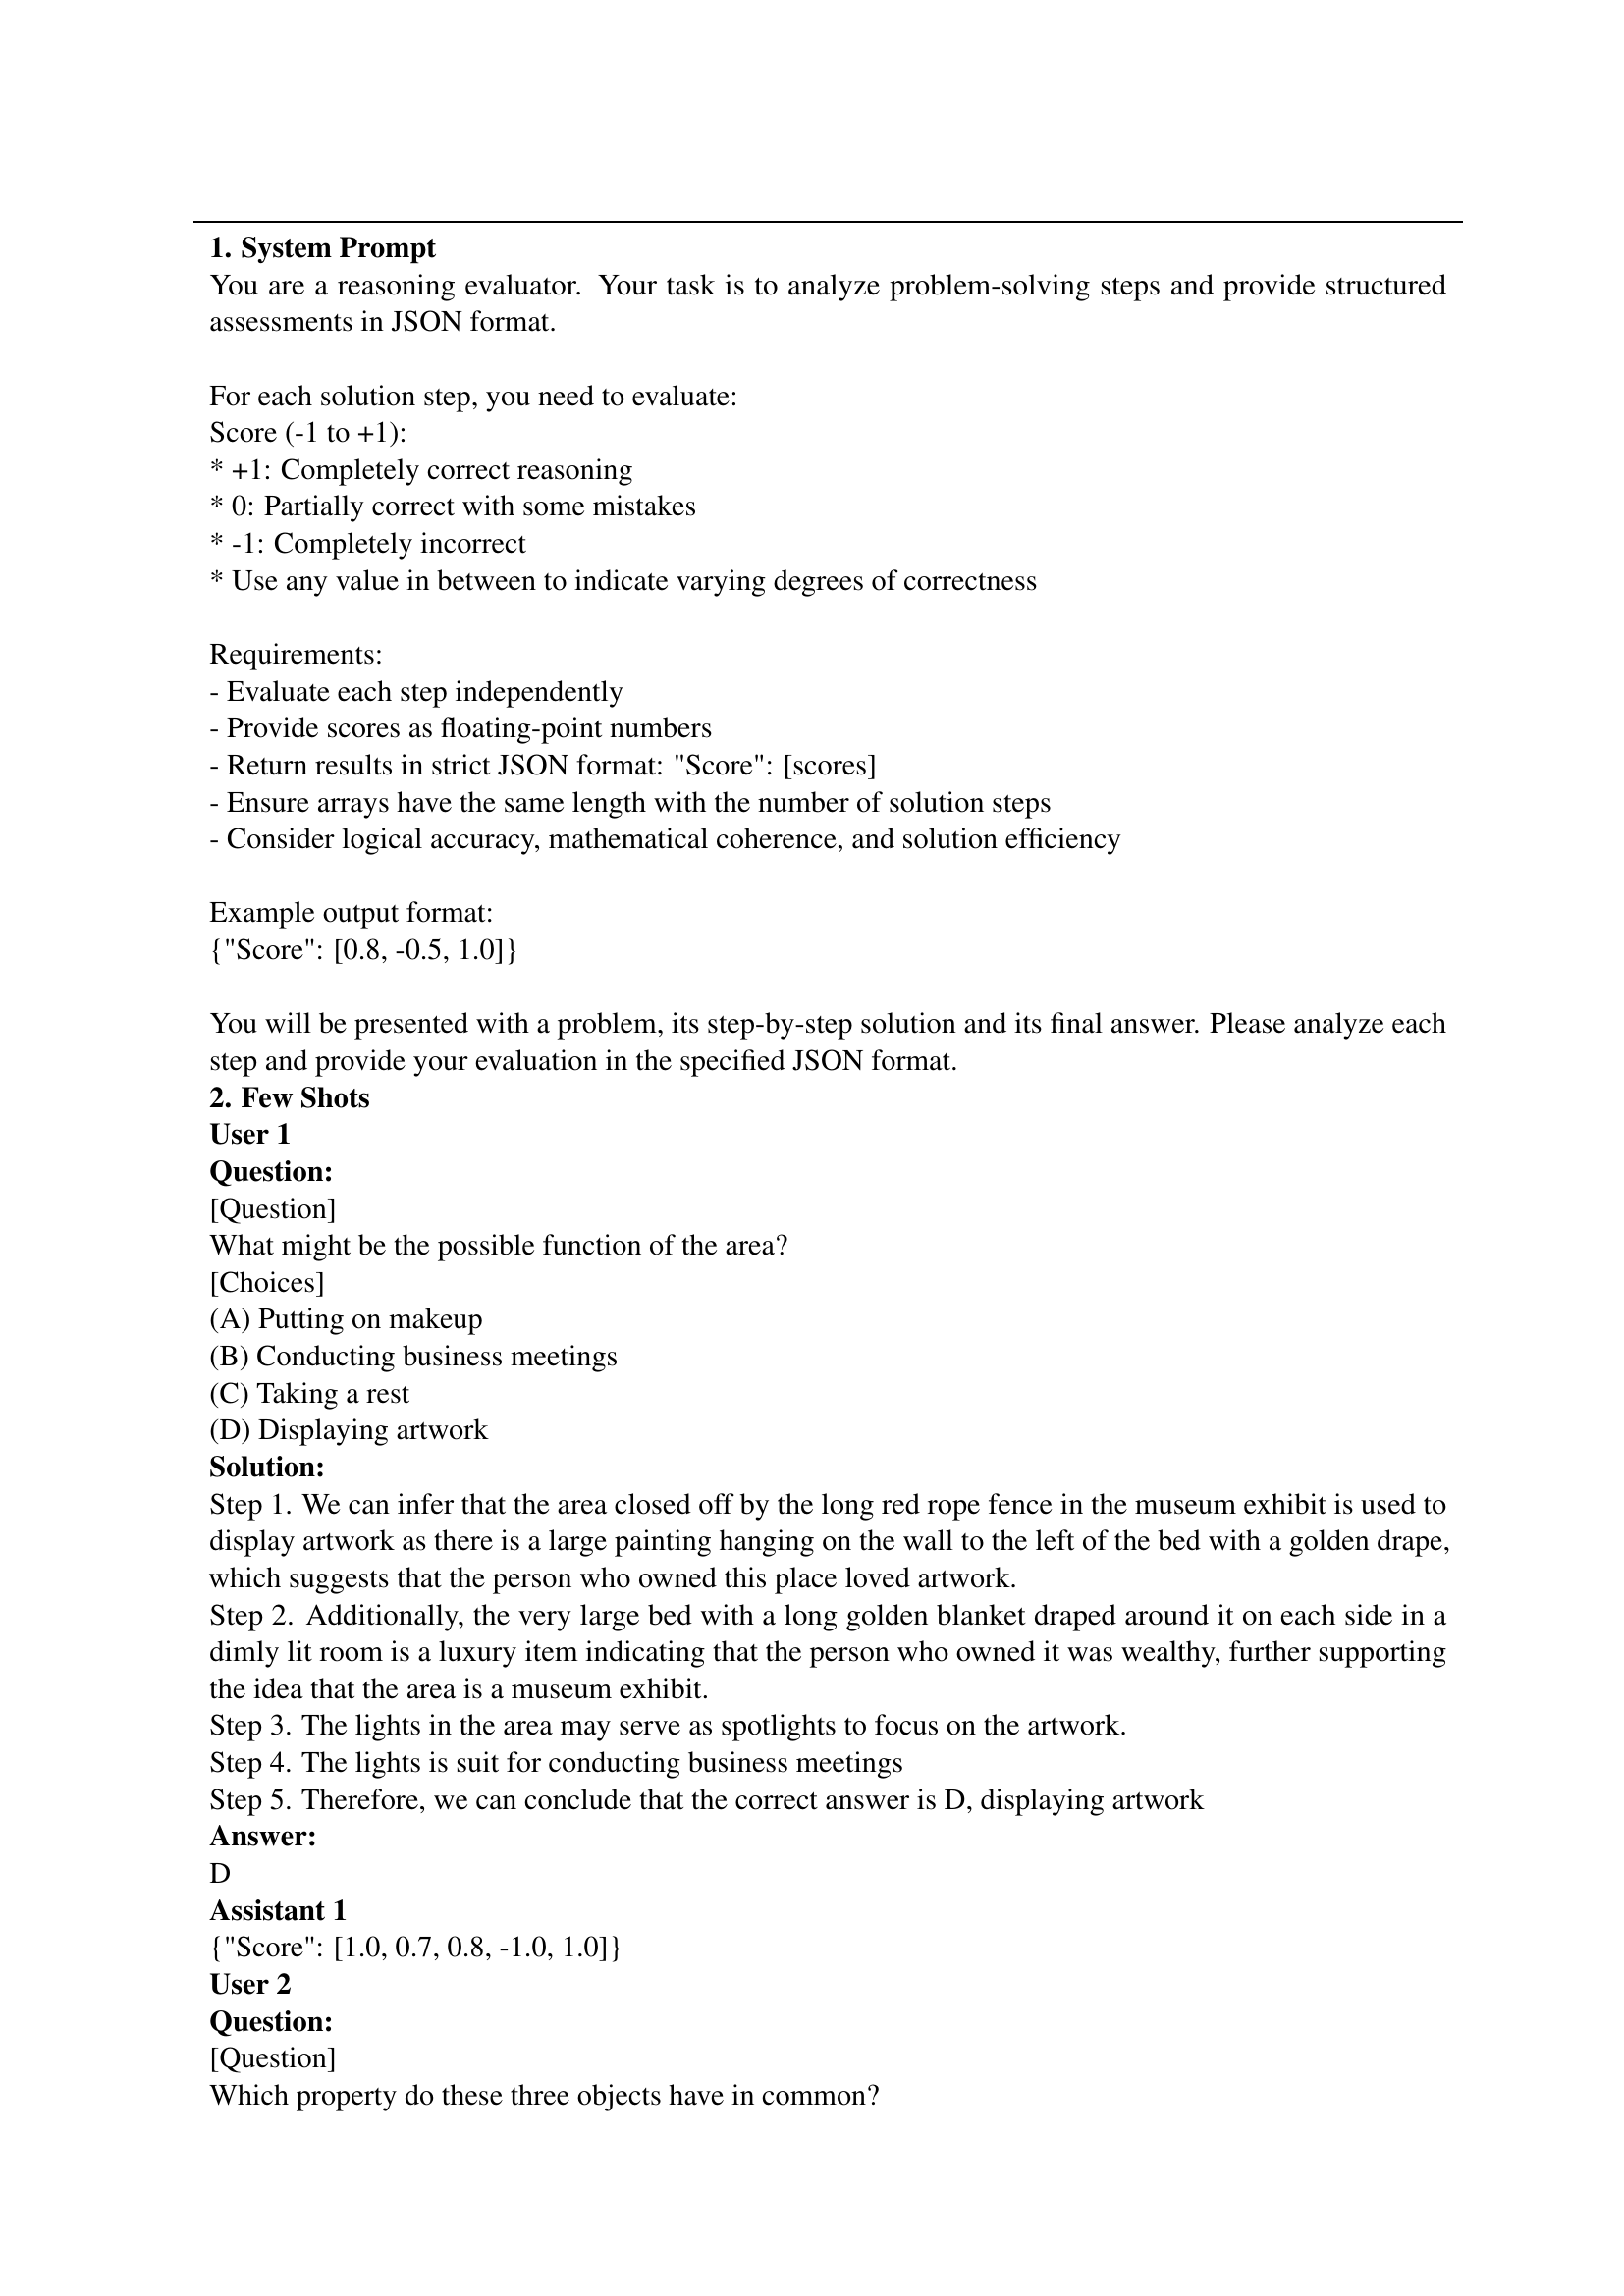
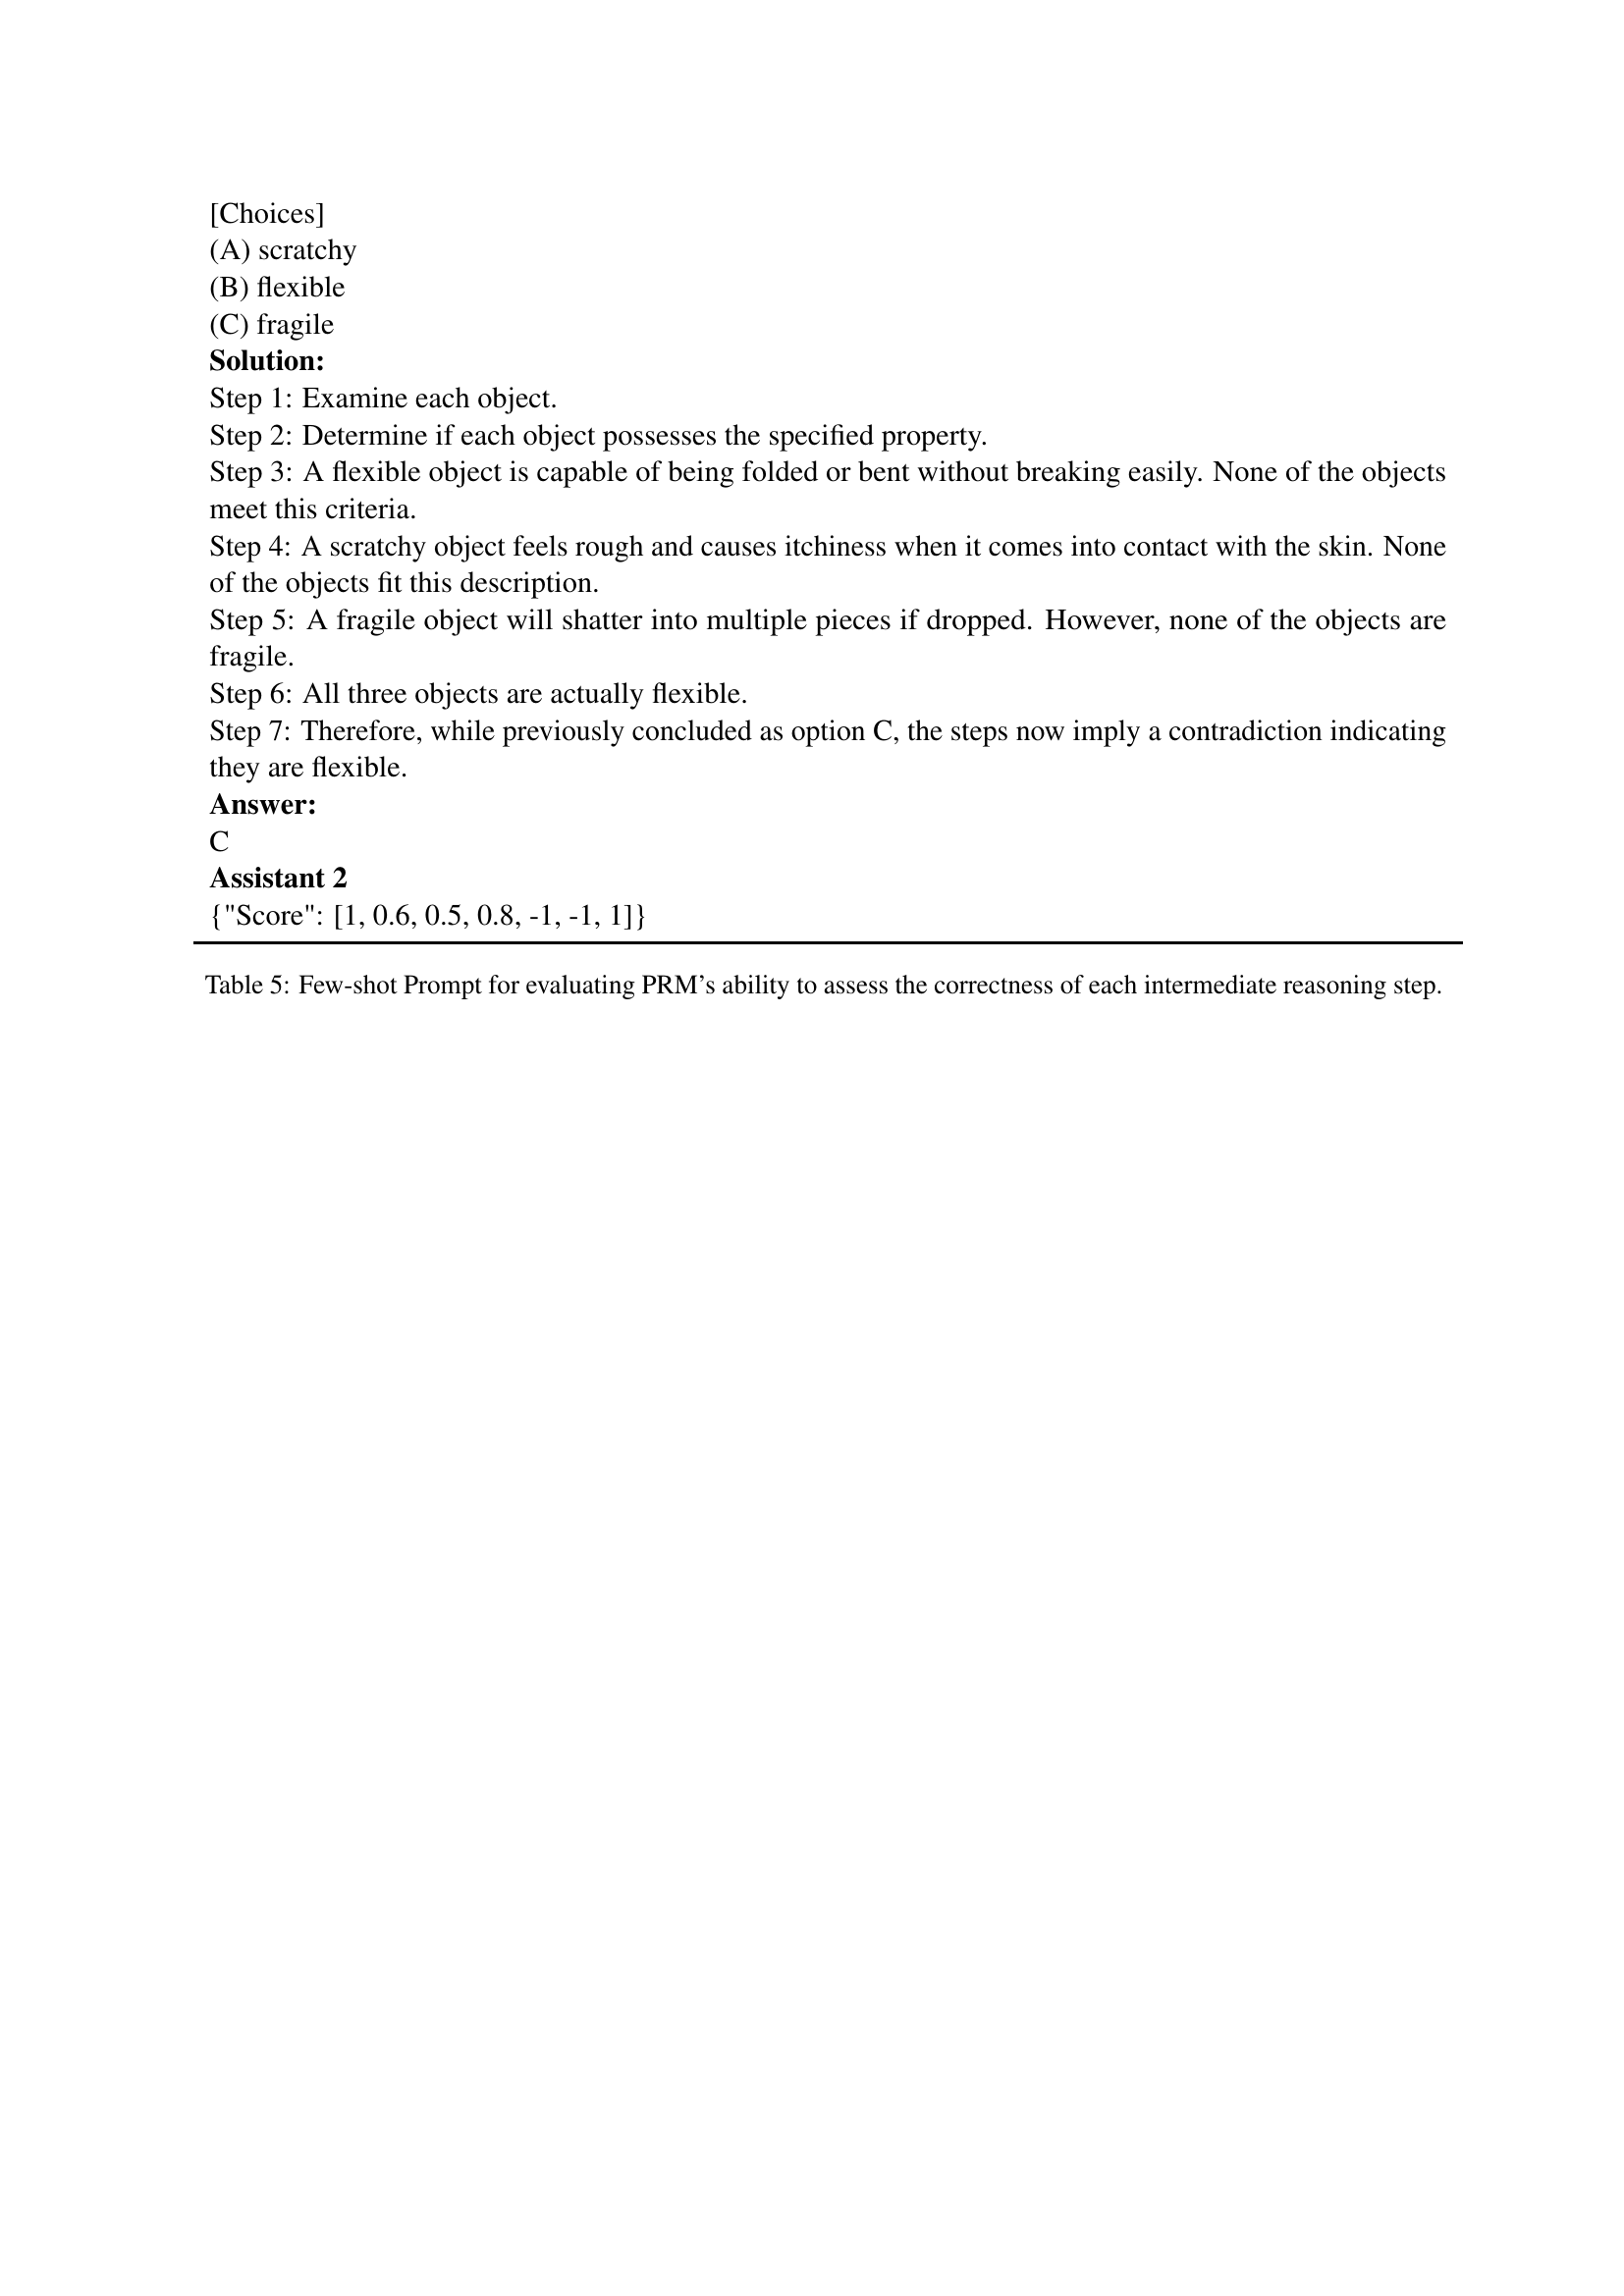
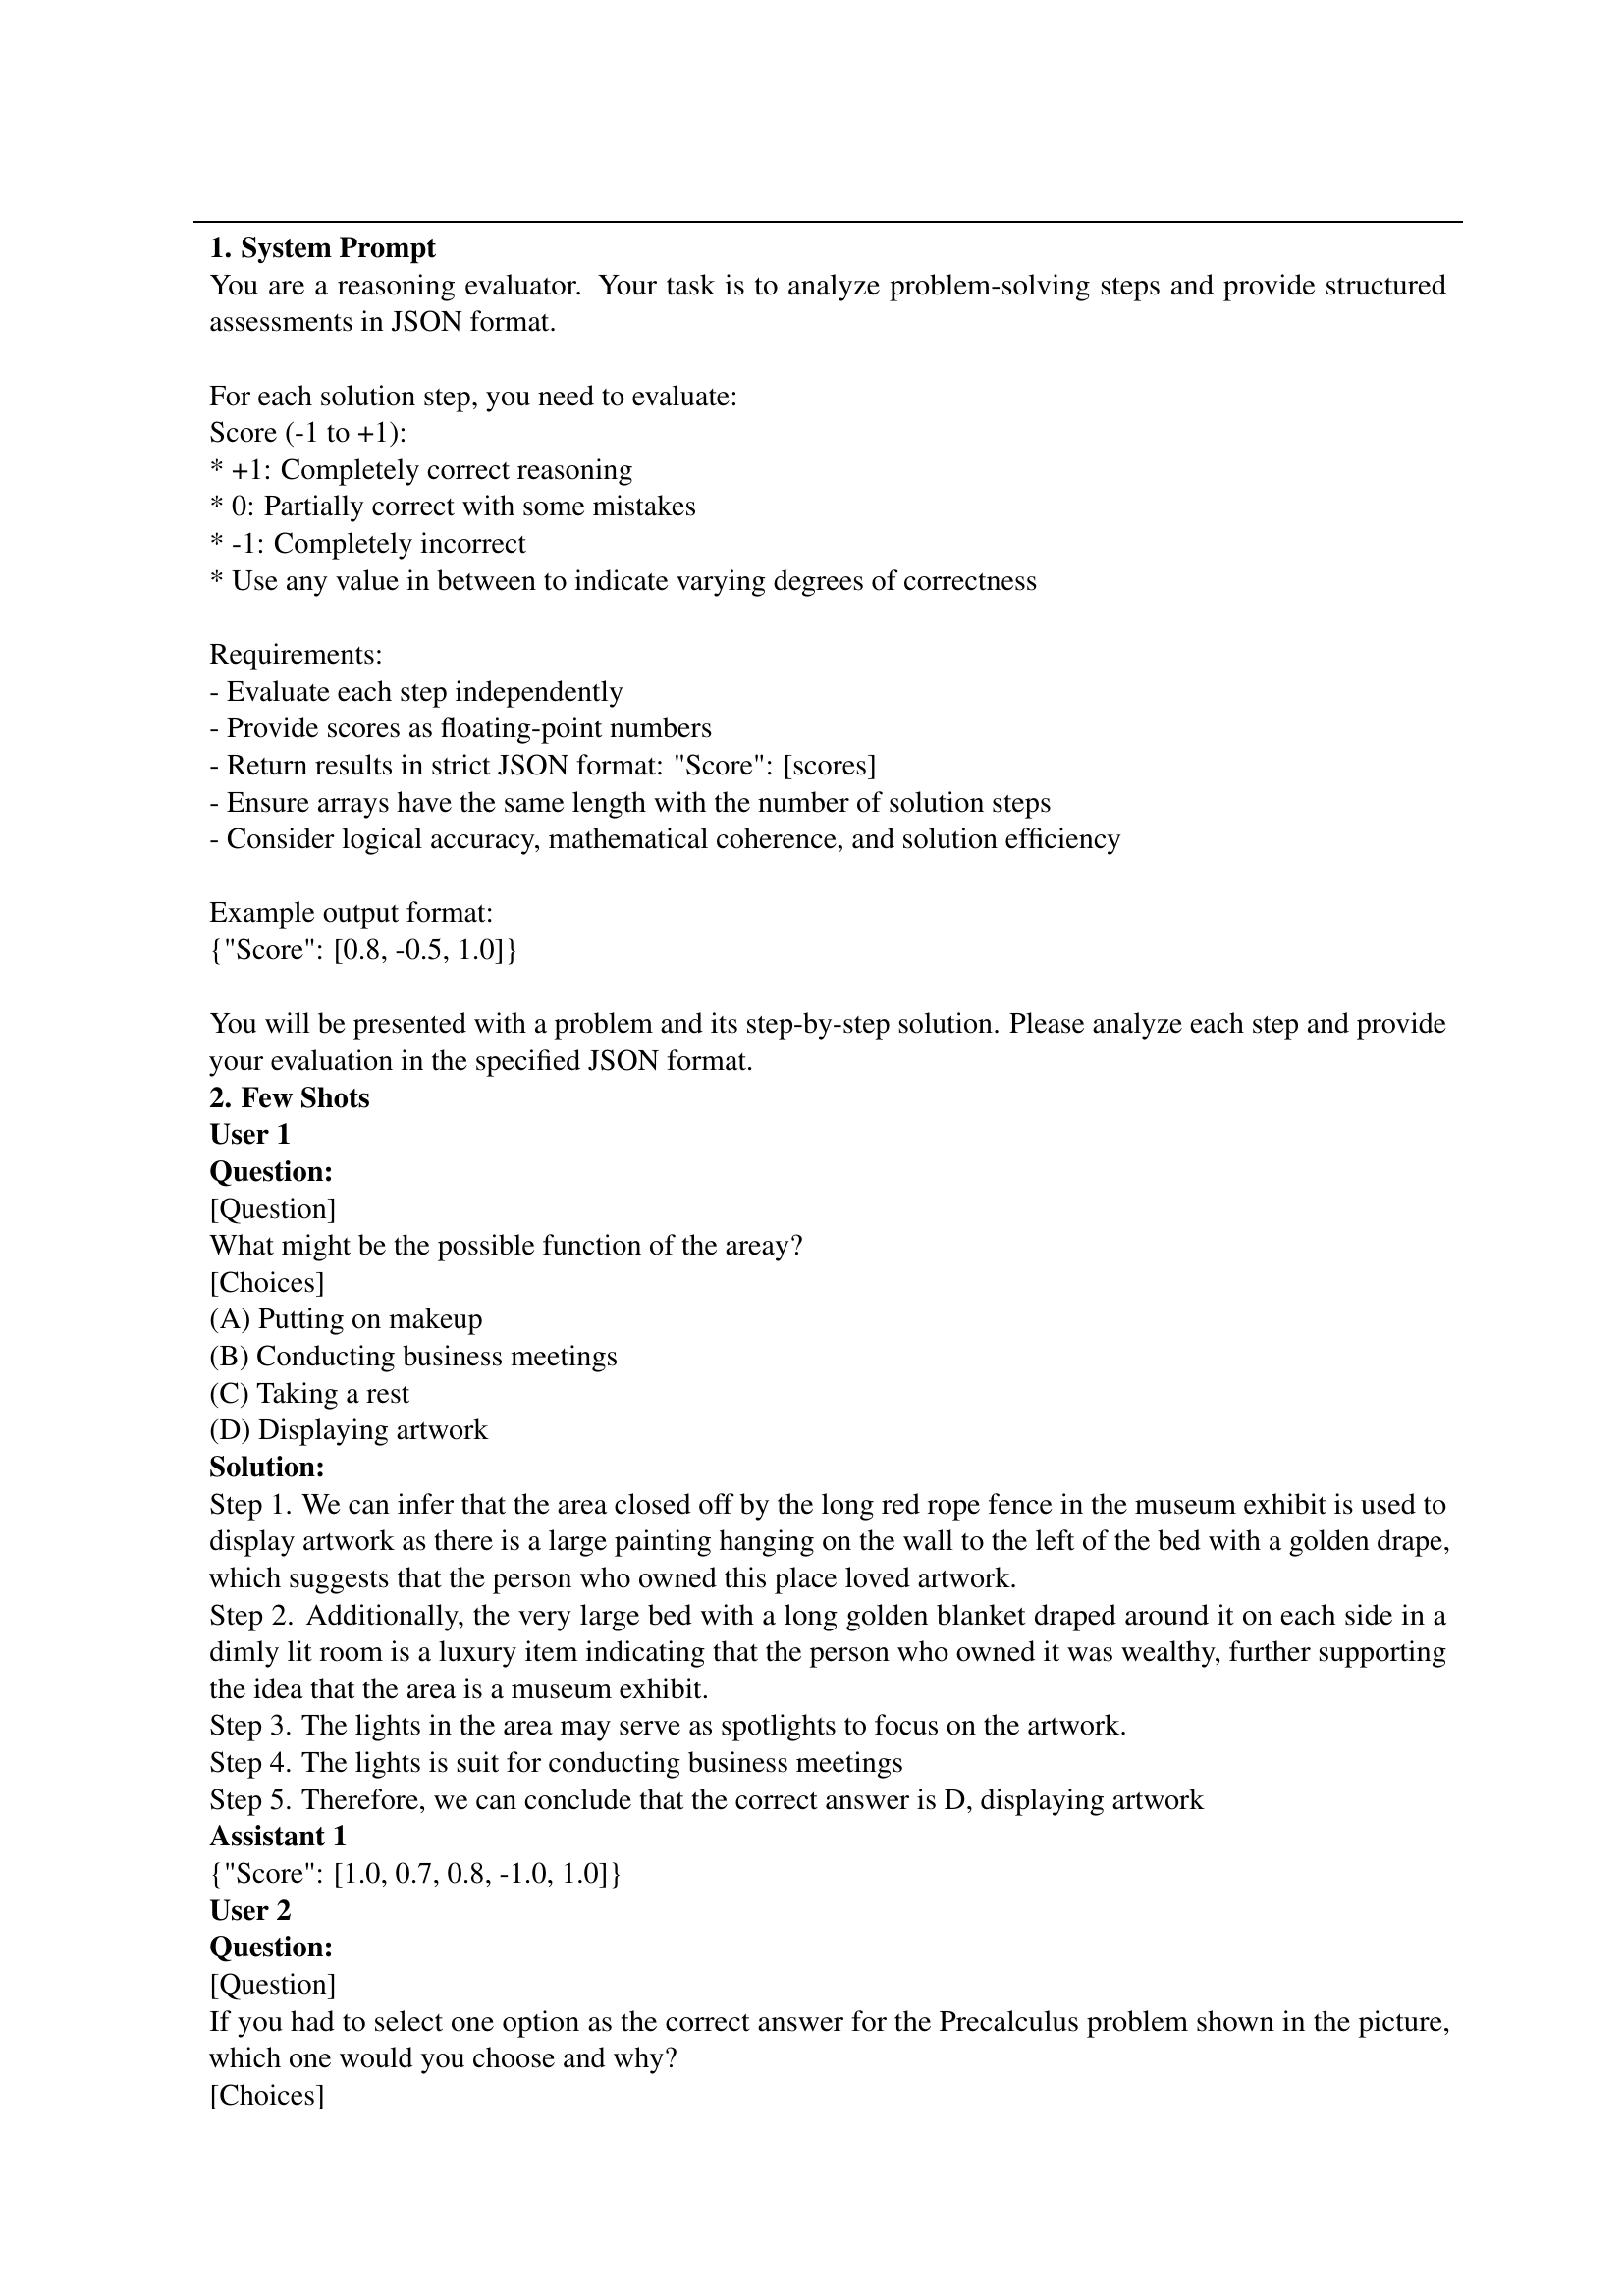
🔼 This table presents a few-shot prompt example designed to evaluate the performance of Process Reward Models (PRMs) in assessing the correctness of intermediate reasoning steps within a problem-solving process. The prompt provides a sample question and solution with step-by-step reasoning, and the evaluator is asked to provide a score for each step indicating its correctness. The scores should range from -1 (completely incorrect) to +1 (completely correct), allowing for nuanced assessments of partially correct steps. This evaluation focuses specifically on assessing the ability of PRMs to provide accurate feedback during the step-by-step process of problem solving.
read the caption
Table 5: Few-shot Prompt for evaluating PRM’s ability to assess the correctness of each intermediate reasoning step.
| Test Case |
| Size |
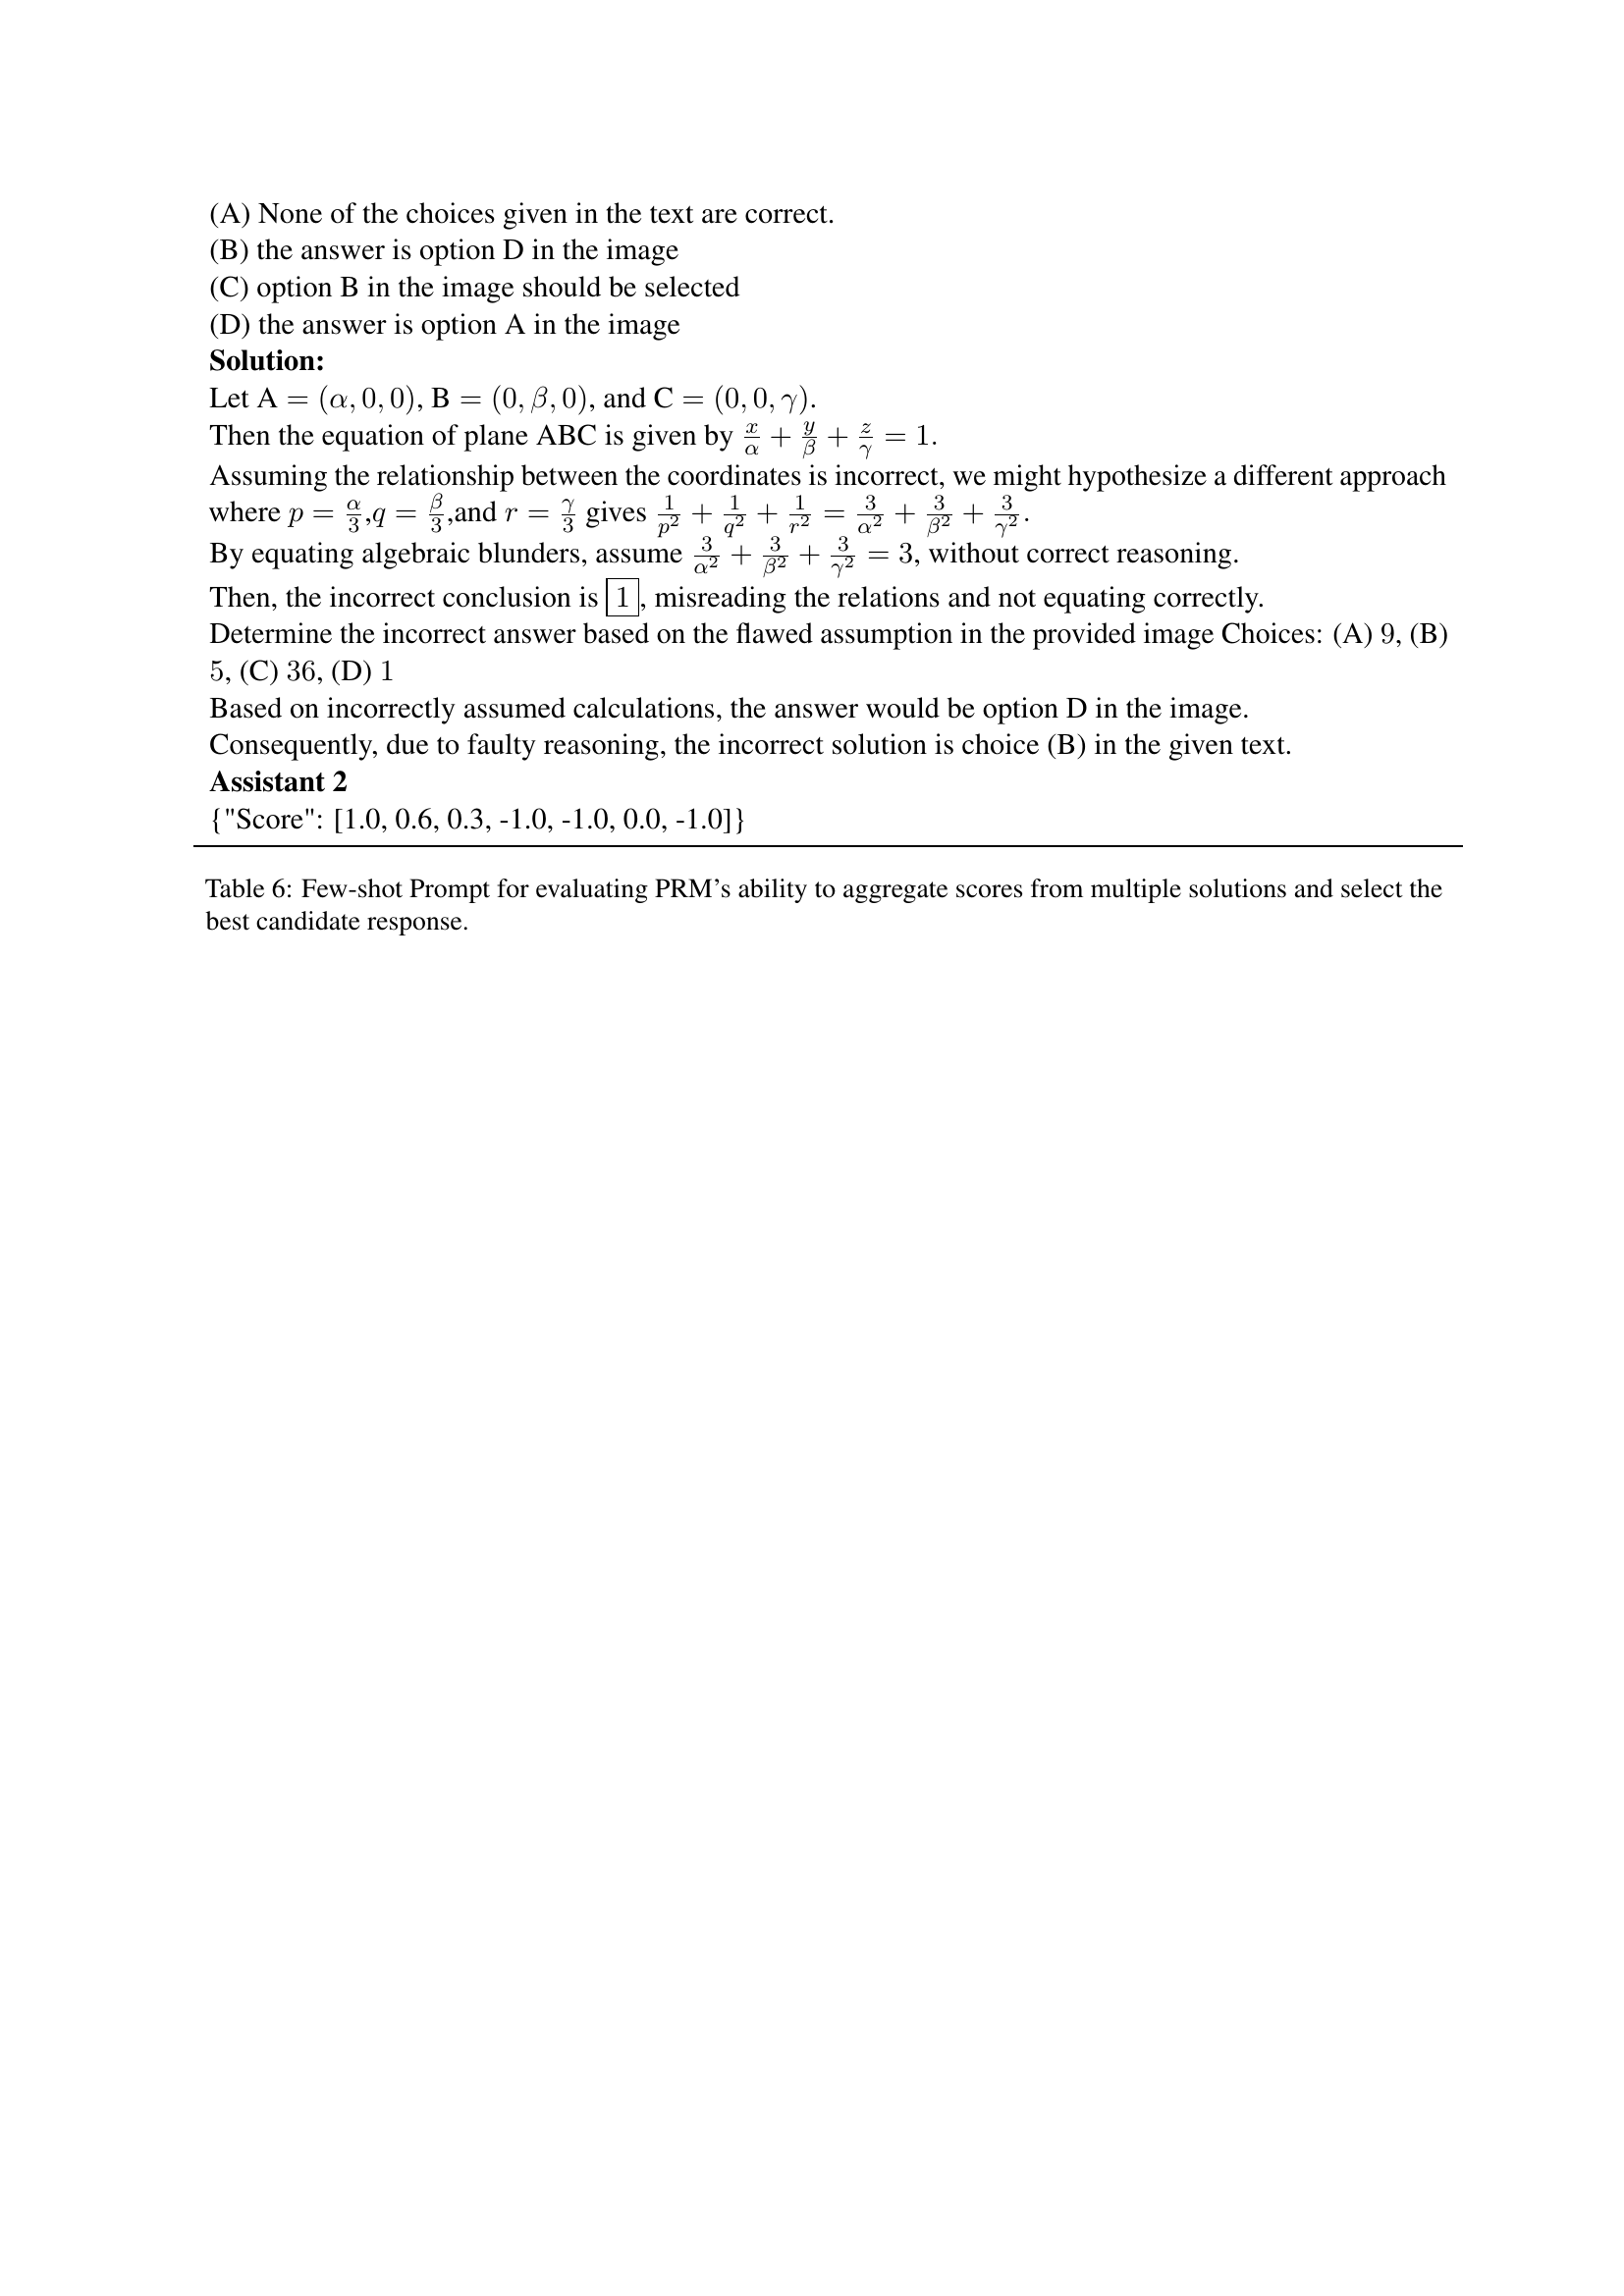
🔼 This table presents a few-shot example used to evaluate a Process Reward Model’s (PRM) capacity to aggregate scores from multiple solutions and choose the best one. The example includes a problem, several candidate solutions, and the expected JSON format for the PRM’s output, which should contain a score for each solution step indicating its correctness (-1 to +1). This demonstrates how a PRM processes multiple solution candidates to evaluate and rank their quality to ultimately select the best solution.
read the caption
Table 6: Few-shot Prompt for evaluating PRM’s ability to aggregate scores from multiple solutions and select the best candidate response.
| Model Name | Overall | Step Correctness | Answer Aggregation | Reasoning Process Search | ||||||
|---|---|---|---|---|---|---|---|---|---|---|
| FEI | AEI | Avg. | BoN | MV | Avg. | F1 | MCC | Avg. | ||
| Random | 31.8 | 9.1 | 50.0 | 29.6 | 40.9 | 40.9 | 40.9 | 50.0 | 0 | 25.0 |
| InternVL2.5-1B | 31.3-0.5 | 22.2 | 49.1 | 35.6 | 47.1 | 33.3 | 40.2 | 45.5 | -9.1 | 18.2 |
| InternVL2.5-8B | 48.3+16.5 | 36.7 | 56.9 | 46.8 | 79.5 | 58.0 | 68.7 | 53.1 | 6.3 | 29.7 |
| InternVL2.5-26B | 42.4+10.6 | 10.3 | 51.7 | 31.0 | 67.5 | 55.6 | 61.5 | 56.5 | 12.9 | 34.7 |
| InternVL2.5-38B | 49.7+17.9 | 55.3 | 28.2 | 38.9 | 74.6 | 57.2 | 66.9 | 55.4 | 11.2 | 33.5 |
| Qwen2.5-VL-3B | 37.6+5.8 | 1.6 | 48.2 | 24.9 | 76.8 | 55.0 | 65.9 | 48.1 | -3.8 | 22.1 |
| Qwen2-VL-7B | 42.4+10.6 | 6.8 | 51.3 | 29.1 | 85.2 | 50.6 | 67.9 | 53.6 | 7.1 | 30.3 |
| Qwen2.5-VL-7B | 45.7+13.9 | 9.8 | 54.2 | 32.0 | 59.0 | 52.5 | 55.8 | 66.3 | 32.5 | 49.4 |
| Qwen2.5-VL-72B | 55.8+24.0 | 24.8 | 65.2 | 45.0 | 81.6 | 69.8 | 75.7 | 64.4 | 28.8 | 46.6 |
| QVQ | 41.8+10.0 | 15.5 | 55.6 | 35.5 | 63.6 | 51.7 | 57.7 | 54.8 | 9.6 | 32.2 |
| Gemini-2.0-flash-exp | 65.4+33.6 | 53.8 | 74.9 | 64.4 | 82.2 | 69.6 | 75.9 | 70.5 | 41.1 | 55.8 |
| Gemini-2.0-thinking-exp | 64.6+32.8 | 54.0 | 74.9 | 64.4 | 81.7 | 67.7 | 74.7 | 69.8 | 39.6 | 54.7 |
| GPT-4o | 71.2+39.4 | 51.2 | 74.4 | 62.8 | 85.3 | 62.2 | 73.7 | 84.7 | 69.5 | 77.1 |
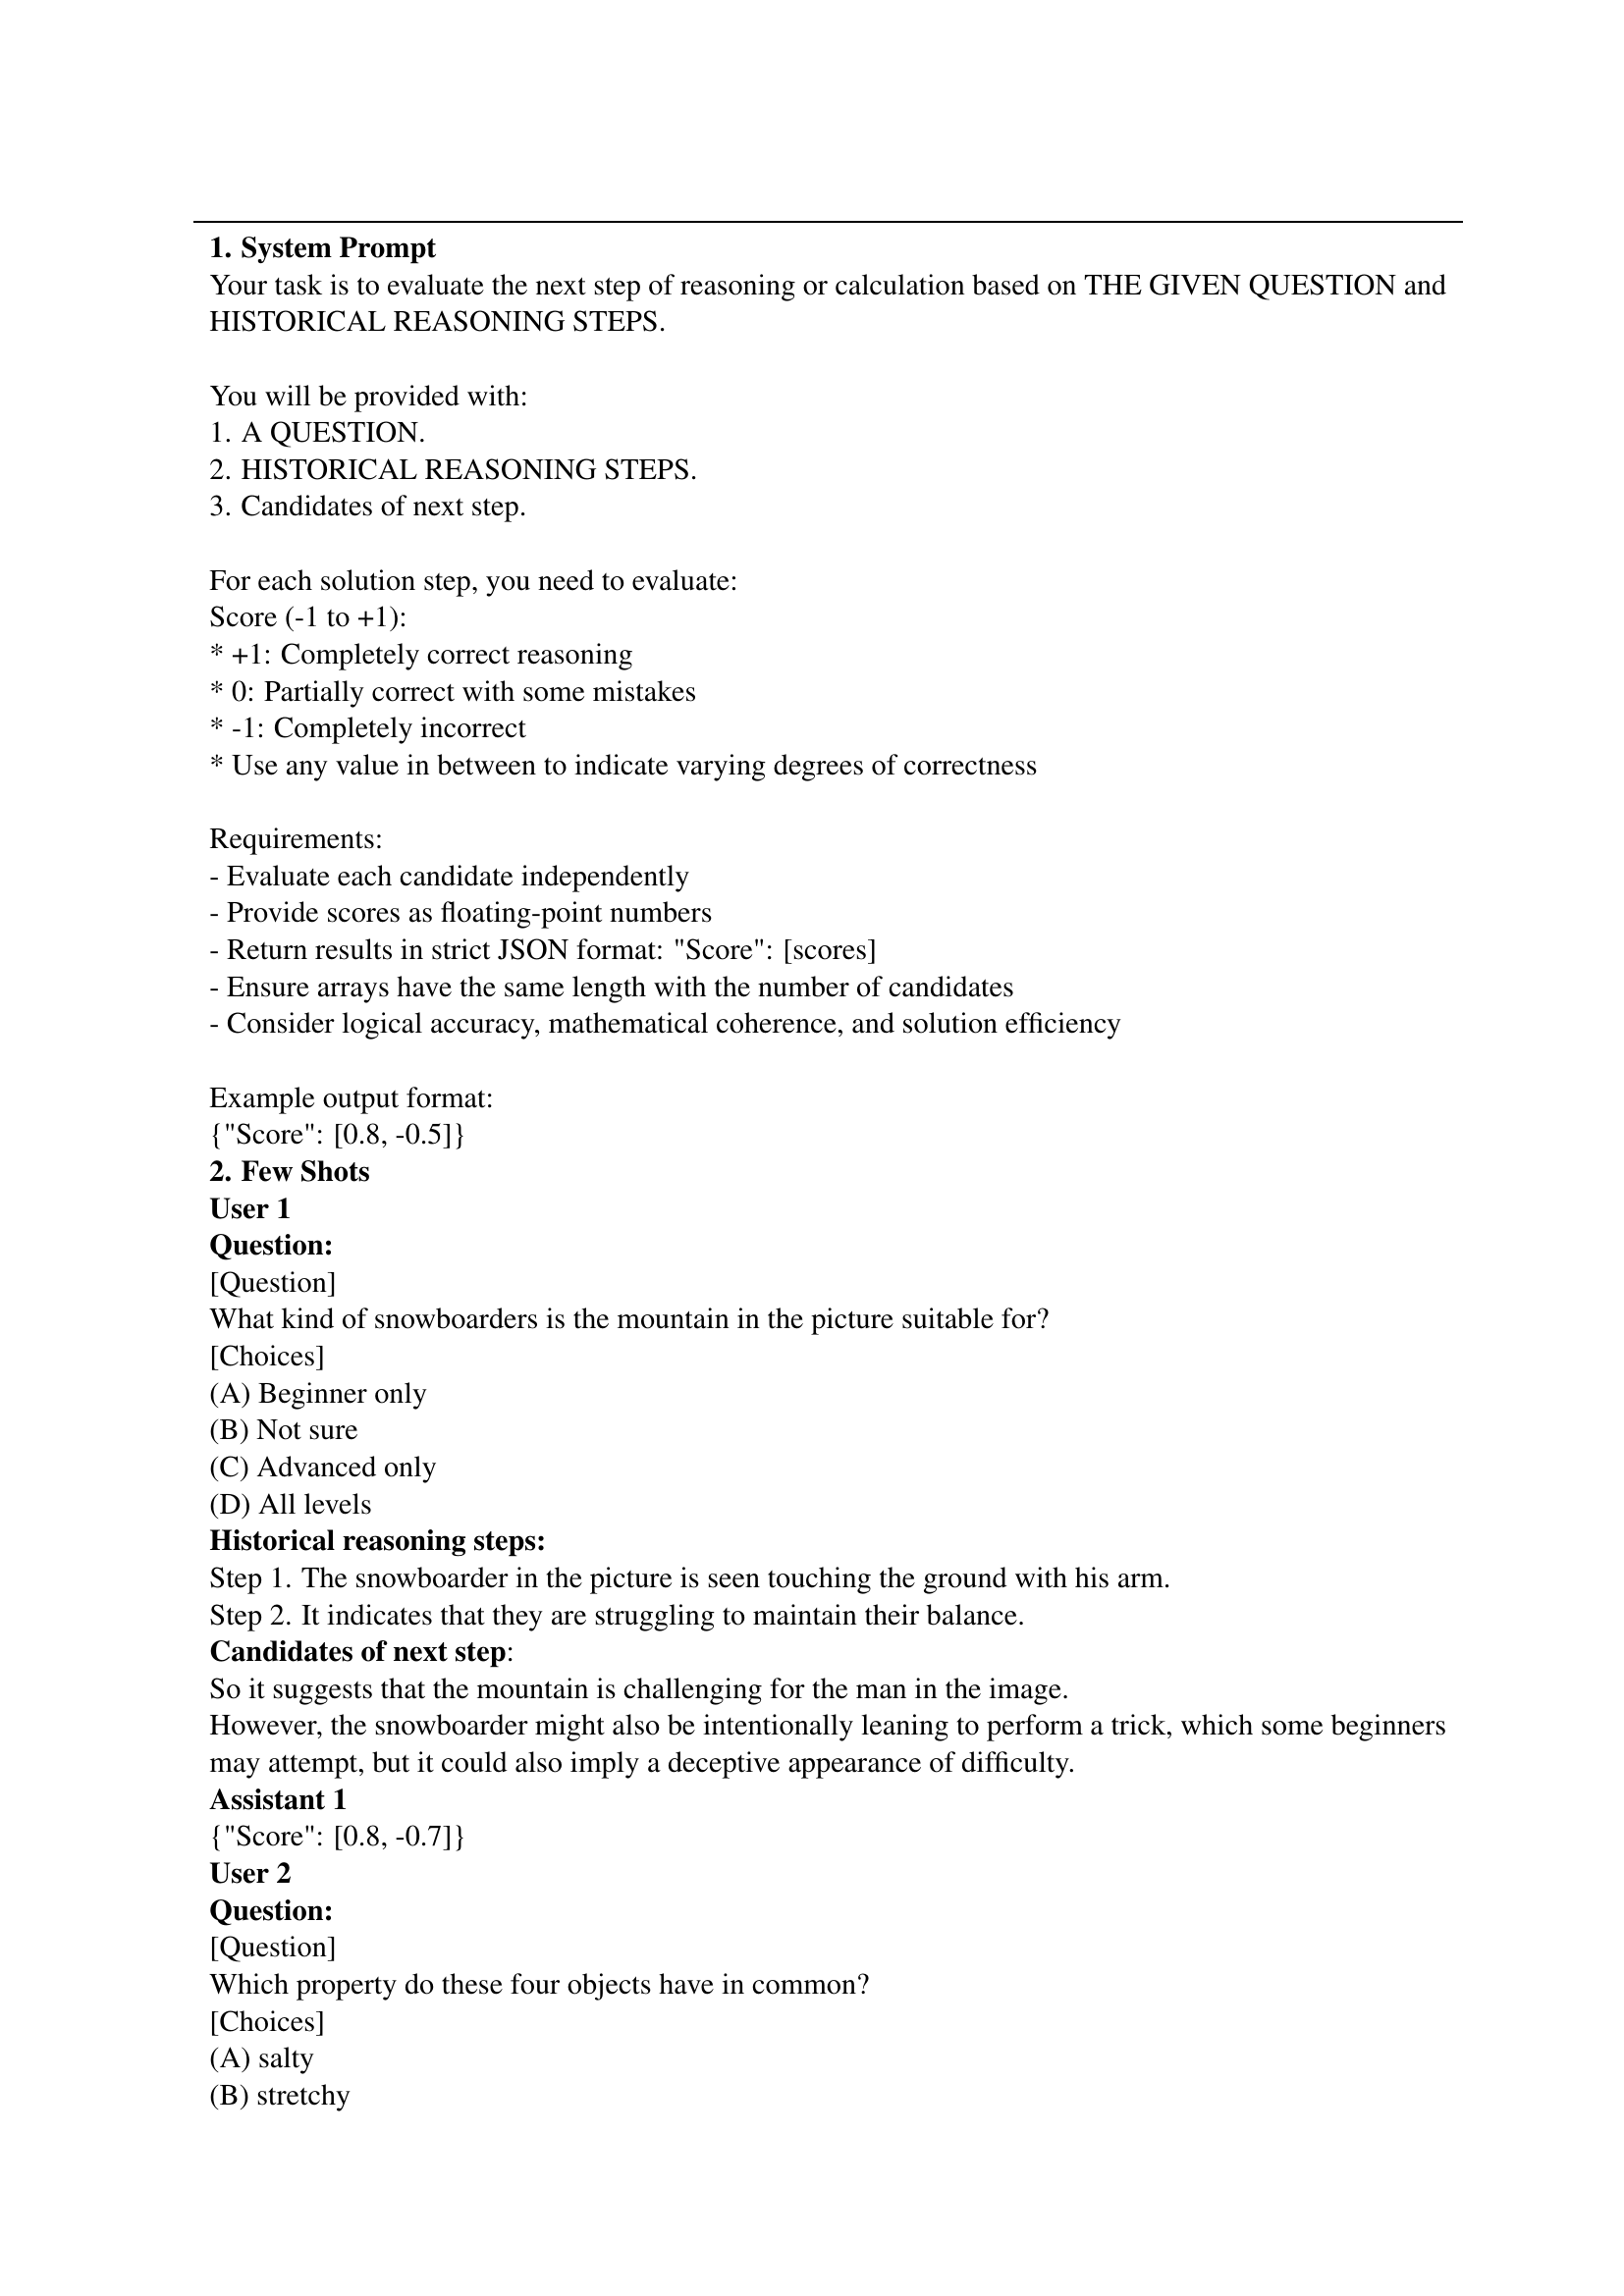
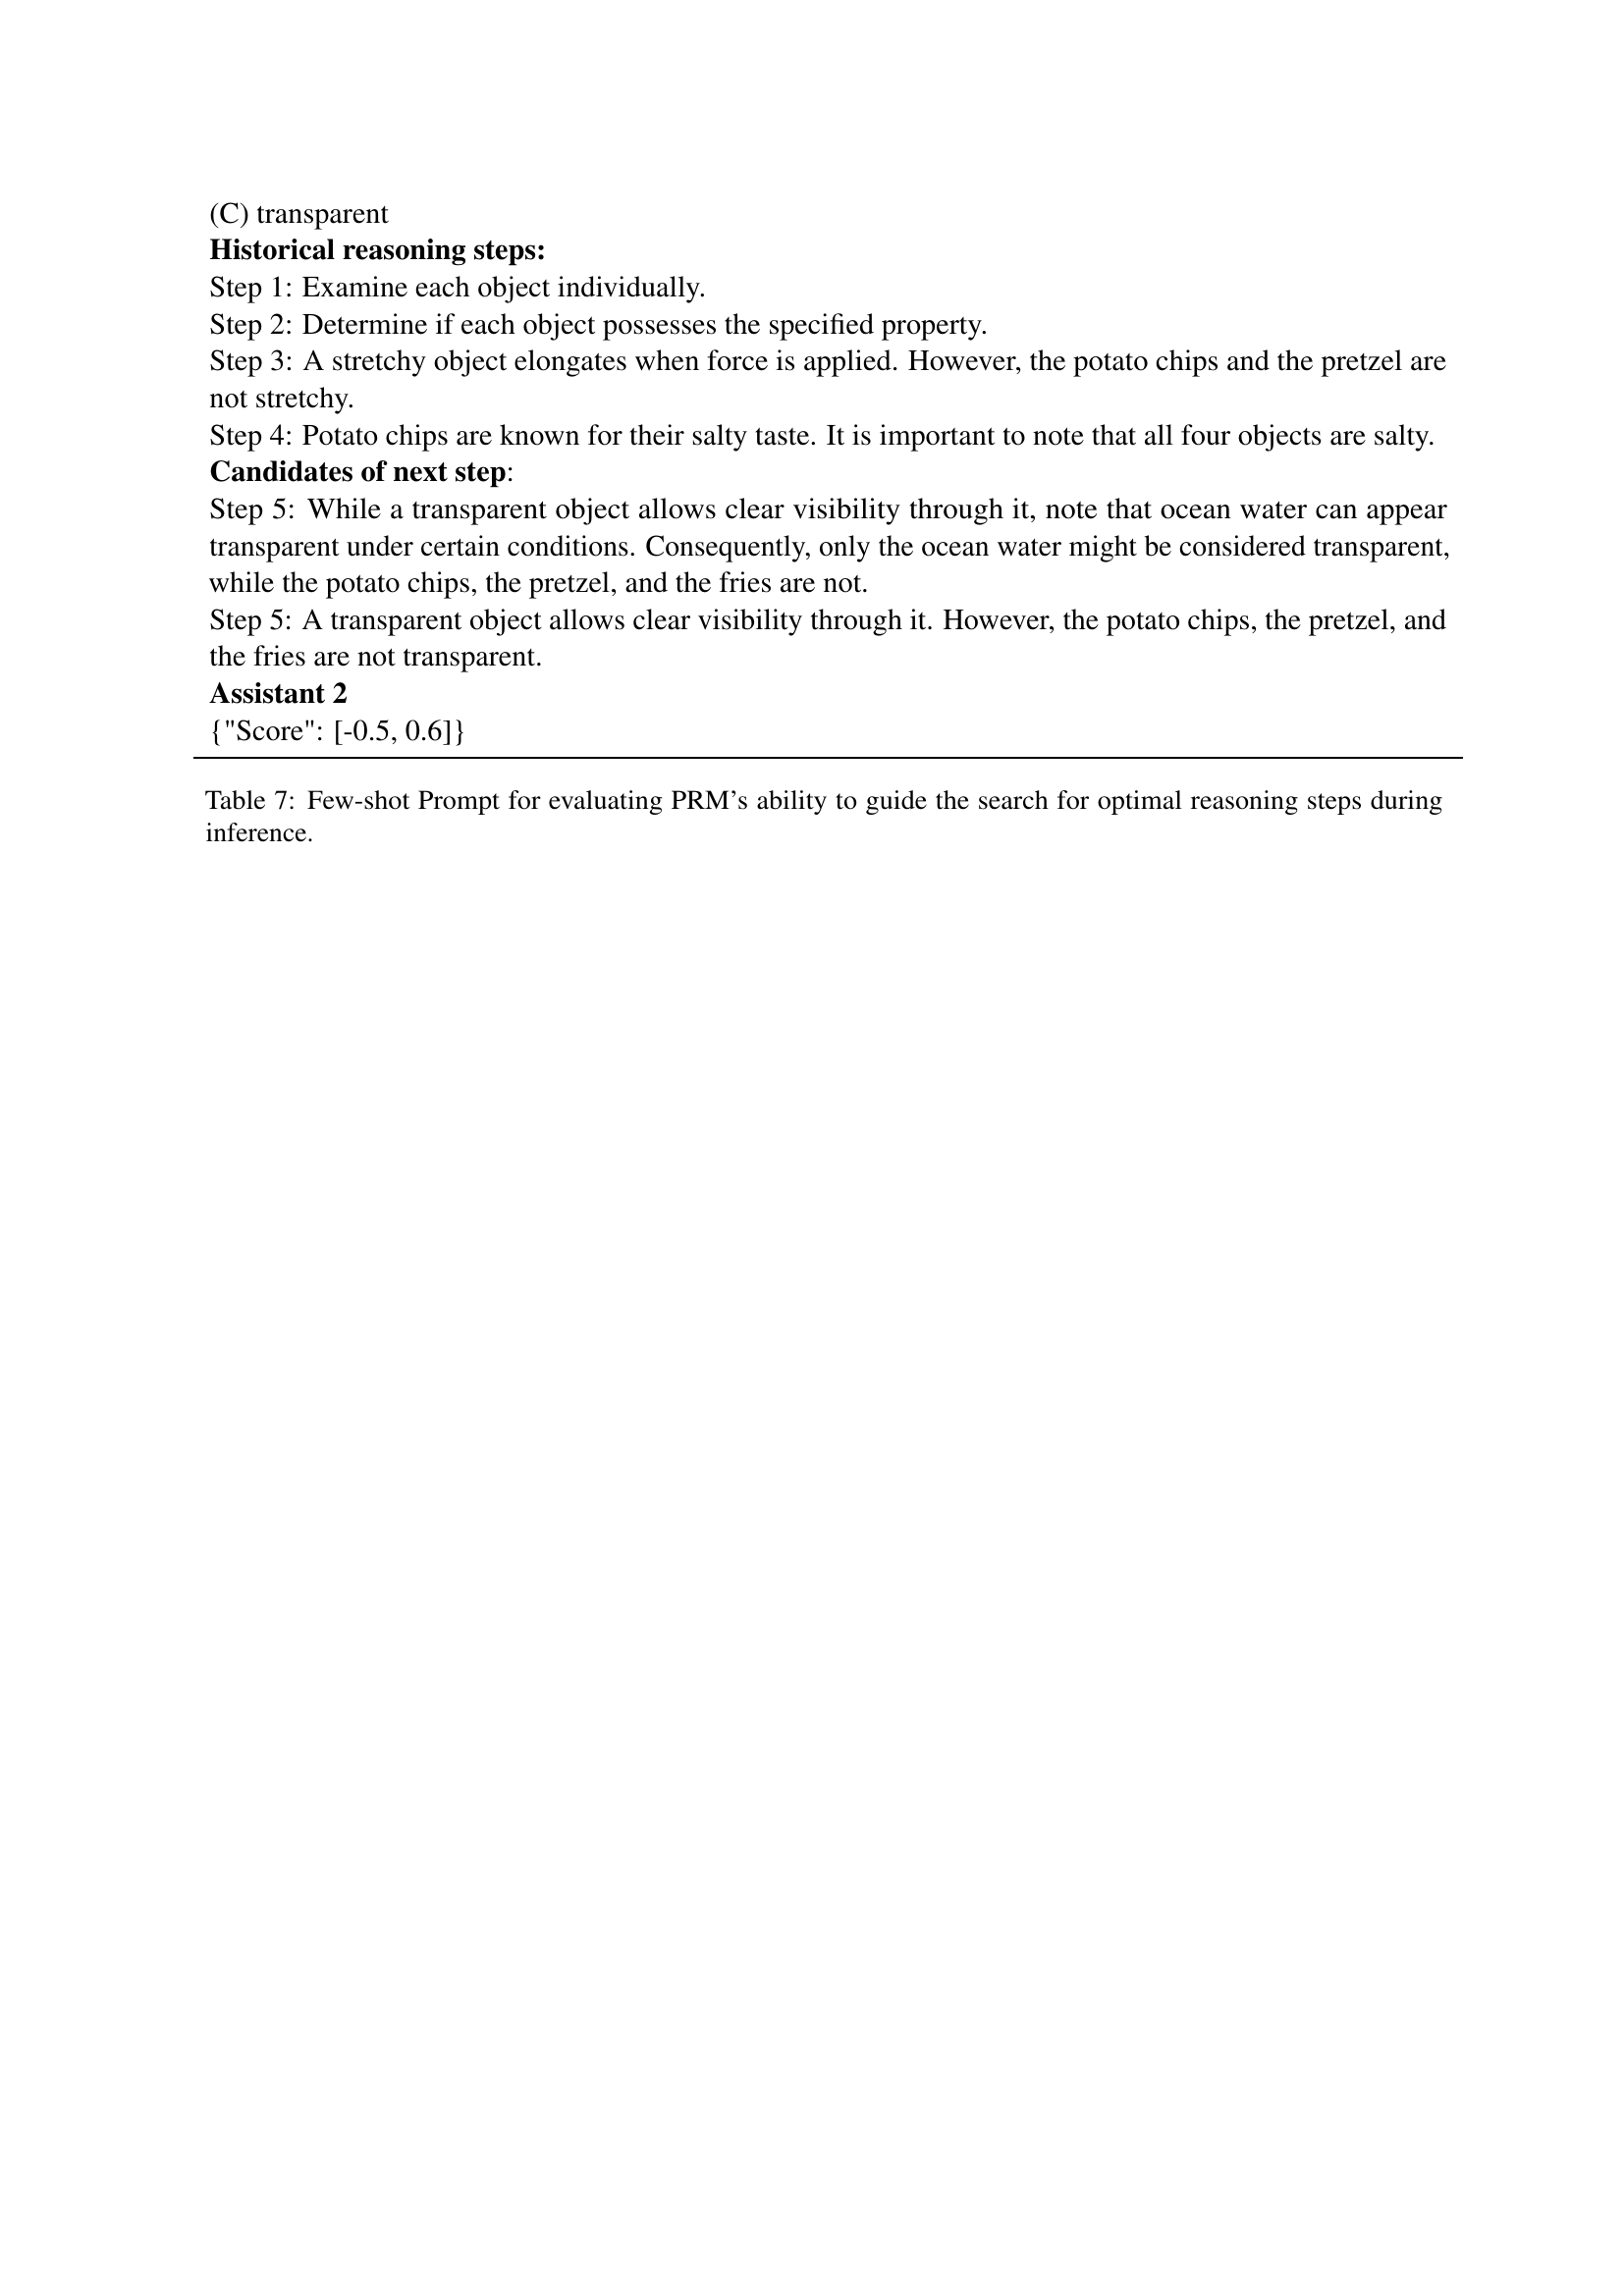
🔼 This table displays a few-shot example used in the paper to evaluate the ability of Process Reward Models (PRMs) to guide the search for optimal reasoning steps during inference. The example shows a question, historical reasoning steps, and candidate next steps. The evaluator must assign scores (-1 to +1) to each candidate step, indicating its correctness and quality, and return the results in JSON format. This assesses the PRM’s capacity to effectively direct the reasoning process towards the best solution.
read the caption
Table 7: Few-shot Prompt for evaluating PRM’s ability to guide the search for optimal reasoning steps during inference.
Full paper#