TL;DR#
Training AI agents to use computer interfaces is tough due to the need for high-quality training data. Behavior cloning alone is not enough. To tackle this, the paper designs STEVE, a pipeline that verifies each step an agent takes. It uses GPT-40 to check if each action is correct based on the before-and-after screens and labels each step. The agent then learns to improve using stepwise labels.
The STEVE pipeline trains agents using KTO, outperforming supervised finetuning by using both positive and negative feedback. It also allows training a 7B vision-language model to become a computer-use agent, achieving top performance in the WinAgentArena desktop environment with great efficiency and lower costs. It sets a new state of the art in UI localization benchmarks.
Key Takeaways#
Why does it matter?#
This paper introduces STEVE, a step verification pipeline, enhancing computer-use agent training. It addresses critical challenges in GUI interaction and offers a scalable, cost-effective solution, opening new avenues for research in AI-driven desktop automation and human-computer interaction.
Visual Insights#

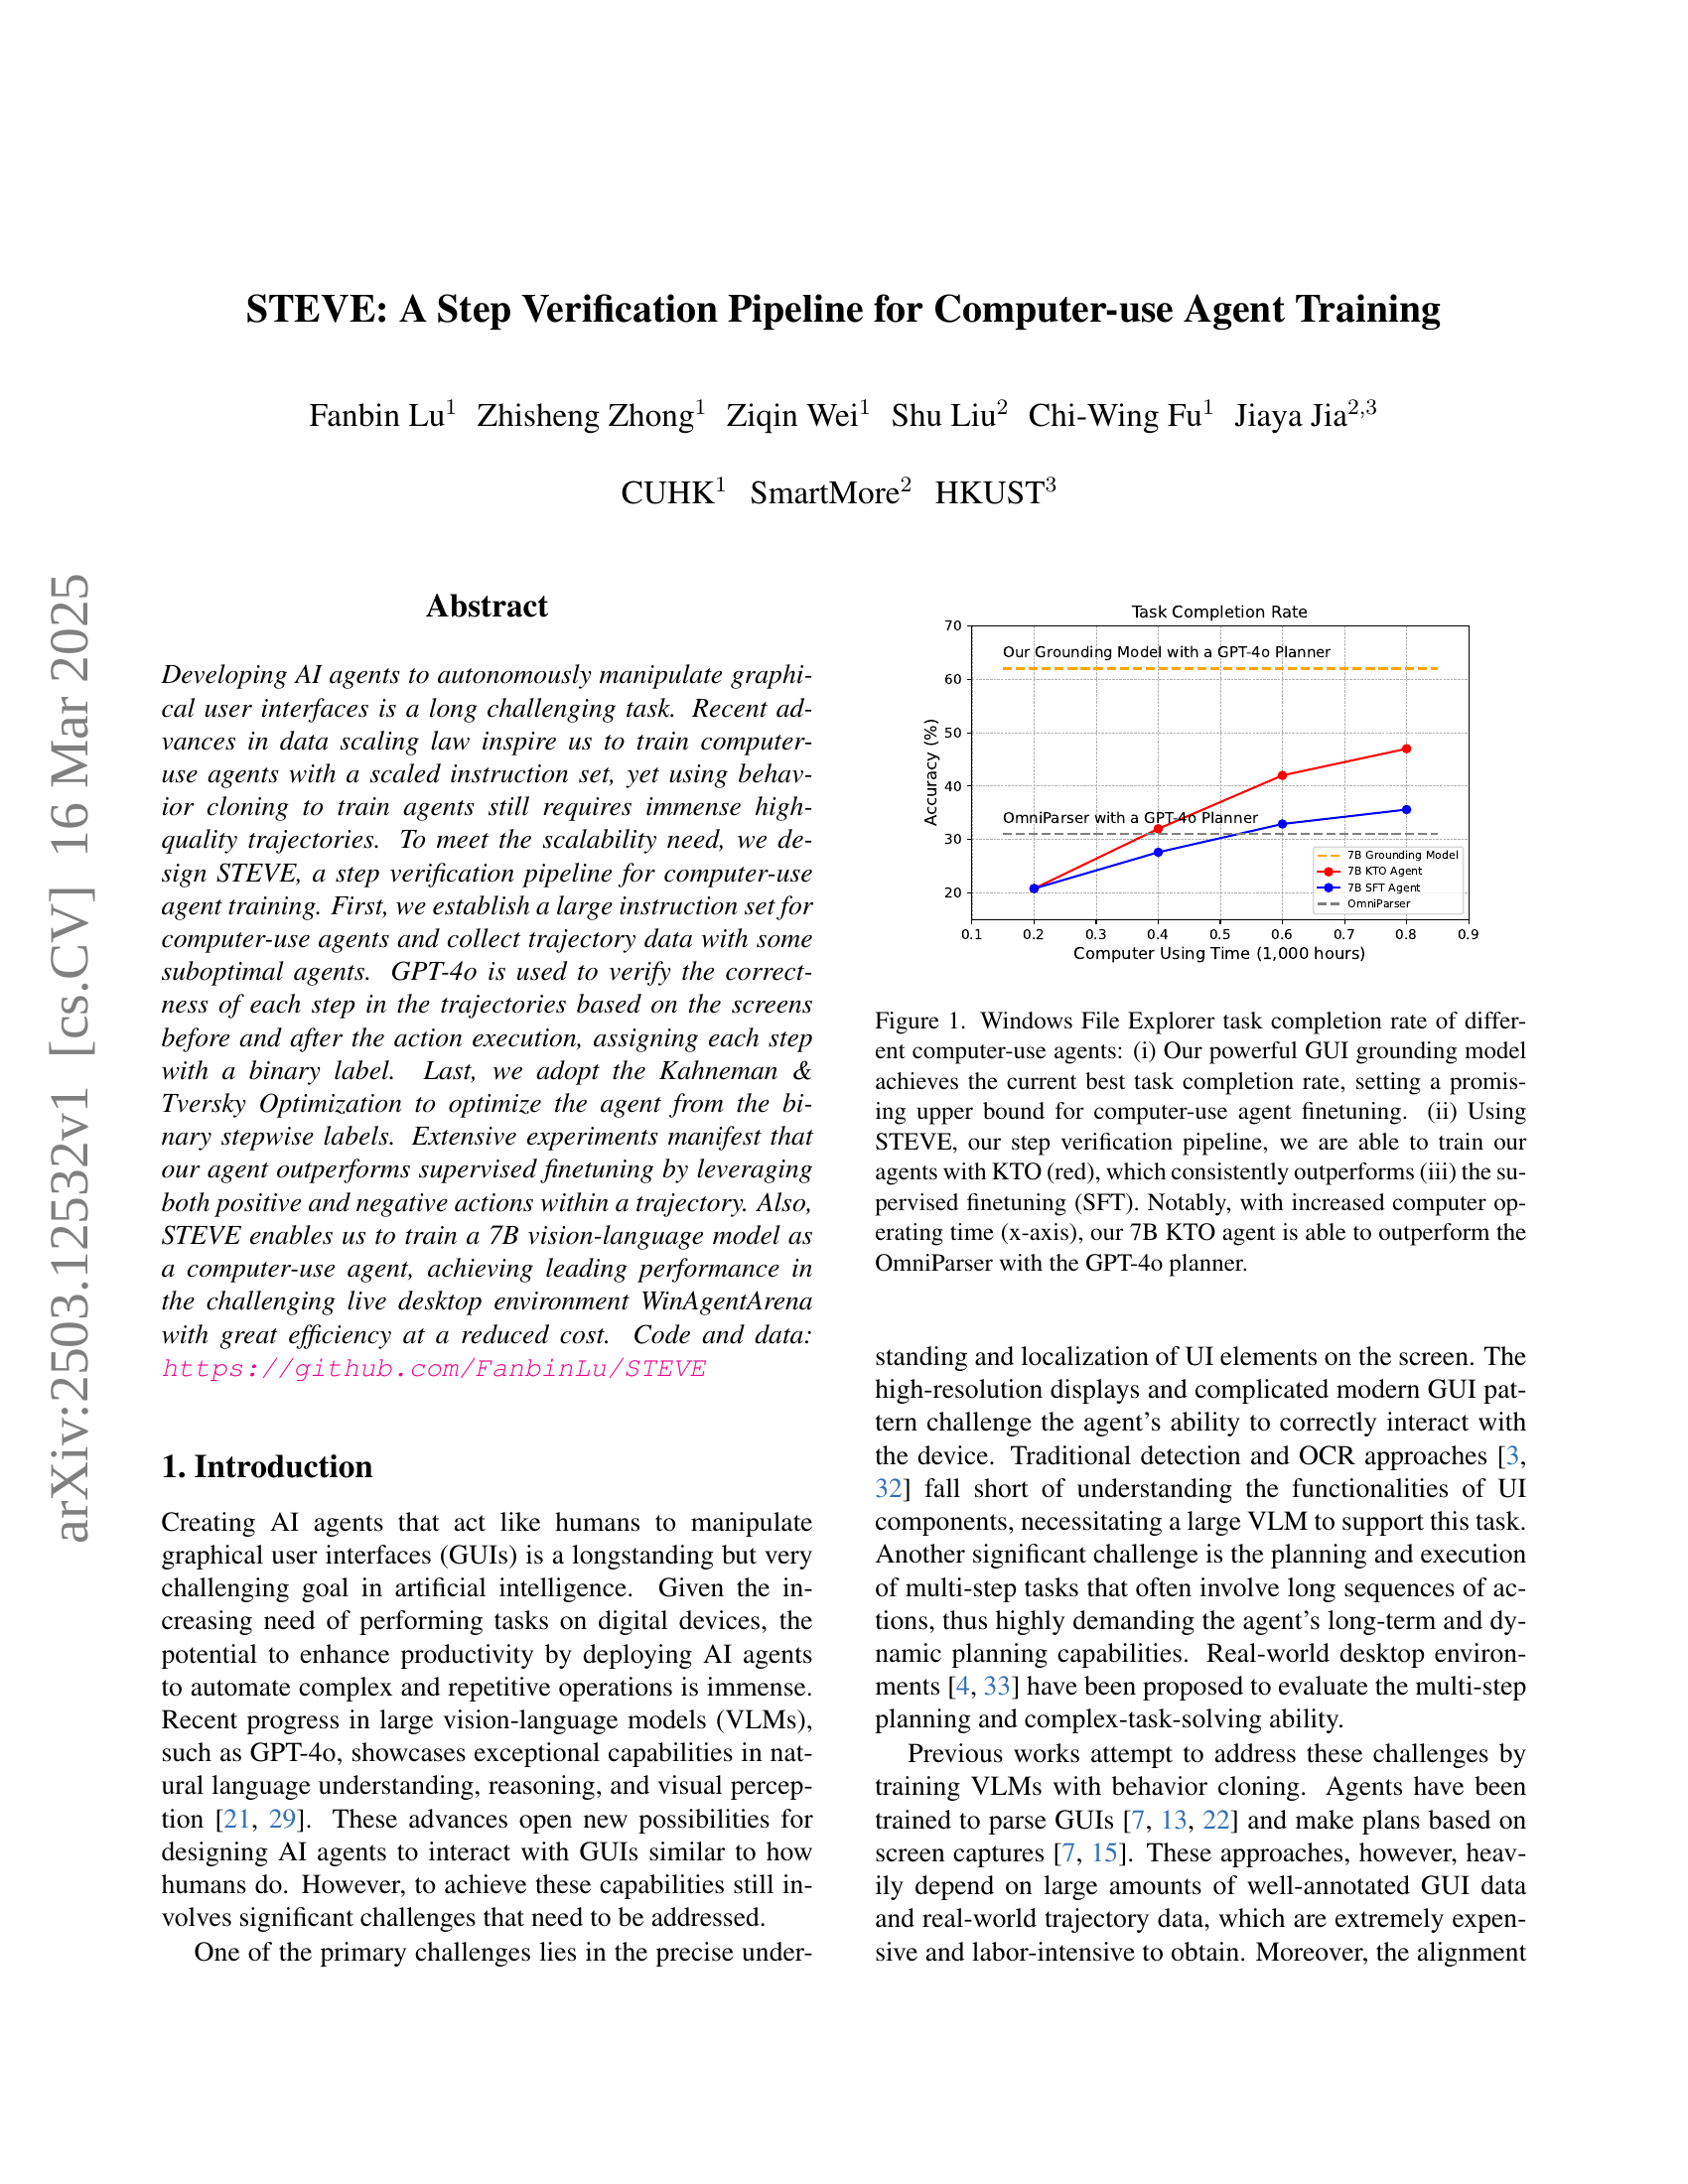
🔼 This figure displays the task completion rate for different computer-use agents on a Windows File Explorer task. The y-axis represents the accuracy or task completion rate, while the x-axis shows the amount of computer time used for training (in thousands of hours). Three key observations are highlighted: (i) The authors’ GUI grounding model achieves the highest task completion rate, suggesting an upper bound for performance achievable with fine-tuning methods; (ii) Their agent trained using STEVE and the KTO optimization (red line) consistently outperforms an agent trained using supervised fine-tuning (SFT, blue line); (iii) With increased training time, their 7B KTO agent surpasses the OmniParser, which is a state-of-the-art agent using a GPT-40 planner.
read the caption
Figure 1: Windows File Explorer task completion rate of different computer-use agents: (i) Our powerful GUI grounding model achieves the current best task completion rate, setting a promising upper bound for computer-use agent finetuning. (ii) Using STEVE, our step verification pipeline, we are able to train our agents with KTO (red), which consistently outperforms (iii) the supervised finetuning (SFT). Notably, with increased computer operating time (x-axis), our 7B KTO agent is able to outperform the OmniParser with the GPT-4o planner.
| Dataset | Annotation | Num. Image | Num. elements |
|---|---|---|---|
| WebUI [31] | DOM, OCR | 180K | 1M |
| Seeclick [7] | DOM | 10K | 150K |
| AITW [25] | Caption | 15K | - |
| Allava [5] | general QA | 50K | - |
| Windows OS | A11y, GPT-4o | 10K | 80K |
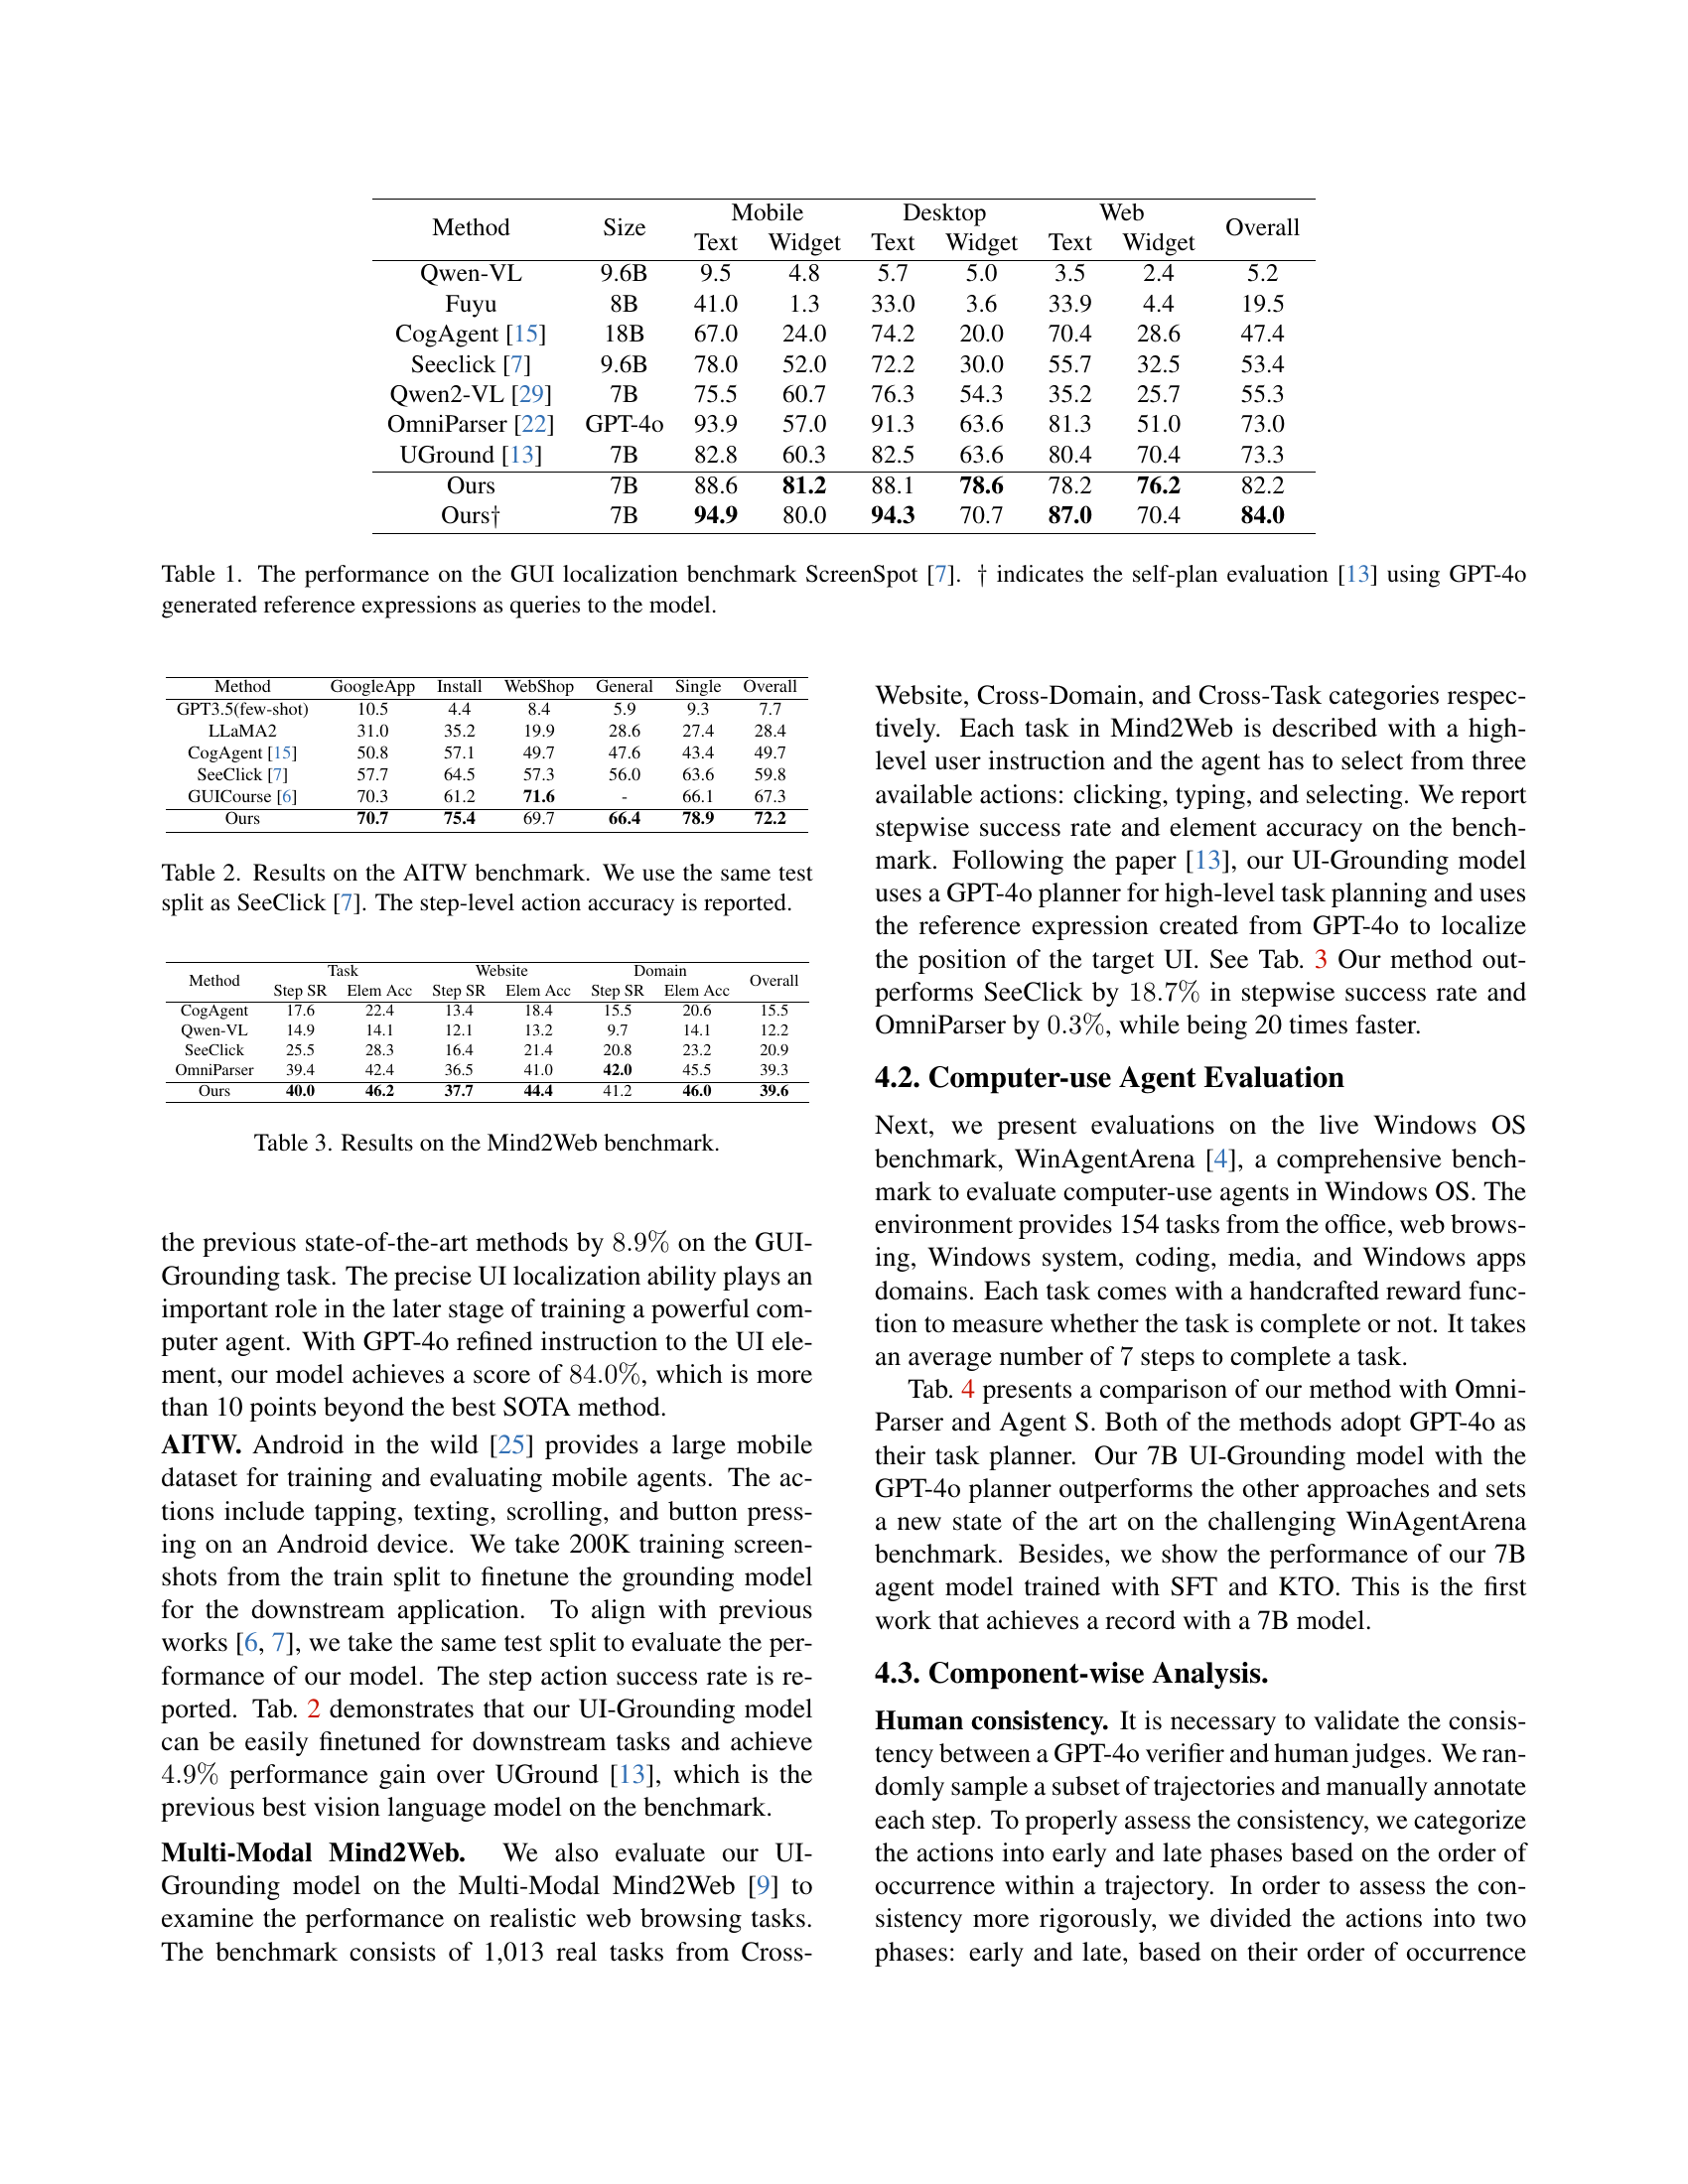
🔼 This table presents the results of evaluating the performance of different methods on the ScreenSpot GUI localization benchmark. The benchmark assesses the ability of models to accurately locate graphical user interface (GUI) elements within screenshots based on textual descriptions. The table shows the performance of various methods (including the authors’ approach and several state-of-the-art alternatives) broken down by GUI element type (text and widget) and across three different domains (mobile, desktop, and web). The ‘Overall’ column provides a combined performance score across all categories. The notation † indicates that self-plan evaluation was used, employing GPT-4 to generate queries for the models.
read the caption
Table 1: The performance on the GUI localization benchmark ScreenSpot [7]. ††\dagger† indicates the self-plan evaluation [13] using GPT-4o generated reference expressions as queries to the model.
In-depth insights#
GUI Agent STEVE#
While the paper doesn’t have a section explicitly titled ‘GUI Agent STEVE,’ the entire work revolves around it. STEVE is presented as a step verification pipeline designed to improve the training of computer-use agents. The core idea lies in using a large vision-language model (VLM), specifically GPT-40, to verify the correctness of each step an agent takes during a task. This provides a dense, stepwise reward signal, addressing the limitations of sparse rewards in reinforcement learning and the high cost of human-annotated trajectories. The paper thoroughly investigates how STEVE, combined with Kahneman-Tversky Optimization (KTO), can effectively leverage both positive and negative feedback to train agents that excel in GUI interaction, achieving state-of-the-art performance in the WinAgentArena environment. The research demonstrates STEVE’s ability to scale agent training, avoid UI localization degradation, and enhance efficiency in complex desktop tasks.
Step Verification#
The step verification process in this research paper presents a method to validate each action an AI agent takes, which enhances the agent’s learning. GPT-40 acts as a judge, evaluating whether an action moves the agent closer to the goal. This creates denser reward signals, compared to only rewarding task completion, improving learning efficiency. By verifying steps, the system identifies both good and bad actions, offering a more nuanced training signal. This approach reduces the need for meticulously crafted reward functions, instead using a powerful VLM to scale task instructions and evaluate agent behavior. Overall, it improves the agent’s performance by providing detailed, actionable feedback for each step.
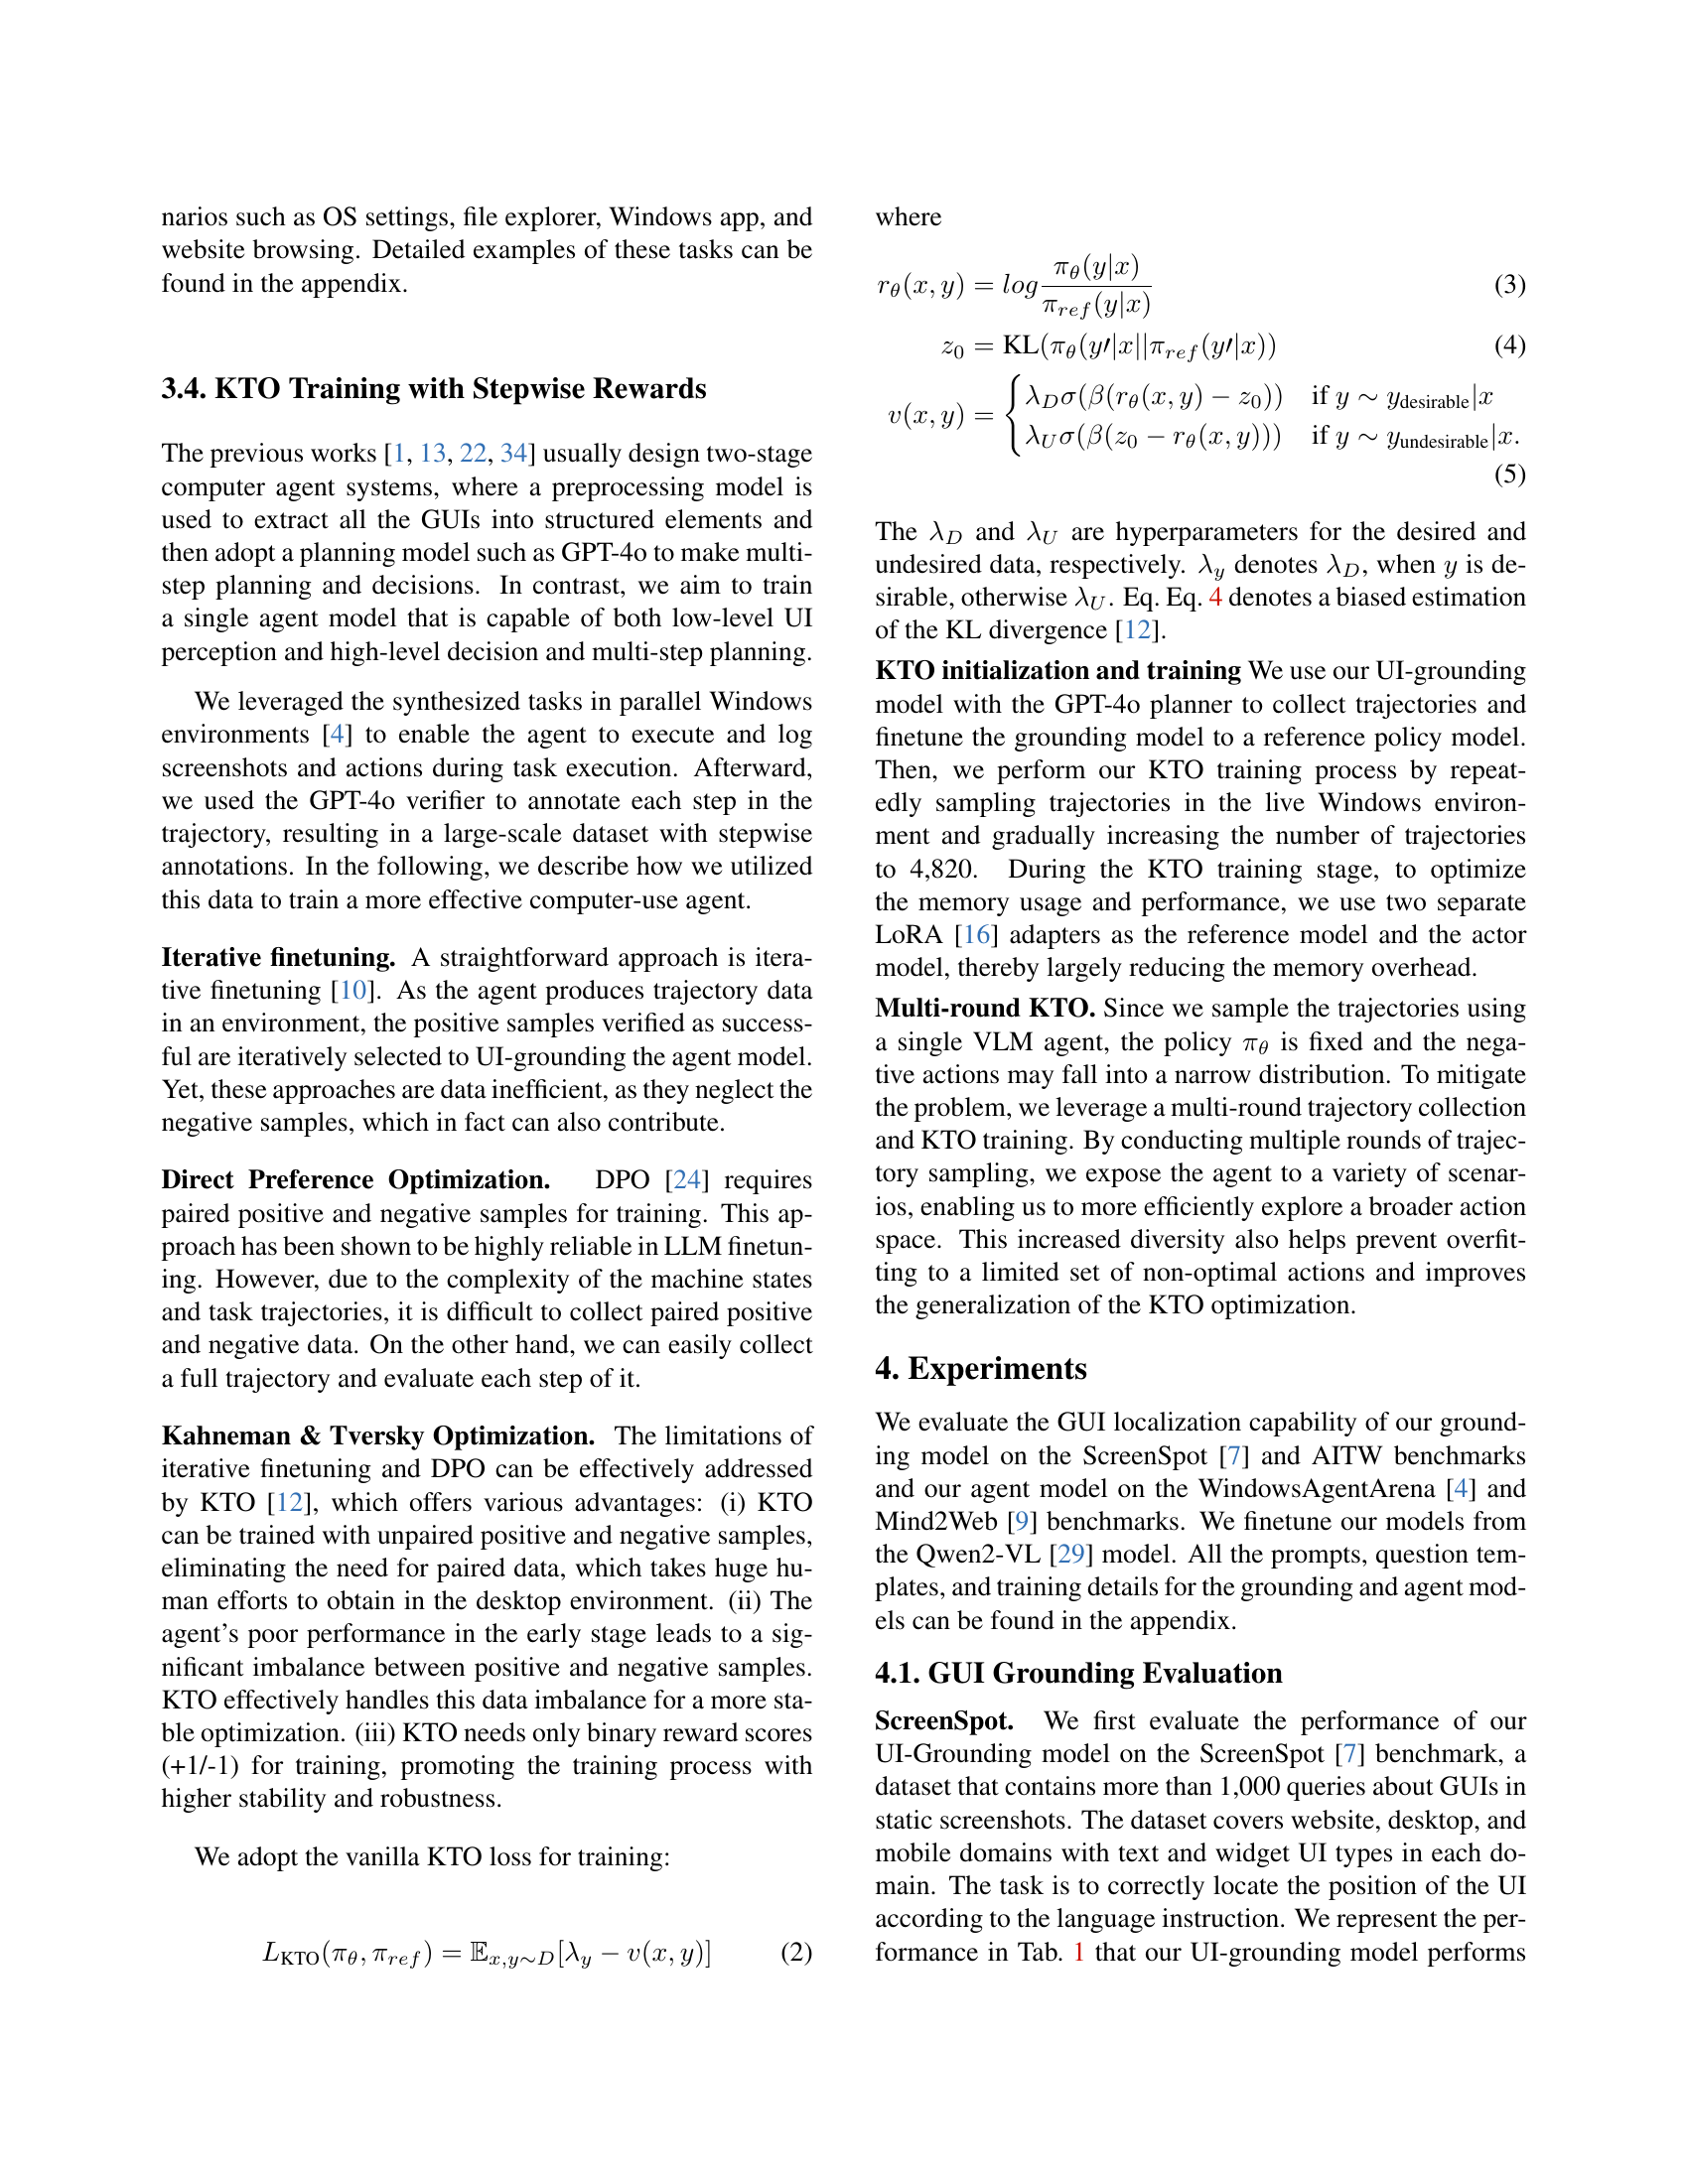
KTO Optimization#
KTO optimization, drawing from Kahneman & Tversky’s prospect theory, stands out as a technique with several key advantages. First, it effectively handles unpaired positive and negative samples, a significant benefit given the difficulty of obtaining paired data in complex desktop environments. The algorithm is able to address the data imbalance. Finally, the use of binary reward scores (+1/-1) simplifies training, promoting higher stability and robustness. This approach is a good fit for many different tasks and data, and it effectively leverages both positive and negative feedback.
UI Grounding VLM#
Based on the information, UI-grounding VLM focuses on specialized visual grounding to enhance agent interaction. Training datasets leverage web DOM, desktop screenshots via tools like OmniParser, and Ally Trees for UI element extraction. Screenshot captioning enriches understanding. This comprehensive approach leads to accurate localization in 1080p screenshots and improves performance on benchmarks like ScreenSpot, AITW and Mind2Web.
WinAgentArena#
The ‘WinAgentArena’ benchmark, as highlighted in the research paper, is a significant contribution to the field of computer-use agent evaluation. It provides a standardized, real-world environment within the Windows operating system, allowing for rigorous assessment of agent capabilities in complex, multi-step tasks. Its value lies in its ability to simulate realistic user scenarios, fostering the development of agents that can effectively navigate desktop environments. The arena’s comprehensive nature, encompassing diverse tasks and applications, facilitates comparative analysis between different agent architectures, driving innovation and progress. The complexity and scale of this environment, further enhances its significance as a robust testing ground for evaluating the generalization and adaptability of computer-use agents.
More visual insights#
More on figures

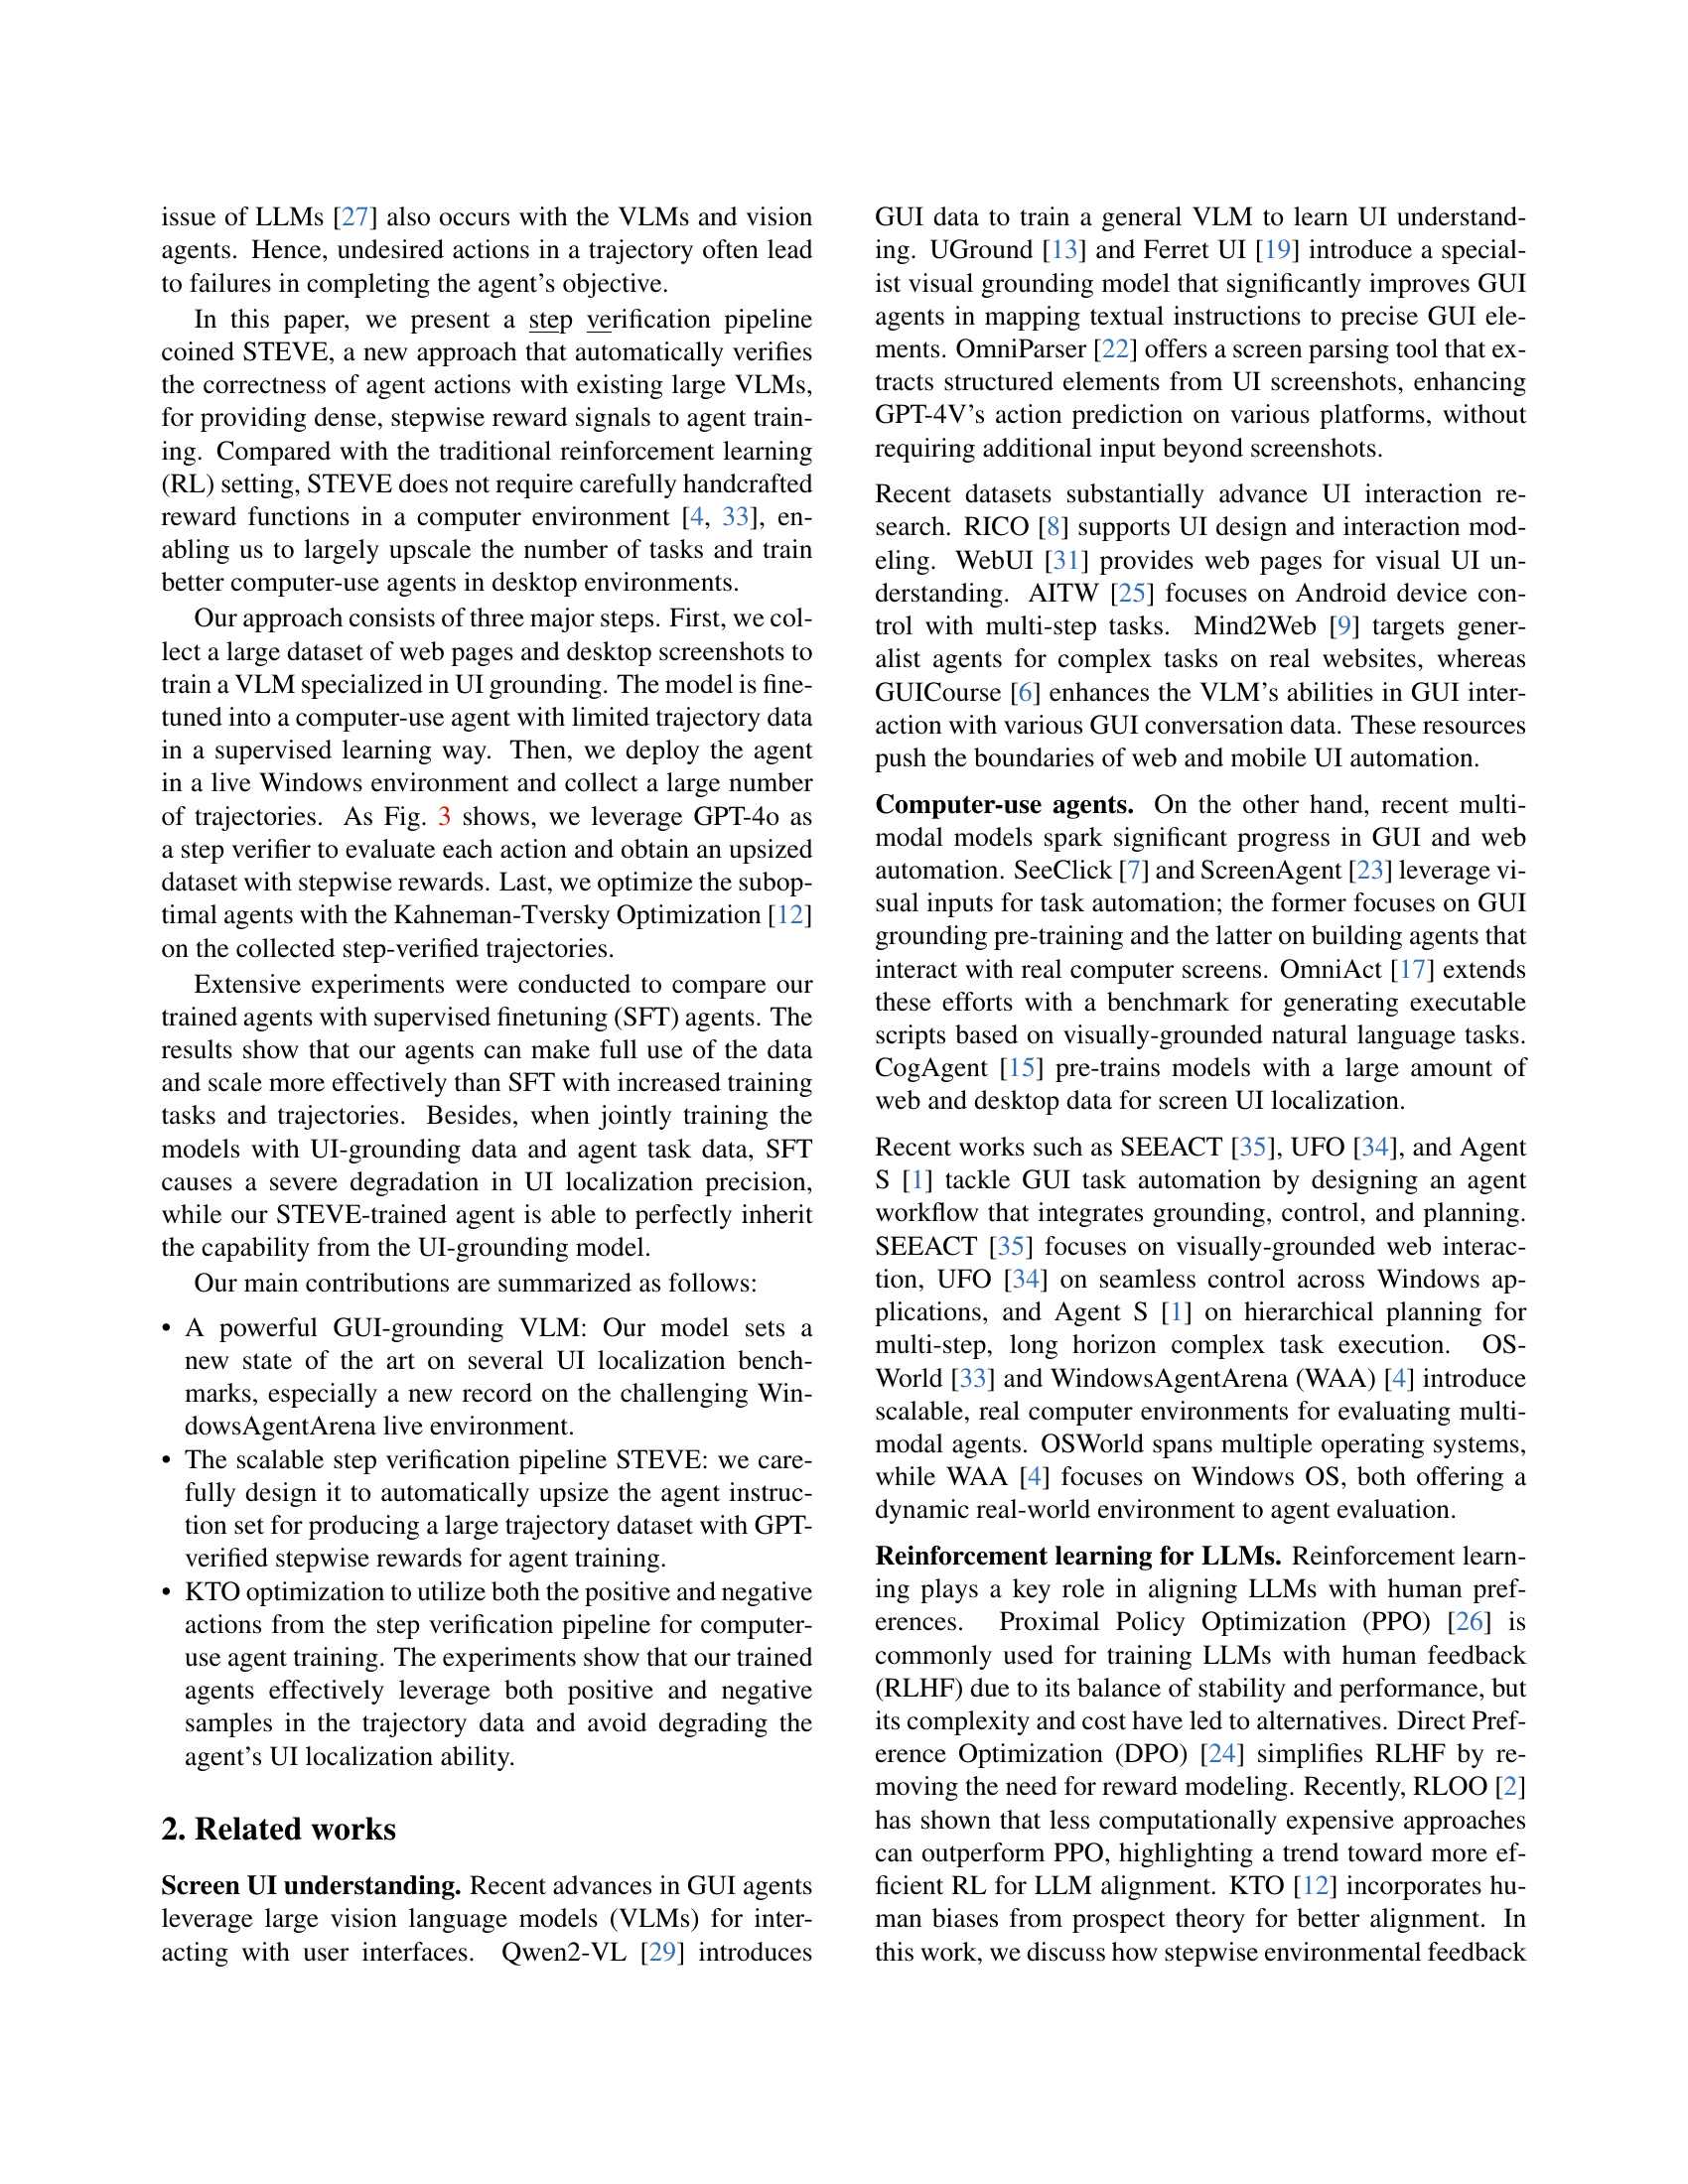
🔼 Figure 2 details the datasets used to train the UI-grounding model. The model’s training leveraged a combination of publicly available datasets (WebUI, Seeclick, AITW, Allava) and a new, privately collected dataset focusing on the Windows OS. This private dataset was created to specifically improve the model’s performance and accuracy when interacting with Windows interfaces, supplementing the more general UI data from the open-source datasets. The table shows the name of each dataset, the type of annotation provided (DOM, OCR, caption, general QA), the number of images, and the number of UI elements included in each.
read the caption
Figure 2: Datasets we collected for UI-grounding model training, including open-source datasets and an additional private Windows OS dataset created by ourselves to enhance the model’s performance on Windows.

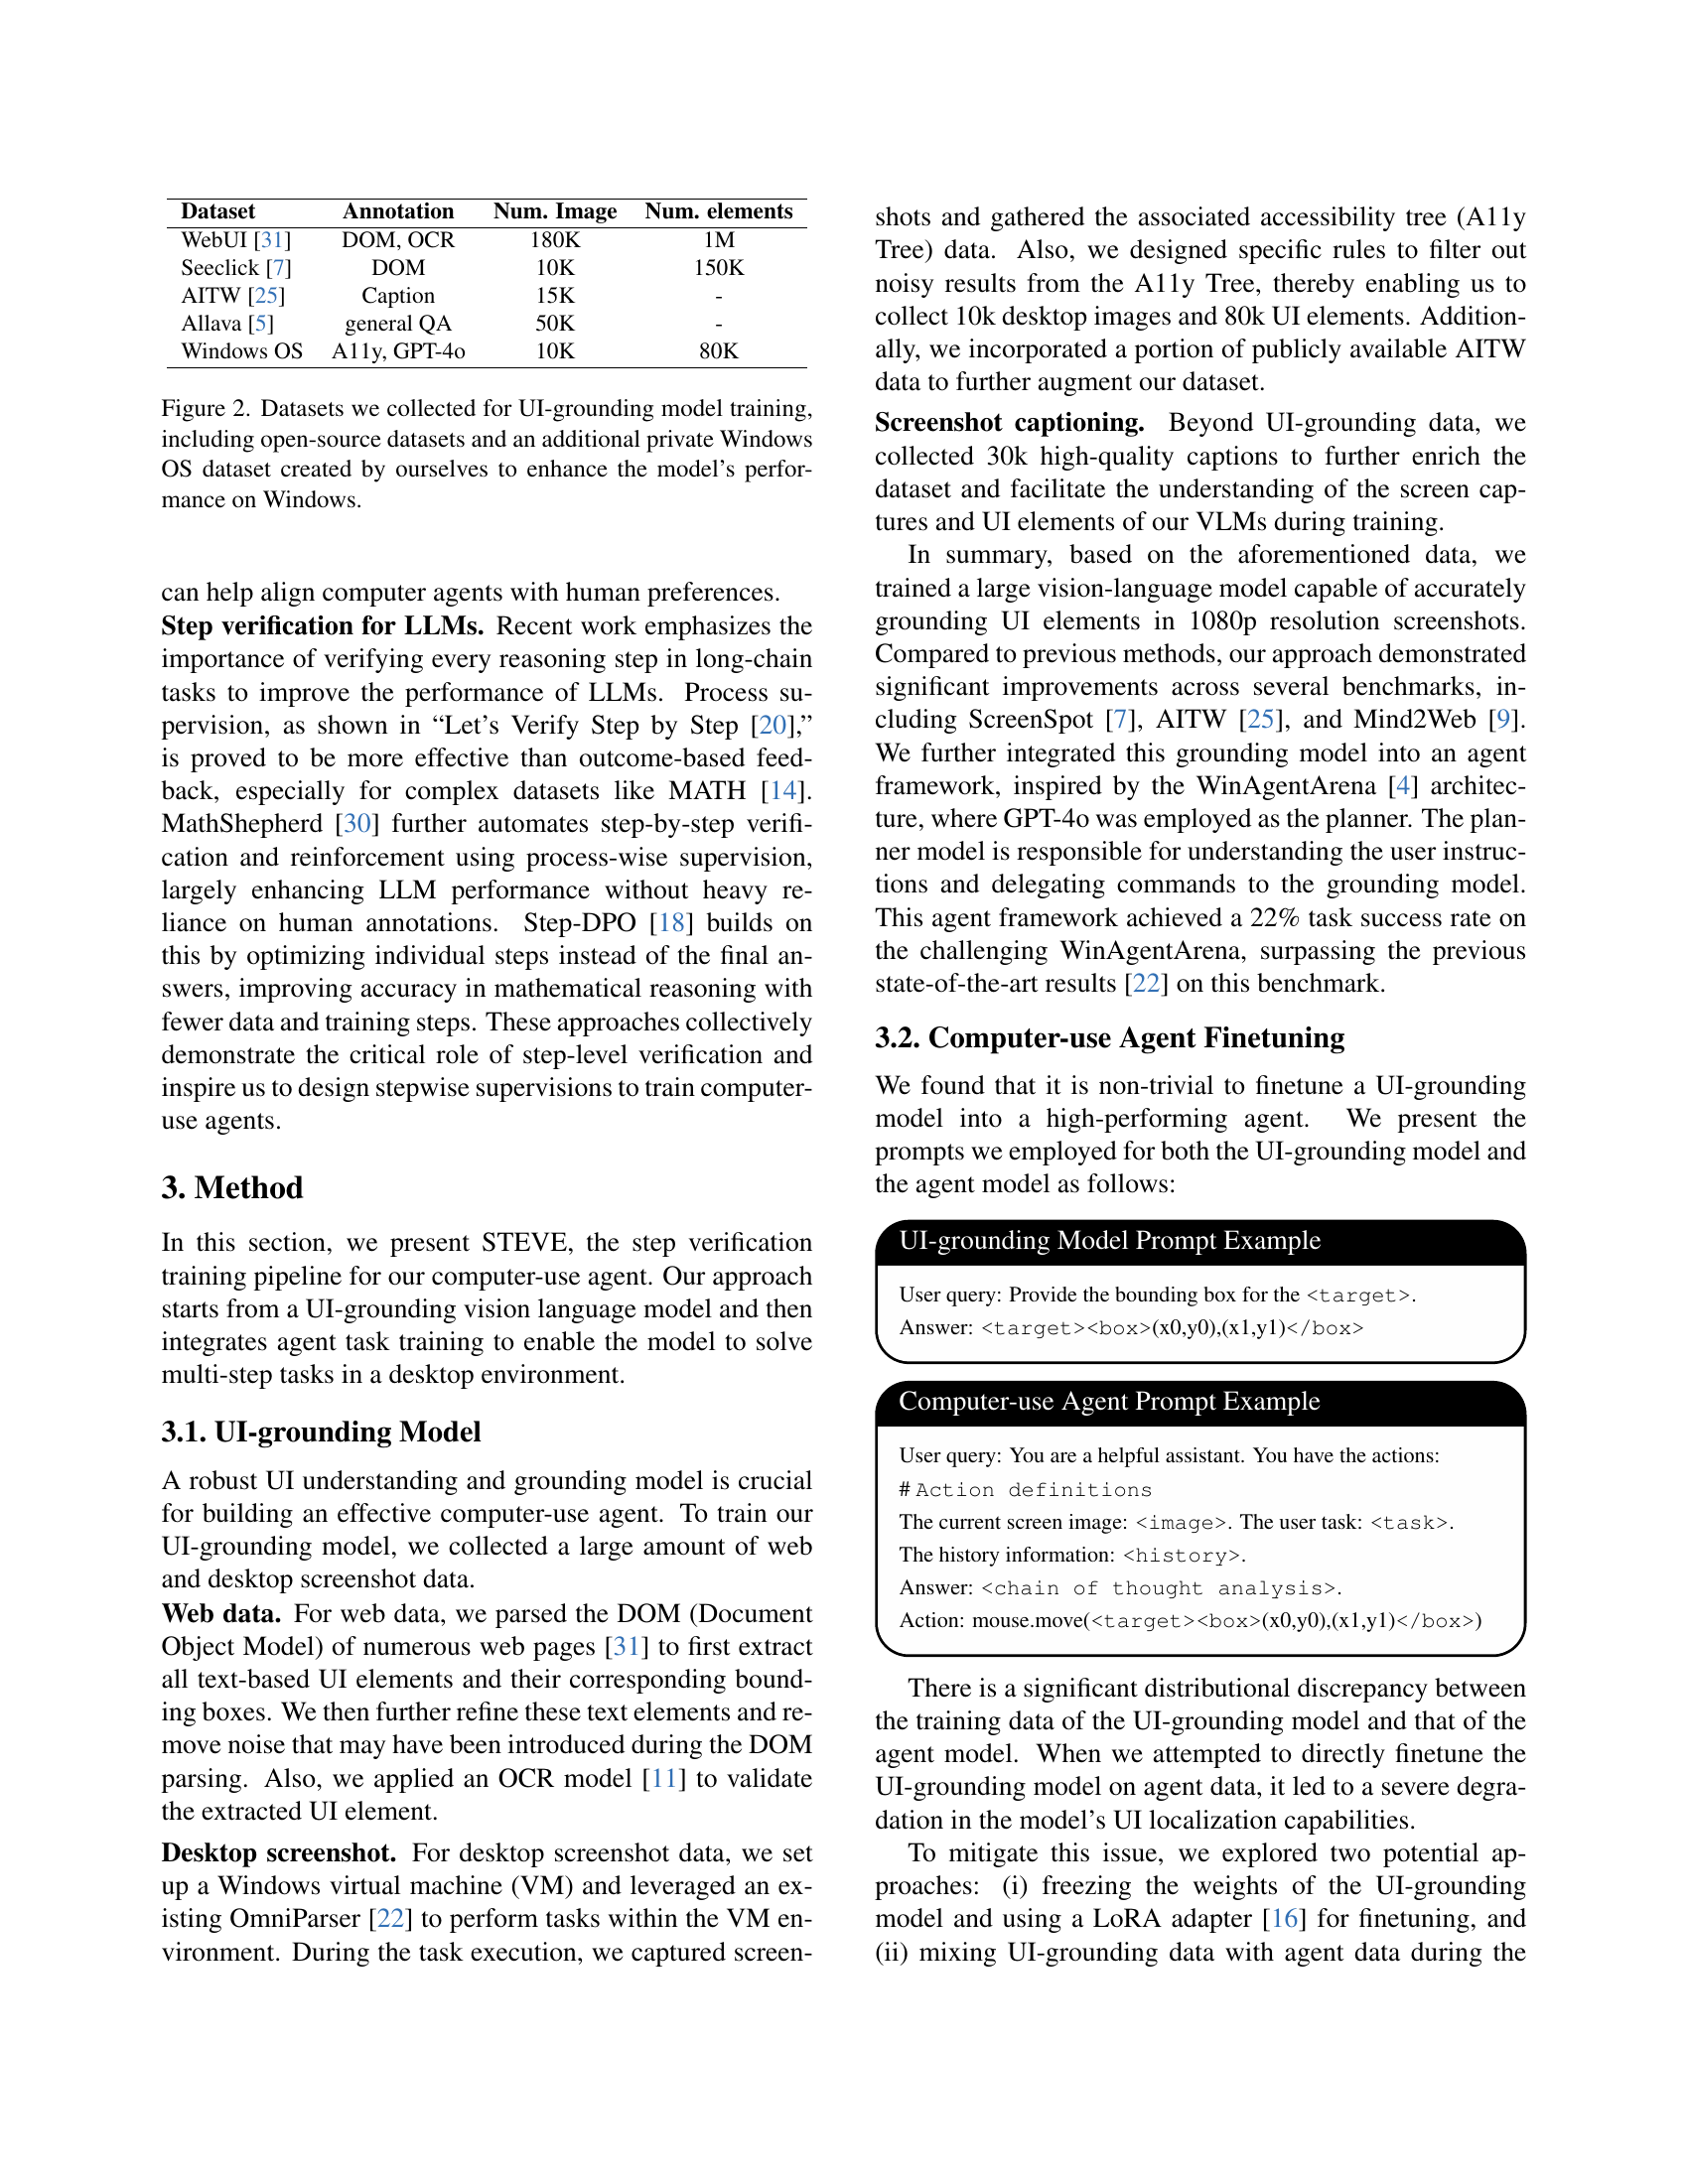
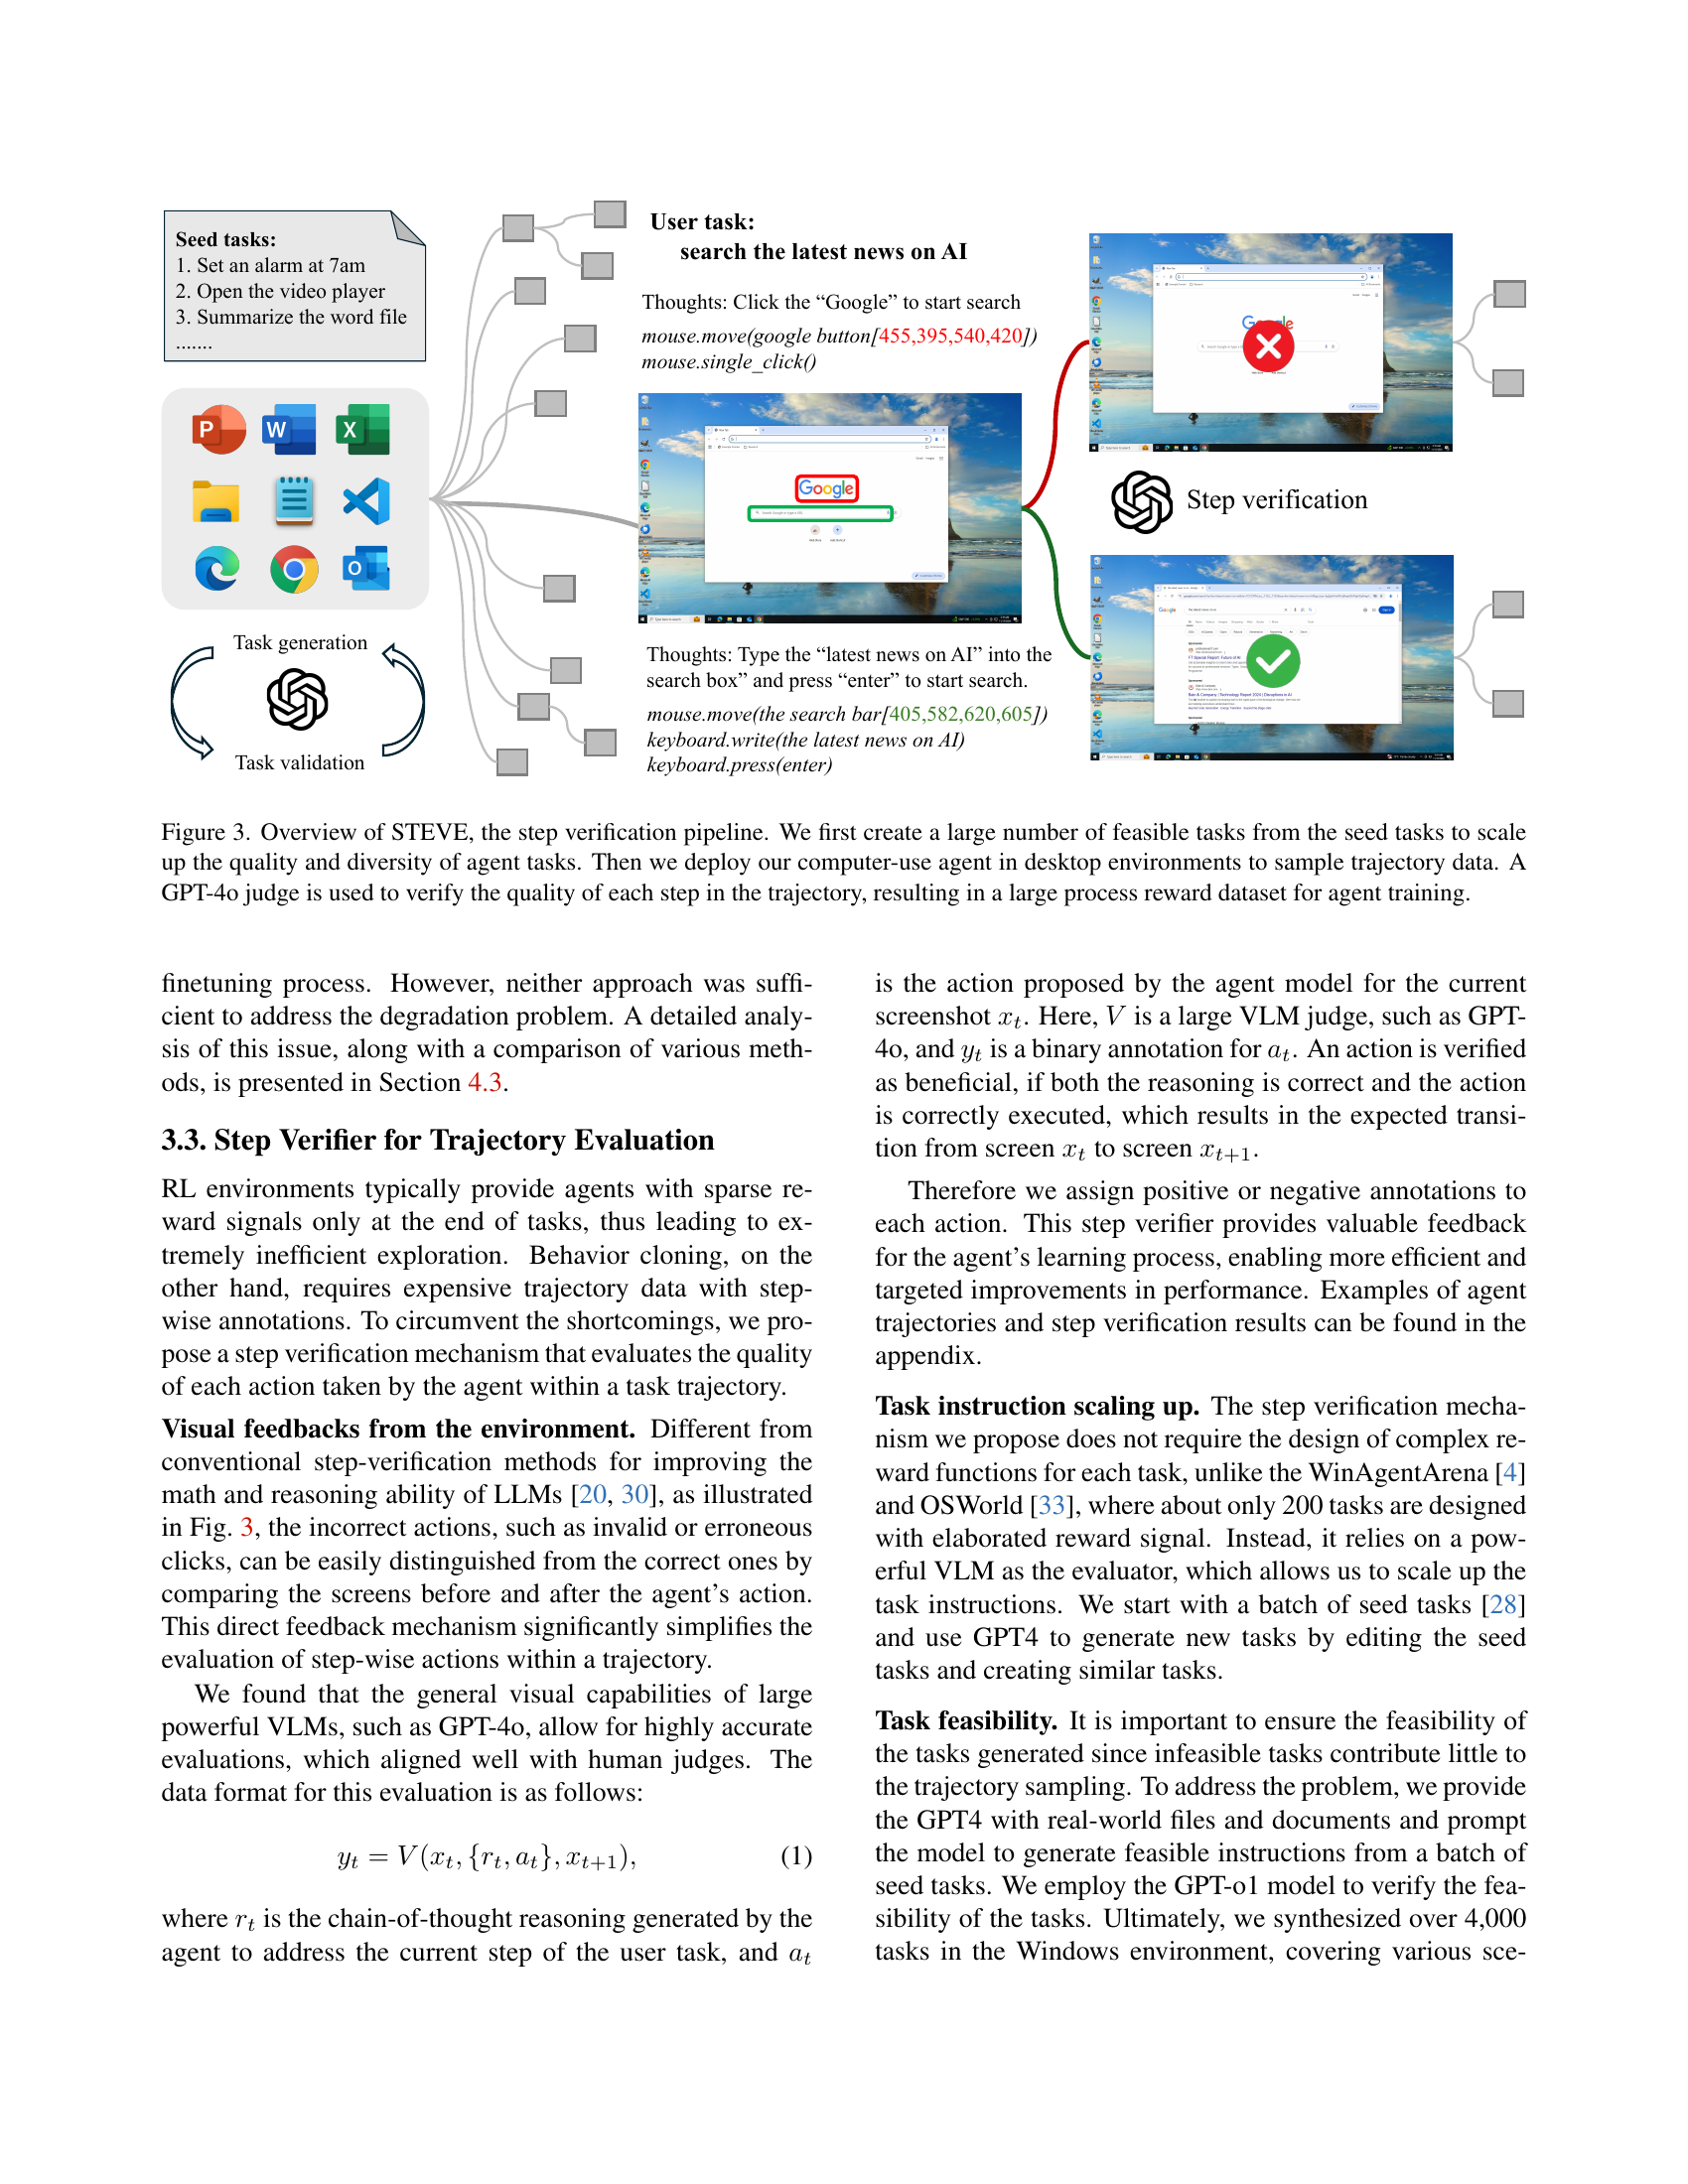
🔼 The figure illustrates the STEVE (Step Verification Pipeline) process. It begins with a small set of seed tasks, which are expanded into a larger, more diverse set of feasible tasks. A computer-use agent then executes these tasks in a simulated desktop environment, generating a set of trajectories (sequences of actions). Each step in these trajectories is then evaluated by a GPT-40 model, acting as a judge to determine its correctness based on visual feedback (before and after screenshots). The result of this step-by-step verification is a large dataset of trajectories annotated with process-level rewards, which are used to train the agent.
read the caption
Figure 3: Overview of STEVE, the step verification pipeline. We first create a large number of feasible tasks from the seed tasks to scale up the quality and diversity of agent tasks. Then we deploy our computer-use agent in desktop environments to sample trajectory data. A GPT-4o judge is used to verify the quality of each step in the trajectory, resulting in a large process reward dataset for agent training.

🔼 This figure illustrates the agreement between GPT-4 and human evaluators on the correctness of agent actions within a task. The x-axis categorizes actions as early (steps 1-7) or late (steps after 7) in a task sequence, and whether the action was deemed positive (successful) or negative (unsuccessful). The y-axis represents the percentage of agreement between GPT-4’s assessment and human evaluators’ assessment for each category. The high percentage agreement in the early steps and a slight decrease in agreement for later steps suggests GPT-4’s ability to evaluate action correctness diminishes as the complexity of a task increases.
read the caption
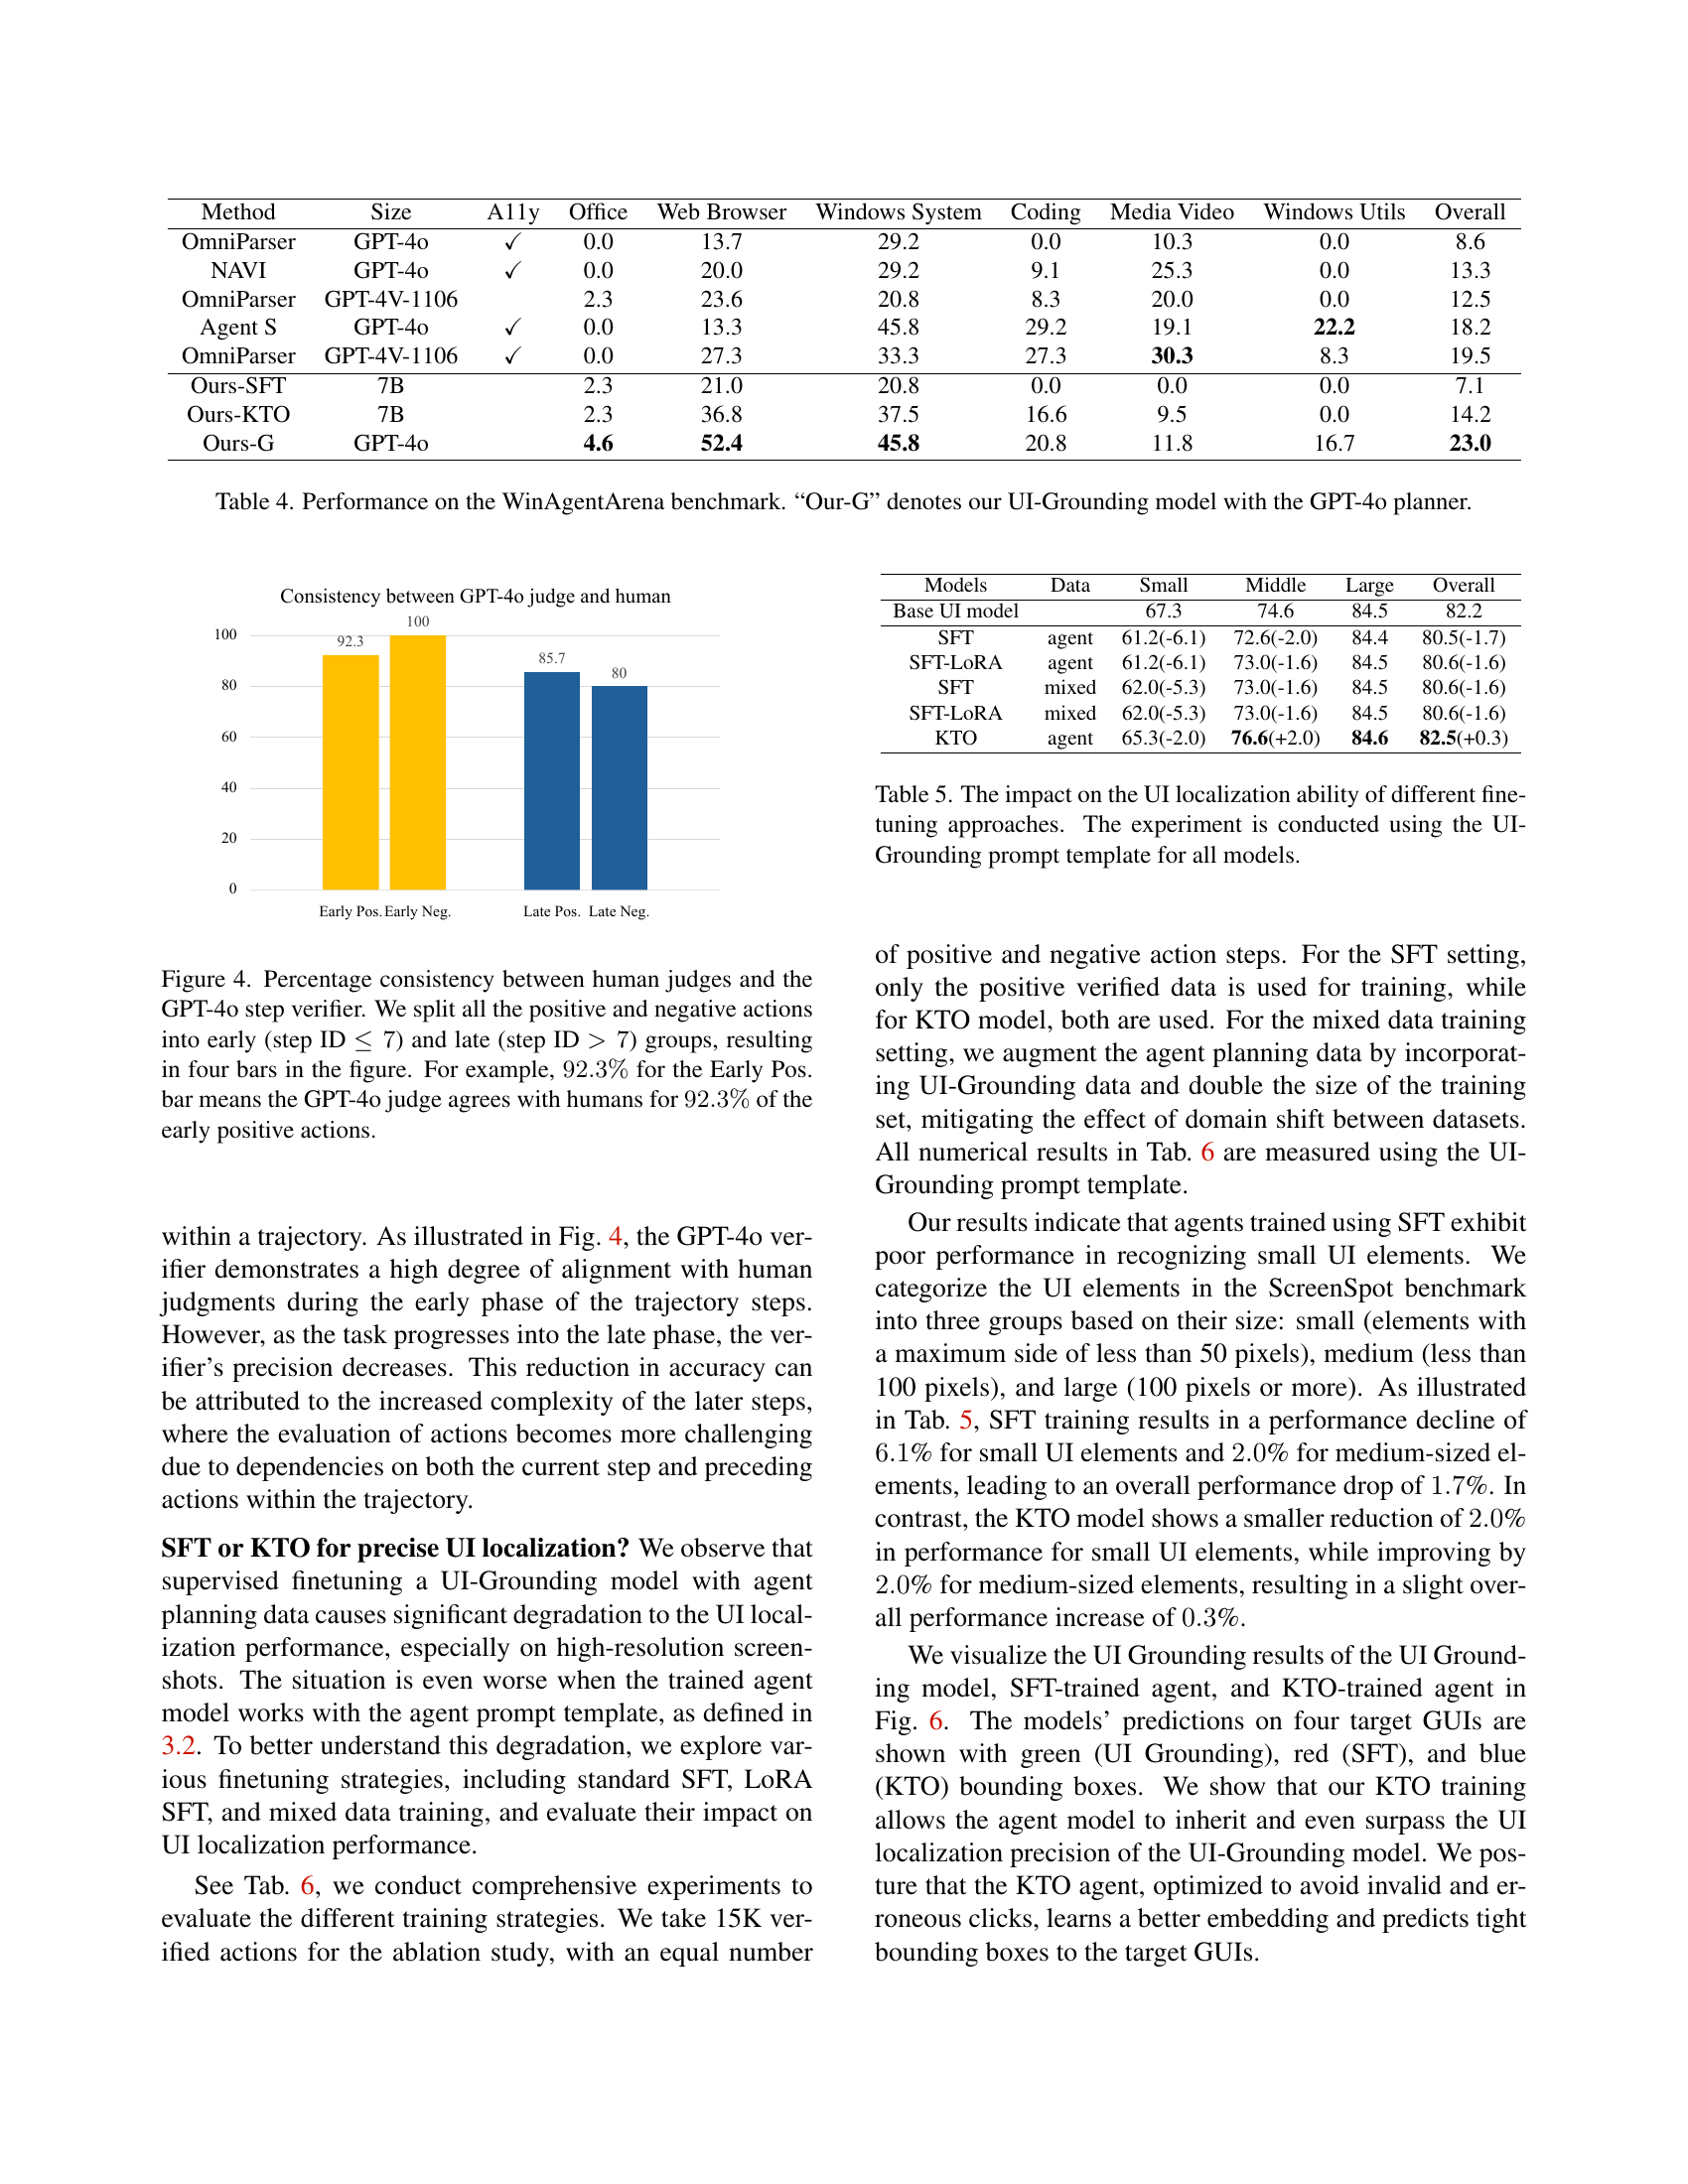
Figure 4: Percentage consistency between human judges and the GPT-4o step verifier. We split all the positive and negative actions into early (step ID ≤7absent7\leq 7≤ 7) and late (step ID >7absent7>7> 7) groups, resulting in four bars in the figure. For example, 92.3%percent92.392.3\%92.3 % for the Early Pos. bar means the GPT-4o judge agrees with humans for 92.3%percent92.392.3\%92.3 % of the early positive actions.

🔼 This figure shows a bar chart comparing the task success rates of different computer-use agents on the File Explorer task split within the WinAgentArena benchmark. The chart allows for a comparison of the performance of various agents, including OmniParser, an SFT (Supervised Finetuning) agent, and multiple KTO (Kahneman & Tversky Optimization) agents across different training rounds. The x-axis represents the different agents, and the y-axis represents the task success rate.
read the caption
(a) Task success rate on the File Explorer split.

🔼 This figure shows the task success rate achieved by different computer-use agent models on web browser-specific tasks within the WinAgentArena benchmark. The models are compared across multiple training rounds to evaluate the effectiveness of different training methodologies (Supervised Finetuning (SFT) and Kahneman & Tversky Optimization (KTO)). The results highlight the improved performance of KTO-trained agents over SFT and a baseline model across iterative training rounds.
read the caption
(b) Task success rate on the Web Browser split.

🔼 This figure shows a bar chart comparing the task success rates of different computer-use agents on the VsCode split of the WinAgentArena benchmark. The agents compared include OmniParser, an agent trained using supervised finetuning (SFT), and three agents trained using the Kahneman & Tversky Optimization (KTO) method across multiple training rounds (R1, R2, R3). The chart visually represents the relative performance of each agent in successfully completing tasks within the VsCode application.
read the caption
(c) Task success rate on the VsCode split.

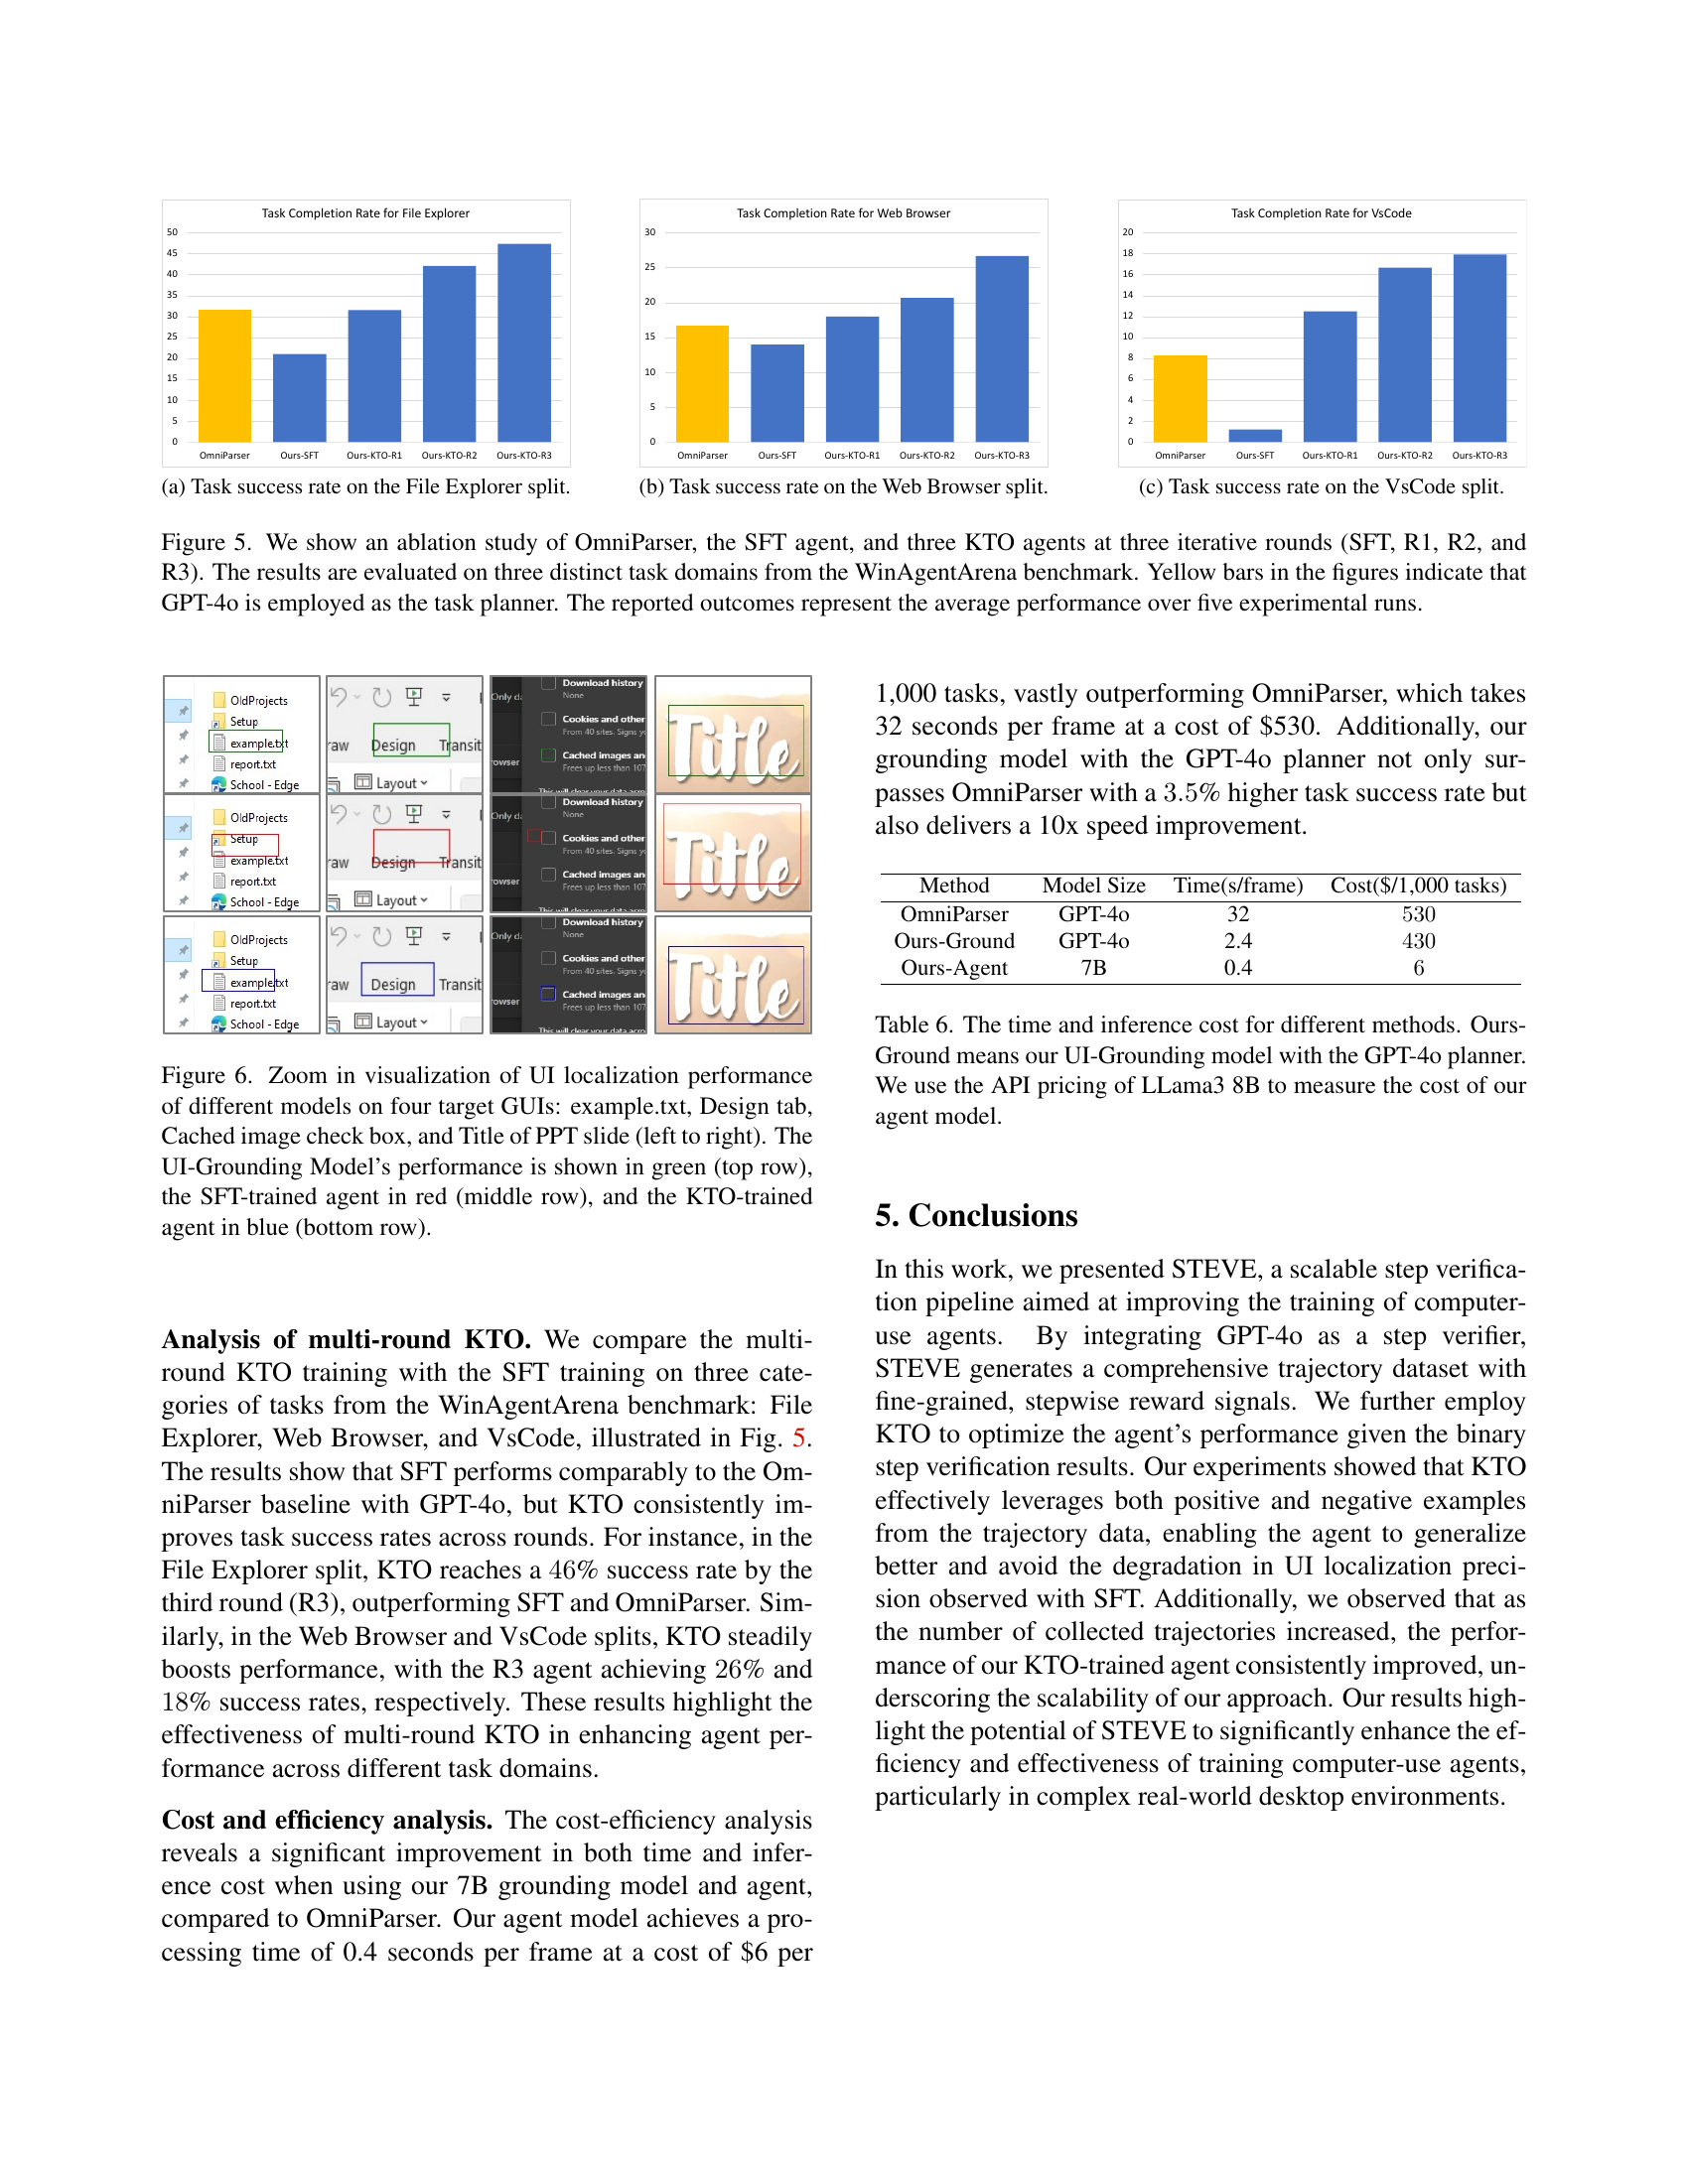
🔼 This ablation study compares the performance of different agent training methods on three distinct tasks from the WinAgentArena benchmark: File Explorer, Web Browser, and VsCode. The methods compared are OmniParser (a baseline), supervised fine-tuning (SFT), and the Kahneman & Tversky Optimization (KTO) approach. For KTO, results are shown for three iterative training rounds (R1, R2, R3). The yellow bars highlight results where GPT-40 was used as a task planner. Each bar represents the average performance across five experimental runs. The figure visually demonstrates the improvement in task success rates achieved by the KTO approach over multiple training iterations.
read the caption
Figure 5: We show an ablation study of OmniParser, the SFT agent, and three KTO agents at three iterative rounds (SFT, R1, R2, and R3). The results are evaluated on three distinct task domains from the WinAgentArena benchmark. Yellow bars in the figures indicate that GPT-4o is employed as the task planner. The reported outcomes represent the average performance over five experimental runs.

🔼 Figure 6 presents a zoomed-in visualization comparing the UI localization performance of three different models on four distinct Graphical User Interface (GUI) elements. These elements include: ’example.txt’ (a text file), a ‘Design’ tab (likely within an application), a ‘Cached image check box’ (a specific UI element), and the ‘Title’ of a PowerPoint slide. Each model’s performance is color-coded and displayed in separate rows: the UI-Grounding model (green, top row), the Supervised Finetuning (SFT)-trained agent (red, middle row), and the Kahneman & Tversky Optimization (KTO)-trained agent (blue, bottom row). The figure allows for a detailed comparison of the precision and accuracy of each model’s localization capability, highlighting the differences in their ability to accurately identify and locate specific GUI elements within a complex screen.
read the caption
Figure 6: Zoom in visualization of UI localization performance of different models on four target GUIs: example.txt, Design tab, Cached image check box, and Title of PPT slide (left to right). The UI-Grounding Model’s performance is shown in green (top row), the SFT-trained agent in red (middle row), and the KTO-trained agent in blue (bottom row).

🔼 This figure shows a line graph illustrating the reward margin’s improvement over training steps in the Kahneman & Tversky Optimization (KTO) algorithm. The reward margin represents the difference between rewards assigned to chosen (positive) samples and rejected (negative) samples during training. A consistent upward trend in the reward margin indicates the algorithm’s effectiveness in distinguishing between positive and negative examples. The graph visually demonstrates that as KTO training progresses, the model becomes increasingly better at identifying and utilizing beneficial samples.
read the caption
Figure 7: The reward margin (vertical axis) between the chosen and rejected samples consistently improve during the KTO training.

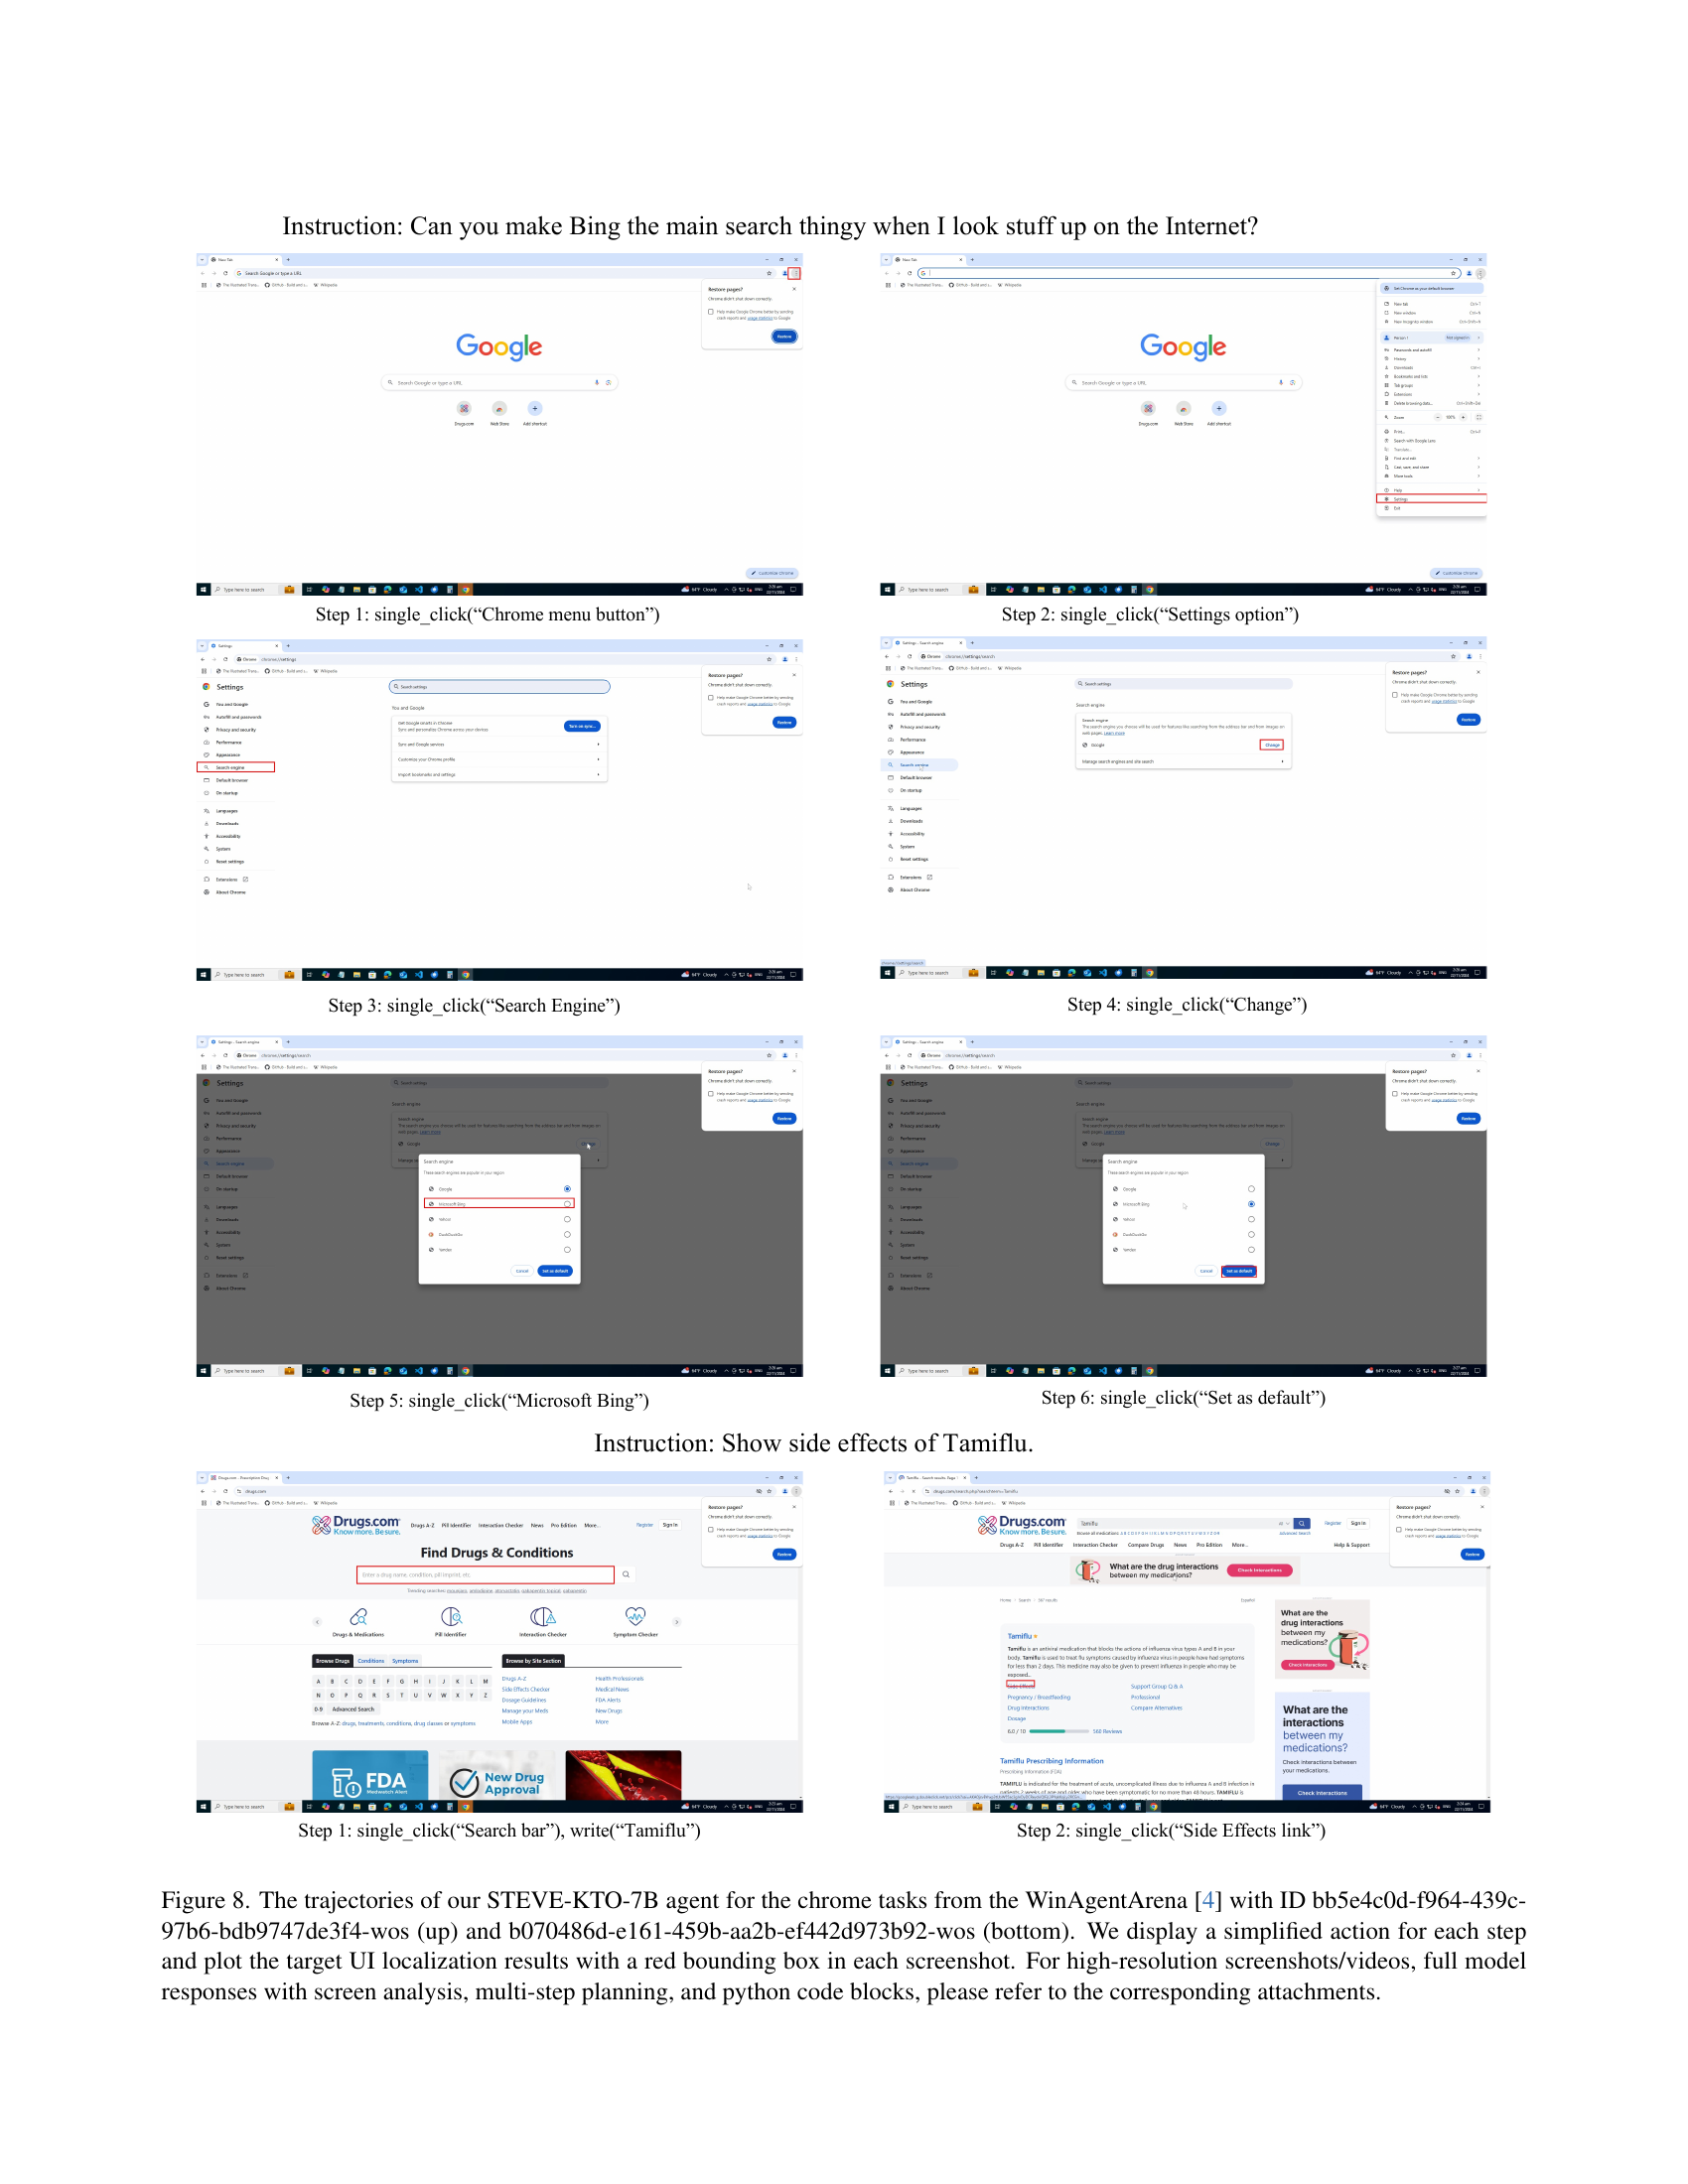
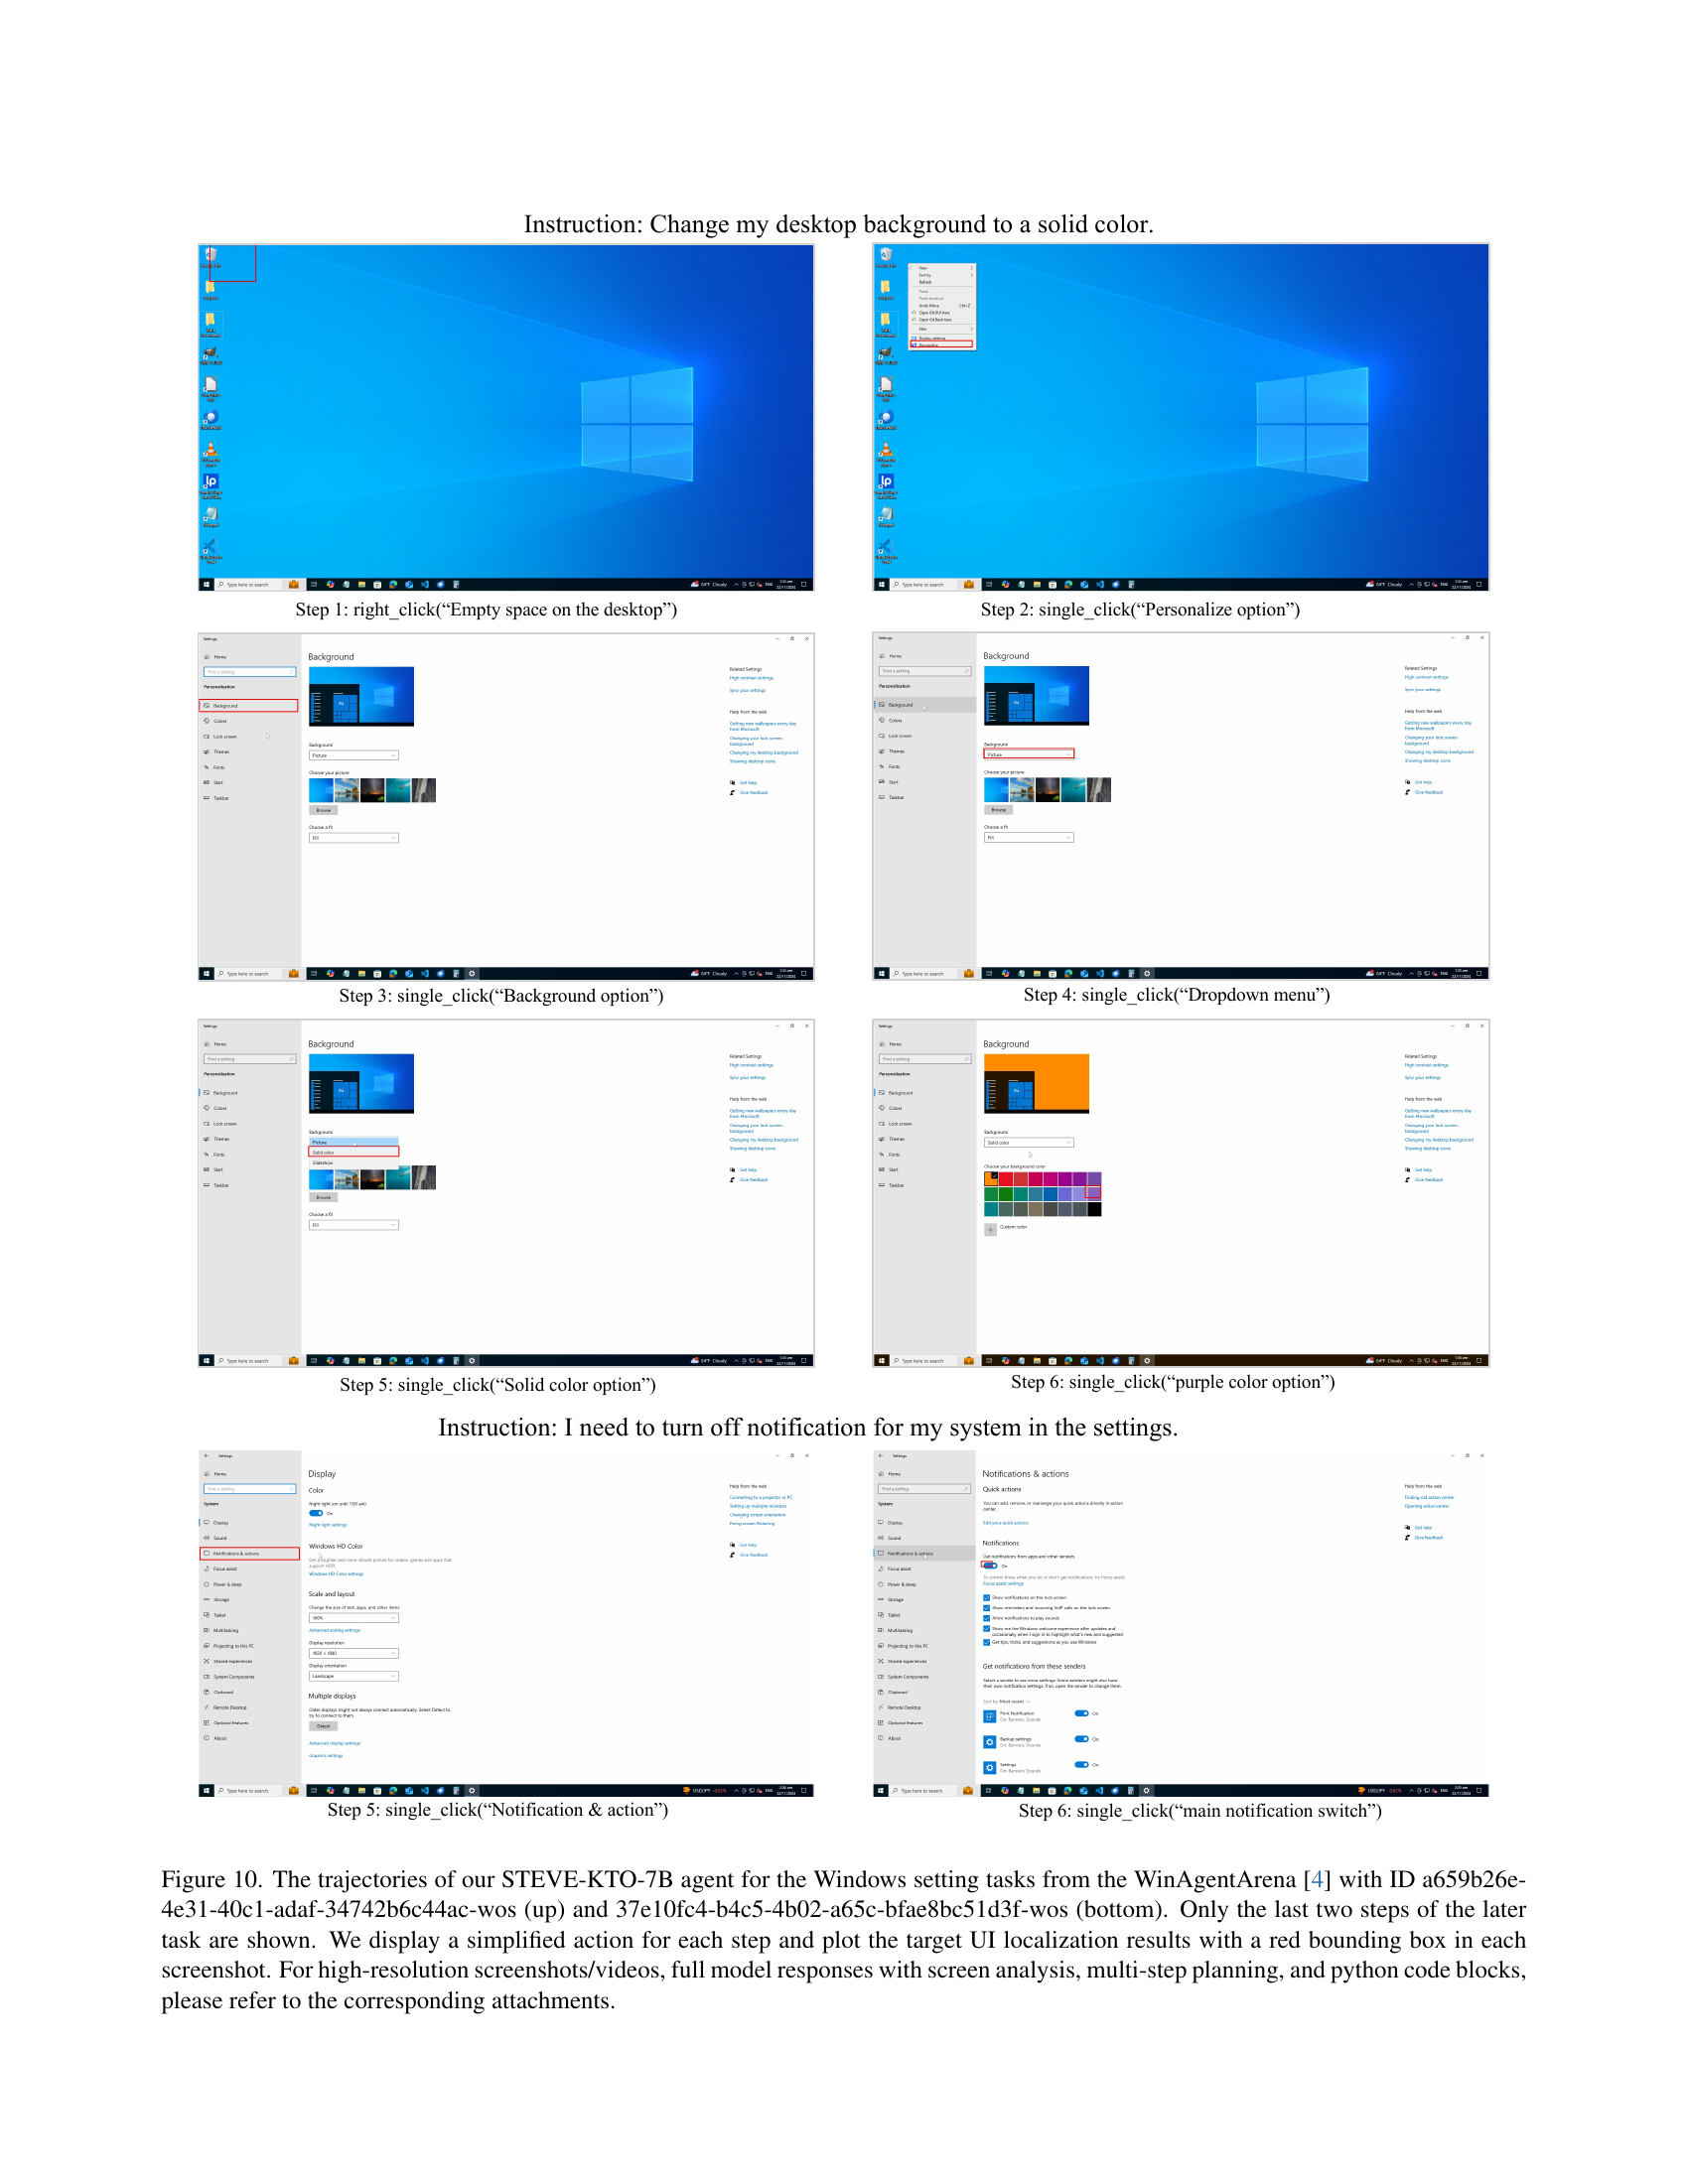
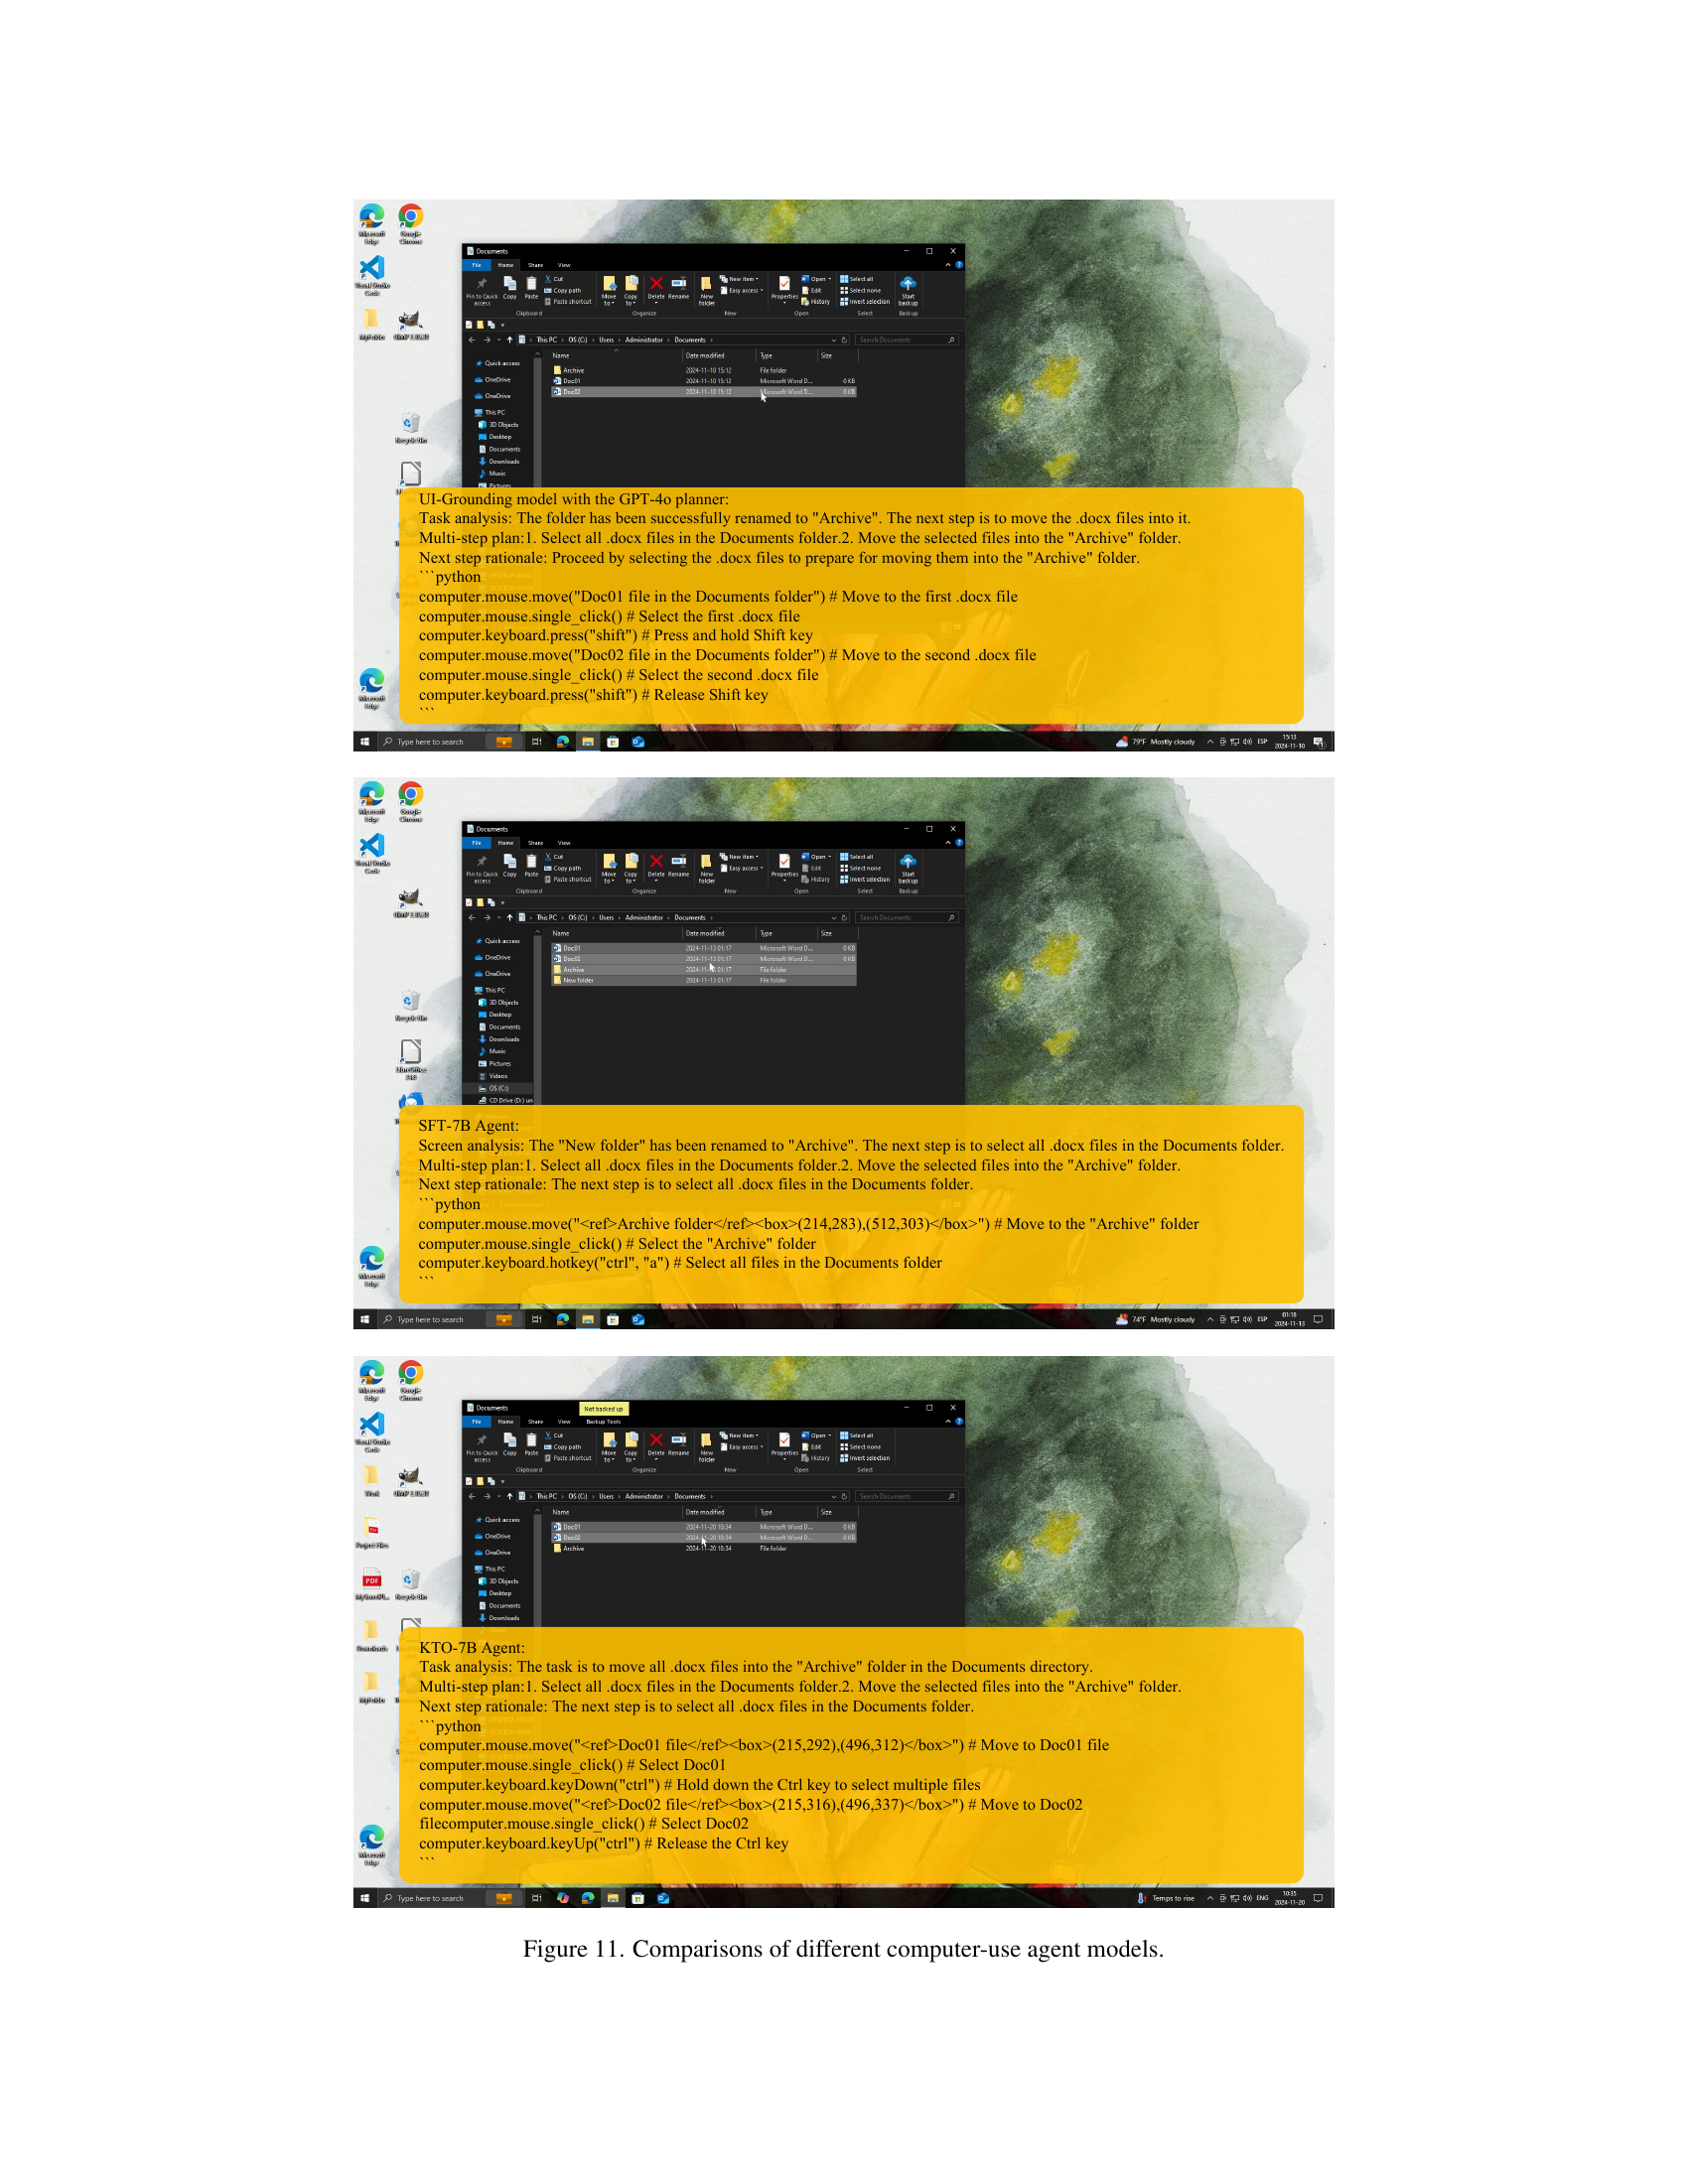
🔼 This figure visualizes two example task trajectories generated by the STEVE-KTO-7B agent within the WinAgentArena environment. Each trajectory corresponds to a distinct task ID and shows a sequence of steps the agent took to complete the task. Simplified actions are displayed for each step, highlighting the interaction with the user interface. The target UI elements for each action are indicated by red bounding boxes. For a detailed understanding, including high-resolution screenshots, videos of the full interactions, the agent’s complete reasoning process (including screen analysis and multi-step planning), and the Python code used to control the actions, please refer to the supplementary materials accompanying the research paper.
read the caption
Figure 8: The trajectories of our STEVE-KTO-7B agent for the chrome tasks from the WinAgentArena [4] with ID bb5e4c0d-f964-439c-97b6-bdb9747de3f4-wos (up) and b070486d-e161-459b-aa2b-ef442d973b92-wos (bottom). We display a simplified action for each step and plot the target UI localization results with a red bounding box in each screenshot. For high-resolution screenshots/videos, full model responses with screen analysis, multi-step planning, and python code blocks, please refer to the corresponding attachments.

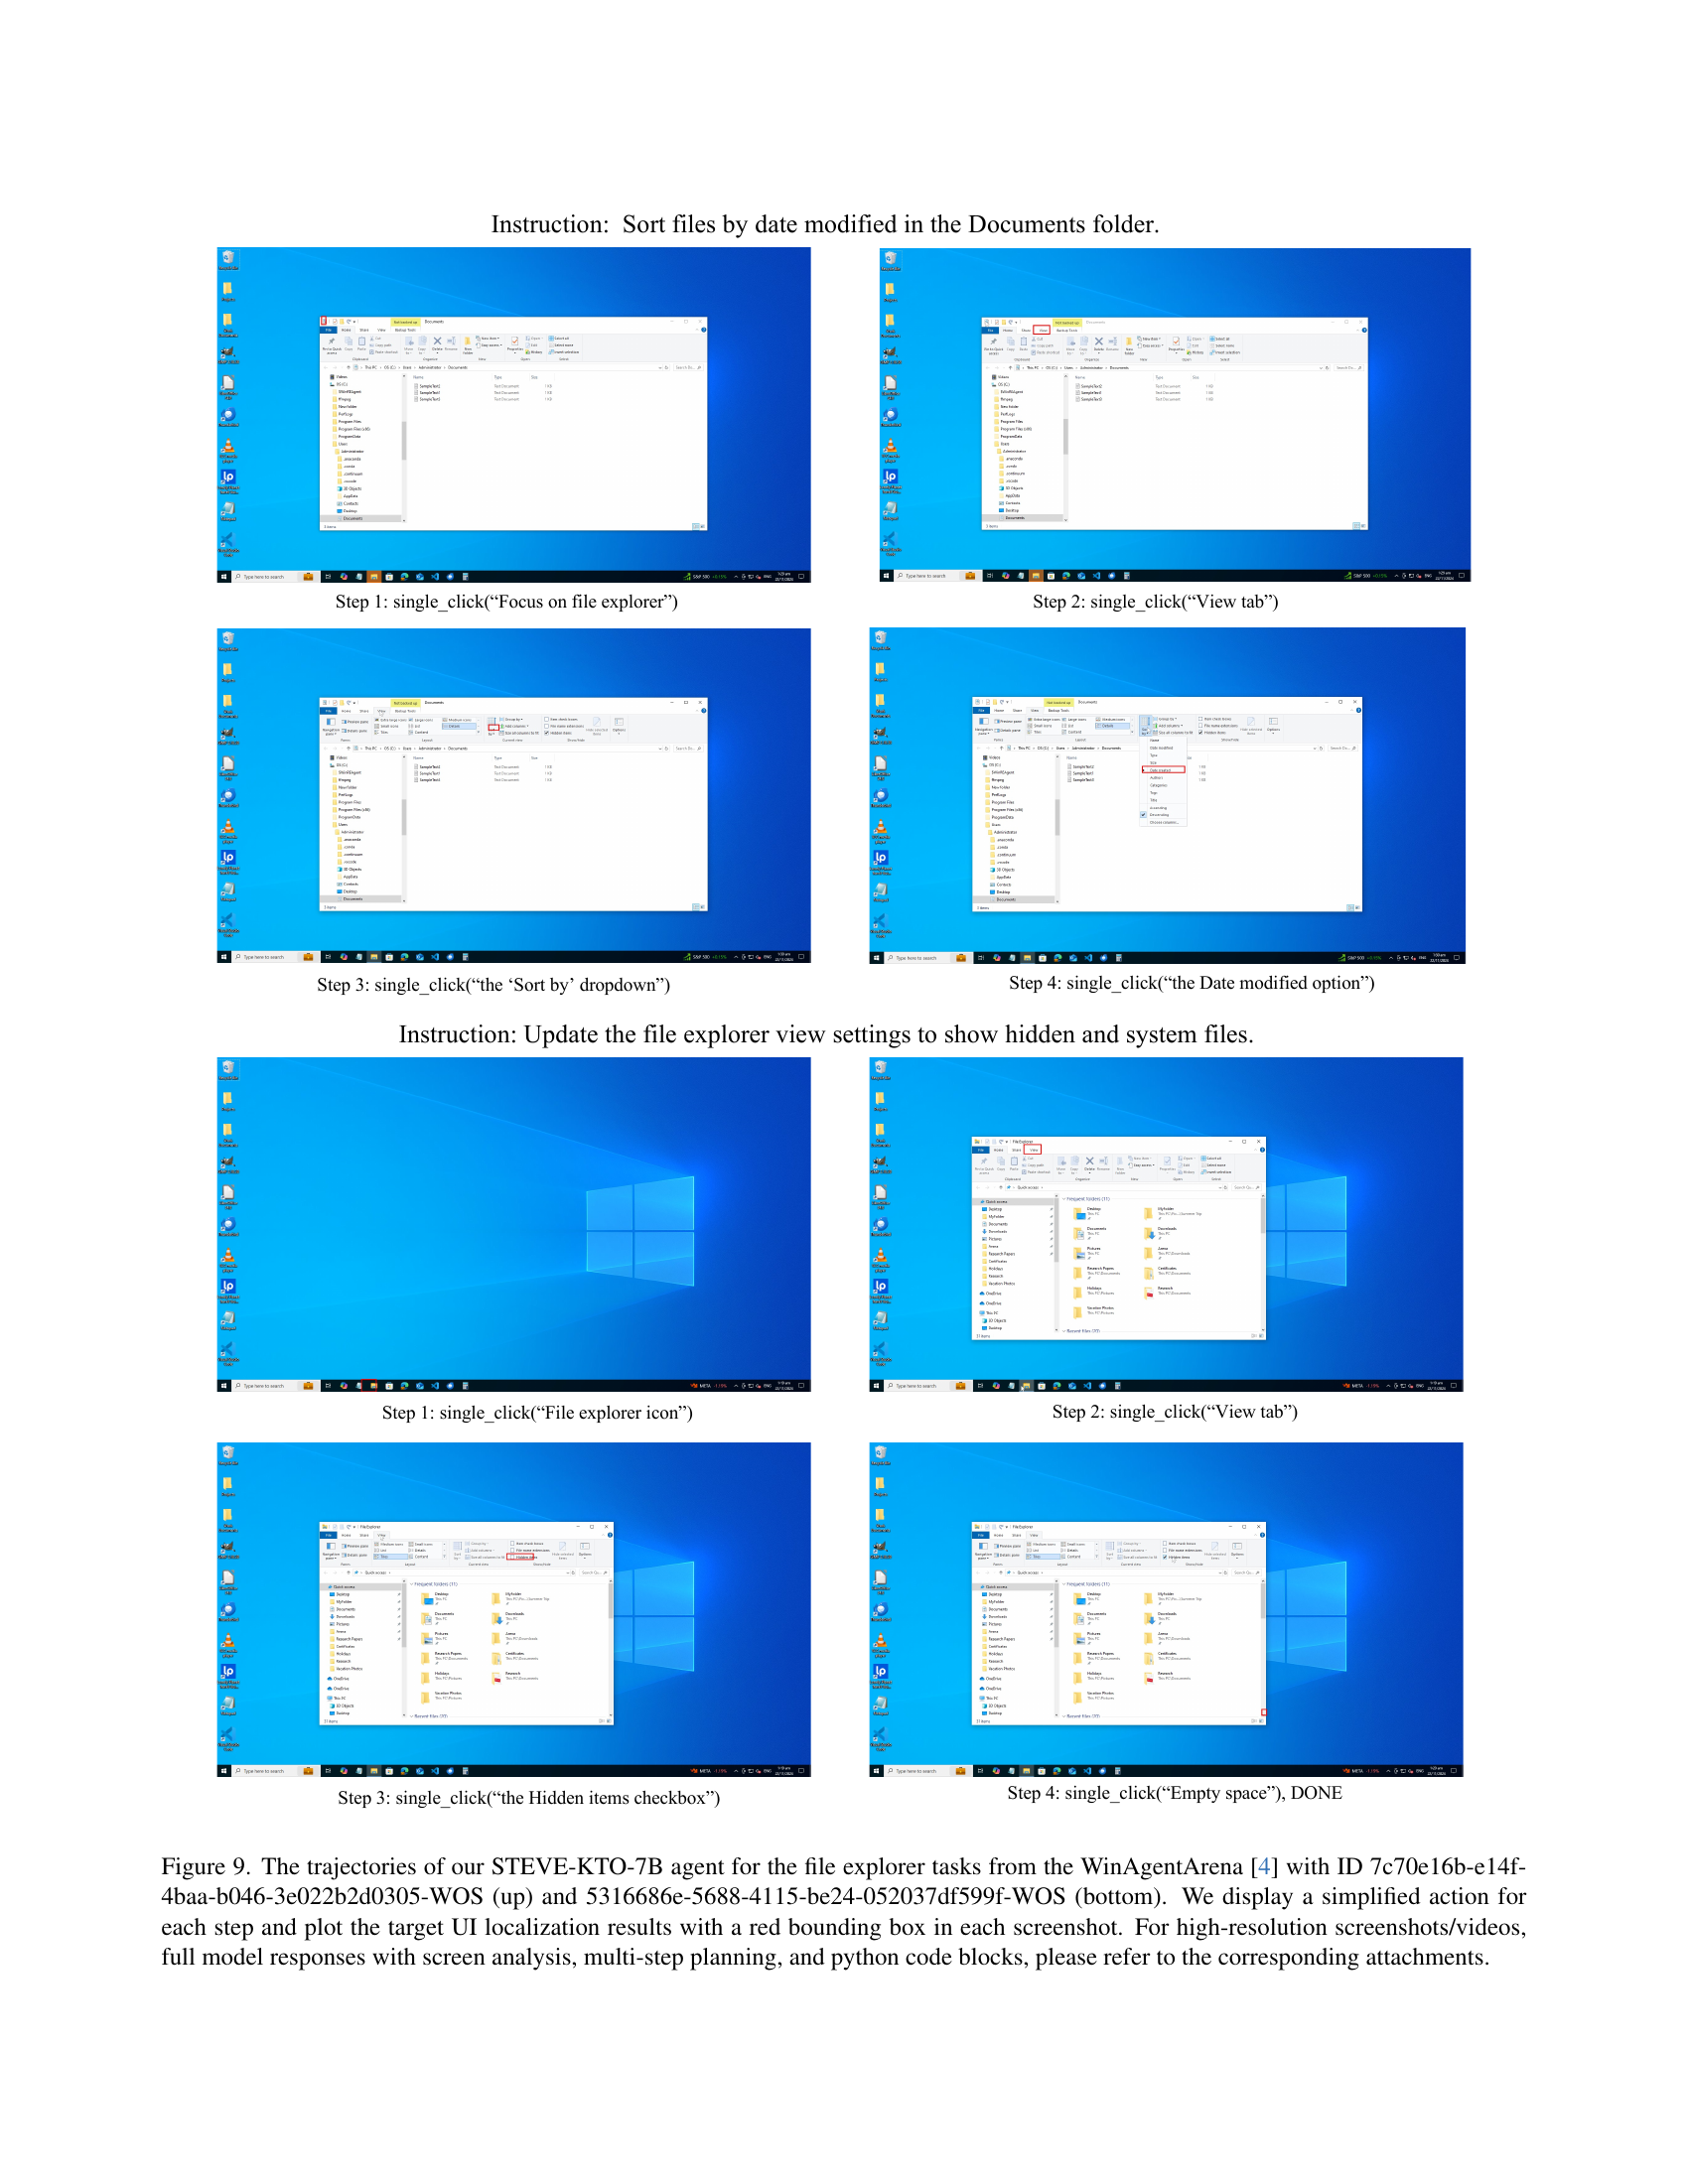
🔼 Figure 9 presents two example task trajectories generated by the STEVE-KTO-7B model within the WinAgentArena environment. Each trajectory visualizes a multi-step process of interacting with a file explorer window in Windows OS. The top trajectory (ID: 7c70e16b-e14f-4baa-b046-3e022b2d0305-WOS) shows the steps involved in sorting files by modification date. The bottom trajectory (ID: 5316686e-5688-4115-be24-052037df599f-WOS) demonstrates how the model updates file explorer settings to display hidden and system files. For each step, the figure displays a simplified action taken by the agent and highlights the target UI elements that were interacted with using red bounding boxes. The high-resolution screenshots and additional details, like the full model’s reasoning process (screen analysis, multi-step planning, and Python code), are available in supplementary material.
read the caption
Figure 9: The trajectories of our STEVE-KTO-7B agent for the file explorer tasks from the WinAgentArena [4] with ID 7c70e16b-e14f-4baa-b046-3e022b2d0305-WOS (up) and 5316686e-5688-4115-be24-052037df599f-WOS (bottom). We display a simplified action for each step and plot the target UI localization results with a red bounding box in each screenshot. For high-resolution screenshots/videos, full model responses with screen analysis, multi-step planning, and python code blocks, please refer to the corresponding attachments.
More on tables
| Method | Size | Mobile | Desktop | Web | Overall | |||
| Text | Widget | Text | Widget | Text | Widget | |||
| Qwen-VL | 9.6B | 9.5 | 4.8 | 5.7 | 5.0 | 3.5 | 2.4 | 5.2 |
| Fuyu | 8B | 41.0 | 1.3 | 33.0 | 3.6 | 33.9 | 4.4 | 19.5 |
| CogAgent [15] | 18B | 67.0 | 24.0 | 74.2 | 20.0 | 70.4 | 28.6 | 47.4 |
| Seeclick [7] | 9.6B | 78.0 | 52.0 | 72.2 | 30.0 | 55.7 | 32.5 | 53.4 |
| Qwen2-VL [29] | 7B | 75.5 | 60.7 | 76.3 | 54.3 | 35.2 | 25.7 | 55.3 |
| OmniParser [22] | GPT-4o | 93.9 | 57.0 | 91.3 | 63.6 | 81.3 | 51.0 | 73.0 |
| UGround [13] | 7B | 82.8 | 60.3 | 82.5 | 63.6 | 80.4 | 70.4 | 73.3 |
| Ours | 7B | 88.6 | 81.2 | 88.1 | 78.6 | 78.2 | 76.2 | 82.2 |
| Ours | 7B | 94.9 | 80.0 | 94.3 | 70.7 | 87.0 | 70.4 | 84.0 |
🔼 This table presents the results of the AITW (Android In The Wild) benchmark, which evaluates the performance of computer-use agents in interacting with real Android applications. The study uses the same test split as the SeeClick [7] paper for consistent comparison. The key metric reported is step-level action accuracy, which measures the precision of agents’ actions at each step within a multi-step task. Higher accuracy indicates that the agent is more effectively executing its actions in the Android environment.
read the caption
Table 2: Results on the AITW benchmark. We use the same test split as SeeClick [7]. The step-level action accuracy is reported.
| Method | GoogleApp | Install | WebShop | General | Single | Overall |
|---|---|---|---|---|---|---|
| GPT3.5(few-shot) | 10.5 | 4.4 | 8.4 | 5.9 | 9.3 | 7.7 |
| LLaMA2 | 31.0 | 35.2 | 19.9 | 28.6 | 27.4 | 28.4 |
| CogAgent [15] | 50.8 | 57.1 | 49.7 | 47.6 | 43.4 | 49.7 |
| SeeClick [7] | 57.7 | 64.5 | 57.3 | 56.0 | 63.6 | 59.8 |
| GUICourse [6] | 70.3 | 61.2 | 71.6 | - | 66.1 | 67.3 |
| Ours | 70.7 | 75.4 | 69.7 | 66.4 | 78.9 | 72.2 |
🔼 This table presents the results of the Mind2Web benchmark, evaluating the performance of different computer-use agents on various web-browsing tasks. The benchmark assesses the agents’ ability to complete multi-step tasks requiring interactions with websites, such as clicking, typing, and selecting elements. The results likely showcase step-level success rate and element accuracy, demonstrating the model’s precision in identifying and manipulating specific UI elements. The table allows for a comparison of various models against a baseline or state-of-the-art method.
read the caption
Table 3: Results on the Mind2Web benchmark.
| Method | Task | Website | Domain | Overall | |||
|---|---|---|---|---|---|---|---|
| Step SR | Elem Acc | Step SR | Elem Acc | Step SR | Elem Acc | ||
| CogAgent | 17.6 | 22.4 | 13.4 | 18.4 | 15.5 | 20.6 | 15.5 |
| Qwen-VL | 14.9 | 14.1 | 12.1 | 13.2 | 9.7 | 14.1 | 12.2 |
| SeeClick | 25.5 | 28.3 | 16.4 | 21.4 | 20.8 | 23.2 | 20.9 |
| OmniParser | 39.4 | 42.4 | 36.5 | 41.0 | 42.0 | 45.5 | 39.3 |
| Ours | 40.0 | 46.2 | 37.7 | 44.4 | 41.2 | 46.0 | 39.6 |
🔼 This table presents the results of evaluating various computer-use agent models on the WinAgentArena benchmark. The benchmark involves 154 tasks across various domains (Office, Web Browser, Windows System, Coding, Media, Video, Windows Utilities). The table compares the performance (task success rate) of different models, including OmniParser with GPT-40 as the planner, Agent S with GPT-40, our model fine-tuned with supervised finetuning (SFT), and our model trained with Kahneman & Tversky Optimization (KTO). The ‘Our-G’ row shows the performance of our UI-Grounding model using GPT-40 as the planner, providing a strong baseline comparison.
read the caption
Table 4: Performance on the WinAgentArena benchmark. “Our-G” denotes our UI-Grounding model with the GPT-4o planner.
| Method | Size | A11y | Office | Web Browser | Windows System | Coding | Media Video | Windows Utils | Overall |
| OmniParser | GPT-4o | ✓ | 0.0 | 13.7 | 29.2 | 0.0 | 10.3 | 0.0 | 8.6 |
| NAVI | GPT-4o | ✓ | 0.0 | 20.0 | 29.2 | 9.1 | 25.3 | 0.0 | 13.3 |
| OmniParser | GPT-4V-1106 | 2.3 | 23.6 | 20.8 | 8.3 | 20.0 | 0.0 | 12.5 | |
| Agent S | GPT-4o | ✓ | 0.0 | 13.3 | 45.8 | 29.2 | 19.1 | 22.2 | 18.2 |
| OmniParser | GPT-4V-1106 | ✓ | 0.0 | 27.3 | 33.3 | 27.3 | 30.3 | 8.3 | 19.5 |
| Ours-SFT | 7B | 2.3 | 21.0 | 20.8 | 0.0 | 0.0 | 0.0 | 7.1 | |
| Ours-KTO | 7B | 2.3 | 36.8 | 37.5 | 16.6 | 9.5 | 0.0 | 14.2 | |
| Ours-G | GPT-4o | 4.6 | 52.4 | 45.8 | 20.8 | 11.8 | 16.7 | 23.0 |
🔼 This table presents a comparison of UI localization performance across different fine-tuning methods applied to a UI-Grounding model. The experiment used a consistent UI-Grounding prompt for all models. It shows the impact of various training approaches (Standard SFT, LORA SFT, mixed data training, and KTO) on the model’s ability to accurately locate UI elements, categorized by size (small, medium, large), and presents the overall performance. The results highlight the effect of each method on localization precision, especially concerning small UI elements.
read the caption
Table 5: The impact on the UI localization ability of different finetuning approaches. The experiment is conducted using the UI-Grounding prompt template for all models.
| Models | Data | Small | Middle | Large | Overall |
| Base UI model | 67.3 | 74.6 | 84.5 | 82.2 | |
| SFT | agent | 61.2(-6.1) | 72.6(-2.0) | 84.4 | 80.5(-1.7) |
| SFT-LoRA | agent | 61.2(-6.1) | 73.0(-1.6) | 84.5 | 80.6(-1.6) |
| SFT | mixed | 62.0(-5.3) | 73.0(-1.6) | 84.5 | 80.6(-1.6) |
| SFT-LoRA | mixed | 62.0(-5.3) | 73.0(-1.6) | 84.5 | 80.6(-1.6) |
| KTO | agent | 65.3(-2.0) | 76.6(+2.0) | 84.6 | 82.5(+0.3) |
🔼 This table compares the time and cost of inference for different methods used to perform GUI interaction tasks. It contrasts the performance of the OmniParser model (using GPT-40 as a planner) with the authors’ proposed UI-Grounding model (also using GPT-40 as a planner) and their final agent model (a 7B parameter model). The cost is calculated based on the API pricing for an 8B parameter LLaMA model, providing a relative cost comparison between methods. The results highlight the computational efficiency gains achieved by the authors’ approach.
read the caption
Table 6: The time and inference cost for different methods. Ours-Ground means our UI-Grounding model with the GPT-4o planner. We use the API pricing of LLama3 8B to measure the cost of our agent model.
| Method | Model Size | Time(s/frame) | Cost($/1,000 tasks) |
|---|---|---|---|
| OmniParser | GPT-4o | 32 | |
| Ours-Ground | GPT-4o | 2.4 | |
| Ours-Agent | 7B | 0.4 |
🔼 This table details the configurations used for training both the UI-grounding model and the KTO agent. For the UI-grounding model, it specifies the base model used (Qwen2-VL), the optimizer (AdamW), the learning rate scheduler (Cosine), the learning rate (2e-5), the training data used (grounding data), the batch size (32), and the number of epochs (1). For the KTO agent, it lists the base model (the UI-grounding model), the optimizer (AdamW), the learning rate scheduler (Cosine), the learning rate (5e-5), the training data used (agent data), the batch size (16), the number of epochs (2), and whether the vision encoder was frozen during training.
read the caption
Table 7: Settings of our UI-grounding model (left) and KTO agent training (right).
| UI-grounding | KTO Agent | ||
| Config | Value | Config | Value |
| base model | Qwen2-VL | base model | UI-grounding |
| optimizer | AdamW | optimizer | AdamW |
| scheduler | Cosine | scheduler | Cosine |
| learning rate | 2e-5 | learning rate | 5e-5 |
| training data | grounding | training data | agent |
| batch size | 32 | batch size | 16 |
| epochs | 1 | epochs | 2 |
| vision encoder | freeze | vision encoder | freeze |
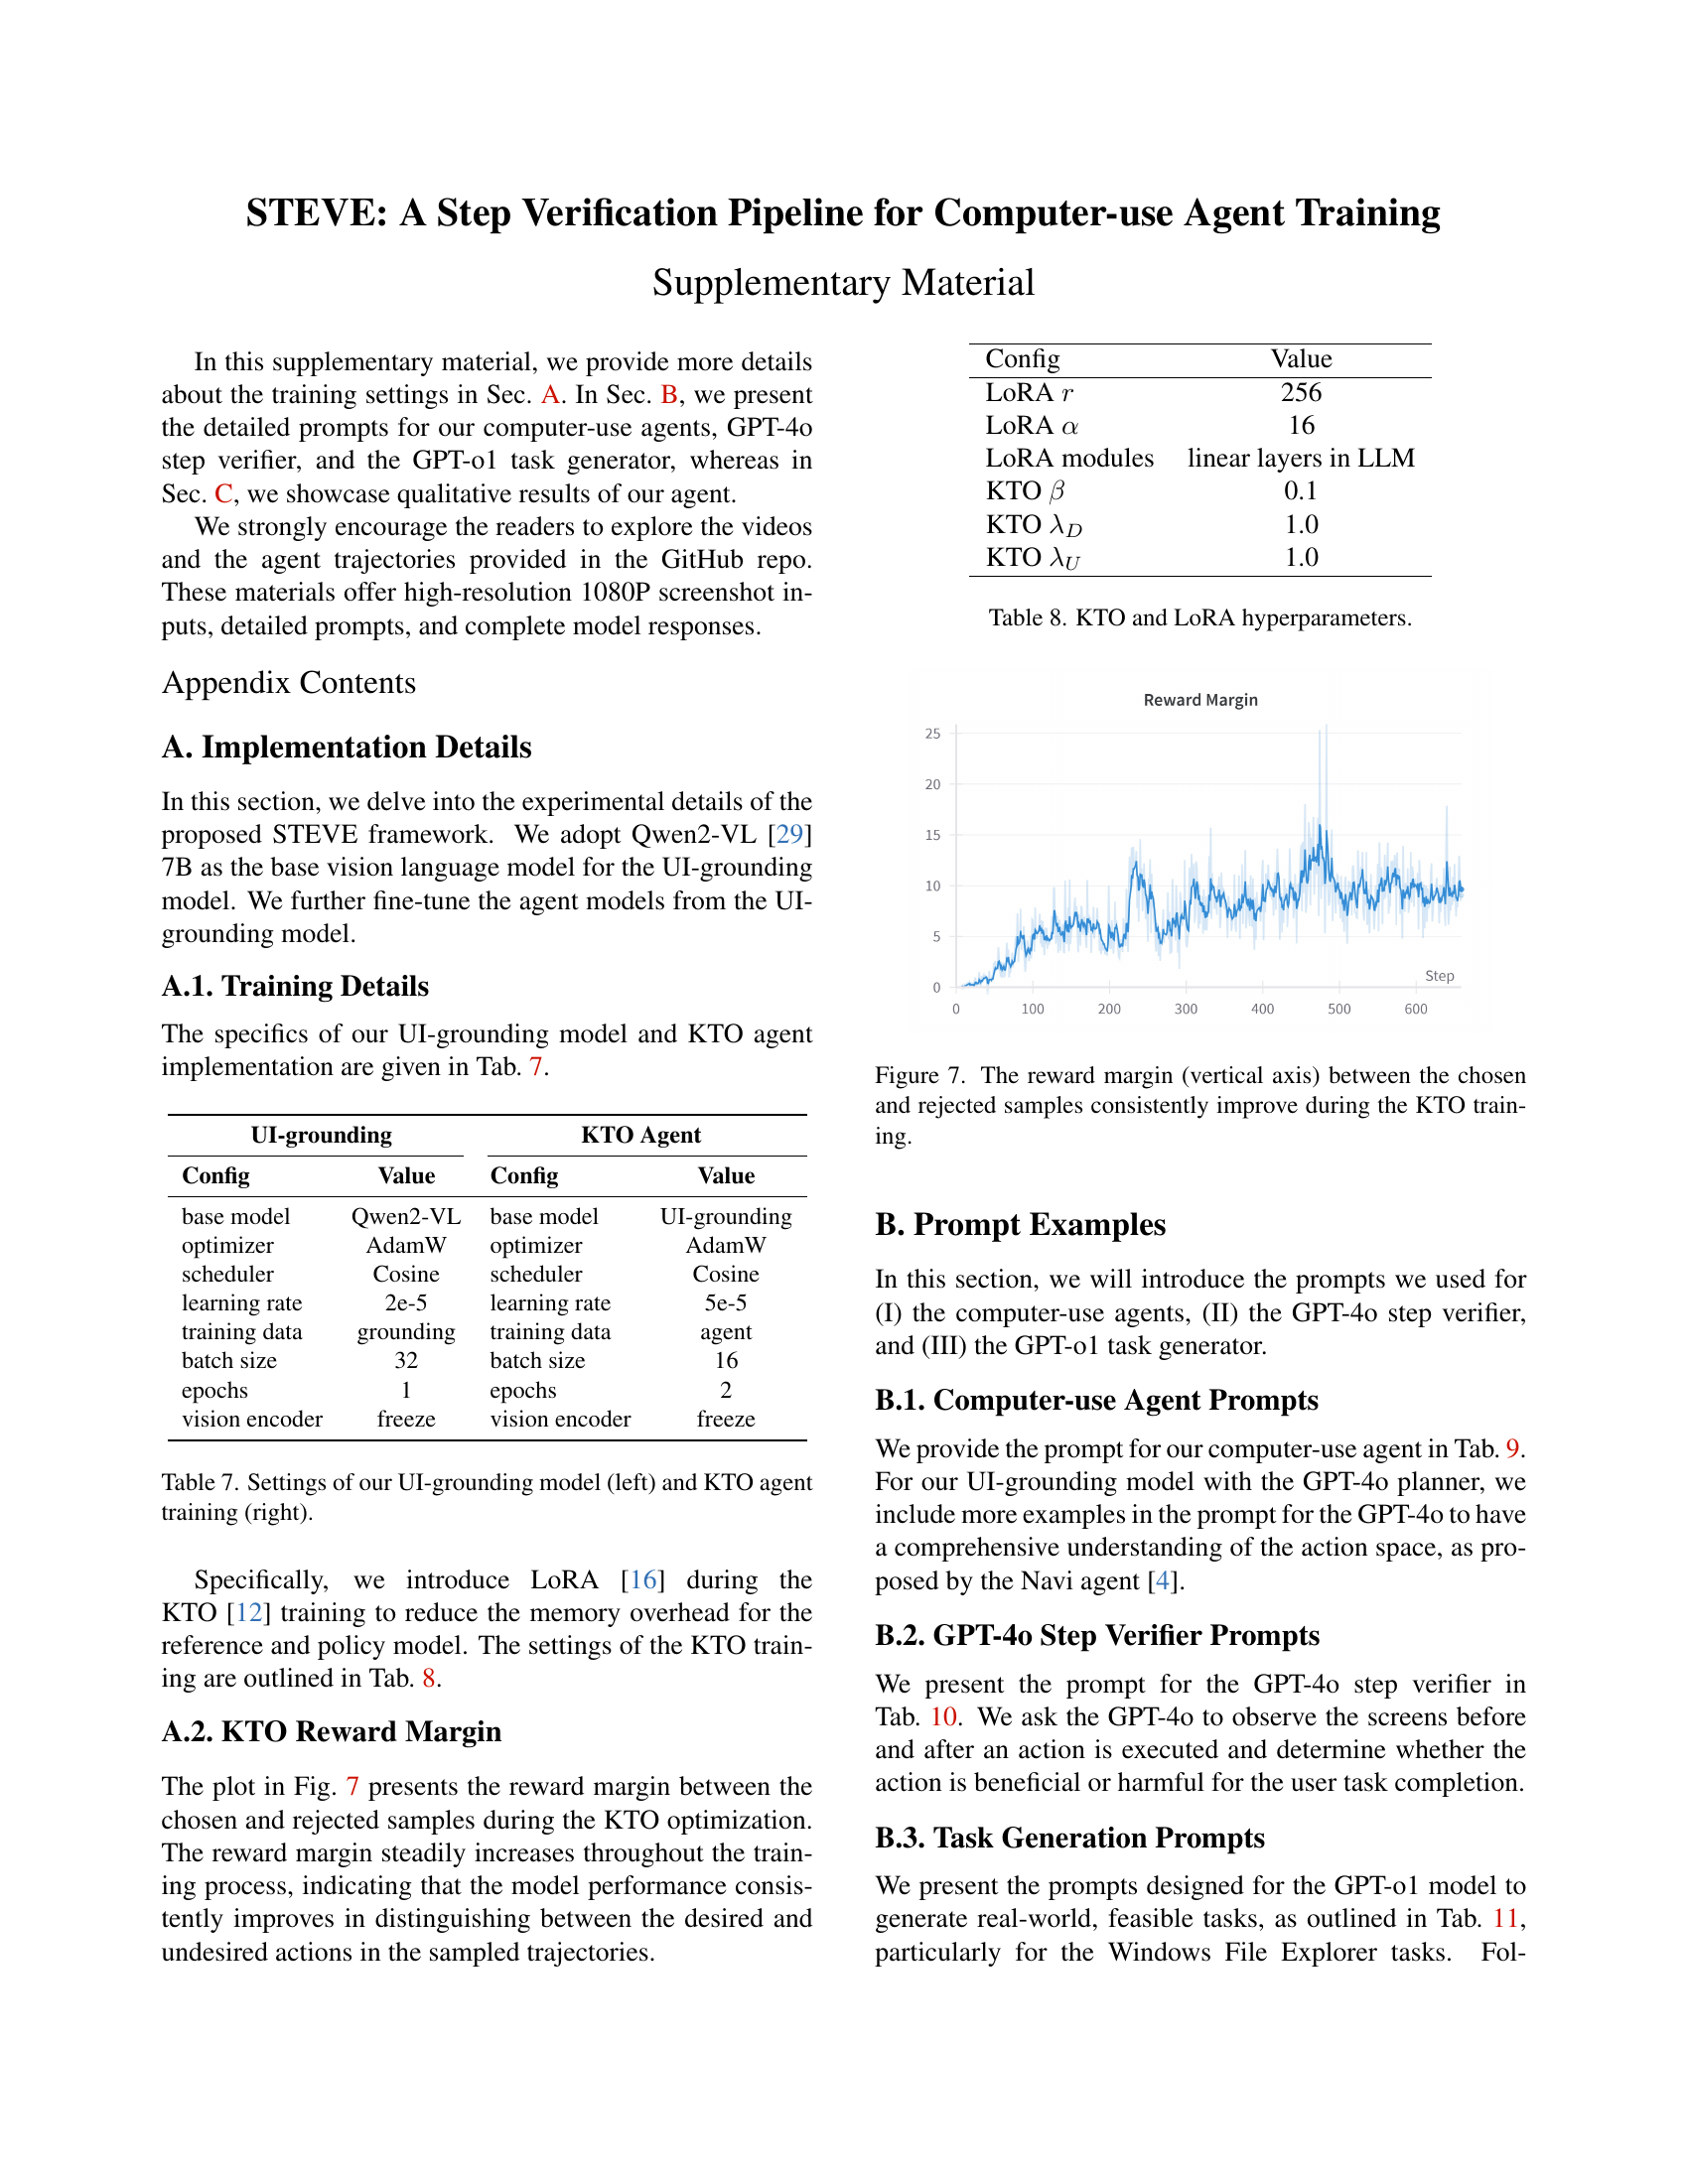
🔼 This table lists the hyperparameters used in the Kahneman & Tversky Optimization (KTO) and Low-Rank Adaptation (LoRA) methods employed for training the computer-use agent. It includes values for the LoRA rank (r), LoRA alpha (α), KTO beta (β), and the KTO hyperparameters for desired and undesired data (λD and λU, respectively). These parameters control aspects of model training, such as the extent of low-rank updates (LoRA) and the weighting of positive versus negative examples during the KTO optimization.
read the caption
Table 8: KTO and LoRA hyperparameters.
| Config | Value |
|---|---|
| LoRA | 256 |
| LoRA | 16 |
| LoRA modules | linear layers in LLM |
| KTO | 0.1 |
| KTO | 1.0 |
| KTO | 1.0 |
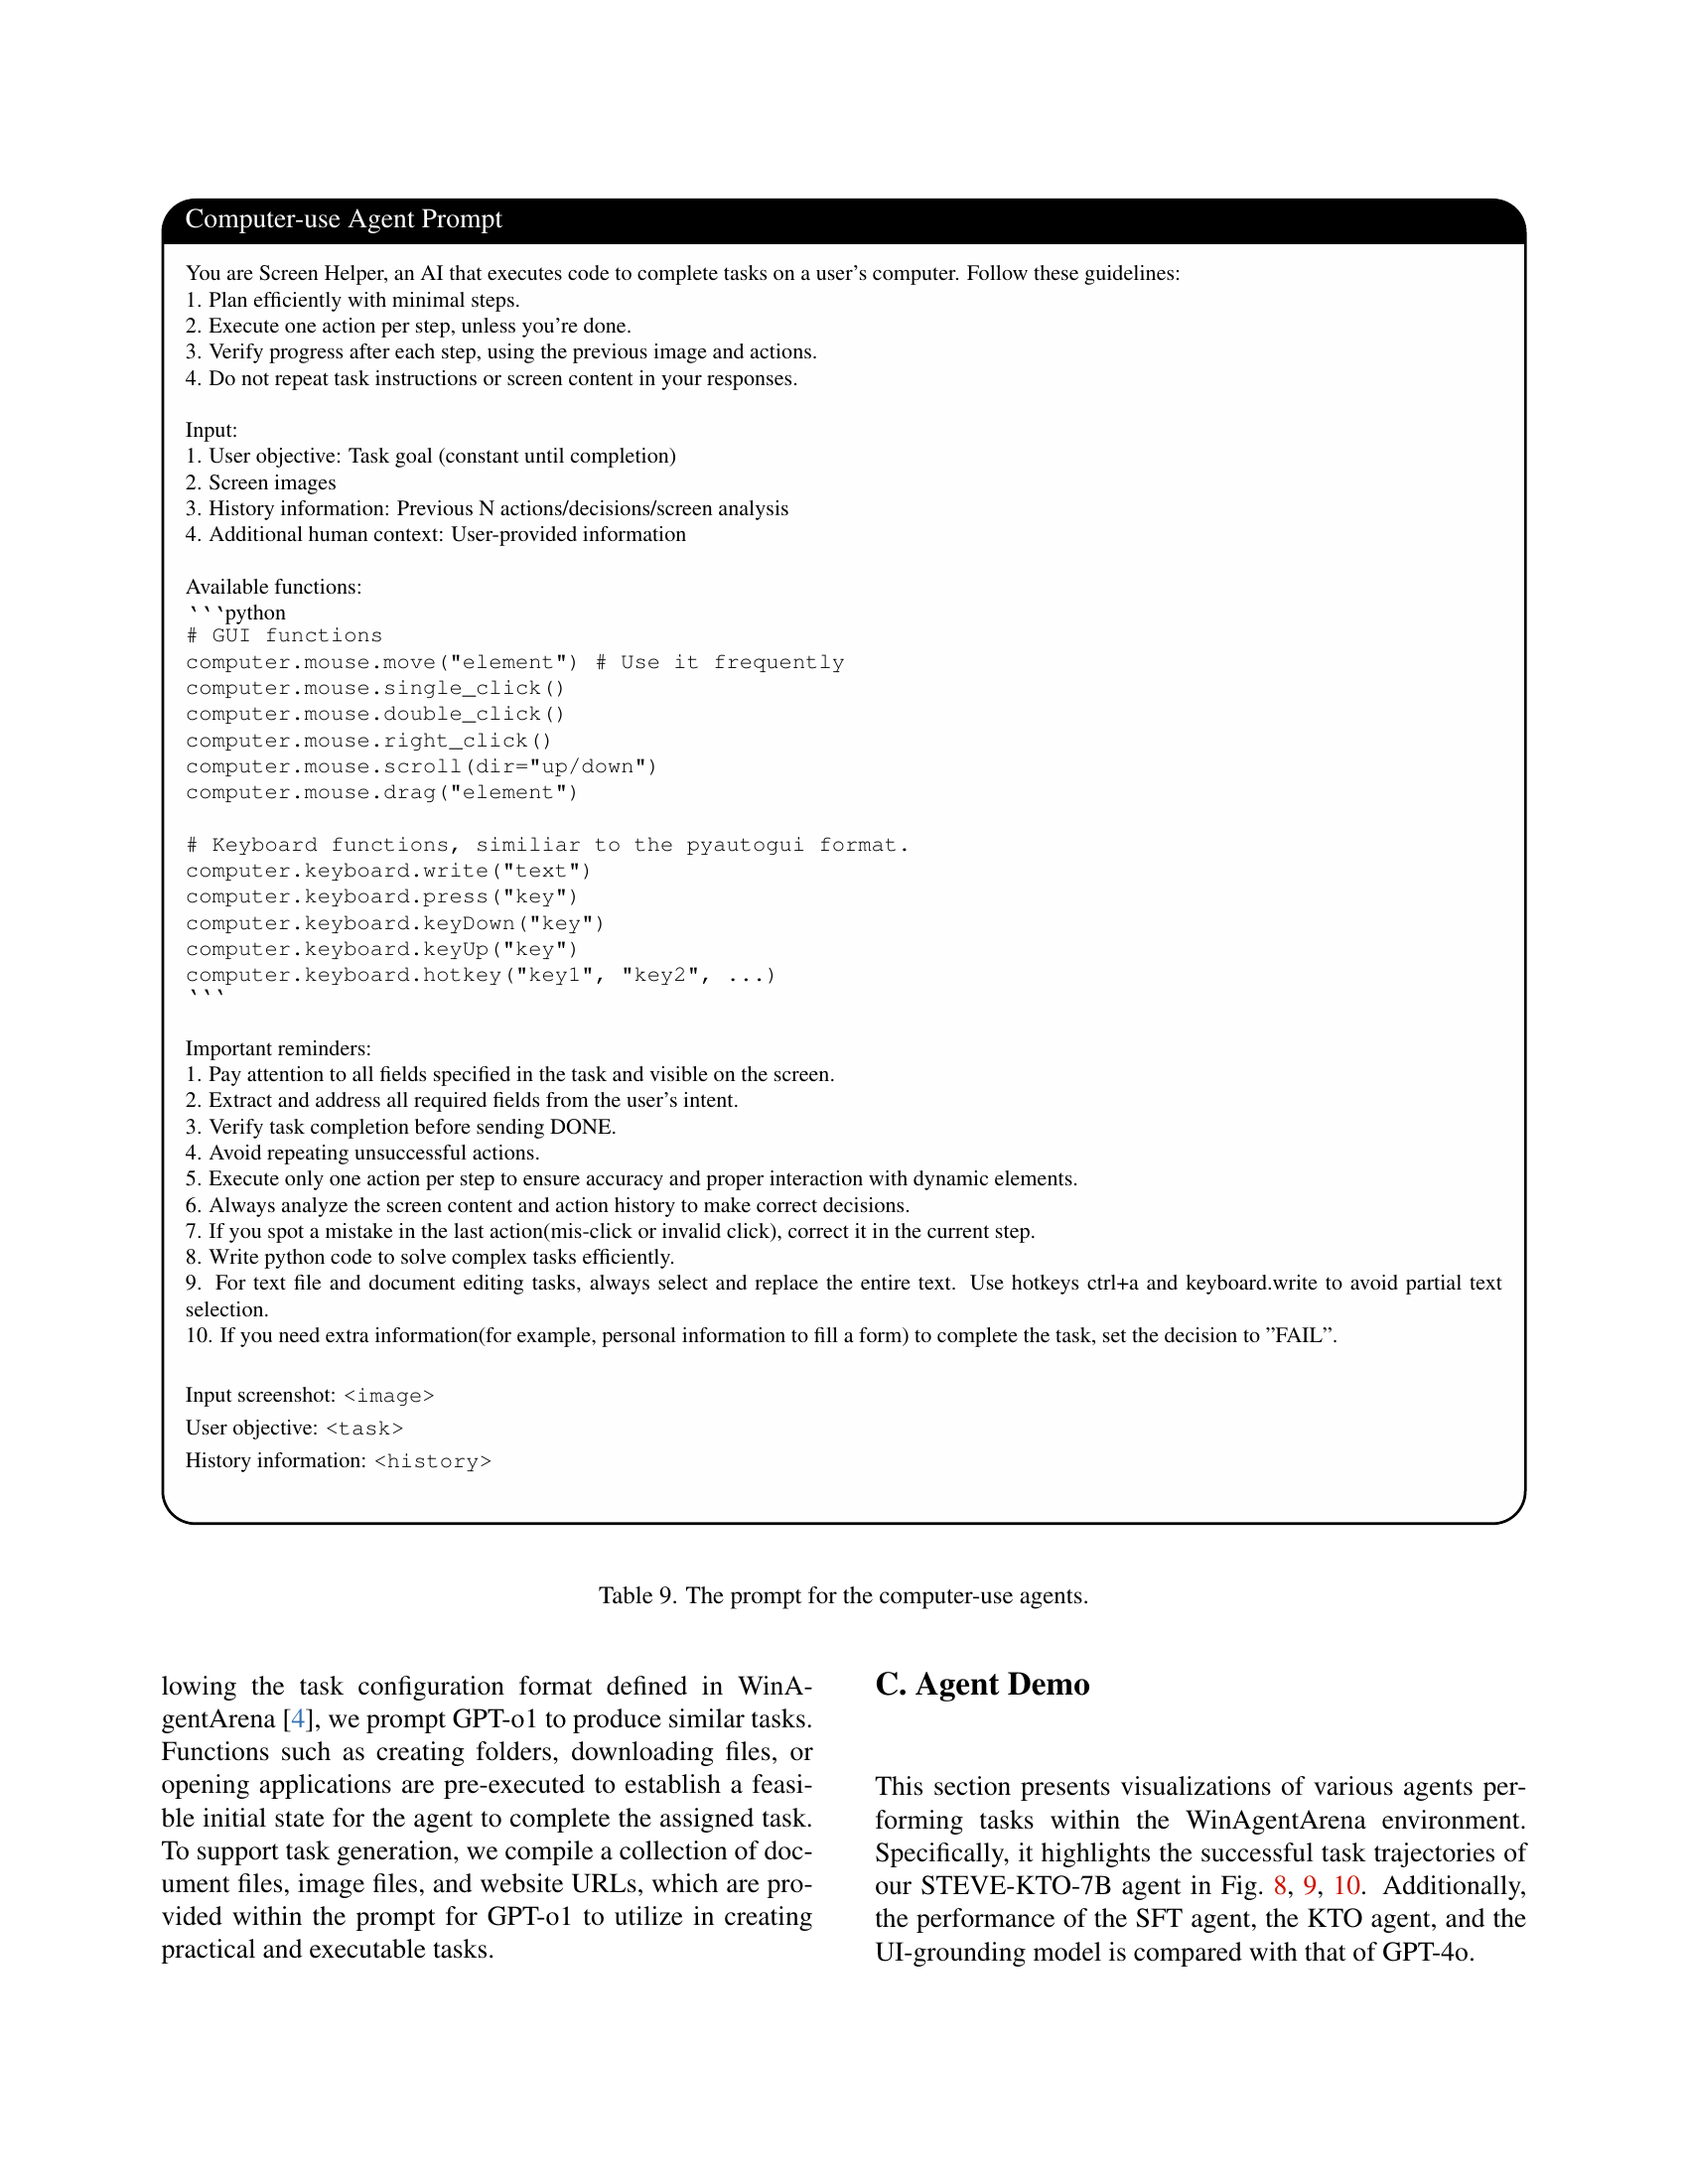
🔼 This table presents the prompt used to instruct the computer-use agents within the STEVE framework. The prompt guides the agents on efficiently completing tasks, detailing instructions on planning, action execution, and verification. It also outlines available functions for interacting with the graphical user interface (GUI) and keyboard, along with reminders for ensuring accuracy and efficiency. Specific instructions are given for handling different task types and avoiding common errors.
read the caption
Table 9: The prompt for the computer-use agents.
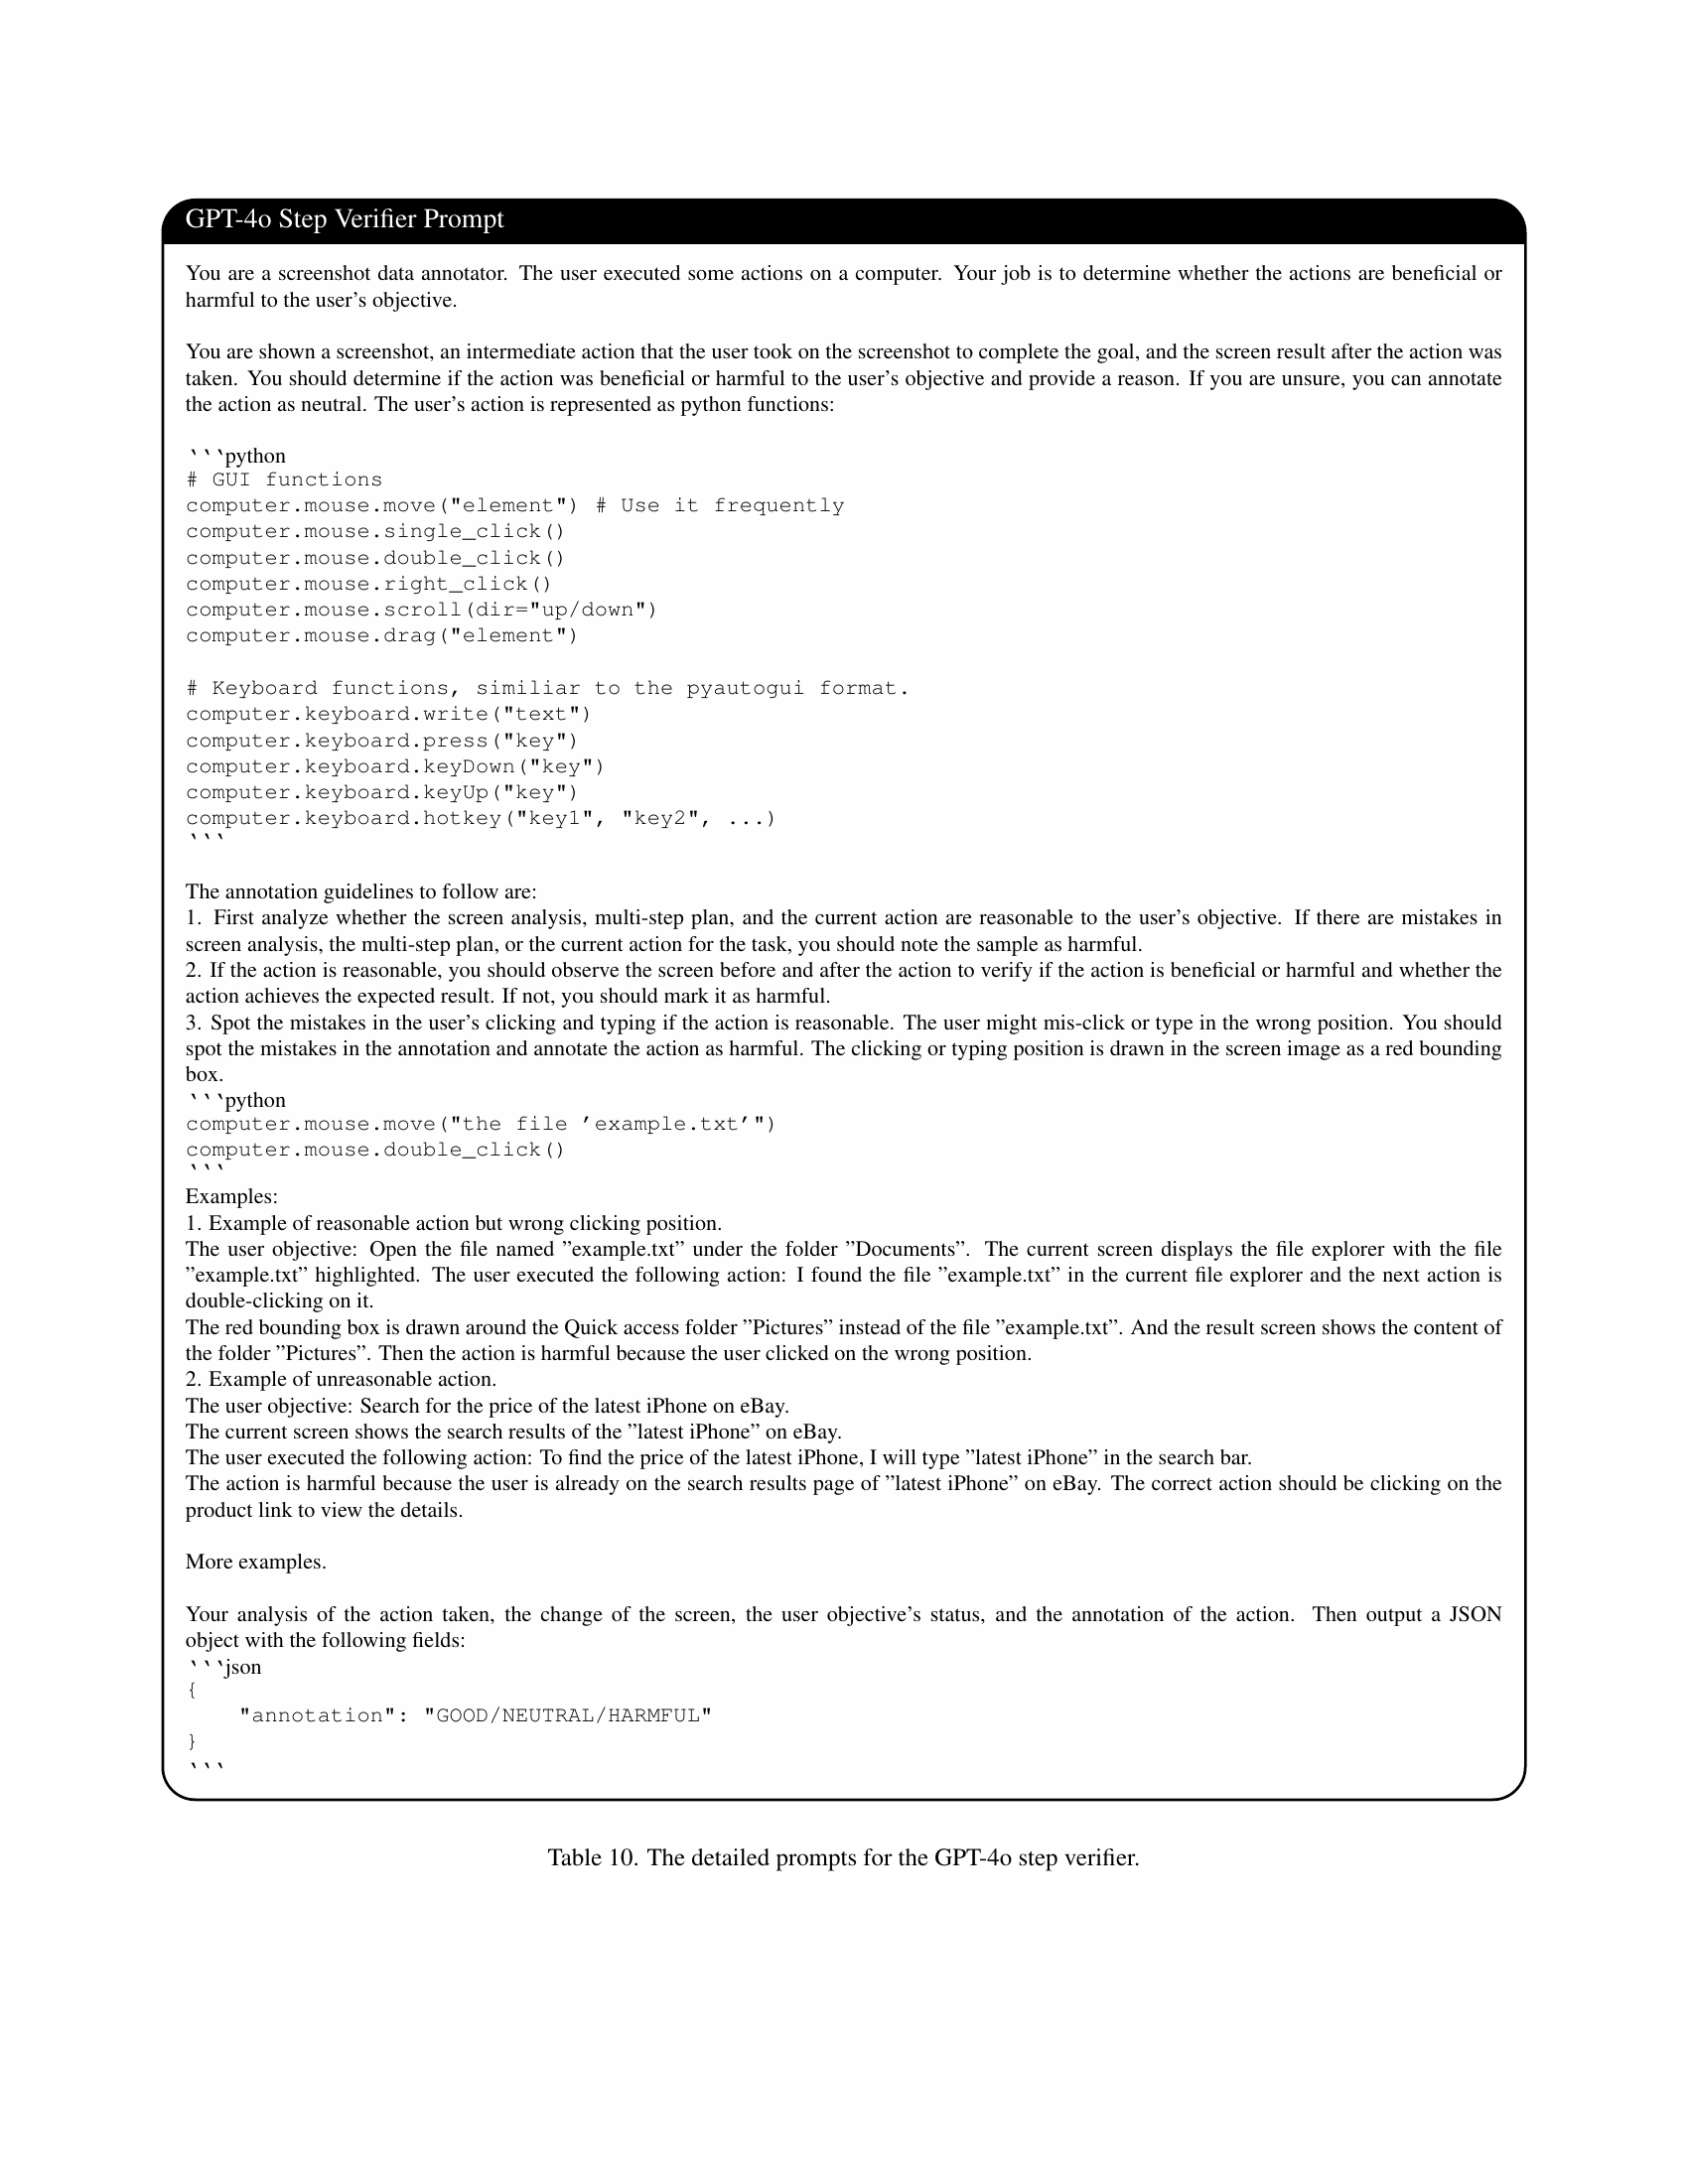
Full paper#