TL;DR#
Existing methods for generating diagram descriptions for BLV users are often costly, biased, and misaligned with their specific needs. Current evaluation metrics also struggle to accurately assess the quality of generated content from a BLV perspective. This leads to ineffective and inaccessible learning materials for visually impaired individuals. This paper introduces an approach to address these shortcomings.
This paper introduces SIGHTATION, a new dataset leveraging sighted user feedback to improve diagram descriptions generated by vision-language models (VLMs) for BLV users. By guiding VLMs with latent supervision and incorporating feedback from sighted individuals, the dataset reduces bias and improves alignment with BLV preferences. SIGHTATION encompasses 5k diagrams and 137k samples, designed for completion, preference, retrieval, question answering, and reasoning tasks, which demonstrates fine-tuning potential.
Key Takeaways#
Why does it matter?#
SIGHTATION bridges the gap in BLV-aligned diagram descriptions, enabling more inclusive VLM applications and setting a precedent for future accessibility-focused research.
Visual Insights#

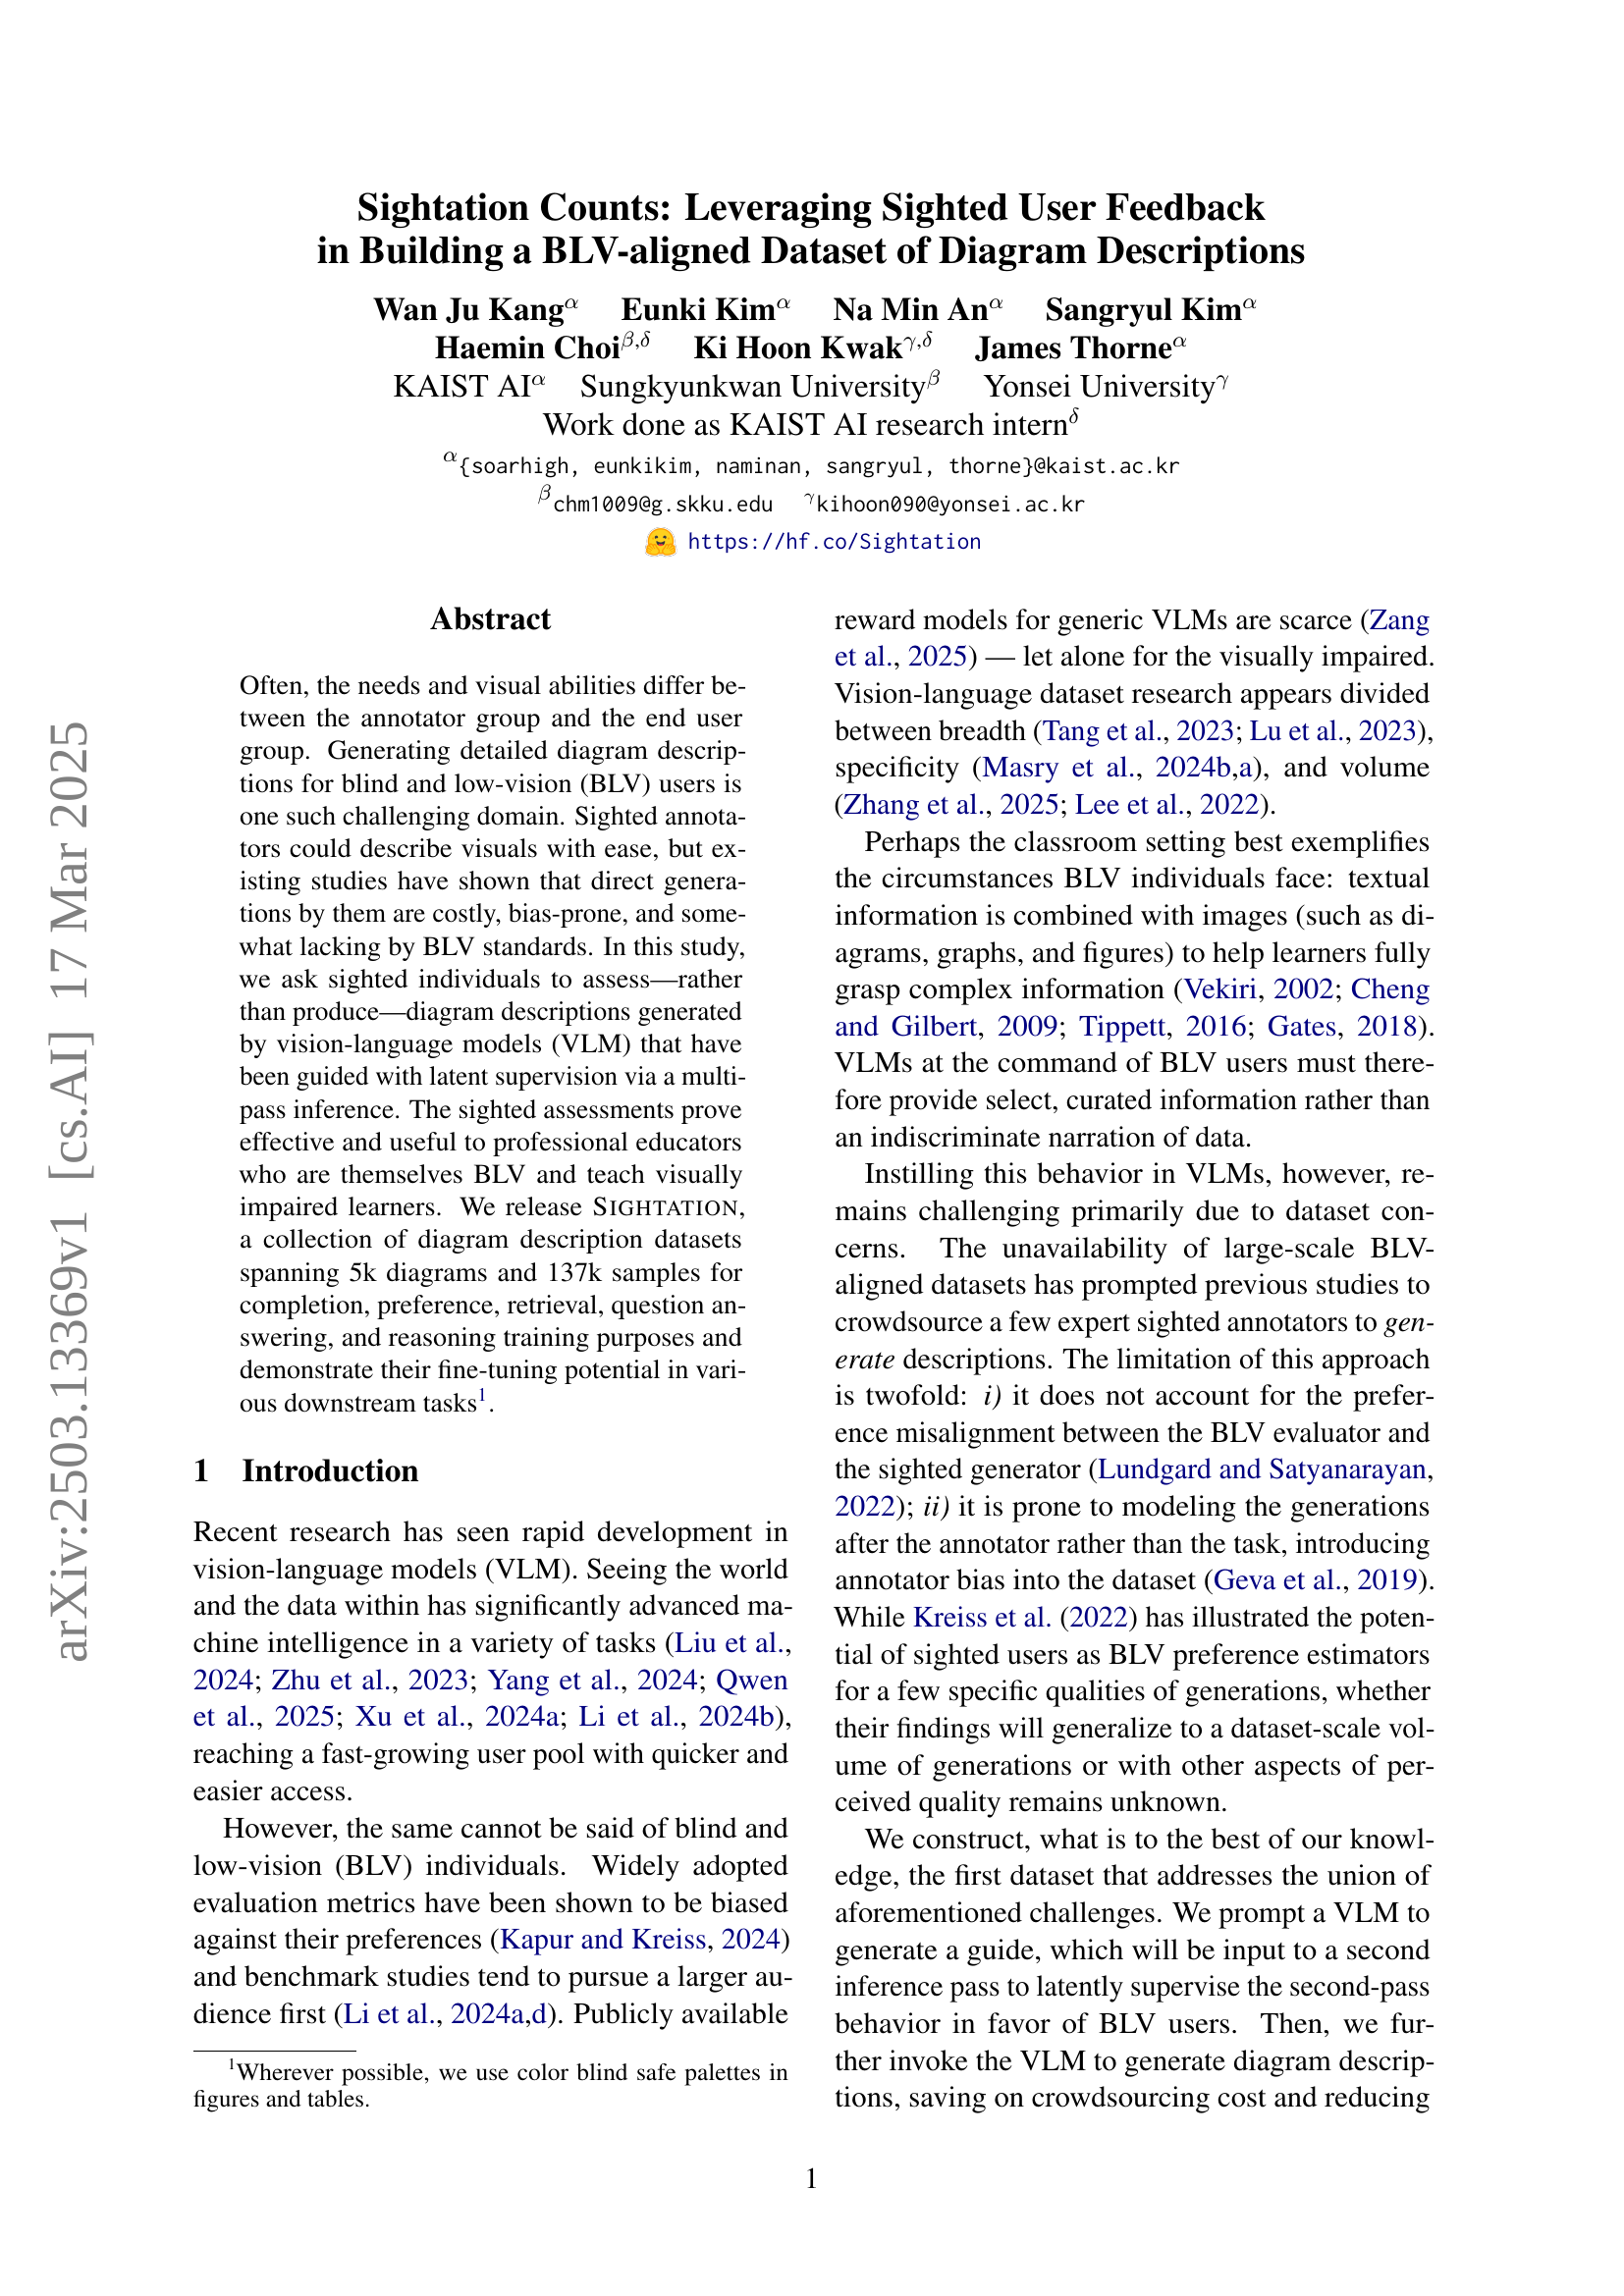
🔼 This figure illustrates the process of creating the SIGHTATION dataset. Sighted users, both general participants and educators, provide feedback on diagram descriptions generated by vision-language models (VLMs). This feedback is crucial because it leverages the sighted users’ solid visual understanding, which is then used to guide the VLMs. This process creates a dataset aligned with the preferences of blind and low-vision (BLV) users, making the generated descriptions more accessible for them. Details of the dataset usage and validation process are explained in Section 4, with a comprehensive list of use cases detailed in Appendix A.
read the caption
Figure 1: The key benefit of utilizing sighted user feedback lies in their assessments, which are based on solid visual grounding. The compiled assessments prove an effective training substance for steering VLMs towards more accessible descriptions. Dataset use and the subsequent validation are described in Sec. 4. A complete list of use cases is provided in Appendix A.
| Dataset | Average Text Length | Validated by BLV? | Applications | Dimensions Assessed |
| Sightation (Ours) -Completions -Preference -Retrieval -VQA -Reasoning | 188.3 (words) | ✓ | Completion Preference alignment Retrieval Reward modeling Question answering | Factuality Informativeness Succinctness Diversity Usefulness, in 4 finer aspects Interpretiveness Preferred Description Best Sentence |
| VisText Tang et al. (2023) | 74.6 | × | Completion | Accuracy, Descriptiveness |
| MathVista Lu et al. (2023) | 58.0 | × | VQA, Reasoning | Correctness |
| ChartGemma Masry et al. (2024b) | 37.5 | × | Completion | Informativeness, Factual Correctness, Structure |
| DiagramQG Zhang et al. (2024b) | 9.5 | × | DQA | Diversity, Object Density |
| VizWiz-VQA Gurari et al. (2018) | 8.6 | ✓ | VQA | Diversity, Answerability |
| VizWiz-LF Huh et al. (2024) | 73.2 | ✓ | VQA | Relevance, Helpfulness, Plausibility, Fluency, Correctness |
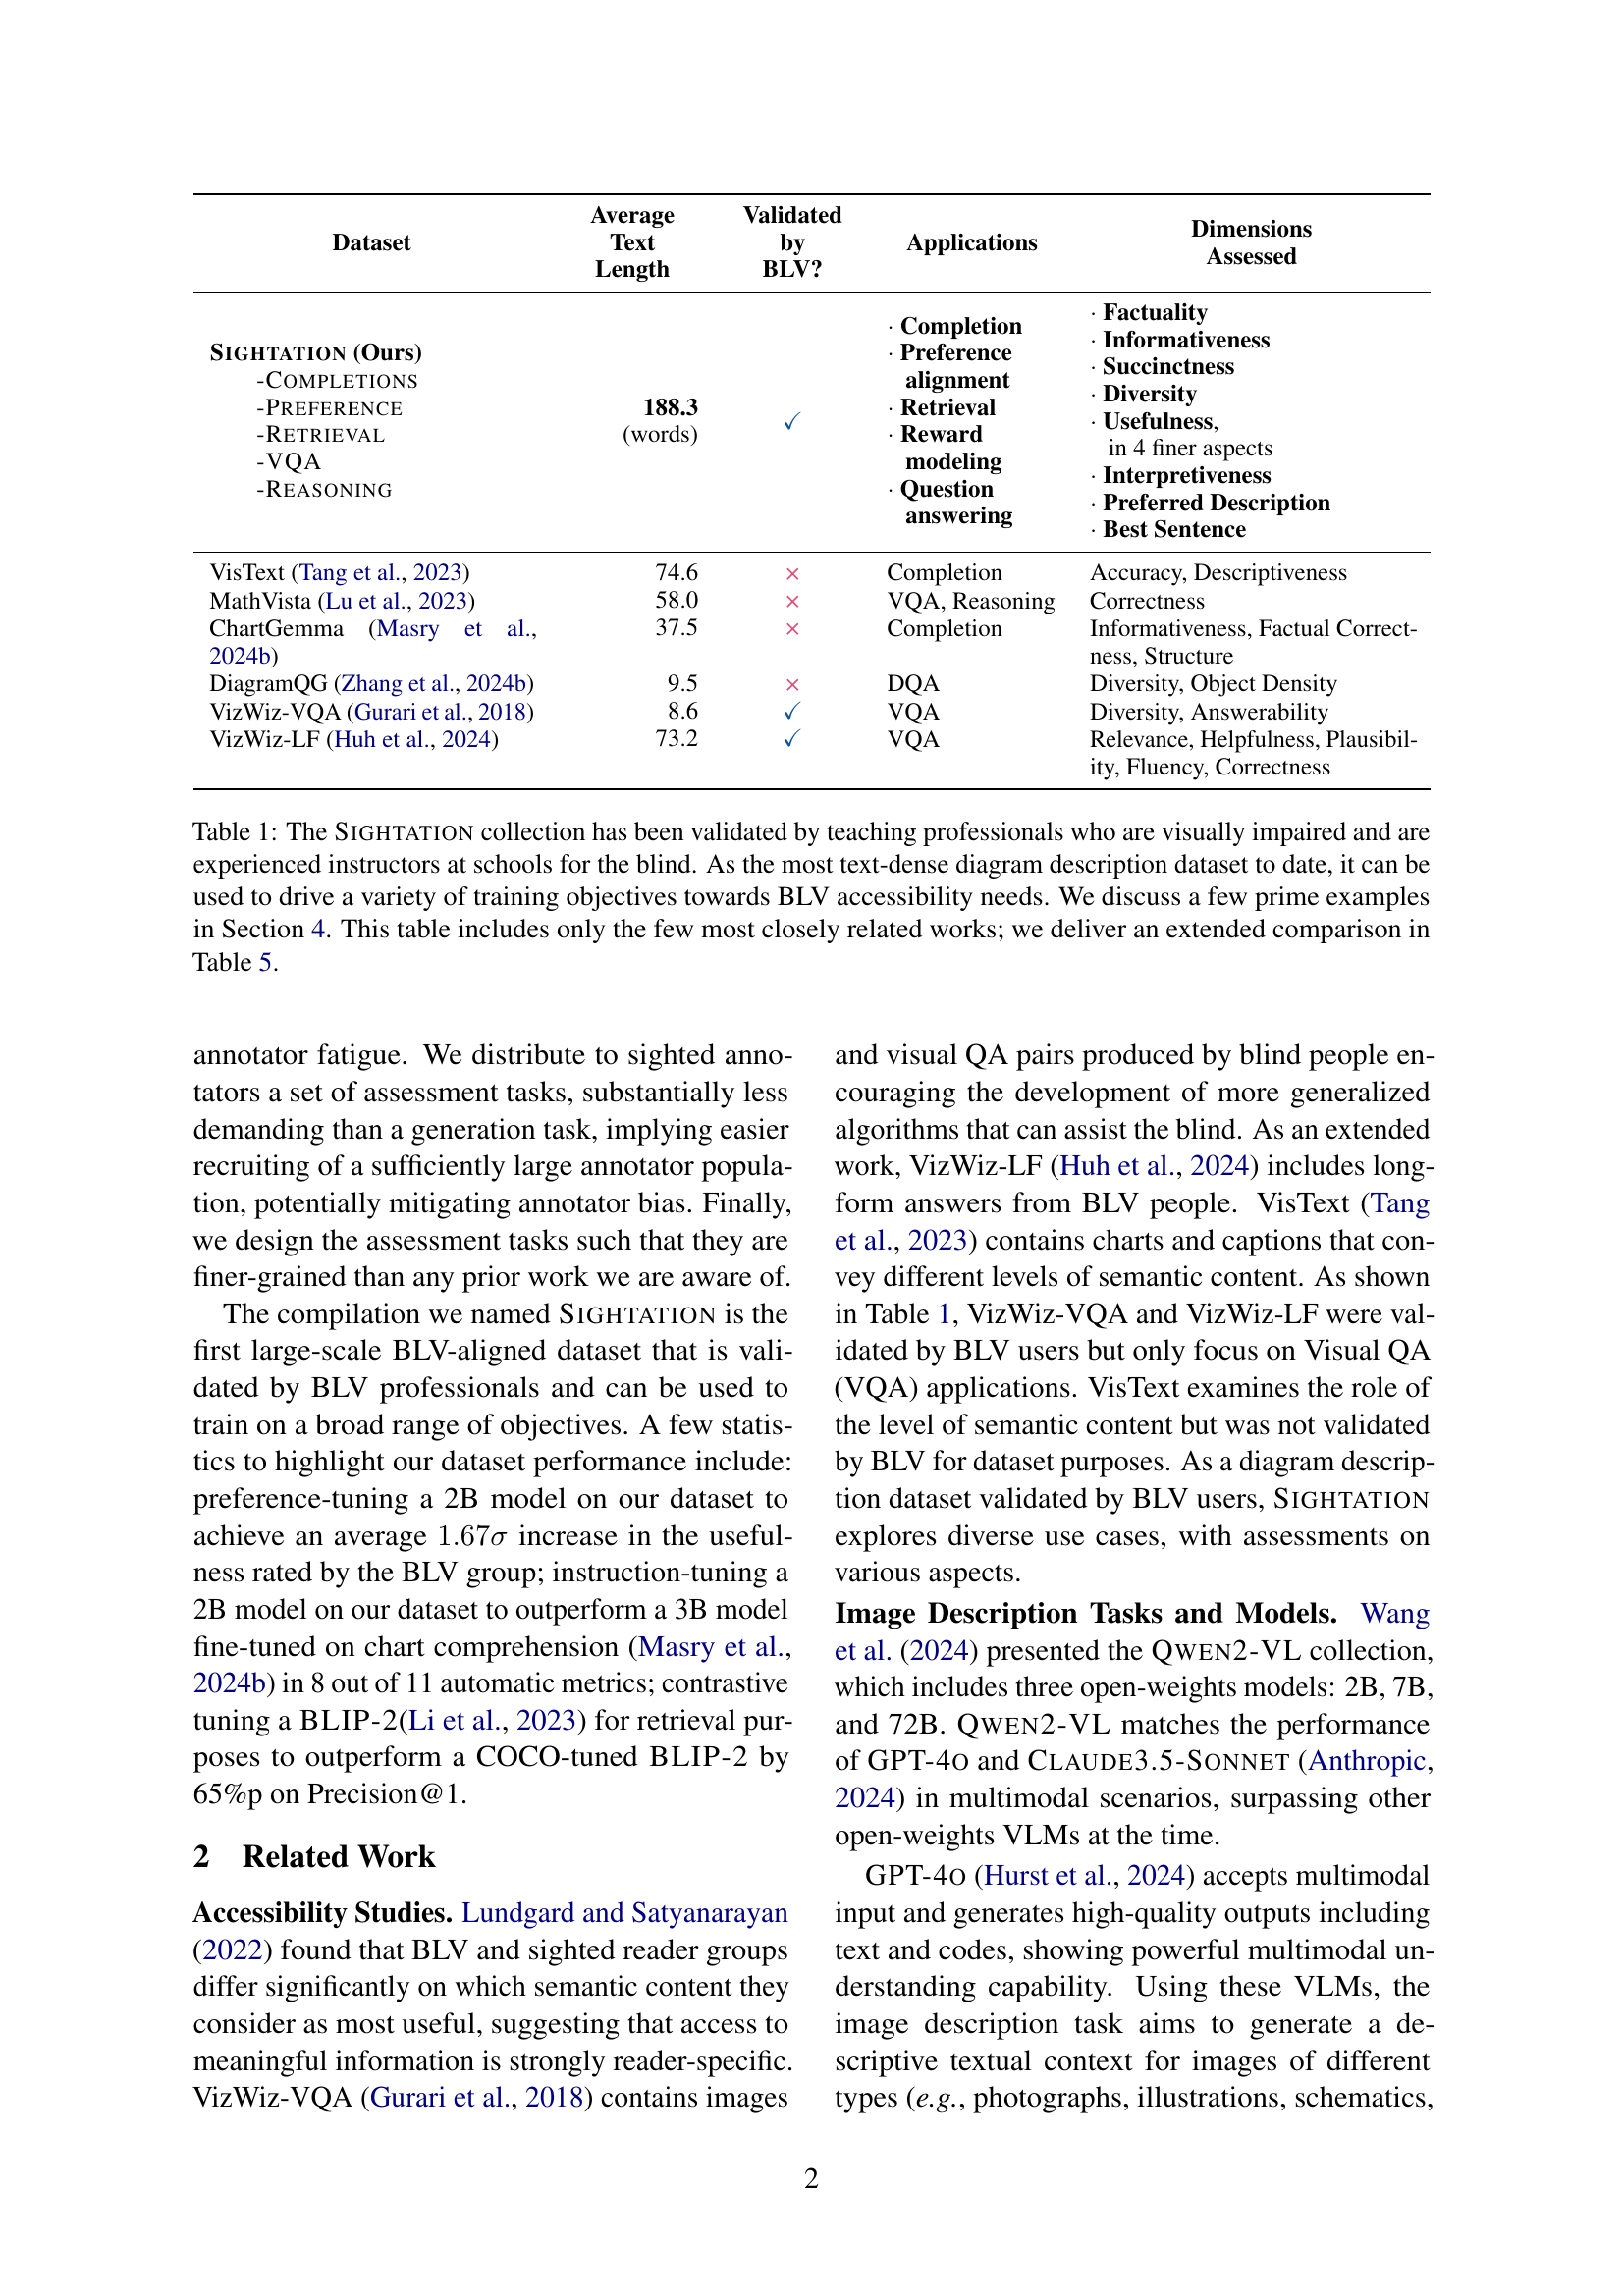
🔼 This table presents a comparison of the Sightation dataset with other relevant datasets in terms of average text length, validation by blind or low-vision (BLV) users, applications (such as completion, preference, retrieval, question answering, and reasoning), and the assessed dimensions (like factuality, informativeness, succinctness, diversity, and usefulness). Sightation is highlighted as the most text-dense diagram description dataset, validated by experienced BLV instructors, and suitable for various training objectives focused on BLV accessibility. A more comprehensive comparison is provided in Table 5.
read the caption
Table 1: The Sightation collection has been validated by teaching professionals who are visually impaired and are experienced instructors at schools for the blind. As the most text-dense diagram description dataset to date, it can be used to drive a variety of training objectives towards BLV accessibility needs. We discuss a few prime examples in Section 4. This table includes only the few most closely related works; we deliver an extended comparison in Table 5.
In-depth insights#
BLV Dataset#
While the provided research paper doesn’t explicitly have a heading called “BLV Dataset,” the core contribution revolves around creating and evaluating a dataset tailored for blind and low-vision (BLV) users. This is a critical area because existing vision-language models (VLMs) and datasets often don’t adequately address the specific needs and preferences of this community. The paper highlights challenges like annotator bias, where sighted annotators may not produce descriptions that are truly useful for BLV individuals. The SIGHTATION dataset seeks to overcome these limitations by leveraging sighted user feedback to guide VLMs in generating more accessible diagram descriptions. A crucial aspect of the approach is the multi-pass inference strategy, using a VLM to generate guides for a second VLM pass, combined with BLV-aligned assessments. The ultimate purpose of the data is to fine-tune VLM for the targeted users.
Sight Bias?#
The idea of sight bias raises critical questions about data collection. Data from sighted individuals could easily reflect their own visual understanding, which might not translate well for those with visual impairments. It could emphasize details differently, potentially missing key information crucial for blind or low-vision users. Addressing sight bias requires careful design of data collection and evaluation methods to ensure inclusivity. This could involve techniques like active feedback from visually impaired individuals, or training sighted annotators on accessibility needs. The goal is to ensure that generated content is genuinely useful, not just visually appealing.
Latent Guides#
Latent guides could significantly enhance vision-language models (VLMs) by providing a structured approach to generating diagram descriptions, especially for blind and low-vision (BLV) users. Instead of relying solely on sighted annotators (potentially introducing bias), VLMs can be prompted to generate intermediate guides—like question-answer pairs—that capture crucial diagram information. These guides then supervise a second VLM pass, resulting in descriptions more aligned with BLV user needs. This addresses the challenge of dataset creation and promotes accessibility. The multi-pass approach uses the VLM itself to curate relevant information, reducing the need for extensive human annotation, which is expensive and potentially biased. The value of latent guides can be seen in a way that they not only address the preference differences between annotators and end-users but also in the reduction of annotator bias by allowing the model to first identify salient features, before generating the final description. This innovative strategy leverages VLM capabilities, fostering accessible visual information for BLV.
BLV Alignment#
BLV alignment is crucial for accessibility, moving beyond sighted-centric views. The paper addresses this by using sighted feedback to improve VLM-generated diagram descriptions for blind and low-vision users. A key insight is the misalignment between sighted annotators and BLV user needs, leading to biased and less effective descriptions. The solution involves a multi-pass inference with latent supervision, guiding VLMs towards BLV-aligned outputs. Sighted individuals assess VLM-generated descriptions instead of creating them, proving more effective. This addresses biases and reduces crowdsourcing costs, with educators providing valuable insights on the relevance to BLV learners. The release of the dataset facilitates training and evaluation and promotes inclusive AI development, ensuring that AI solutions are truly beneficial for all users.
Multi-Pass VLM#
The concept of a ‘Multi-Pass VLM’ suggests a sophisticated approach to visual-language modeling, where the model isn’t limited to a single interaction with the input. Instead, it could involve multiple iterative passes, allowing for deeper analysis and contextual understanding. In each pass, the VLM could focus on different aspects, like identifying objects, inferring relationships, or generating detailed descriptions. This iterative process can refine its understanding and output, resulting in more accurate and nuanced results. It allows the model to generate a guide as latent supervision and reducing cost of crowdsourcing, that can better aligns with BLV user preferences.
More visual insights#
More on figures

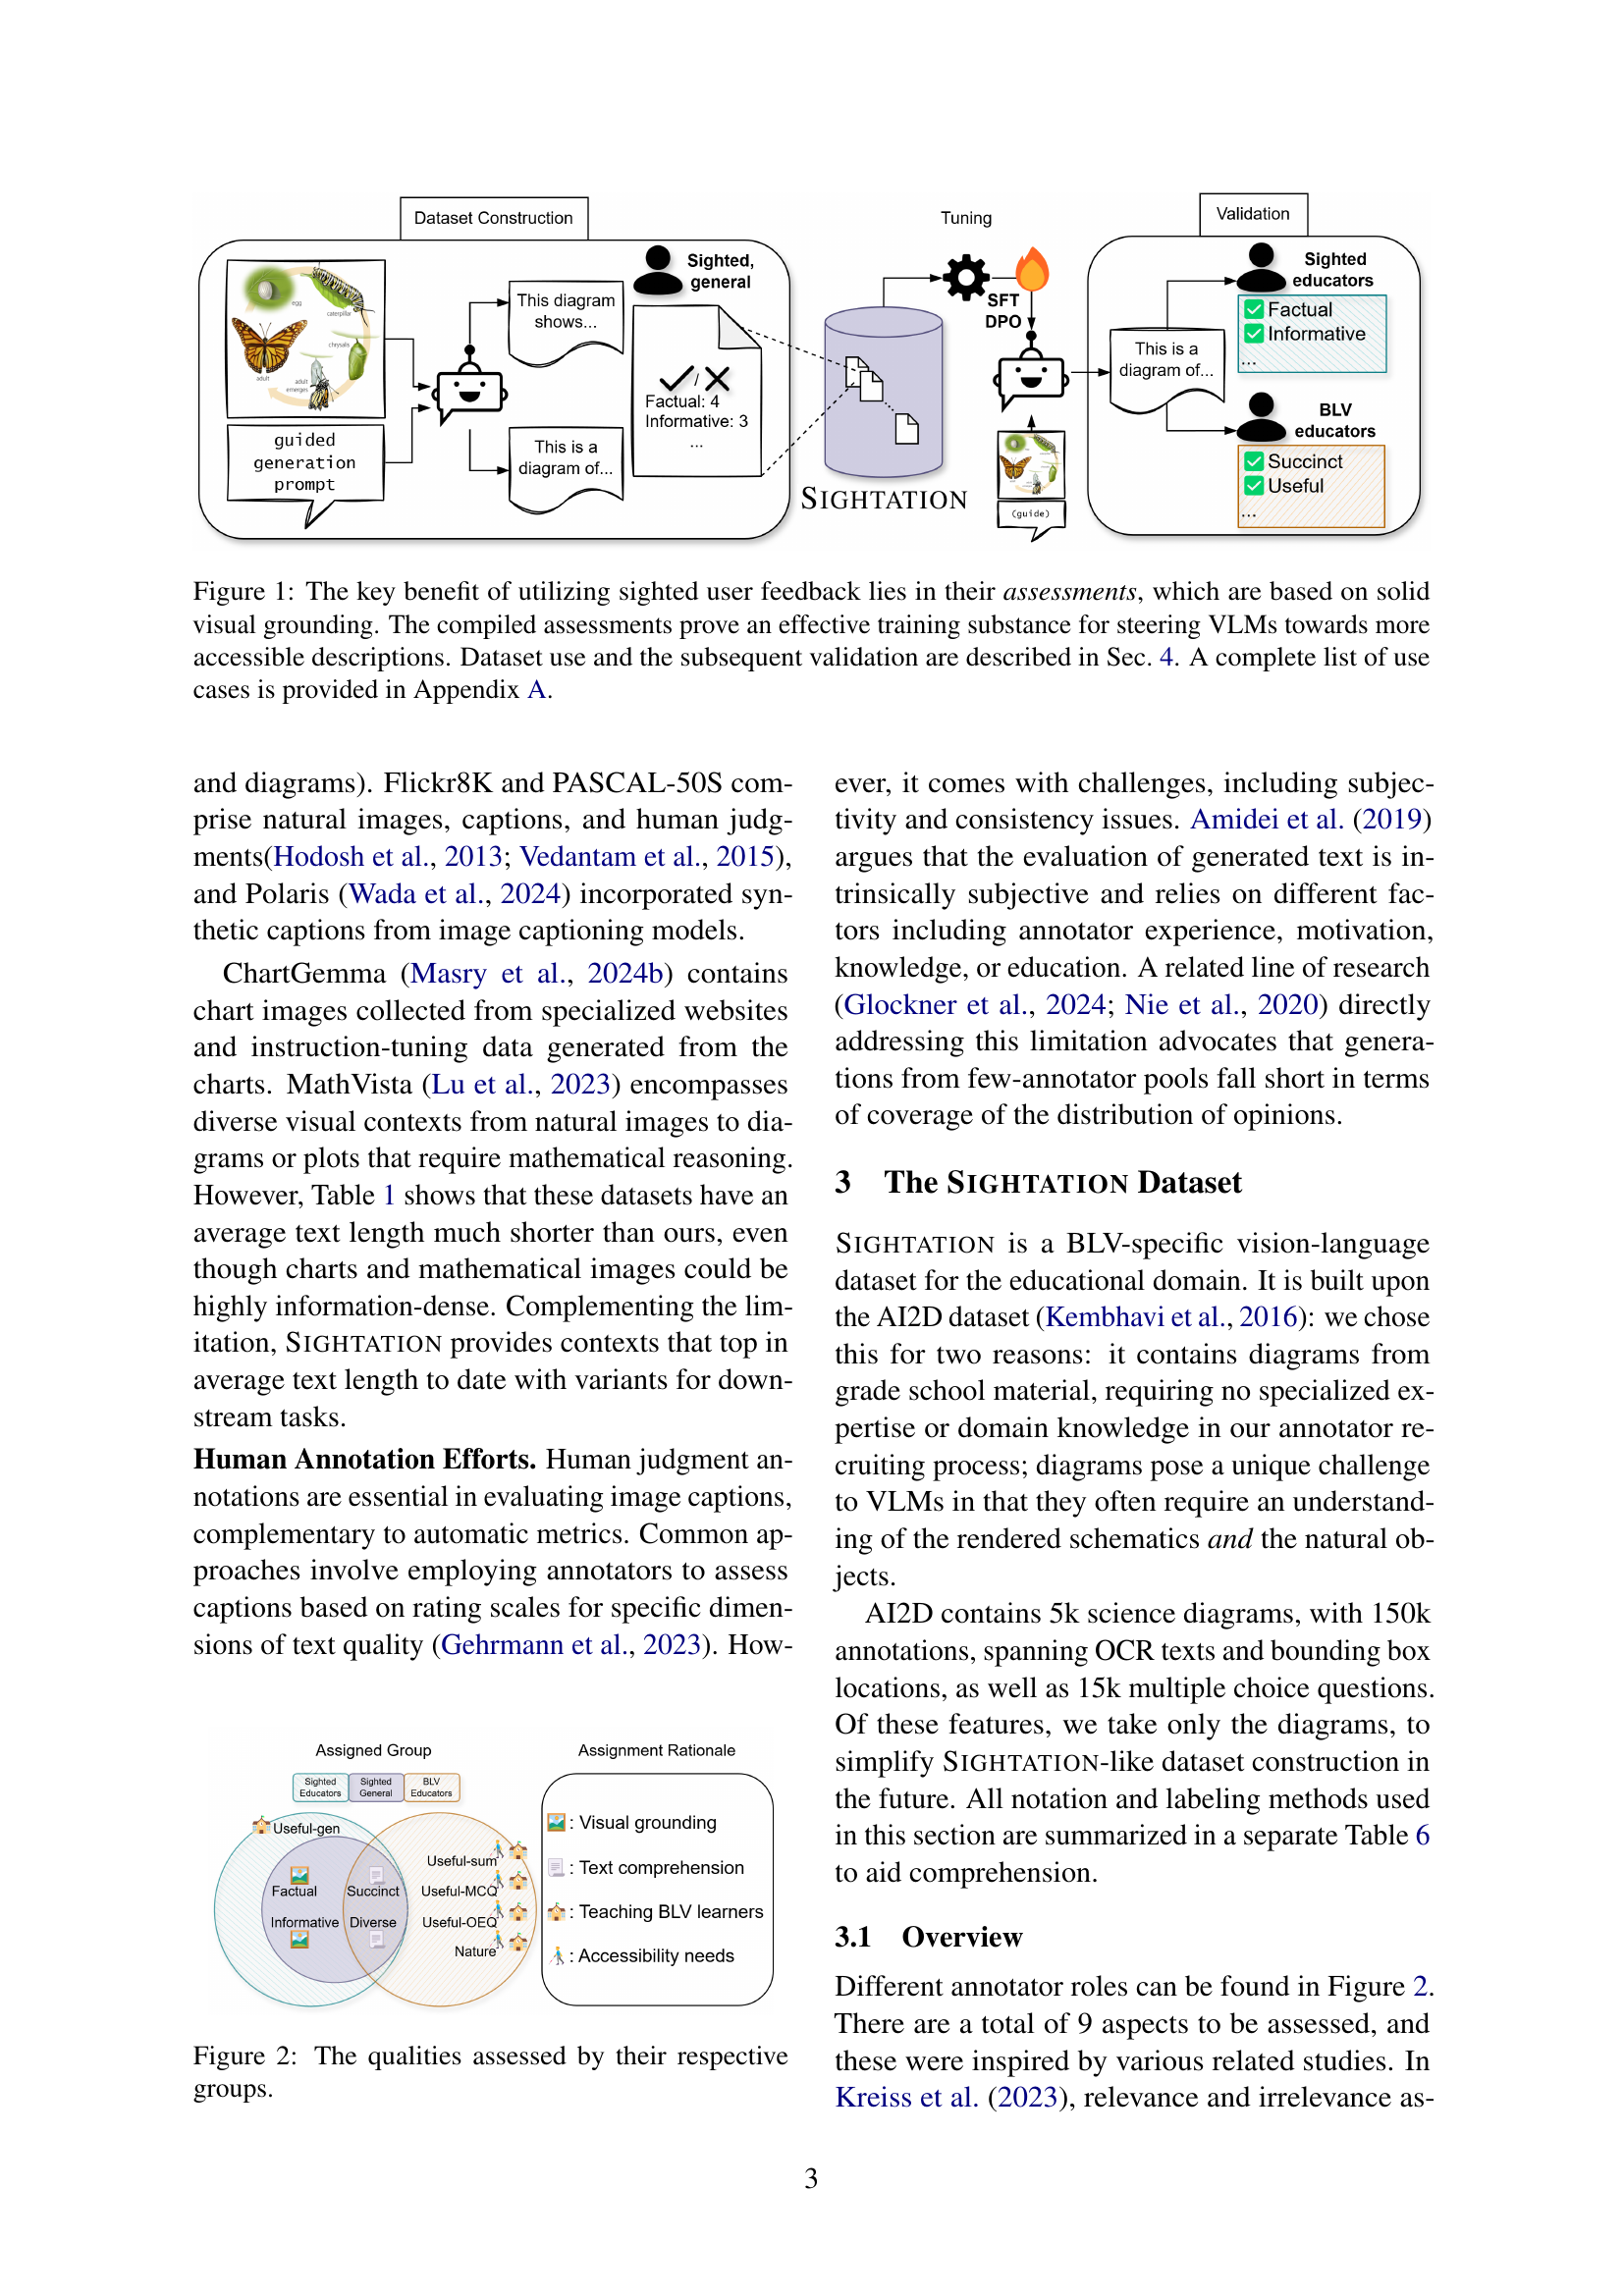
🔼 This figure shows the different qualities assessed by three groups of annotators involved in evaluating diagram descriptions. The three groups were: sighted general participants, sighted educators, and blind or low-vision (BLV) educators. Each group focused on assessing a different subset of qualities, reflecting their respective backgrounds and experiences. This is crucial because it shows how different perspectives are incorporated into the evaluation of the data.
read the caption
Figure 2: The qualities assessed by their respective groups.

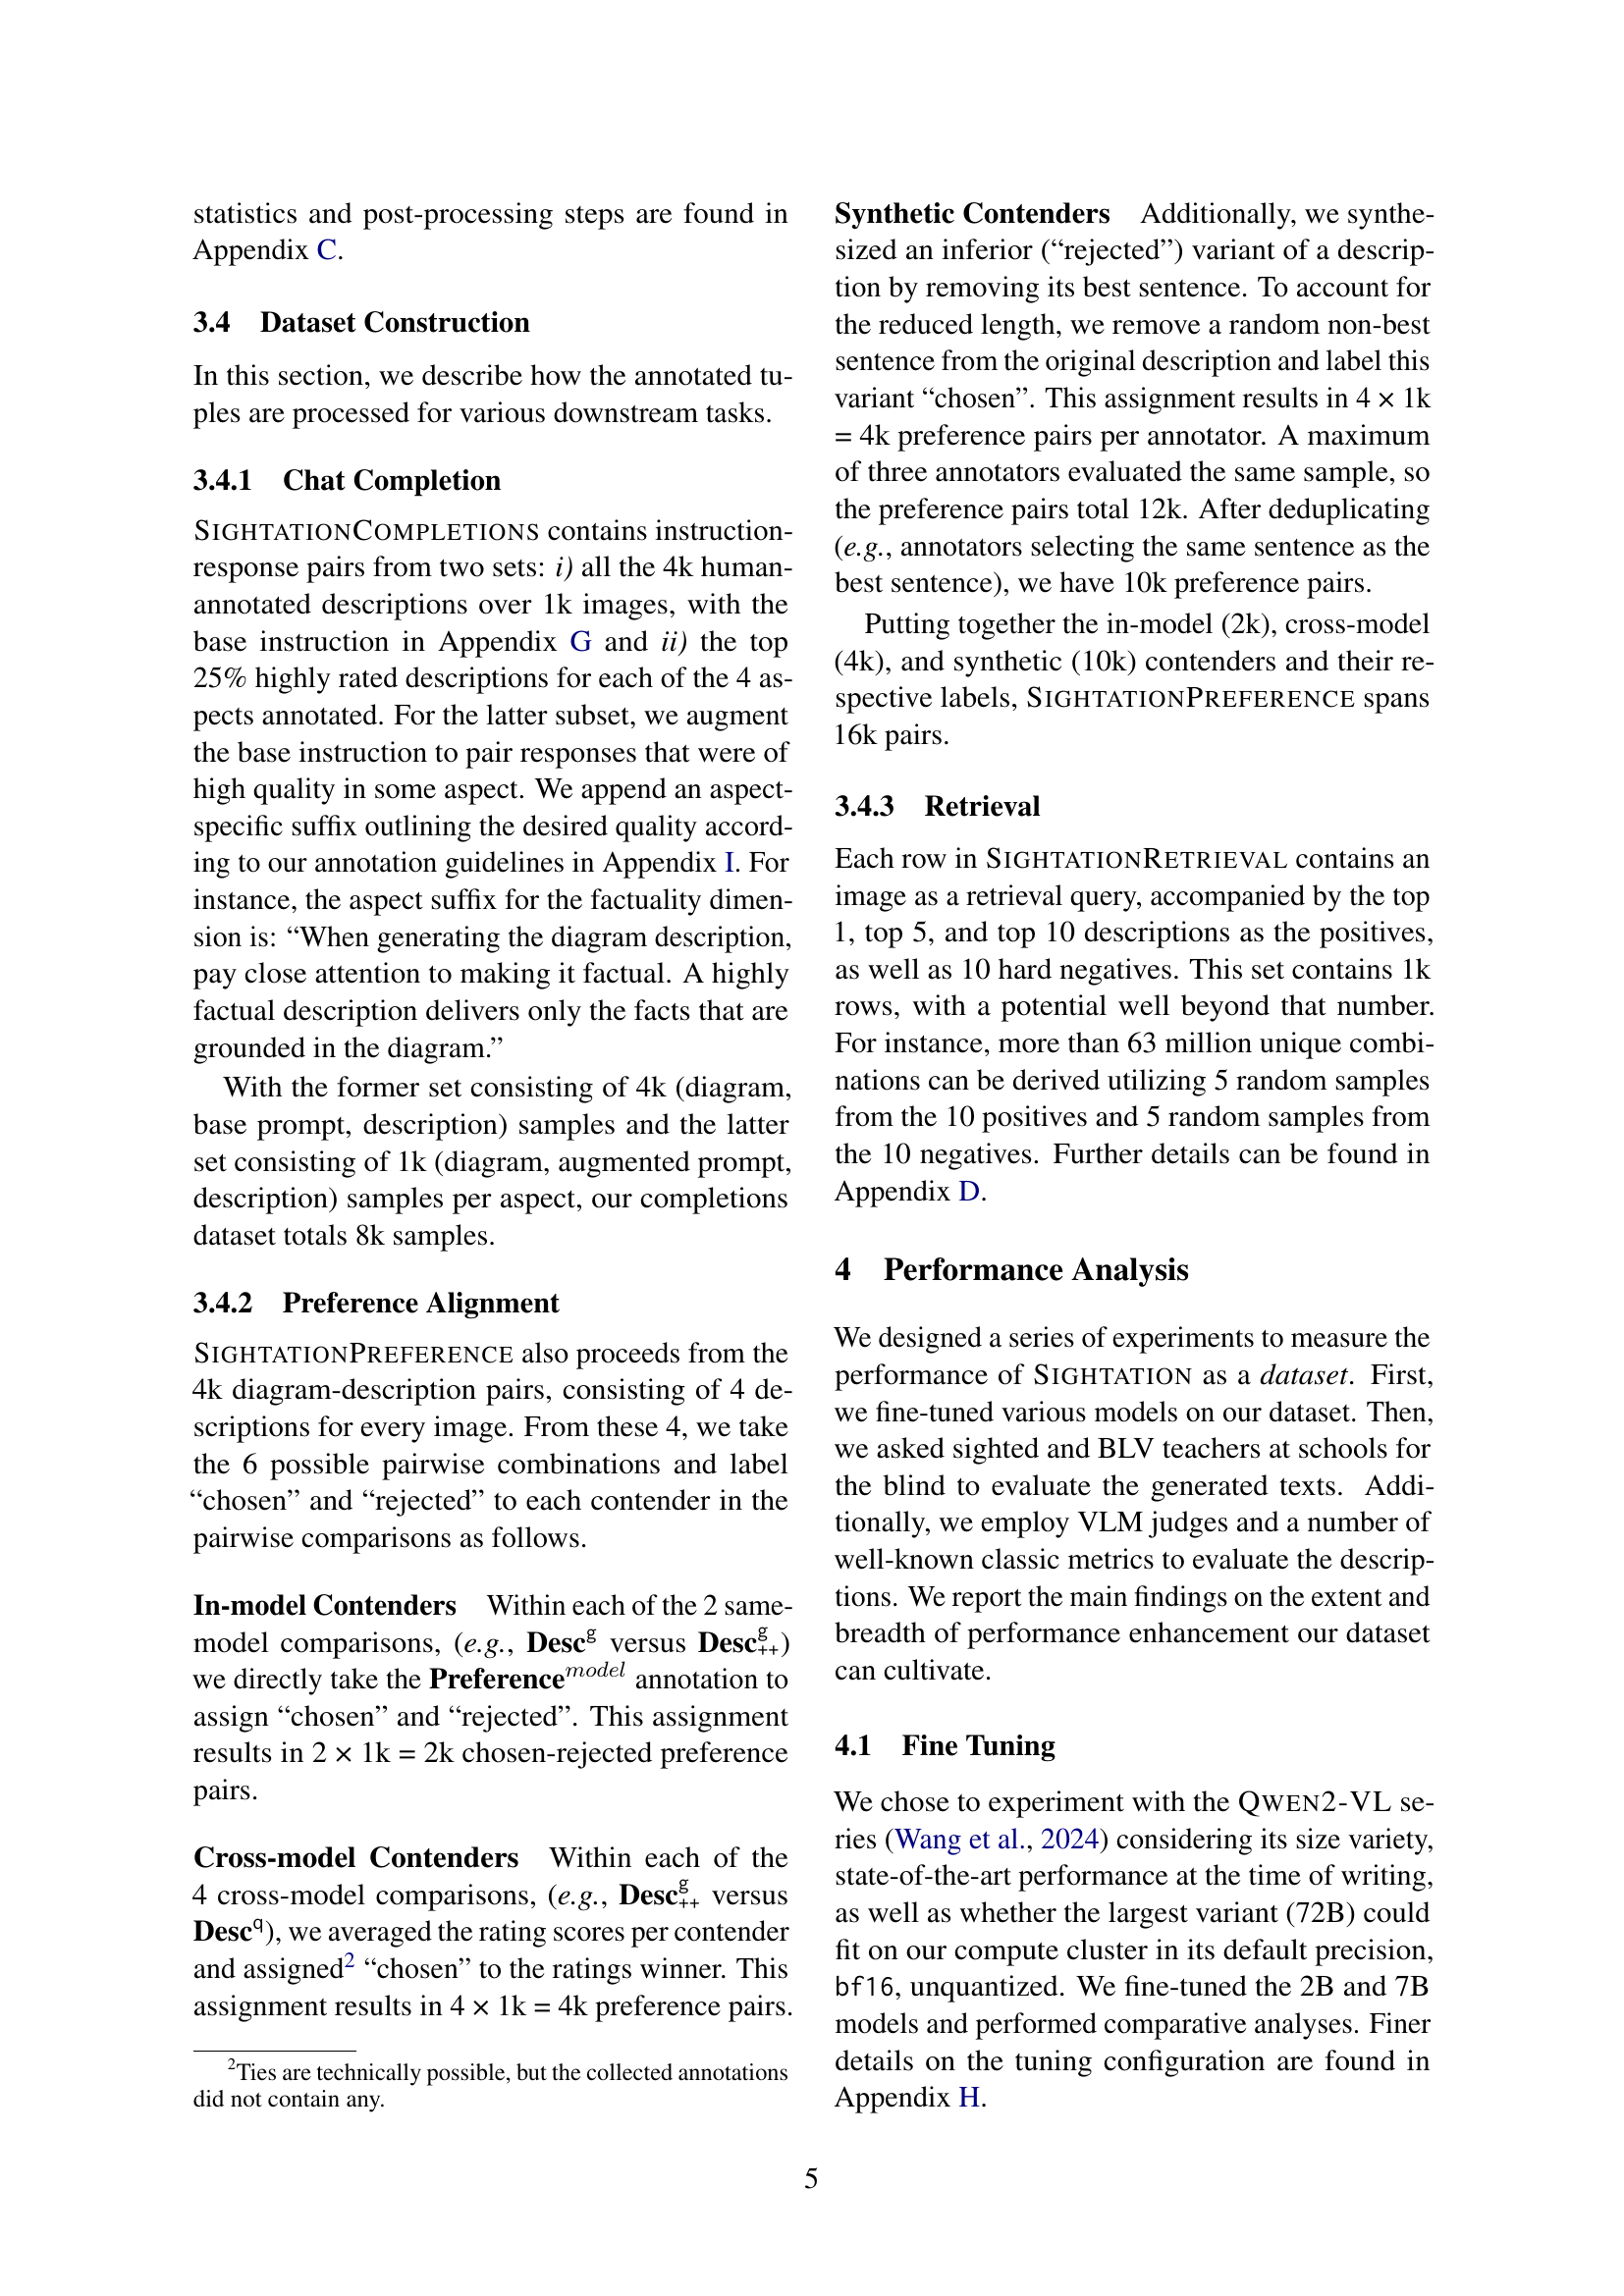
🔼 The radar chart visualizes the effect size of fine-tuning and guided generation on diagram descriptions generated by various vision-language models (VLMs). The evaluation is based on assessments by blind and low-vision (BLV) educators across several dimensions: succinctness, diversity, usefulness in different question formats (summary, multiple-choice, open-ended), and interpretability (Nature). The 2B model shows the most significant improvement. More detailed results are available in the supplementary material.
read the caption
Figure 3: Tuning VLMs on Sightation enhanced various qualities of the diagram descriptions, evaluated by BLV educators, and shown here as normalized ratings averaged in each aspect. The capability of the dataset is most strongly pronounced with the 2B variant, shown above. Full results across 4 models and 22 metrics are reported in Tables E.1, E.1, 11, and 12.

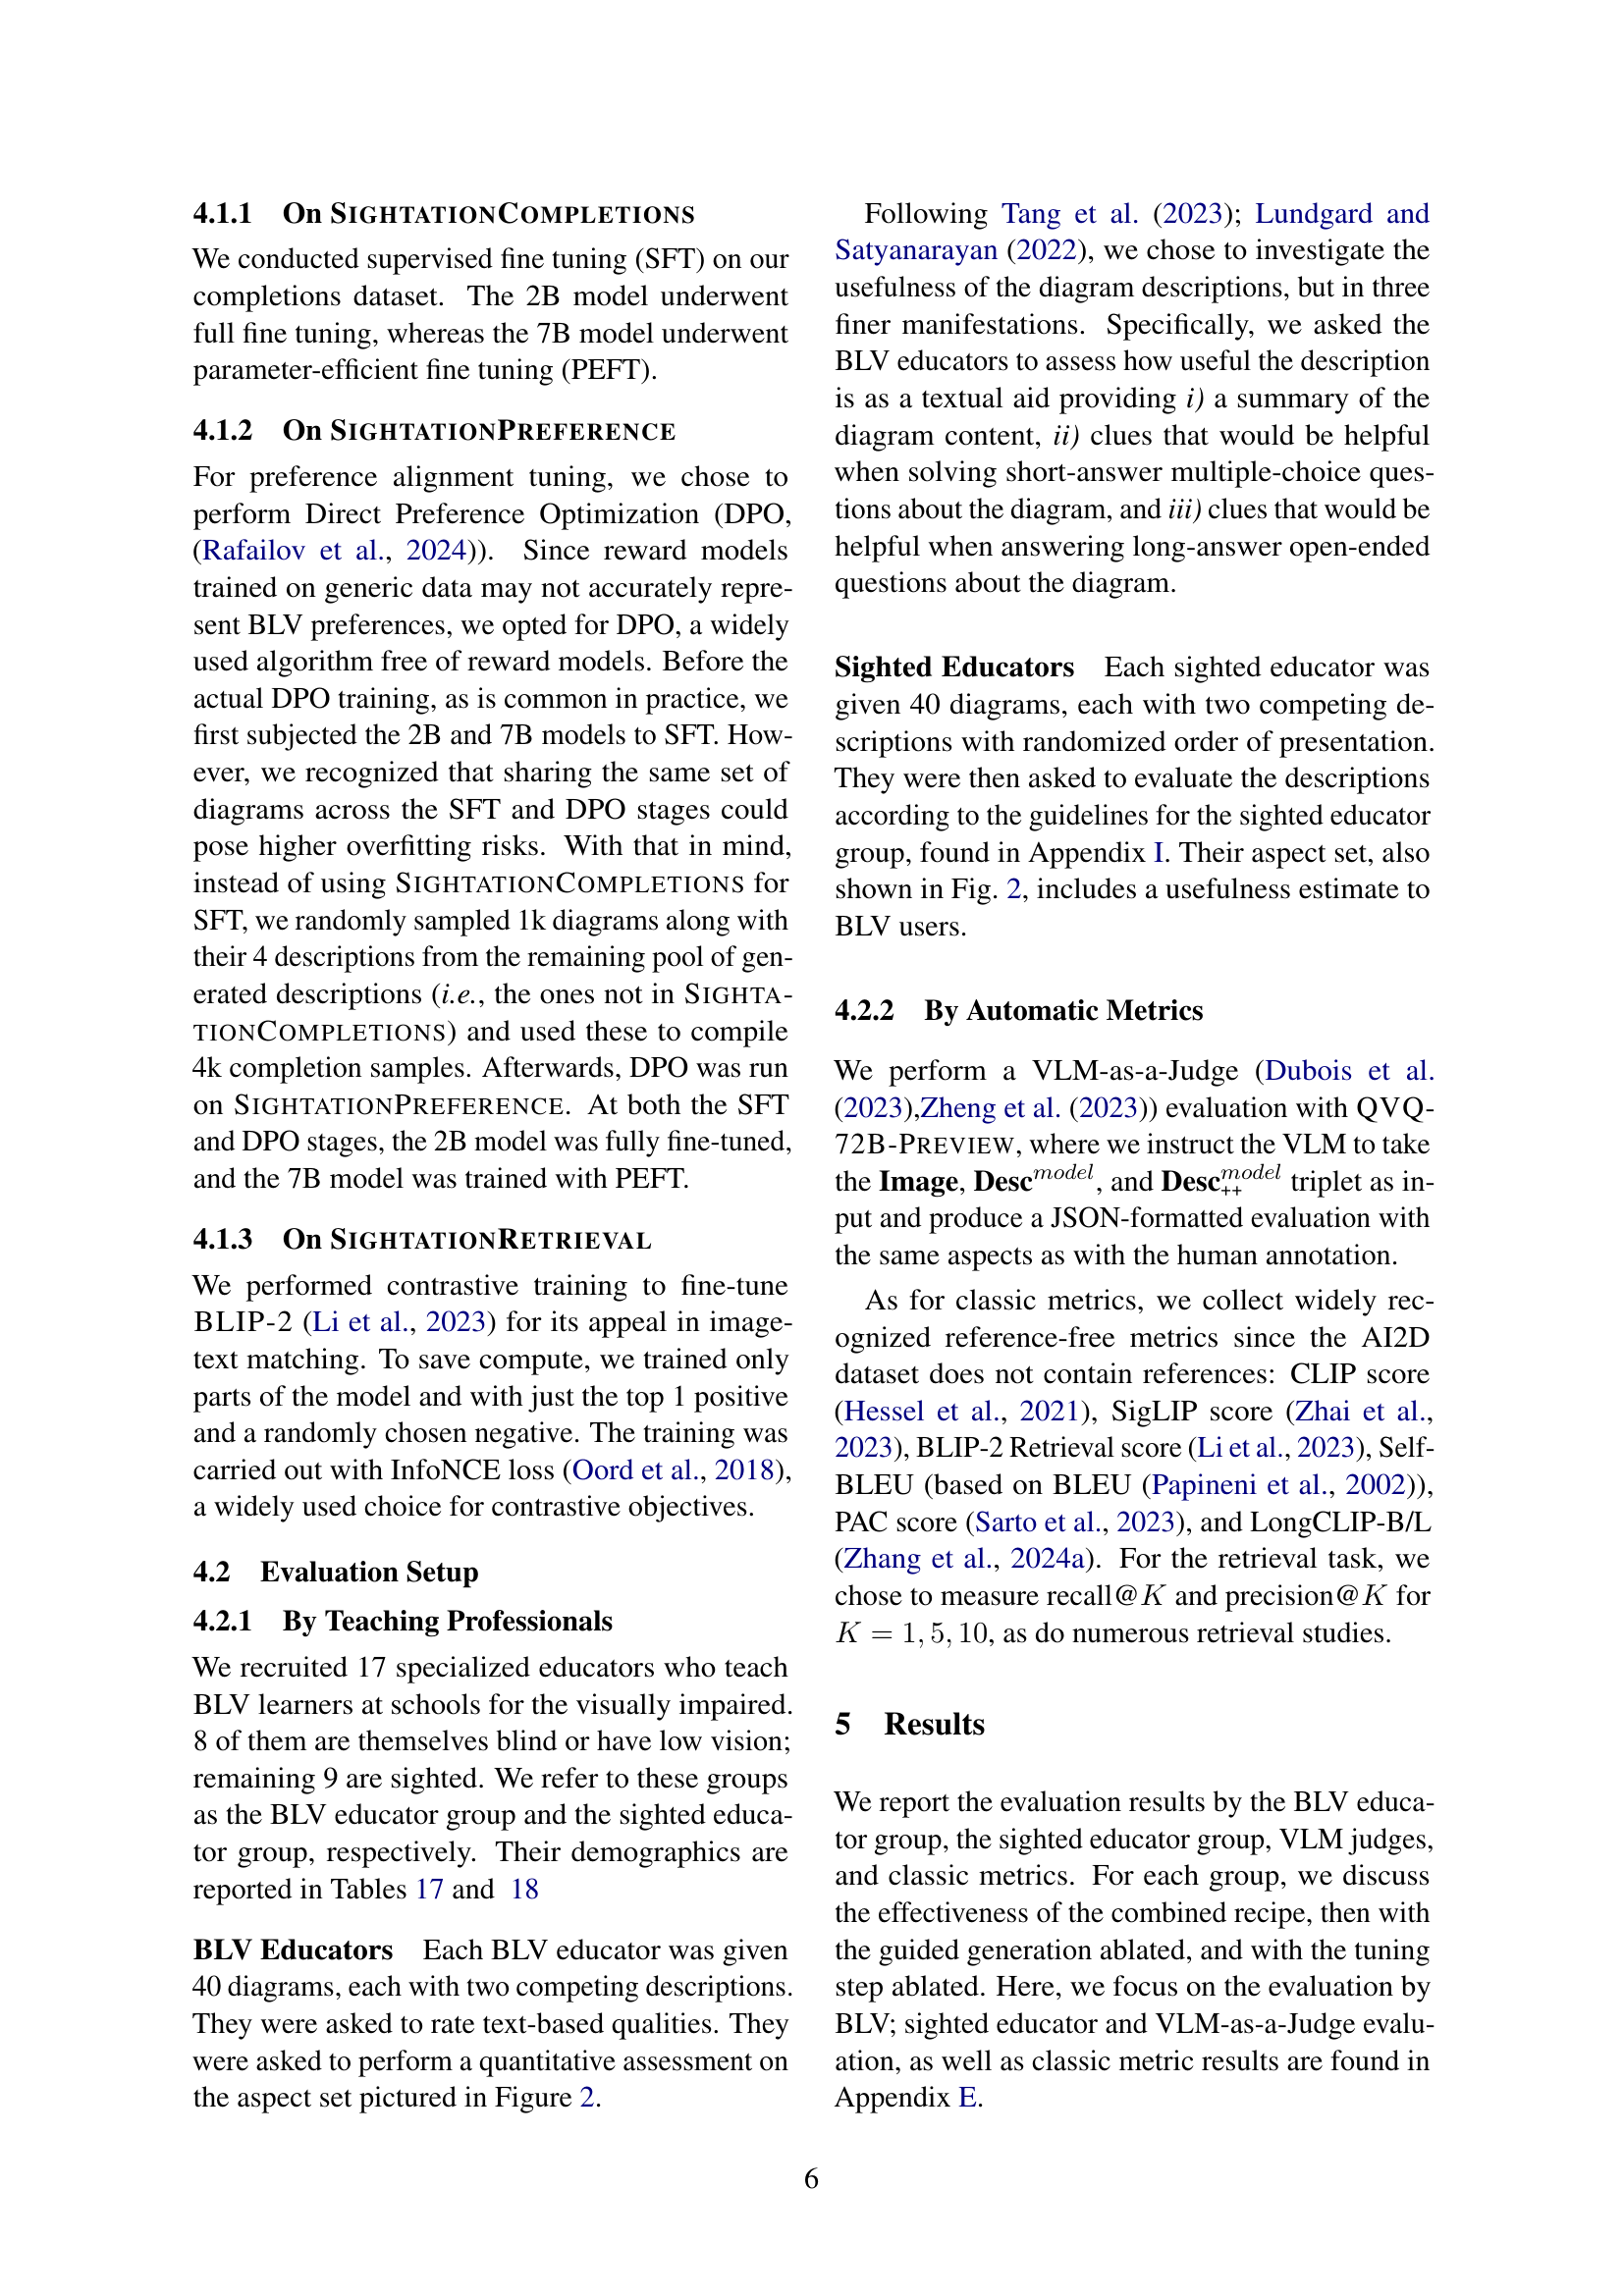
🔼 This table presents the effect size of using a combined approach (fine-tuning and guided generation) on various aspects of diagram descriptions, as assessed by blind and low-vision (BLV) users. Effect size is measured using Cohen’s d, indicating the standardized difference in means between the experimental condition (combined approach) and a baseline. Higher values of Cohen’s d represent a larger impact of the combined approach on that specific aspect.
read the caption
Table 2: Combined recipe effect size on each aspect, measured with BLV assessment.

🔼 This table presents the effect size of fine-tuning various models on the SIGHTATION dataset, specifically focusing on how well the generated descriptions meet the needs and preferences of blind and low-vision (BLV) users. Effect size is measured using Cohen’s d, which quantifies the difference in mean ratings between fine-tuned and baseline models, normalized by the pooled standard deviation. Each row represents a different aspect of the descriptions that were assessed (e.g., succinctness, diversity, usefulness in different contexts), with separate values for the 2B and 7B models. Larger values indicate stronger effects of fine-tuning.
read the caption
Table 3: Fine tuning effect size on each aspect, measured with BLV assessment.

🔼 This table presents the effect size of applying guided generation to the model’s outputs, specifically focusing on how well the resulting descriptions align with the preferences of blind and low-vision (BLV) users. The effect size is measured for each assessment aspect: succinctness, diversity, usefulness (as summary, multiple-choice questions, and open-ended questions), and the overall nature (how interpretive vs. factual). Larger effect sizes indicate that guided generation has a more substantial impact on that particular aspect. The table separately shows results for the 2B and 7B models, indicating any differences in the model’s response to the treatment.
read the caption
Table 4: Guided generation effect size on each aspect, measured with BLV assessment.

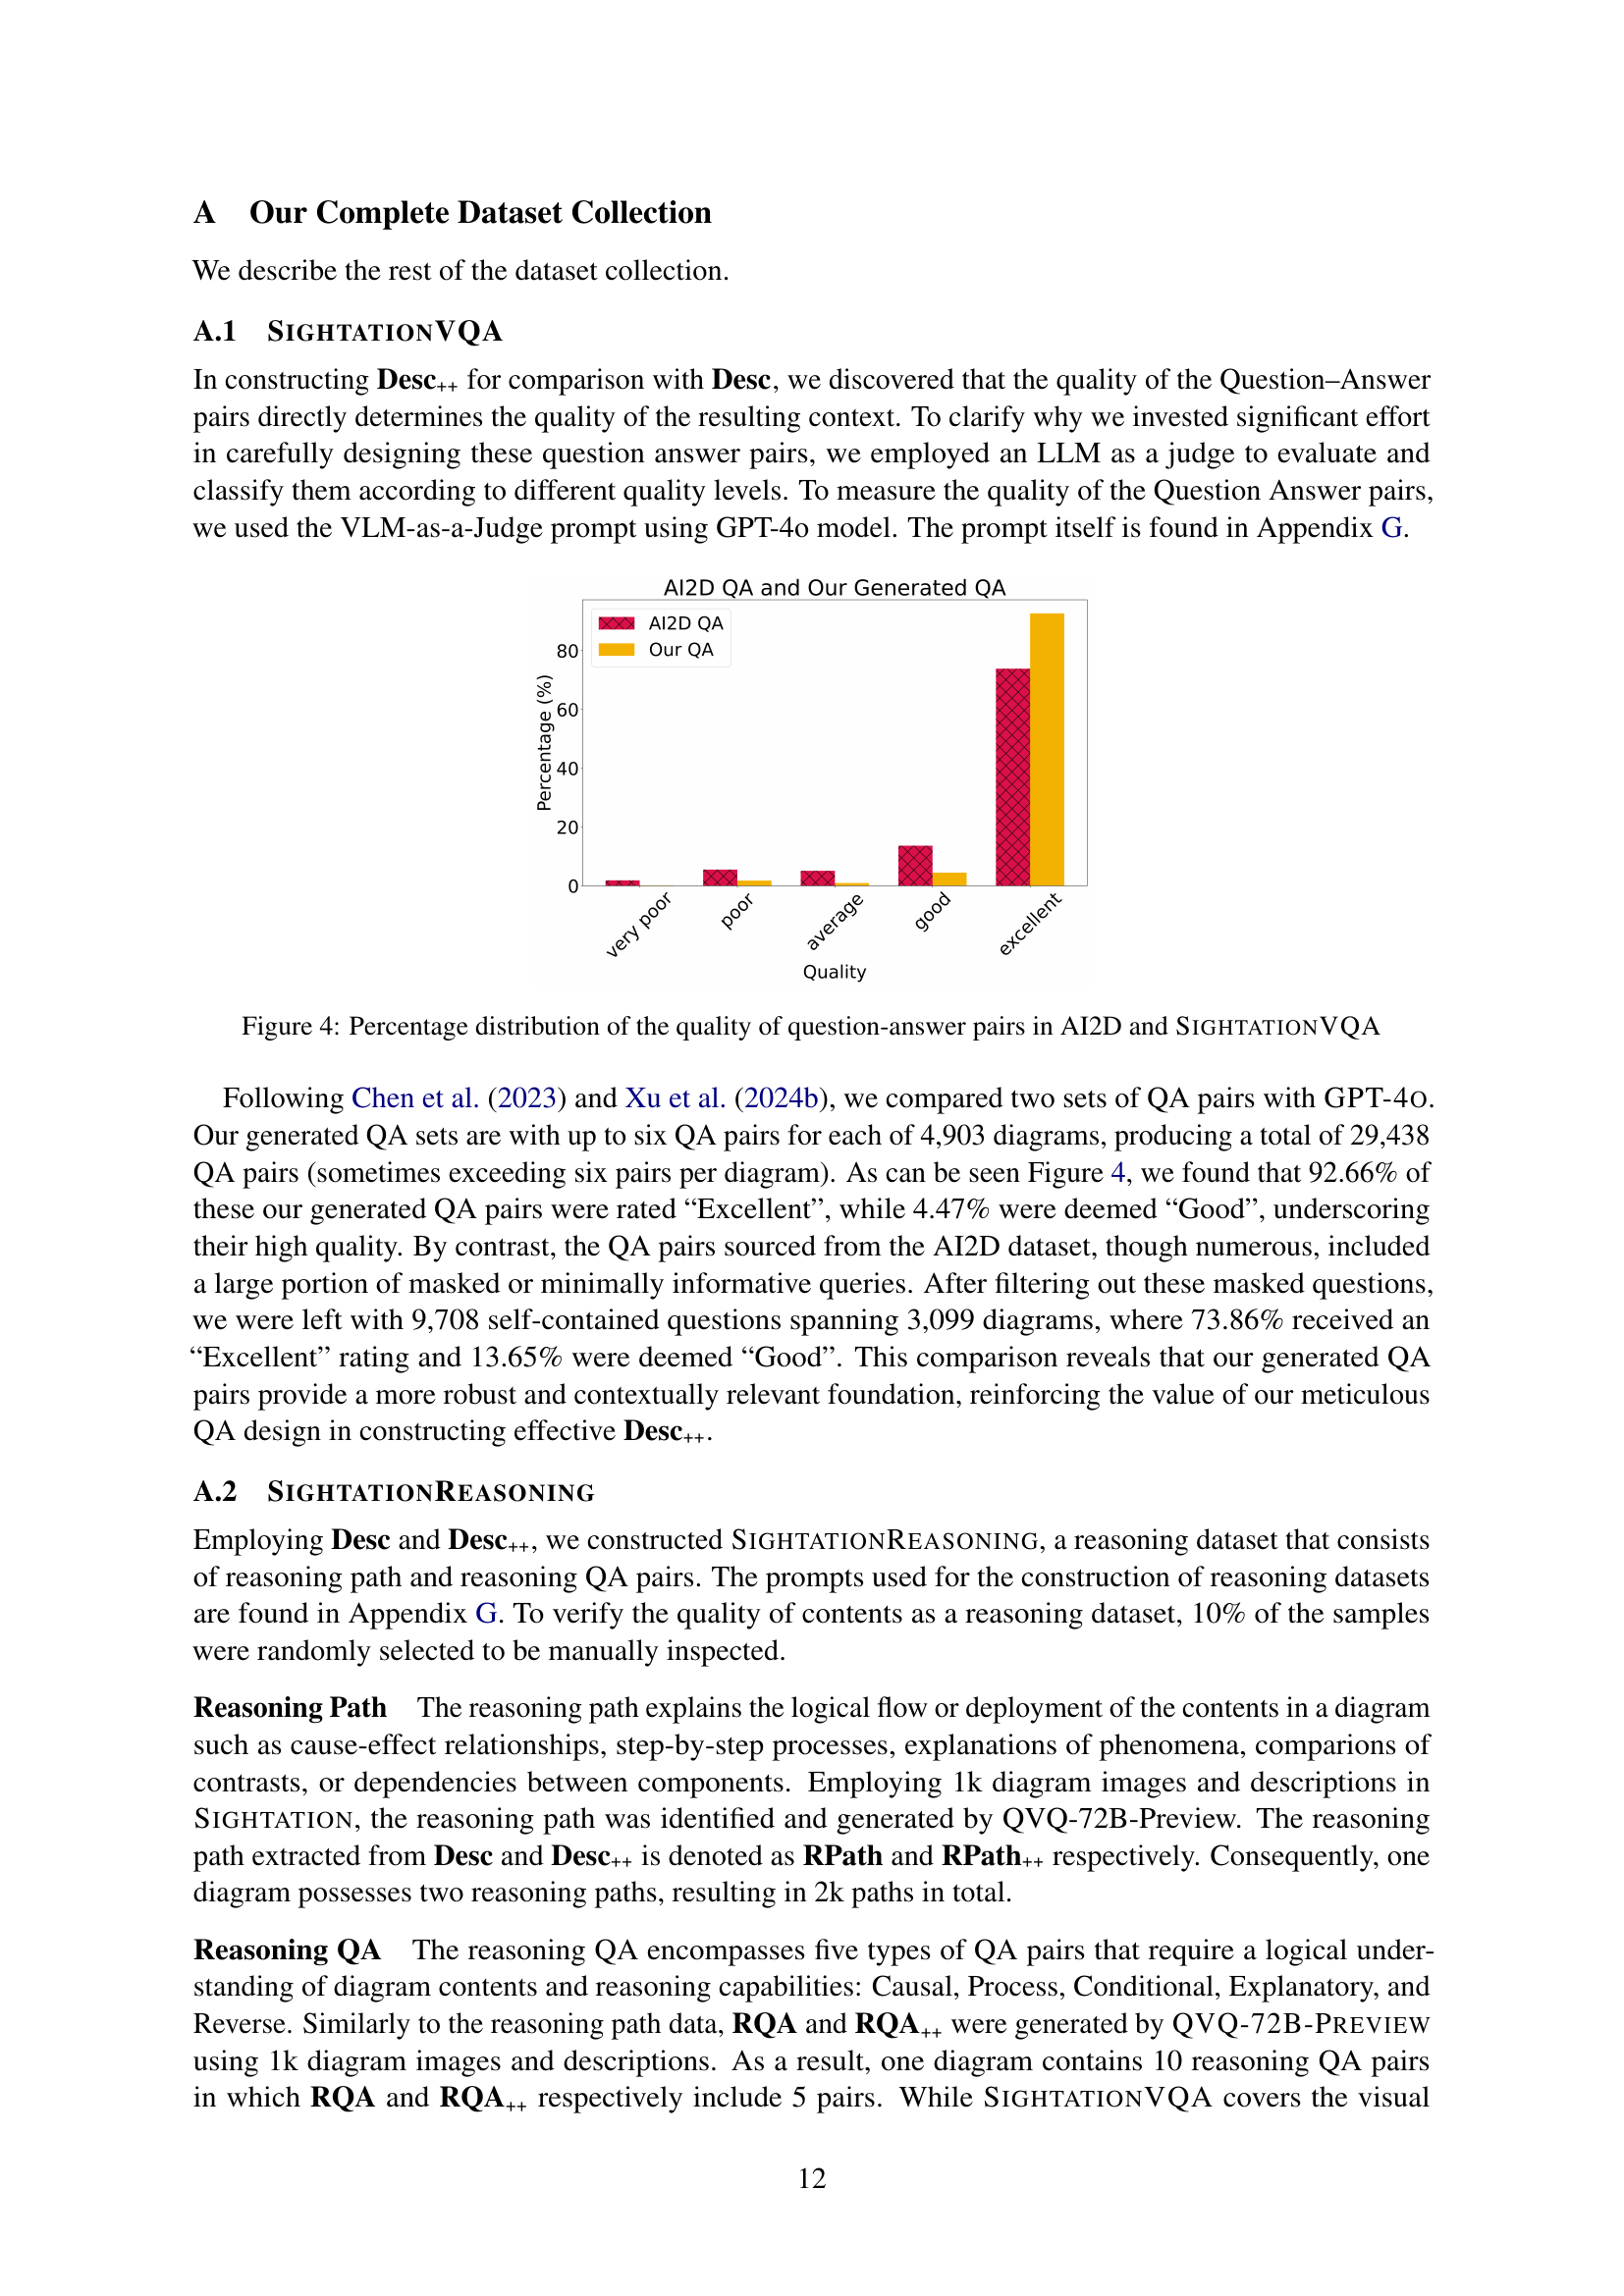
🔼 This bar chart compares the quality distribution of question-answer pairs from the AI2D dataset and the SIGHTATIONVQA dataset. The x-axis represents quality levels, ranging from ‘very poor’ to ’excellent.’ The y-axis shows the percentage of question-answer pairs falling into each quality level. The chart visually demonstrates that SIGHTATIONVQA has a significantly higher percentage of question-answer pairs rated as ’excellent’ compared to AI2D.
read the caption
Figure 4: Percentage distribution of the quality of question-answer pairs in AI2D and SightationVQA

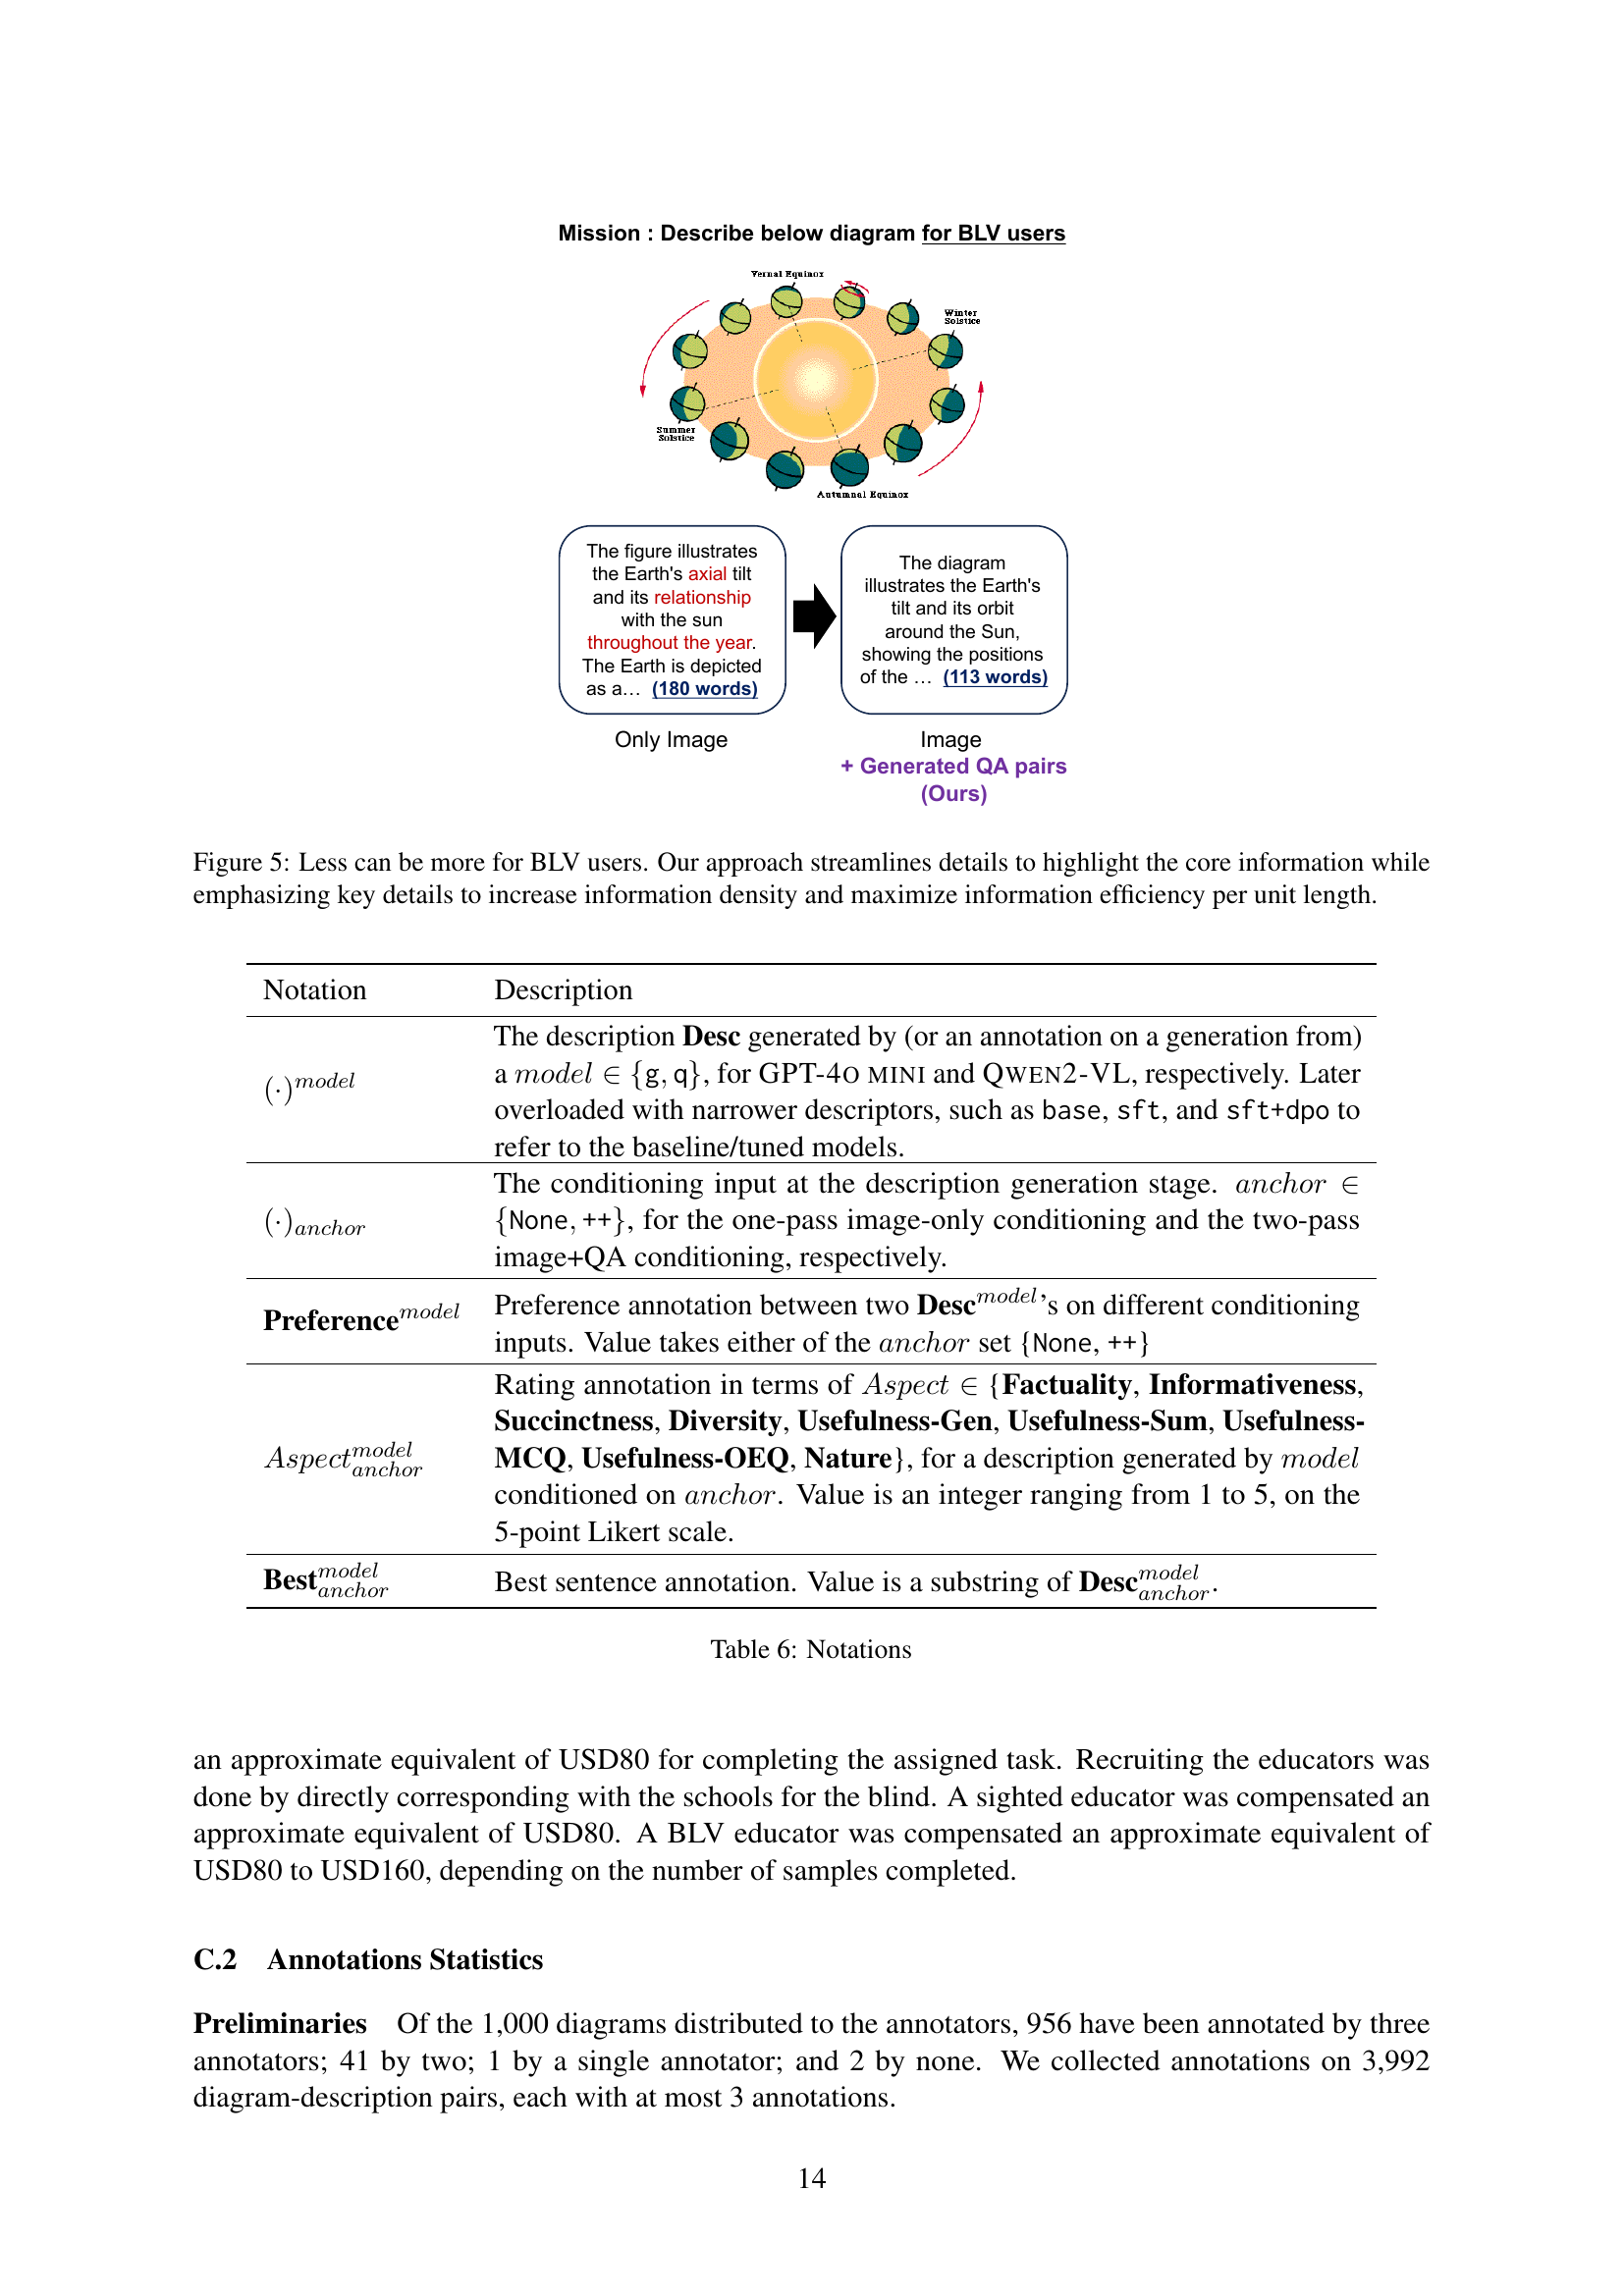
🔼 This figure demonstrates how streamlining diagram descriptions for blind and low-vision (BLV) users can improve information density and efficiency. The example shows two descriptions of the same diagram. The first is a longer, more detailed description, typical of those generated by sighted individuals. The second is a shorter, more concise description designed specifically for BLV users, highlighting only the core information and key details.
read the caption
Figure 5: Less can be more for BLV users. Our approach streamlines details to highlight the core information while emphasizing key details to increase information density and maximize information efficiency per unit length.
More on tables
| Combined Effect Size | ||
| Aspect | 2B | 7B |
| Succinct | -0.09 | 1.69 |
| Diverse | 0.90 | 0.46 |
| Useful-Sum | 0.39 | 0.53 |
| Useful-MCQ | -0.18 | 0.20 |
| Useful-OEQ | 0.76 | 0.00 |
| Average | 0.36 | 0.58 |
| Nature | 1.08 | -2.38 |
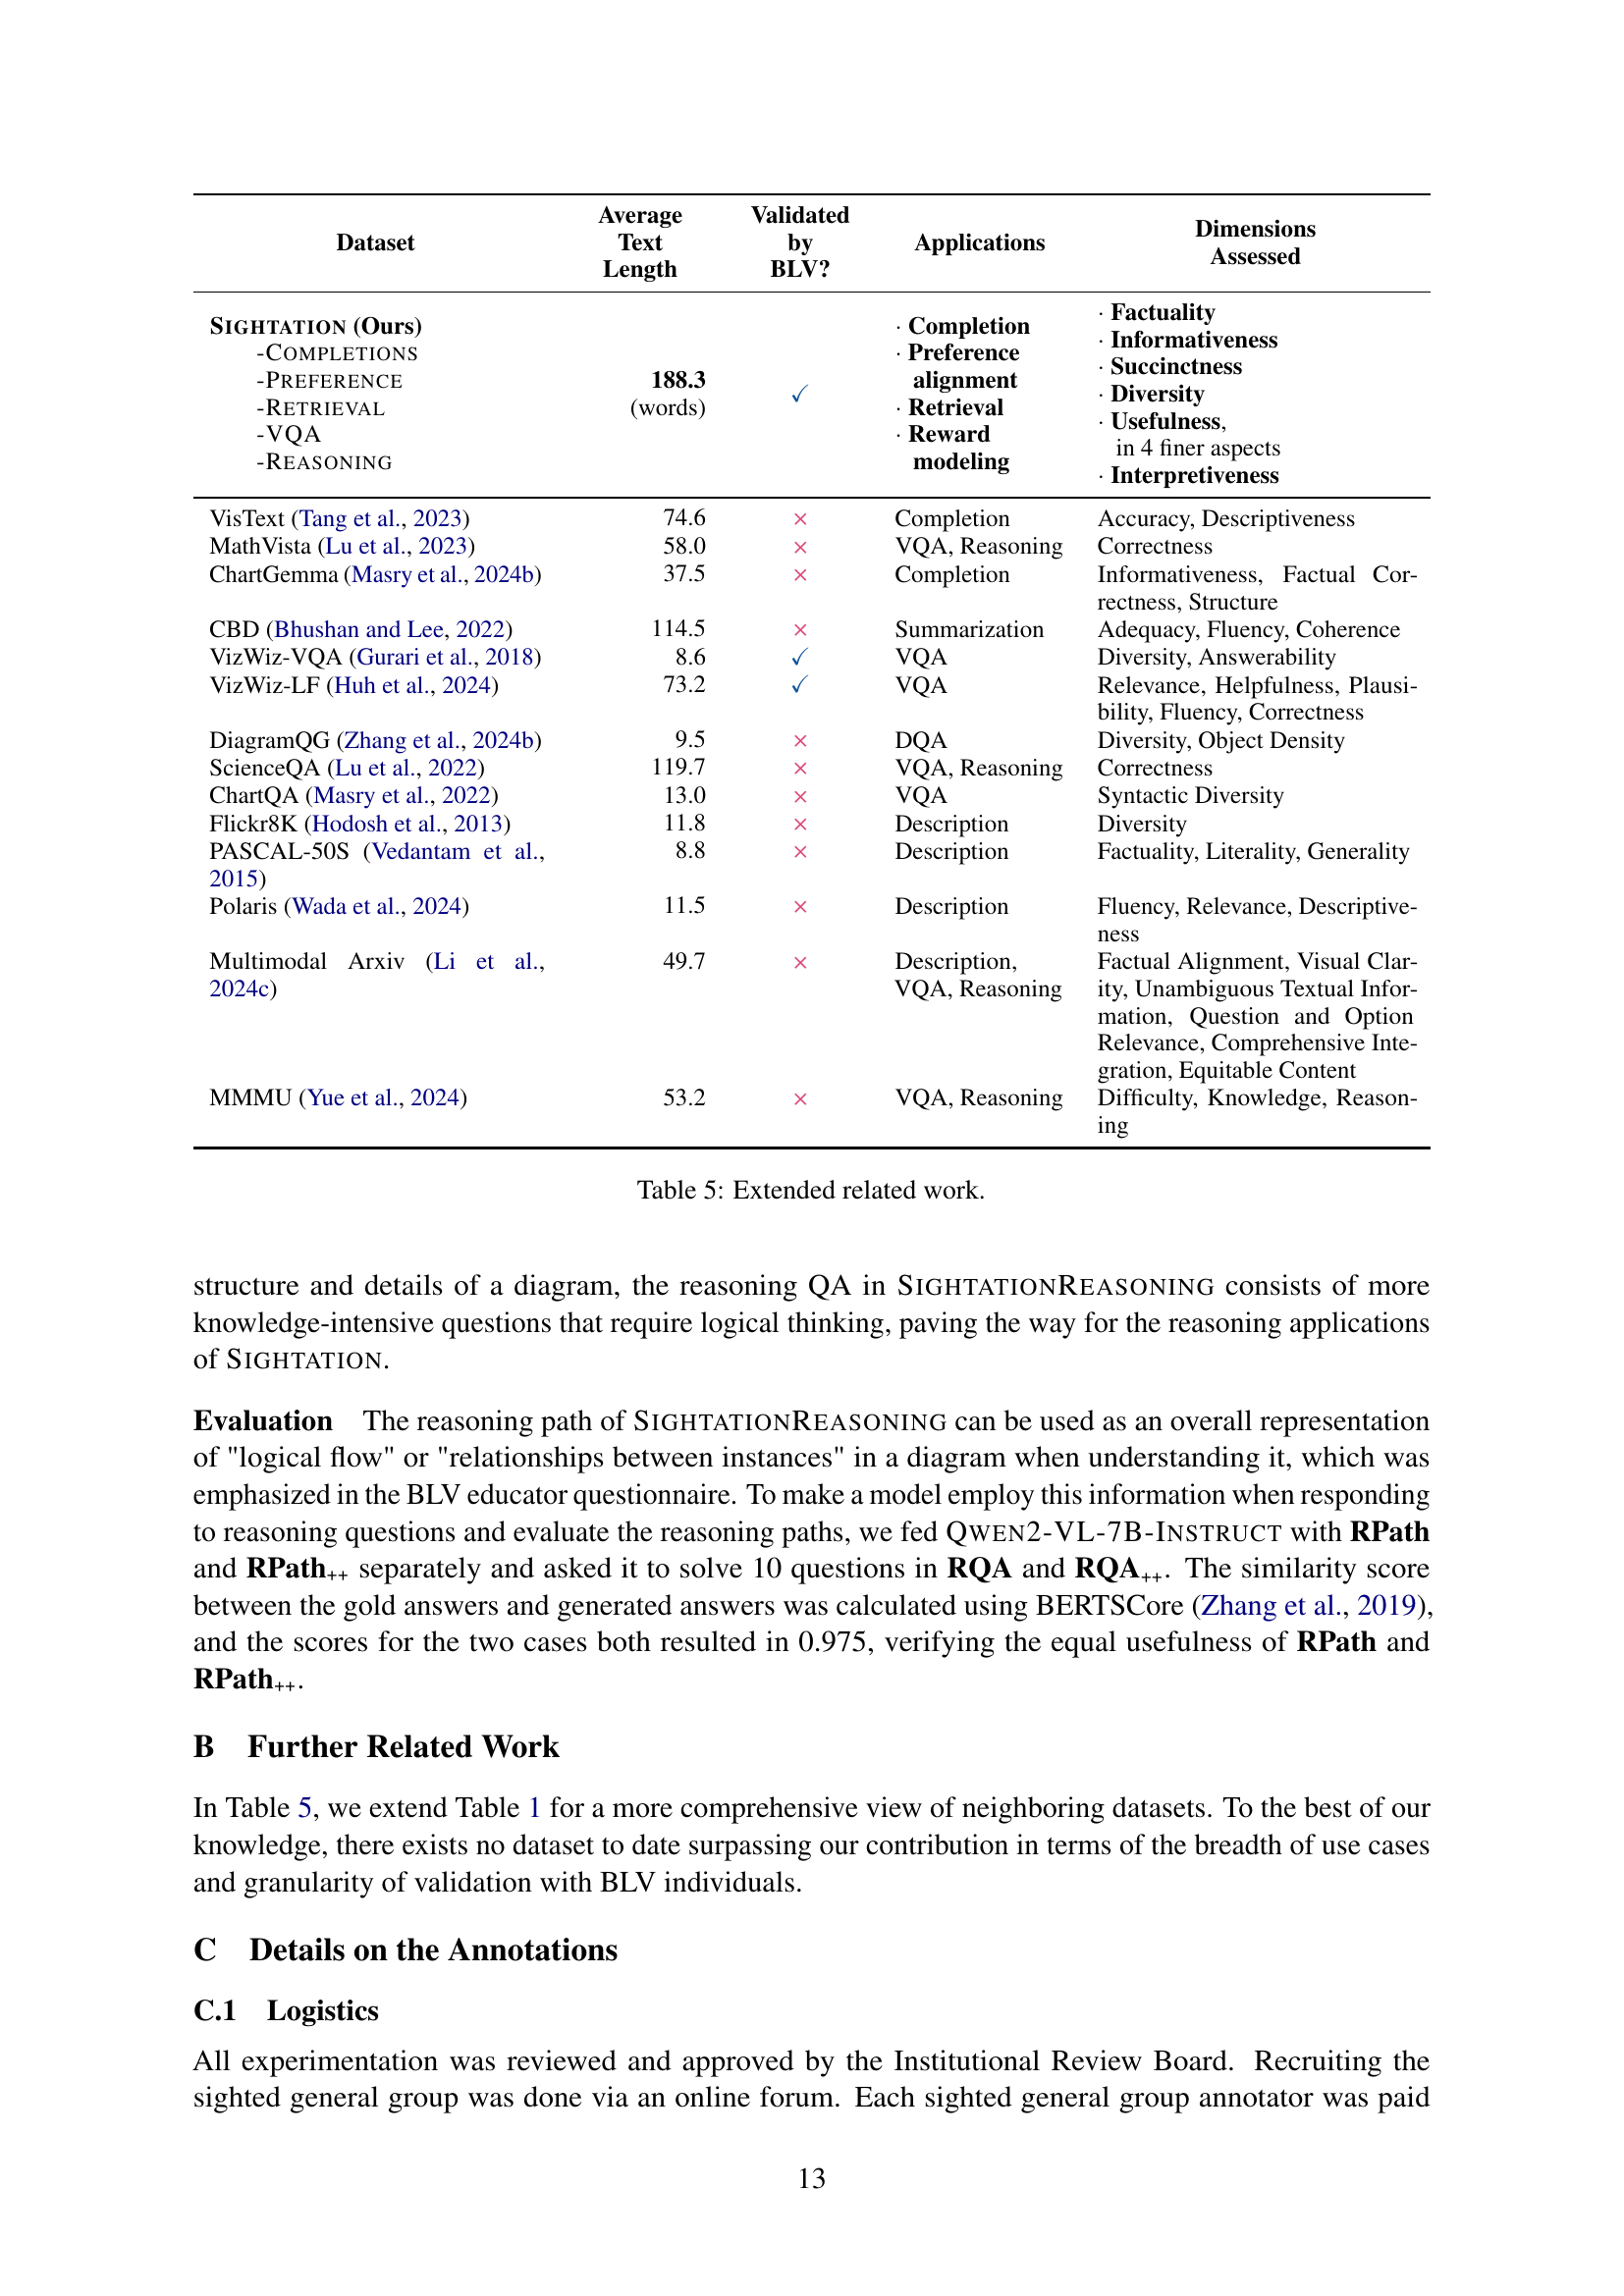
🔼 This table provides an extended comparison of related datasets focusing on diagram descriptions. It compares various aspects such as average text length, whether the dataset was validated by blind or low-vision (BLV) users, the applications each dataset supports (e.g., completion, VQA, reasoning), and the dimensions assessed (e.g., factuality, informativeness, diversity). This allows for a comprehensive understanding of how SIGHTATION compares to other existing datasets in terms of scale, BLV-alignment, and task diversity.
read the caption
Table 5: Extended related work.
| Tuning Effect Size | ||||
| Aspect | 2B | 2B+GG | 7B | 7B+GG |
| Succinct | 0.06 | 0.08 | 0.37 | -0.11 |
| Diverse | 0.87 | 1.08 | -0.06 | 0.00 |
| Useful-Sum | 0.20 | 0.55 | 0.14 | 0.36 |
| Useful-MCQ | 0.29 | 0.00 | -0.54 | 0.00 |
| Useful-OEQ | 1.01 | 0.90 | -0.74 | -0.19 |
| Average | 0.49 | 0.52 | -0.17 | 0.01 |
| Nature | 1.49 | 1.06 | -3.14 | -0.31 |
🔼 This table lists notations used in the paper to represent different components of the dataset and annotation process. It defines the meaning of abbreviations such as (.)model, (.)anchor, Preferencemodel, Aspectmodel, and Bestmodel, clarifying what each represents regarding descriptions generated by different models, conditioning inputs for generation, preference annotations, quality ratings for various aspects, and the selection of best sentences.
read the caption
Table 6: Notations
| Guided Generation Effect Size | |||
| Aspect | GPT | 2B Base | 2B DPO |
| Succinct | 0.18 | -0.17 | 0.17 |
| Diverse | -0.13 | -0.13 | 0.47 |
| Useful-Sum | 0.48 | -0.17 | 0.57 |
| Useful-MCQ | 0.13 | -0.20 | 0.92 |
| Useful-OEQ | 0.76 | -0.07 | 0.77 |
| Average | 0.28 | -0.15 | 0.58 |
| Nature | 0.33 | 0.08 | 3.17 |
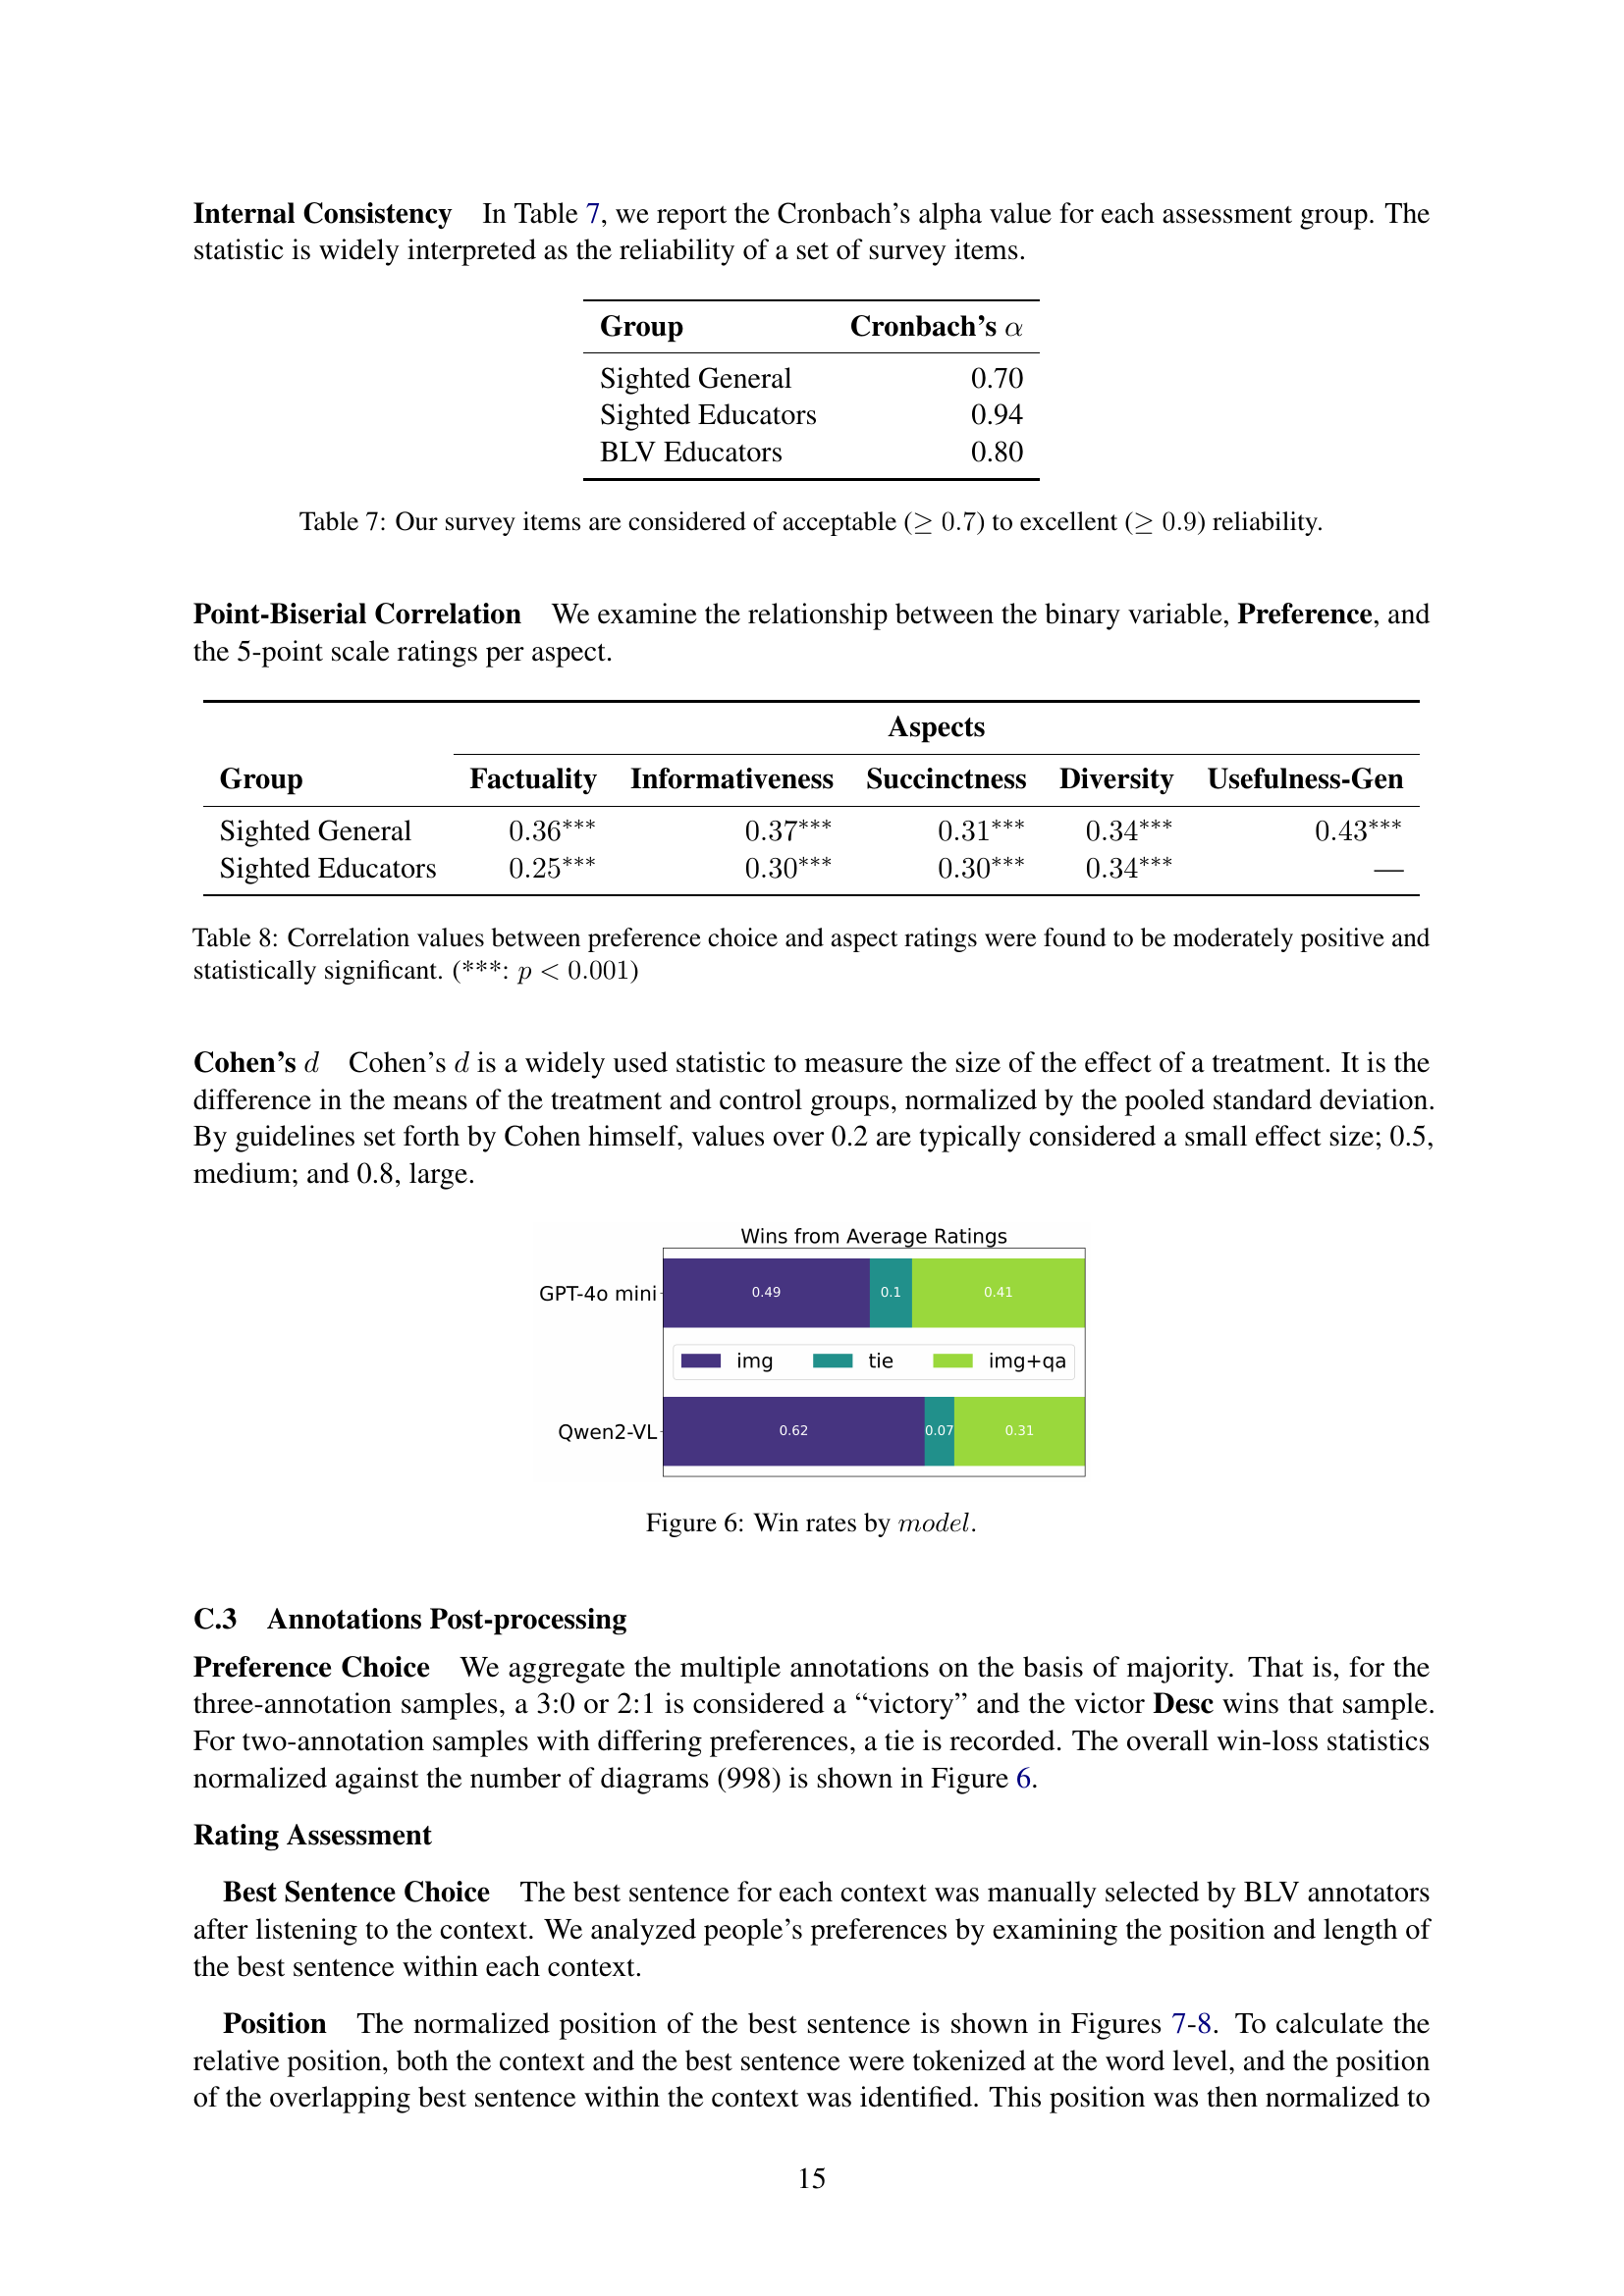
🔼 This table presents the Cronbach’s alpha coefficients, a measure of internal consistency reliability, for three groups of annotators: sighted general, sighted educators, and blind and low-vision (BLV) educators. The values indicate the extent to which the items within each assessment are measuring the same underlying construct. Higher values represent greater reliability, with scores above 0.7 generally considered acceptable and scores above 0.9 considered excellent.
read the caption
Table 7: Our survey items are considered of acceptable (≥0.7absent0.7\geq 0.7≥ 0.7) to excellent (≥0.9absent0.9\geq 0.9≥ 0.9) reliability.
| Dataset | Average Text Length | Validated by BLV? | Applications | Dimensions Assessed |
| Sightation (Ours) -Completions -Preference -Retrieval -VQA -Reasoning | 188.3 (words) | ✓ | Completion Preference alignment Retrieval Reward modeling | Factuality Informativeness Succinctness Diversity Usefulness, in 4 finer aspects Interpretiveness |
| VisText Tang et al. (2023) | 74.6 | × | Completion | Accuracy, Descriptiveness |
| MathVista Lu et al. (2023) | 58.0 | × | VQA, Reasoning | Correctness |
| ChartGemma Masry et al. (2024b) | 37.5 | × | Completion | Informativeness, Factual Cor- rectness, Structure |
| CBD Bhushan and Lee (2022) | 114.5 | × | Summarization | Adequacy, Fluency, Coherence |
| VizWiz-VQA Gurari et al. (2018) | 8.6 | ✓ | VQA | Diversity, Answerability |
| VizWiz-LF Huh et al. (2024) | 73.2 | ✓ | VQA | Relevance, Helpfulness, Plausi- bility, Fluency, Correctness |
| DiagramQG Zhang et al. (2024b) | 9.5 | × | DQA | Diversity, Object Density |
| ScienceQA Lu et al. (2022) | 119.7 | × | VQA, Reasoning | Correctness |
| ChartQA Masry et al. (2022) | 13.0 | × | VQA | Syntactic Diversity |
| Flickr8K Hodosh et al. (2013) | 11.8 | × | Description | Diversity |
| PASCAL-50S Vedantam et al. (2015) | 8.8 | × | Description | Factuality, Literality, Generality |
| Polaris Wada et al. (2024) | 11.5 | × | Description | Fluency, Relevance, Descriptiveness |
| Multimodal Arxiv Li et al. (2024c) | 49.7 | × | Description, VQA, Reasoning | Factual Alignment, Visual Clarity, Unambiguous Textual Information, Question and Option Relevance, Comprehensive Integration, Equitable Content |
| MMMU Yue et al. (2024) | 53.2 | × | VQA, Reasoning | Difficulty, Knowledge, Reasoning |
🔼 This table presents the correlation analysis between the sighted annotators’ preference choices for diagram descriptions and their ratings on various aspects of those descriptions. The analysis reveals moderately positive and statistically significant correlations (p<0.001) across all aspects, indicating a consistent relationship between preference and the assessed qualities.
read the caption
Table 8: Correlation values between preference choice and aspect ratings were found to be moderately positive and statistically significant. (***: p<0.001𝑝0.001p<0.001italic_p < 0.001)
| Notation | Description |
| \pbox0.7The description Desc generated by (or an annotation on a generation from) a , for GPT-4o mini and Qwen2-VL, respectively. Later overloaded with narrower descriptors, such as base, sft, and sft+dpo to refer to the baseline/tuned models. | |
| \pbox0.7The conditioning input at the description generation stage. , for the one-pass image-only conditioning and the two-pass image+QA conditioning, respectively. | |
| \pbox0.7Preference annotation between two ’s on different conditioning inputs. Value takes either of the set {None, ++} | |
| \pbox0.7Rating annotation in terms of {Factuality, Informativeness, Succinctness, Diversity, Usefulness-Gen, Usefulness-Sum, Usefulness-MCQ, Usefulness-OEQ, Nature}, for a description generated by conditioned on . Value is an integer ranging from 1 to 5, on the 5-point Likert scale. | |
| \pbox0.7Best sentence annotation. Value is a substring of . |
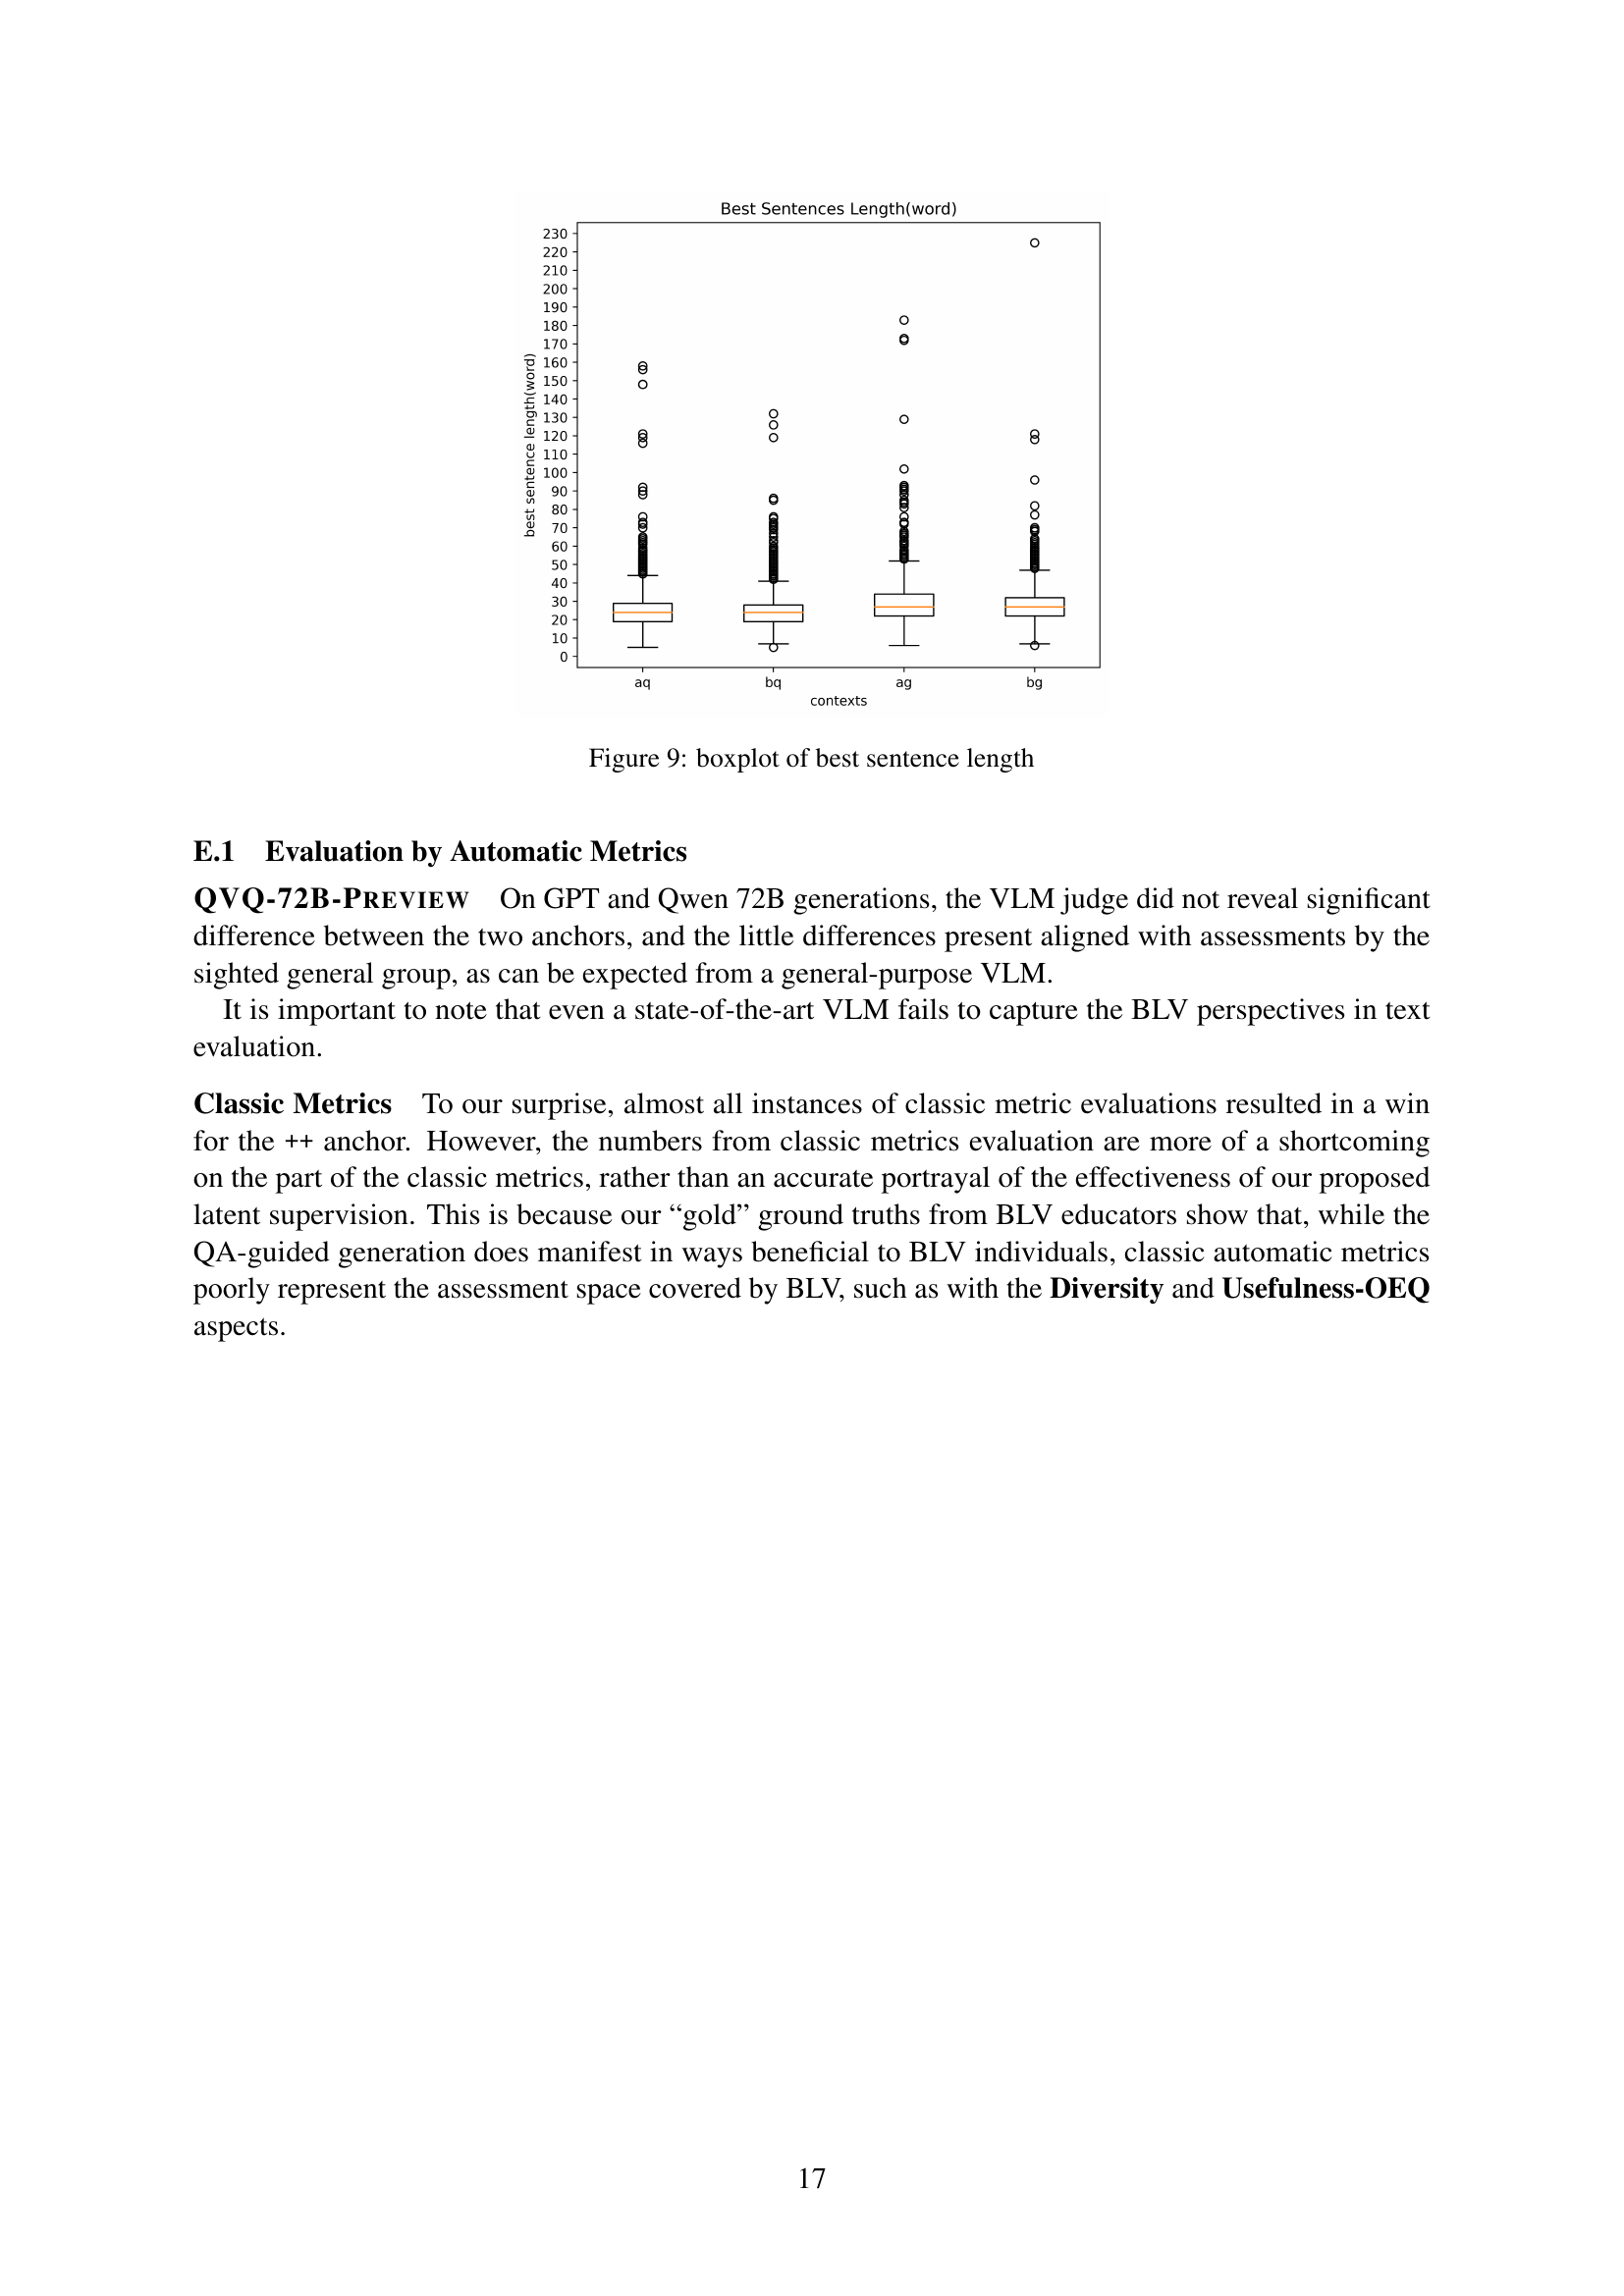
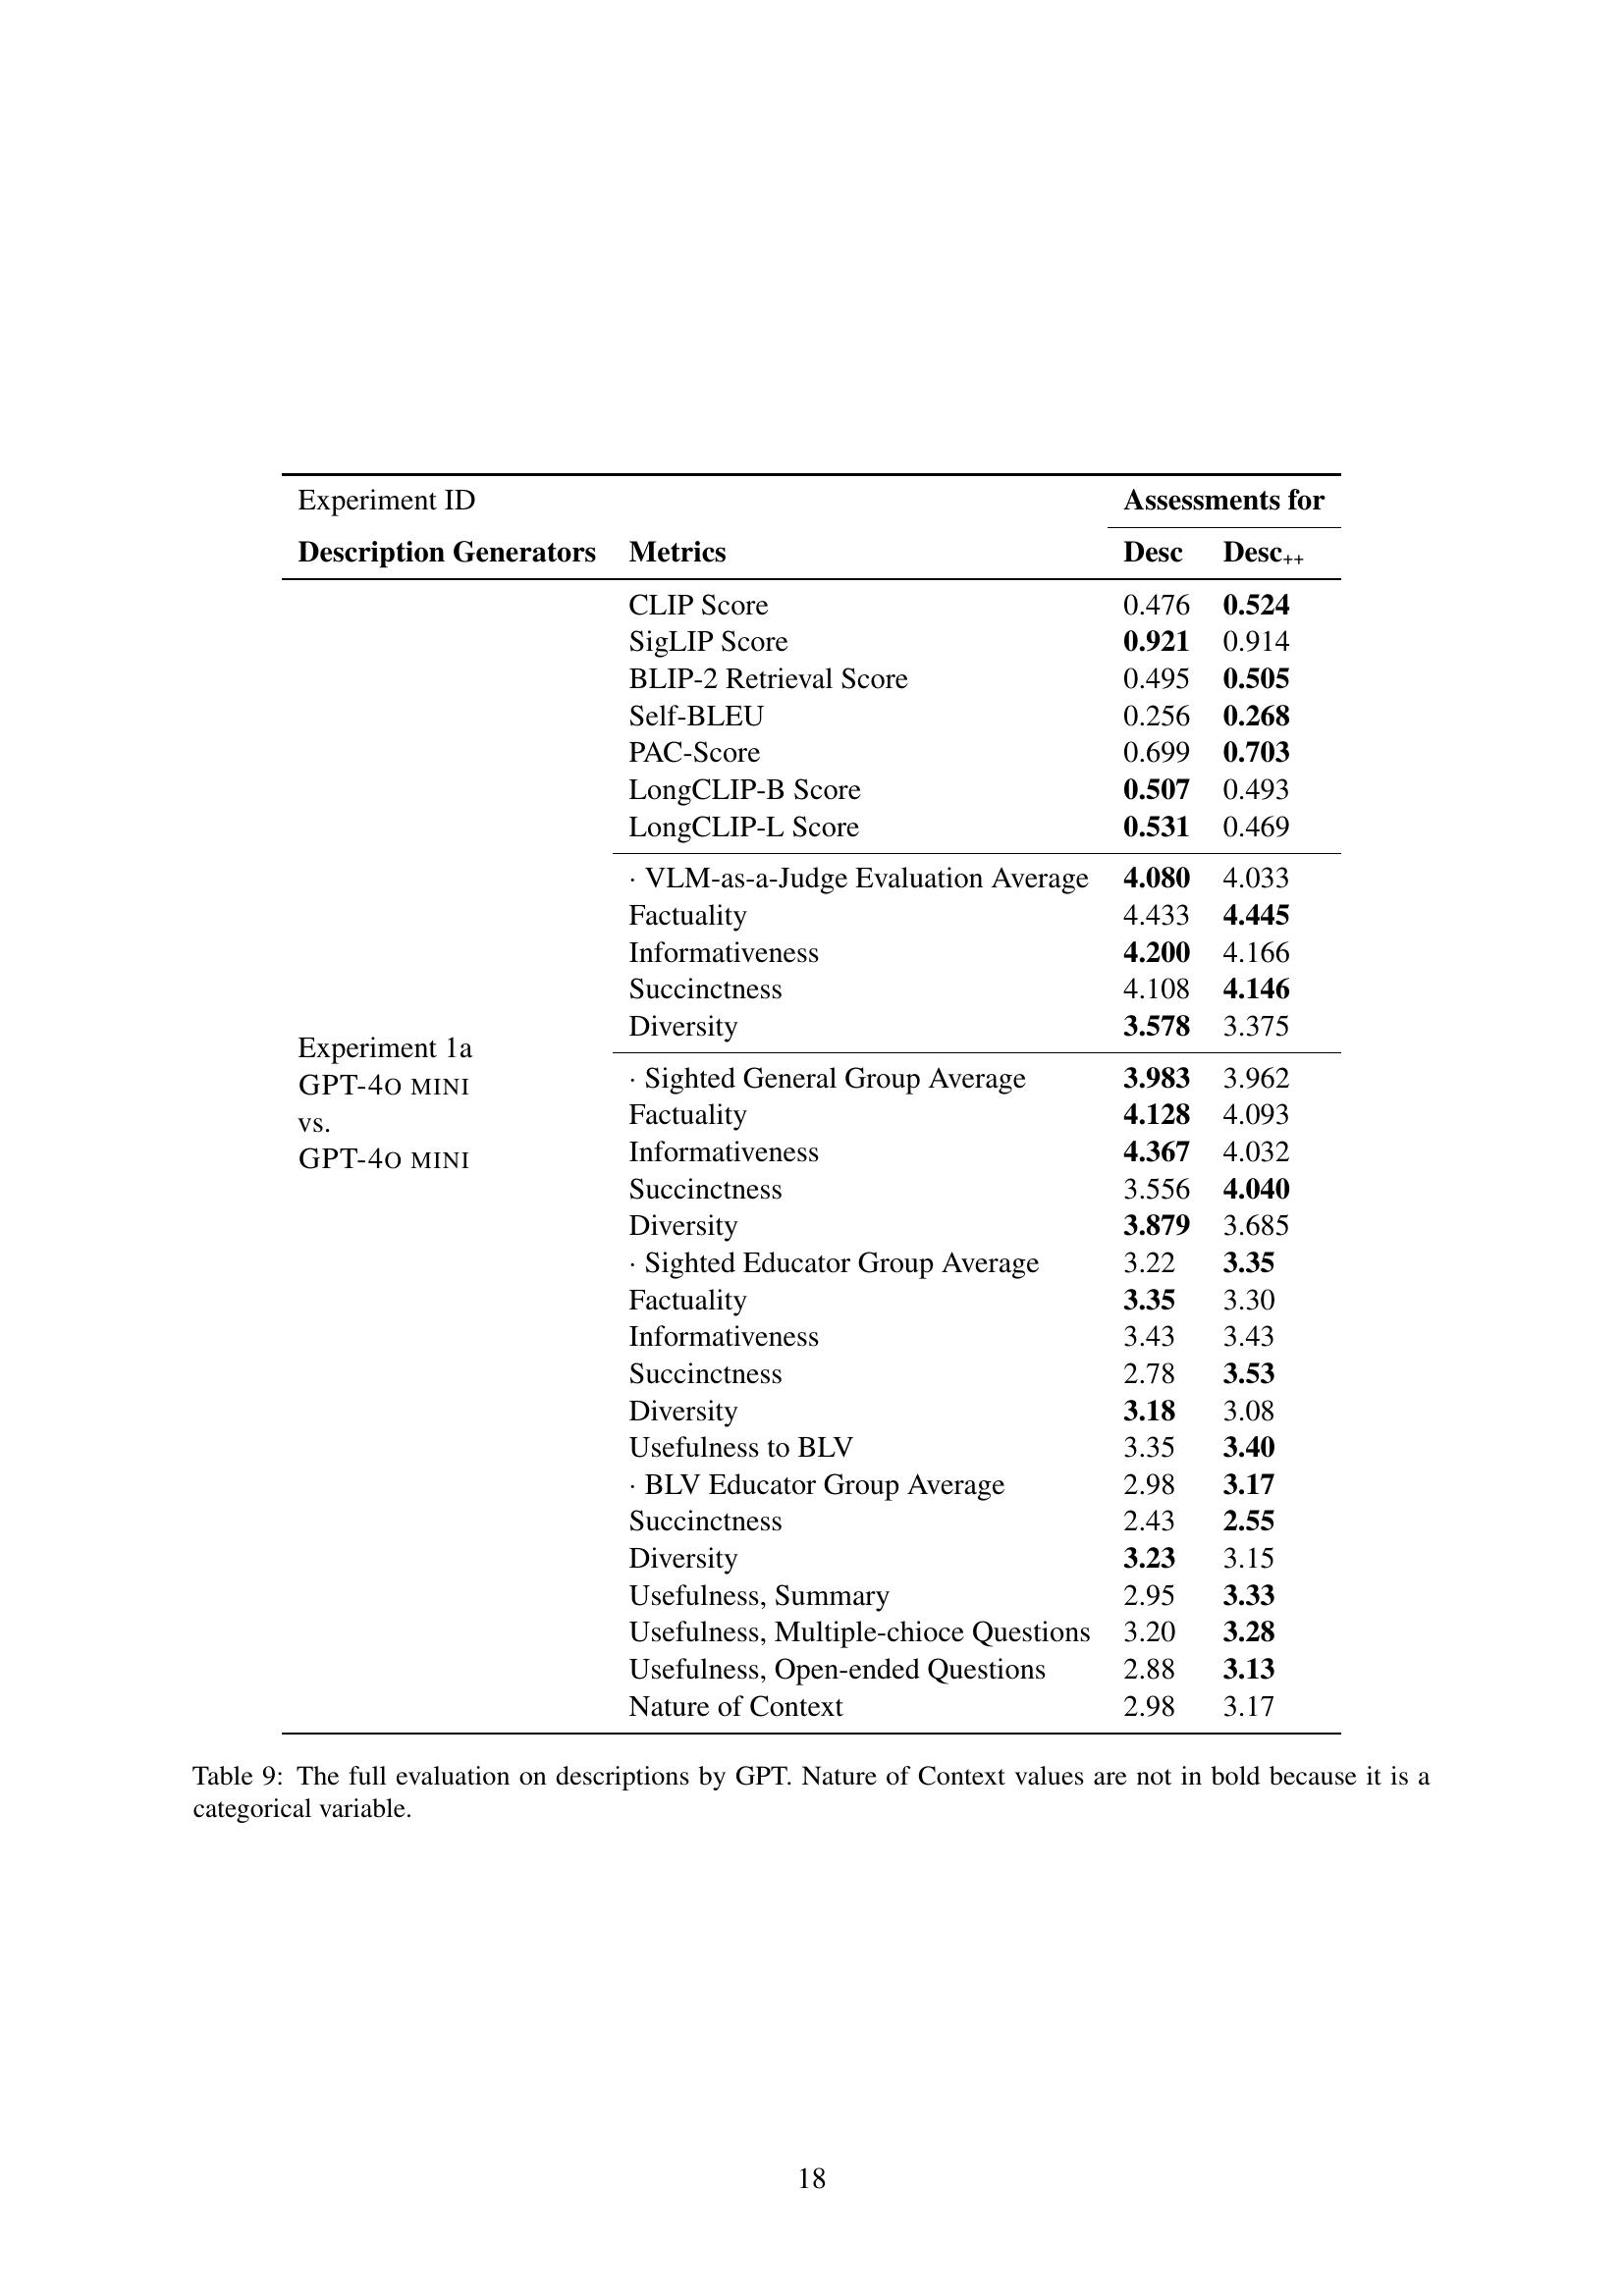
🔼 Table 9 presents a comprehensive evaluation of diagram descriptions generated by the GPT model. It includes both automatic metrics (CLIP Score, SigLIP Score, BLIP-2 Retrieval Score, Self-BLEU, PAC-Score, LongCLIP-B Score, LongCLIP-L Score) and human evaluations from three groups: sighted general annotators, sighted educators, and blind or low-vision (BLV) educators. The human evaluations assess several aspects of the descriptions: factuality, informativeness, succinctness, diversity, and usefulness (broken down into summary, multiple choice questions, and open-ended questions). Note that ‘Nature of Context’ is a categorical variable and therefore is not presented with statistical measures.
read the caption
Table 9: The full evaluation on descriptions by GPT. Nature of Context values are not in bold because it is a categorical variable.
| Group | Cronbach’s |
| Sighted General | 0.70 |
| Sighted Educators | 0.94 |
| BLV Educators | 0.80 |
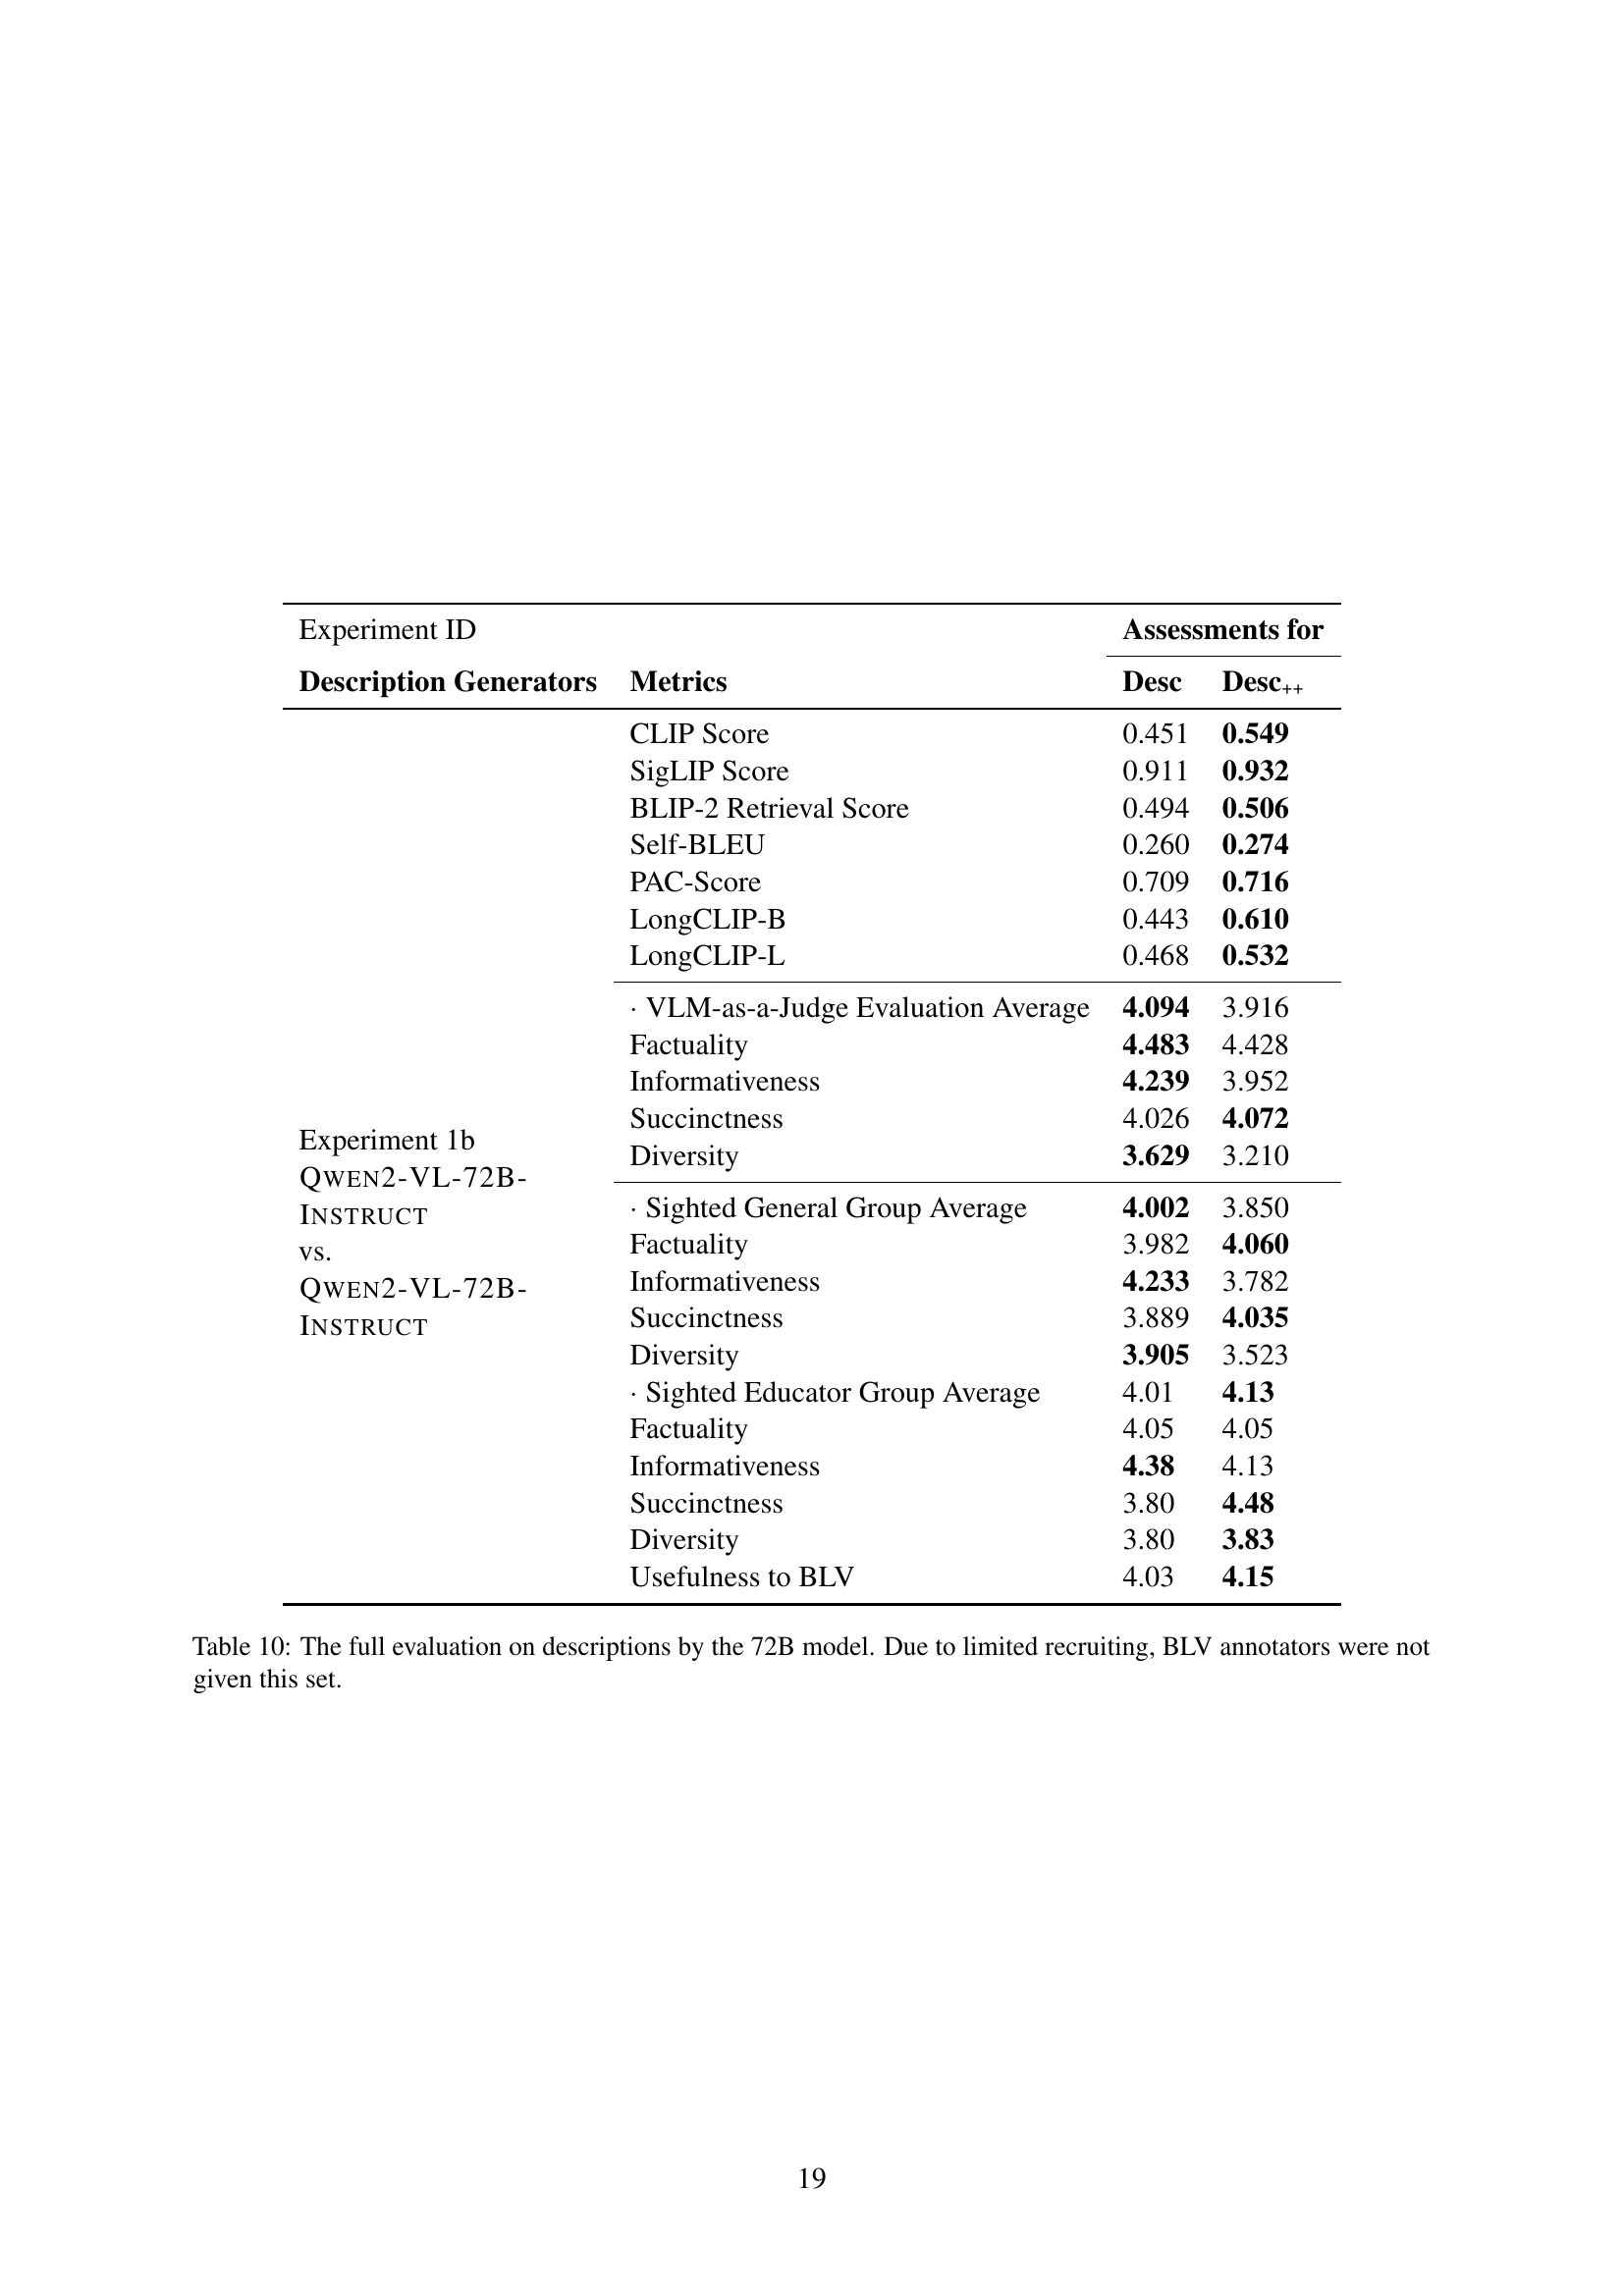
🔼 Table 10 presents a comprehensive evaluation of text descriptions generated by the 72B model. It includes both automatic metrics (CLIP score, SigLIP score, BLIP-2 Retrieval Score, Self-BLEU, PAC-Score, LongCLIP-B, LongCLIP-L) and human evaluations. The human evaluations consist of average scores from sighted general group and sighted educators. Note that, due to recruitment limitations, BLV (Blind and Low Vision) educators did not assess this specific 72B model’s outputs.
read the caption
Table 10: The full evaluation on descriptions by the 72B model. Due to limited recruiting, BLV annotators were not given this set.
| Aspects | |||||
| Group | Factuality | Informativeness | Succinctness | Diversity | Usefulness-Gen |
| Sighted General | |||||
| Sighted Educators | — | ||||
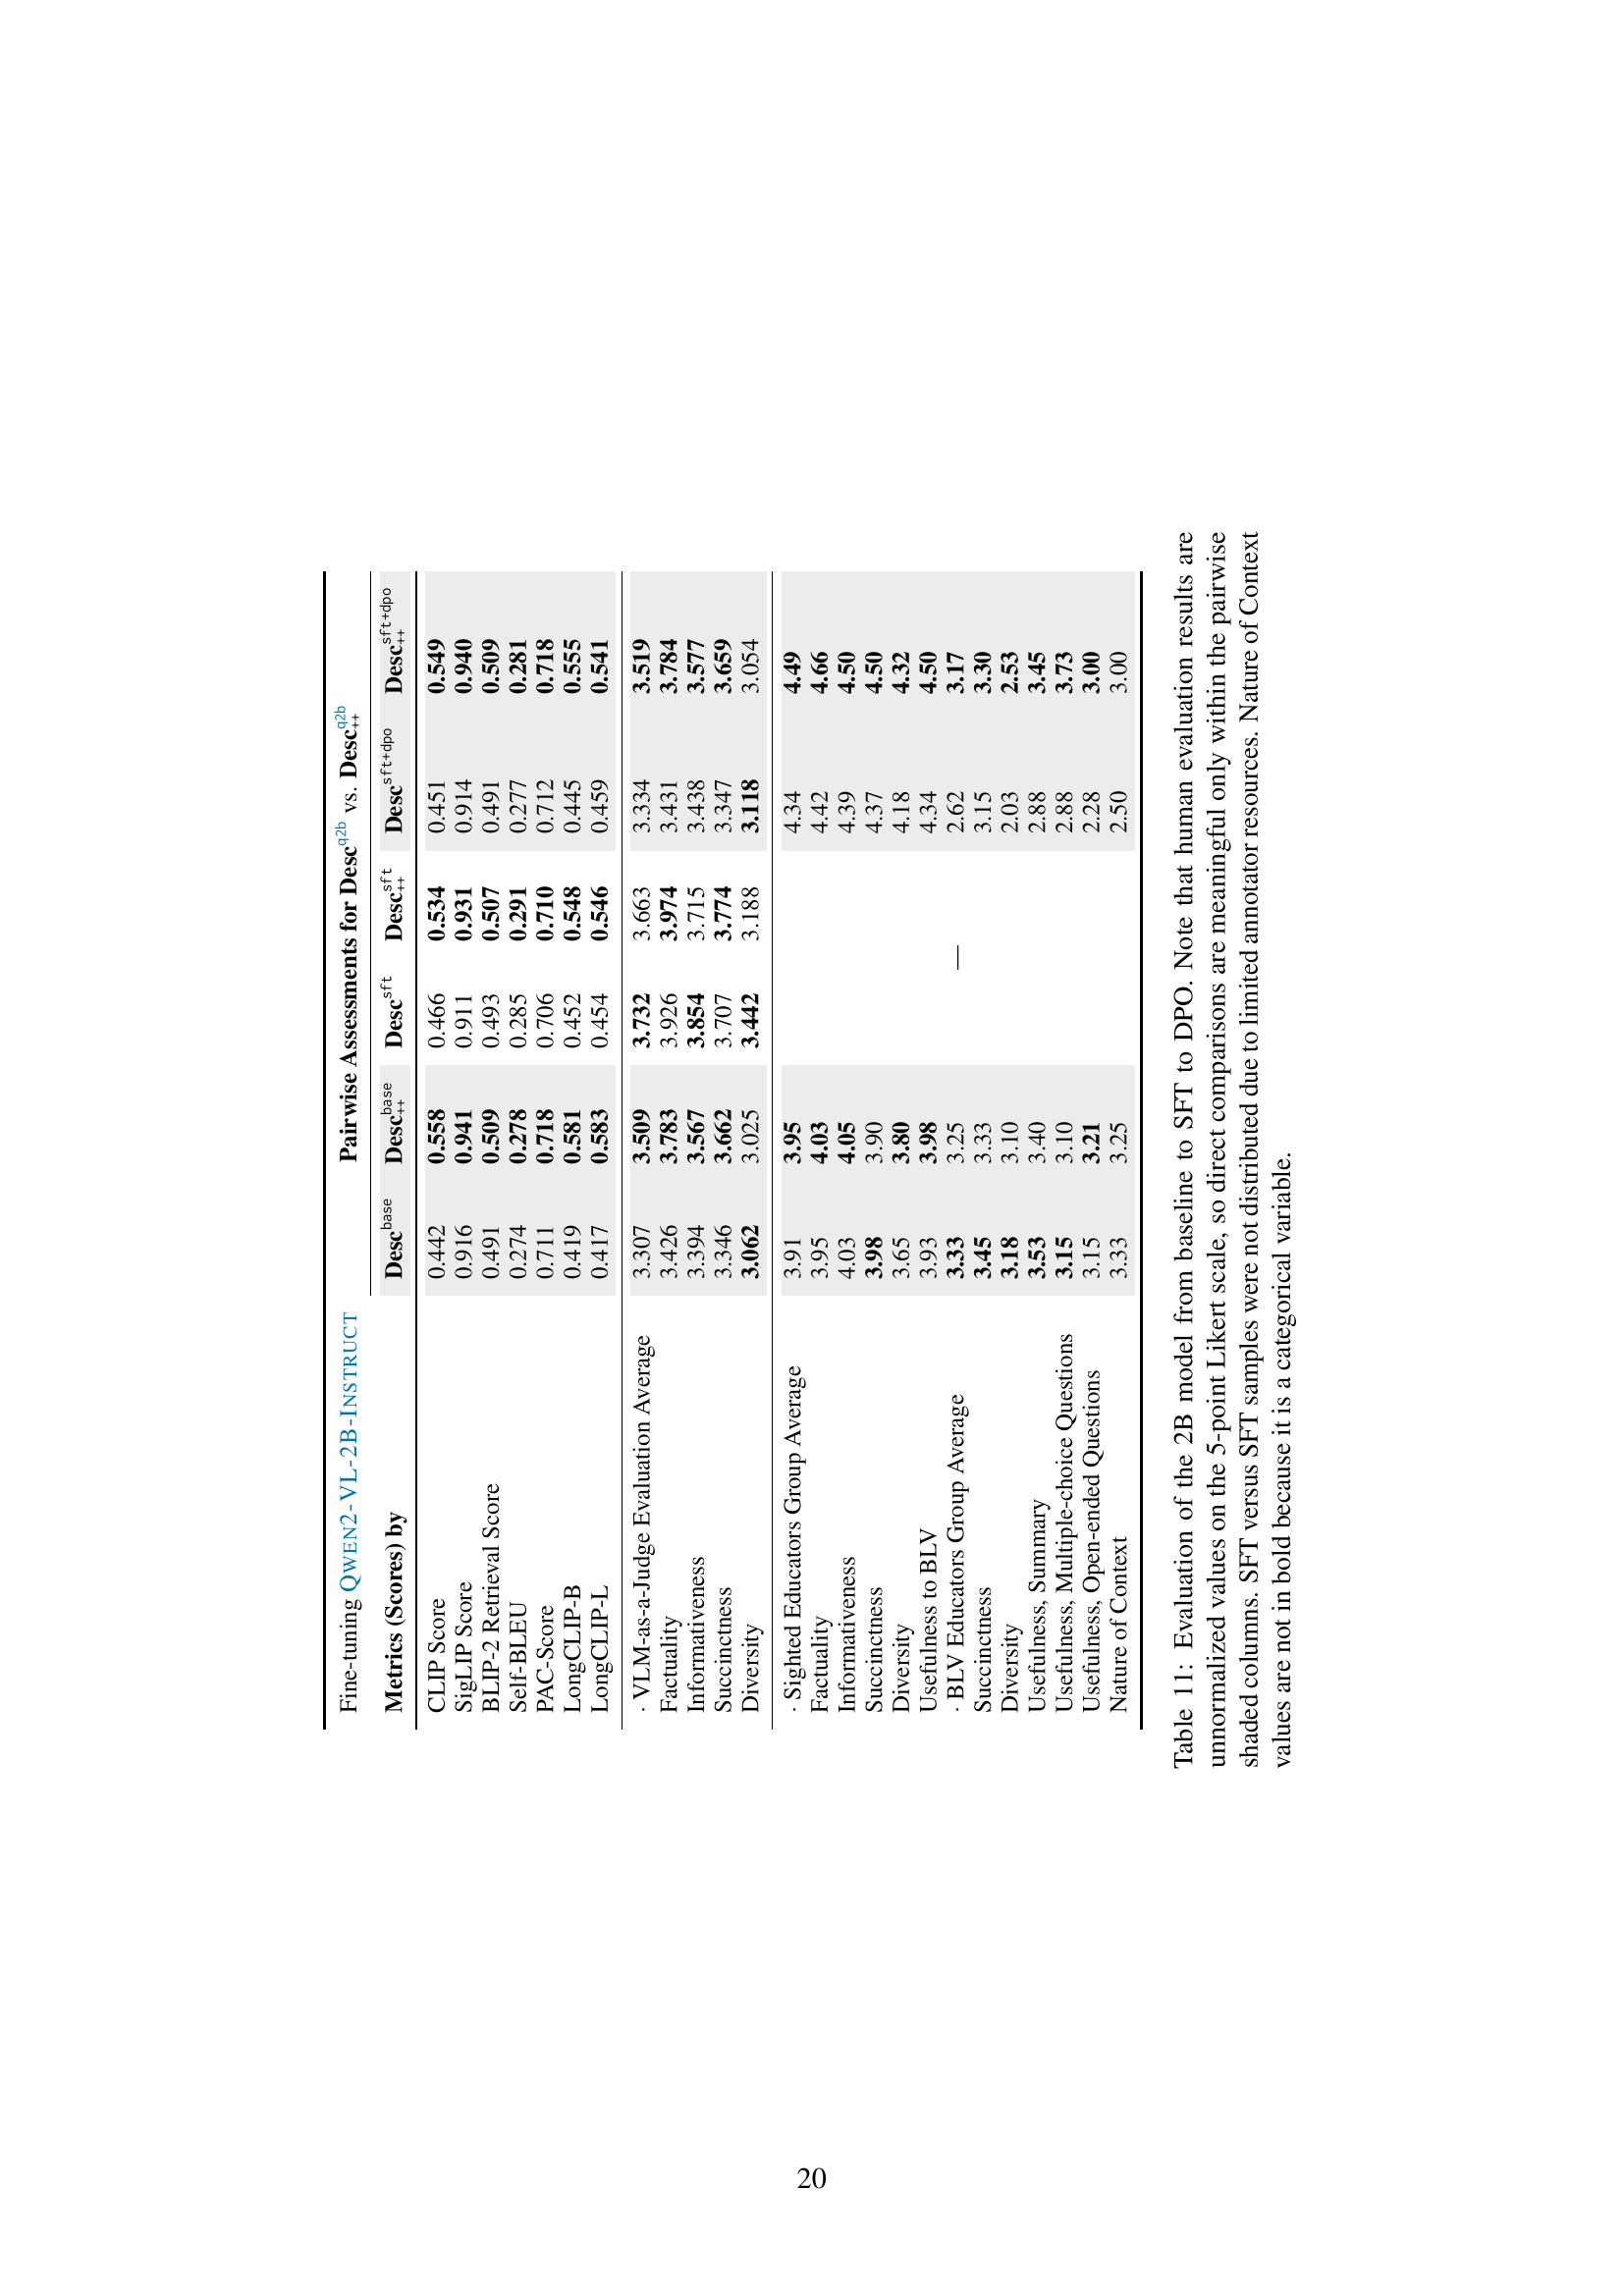
🔼 This table presents a comprehensive evaluation of a 2B model’s performance across various stages of fine-tuning: baseline, supervised fine-tuning (SFT), and direct preference optimization (DPO). The evaluation metrics encompass both automated scores (CLIP, SigLIP, BLIP-2 Retrieval, Self-BLEU, PAC, LongCLIP-B, LongCLIP-L) and human assessments (VLM-as-a-judge, Factuality, Informativeness, Succinctness, Diversity, and Usefulness from three evaluator groups: sighted general, sighted educators, and blind/low vision educators). Because human evaluations used a 5-point Likert scale, direct comparison of scores is only valid within the shaded, pairwise columns. Due to resource constraints, SFT vs. SFT comparisons are absent. ‘Nature of Context’ is a categorical variable and thus not bolded.
read the caption
Table 11: Evaluation of the 2B model from baseline to SFT to DPO. Note that human evaluation results are unnormalized values on the 5-point Likert scale, so direct comparisons are meaningful only within the pairwise shaded columns. SFT versus SFT samples were not distributed due to limited annotator resources. Nature of Context values are not in bold because it is a categorical variable.
| Experiment ID | Assessments for | ||
| Description Generators | Metrics | Desc | |
| Experiment 1a GPT-4o mini vs. GPT-4o mini | CLIP Score | 0.476 | 0.524 |
| SigLIP Score | 0.921 | 0.914 | |
| BLIP-2 Retrieval Score | 0.495 | 0.505 | |
| Self-BLEU | 0.256 | 0.268 | |
| PAC-Score | 0.699 | 0.703 | |
| LongCLIP-B Score | 0.507 | 0.493 | |
| LongCLIP-L Score | 0.531 | 0.469 | |
| VLM-as-a-Judge Evaluation Average | 4.080 | 4.033 | |
| Factuality | 4.433 | 4.445 | |
| Informativeness | 4.200 | 4.166 | |
| Succinctness | 4.108 | 4.146 | |
| Diversity | 3.578 | 3.375 | |
| Sighted General Group Average | 3.983 | 3.962 | |
| Factuality | 4.128 | 4.093 | |
| Informativeness | 4.367 | 4.032 | |
| Succinctness | 3.556 | 4.040 | |
| Diversity | 3.879 | 3.685 | |
| Sighted Educator Group Average | 3.22 | 3.35 | |
| Factuality | 3.35 | 3.30 | |
| Informativeness | 3.43 | 3.43 | |
| Succinctness | 2.78 | 3.53 | |
| Diversity | 3.18 | 3.08 | |
| Usefulness to BLV | 3.35 | 3.40 | |
| BLV Educator Group Average | 2.98 | 3.17 | |
| Succinctness | 2.43 | 2.55 | |
| Diversity | 3.23 | 3.15 | |
| Usefulness, Summary | 2.95 | 3.33 | |
| Usefulness, Multiple-chioce Questions | 3.20 | 3.28 | |
| Usefulness, Open-ended Questions | 2.88 | 3.13 | |
| Nature of Context | 2.98 | 3.17 | |
🔼 This table presents the results of evaluating the performance of a 7B model. The evaluation included various metrics, both automatic and human-based. Human evaluations used a 5-point Likert scale, making direct comparisons only valid within specific, shaded pairings in the table. Due to resource constraints, not all combinations of evaluations were performed. The ‘Nature of Context’ metric is categorical and therefore not represented in bold.
read the caption
Table 12: Evaluation of the 7B model. Note that human evaluation results are nominal values on the 5-point Likert scale, so direct comparisons are meaningful only within the pairwise shaded columns. As with the 2B case, SFT versus SFT samples were not distributed due to limited annotator resources. Nature of Context values are not in bold because it is a categorical variable.
| Experiment ID | Assessments for | ||
| Description Generators | Metrics | Desc | |
| Experiment 1b Qwen2-VL-72B-Instruct vs. Qwen2-VL-72B-Instruct | CLIP Score | 0.451 | 0.549 |
| SigLIP Score | 0.911 | 0.932 | |
| BLIP-2 Retrieval Score | 0.494 | 0.506 | |
| Self-BLEU | 0.260 | 0.274 | |
| PAC-Score | 0.709 | 0.716 | |
| LongCLIP-B | 0.443 | 0.610 | |
| LongCLIP-L | 0.468 | 0.532 | |
| VLM-as-a-Judge Evaluation Average | 4.094 | 3.916 | |
| Factuality | 4.483 | 4.428 | |
| Informativeness | 4.239 | 3.952 | |
| Succinctness | 4.026 | 4.072 | |
| Diversity | 3.629 | 3.210 | |
| Sighted General Group Average | 4.002 | 3.850 | |
| Factuality | 3.982 | 4.060 | |
| Informativeness | 4.233 | 3.782 | |
| Succinctness | 3.889 | 4.035 | |
| Diversity | 3.905 | 3.523 | |
| Sighted Educator Group Average | 4.01 | 4.13 | |
| Factuality | 4.05 | 4.05 | |
| Informativeness | 4.38 | 4.13 | |
| Succinctness | 3.80 | 4.48 | |
| Diversity | 3.80 | 3.83 | |
| Usefulness to BLV | 4.03 | 4.15 | |
🔼 Table 13 presents a comparison of the performance of two Qwen2-VL models (2B and 72B) on various metrics, including automatic metrics and human evaluations from sighted and blind/low-vision (BLV) educators. The results show that the smaller 2B model outperforms the larger 72B model across several metrics. Interestingly, the VLM (large language model) evaluations correlate more strongly with the assessments of sighted educators than with those of BLV educators, indicating potential biases in the evaluation methods. This disparity is particularly noticeable when comparing the results from the 72B and 2B models.
read the caption
Table 13: The smaller model outperforms a larger variant across many metrics. It is also important to note that the VLM judgments align better with sighted educators than with BLV educators. Further analysis is found in Section 5. This tendency is especially strong with the pairwise comparison between 72B- and 7B-generated descriptions. Nature of Context values are not in bold because it is a categorical variable.
| Fine-tuning Qwen2-VL-2B-Instruct | Pairwise Assessments for vs. | |||||
| Metrics (Scores) by | ||||||
| CLIP Score | 0.442 | 0.558 | 0.466 | 0.534 | 0.451 | 0.549 |
| SigLIP Score | 0.916 | 0.941 | 0.911 | 0.931 | 0.914 | 0.940 |
| BLIP-2 Retrieval Score | 0.491 | 0.509 | 0.493 | 0.507 | 0.491 | 0.509 |
| Self-BLEU | 0.274 | 0.278 | 0.285 | 0.291 | 0.277 | 0.281 |
| PAC-Score | 0.711 | 0.718 | 0.706 | 0.710 | 0.712 | 0.718 |
| LongCLIP-B | 0.419 | 0.581 | 0.452 | 0.548 | 0.445 | 0.555 |
| LongCLIP-L | 0.417 | 0.583 | 0.454 | 0.546 | 0.459 | 0.541 |
| VLM-as-a-Judge Evaluation Average | 3.307 | 3.509 | 3.732 | 3.663 | 3.334 | 3.519 |
| Factuality | 3.426 | 3.783 | 3.926 | 3.974 | 3.431 | 3.784 |
| Informativeness | 3.394 | 3.567 | 3.854 | 3.715 | 3.438 | 3.577 |
| Succinctness | 3.346 | 3.662 | 3.707 | 3.774 | 3.347 | 3.659 |
| Diversity | 3.062 | 3.025 | 3.442 | 3.188 | 3.118 | 3.054 |
| Sighted Educators Group Average | 3.91 | 3.95 | 4.34 | 4.49 | ||
| Factuality | 3.95 | 4.03 | 4.42 | 4.66 | ||
| Informativeness | 4.03 | 4.05 | 4.39 | 4.50 | ||
| Succinctness | 3.98 | 3.90 | 4.37 | 4.50 | ||
| Diversity | 3.65 | 3.80 | 4.18 | 4.32 | ||
| Usefulness to BLV | 3.93 | 3.98 | 4.34 | 4.50 | ||
| BLV Educators Group Average | 3.33 | 3.25 | — | 2.62 | 3.17 | |
| Succinctness | 3.45 | 3.33 | 3.15 | 3.30 | ||
| Diversity | 3.18 | 3.10 | 2.03 | 2.53 | ||
| Usefulness, Summary | 3.53 | 3.40 | 2.88 | 3.45 | ||
| Usefulness, Multiple-choice Questions | 3.15 | 3.10 | 2.88 | 3.73 | ||
| Usefulness, Open-ended Questions | 3.15 | 3.21 | 2.28 | 3.00 | ||
| Nature of Context | 3.33 | 3.25 | 2.50 | 3.00 | ||
🔼 Table 14 presents a comparison of the performance of a 2B and a 7B model on a diagram description task. The results show that the smaller, 2B model performs comparably to the larger 7B model. A key finding is that evaluations by a Vision-Language Model (VLM) align more closely with assessments from sighted educators than those from blind or low-vision (BLV) educators. Section 5 delves deeper into an analysis of this discrepancy.
read the caption
Table 14: The 2B model performs on par with the 7B variant. Again, VLM judgments align better with sighted educators than with BLV educators. Further analysis is found in Section 5. Nature of Context values are not in bold because it is a categorical variable.
| Fine-tuning Qwen2-VL-7B-Instruct | Pairwise Assessments for vs. | |||||
| Metrics (Scores) by | ||||||
| CLIP Score | 0.423 | 0.577 | 0.411 | 0.589 | 0.407 | 0.593 |
| SigLIP Score | 0.922 | 0.952 | 0.918 | 0.944 | 0.923 | 0.952 |
| BLIP-2 Retrieval Score | 0.490 | 0.510 | 0.489 | 0.511 | 0.490 | 0.510 |
| Self-BLEU | 0.268 | 0.274 | 0.275 | 0.282 | 0.268 | 0.275 |
| PAC-Score | 0.713 | 0.720 | 0.706 | 0.714 | 0.711 | 0.718 |
| LongCLIP-B | 0.419 | 0.581 | 0.452 | 0.589 | 0.417 | 0.583 |
| LongCLIP-L | 0.417 | 0.583 | 0.486 | 0.514 | 0.412 | 0.588 |
| VLM-as-a-Judge Evaluation Average | 3.951 | 3.652 | 4.021 | 3.758 | 3.948 | 3.642 |
| Factuality | 4.271 | 4.157 | 4.371 | 4.261 | 4.289 | 4.161 |
| Informativeness | 4.101 | 3.645 | 4.161 | 3.770 | 4.100 | 3.642 |
| Succinctness | 3.946 | 3.892 | 3.974 | 3.964 | 3.904 | 3.858 |
| Diversity | 3.486 | 2.913 | 3.576 | 3.036 | 3.498 | 2.906 |
| Sighted Educators Group Average | 4.37 | 3.97 | 3.97 | 3.95 | ||
| Factuality | 4.82 | 4.56 | 4.00 | 3.95 | ||
| Informativeness | 4.67 | 3.87 | 4.08 | 4.13 | ||
| Succinctness | 3.95 | 4.15 | 3.88 | 4.00 | ||
| Diversity | 4.23 | 3.64 | 3.88 | 3.70 | ||
| Usefulness to BLV | 4.37 | 3.97 | 4.03 | 3.95 | ||
| BLV Educators Group Average | 3.87 | 3.82 | — | 3.82 | 3.71 | |
| Succinctness | 4.30 | 4.55 | 4.48 | 4.65 | ||
| Diversity | 4.20 | 4.20 | 4.13 | 3.90 | ||
| Usefulness, Summary | 4.15 | 4.55 | 4.25 | 4.35 | ||
| Usefulness, Multiple-choice Questions | 4.40 | 4.20 | 4.15 | 3.95 | ||
| Usefulness, Open-ended Questions | 3.80 | 3.80 | 3.70 | 3.58 | ||
| Nature of Context | 2.35 | 1.60 | 2.23 | 1.85 | ||
🔼 This table compares the performance of a 2B parameter model fine-tuned on the SightationCompletions dataset against a 3B parameter model trained on the ChartGemma dataset. The comparison focuses on caption generation tasks, and to ensure a fair evaluation given that ChartGemma is not designed for conversational use, both models were prompted with the simple instruction ‘Generate a caption’. The results demonstrate that the smaller, SightationCompletions-trained model outperforms the larger model, highlighting the effectiveness of the Sightation dataset in generating high-quality captions.
read the caption
Table 15: A 2B model fine-tuned on SightationCompletions outperforms a 3B model tuned on a larger dataset. Note that ChartGemma is not meant for conversational use. Hence, for a fair comparison, we did not enter our guided generation prompt and instead input only the brief request “Generate a caption” to both models.
| Experiment ID | Assessments for | ||
| Description Generators | Metrics | ||
| Experiment 3a Qwen2-VL-72B-Instruct vs. Fine-tuned Qwen2-VL-7B-Instruct | CLIP Score | 0.390 | 0.610 |
| SigLIP Score | 0.911 | 0.952 | |
| BLIP-2 Retrieval Score | 0.487 | 0.513 | |
| Self-BLEU | 0.260 | 0.275 | |
| PAC-Score | 0.709 | 0.719 | |
| LongCLIP-B Score | 0.388 | 0.612 | |
| LongCLIP-L Score | 0.445 | 0.555 | |
| VLM-as-a-Judge Evaluation Average | 4.095 | 3.650 | |
| Factuality | 4.477 | 4.238 | |
| Informativeness | 4.262 | 3.586 | |
| Succinctness | 3.990 | 3.894 | |
| Diversity | 3.652 | 2.880 | |
| Sighted Educators Group Average | 3.21 | 3.01 | |
| Factuality | 3.30 | 3.28 | |
| Informativeness | 3.33 | 2.95 | |
| Succinctness | 2.95 | 3.18 | |
| Diversity | 3.13 | 2.68 | |
| Usefulness to BLV | 3.35 | 2.98 | |
| BLV Educators Group Average | 3.69 | 4.33 | |
| Succinctness | 3.60 | 4.55 | |
| Diversity | 3.60 | 3.90 | |
| Usefulness, Summary | 3.95 | 4.30 | |
| Usefulness, Multiple-choice Questions | 3.70 | 4.55 | |
| Usefulness, Open-ended Questions | 3.70 | 4.45 | |
| Nature of Context | 3.60 | 4.25 | |
🔼 Table 16 presents a comprehensive performance evaluation of the SIGHTATIONRETRIEVAL dataset used for training image-to-text retrieval models. The results demonstrate that models trained on the SIGHTATIONRETRIEVAL dataset generalize well to the COCO dataset, outperforming models trained solely on COCO when evaluated on the SIGHTATIONRETRIEVAL dataset. Conversely, models trained on COCO and tested on SIGHTATIONRETRIEVAL exhibited performance comparable to models trained and tested on COCO. This highlights the robustness and effectiveness of SIGHTATIONRETRIEVAL for training generalizable retrieval models. The absence of K=10 data points for COCO is attributed to the limited number of positive samples (only 5) available in the COCO dataset.
read the caption
Table 16: SightationRetrieval shows promising potential as a challenging and effective training material for image-to-text retrievers. Two important observations can be made: the model trained on our set generalizes to COCO better than the other direction; our model performs on par with the model that was both trained and tested on COCO. K=10𝐾10K=10italic_K = 10 values are missing for tests with COCO, since its samples contain only 5 positives each.
| Experiment ID | Assessments for | ||
| Description Generators | Metrics | ||
| Experiment 3b Qwen2-VL-7B-Instruct vs. Fine-tuned Qwen2-VL-2B-Instruct | CLIP Score | 0.486 | 0.514 |
| SigLIP Score | 0.922 | 0.940 | |
| BLIP-2 Retrieval Score | 0.500 | 0.500 | |
| Self-BLEU | 0.268 | 0.281 | |
| PAC-Score | 0.713 | 0.718 | |
| LongCLIP-B Score | 0.316 | 0.684 | |
| LongCLIP-L Score | 0.559 | 0.441 | |
| VLM-as-a-Judge Evaluation Average | 3.921 | 3.545 | |
| Factuality | 4.203 | 3.935 | |
| Informativeness | 4.046 | 3.592 | |
| Succinctness | 3.942 | 3.709 | |
| Diversity | 3.493 | 2.945 | |
| Sighted Educators Group Average | 4.75 | 4.44 | |
| Factuality | 4.75 | 4.50 | |
| Informativeness | 4.65 | 4.38 | |
| Succinctness | 4.88 | 4.40 | |
| Diversity | 4.80 | 4.63 | |
| Usefulness to BLV | 4.65 | 4.28 | |
| BLV Educators Group Average | 4.13 | 4.32 | |
| Succinctness | 4.05 | 4.15 | |
| Diversity | 4.08 | 4.15 | |
| Usefulness, Summary | 3.85 | 4.13 | |
| Usefulness, Multiple-choice Questions | 4.53 | 4.58 | |
| Usefulness, Open-ended Questions | 4.23 | 4.35 | |
| Nature of Context | 4.08 | 4.50 | |
🔼 This table presents demographic information on the visually impaired (BLV) educators who participated in the study. For each educator, it lists their ID, sex, age, years of teaching experience, age of blindness onset, and the assistive technologies (if any) they use. Importantly, the caption notes that all BLV educators in this study had the most severe level of blindness (level 1).
read the caption
Table 17: BLV Teachers Information. All the BLV teachers in our study were of blindness level 1, the severest.
| Experiment ID | Assessments for | ||
| Description Generators | Metrics | ||
| Experiment 3c ChartGemma (3B) vs. Fine-tuned Qwen2-VL-2B-Instruct | CLIP Score | 0.450 | 0.550 |
| SigLIP Score | 0.872 | 0.940 | |
| BLIP-2 Retrieval Score | 0.511 | 0.490 | |
| Self-BLEU | 0.305 | 0.280 | |
| PAC-Score | 0.705 | 0.716 | |
| LongClip-B | 0.316 | 0.684 | |
| LongClip-L | 0.559 | 0.441 | |
| VLM-as-a-Judge Evaluation Average | 2.951 | 3.860 | |
| Factuality | 3.068 | 4.119 | |
| Informativeness | 2.848 | 3.967 | |
| Succinctness | 3.253 | 3.925 | |
| Diversity | 2.635 | 3.428 | |
🔼 This table details the demographics and AI tool usage of the sighted educators who participated in the study. Specifically, it lists each educator’s ID, sex, age, teaching experience, and the AI tools they use, categorized into generic AI tools and those specifically for accessibility.
read the caption
Table 18: Sighted Teachers Information.
| 2-way Cross-validation of BLIP-2 | ||||||
| Train set | N/A (Pre-trained) | COCO | SightationRetrieval (Ours) | |||
| Test set | COCO | Ours | COCO | Ours | COCO | Ours |
| Recall@1 | 0.171 | 0.048 | 0.185 | 0.033 | 0.180 | 0.076 |
| Recall@5 | 0.767 | 0.210 | 0.831 | 0.134 | 0.766 | 0.348 |
| Recall@10 | — | 0.340 | — | 0.229 | — | 0.549 |
| Precision@1 | 0.856 | 0.371 | 0.924 | 0.250 | 0.900 | 0.585 |
| Precision@5 | 0.767 | 0.324 | 0.831 | 0.204 | 0.766 | 0.535 |
| Precision@10 | — | 0.263 | — | 0.175 | — | 0.425 |
🔼 Table 19 details the configurations used for fine-tuning the Qwen2-VL-2B-Instruct model using supervised fine-tuning (SFT) and direct preference optimization (DPO). It lists various hyperparameters, including training settings (batch size, epochs, etc.), evaluation metrics, and hardware specifications (4xA6000 GPUs). The table allows for a detailed comparison of the SFT and DPO processes for this specific model.
read the caption
Table 19: SFT and DPO configurations for Qwen2-VL-2B-Instruct. Tuning was performed on 4 ×A6000 GPUs.
| ID | Sex | Age | Teaching Experience (years) | Onset Age | AI Use, Generic | AI Use, Accessibility |
| B1 | M | 54 | 28 | 16 | ChatGPT, Gemini | SenseReader |
| B2 | F | 46 | 21 | Congenital | ChatGPT | SenseReader |
| B3 | M | 47 | 5 | 9 | ChatGPT, Gemini | SenseReader |
| B4 | M | 51 | 26 | 14 | SeeingAI, ChatGPT, Adot, Perplexity, Adot | SenseReader, NVDA, VoiceOver |
| B5 | M | 20 | 1 | Congenital | SeeingAI, ChatGPT | SenseReader, NVDA |
| B6 | M | 46 | 19 | — | — | SenseReader |
| B7 | M | 44 | 21 | Congenital | Be_My_Eyes, SeeingAI, ChatGPT, Claude | SenseReader, VoiceOver |
| B8 | M | 45 | 19 | Congenital | Be_My_Eyes, SeeingAI, ChatGPT | SenseReader, VoiceOver |
🔼 This table details the specific hyperparameters and settings used for fine-tuning and direct preference optimization (DPO) of the Qwen2-VL-7B-Instruct model. It includes parameters such as output directory, evaluation strategy, batch sizes (training and evaluation), number of training epochs, gradient accumulation steps, whether bfloat16 was enabled, evaluation steps, label names, whether to load the best model at the end of training, the metric used to select the best model, whether the Liger library was used, maximum sequence length, dataset keyword arguments, gradient checkpointing, number of processors used, whether or not Torch Compile was enabled, whether DDP found unused parameters, model path, data type, and attention implementation. The training was conducted on 4x A6000 GPUs.
read the caption
Table 20: SFT and DPO configurations for Qwen2-VL-7B-Instruct. Tuning was performed on 4 ×A6000 GPUs.
| ID | Sex | Age | Teaching Experience (years) | AI Use - Generic |
| S1 | M | 39 | 6.5 | ChatGPT |
| S2 | M | 51 | 20 | ChatGPT, wrtn |
| S3 | M | 48 | 21 | ChatGPT |
| S4 | F | 40 | 13 | ChatGPT |
| S5 | F | 56 | 33 | — |
| S6 | F | 49 | 20 | ChatGPT |
| S7 | M | 49 | 20 | Gemini |
| S8 | F | 49 | 24 | ChatGPT, Claude |
| S9 | M | 44 | 14 | — |
| S10 | F | 50 | 20 | ChatGPT |
🔼 This table details the hyperparameters and settings used during the training process of the BLIP-2 model for image-text retrieval. It covers aspects such as the model itself, the hardware used (GPUs), the dataset employed (SIGHTATIONRETRIEVAL), the loss function (InfoNCE), batch size, number of training epochs, optimizer (AdamW with specified learning rates for text and vision components), gradient clipping, learning rate scheduler (linear warmup), which layers of the model were frozen during training, and the checkpointing strategy.
read the caption
Table 21: Training configurations for BLIP-2 image-text retrieval.
Full paper#