TL;DR#
Scientific discovery needs AI that reasons over multimodal data, which is a challenge, especially in biology. Current multimodal reasoning benchmarks do not target the complexity of research-level tasks. Existing research-level benchmarks lack the complex multimodal reasoning required for scientific discovery, emphasizing lower-level perception. Thus, there is a gap to bridge to achieve more complex reasoning for scientific discovery.
To address this, a new visual question answering (VQA) benchmark is introduced. The MicroVQA assesses three key reasoning skills crucial for research: expert image understanding, hypothesis generation, and experiment proposal. It features 1,042 expert-created multiple-choice questions across diverse microscopy modalities, mirroring real scientific practice. This benchmark exposes limitations in state-of-the-art MLLMs, suggesting areas for improvement such as multimodal reasoning skills.
Key Takeaways#
Why does it matter?#
This research propels scientific AI by introducing a specialized VQA benchmark, revealing MLLM challenges in expert-level microscopy analysis and paving the way for more sophisticated, AI-driven research tools.
Visual Insights#

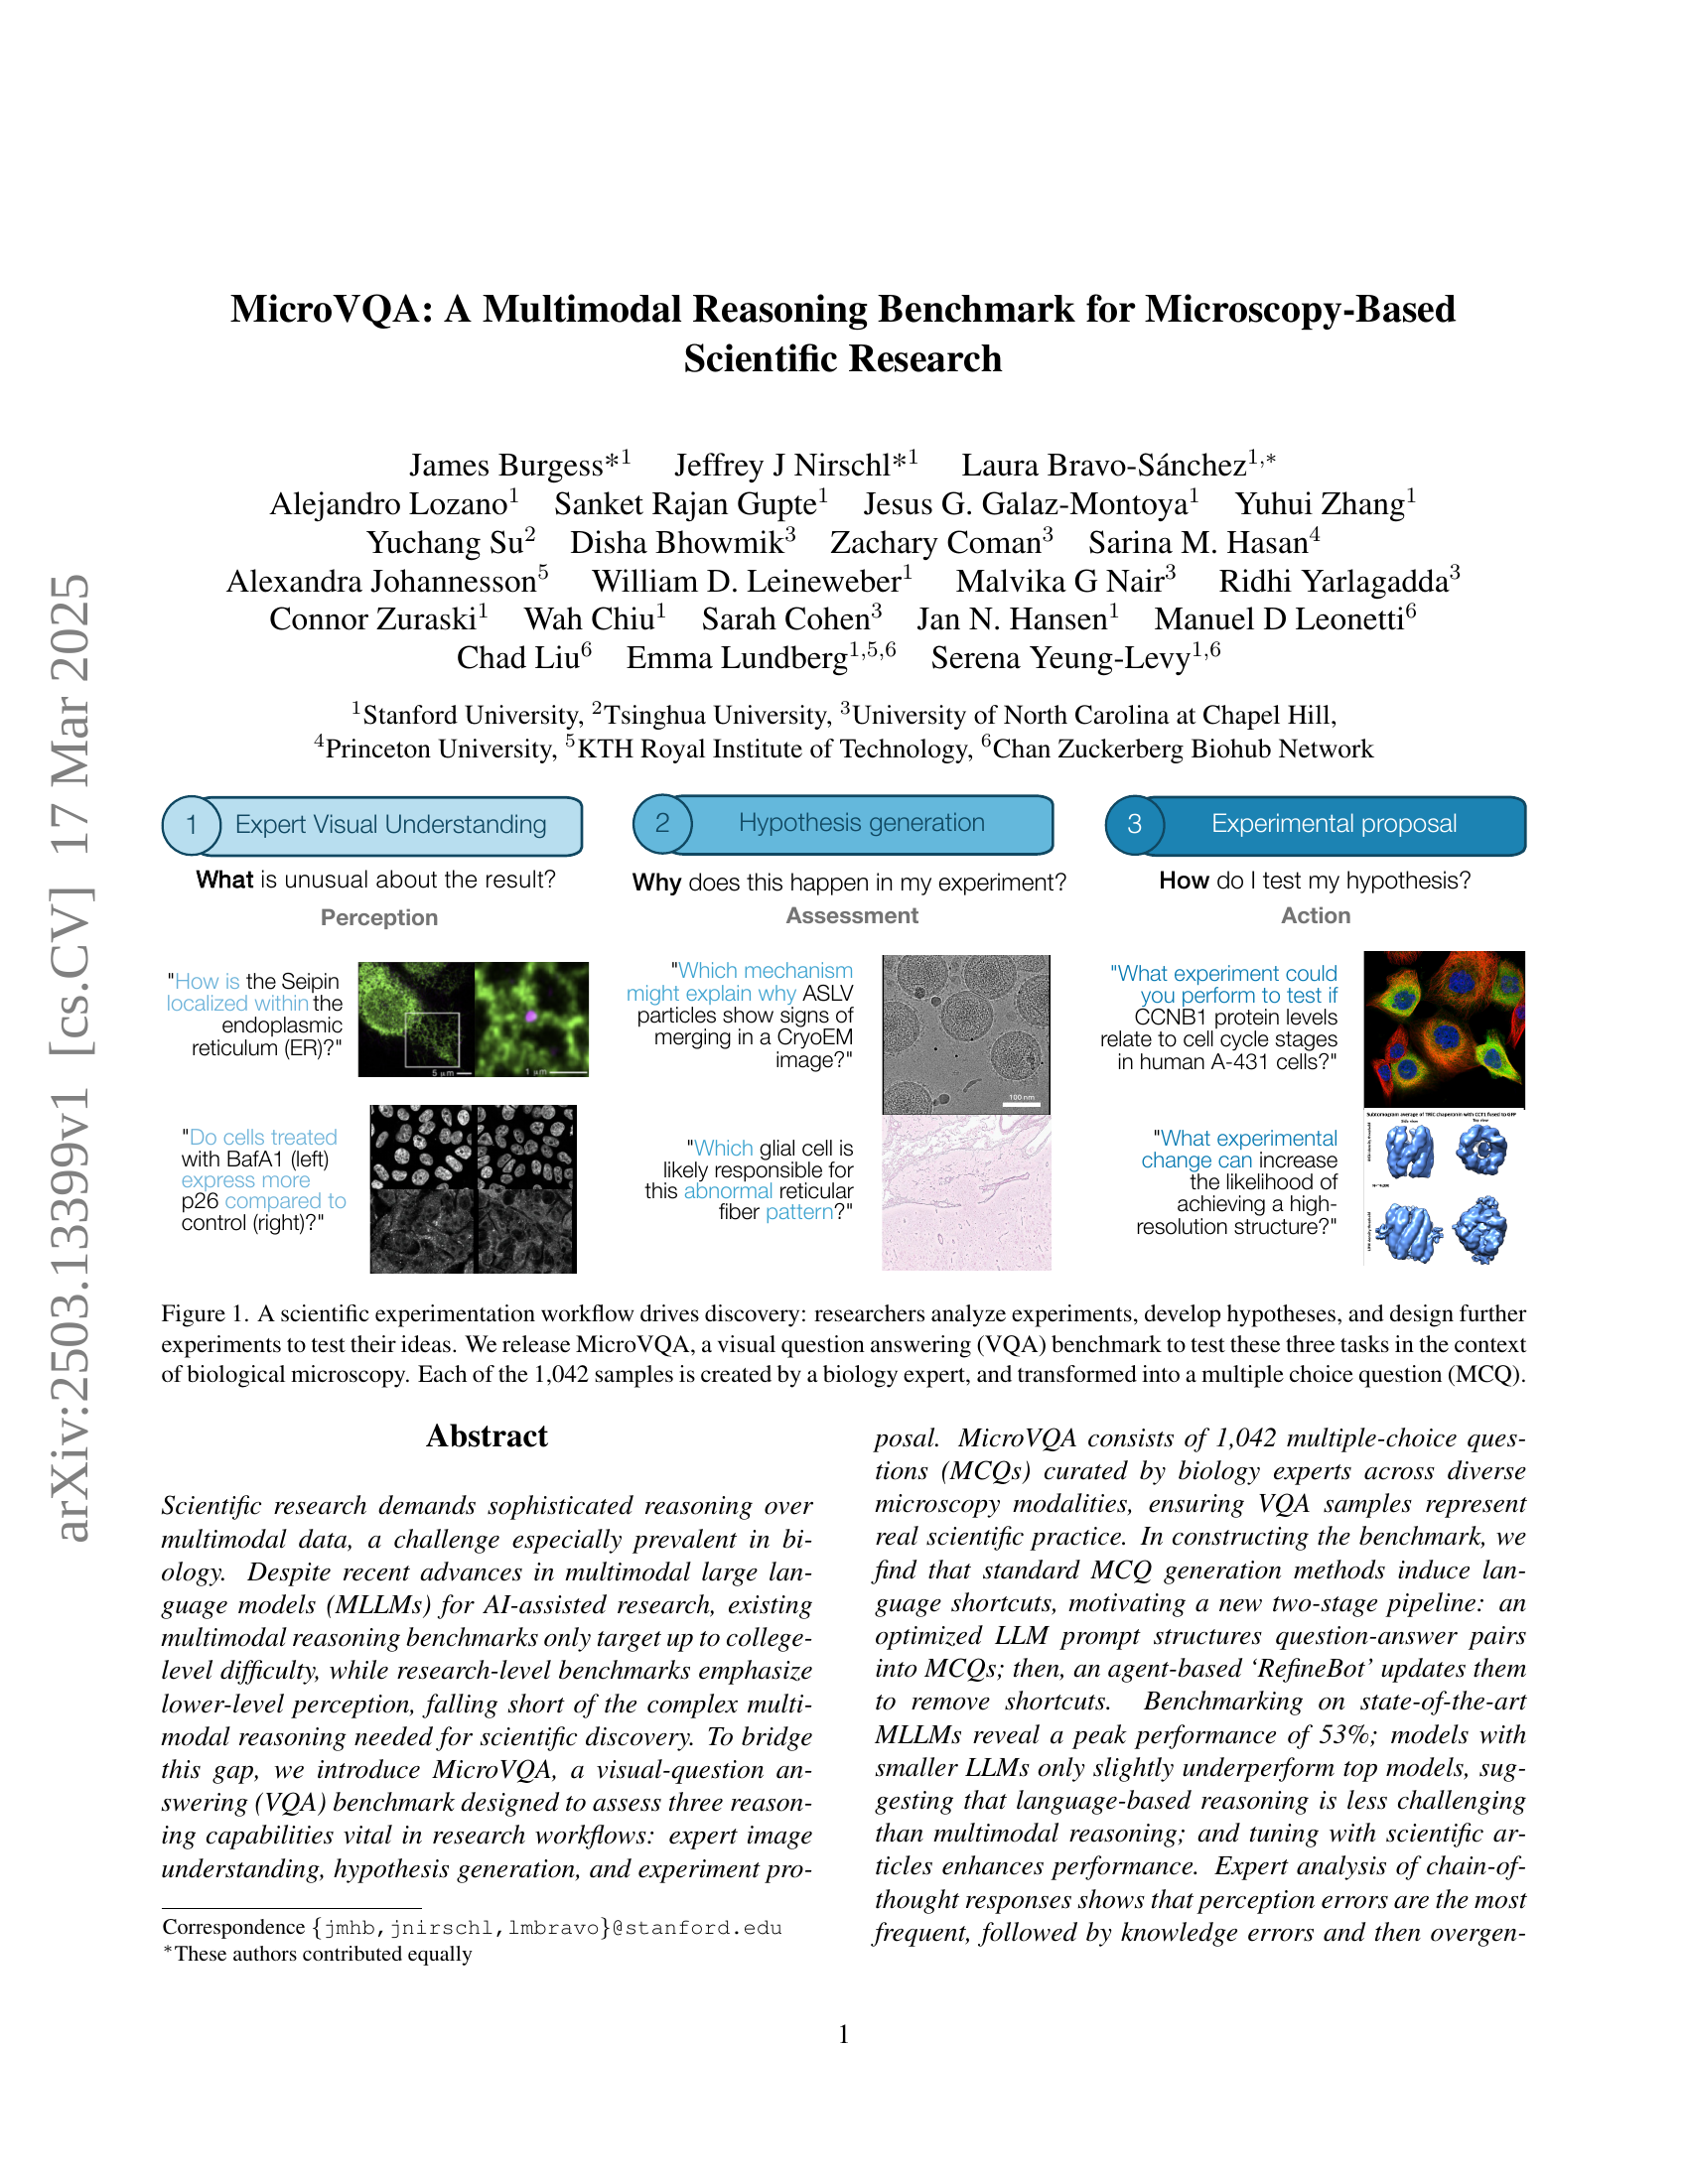
🔼 The figure illustrates the three main reasoning tasks involved in scientific experimentation using biological microscopy images: expert image understanding, hypothesis generation, and experimental proposal. Each task is represented with an example image and question, highlighting how MicroVQA uses visual question answering to evaluate these reasoning capabilities. The benchmark comprises 1042 multiple-choice questions, each created by a biology expert, to test the ability to understand, interpret, and reason using microscopy-based data.
read the caption
Figure 1: A scientific experimentation workflow drives discovery: researchers analyze experiments, develop hypotheses, and design further experiments to test their ideas. We release MicroVQA, a visual question answering (VQA) benchmark to test these three tasks in the context of biological microscopy. Each of the 1,042 samples is created by a biology expert, and transformed into a multiple choice question (MCQ).
| Dataset feature | Value | |
| Total questions | 1,042 | |
| Multi-image questions | 423 | |
| Avg. MCQ question length | 66 | |
| Avg. MCQ answer length | 15 | |
| Avg. raw question length | 158 | |
| Avg. raw answer length | 52 | |
| Unique image sets | 255 | |
| Image Modalities | Light, Fluoro, Electron | |
| Image Scales | Tissue, Cell, Subcell, Atomic | |
| Organisms | 31 | |
| Research areas | 33 | |
| Expert question creators | 12 | |
| Time to create 1 question | 30-40 mins | |
| Time to quality check 1 MCQ | 5 mins |
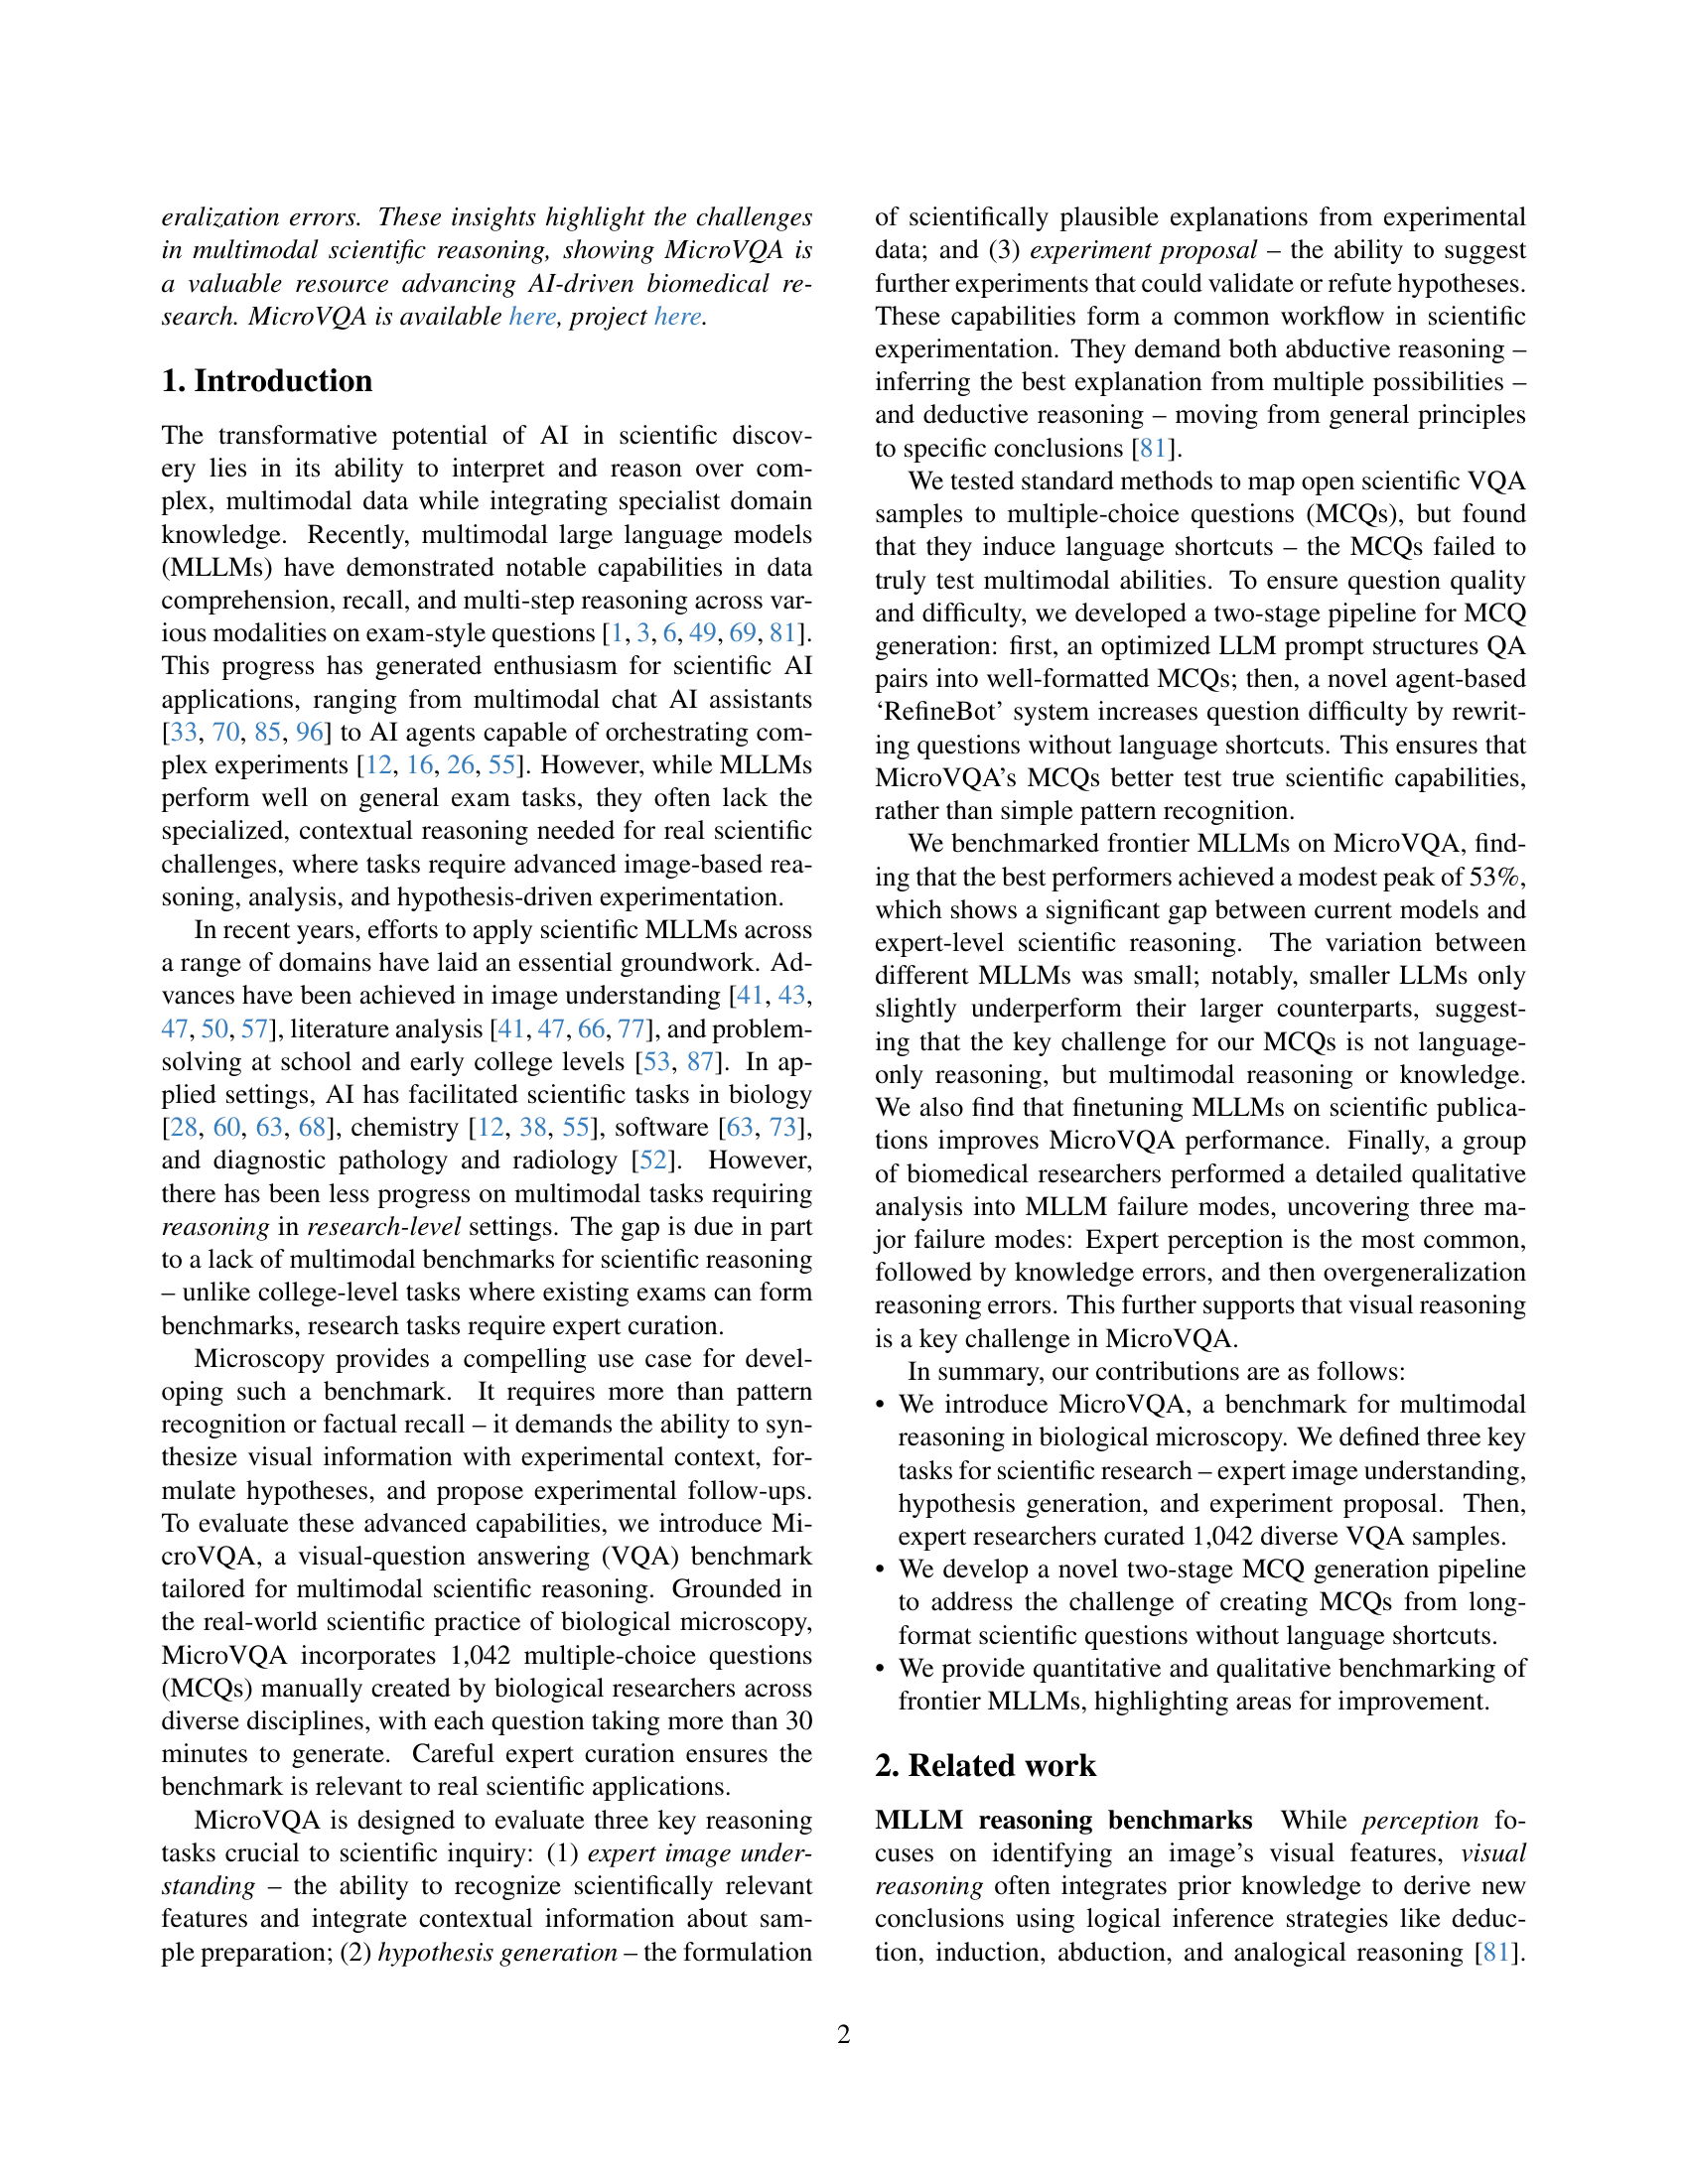
🔼 This table presents a comprehensive overview of the key characteristics and attributes of the MicroVQA benchmark dataset. It details the dataset’s size, question types, image features, and other relevant aspects to provide a clear understanding of its scope and composition.
read the caption
Table 1: MicroVQA benchmark attributes.
In-depth insights#
Multi-VQA task#
The concept of a ‘Multi-VQA task,’ though not explicitly defined in this research paper, is crucial for advancing AI’s understanding of complex scientific data. A Multi-VQA task would involve reasoning across multiple Visual Question Answering scenarios, requiring a model to synthesize information from diverse image modalities and biological contexts. This is particularly relevant in microscopy, where understanding often relies on comparing images, generating hypotheses, and proposing experiments. Such a task necessitates robust multimodal reasoning, integrating expert knowledge, and addressing challenges like language shortcuts and biases. A true Multi-VQA task assesses a model’s ability to generalize scientific principles across different experimental settings, a critical step toward AI-driven scientific discovery.
Microscopy focus#
The paper’s focus on microscopy is evident in the creation of MicroVQA, a VQA benchmark using microscopy images. This choice fills a gap by demanding more than pattern recognition and factual recall as common in existing benchmarks. It compels models to synthesize visual data with experimental context to formulate hypotheses. This focus highlights the unique challenges presented by microscopy, demanding both abductive and deductive reasoning, bridging the gap between college level tasks and research-level scientific investigation. This emphasis makes it a valuable resource for AI-driven biomedical research by pushing for sophisticated multimodal reasoning capabilities.
Expert reasoning#
Expert reasoning is central to the study, as it tests the model’s capacity to go beyond mere image recognition, and delve into hypothesis generation & experiment proposals. The paper assesses three vital capabilities: expert image understanding, hypothesis generation, & experiment proposal, all vital for scientific research. This assessment is done via a dataset with 1,042 questions, crafted by biology experts, transformed into a multiple-choice format. The questions represent true-to-life scientific situations. This analysis method, coupled with expert-created scenarios, highlights the capacity of AI in sophisticated scientific thought beyond basic object identification.
MCQ generation#
The research paper delves into the intricacies of Multiple-Choice Question (MCQ) generation, highlighting its inadequacy with naive methods. Standard approaches fail to truly test multimodal abilities, often resulting in language shortcuts that allow models to answer without genuine understanding. To combat this, the paper introduces a two-stage pipeline. Initial LLM prompts structure question-answer pairs, followed by an agent-based refinement bot to remove shortcuts and enhance difficulty. This innovative approach ensures questions are vision-centric, promoting a more accurate assessment of multimodal reasoning. The development and application of RefineBot represents a significant step toward creating robust and reliable MCQs that effectively evaluate model capabilities. A key factor is creating quality distractors, making sure that generated distractors are vision-centric. By testing state-of-the-art MLLMs (Multimodal Large Language Models) on the generated data-set it ensures question qualities and difficulties, and at the same time, makes the models more robust.
No shortcuts#
The research paper addresses the challenge of language shortcuts in visual question answering (VQA), where models can answer correctly without truly understanding the image. The authors acknowledge that standard methods for generating multiple-choice questions (MCQs) often fail to adequately test multimodal reasoning, as models can exploit language-based cues instead of relying on visual information. To address this, they introduce a two-stage pipeline for MCQ generation: First, they use an optimized LLM prompt to structure question-answer pairs into well-formatted MCQs. Second, they employ an agent-based ‘RefineBot’ to rewrite questions and distractors, aiming to remove language shortcuts and increase the difficulty of the MCQs. The effectiveness of RefineBot is evaluated in the experiments section, which highlights the significant drop in performance by the models after it is used, demonstrating that the models can perform only if the prompt lacks shortcuts.
Visual key#
The document leverages visual keys like microscopy images to drive scientific research. Visual keys encompass expert understanding of images, hypothesis generation based on observations, and experimental proposals for validation. MicroVQA benchmark curated by experts targets these skills, ensuring high scientific relevance. The goal is to assesses model’s reasoning vital in research workflows like image understanding, hypothesis generation, and proposing experiments for better analysis in science.
Domain limits#
The discussion of domain limits acknowledges that while MicroVQA strives for broad coverage within microscopy, practical constraints exist due to expert specialization. This means certain modalities, like Raman spectroscopy, are less represented. Focus on human-relevant samples (human, mouse) further defines the domain, with fewer examples from other organisms. This trade-off between breadth and depth is recognized, and the framework’s adaptability to other biomedical imaging fields or even ecology is suggested, highlighting the potential for future expansion while also showcasing current constraint.
More visual insights#
More on figures

🔼 This figure presents a taxonomy that organizes the subtasks within the MicroVQA benchmark into three main categories: expert visual understanding, hypothesis generation, and experimental proposal. Each category is further divided into more specific subtasks to comprehensively evaluate the different aspects of scientific reasoning involved in microscopy-based biological research. Expert visual understanding tasks include comparing image sets, identifying abnormalities, and more. Hypothesis generation tasks involve exploring causal mechanisms and functional implications. Finally, experimental proposal tasks focus on suggesting new experiments or addressing technical issues.
read the caption
Figure 2: MicroVQA taxonomy of sub-tasks.

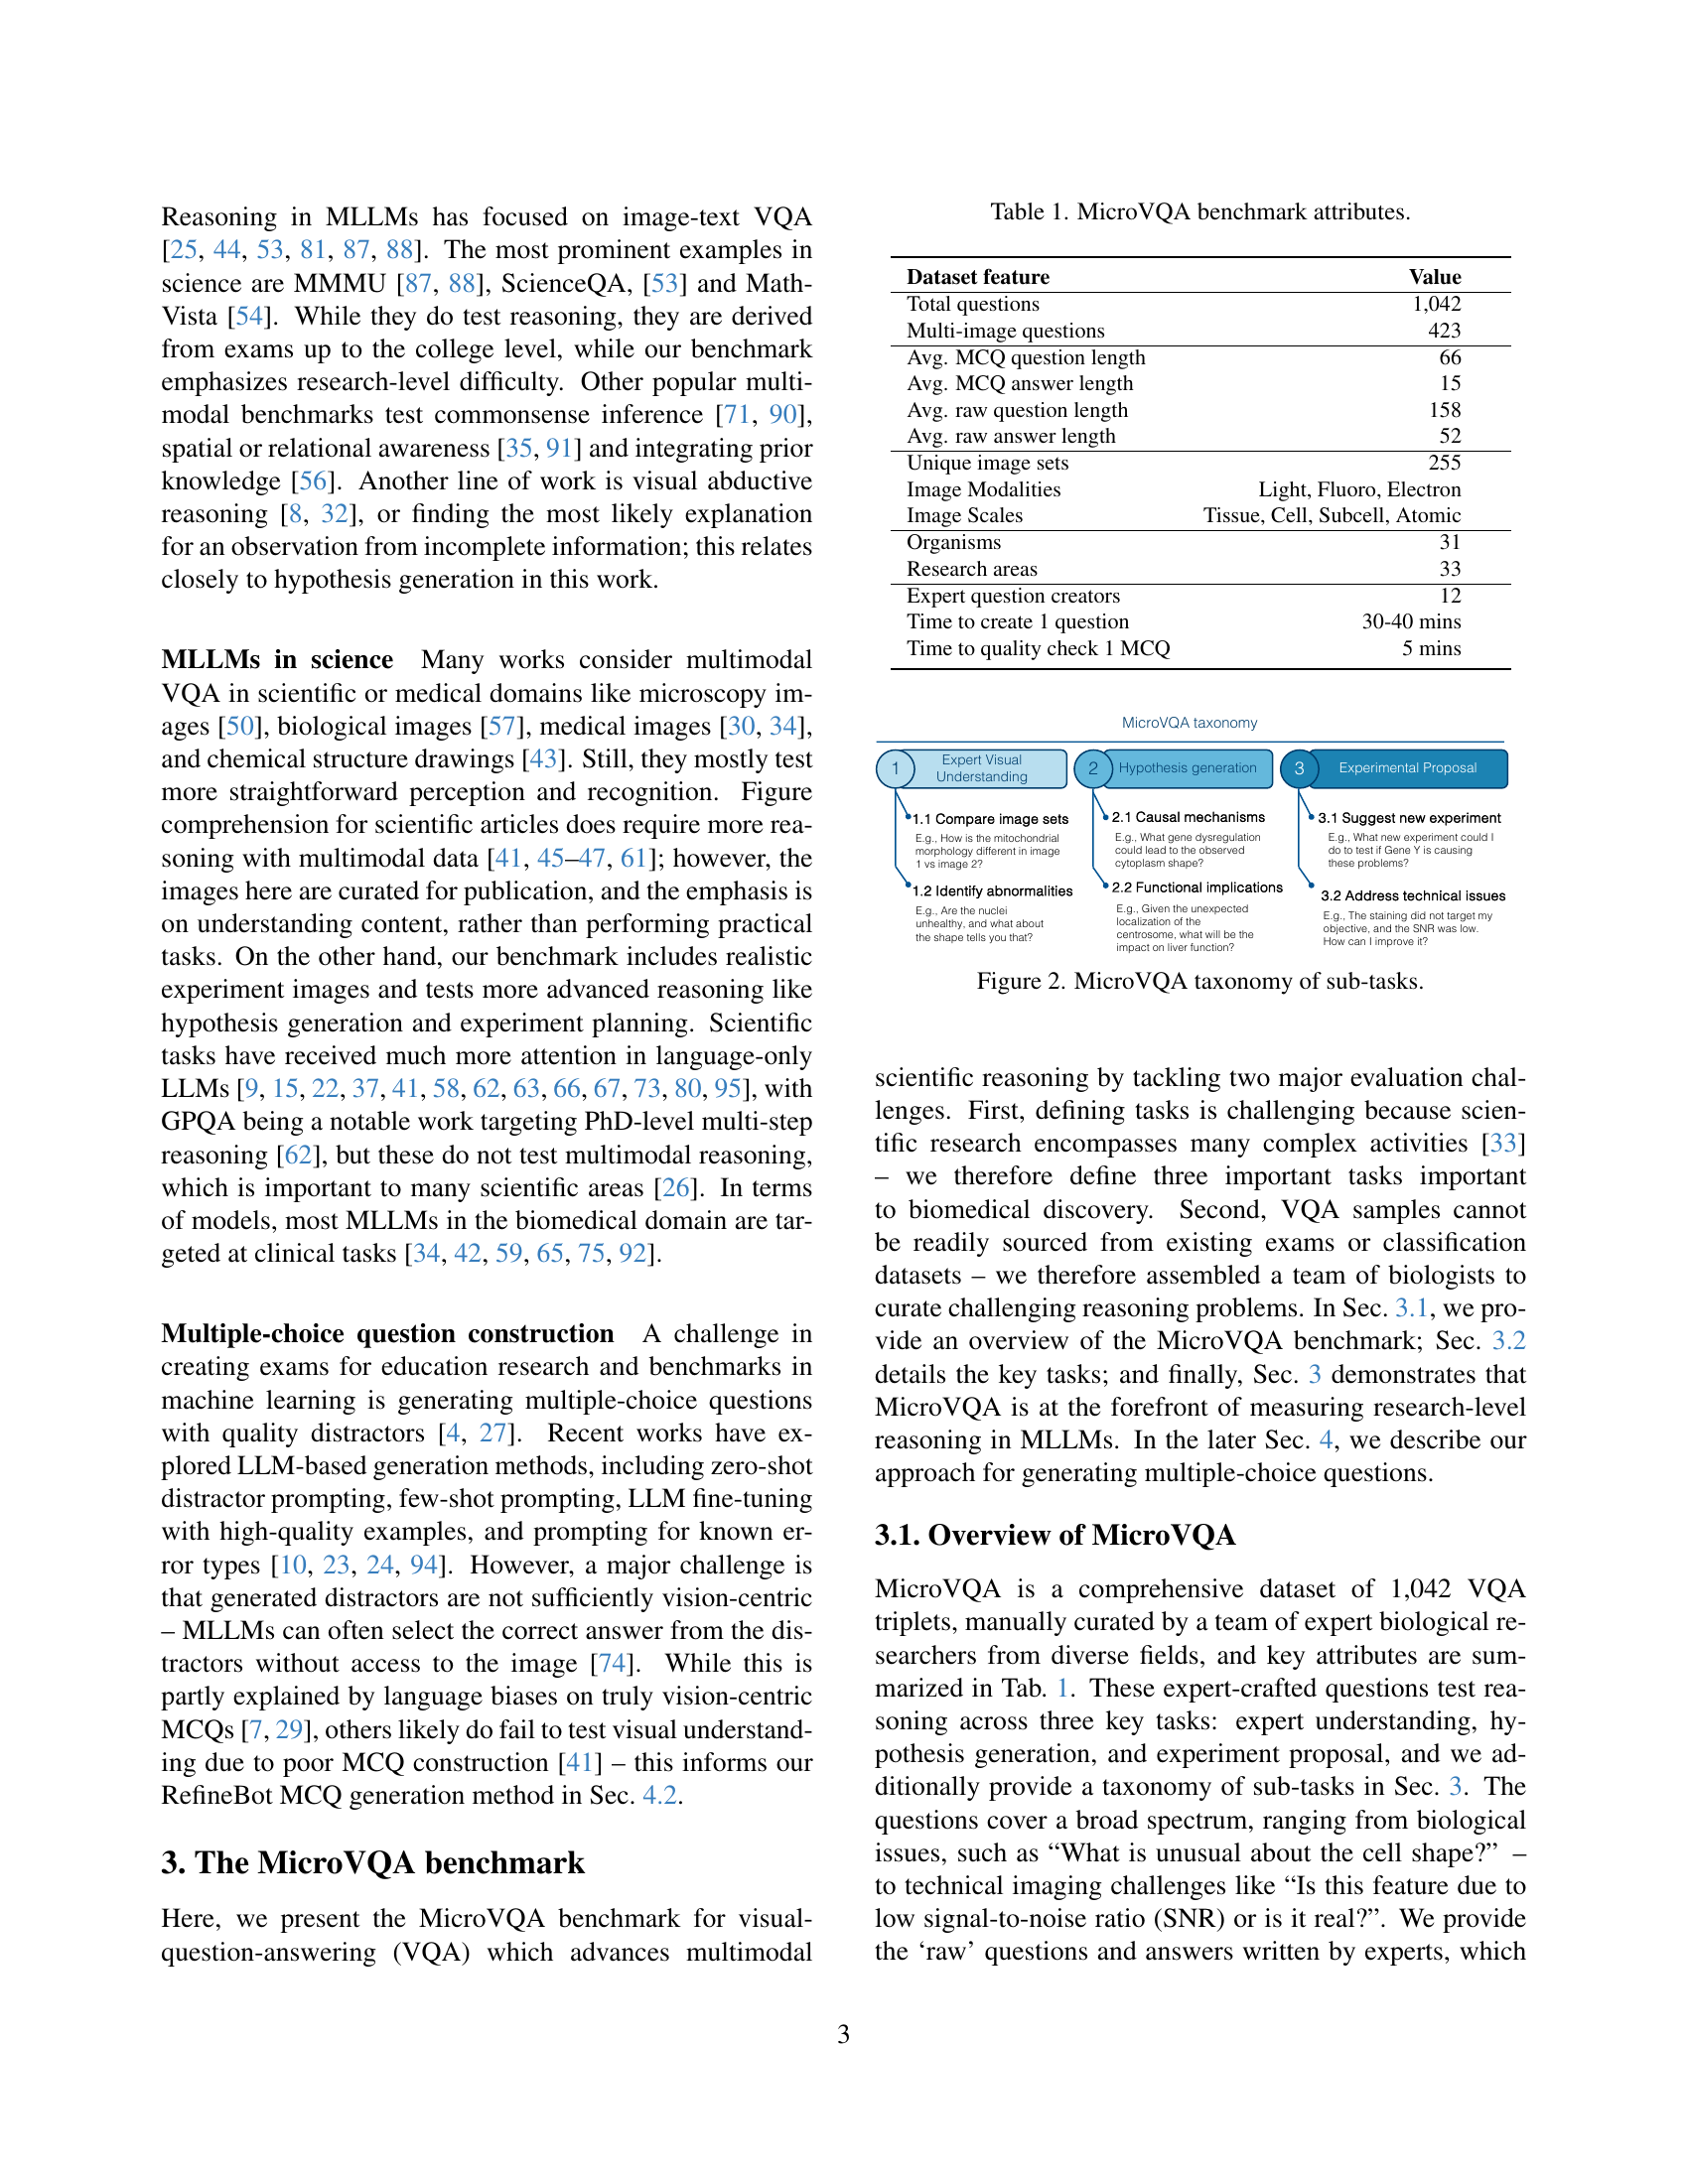
🔼 Figure 3 is a bar chart comparing the distribution of Bloom’s taxonomy levels across several scientific multimodal large language model (MLLM) benchmarks. Bloom’s taxonomy categorizes cognitive skills from simple recall to complex evaluation. The chart shows that MicroVQA, the benchmark introduced in this paper, has a higher proportion of questions at the higher cognitive levels (analysis, application, evaluation) compared to other benchmarks like MMMU and ScienceQA. These other benchmarks tend to have a greater proportion of questions at the lower levels (recall, comprehension), reflecting a focus on simpler tasks. Benchmarks focusing primarily on perception, such as OmniMedVQA, also show a concentration of questions at the lower levels. This figure highlights that MicroVQA is designed to assess more advanced reasoning capabilities than many existing benchmarks.
read the caption
Figure 3: Composition of scientific MLLM benchmarks regarding estimated Bloom’s taxonomy [11]. Higher levels are more cognitively challenging. MicroVQA has more questions at higher levels compared to other benchmarks, for example, MMMU [87] and ScienceQA [53], while perception-driven medical benchmarks like OmniMedVQA are at lower levels.

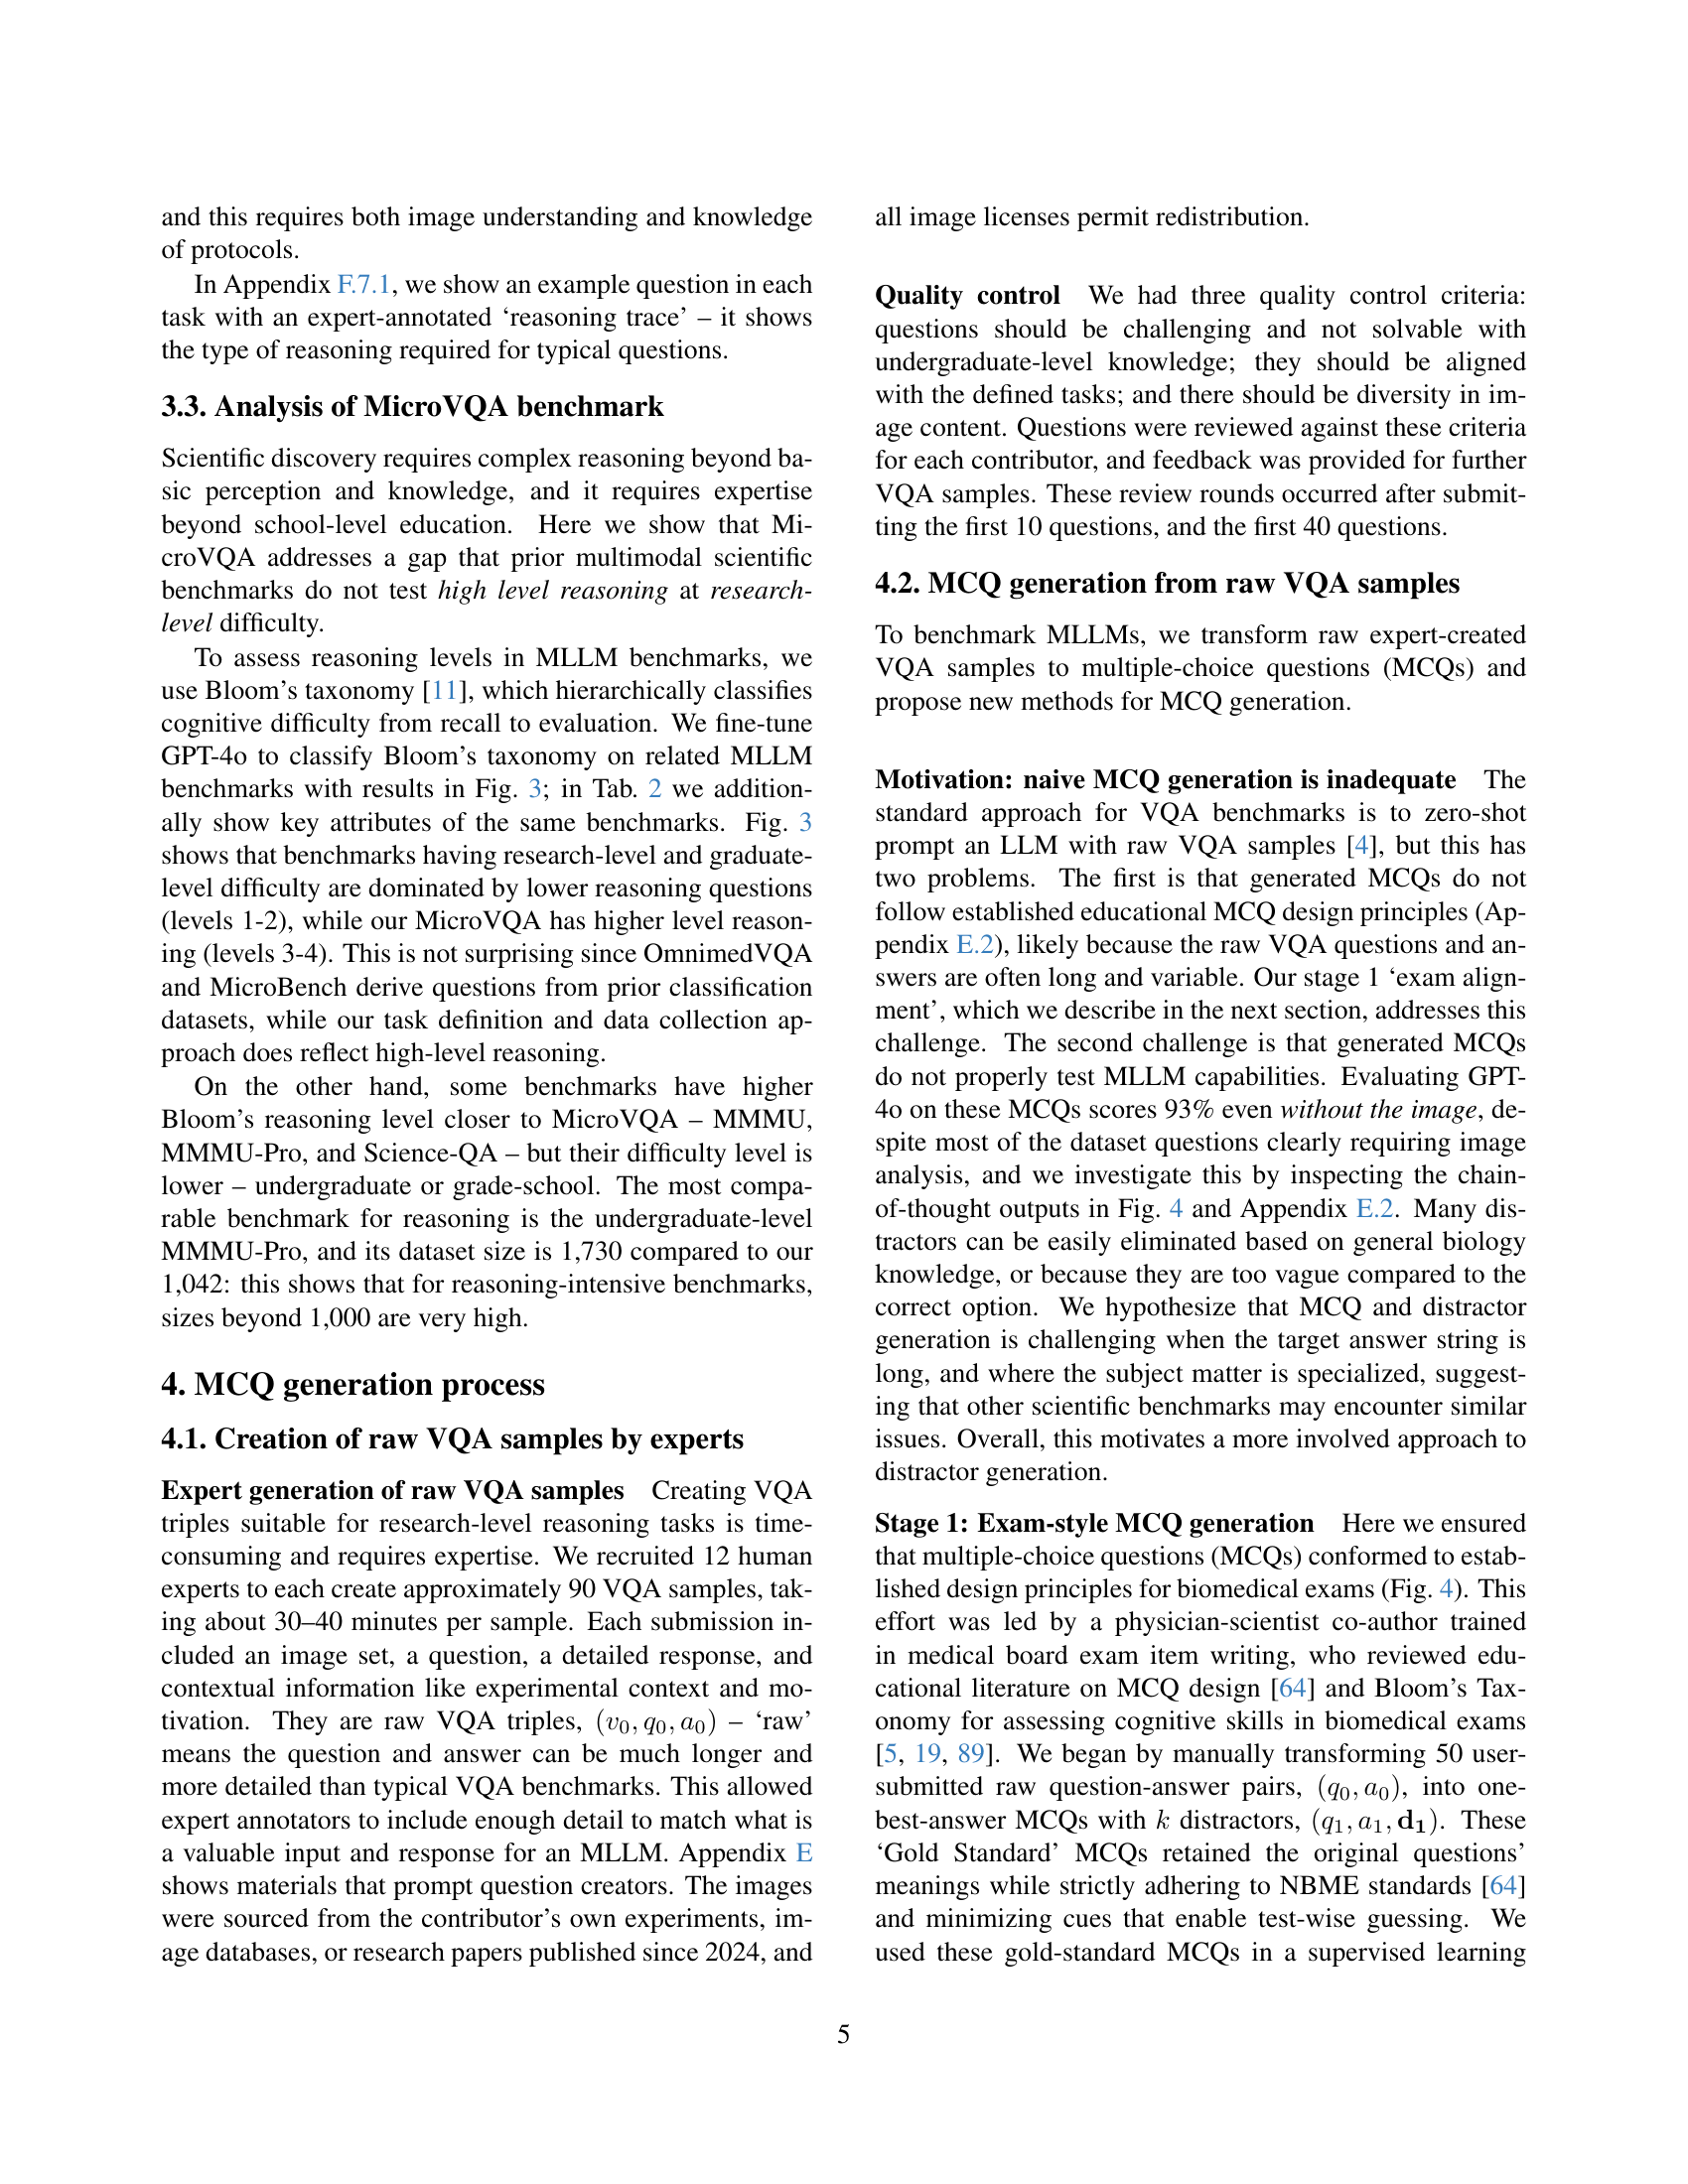
🔼 This figure illustrates the three-stage process of generating multiple-choice questions (MCQs) for the MicroVQA benchmark. Stage 0 involves defining the tasks and creating 1061 raw visual question answering (VQA) samples with the help of biology experts. In Stage 1, these raw VQA samples are transformed into exam-style MCQs. This is done by manually converting a subset of samples and then optimizing an LLM prompt to automatically convert the remaining samples. Finally, in Stage 2, the MCQs are further refined using the RefineBot, an iterative method that increases question difficulty and removes language shortcuts that could allow models to answer without true multi-modal reasoning. The lower panel provides a detailed example illustrating the changes made during the refinement process, highlighting improvements (green) and issues (red) that are further discussed in Section E.2 of the paper.
read the caption
Figure 4: Constructing the MicroVQA multiple choice questions. (0) We defined tasks with domain biological scientists and created 1,061 raw VQA samples. (1) The raw samples were aligned to an exam-style MCQ by manually transforming a small set and optimizing an LLM prompt to match that alignment. (2) MCQs are further improved using RefineBot, a new iterative method to make MCQs more challenging. The lower panel shows an example MCQ from raw VQA to final: the annotations highlight key changes that we further explore in Sec. E.2, where red indicates issues, and green indicates good attributes.

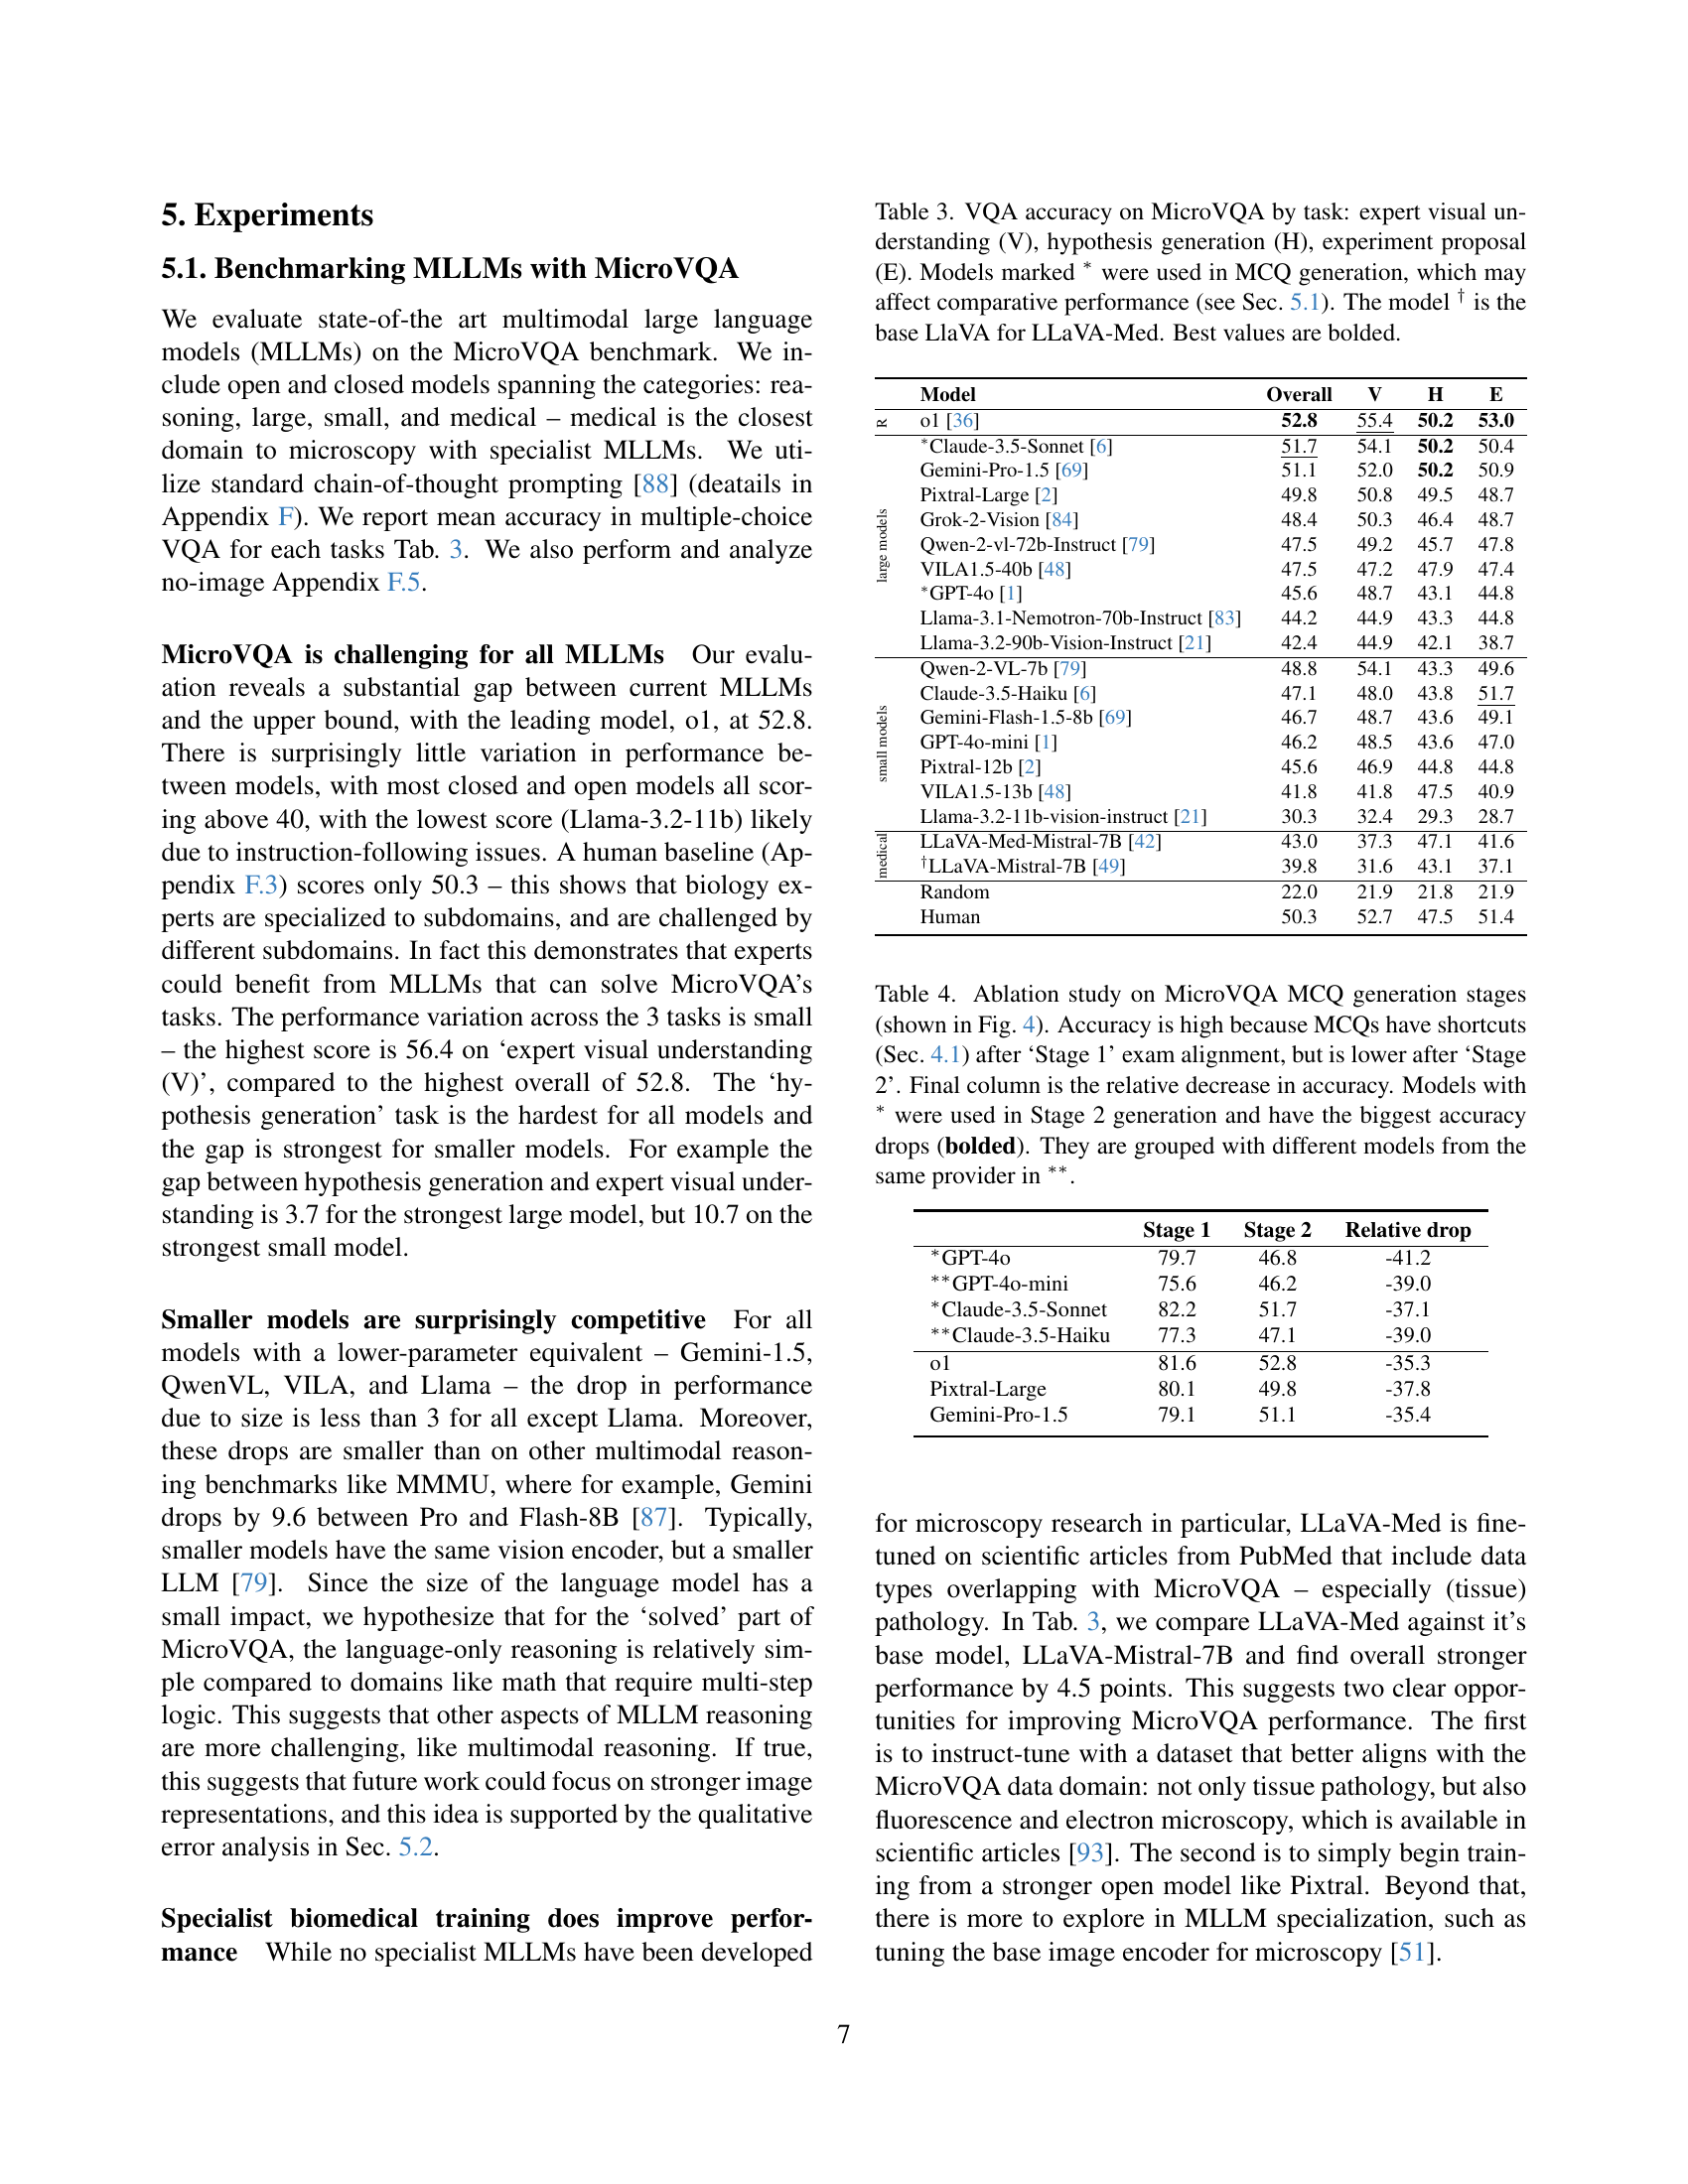
🔼 This figure presents a detailed breakdown of the performance of three state-of-the-art large language models (LLMs) across various subtasks and Bloom’s taxonomy levels within the MicroVQA benchmark. The subtasks, representing different aspects of scientific reasoning, include comparing image sets, identifying abnormalities, proposing causal mechanisms, exploring functional implications, suggesting new experiments, and addressing technical issues. The Bloom’s taxonomy levels reflect the cognitive complexity of each task, ranging from simple recall to complex evaluation. The models analyzed are Gemini-1.5-Pro (closed-source), VILA1.5-40B (open-source), and LlaVA-Med-Mistral-7B (a medical-specialized model). By visualizing performance across these dimensions, Figure 5 provides key insights into the strengths and weaknesses of each model in tackling various aspects of multimodal scientific reasoning.
read the caption
Figure 5: Performance by sub-task and Bloom’s level for best models: Gemini-1.5-Pro (closed source), VILA1.5-40B (open-source), and LlaVA-Med-Mistral-7B (medical).

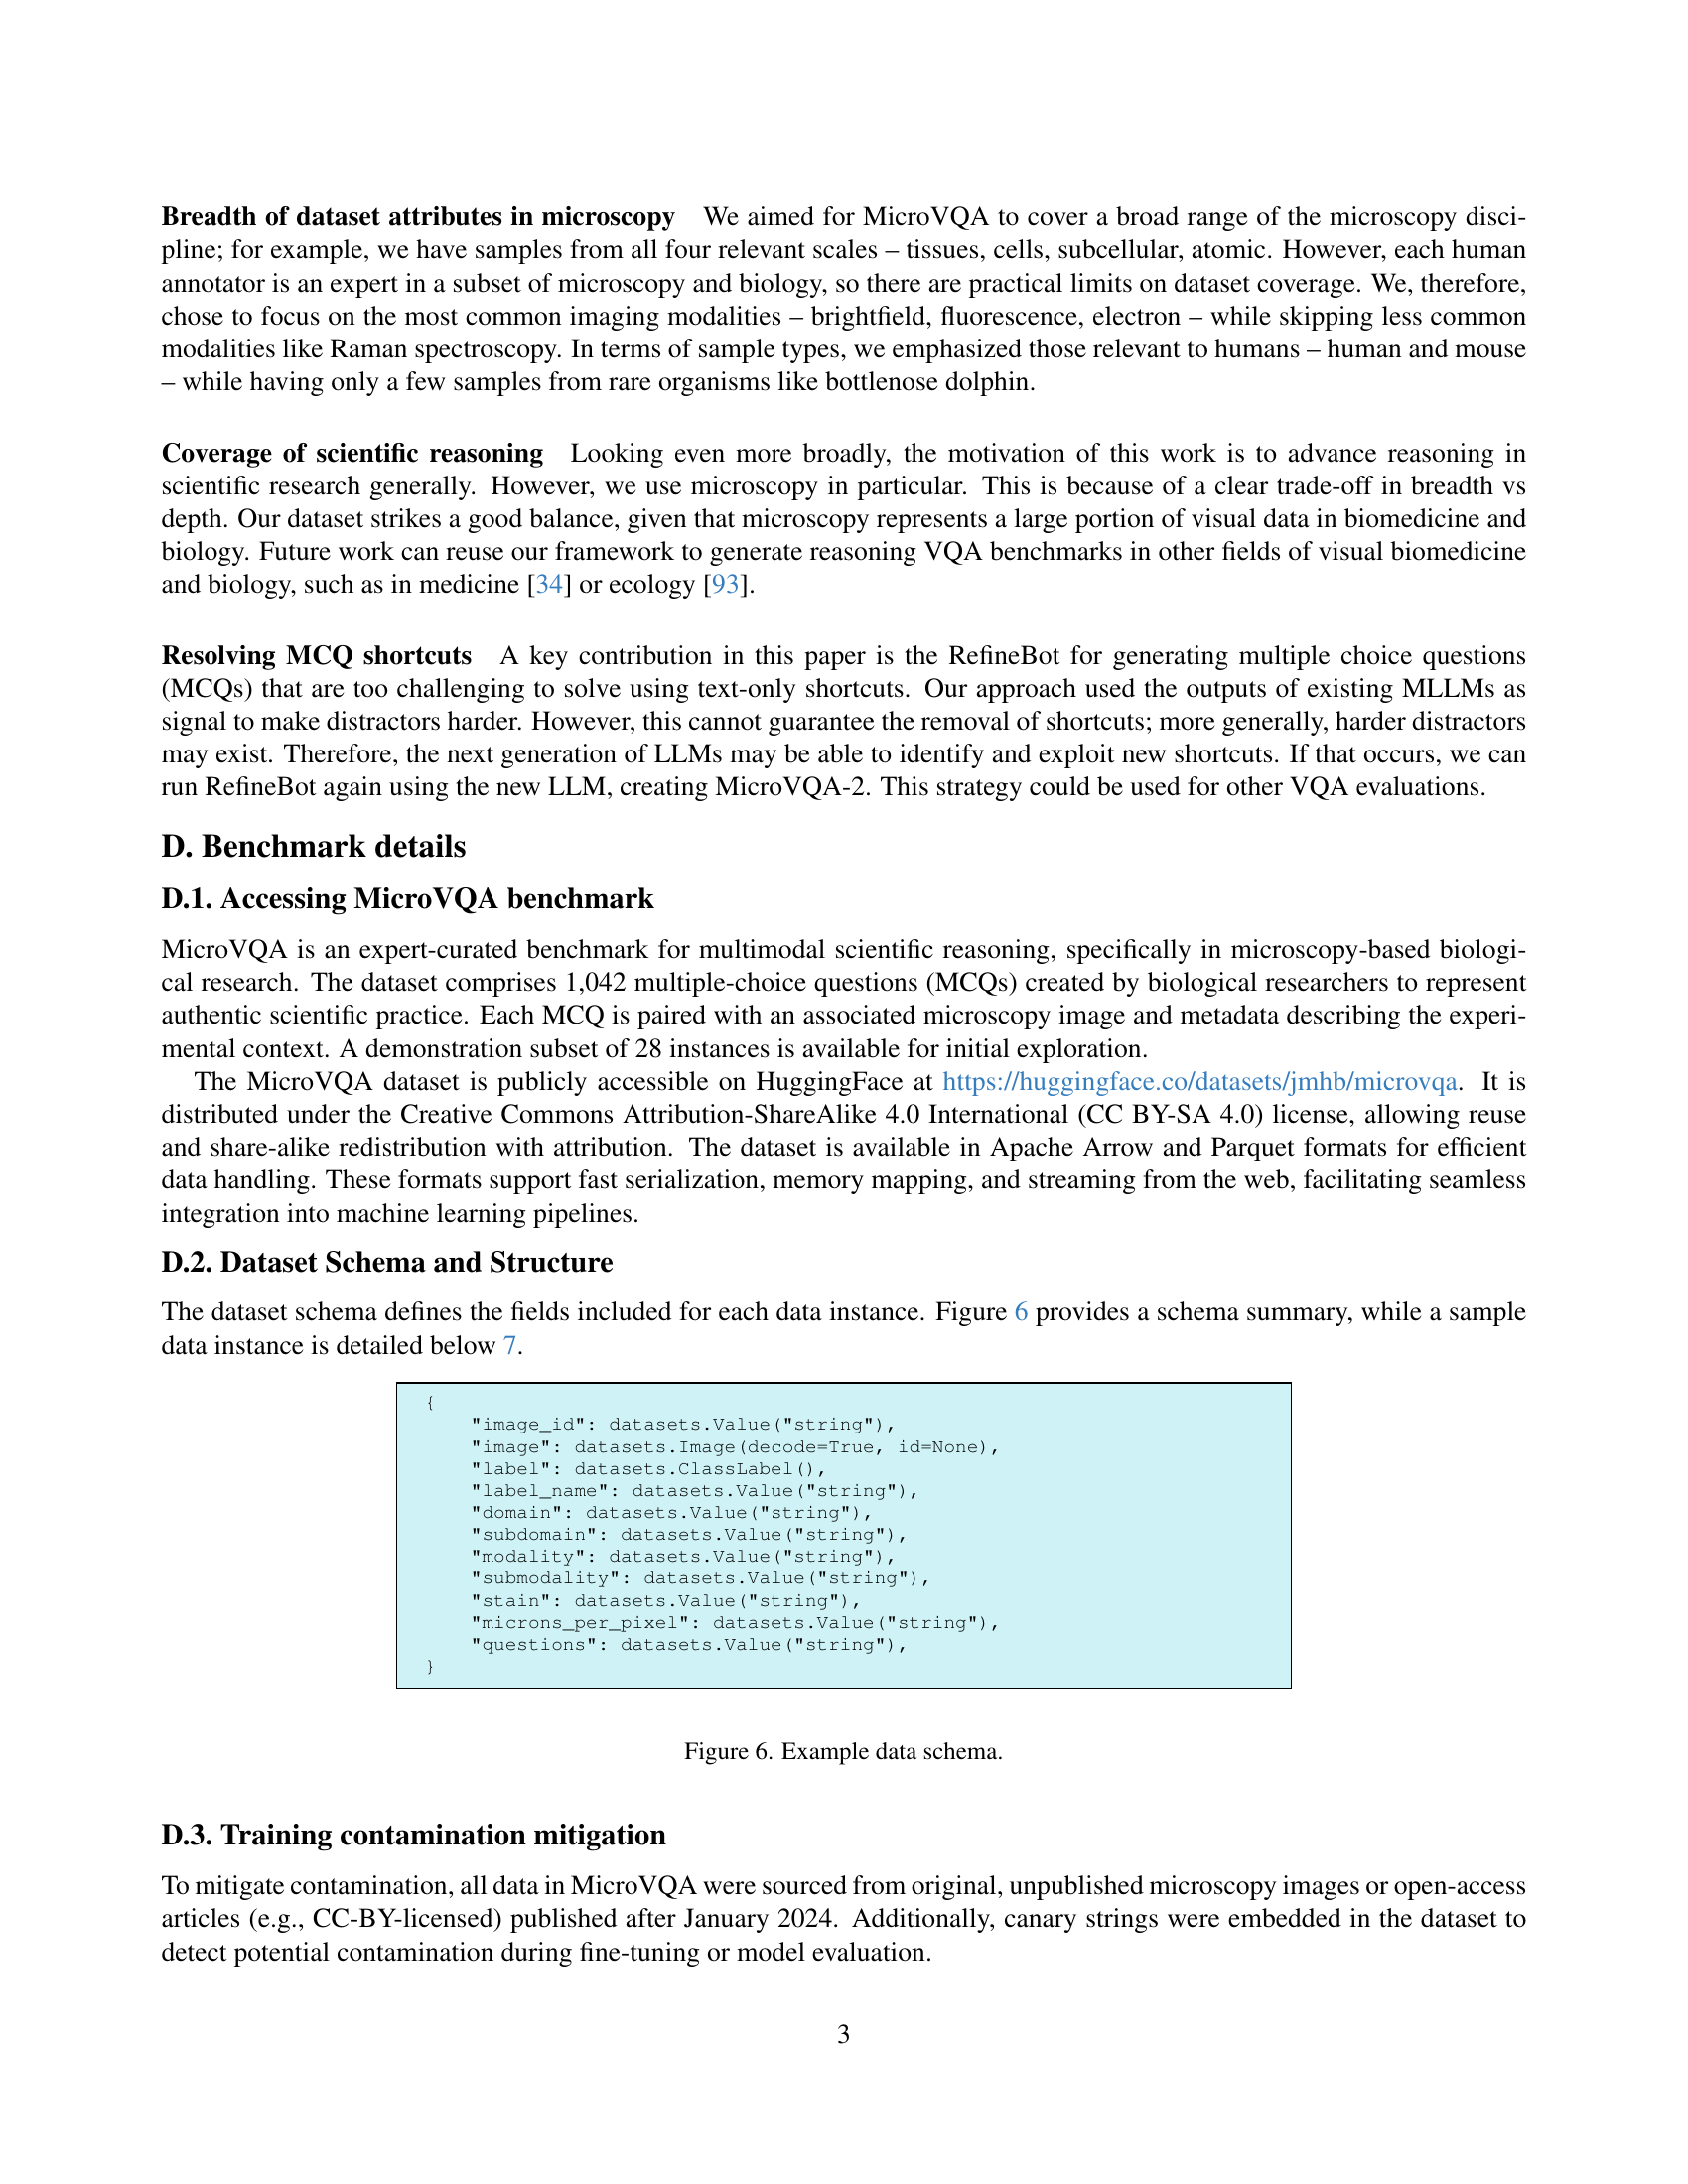
🔼 The figure displays the schema of the MicroVQA dataset. It shows the various fields and data types associated with each data point. The fields include identifiers (image_id), the image data itself, labels, label names, domain and subdomain information, imaging modalities and submodalities, stain type, microns per pixel resolution, and the questions and answers associated with the image. This provides a comprehensive overview of the structure of the dataset, illustrating how diverse data (images, text, metadata) is organized to capture the multifaceted nature of scientific visual question answering.
read the caption
Figure 6: Example data schema.

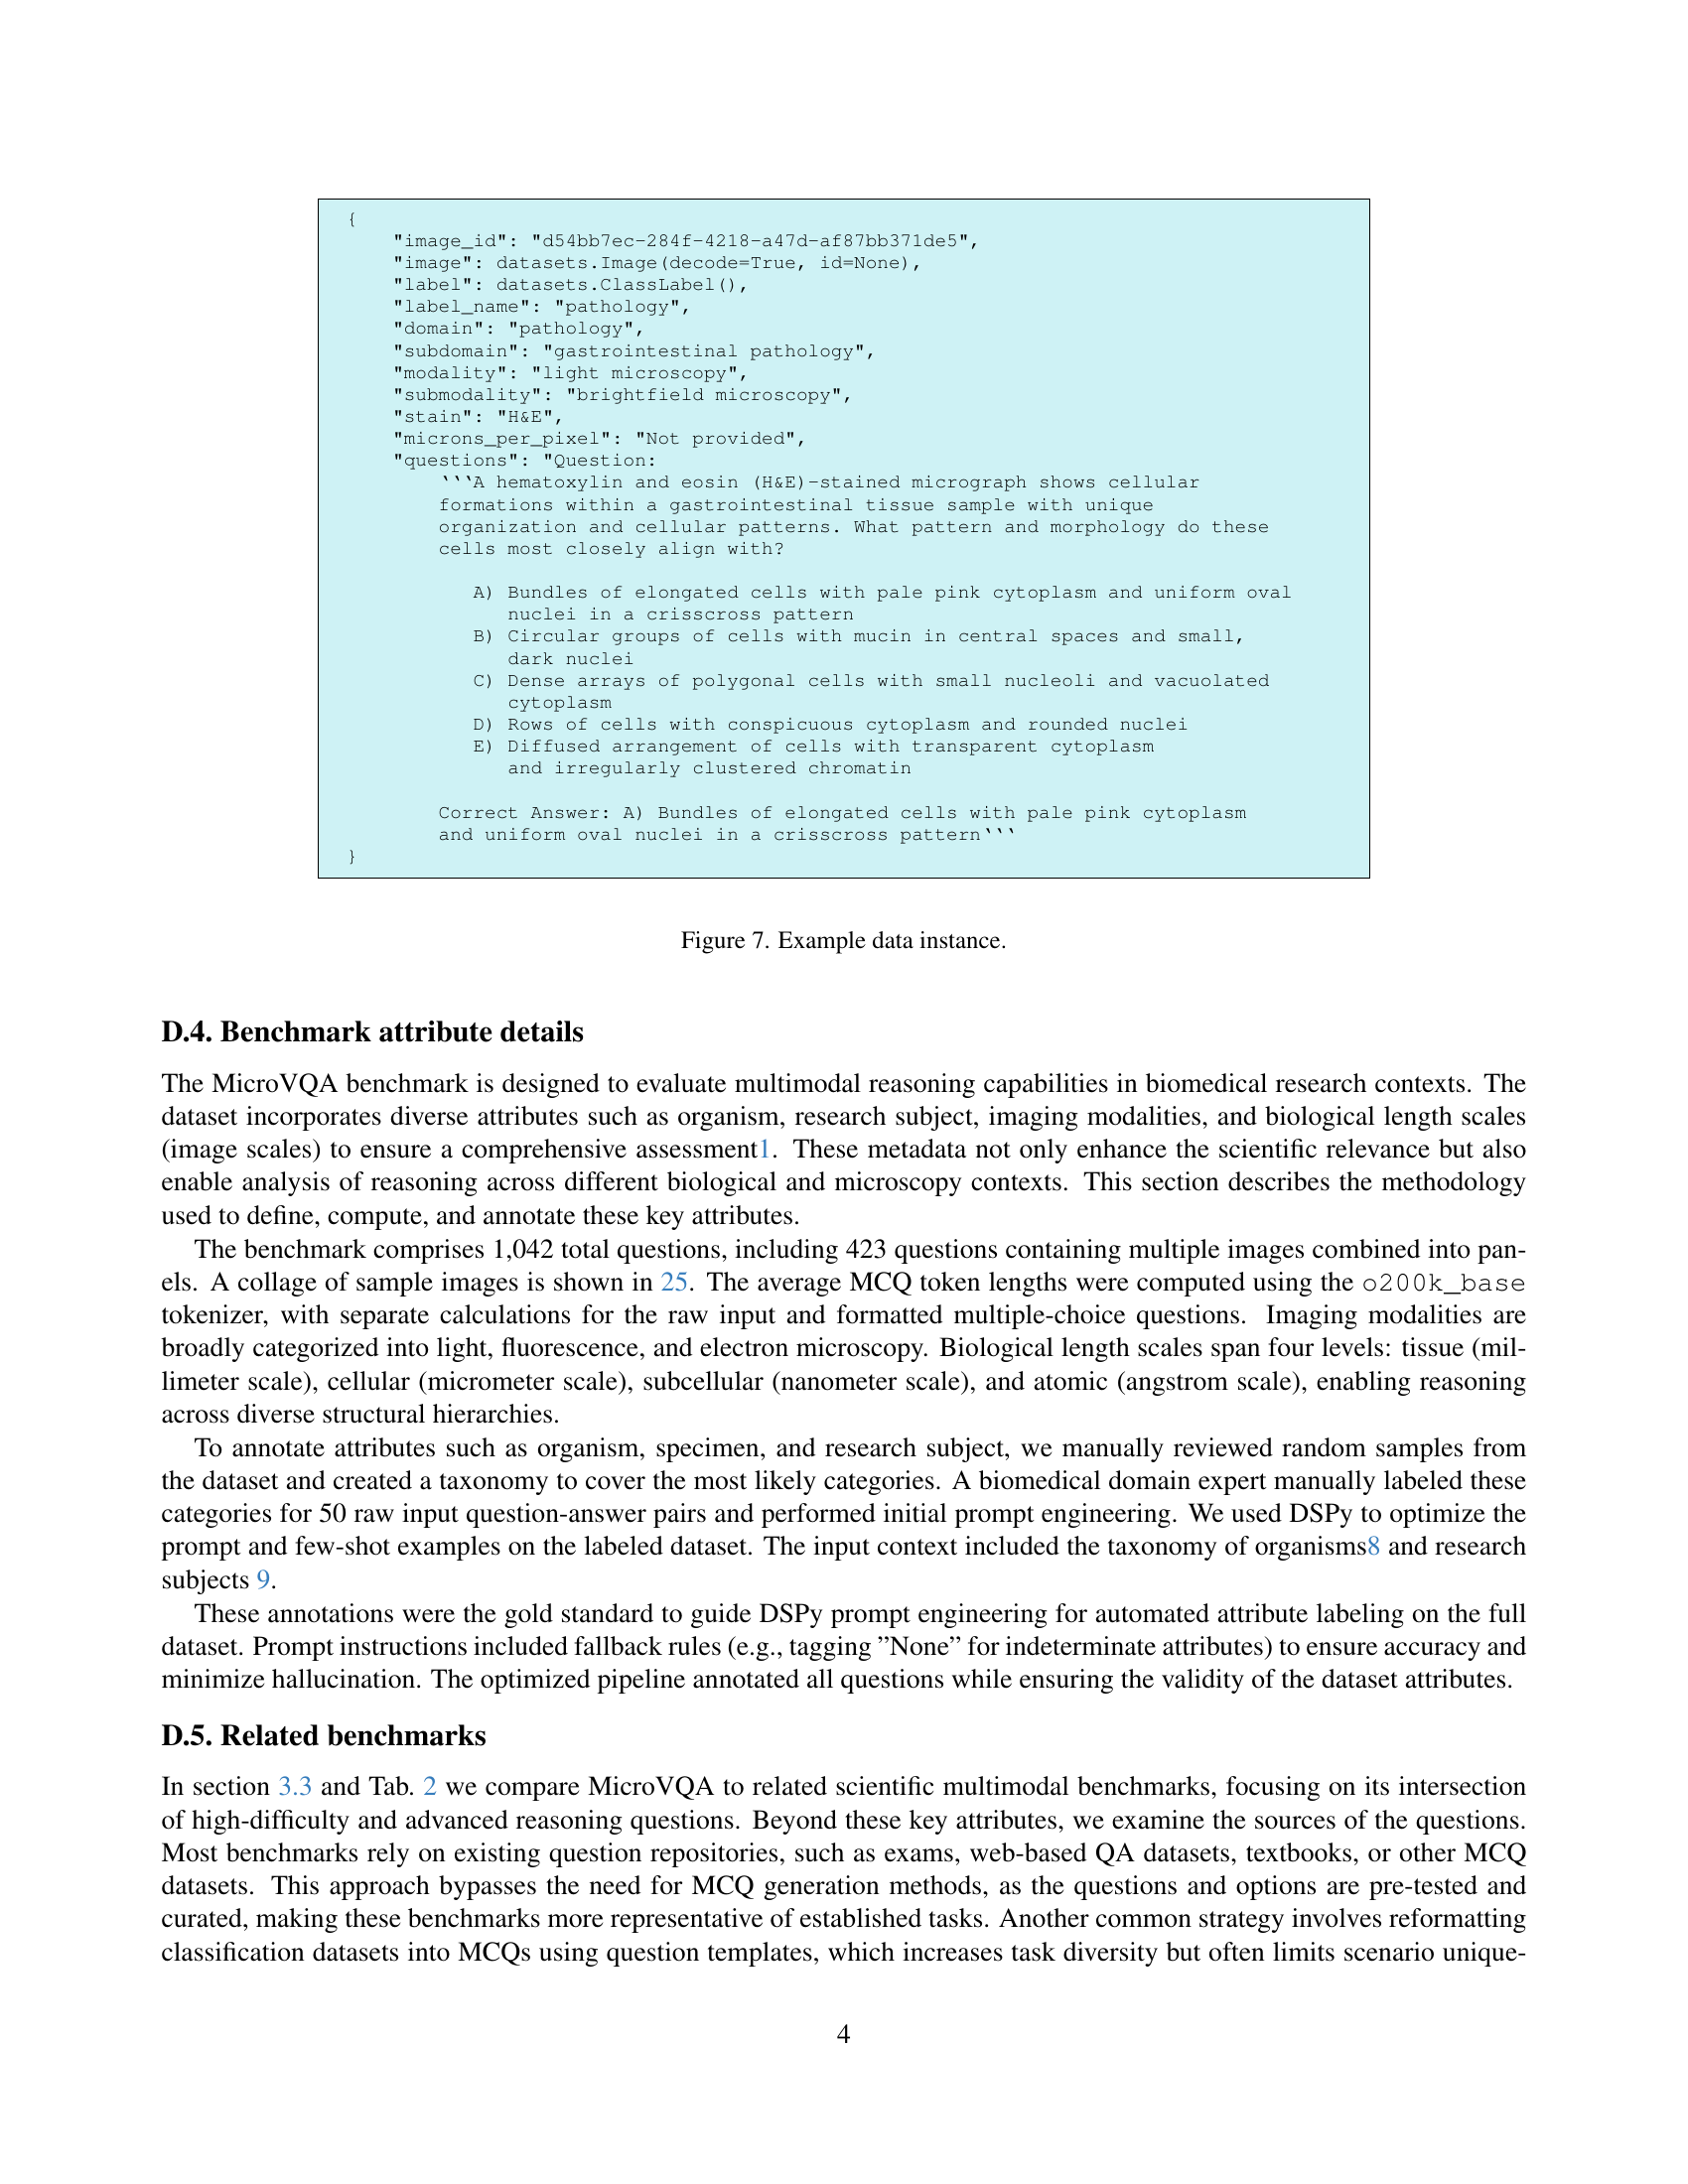
🔼 This figure displays an example of the data schema used in the MicroVQA benchmark. The schema includes fields such as image ID, image data, label, label name (e.g., pathology), domain, subdomain (e.g., gastrointestinal pathology), modality (e.g., light microscopy), submodality (e.g., brightfield microscopy), stain type (e.g., H&E), microns per pixel, question text, and the correct answer. The question text includes the prompt to be answered and the multiple choice options, along with the correct answer.
read the caption
Figure 7: Example data instance.

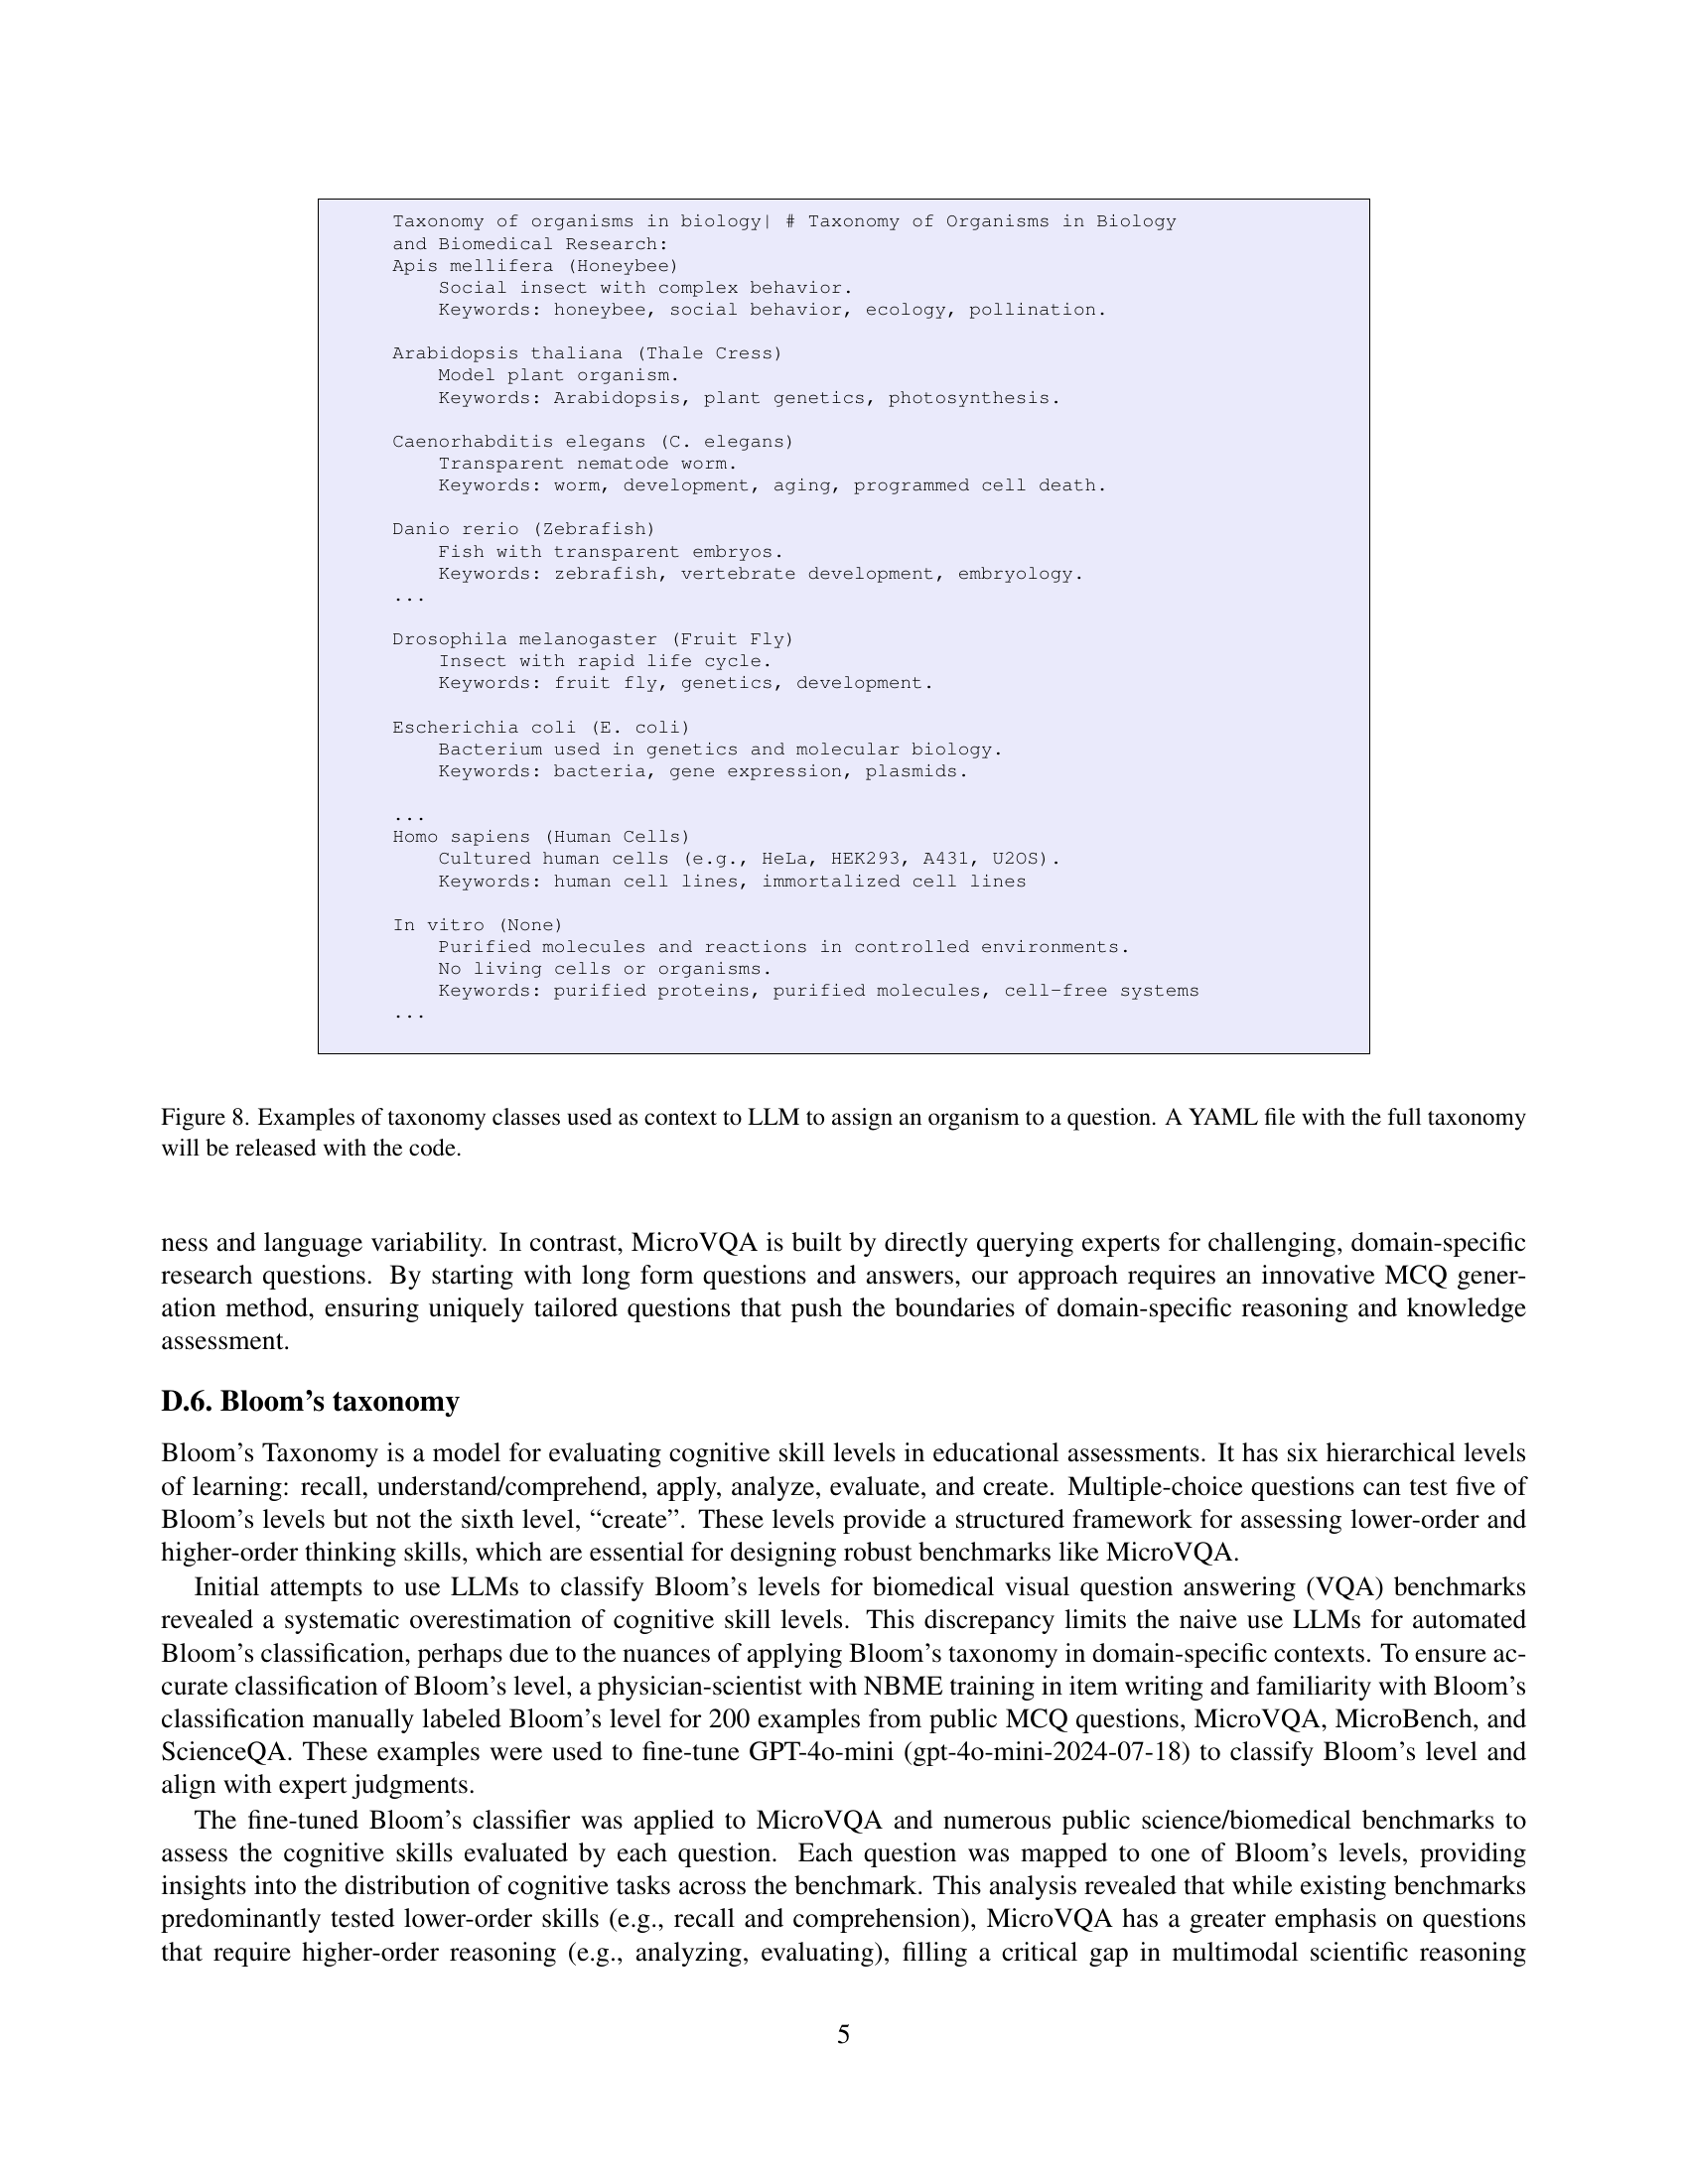
🔼 Figure 8 shows examples of how taxonomy classes are used as context for LLMs to assign organisms to questions in the MicroVQA benchmark. The full taxonomy, in YAML format, will be made available with the code release. This is important because it provides additional context for the LLMs to understand the questions and select the correct answer, which is particularly important in the scientific domain where specialized knowledge is needed.
read the caption
Figure 8: Examples of taxonomy classes used as context to LLM to assign an organism to a question. A YAML file with the full taxonomy will be released with the code.

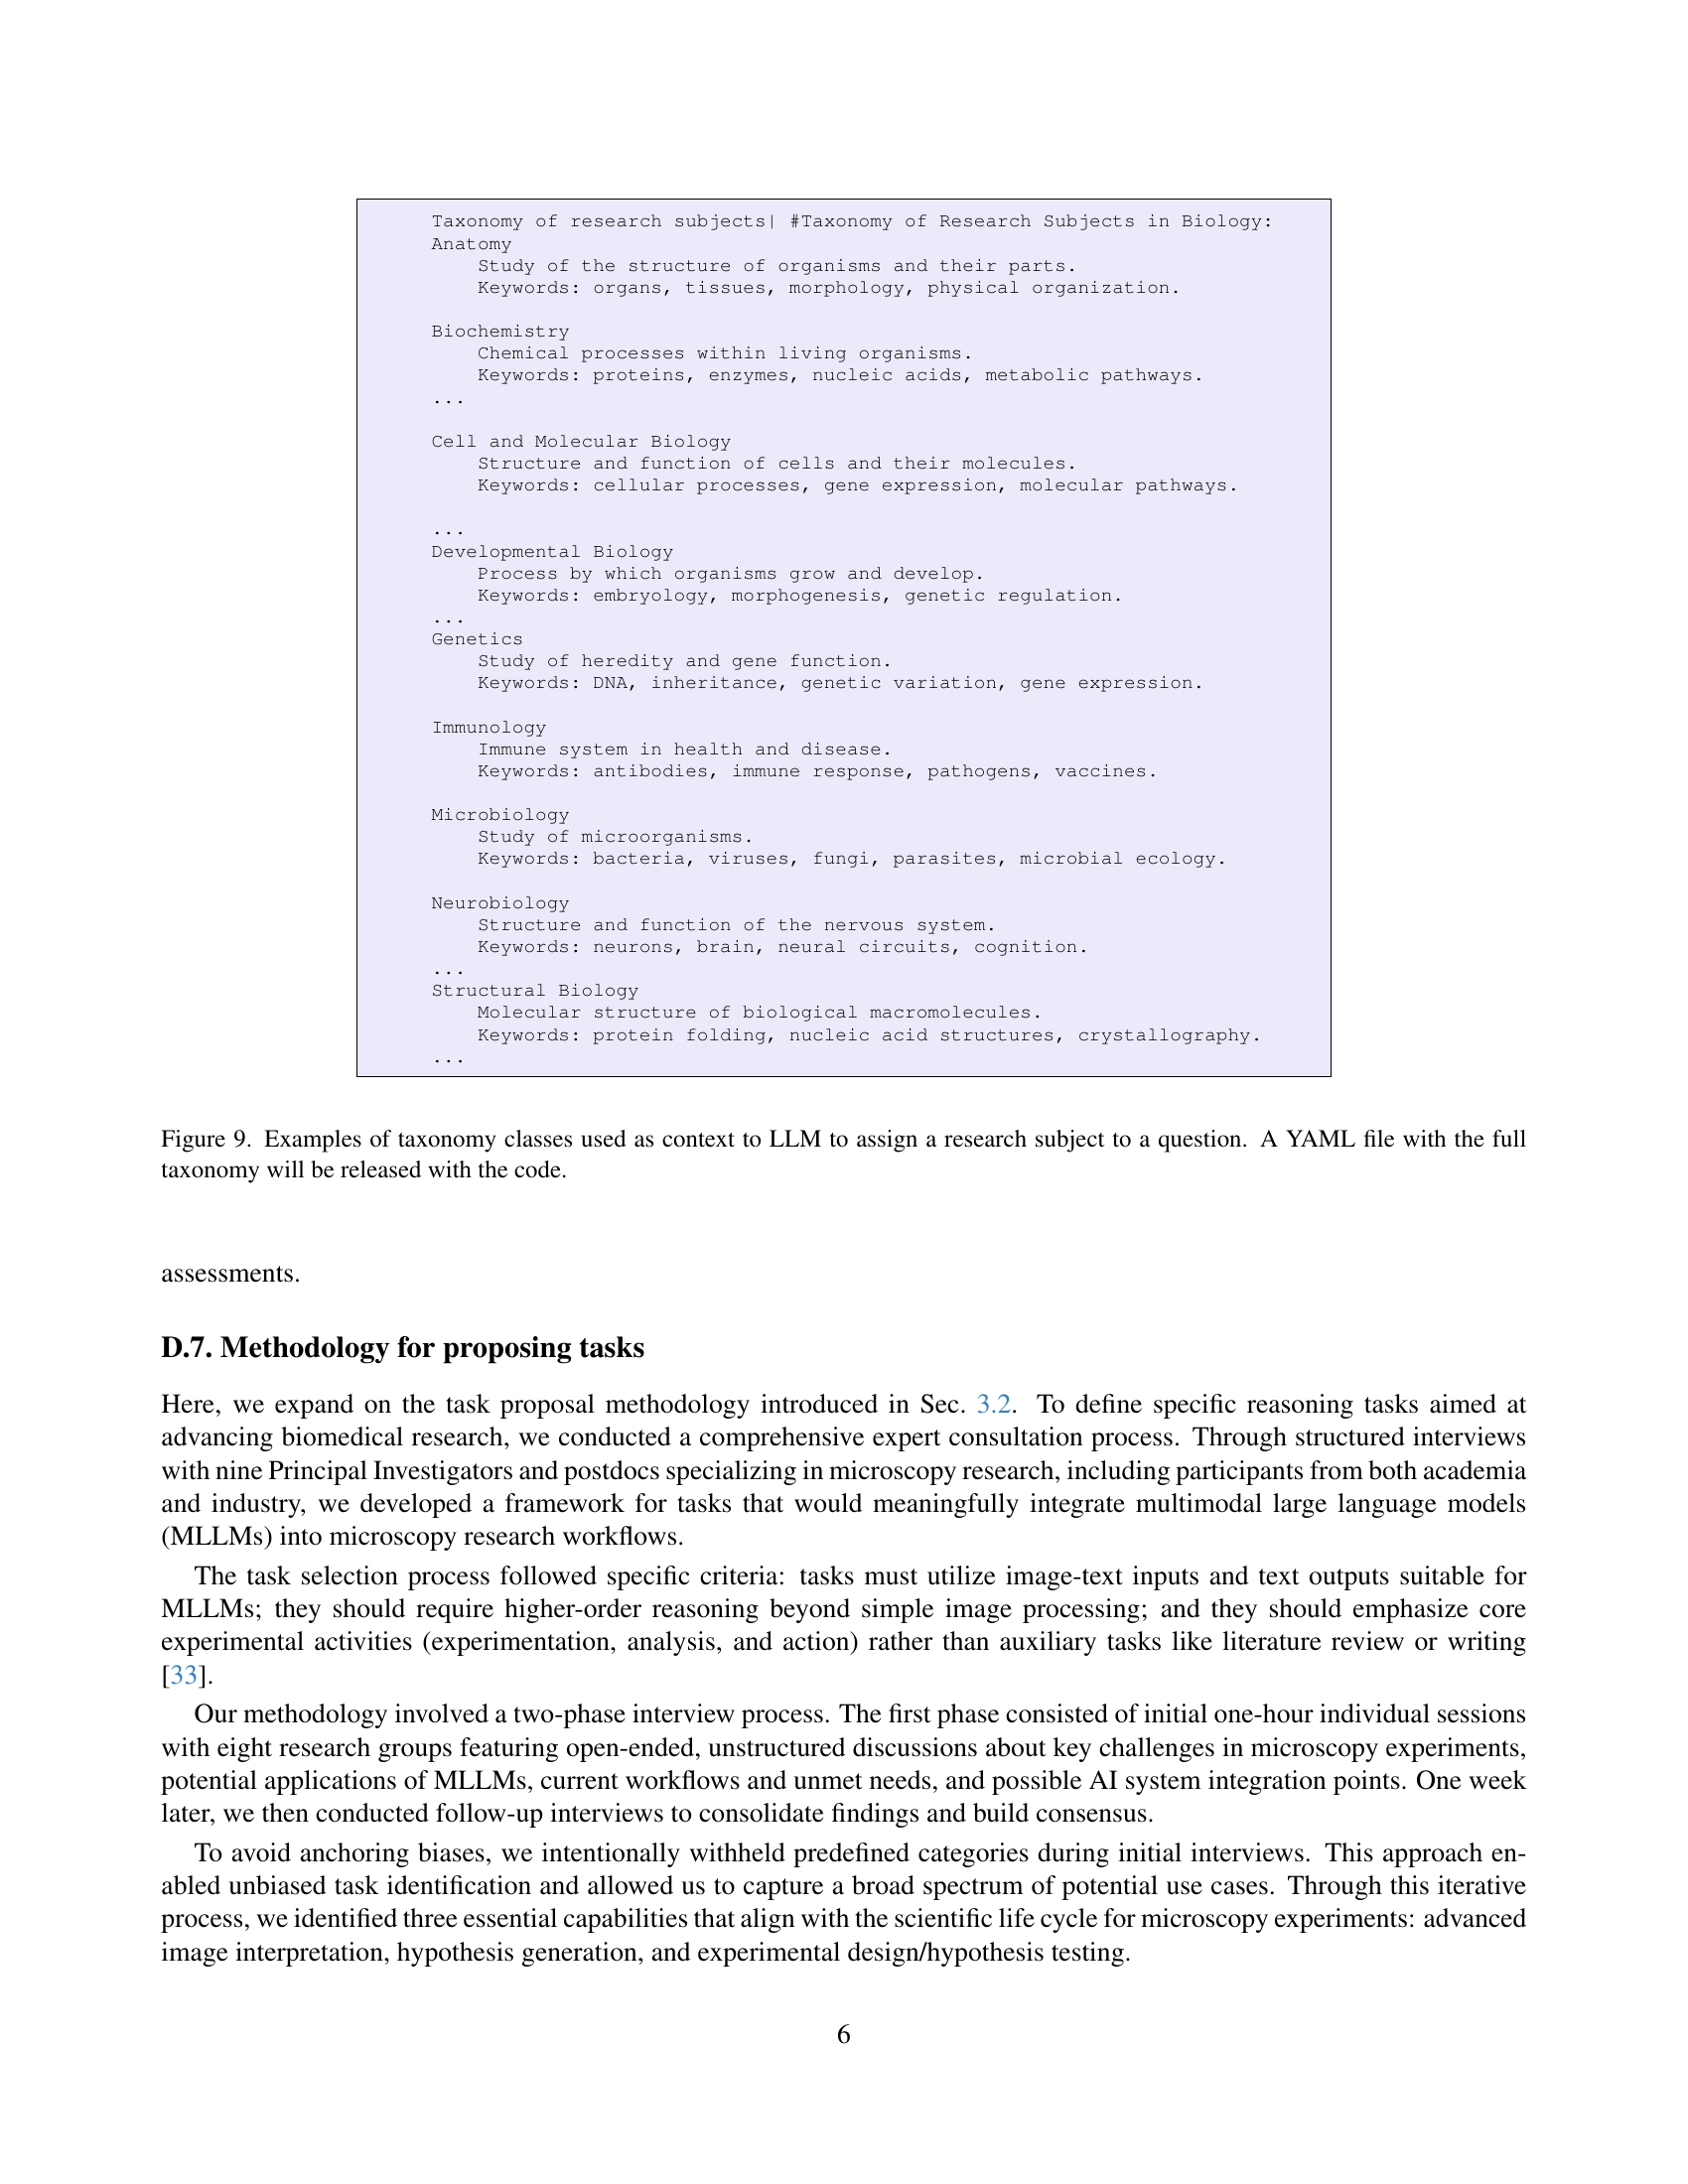
🔼 This figure shows examples of the taxonomy classes used to provide context to a large language model (LLM) when assigning a research subject to a question within the MicroVQA benchmark. The full taxonomy, in YAML format, will be available alongside the code release. The taxonomy helps ensure that the LLMs receive sufficient contextual information for accurate and nuanced reasoning in scientific contexts. Each example shows a category within the taxonomy (e.g., ‘Anatomy,’ ‘Biochemistry’) and then lists some relevant keywords.
read the caption
Figure 9: Examples of taxonomy classes used as context to LLM to assign a research subject to a question. A YAML file with the full taxonomy will be released with the code.

🔼 Figure 10 illustrates three common ways that large language models (LLMs) can ‘cheat’ on visual question answering (VQA) tasks by relying on textual information rather than visual reasoning. The example questions all relate to a fluorescence microscopy image stained with TOMM20, a marker for mitochondria. Shortcut 1 demonstrates a ‘visual giveaway,’ where the question itself provides enough information to answer the question without needing to analyze the image. Shortcut 2 shows ‘weak distractors,’ where the incorrect answer options are implausible or easily eliminated based on general knowledge. Finally, shortcut 3 highlights ’language bias,’ where the question wording or context makes one answer more likely than others, irrespective of the visual data.
read the caption
Figure 10: Three types of language shortcut relevant to MicroVQA. The target VQA has an image that is fluorescence microscopy stained with TOMM20 which would show a pattern consistent with visualizing mitochondria.

🔼 This figure showcases examples of how the two-stage MCQ generation process refines questions and answer options. Stage 1 focuses on creating well-structured MCQs from the original raw data; whereas, stage 2 uses RefineBot to improve the questions by making them more challenging and removing language shortcuts. The image highlights specific modifications made during the refinement process. Red indicates elements that were improved, while green highlights the improvements themselves.
read the caption
Figure 11: Examples of changes to questions and options between stage 1 and stage 2 (RefineBot) of our MCQ generation method. In red elements that need to be improved and in green improvements.

🔼 This figure shows a bar chart comparing the performance of three different large language models (LLMs) across three different microscopy image modalities: light microscopy, fluorescence microscopy, and electron microscopy. The performance metric is likely accuracy or a similar measure of correct responses to questions about the images. The models compared are Gemini-1.5-Pro, VILA1.5-40B, and LlaVA-Med-Mistral-7B, representing closed-source, open-source, and medical-specialized models, respectively. The chart visually demonstrates how each model’s performance varies across the different image modalities, highlighting which modality is most challenging for each model and revealing potential differences in model capabilities for handling diverse visual data types in microscopy image analysis.
read the caption
Figure 12: Performance by image modality type for the best models: Gemini-1.5-Pro (closed source), VILA1.5-40B (open-source), and LlaVA-Med-Mistral-7B (medical).

🔼 This figure shows a cryo-electron tomography (cryoET) image of mammalian cells, highlighting dark circular structures within an organelle. The image was acquired at a resolution of 1.3 Å and binned by 4, resulting in a 5.3 Å per pixel resolution. The figure is accompanied by a multiple-choice question asking about the likely identity of these structures, with options including ribosomes, phase-separated condensates, lysosomes, and peroxisomes. The correct answer is stress granules. The reasoning process for identifying the structures is also shown. A key component of the analysis is assessing the size, shape, electron density, and the context of the organelle in which the structures are located. This figure illustrates an error of perception; the model misidentifies the granules.
read the caption
Figure 13:

🔼 This figure shows examples of how the two-stage MCQ generation process improves the quality of questions. The left column shows the original questions and options generated in stage 1 (exam-style alignment). The right column shows the refined questions and options after the RefineBot process (stage 2). The improvements highlight the RefineBot’s effectiveness in removing language shortcuts, making the questions more challenging, and improving the distractors’ quality by ensuring they’re biologically plausible and not easily ruled out by superficial knowledge.
read the caption
Figure 14:

🔼 This figure displays two H&E-stained images of schwannoma tissue, showing marked cellular changes and unique tissue structures. The images highlight a cystic change that can be seen in chronic, longstanding schwannomas, and fascicular growth with Verocay bodies. The model incorrectly interprets this as rapid cellular proliferation.
read the caption
Figure 15:

🔼 This figure shows a fluorescence microscopy image comparing wounded and unwounded mouse liver tissue. The tissue is stained with markers for immune response: neutrophil-derived migrasomes (Ly6G, yellow) and platelets (CD41, magenta). The image illustrates the distribution of these markers in both wounded and unwounded tissue, highlighting differences in immune cell localization and activation in response to tissue injury.
read the caption
Figure 16:
🔼 This figure displays the results of a double immunofluorescence experiment conducted on nerve cells to visualize Sema4B (red marker) and Sox9 (an astrocyte marker, green). Sema4B’s primary localization is surrounding the nuclear area, dispersed in the cytoplasm. The figure shows three images: one each for Sema4B, Sox9 and a merged image. The question is what potential role Sema4B may play in these cells, based on its observed distribution. The model’s response and error analysis are also provided.
read the caption
Figure 17:

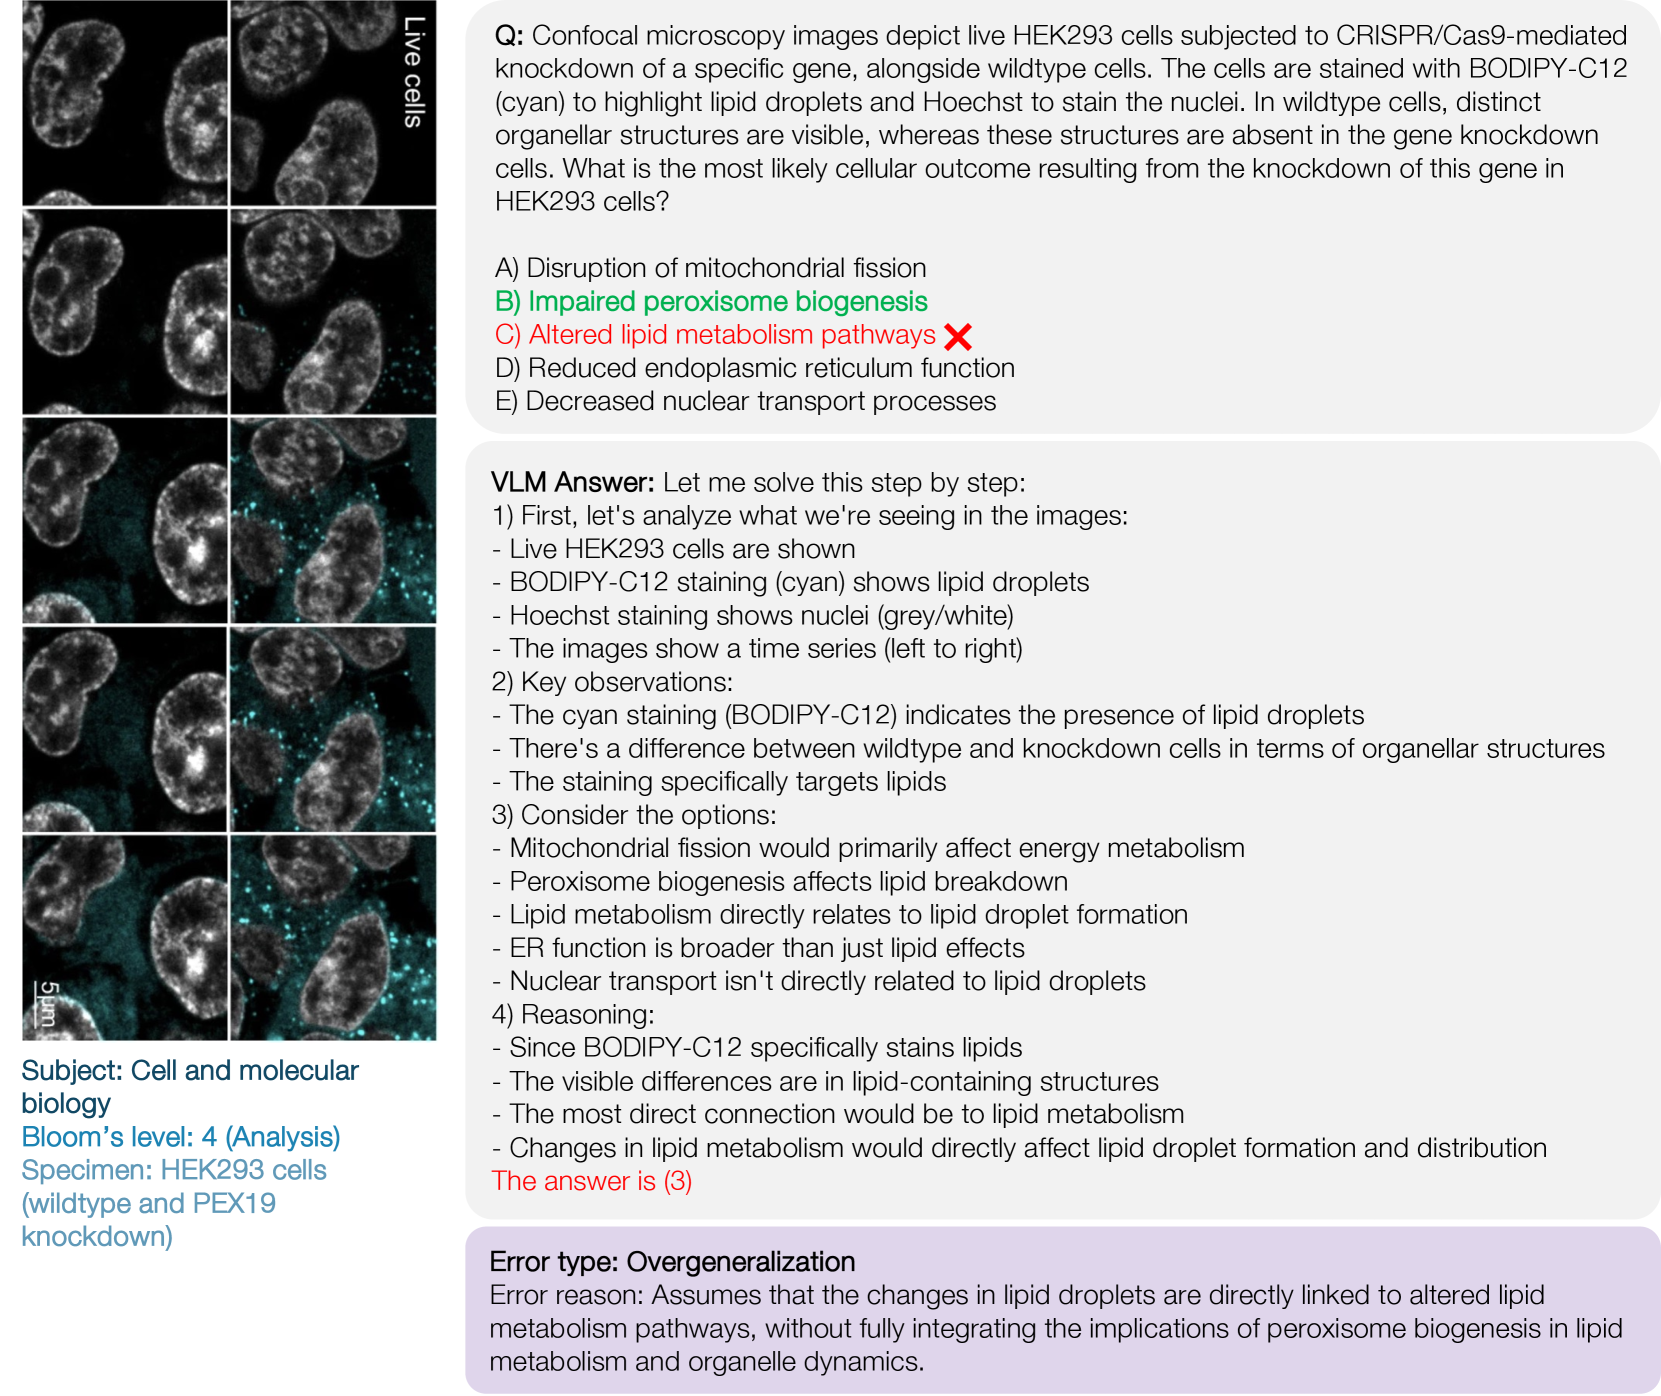
🔼 This figure shows a cryo-electron tomography image of fibroblasts from a 70-year-old Alzheimer’s patient, highlighting three mitochondria clustered together. The question associated with this image in the MicroVQA benchmark asks about the most likely reason for this mitochondrial clustering. The various response options provided to the large language model reflect potential causes related to mitochondrial biogenesis, fusion, fission, mitophagy, or other cellular processes. The correct answer is impaired mitophagy (the failure of the cell to properly remove damaged mitochondria), but the model’s answer is incorrect because its understanding of mitophagy is shallow. The analysis of this incorrect answer in the paper reveals the challenges of correctly interpreting complex biological phenomena from microscopic images and applying scientific knowledge appropriately.
read the caption
Figure 18:
🔼 This figure shows an H&E-stained image and a vimentin-stained image of a tissue sample from a patient with recurrent seizures. The vimentin stain highlights cells that are larger than surrounding cells. The question associated with this figure asks for the identity of the enlarged, vimentin-expressing cells. This image is used in the error analysis to illustrate a knowledge error, where the model fails to correctly identify the cells as reactive astrocytes due to a lack of understanding of the specific cellular changes associated with seizures and brain injury. The image highlights the challenges of multi-modal reasoning in biological microscopy.
read the caption
Figure 19:

🔼 This figure shows a microscopic analysis of a tissue sample from an individual with recurrent seizures, using hematoxylin and eosin stain alongside a vimentin stain. The figure highlights cells with stronger vimentin expression, which are significantly larger than their surrounding counterparts. The question associated with this figure in the paper asks to identify the most probable identity of these prominent vimentin-expressing cells.
read the caption
Figure 20:
More on tables
| Benchmark | Difficulty level | Domain | Source | Size |
| MicroVQA | research | microscopy | expert-curated | 1,042 |
| MMSci [47] | research | science | paper figures | 7132 |
| LabBench [41] | research | biology | webQA | 181 |
| PathVQA [30] | graduate | pathology | texbooks | 16.3k |
| OmnimedVQA∗ [34] | graduate | medical | classification dataset | 127.9k |
| Microbench [50] | graduate | microscopy | classification dataset | 17.2k |
| MMMU [87] | undergraduate | general | textbooks, webQA | 11k |
| MMMU Pro [88] | undergraduate | general | MCQ dataset | 1,730 |
| Science QA [53] | grade-school | science | exams | 16.8k |
🔼 This table compares MicroVQA with other scientific multimodal benchmarks, focusing on reasoning level and difficulty beyond college level. It shows each benchmark’s difficulty level, scientific domain, dataset source (how the questions were obtained), and size (number of questions). MicroVQA stands out because it has a higher difficulty level than most existing benchmarks, and also a higher reasoning level (as demonstrated in Figure 3). Among benchmarks with similar reasoning levels, MicroVQA has a dataset size comparable to MMMU-Pro.
read the caption
Table 2: Comparing scientific multimodal benchmarks close to MicroVQA for in terms of reasoning level or difficulty beyond college level. We show difficulty level, scientific domain, dataset source, and size. Compared to others, MicroVQA either has higher difficulty level, or it has higher reasoning level (which is established in Fig. 3). Compared to others at the same reasoning level, namely MMMU-Pro, it has similar size.
| Model | Overall | V | H | E | |
| R | o1 [36] | 52.8 | 55.4 | 50.2 | 53.0 |
| large models | ∗Claude-3.5-Sonnet [6] | 51.7 | 54.1 | 50.2 | 50.4 |
| Gemini-Pro-1.5 [69] | 51.1 | 52.0 | 50.2 | 50.9 | |
| Pixtral-Large [2] | 49.8 | 50.8 | 49.5 | 48.7 | |
| Grok-2-Vision [84] | 48.4 | 50.3 | 46.4 | 48.7 | |
| Qwen-2-vl-72b-Instruct [79] | 47.5 | 49.2 | 45.7 | 47.8 | |
| VILA1.5-40b [48] | 47.5 | 47.2 | 47.9 | 47.4 | |
| ∗GPT-4o [1] | 45.6 | 48.7 | 43.1 | 44.8 | |
| Llama-3.1-Nemotron-70b-Instruct [83] | 44.2 | 44.9 | 43.3 | 44.8 | |
| Llama-3.2-90b-Vision-Instruct [21] | 42.4 | 44.9 | 42.1 | 38.7 | |
| small models | Qwen-2-VL-7b [79] | 48.8 | 54.1 | 43.3 | 49.6 |
| Claude-3.5-Haiku [6] | 47.1 | 48.0 | 43.8 | 51.7 | |
| Gemini-Flash-1.5-8b [69] | 46.7 | 48.7 | 43.6 | 49.1 | |
| GPT-4o-mini [1] | 46.2 | 48.5 | 43.6 | 47.0 | |
| Pixtral-12b [2] | 45.6 | 46.9 | 44.8 | 44.8 | |
| VILA1.5-13b [48] | 41.8 | 41.8 | 47.5 | 40.9 | |
| Llama-3.2-11b-vision-instruct [21] | 30.3 | 32.4 | 29.3 | 28.7 | |
| medical | LLaVA-Med-Mistral-7B [42] | 43.0 | 37.3 | 47.1 | 41.6 |
| †LLaVA-Mistral-7B [49] | 39.8 | 31.6 | 43.1 | 37.1 | |
| Random | 22.0 | 21.9 | 21.8 | 21.9 | |
| Human | 50.3 | 52.7 | 47.5 | 51.4 |
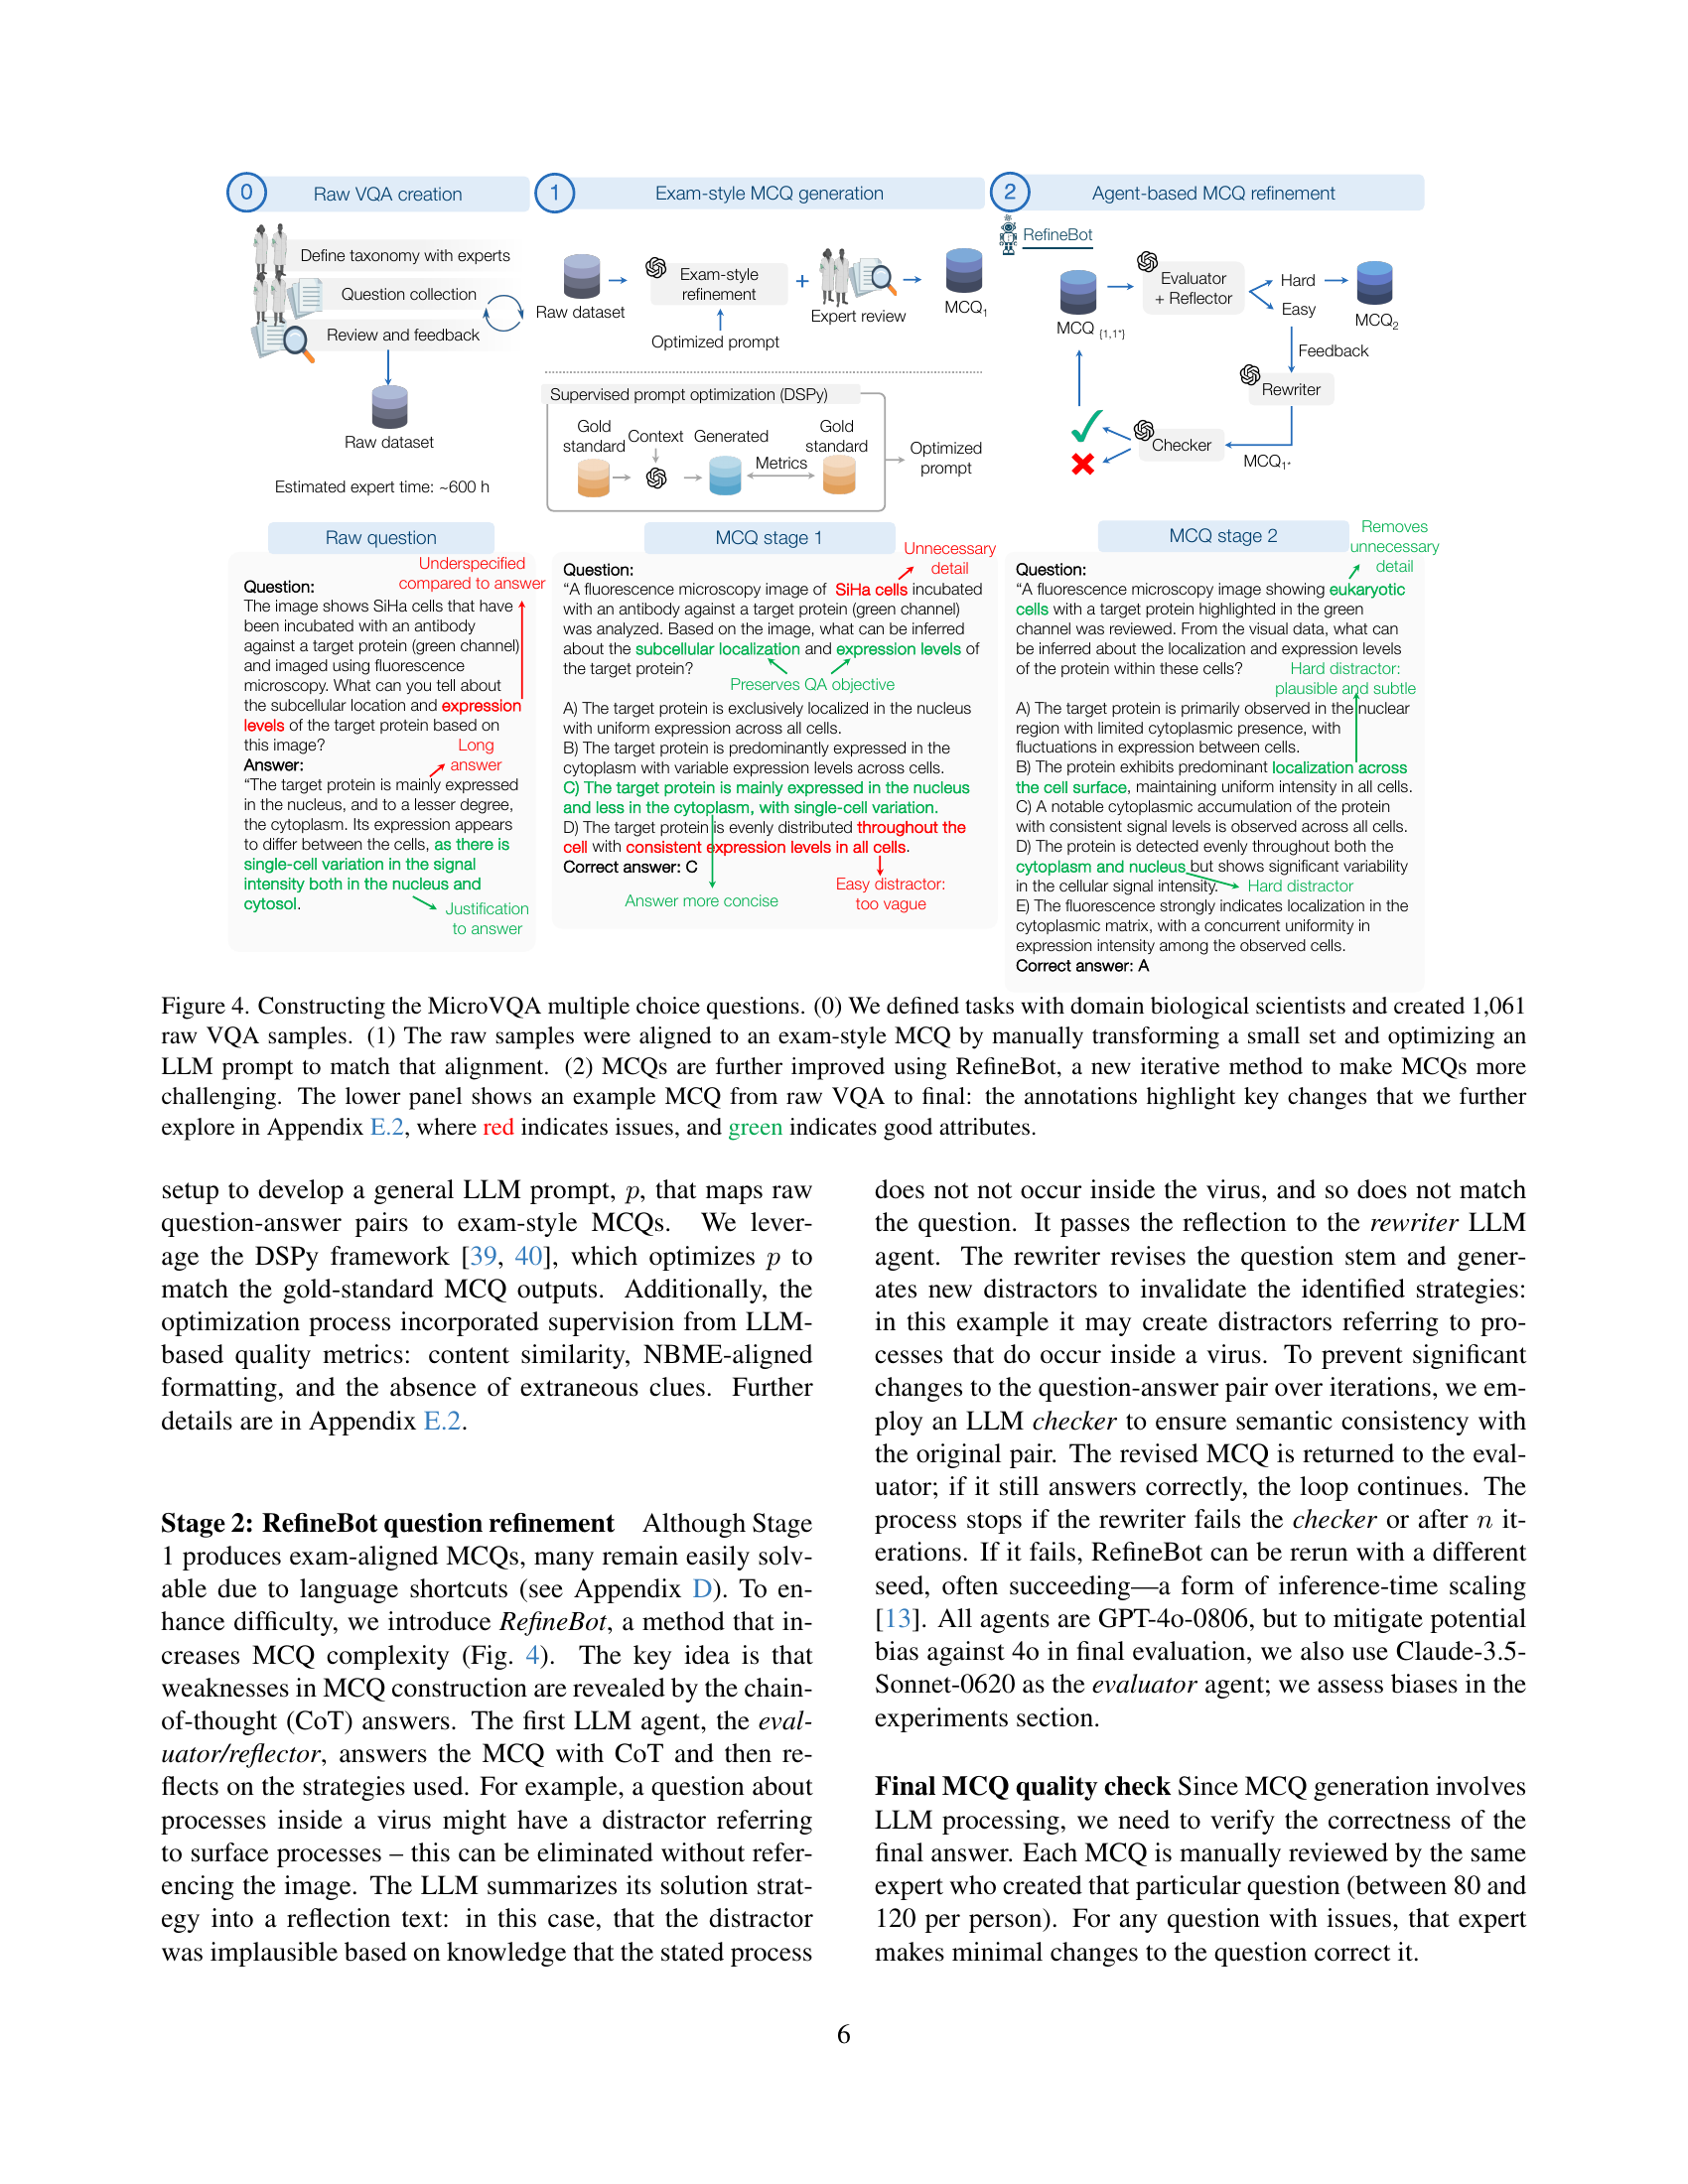
🔼 This table presents the performance of various Multimodal Large Language Models (MLLMs) on the MicroVQA benchmark. The benchmark tests three key reasoning capabilities: expert image understanding (V), hypothesis generation (H), and experiment proposal (E). The table shows the accuracy of each model on each of these tasks. Note that some models were used in the creation of the multiple-choice questions (MCQs) themselves and may therefore show inflated scores. Also, one model’s performance is given relative to its base model. The highest accuracy for each task is highlighted in bold.
read the caption
Table 3: VQA accuracy on MicroVQA by task: expert visual understanding (V), hypothesis generation (H), experiment proposal (E). Models marked ∗ were used in MCQ generation, which may affect comparative performance (see Sec. 5.1). The model † is the base LlaVA for LLaVA-Med. Best values are bolded.
| Stage 1 | Stage 2 | Relative drop | |
| ∗GPT-4o | 79.7 | 46.8 | -41.2 |
| ∗∗GPT-4o-mini | 75.6 | 46.2 | -39.0 |
| ∗Claude-3.5-Sonnet | 82.2 | 51.7 | -37.1 |
| ∗∗Claude-3.5-Haiku | 77.3 | 47.1 | -39.0 |
| o1 | 81.6 | 52.8 | -35.3 |
| Pixtral-Large | 80.1 | 49.8 | -37.8 |
| Gemini-Pro-1.5 | 79.1 | 51.1 | -35.4 |
🔼 This ablation study analyzes the impact of each stage in the MicroVQA MCQ generation pipeline (shown in Figure 4). Stage 1 aligns raw VQA samples to exam-style MCQs, while Stage 2 uses RefineBot to refine these MCQs and increase difficulty by removing language shortcuts. The table shows that accuracy is initially high due to these shortcuts after Stage 1, but decreases significantly after incorporating RefineBot in Stage 2. The models used in the Stage 2 refinement show the largest drops in accuracy after refinement. Models from the same provider are grouped together for better comparison.
read the caption
Table 4: Ablation study on MicroVQA MCQ generation stages (shown in Fig. 4). Accuracy is high because MCQs have shortcuts (Sec. 4.1) after ‘Stage 1’ exam alignment, but is lower after ‘Stage 2’. Final column is the relative decrease in accuracy. Models with ∗ were used in Stage 2 generation and have the biggest accuracy drops (bolded). They are grouped with different models from the same provider in ∗∗.
| VQA | VQA-no-image | |
| GPT-4o | 85.1 | 82.7 |
| Claude-3.5-Sonnet | 91.4 | 88.4 |
| Gemini-1.5-Pro | 88.5 | 82.4 |
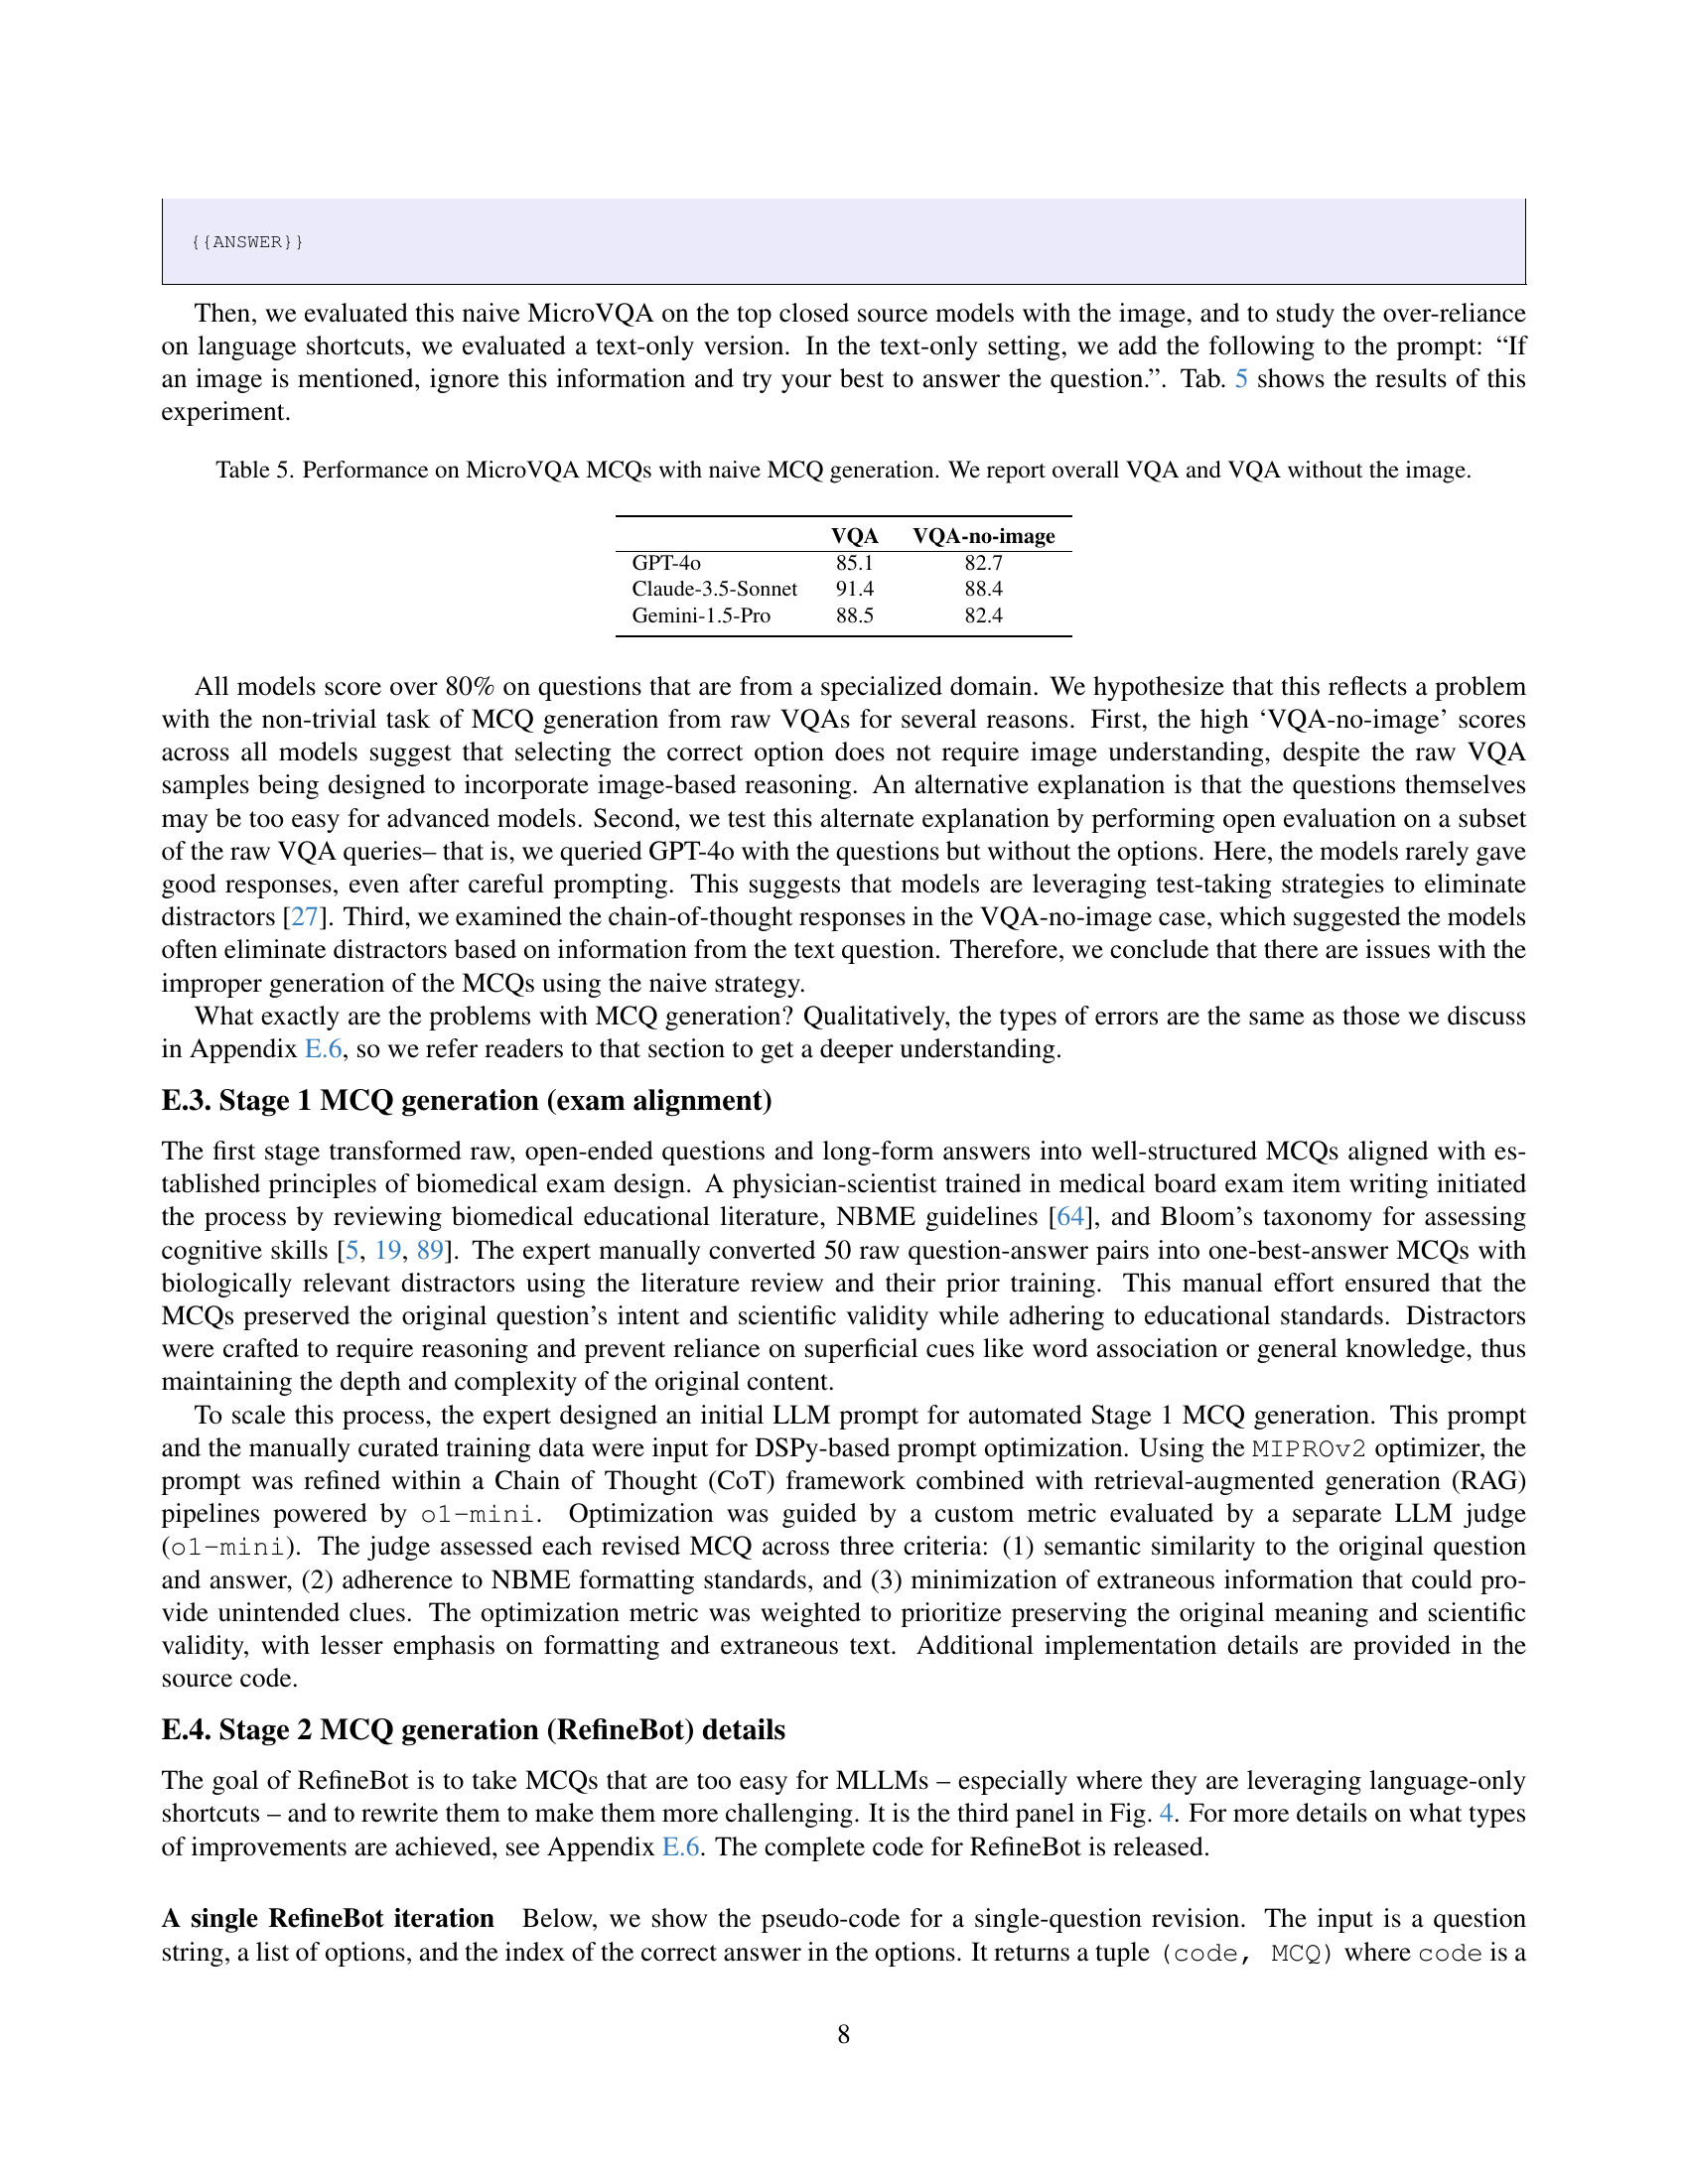
🔼 This table presents the results of evaluating various large language models (LLMs) on a naive version of the MicroVQA benchmark. The naive version uses a simple, zero-shot prompting method for generating multiple-choice questions (MCQs) directly from the raw visual question answering (VQA) pairs, without any optimization or refinement. The table shows the overall performance of each LLM on the benchmark, along with their performance when the image is excluded from the input. This comparison helps to assess the models’ reliance on visual information versus language-only reasoning.
read the caption
Table 5: Performance on MicroVQA MCQs with naive MCQ generation. We report overall VQA and VQA without the image.
| Model Name | API Endpoint | Source & Details |
| o1 | o1-2024-12-17 | OpenAI API |
| Claude-3.5-Sonnet | *anthropic/claude-3.5-sonnet-20240620 | Openrouter API |
| Gemini-Pro-1.5 | google/gemini-pro-1.5 | Openrouter API |
| Pixtral-Large | mistralai/pixtral-large-2411 | Openrouter API |
| Grok-2-Vision | x-ai/grok-2-vision-1212 | Openrouter API |
| Qwen-2-vl-72b-Instruct | qwen/qwen-2-vl-72b-instruct | Openrouter API |
| VILA1.5-40b | VILA1.5-40b | HuggingFace, local inference |
| GPT-4o | gpt-4o-2024-08-06 | OpenAI API |
| Llama-3.1-Nemotron-70b-Instruct | nvidia/llama-3.1-nemotron-70b-instruct | Openrouter API |
| Llama-3.2-90b-Vision-Instruct | meta-llama/llama-3.2-90b-vision-instruct | Openrouter API |
| Qwen-2-VL-7b | qwen/qwen-2-vl-7b-instruct | Openrouter API |
| Claude-3.5-Haiku | anthropic/claude-3.5-haiku | Openrouter API |
| Gemini-Flash-1.5-8b | google/gemini-flash-1.5-8b | Openrouter API |
| GPT-4o-mini | gpt-4o-mini-2024-07-18 | OpenAI API |
| Pixtral-12b | mistralai/pixtral-12b | Openrouter API |
| VILA1.5-13b | VILA1.5-13b | HuggingFace, local inference |
| Llama-3.2-11b-vision-instruct | meta-llama/llama-3.2-11b-vision-instruct | Openrouter API |
| LLaVA-Med-Mistral-7B | LLaVA-Med-Mistral-7B | HuggingFace, local inference |
| LLaVA-Mistral-7B | LLaVA-Mistral-7B | HuggingFace, local inference |
🔼 This table lists the specific versions of the large language models (LLMs) used in the experiments section of the paper. It provides the API endpoint used to access each model, along with the source and details about where the endpoint is hosted (e.g., OpenAI API, HuggingFace, local inference). This information is crucial for reproducibility, allowing researchers to easily replicate the experiments using the same model versions.
read the caption
Table 6: AI model API endpoints and their sources
| No-image ablation | Choices-only ablation | ||||
| Accuracy | Accuracy | Drop | Accuracy | diff | |
| o1 | 52.8 | 49.2 | -3.6 | 37.7 | -15.1 |
| Claude-3.5-Sonnet | 51.7 | 46.0 | -5.8 | 44.0 | -7.7 |
| Gemini-Pro-1.5 | 51.1 | 47.2 | -3.8 | 36.8 | -14.3 |
| Pixtral-Large | 49.8 | 46.3 | -3.6 | 36.7 | -13.1 |
| Grok-2-Vision | 48.4 | 46.3 | -2.1 | 40.5 | -7.9 |
| GPT-4o-mini | 46.2 | 44.2 | -1.9 | 34.3 | -11.9 |
| Pixtral-12b | 45.6 | 43.7 | -1.9 | 31.8 | -13.8 |
| Random | 22.0 | ||||
🔼 This ablation study analyzes the impact of removing visual and textual information from the MicroVQA benchmark on model performance. The table shows the overall accuracy of various models, along with their accuracy when either the image is removed (no-image ablation), or both the image and question text are removed (choices-only ablation). The ‘drop’ columns show the reduction in accuracy compared to the overall performance, highlighting the relative importance of visual and textual information in solving the MicroVQA tasks.
read the caption
Table 7: Ablation study on MicroVQA MCQs. Column 2 is overall accuracy. Cols 3-4 are the no-image ablation accuracy and drop compared to overall accuracy. Cols 5-6 are the choices-only ablation accuracy and drop compared to overall accuracy. See the text for discussion.
Full paper#