TL;DR#
Vision-language(VL) models show great results but often rely too much on one type of information leading to a “dominant modality bias.” This hurts performance, especially when one data source is weak. The paper looks at how this bias affects models, finding that mismatched gradients stop the loss from balancing out. This suggests that some data types are more vital to target performance.
The paper presents BALGRAD to reduce dominant modality bias by rebalancing gradient. It adjusts gradients depending on each data source’s contribution and makes sure task directions line up properly. Results on datasets like UPMC Food-101 show BALGRAD stops over-reliance on certain data sources, especially when one source is not as reliable.
Key Takeaways#
Why does it matter?#
This work is crucial because it tackles the widespread issue of dominant modality bias in VL models, offering a way to enhance their robustness and reliability in real-world applications. By enabling more balanced and effective use of multimodal data, this research promotes the development of more advanced, adaptable, and versatile VL systems.
Visual Insights#

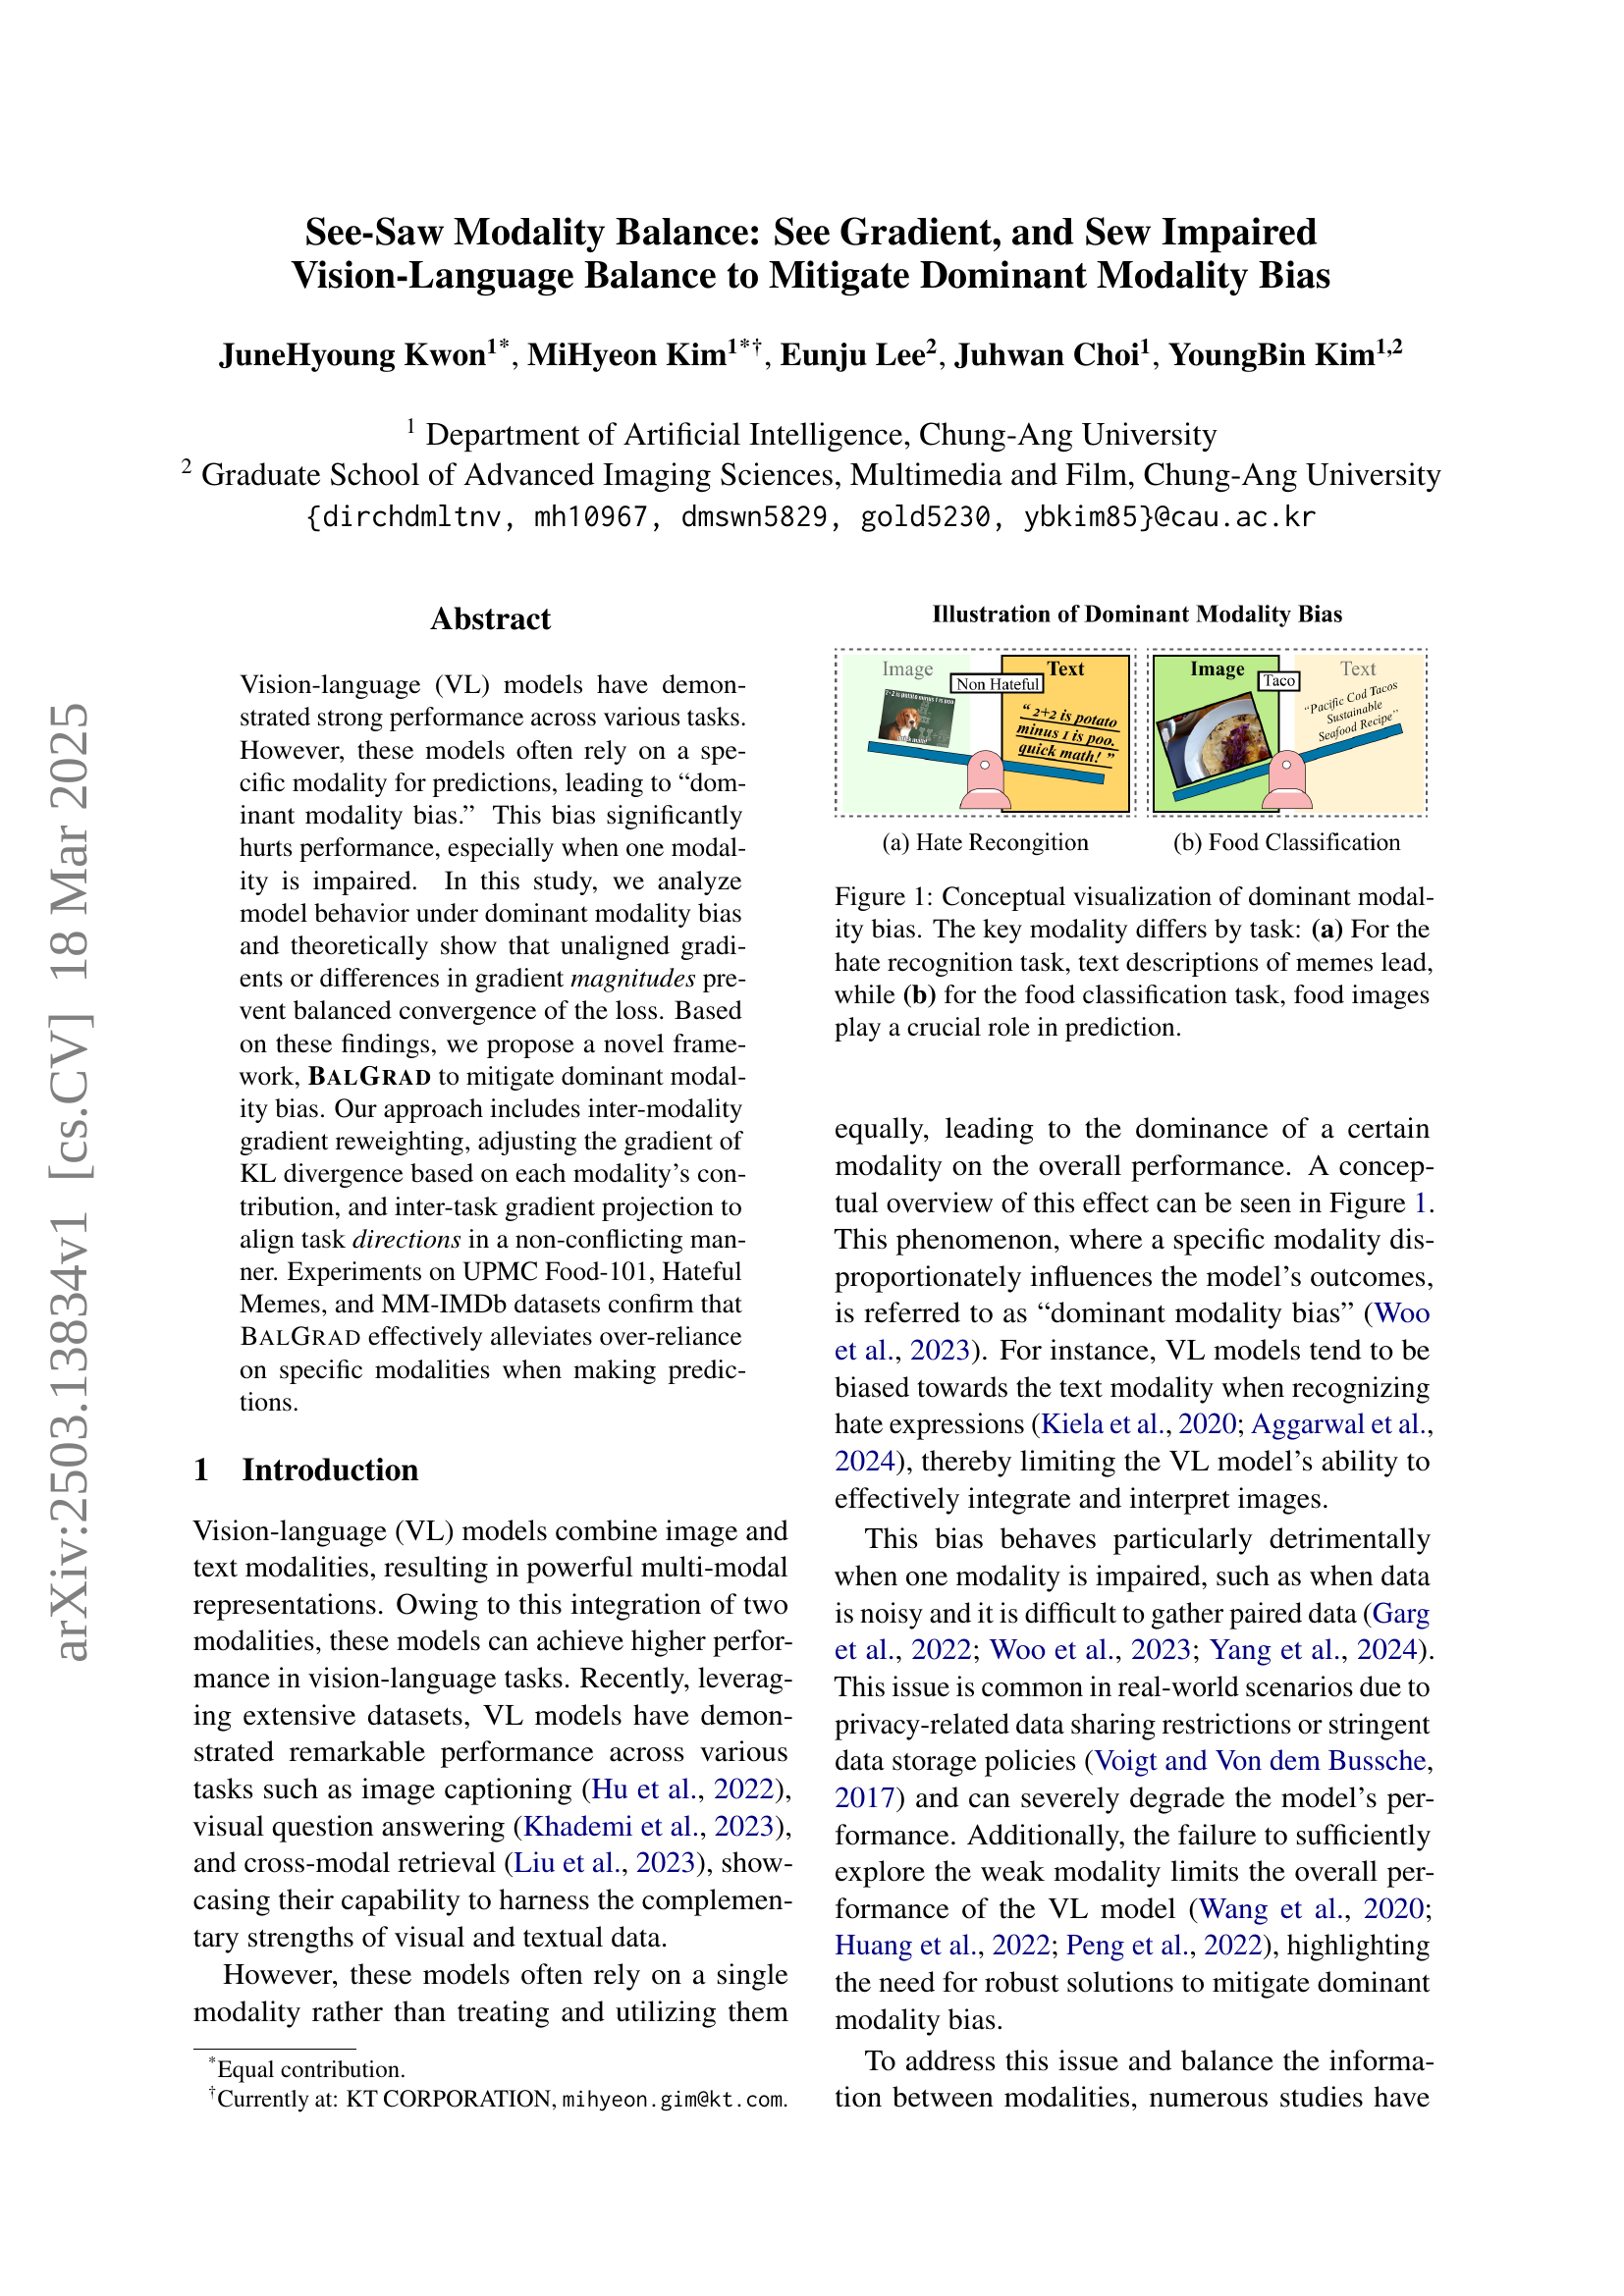
🔼 Figure 1 illustrates the concept of dominant modality bias in vision-language (VL) models. Dominant modality bias refers to situations where a VL model relies disproportionately on one modality (either visual or textual) for its predictions, even when information from both modalities is available. The figure shows two examples: (a) Hate recognition: Here, the text associated with a meme is more influential in determining whether it is hateful than the image itself. The model primarily focuses on the textual content to make the prediction. (b) Food Classification: Conversely, in this task, the visual information (the image of the food) is significantly more important than the textual description for correct classification. The model heavily relies on the visual data to make the prediction. This bias can negatively impact the model’s performance, especially when one modality is impaired or unavailable.
read the caption
Figure 1: Conceptual visualization of dominant modality bias. The key modality differs by task: (a) For the hate recognition task, text descriptions of memes lead, while (b) for the food classification task, food images play a crucial role in prediction.
| UPMC Food-101 | Hateful Memes | MM-IMDb | ||||||||||||||
| Modality | Baseline | MSLR | OGM-GE | AGM | BalGrad | Baseline | MSLR | OGM-GE | AGM | BalGrad | Baseline | MSLR | OGM-GE | AGM | BalGrad | |
| Full | 76.01 | 78.43 | 77.42 | \ul78.93 | 80.32 | 65.10 | 65.58 | \ul66.70 | 64.69 | 67.35 | 44.09 | 44.09 | 42.22 | 43.93 | 43.19 | |
| Image | 12.99 | 20.52 | 13.86 | \ul22.60 | 25.49 | 64.34 | 66.04 | 66.83* | \ul66.25* | 65.86 | 18.85 | \ul19.26 | 24.48 | 17.57 | 18.81 | |
| Text | \ul63.52 | 63.00 | 61.45 | 63.13 | 65.03 | 55.60 | 55.66 | \ul57.20 | 56.20 | 57.58 | 18.40 | 14.67 | 12.31 | 15.46 | \ul17.47 | |
| Avg. | 38.26 | 41.76 | 37.66 | \ul42.87 | 45.26 | 59.97 | 60.85 | 62.02 | 61.23 | \ul61.72 | 18.63 | 16.97 | \ul18.40 | 16.52 | 18.14 | |
| Missing | 50.53 | 42.48 | 47.59 | \ul40.53 | 39.54 | \ul8.74 | 10.38 | 9.63 | 10.05 | 8.28 | 0.45 | 4.59 | 12.17 | 2.11 | \ul1.34 | |
| Image | 41.92 | 52.92 | 46.50 | 56.57 | \ul55.58 | 63.64 | \ul64.21 | 63.72 | 61.85 | 65.78 | 30.89 | 33.86 | 35.31 | \ul35.73 | 37.76 | |
| Text | 67.28 | \ul77.71 | 75.94 | 77.43 | 78.54 | 65.09 | 63.66 | 67.16* | 63.68 | \ul65.60 | 38.09 | 43.00 | 40.33 | \ul42.66 | 41.80 | |
| Avg. | 54.60 | 65.32 | 61.22 | \ul67.00 | 67.06 | 64.37 | 63.94 | \ul65.44 | 62.77 | 65.69 | 34.49 | 38.43 | 37.82 | \ul39.20 | 39.78 | |
| Noisy | 25.36 | 24.79 | 29.44 | 20.86 | \ul22.96 | 1.45 | \ul0.55 | 3.44 | 1.83 | 0.18 | 7.20 | 9.14 | \ul5.02 | 6.93 | 4.04 | |
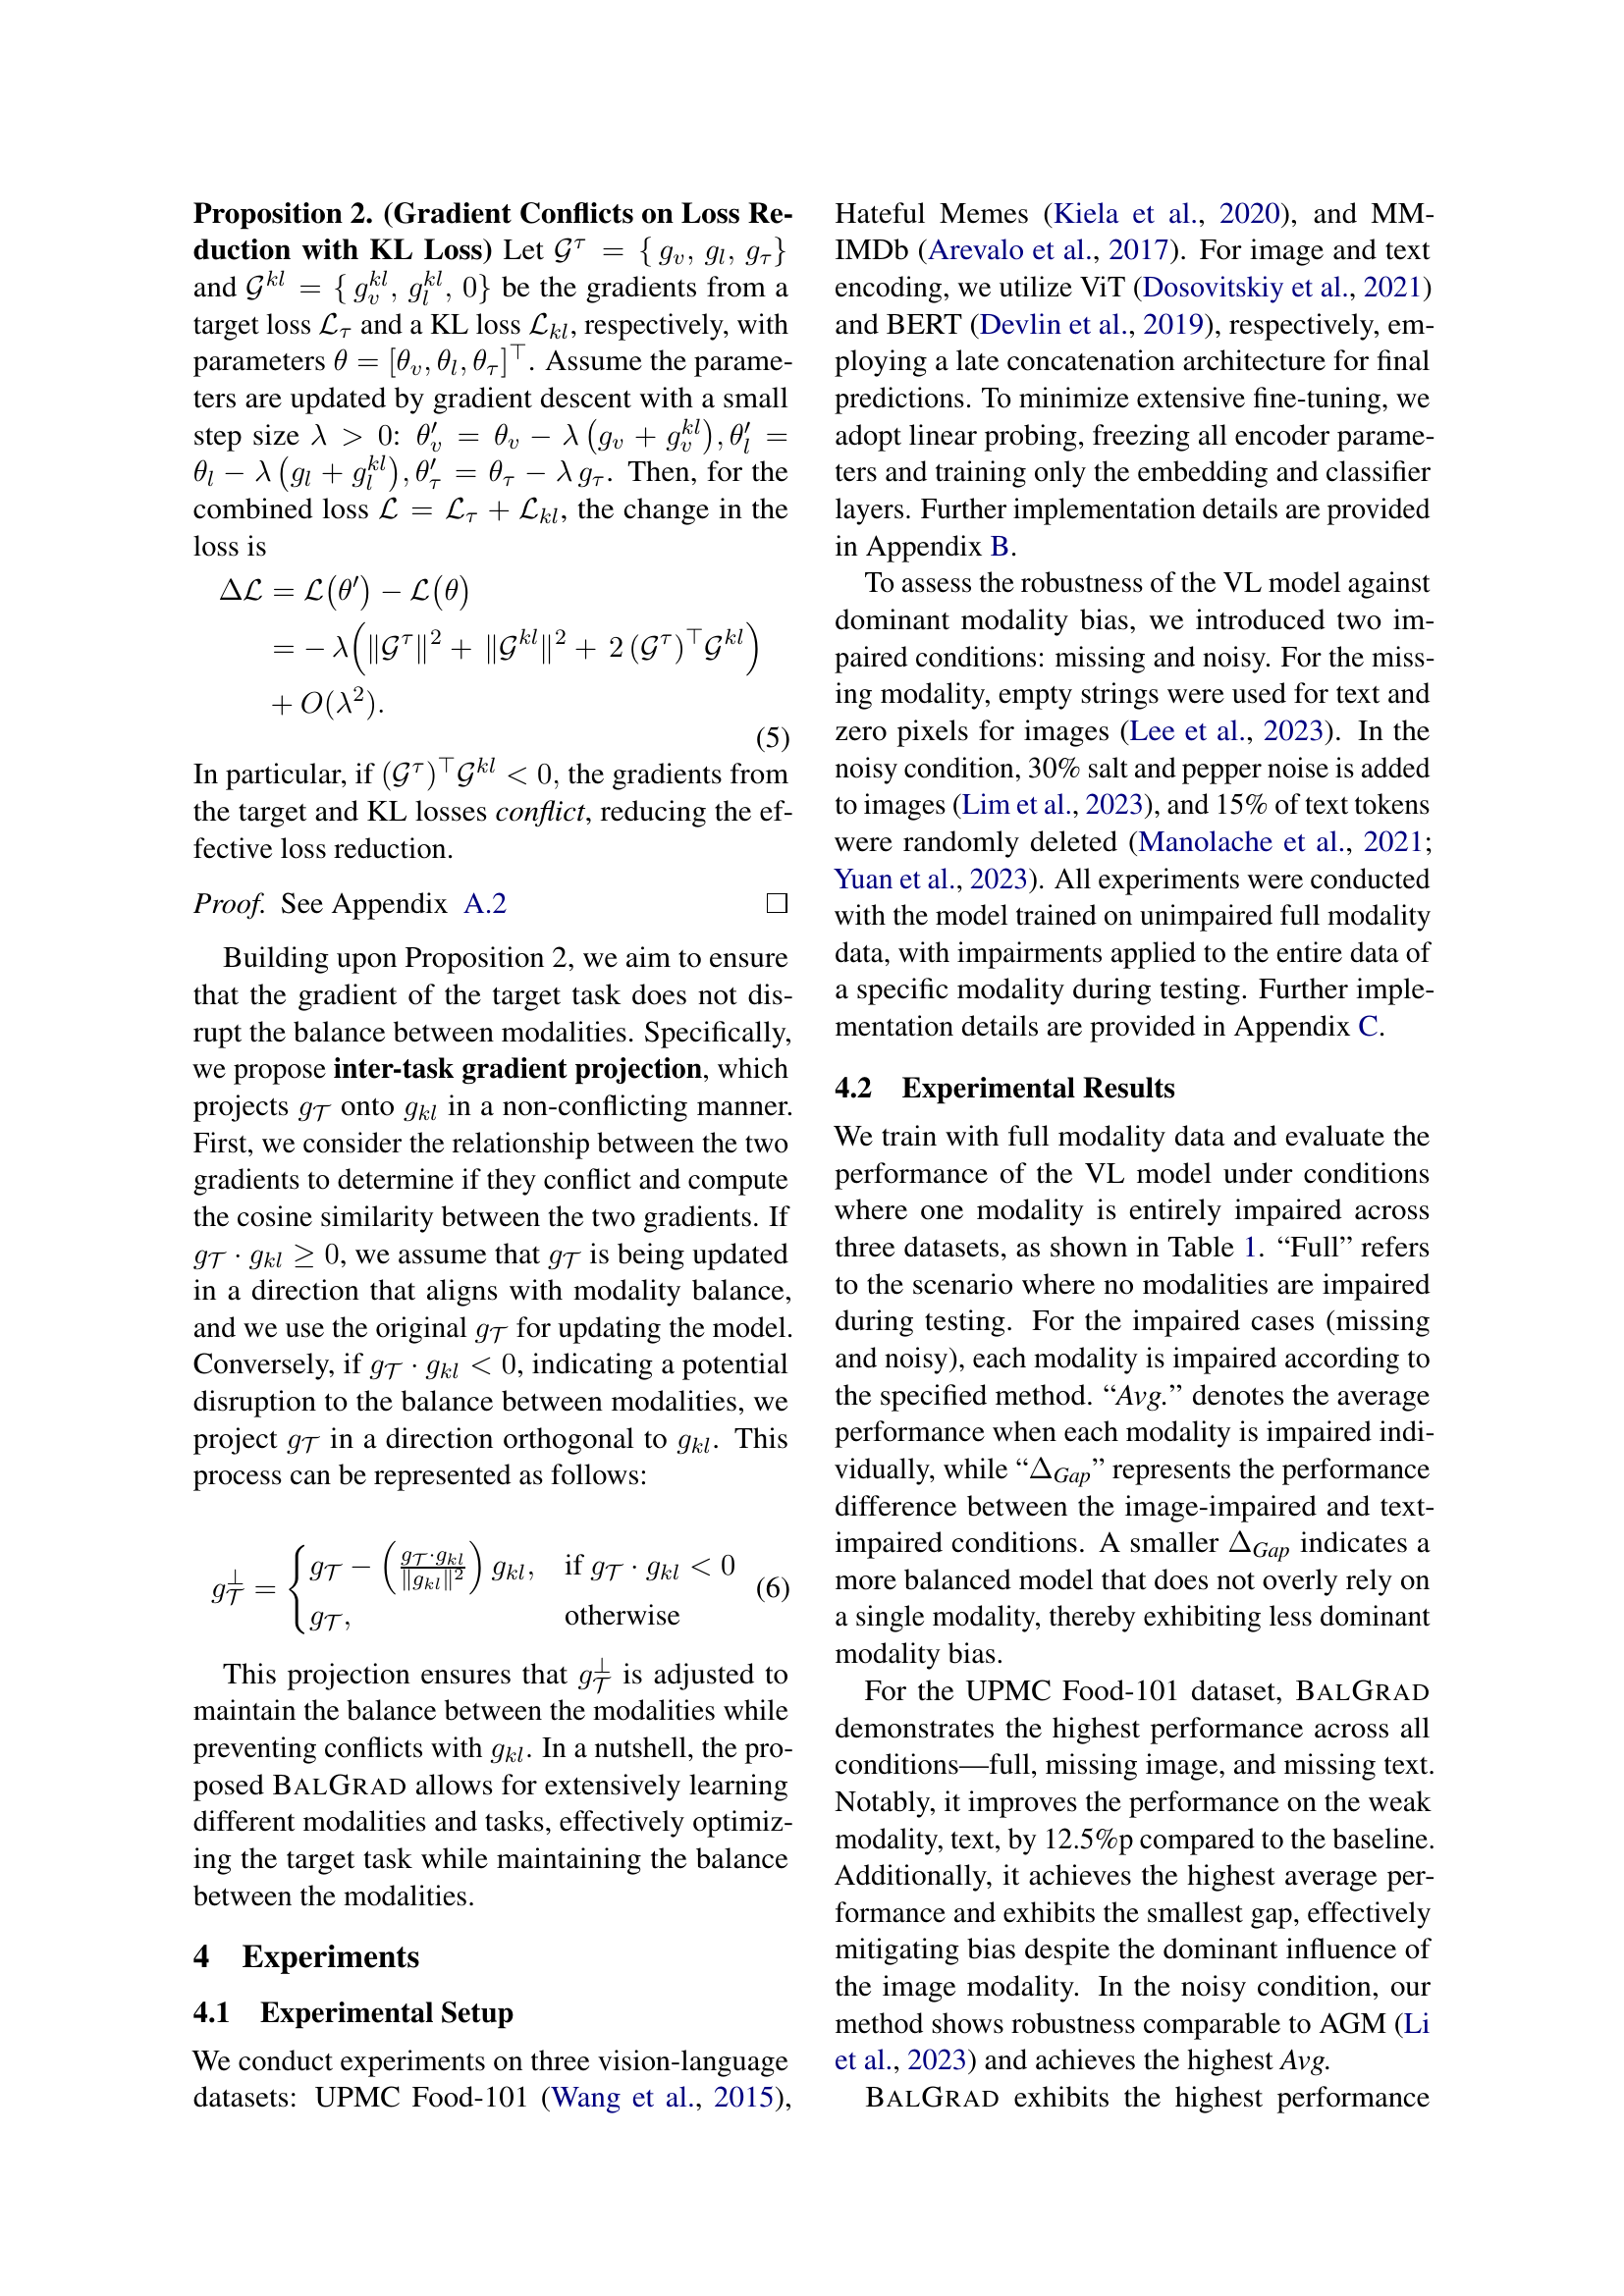
🔼 This table presents the performance comparison of the proposed BalGrad model against several baseline models on three vision-language datasets: UPMC Food-101, Hateful Memes, and MM-IMDb. The evaluation considers three scenarios: data with both modalities (full), data missing the image modality (missing image), and data missing the text modality (missing text). For each dataset and scenario, the table shows the accuracy of each model. The ‘Avg’ column represents the average accuracy across the missing image and missing text conditions. The ‘ΔGap’ column indicates the difference in accuracy between the missing image and missing text conditions, quantifying the model’s reliance on either modality. A smaller ΔGap suggests a better balance between modalities, mitigating dominant modality bias. Values marked with an asterisk (*) represent cases of negative transfer, where adding more modality data hurts performance compared to using only one modality.
read the caption
Table 1: The experimental result to validate the effectiveness of BalGrad on the UPMC Food-101, Hateful Memes, and MM-IMDb datasets. The best result in each test dataset is boldfaced, and the second best is presented with underlining. “Avg.” represents the average performance under conditions where one of the modalities is impaired (missing or noisy), while “ΔGapsubscriptΔGap\Delta_{\textit{Gap}}roman_Δ start_POSTSUBSCRIPT Gap end_POSTSUBSCRIPT” indicates the performance difference. The value that is displayed in gray* represents a negative transfer. The unit for “ΔGapsubscriptΔGap\Delta_{\textit{Gap}}roman_Δ start_POSTSUBSCRIPT Gap end_POSTSUBSCRIPT” is %p, and the unit for all other values is %.
In-depth insights#
Modality Balance#
Modality balance in vision-language (VL) models is a critical aspect that determines the robustness and generalizability of these models. Effective modality balance ensures that the model leverages both visual and textual information equally, preventing reliance on a single modality, which leads to issues like dominant modality bias. This bias can severely degrade performance, especially when one modality is impaired or missing. Achieving modality balance requires careful consideration of gradient magnitudes and directions during training. Techniques like gradient reweighting and projection are employed to ensure that both modalities contribute equally to the loss reduction, preventing one modality from overshadowing the other. Furthermore, the architecture and training scheme, including the fusion mechanism, play crucial roles in maintaining this balance. By addressing these factors, VL models can achieve more stable and balanced learning, leading to improved performance and robustness across various vision-language tasks and datasets. Focusing on this enables models to generalize better and avoid negative transfer, which is vital for real-world applications.
Gradient Control#
Gradient control in multimodal learning is a critical area, aiming to mitigate biases and ensure balanced contributions from different modalities. Approaches often involve modulating gradients based on modality confidence or using modality-specific learning rates. The goal is to prevent dominant modalities from overshadowing weaker ones, which can lead to under-exploration and poor generalization. Techniques like gradient reweighting, projection, and surgery are used to align gradients and avoid conflicts. Effective gradient control enhances model robustness and enables synergistic integration of multimodal information, improving overall performance. The challenge lies in dynamically adjusting gradients to reflect the learning status of each modality while avoiding negative transfer and maintaining stability.
Avoiding Bias#
Addressing bias in vision-language models is crucial for fairness and reliability. Dominant modality bias, where models overly rely on one modality (text or image), can lead to poor performance, especially when that modality is impaired. BALGRAD framework addresses this by reweighting gradients to ensure balanced contributions from both modalities. By adjusting gradient magnitudes and aligning task directions, BALGRAD mitigates over-reliance on specific modalities and avoids negative transfer. This approach enhances robustness and promotes effective joint learning, leading to improved performance in various vision-language tasks. Addressing bias leads to fair, generalizable and reliable models, which is an essential step towards real-world deployment.
Experiments#
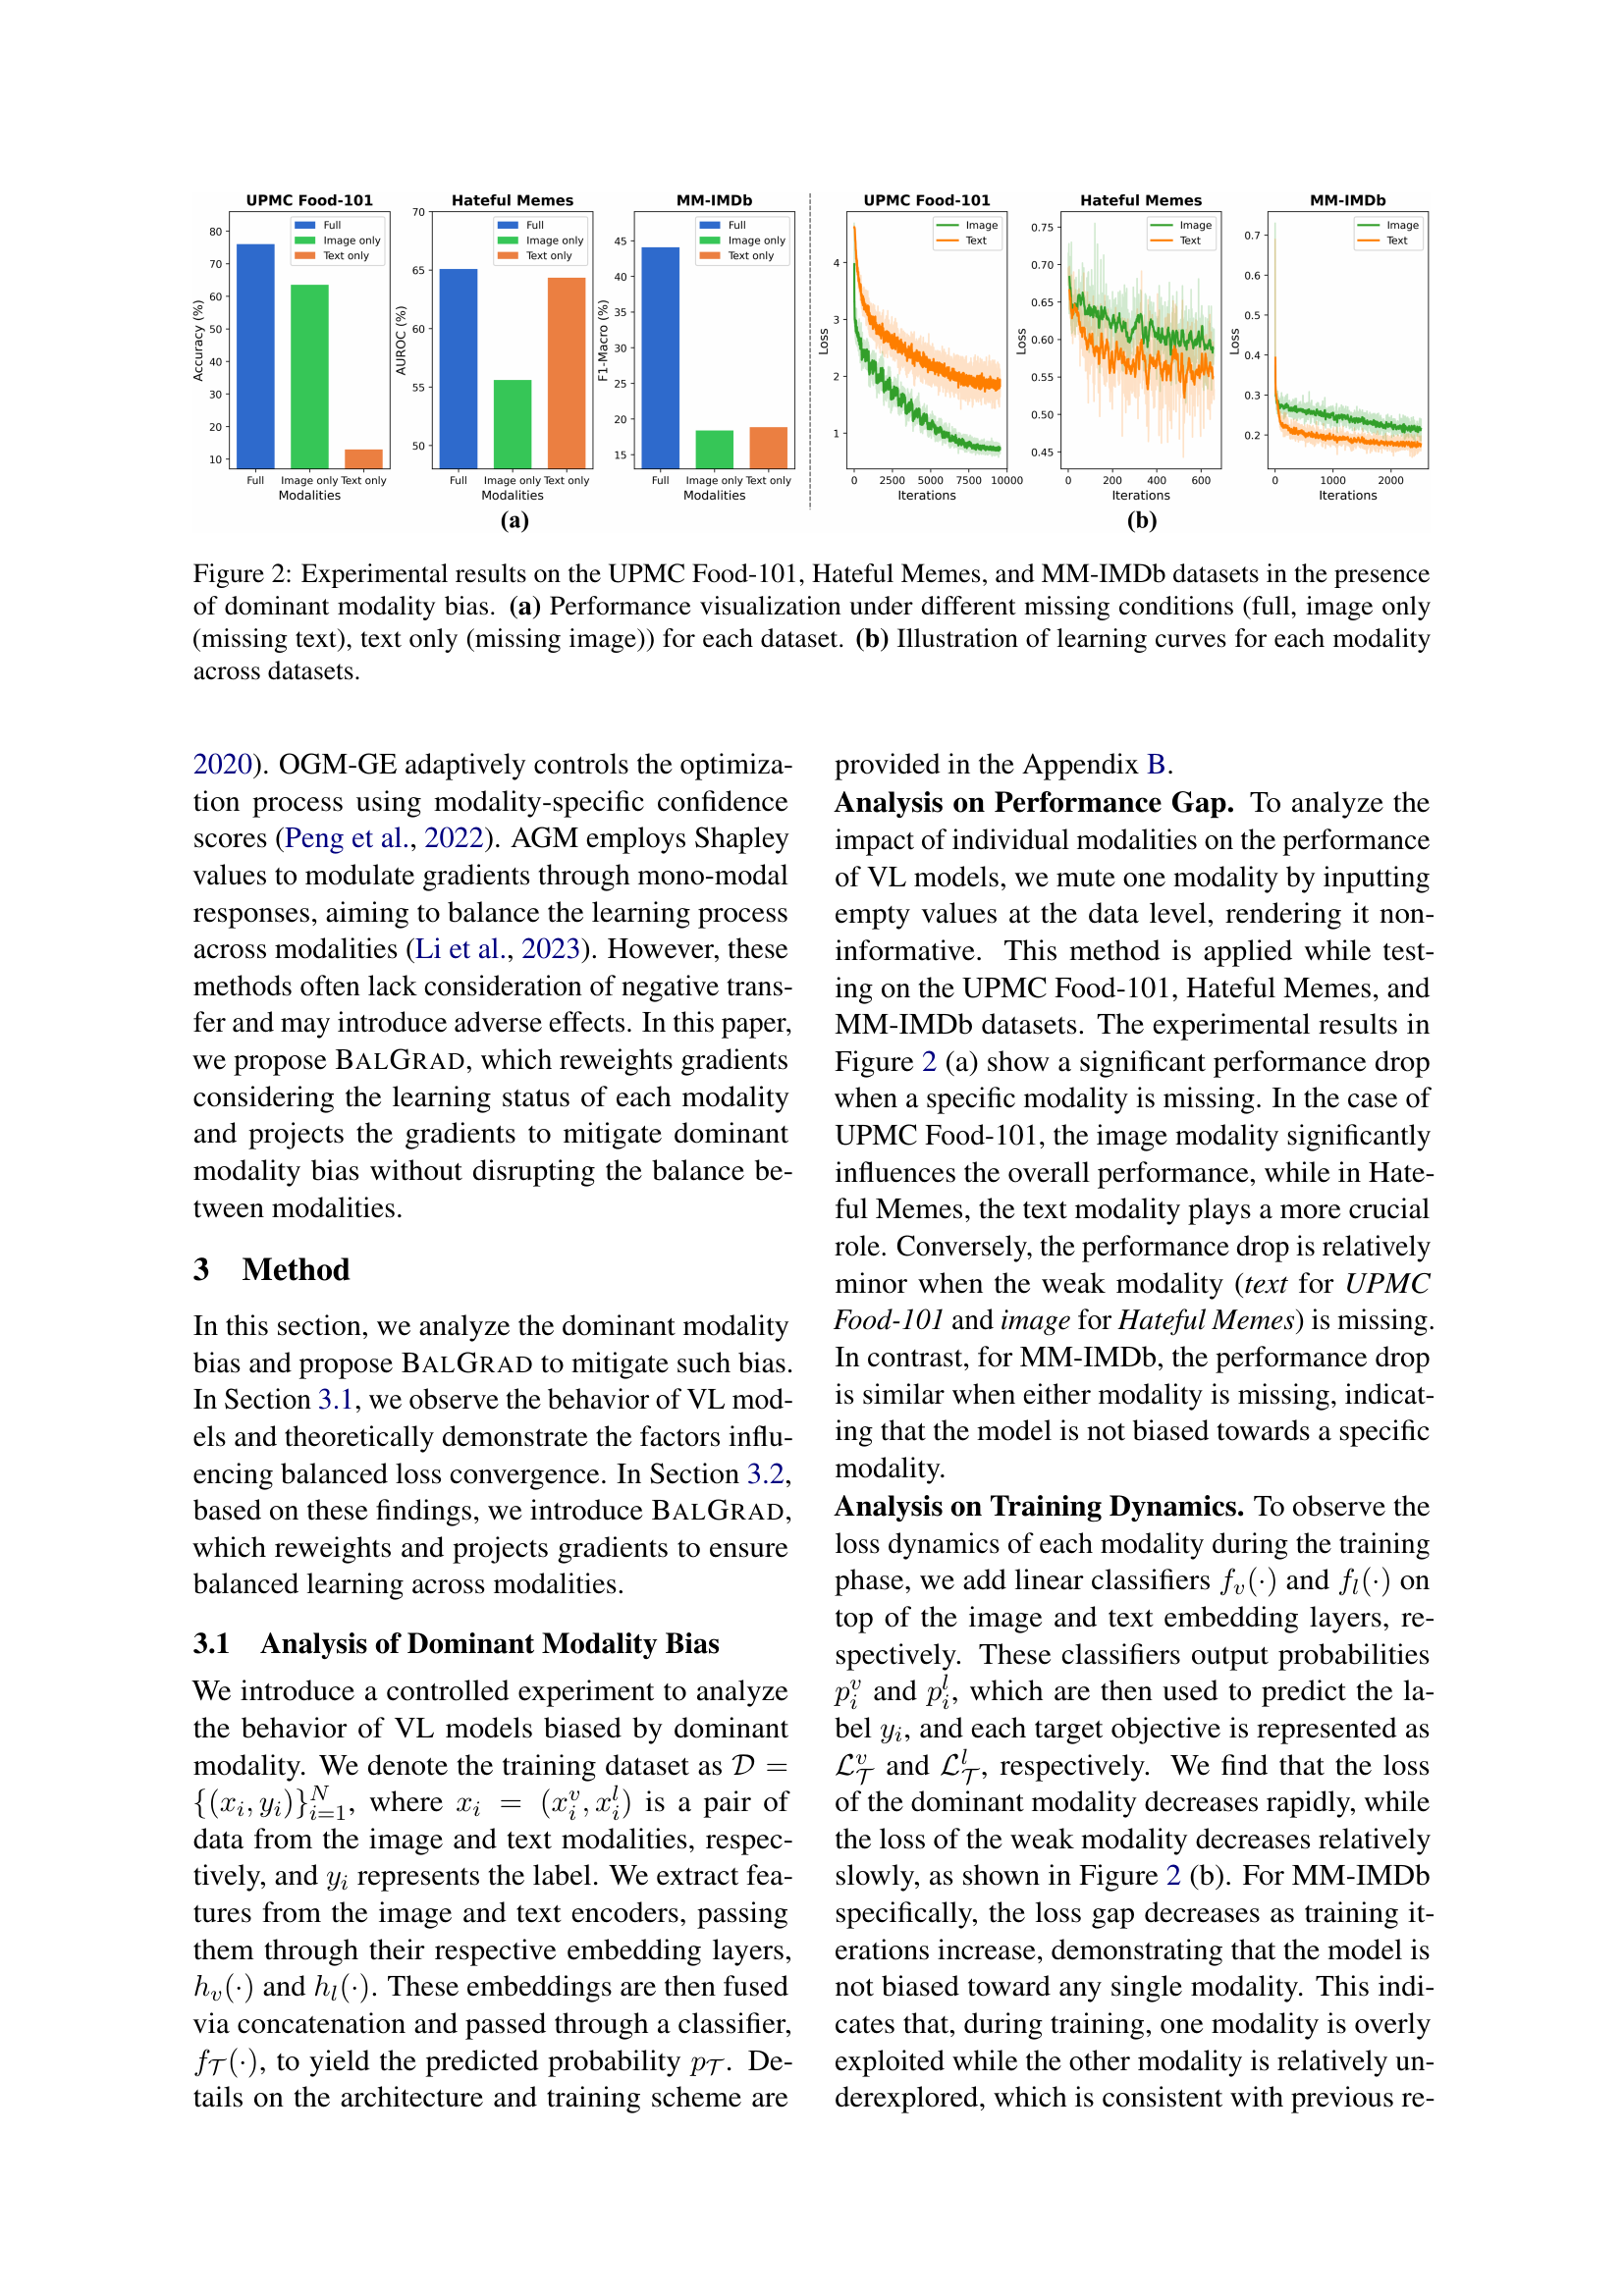
The experiments section is crucial for validating the proposed method, BALGRAD. The setup involves using standard datasets like UPMC Food-101, Hateful Memes, and MM-IMDb to benchmark performance under various conditions. A key aspect is the introduction of controlled impairments such as missing or noisy modalities (image or text) to simulate real-world scenarios where data quality varies. This allows for a rigorous assessment of BALGRAD’s robustness to modality bias. Performance metrics like accuracy and F1-macro are used, along with a careful analysis of the performance gap (∆Gap) between image-impaired and text-impaired conditions, offering insights into modality balance. Furthermore, analyzing the training dynamics and gradient behavior contributes to understanding how BALGRAD achieves this balance. The experiments section also analyzes the individual contributions of gradient reweighting and projection towards overall improvements. The use of text decoder-based architecture is tested through BLIP and is experimented with various fusion mechanisms and backbone models, reinforcing the validity and wide applicability of the method. Datasets with additional modalities help test the generalizability of the model.
Limitations#
The paper acknowledges a limitation in extending its approach, BALGRAD, to multimodal models beyond two modalities, citing a rapid increase in training costs due to the need to consider relationships between gradients of each pair of modalities. The complexity in gradient management becomes computationally intensive and difficult to maintain effectively when dealing with three or more modalities. While BALGRAD is effective in bi-modal settings, its application in multimodal scenarios requires further refinement to manage the higher computational demands and ensure balanced performance across all modalities. The study is limited to two modalities, so future work must be done to extend BALGRAD to more modalities.
More visual insights#
More on figures

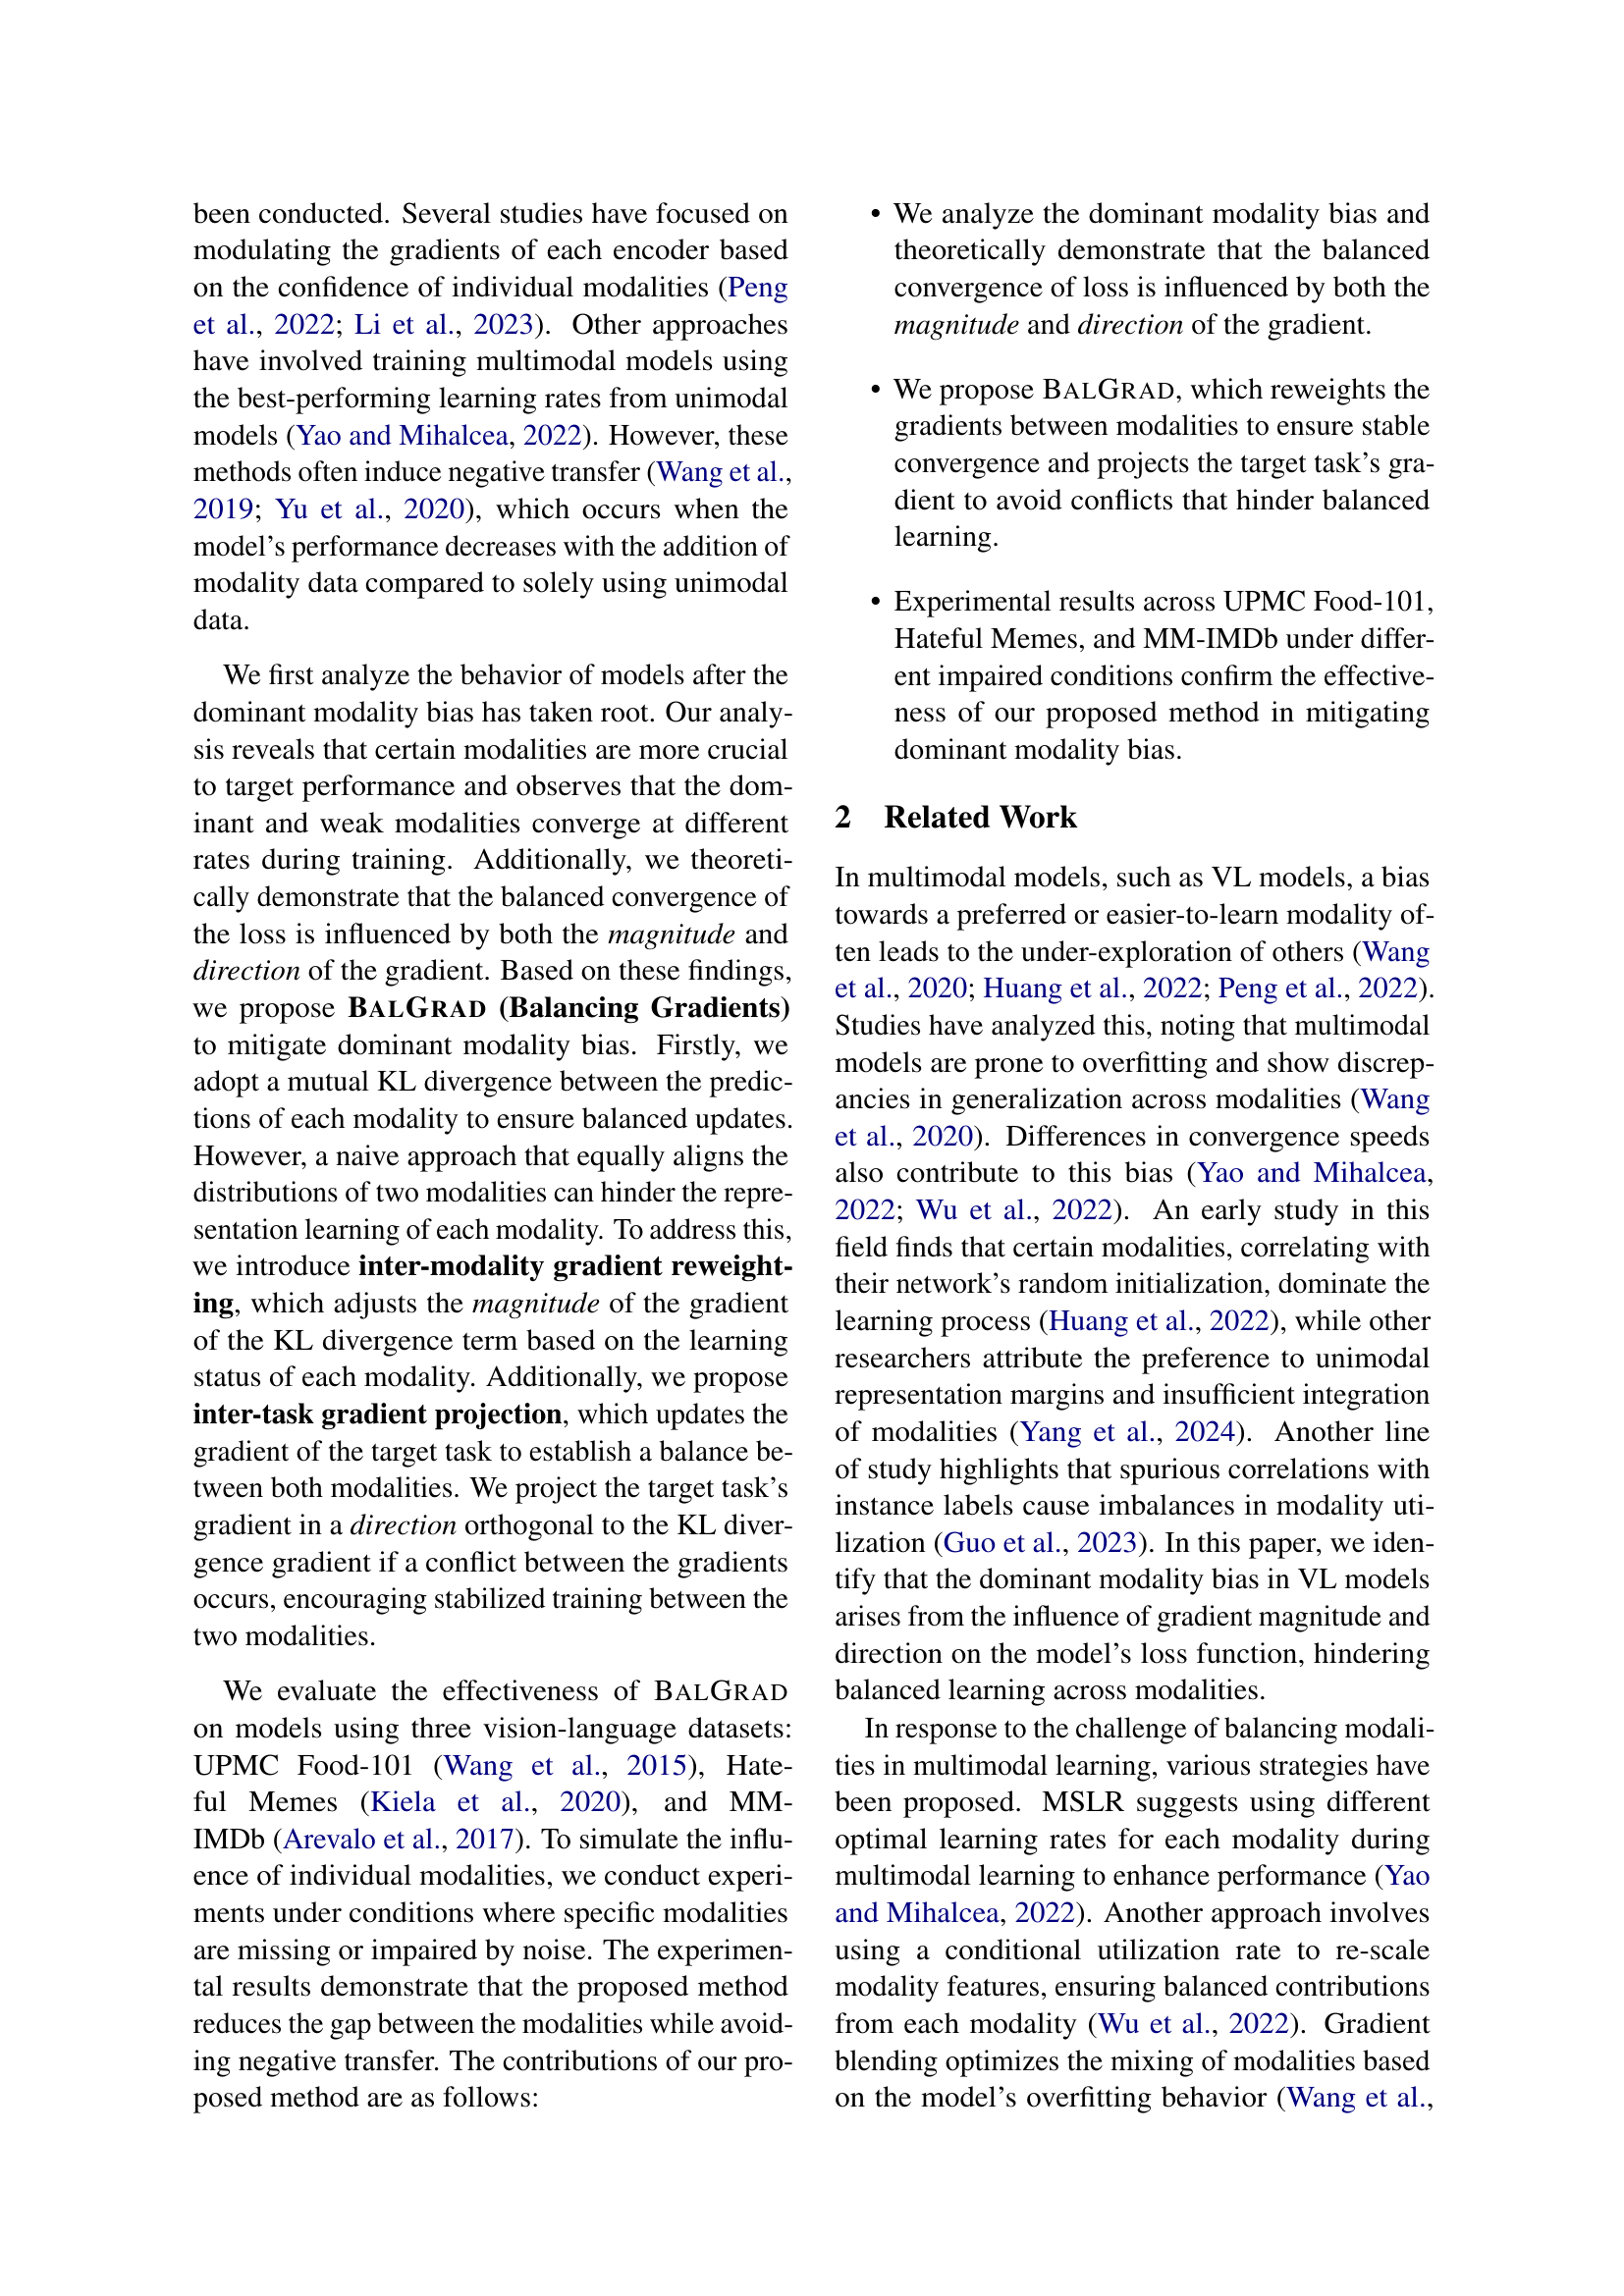
🔼 This figure presents the experimental results evaluating the impact of dominant modality bias on three vision-language datasets: UPMC Food-101, Hateful Memes, and MM-IMDb. Subfigure (a) shows a comparison of model performance across three conditions: when both image and text modalities are available (‘Full’), when only the image modality is available (‘Image only’), and when only the text modality is available (‘Text only’). This visualization reveals the extent to which each dataset exhibits a dominant modality bias. Subfigure (b) illustrates the training dynamics of the models. By plotting the loss curves for each modality (image and text) across the different datasets, the visualization helps demonstrate how the dominant modality achieves faster convergence and lower loss compared to the weaker modality. This difference in convergence rates underscores the existence of dominant modality bias, where one modality is disproportionately influential in the model’s predictions.
read the caption
Figure 2: Experimental results on the UPMC Food-101, Hateful Memes, and MM-IMDb datasets in the presence of dominant modality bias. (a) Performance visualization under different missing conditions (full, image only (missing text), text only (missing image)) for each dataset. (b) Illustration of learning curves for each modality across datasets.

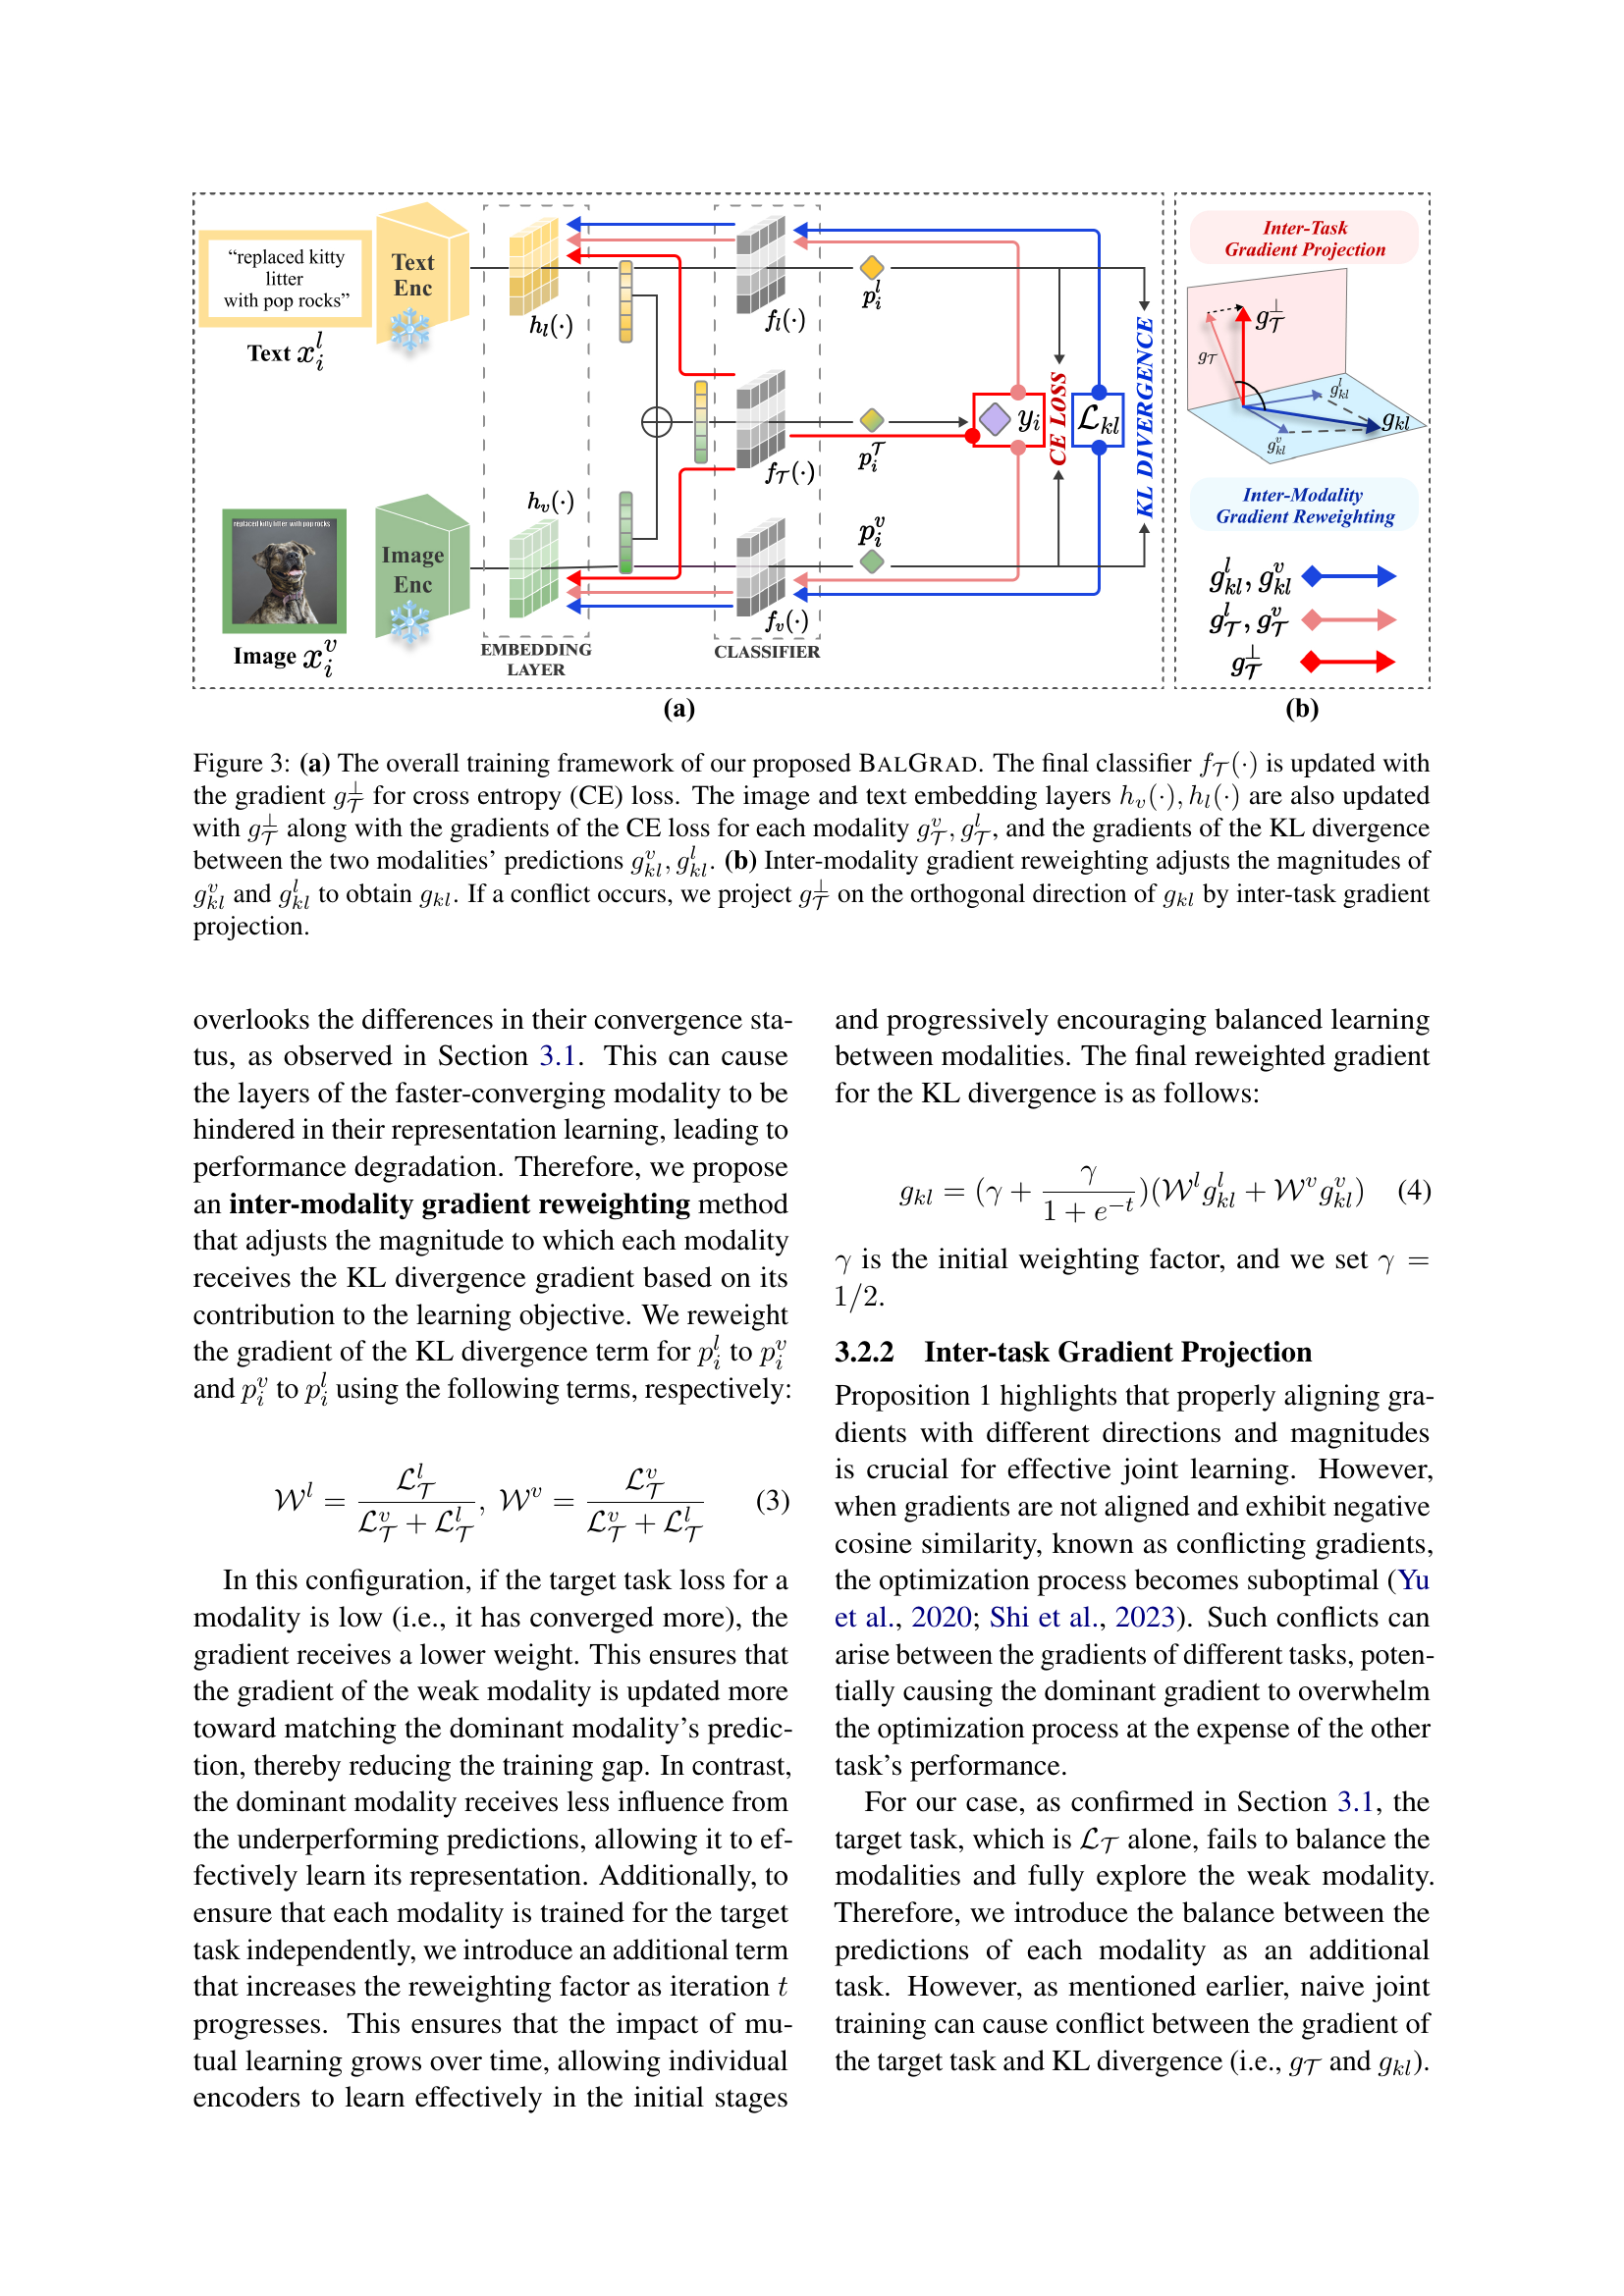
🔼 Figure 3 illustrates the architecture and training process of the proposed BalGrad model. (a) shows the overall framework where the image and text encoders produce embeddings that are concatenated and passed to a final classifier. The classifier is updated using the cross-entropy (CE) loss gradient and the gradients for the individual modalities and the KL divergence between the two modalities’ predictions. (b) details the inter-modality gradient reweighting and inter-task gradient projection components. Inter-modality gradient reweighting adjusts the magnitudes of KL divergence gradients based on each modality’s contribution. Inter-task gradient projection projects the main task gradient orthogonally to the KL divergence gradient when they conflict, ensuring balanced updates across modalities.
read the caption
Figure 3: (a) The overall training framework of our proposed BalGrad. The final classifier f𝒯(⋅)subscript𝑓𝒯⋅f_{\mathcal{T}}(\cdot)italic_f start_POSTSUBSCRIPT caligraphic_T end_POSTSUBSCRIPT ( ⋅ ) is updated with the gradient g𝒯⟂subscriptsuperscript𝑔perpendicular-to𝒯g^{\perp}_{\mathcal{T}}italic_g start_POSTSUPERSCRIPT ⟂ end_POSTSUPERSCRIPT start_POSTSUBSCRIPT caligraphic_T end_POSTSUBSCRIPT for cross entropy (CE) loss. The image and text embedding layers hv(⋅),hl(⋅)subscriptℎ𝑣⋅subscriptℎ𝑙⋅h_{v}(\cdot),h_{l}(\cdot)italic_h start_POSTSUBSCRIPT italic_v end_POSTSUBSCRIPT ( ⋅ ) , italic_h start_POSTSUBSCRIPT italic_l end_POSTSUBSCRIPT ( ⋅ ) are also updated with g𝒯⟂subscriptsuperscript𝑔perpendicular-to𝒯g^{\perp}_{\mathcal{T}}italic_g start_POSTSUPERSCRIPT ⟂ end_POSTSUPERSCRIPT start_POSTSUBSCRIPT caligraphic_T end_POSTSUBSCRIPT along with the gradients of the CE loss for each modality g𝒯v,g𝒯lsubscriptsuperscript𝑔𝑣𝒯subscriptsuperscript𝑔𝑙𝒯g^{v}_{\mathcal{T}},g^{l}_{\mathcal{T}}italic_g start_POSTSUPERSCRIPT italic_v end_POSTSUPERSCRIPT start_POSTSUBSCRIPT caligraphic_T end_POSTSUBSCRIPT , italic_g start_POSTSUPERSCRIPT italic_l end_POSTSUPERSCRIPT start_POSTSUBSCRIPT caligraphic_T end_POSTSUBSCRIPT, and the gradients of the KL divergence between the two modalities’ predictions gklv,gkllsubscriptsuperscript𝑔𝑣𝑘𝑙subscriptsuperscript𝑔𝑙𝑘𝑙g^{v}_{kl},g^{l}_{kl}italic_g start_POSTSUPERSCRIPT italic_v end_POSTSUPERSCRIPT start_POSTSUBSCRIPT italic_k italic_l end_POSTSUBSCRIPT , italic_g start_POSTSUPERSCRIPT italic_l end_POSTSUPERSCRIPT start_POSTSUBSCRIPT italic_k italic_l end_POSTSUBSCRIPT. (b) Inter-modality gradient reweighting adjusts the magnitudes of gklvsubscriptsuperscript𝑔𝑣𝑘𝑙g^{v}_{kl}italic_g start_POSTSUPERSCRIPT italic_v end_POSTSUPERSCRIPT start_POSTSUBSCRIPT italic_k italic_l end_POSTSUBSCRIPT and gkllsubscriptsuperscript𝑔𝑙𝑘𝑙g^{l}_{kl}italic_g start_POSTSUPERSCRIPT italic_l end_POSTSUPERSCRIPT start_POSTSUBSCRIPT italic_k italic_l end_POSTSUBSCRIPT to obtain gklsubscript𝑔𝑘𝑙g_{kl}italic_g start_POSTSUBSCRIPT italic_k italic_l end_POSTSUBSCRIPT. If a conflict occurs, we project g𝒯⟂subscriptsuperscript𝑔perpendicular-to𝒯g^{\perp}_{\mathcal{T}}italic_g start_POSTSUPERSCRIPT ⟂ end_POSTSUPERSCRIPT start_POSTSUBSCRIPT caligraphic_T end_POSTSUBSCRIPT on the orthogonal direction of gklsubscript𝑔𝑘𝑙g_{kl}italic_g start_POSTSUBSCRIPT italic_k italic_l end_POSTSUBSCRIPT by inter-task gradient projection.

🔼 This figure displays the robustness of the proposed BALGRAD model and three other existing models (MSLR, OGM-GE, and AGM) against varying degrees of missing data. The x-axis represents the percentage of missing data (missing ratio r) for either the image or text modality. The y-axis shows the performance gap, which is the difference in performance between conditions where only the image modality is missing and conditions where only the text modality is missing. The results are shown for three different datasets: UPMC Food-101, Hateful Memes, and MM-IMDb. A smaller performance gap indicates that the model is less biased toward a specific modality.
read the caption
Figure 4: Evaluation on robustness to different missing ratio r𝑟ritalic_r of BalGrad and existing methods on UPMC Food-101, Hateful Memes, and MM-IMDb datasets.

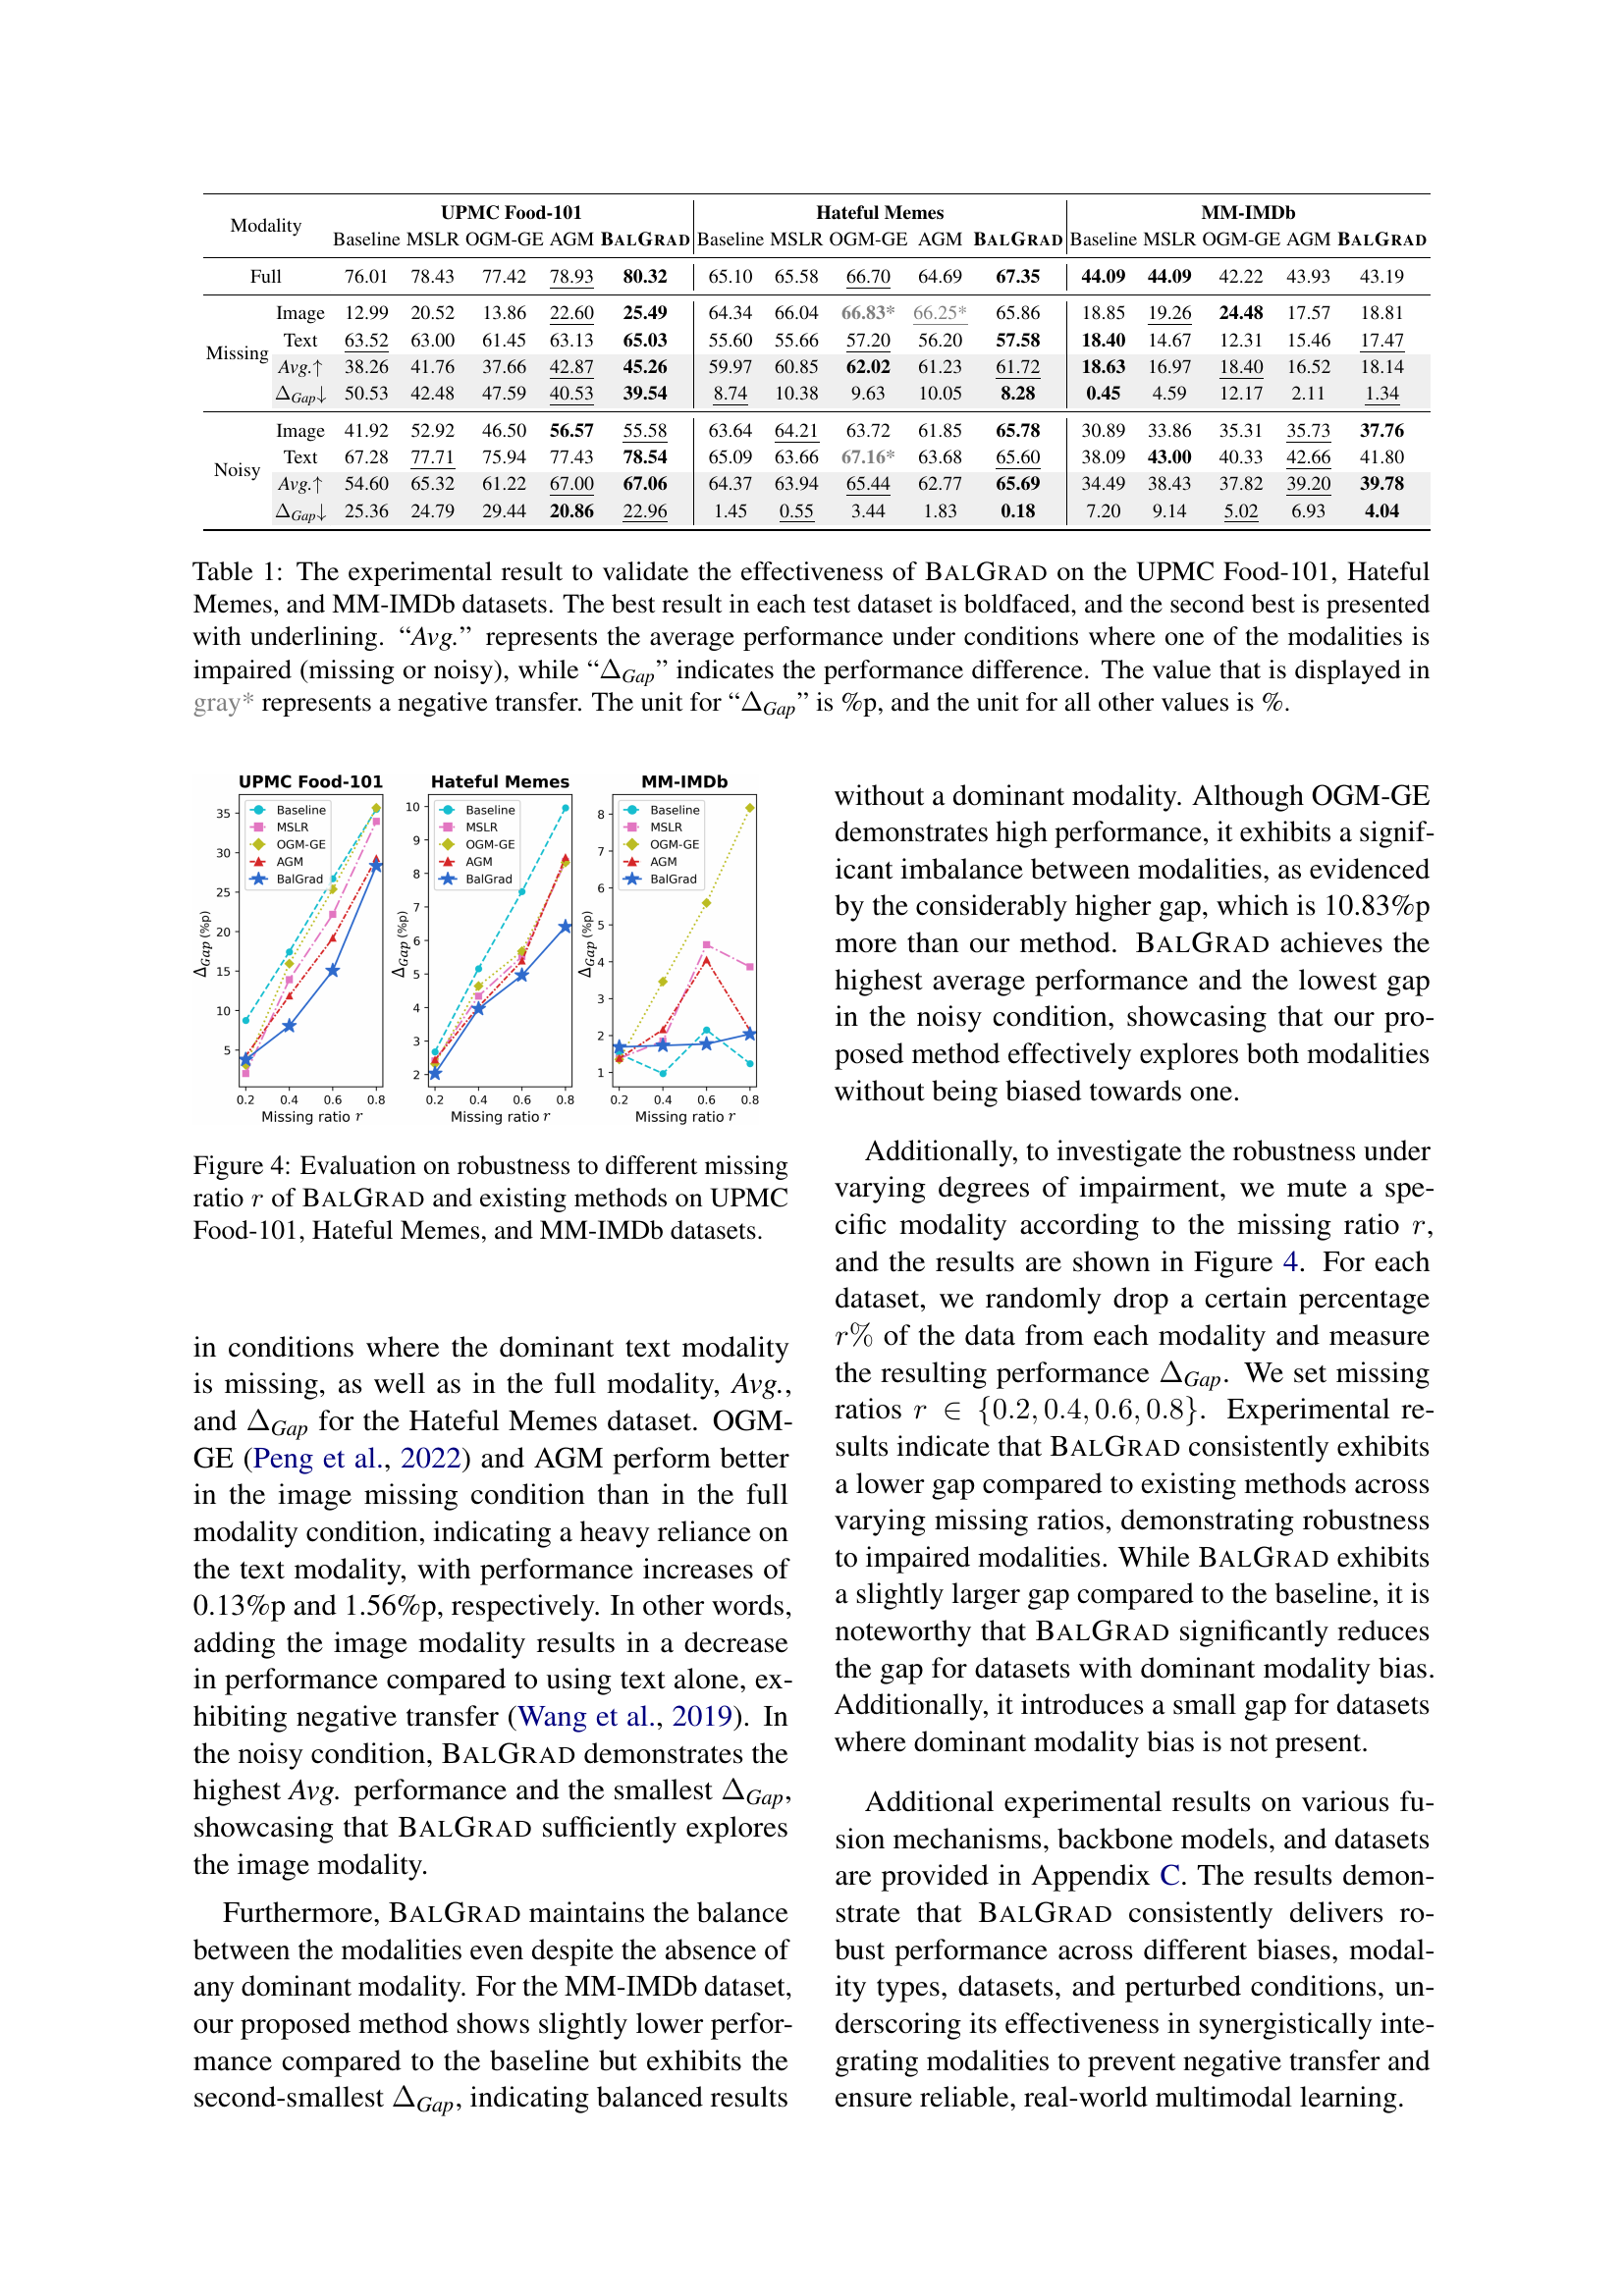
🔼 Figure 5 presents a comparison of the performance of several methods for mitigating dominant modality bias in vision-language models, specifically focusing on the impact of missing modalities. The models were evaluated using the BLIP architecture, and the results are shown in terms of ΔGap, which is the difference in performance between cases where only the image is available (missing text) and cases where only the text is available (missing image). Each bar in the plot represents the ΔGap for a specific method on one of the three datasets used in the study (UPMC Food-101, Hateful Memes, and MM-IMDb). A smaller ΔGap indicates better balance between the modalities and suggests less reliance on a dominant modality. The figure visually summarizes how effectively each model maintains performance across these missing modality conditions, highlighting BalGrad’s relative effectiveness in achieving modality balance.
read the caption
Figure 5: Bar plots comparing the performance of existing methods and BalGrad using BLIP. Each bar represents ΔGapsubscriptΔGap\Delta_{\textit{Gap}}roman_Δ start_POSTSUBSCRIPT Gap end_POSTSUBSCRIPT(%), defined as the performance difference between missing image and missing text conditions.

🔼 This figure displays the training loss curves for both image and text modalities across two datasets: UPMC Food-101 and Hateful Memes. Separate curves are shown for each modality under two conditions: with and without inter-modality gradient reweighting. This visual representation allows for a comparison of how the loss decreases over training iterations for each modality and the impact of the proposed inter-modality gradient reweighting technique on balancing the training dynamics between the image and text modalities.
read the caption
Figure 6: Training iteration loss curves for image and text modalities on the UPMC Food-101 and Hateful Memes datasets, comparing the effects of the existence of inter-modality gradient reweighting.

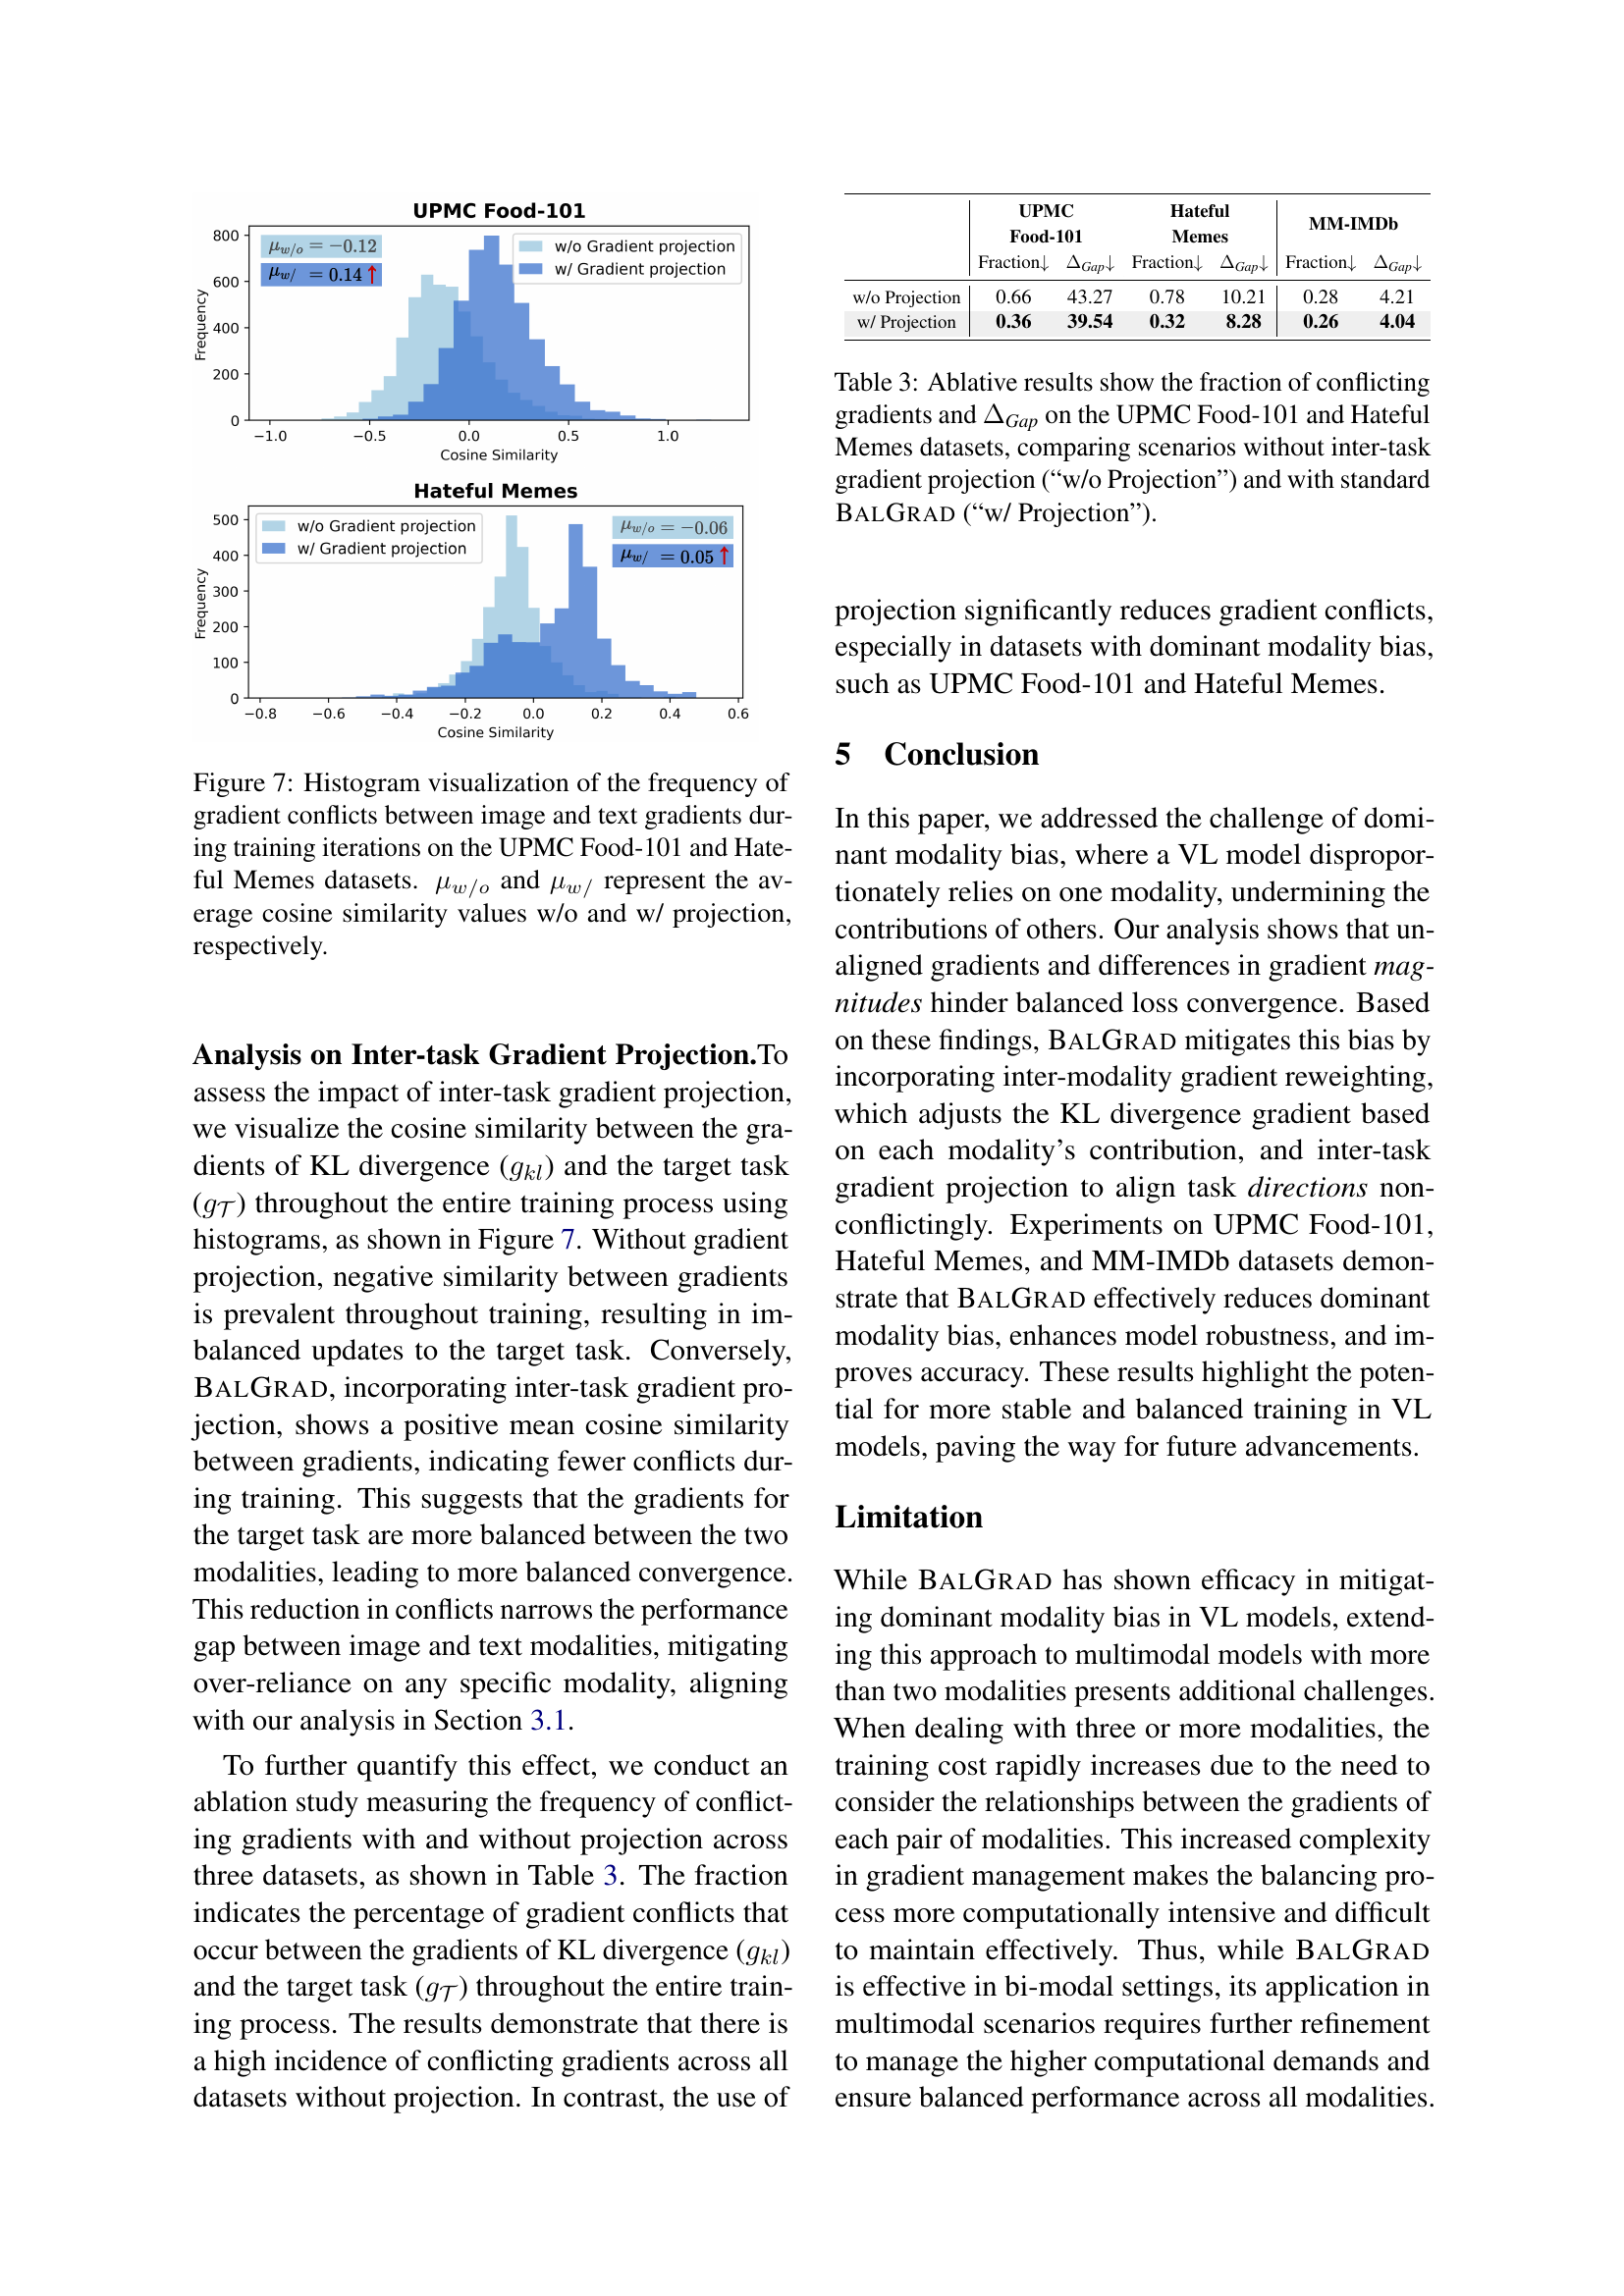
🔼 This figure displays histograms showing the distribution of cosine similarity between image and text gradients during the training process for two datasets: UPMC Food-101 and Hateful Memes. The cosine similarity measures the alignment of the gradients. A higher positive value indicates stronger alignment, implying that both modalities contribute effectively to the learning process. Conversely, negative values suggest conflicting gradients, where one modality might hinder the other’s learning. The histograms compare the gradient distributions with and without gradient projection. μw/o represents the average cosine similarity without gradient projection, while μw/ represents the average cosine similarity with gradient projection. The difference between these values illustrates the effectiveness of the gradient projection in reducing conflicts between modalities during training.
read the caption
Figure 7: Histogram visualization of the frequency of gradient conflicts between image and text gradients during training iterations on the UPMC Food-101 and Hateful Memes datasets. μw/osubscript𝜇𝑤𝑜\mu_{w/o}italic_μ start_POSTSUBSCRIPT italic_w / italic_o end_POSTSUBSCRIPT and μw/subscript𝜇𝑤\mu_{w/}italic_μ start_POSTSUBSCRIPT italic_w / end_POSTSUBSCRIPT represent the average cosine similarity values w/o and w/ projection, respectively.

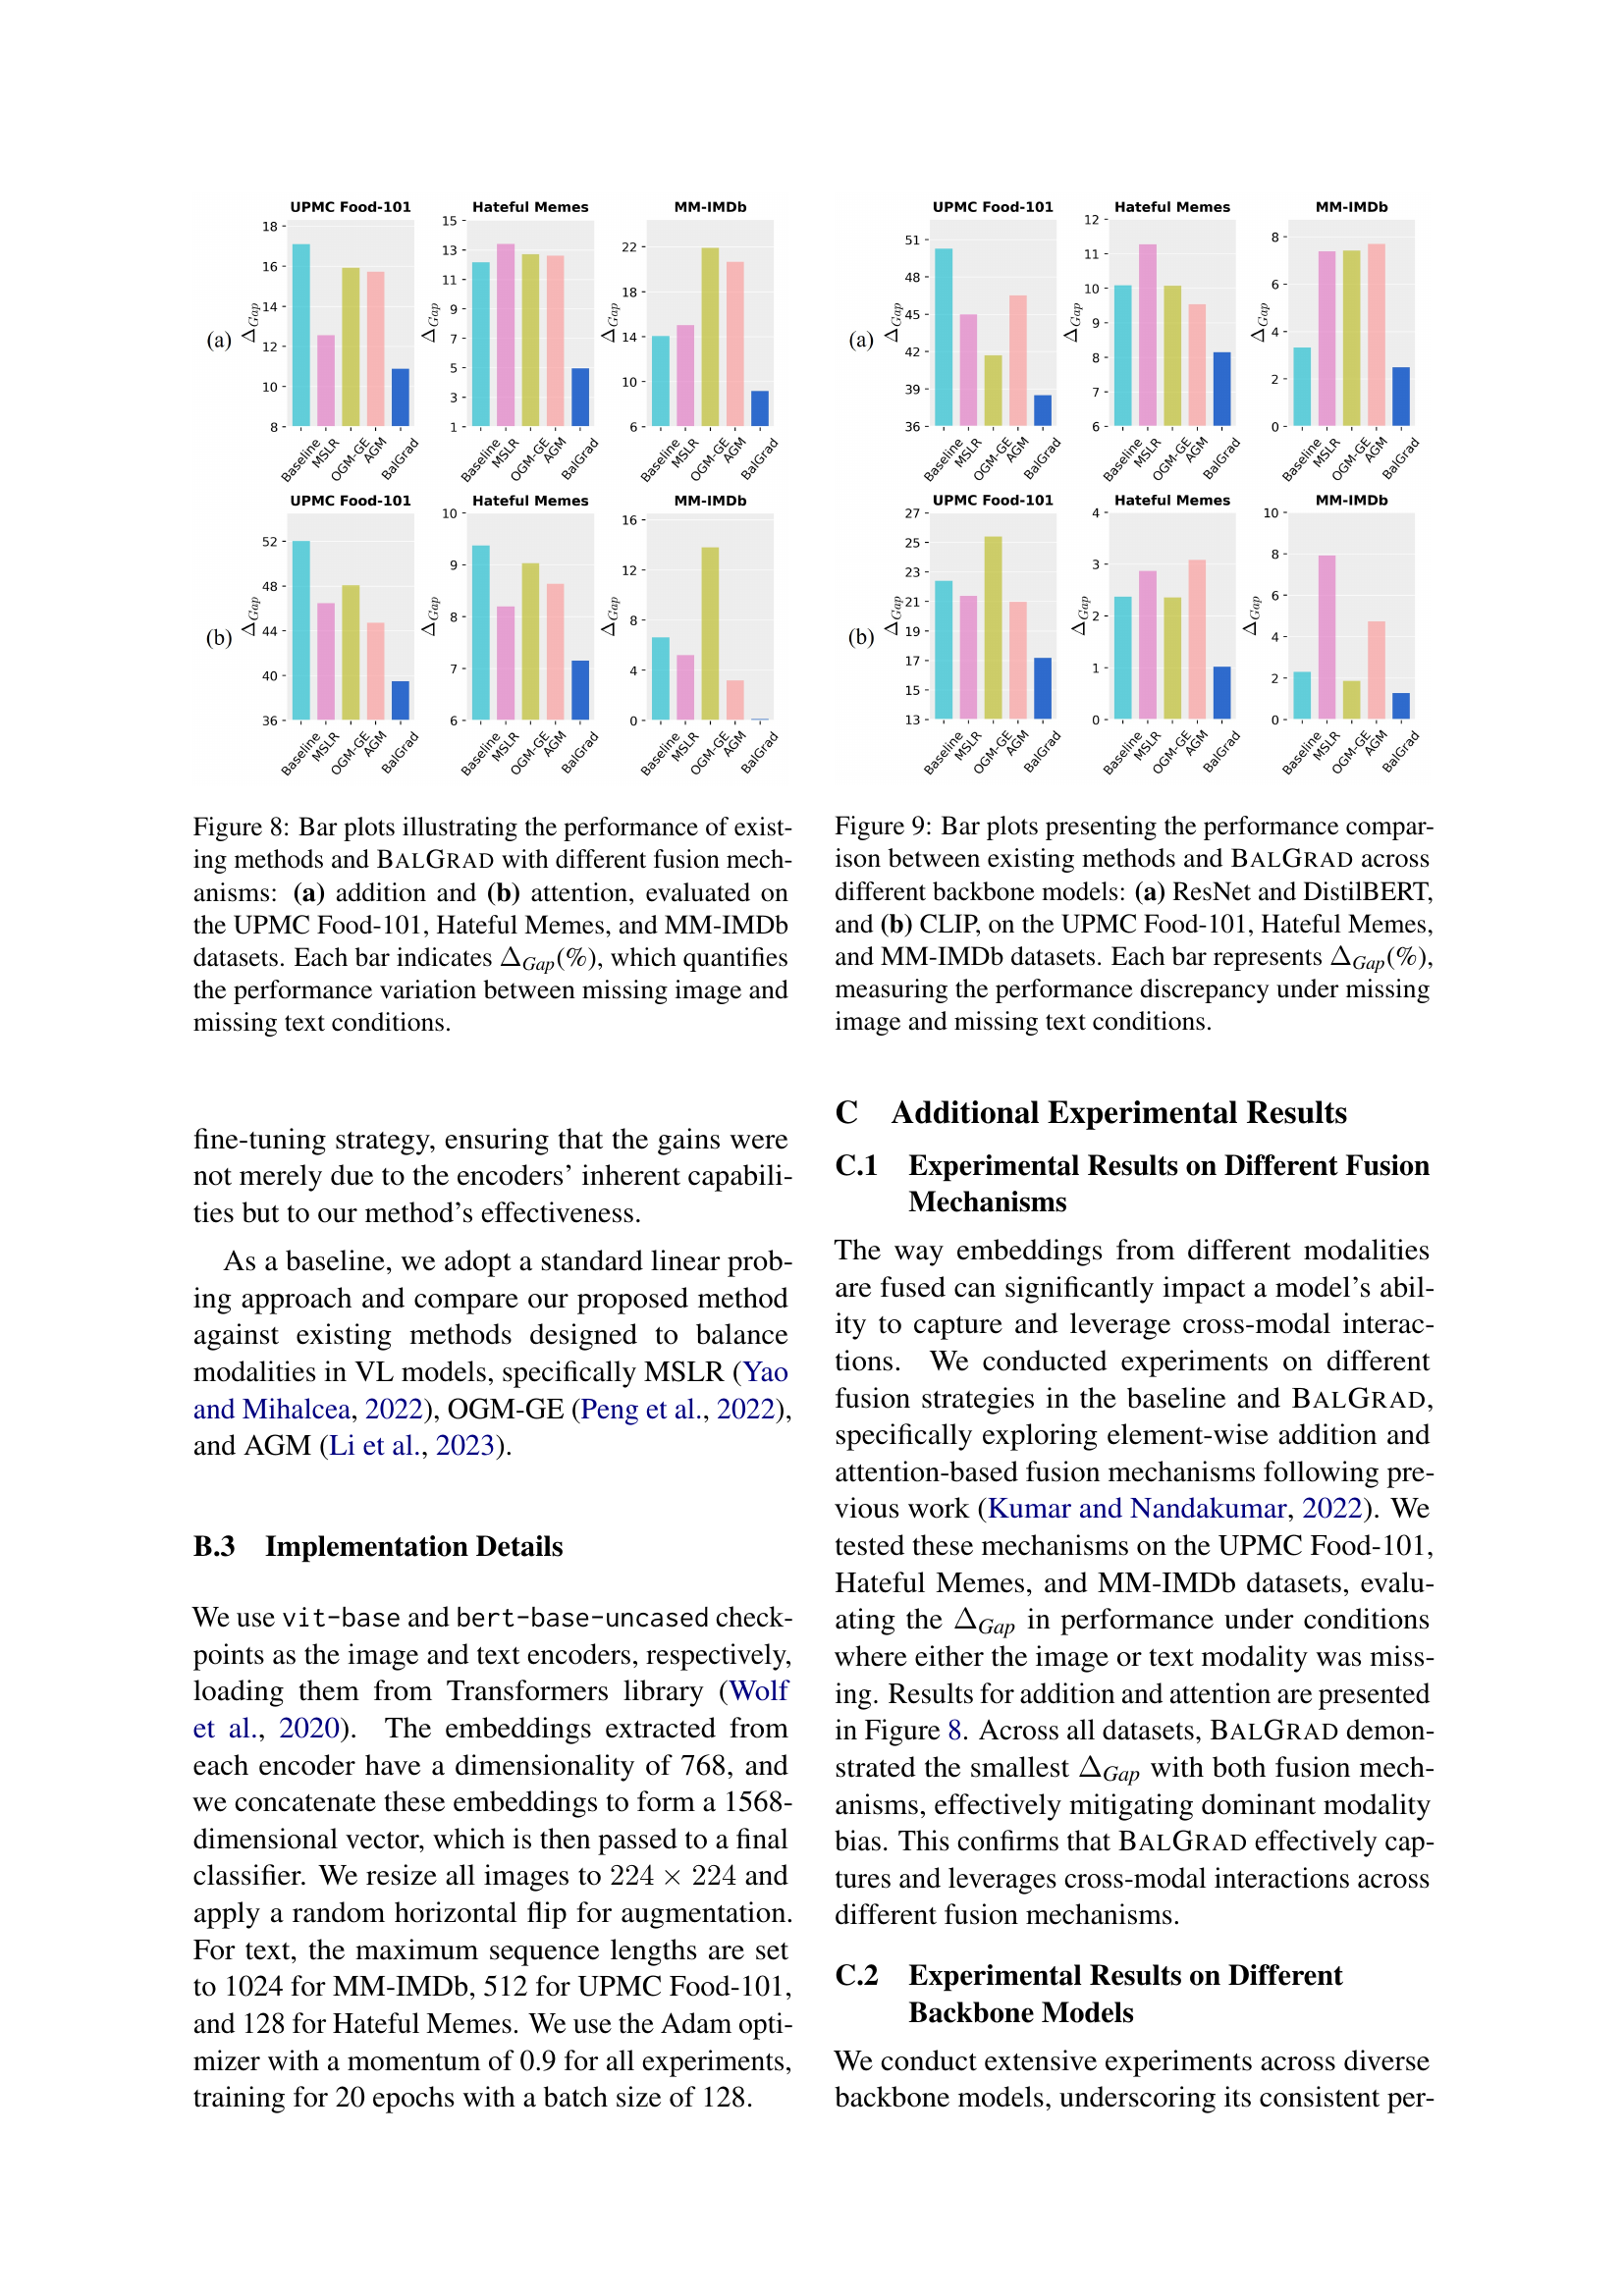
🔼 Figure 8 presents a comparative analysis of various multi-modal learning approaches, including BalGrad, across different fusion mechanisms (addition and attention). The experiments were conducted on three benchmark datasets: UPMC Food-101, Hateful Memes, and MM-IMDb. The bar plots display the performance difference (ΔGap) between scenarios where either the image or text modality was missing. A smaller ΔGap indicates a better balance in the model’s reliance on both modalities, with less over-dependence on one modality over the other.
read the caption
Figure 8: Bar plots illustrating the performance of existing methods and BalGrad with different fusion mechanisms: (a) addition and (b) attention, evaluated on the UPMC Food-101, Hateful Memes, and MM-IMDb datasets. Each bar indicates ΔGapsubscriptΔGap\Delta_{\textit{Gap}}roman_Δ start_POSTSUBSCRIPT Gap end_POSTSUBSCRIPT(%), which quantifies the performance variation between missing image and missing text conditions.

🔼 Figure 9 presents a comparative analysis of the performance of various methods, including BalGrad, across different vision-language model architectures. Specifically, it uses ResNet and DistilBERT in part (a), and CLIP in part (b) as backbone models. The datasets used for this comparison are UPMC Food-101, Hateful Memes, and MM-IMDb. The key metric shown is ΔGap, representing the performance difference between scenarios where either the image or text modality is missing. This illustrates the robustness of each model in handling scenarios with missing data from one of the modalities.
read the caption
Figure 9: Bar plots presenting the performance comparison between existing methods and BalGrad across different backbone models: (a) ResNet and DistilBERT, and (b) CLIP, on the UPMC Food-101, Hateful Memes, and MM-IMDb datasets. Each bar represents ΔGapsubscriptΔGap\Delta_{\textit{Gap}}roman_Δ start_POSTSUBSCRIPT Gap end_POSTSUBSCRIPT(%), measuring the performance discrepancy under missing image and missing text conditions.
More on tables
| UPMC Food-101 | Hateful Memes | MM-IMDb | |||||||||||||||||||||||
| Modality | Baseline |
|
| BalGrad | Baseline |
|
| BalGrad | Baseline |
|
| BalGrad | |||||||||||||
| Full | 76.01 | \ul78.17 | 76.20 | 80.32 | 65.10 | 65.80 | \ul66.30 | 67.35 | \ul44.09 | 44.30 | 42.30 | 43.19 | |||||||||||||
| Image | 12.99 | \ul22.30 | 19.82 | 25.49 | 64.34 | 66.37* | 65.40 | \ul65.86 | \ul18.85 | 21.48 | 18.47 | 18.81 | |||||||||||||
| Text | 63.52 | \ul64.10 | 63.76 | 65.03 | 55.60 | \ul57.03 | 56.20 | 57.48 | \ul18.40 | 17.20 | 18.80 | 17.47 | |||||||||||||
| Avg.↑ | 38.26 | \ul43.20 | 41.79 | 45.26 | 59.97 | 61.70 | 60.80 | \ul61.67 | 18.63 | 19.34 | \ul18.64 | 18.14 | |||||||||||||
| Missing | Gap | 50.53 | \ul41.80 | 43.94 | 39.54 | \ul8.74 | 9.34 | 9.20 | 8.38 | \ul0.45 | 4.28 | 0.33 | 1.34 | ||||||||||||
🔼 This ablation study investigates the effects of inter-modality gradient reweighting and inter-task gradient projection on model performance. The table compares results across three vision-language datasets (UPMC Food-101, Hateful Memes, and MM-IMDb) under various conditions: full modality data, image-only, and text-only. Performance metrics (accuracy and ΔGap, the performance difference between image-only and text-only conditions) are reported to assess the impact of the proposed components on dominant modality bias and negative transfer. Bold values represent the best performance, italicized values represent the second-best performance, and gray values indicate negative transfer (performance decrease with additional modalities). ΔGap is presented in percentage points while other values are in percentages.
read the caption
Table 2: Ablation study results compares performance with and without inter-modality gradient reweighting and inter-task gradient projection to evaluate their impact on modality balance and transfer effects on UPMC Food-101, Hateful Memes, and MM-IMDb datasets. The best results are highlighted in bold, the second-best in italics, and values shown in gray* indicate negative transfer. “ΔGapsubscriptΔGap\Delta_{\textit{Gap}}roman_Δ start_POSTSUBSCRIPT Gap end_POSTSUBSCRIPT” is reported in %p, while all other values are in %.
| w/ Gradient |
| reweighting |
🔼 This table presents an ablation study analyzing the impact of inter-task gradient projection in the BalGrad model. It shows, for the UPMC Food-101 and Hateful Memes datasets, the fraction of times conflicting gradients occurred during training (i.e., where the gradients of the main task and the KL divergence loss had negative cosine similarity). It also reports the performance difference (ΔGap) between the scenarios with and without the projection. The results demonstrate that the inter-task gradient projection in BalGrad effectively reduces the occurrence of gradient conflicts and improves the balance between modalities.
read the caption
Table 3: Ablative results show the fraction of conflicting gradients and ΔGapsubscriptΔGap\Delta_{\textit{Gap}}roman_Δ start_POSTSUBSCRIPT Gap end_POSTSUBSCRIPT on the UPMC Food-101 and Hateful Memes datasets, comparing scenarios without inter-task gradient projection (“w/o Projection”) and with standard BalGrad (“w/ Projection”).
| w/ Gradient |
| projection |
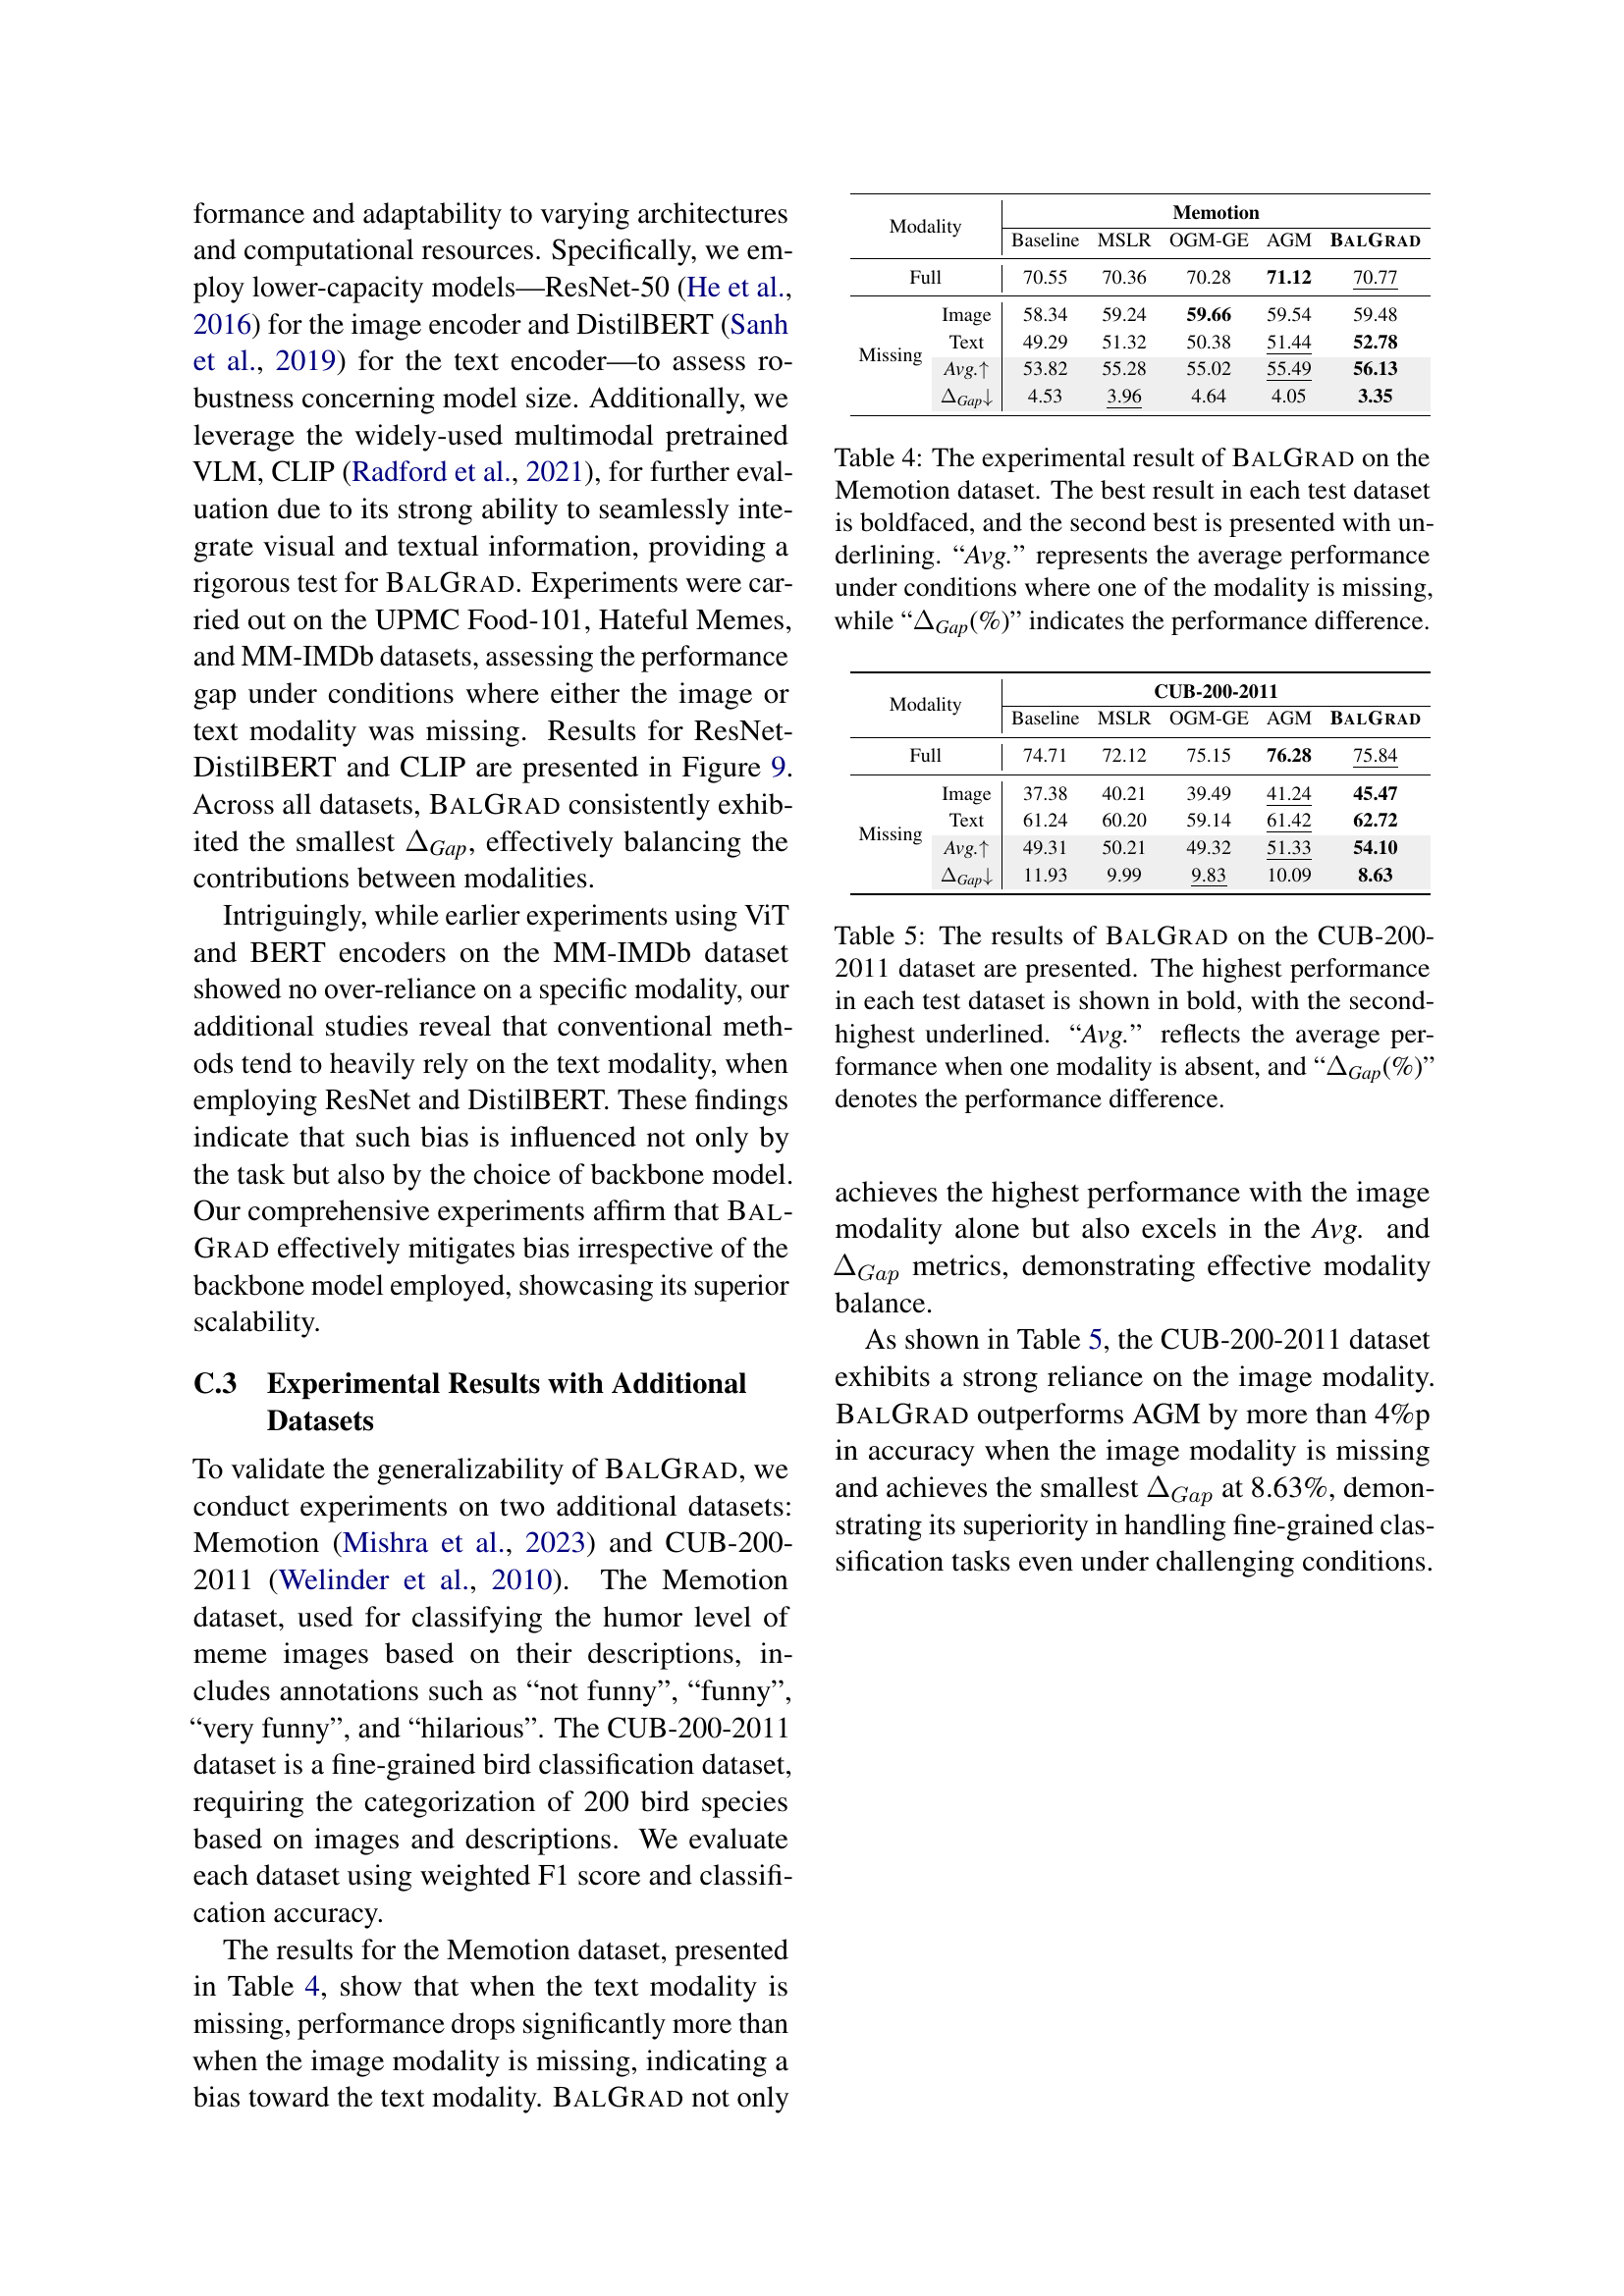
🔼 This table presents the results of the BALGRAD model on the Memotion dataset, which focuses on classifying the humor level of memes. It compares the performance of BALGRAD against baseline methods under different conditions: when all modalities (image and text) are available (‘Full’), when the image modality is missing (‘Missing Image’), and when the text modality is missing (‘Missing Text’). The table shows the performance metrics (presumably accuracy or similar) for each condition and calculates the average performance (‘Avg.’) across the missing modality conditions. Finally, it calculates the difference between the performance when the image is missing and the performance when the text is missing (‘ΔGap’), highlighting the model’s balance between modalities. A smaller ‘ΔGap’ indicates better balance.
read the caption
Table 4: The experimental result of BalGrad on the Memotion dataset. The best result in each test dataset is boldfaced, and the second best is presented with underlining. “Avg.” represents the average performance under conditions where one of the modality is missing, while “ΔGapsubscriptΔGap\Delta_{\textit{Gap}}roman_Δ start_POSTSUBSCRIPT Gap end_POSTSUBSCRIPT(%)” indicates the performance difference.
| w/ Gradient |
| reweighting |
🔼 Table 5 presents the performance of the BALGRAD model on the CUB-200-2011 dataset, focusing on scenarios with missing modalities (either image or text). The table shows the model’s performance under three conditions: when both image and text are present (‘Full’), when the image modality is missing (‘Missing Image’), and when the text modality is missing (‘Missing Text’). The ‘Avg.’ column represents the average performance across these missing modality conditions, illustrating the model’s robustness to missing data. Finally, the ‘ΔGap’ column displays the performance difference between ‘Missing Image’ and ‘Missing Text’ conditions. A smaller ΔGap suggests a more balanced model that doesn’t over-rely on a specific modality.
read the caption
Table 5: The results of BalGrad on the CUB-200-2011 dataset are presented. The highest performance in each test dataset is shown in bold, with the second-highest underlined. “Avg.” reflects the average performance when one modality is absent, and “ΔGapsubscriptΔGap\Delta_{\textit{Gap}}roman_Δ start_POSTSUBSCRIPT Gap end_POSTSUBSCRIPT(%)” denotes the performance difference.
Full paper#