TL;DR#
Diffusion models excel in image synthesis but demand significant resources, posing challenges for personalization on devices with limited memory. Existing methods still require significant memory for storing activations and gradients. This paper addresses the challenge by quantizing a diffusion model and leveraging zeroth-order optimization on personalization tokens. It allows personalization without backpropagation that requires considerable memory.
To improve noisy gradient estimation, the method projects it onto a subspace constructed with the past history of tokens, called Subspace Gradient. In addition, the study investigates the influence of text embedding in image generation, leading to Partial Uniform Timestep Sampling for sampling with effective diffusion timesteps. The method achieves comparable performance in image and text alignment scores while reducing training memory demand up to 8.2x.
Key Takeaways#
Why does it matter?#
This paper introduces a novel method, ZOODiP, for personalizing diffusion models on resource-constrained devices, like mobile phones, using forward passes only. This work is important as it makes personalized AI more accessible and paves the way for future research in memory-efficient on-device training. It challenges the traditional reliance on backpropagation and quantized models, offering a new direction for AI personalization.
Visual Insights#

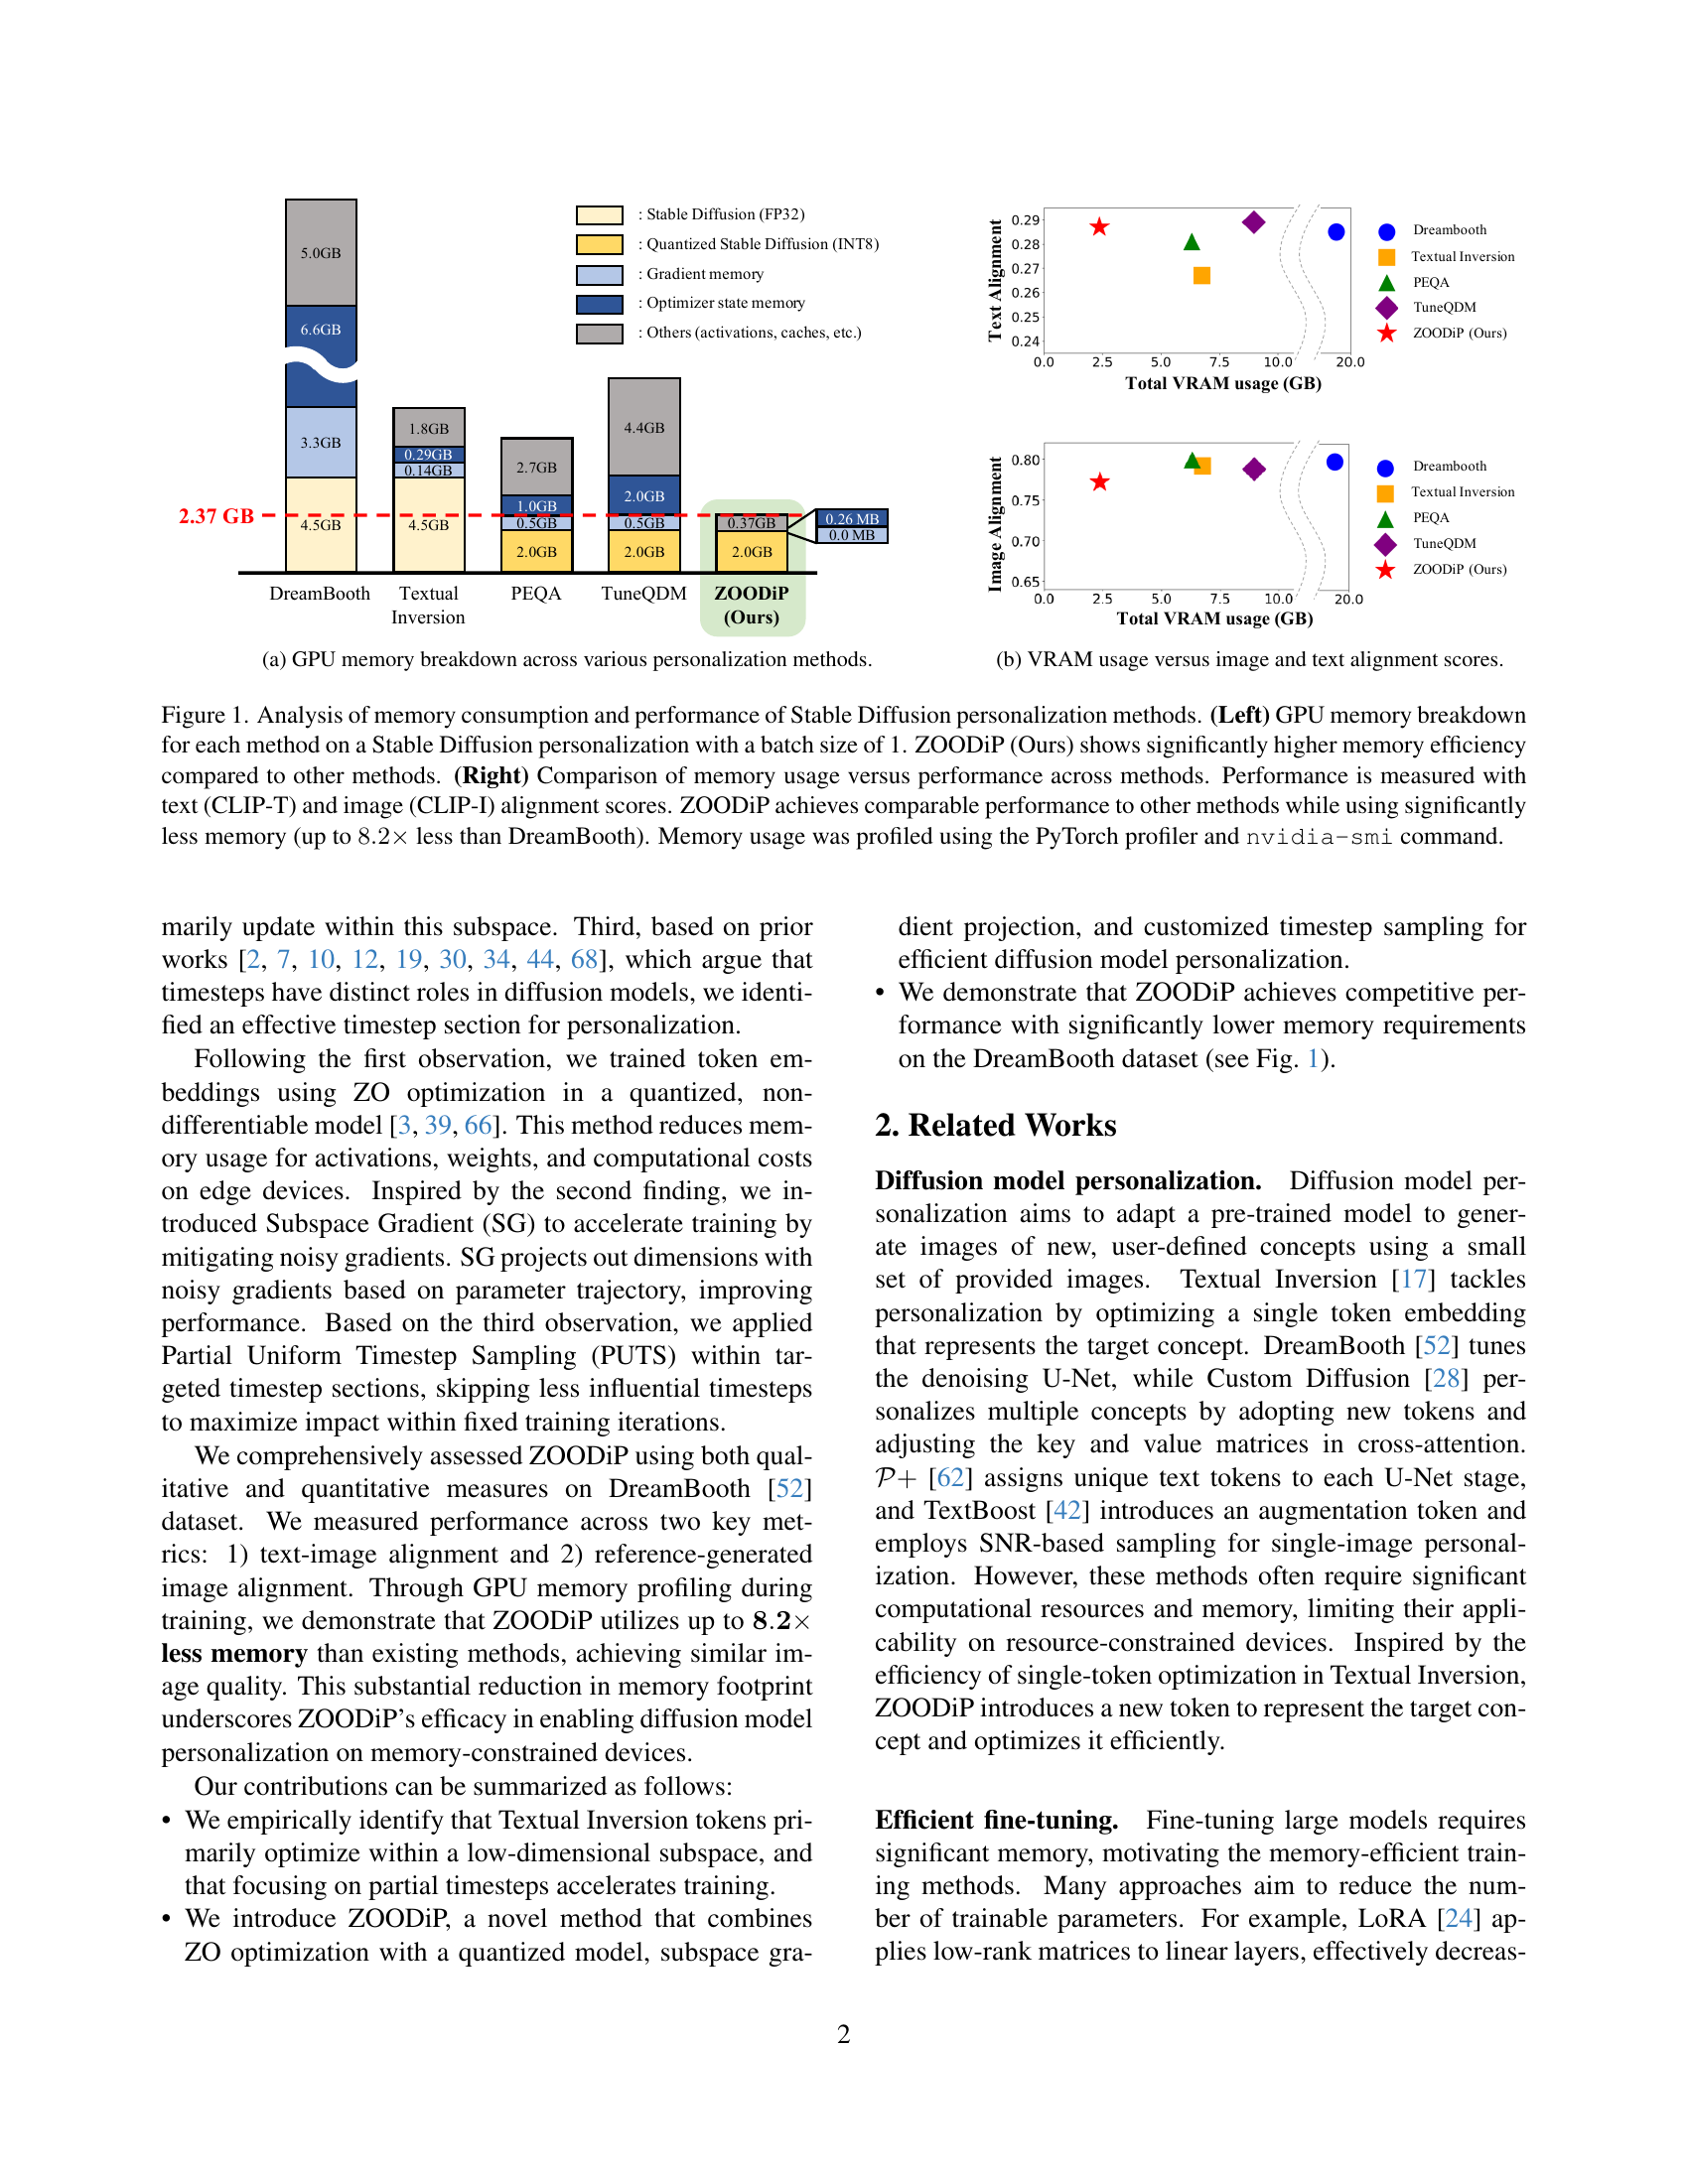
🔼 This figure (a) shows a detailed breakdown of GPU memory usage across different personalization methods for Stable Diffusion models. It visually represents the memory allocation for various components, such as the Stable Diffusion model itself (in FP32 and quantized INT8 versions), gradient memory, optimizer state memory, and other memory usage like activations and caches. This breakdown highlights the memory efficiency achieved by the proposed ZOODIP method compared to existing approaches (DreamBooth, Textual Inversion, PEQA, TuneQDM).
read the caption
(a) GPU memory breakdown across various personalization methods.
| Base. | Method | Quant. | Grad. Free | Mem. (GB) | Stor. (MB) | CLIP-T | CLIP-I | DINO |
| DB | DB [52] | ✗ | ✗ | 19.4 | 3438 | 0.281 | 0.782 | 0.592 |
| QLoRA [13] | ✓ | ✗ | 7.56 | 1.63 | 0.297 | 0.762 | 0.607 | |
| PEQA [26] | ✓ | ✗ | 6.31 | 1.32 | 0.275 | 0.791 | 0.604 | |
| TuneQDM [54] | ✓ | ✗ | 8.96 | 2.48 | 0.289 | 0.788 | 0.555 | |
| TI | TI [17] | ✗ | ✗ | 6.75 | 0.003 | 0.285 | 0.778 | 0.559 |
| GF-TI [16] | ✓ | ✓ | 2.37 | 0.003 | 0.253 | 0.540 | 0.011 | |
| ZOODiP (Ours) | ✓ | ✓ | 2.37 | 0.003 | 0.287 | 0.772 | 0.558 |
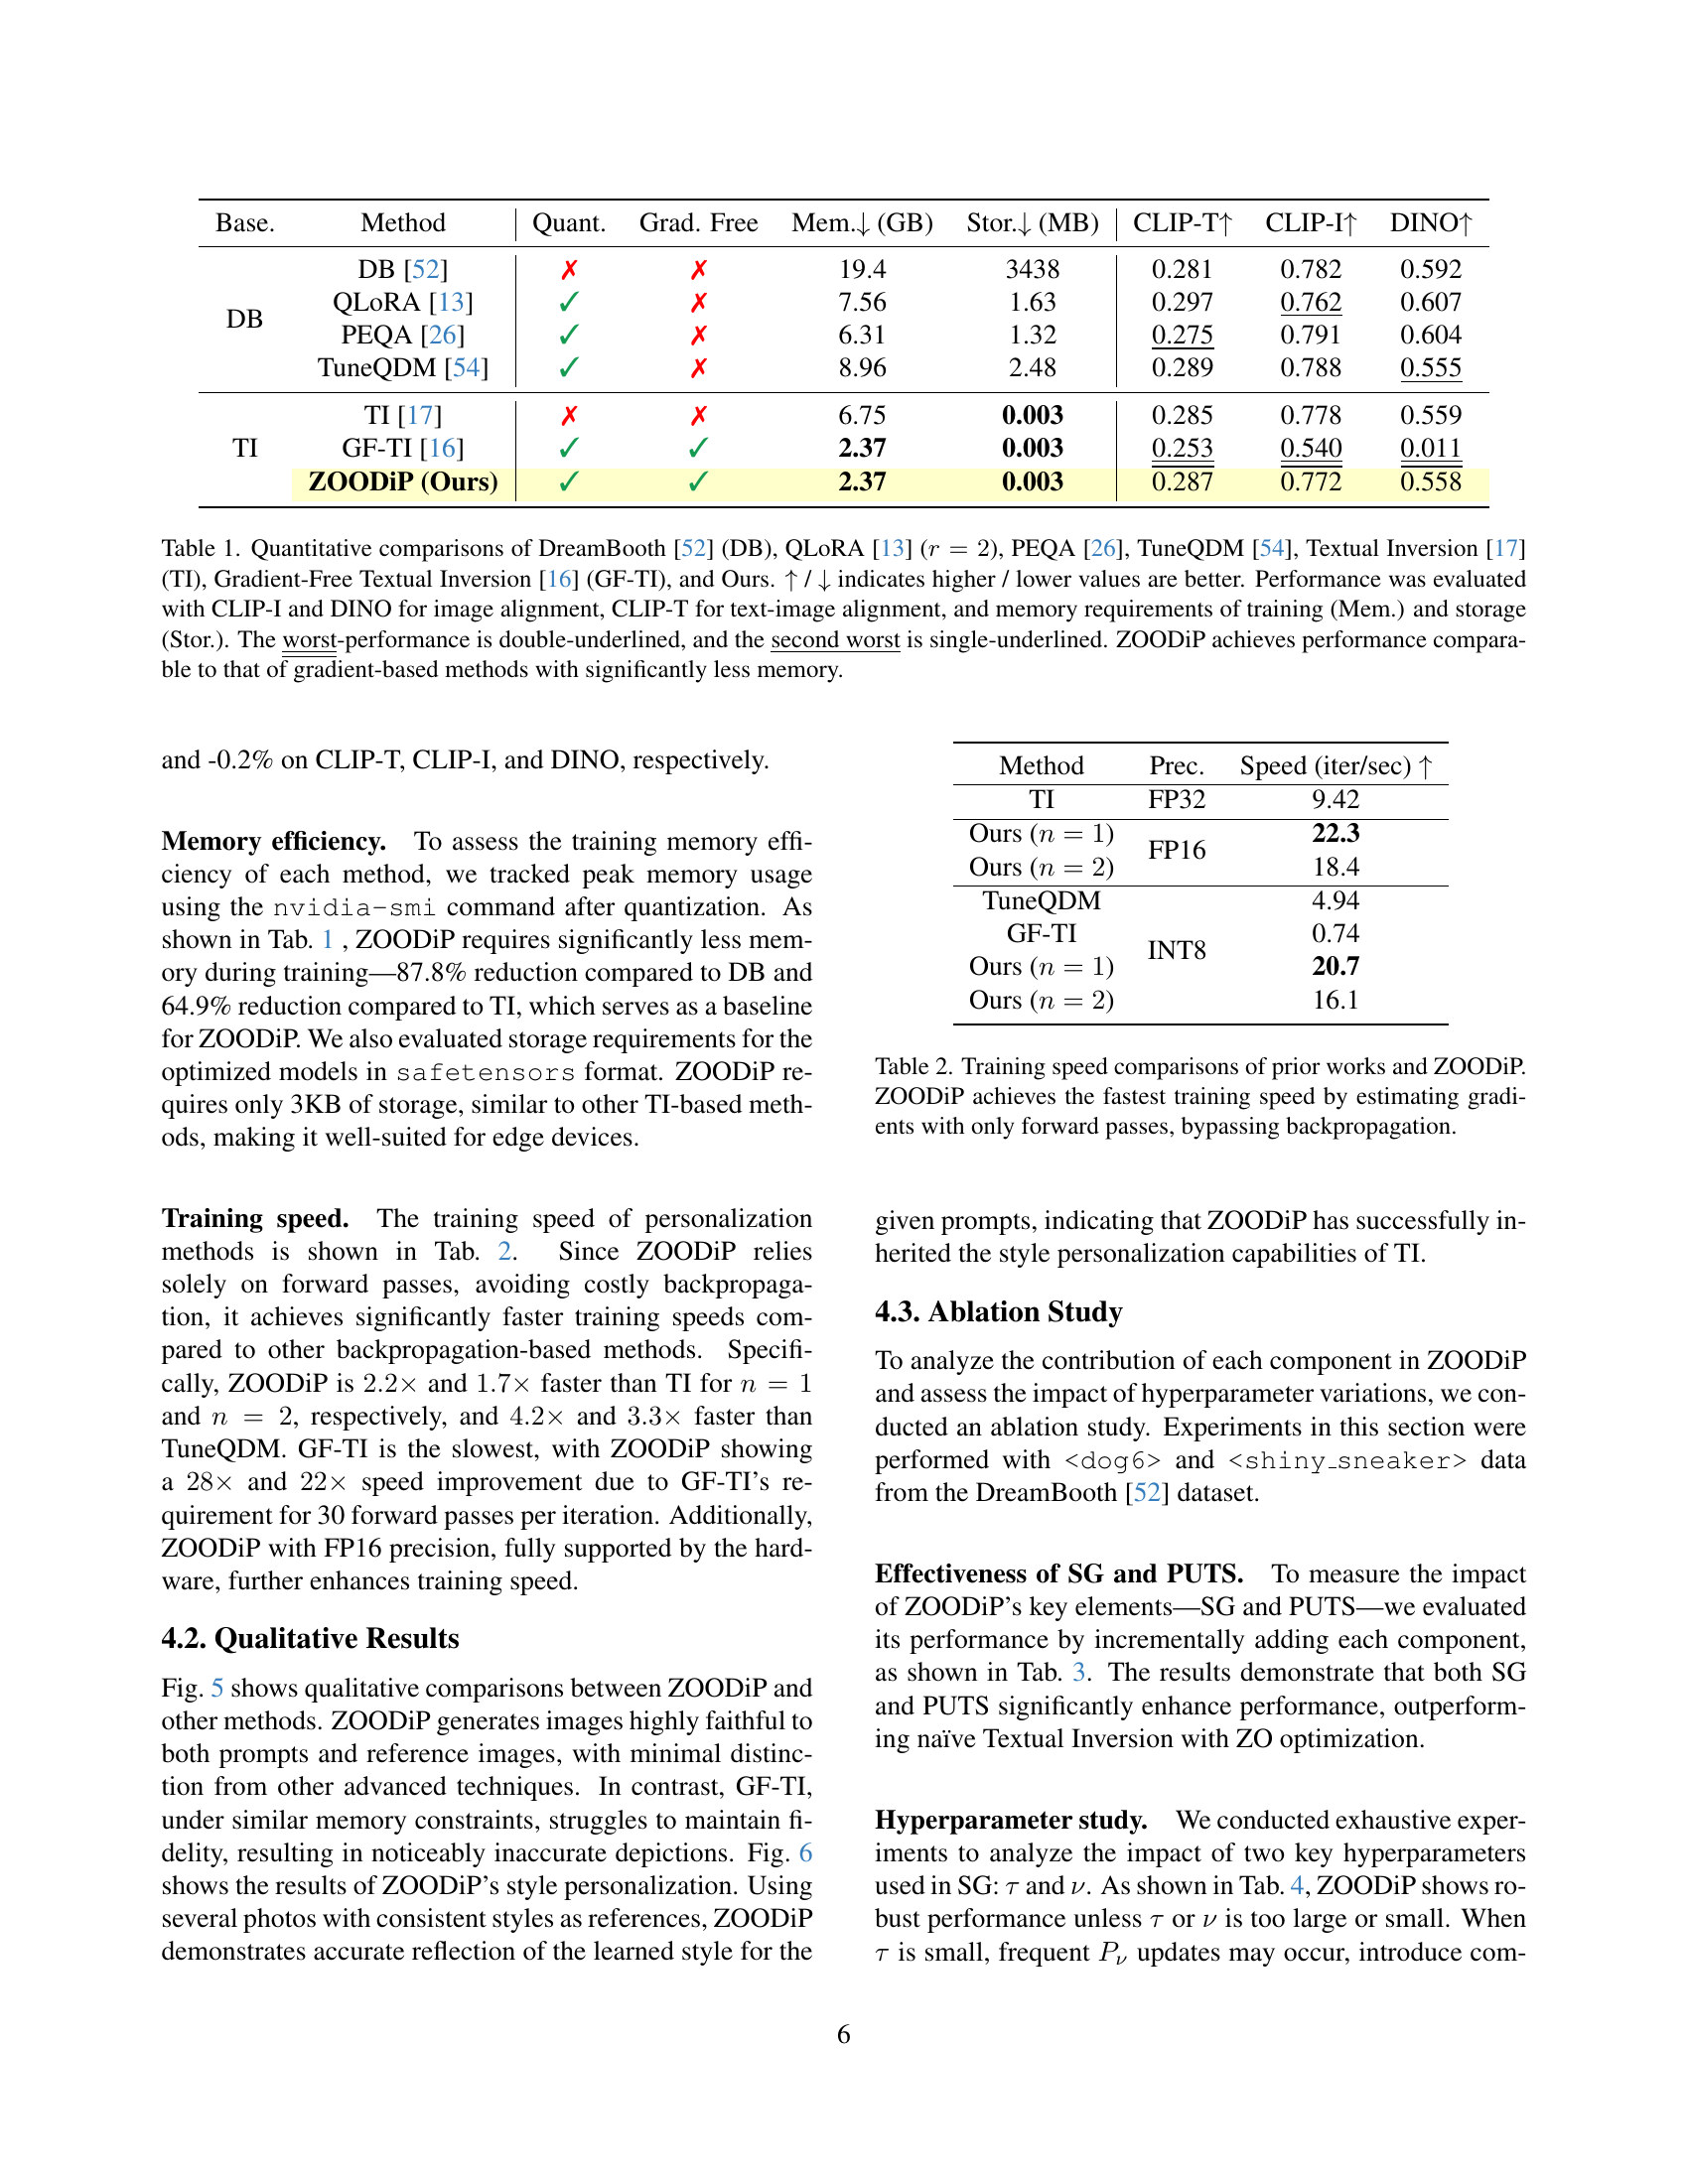
🔼 This table presents a quantitative comparison of several Stable Diffusion personalization methods, including DreamBooth, QLoRA, PEQA, TuneQDM, Textual Inversion, Gradient-Free Textual Inversion, and the authors’ proposed method, ZOODiP. It evaluates these methods across three key metrics: CLIP-I and DINO (image alignment scores), and CLIP-T (text-image alignment score). Furthermore, it compares their training memory usage and storage requirements. Higher scores for alignment metrics are better, while lower memory usage and storage are preferred. The table highlights ZOODiP’s comparable performance to gradient-based methods while significantly reducing memory consumption.
read the caption
Table 1: Quantitative comparisons of DreamBooth [52] (DB), QLoRA [13] (r=2𝑟2r=2italic_r = 2), PEQA [26], TuneQDM [54], Textual Inversion [17] (TI), Gradient-Free Textual Inversion [16] (GF-TI), and Ours. ↑↑\uparrow↑ / ↓↓\downarrow↓ indicates higher / lower values are better. Performance was evaluated with CLIP-I and DINO for image alignment, CLIP-T for text-image alignment, and memory requirements of training (Mem.) and storage (Stor.). The worst-performance is double-underlined, and the second worst is single-underlined. ZOODiP achieves performance comparable to that of gradient-based methods with significantly less memory.
In-depth insights#
Efficient ZOODiP#
Efficient ZOODiP, as a concept extrapolated from the paper, highlights memory-conscious personalization of diffusion models. It leverages zeroth-order optimization (ZO), which smartly navigates quantized model landscapes, avoiding costly backpropagation. By innovating with Subspace Gradient (SG), the method reduces noise and accelerates learning within pertinent token trajectory dimensions. Further bolstered by Partial Uniform Timestep Sampling (PUTS), training focuses where text embedding wields maximal influence, boosting efficiency. This multifaceted approach ensures comparable image quality while drastically curtailing memory demands, facilitating diffusion model adaptation on resource-constrained devices.
Subspace Gradient#
The ‘Subspace Gradient’ technique tackles the challenge of noisy gradient estimates common in zeroth-order optimization, particularly crucial when personalizing quantized diffusion models with limited data. It smartly leverages the observation that Textual Inversion tokens, representing personalized concepts, primarily update within a low-dimensional subspace. By projecting gradients onto this subspace, constructed from the past trajectory of token embeddings, the method filters out noisy dimensions, accelerating training and improving stability. This approach is particularly effective as it concentrates optimization efforts on the most relevant parameters, reflecting the core features of the concept being learned, while reducing the impact of irrelevant or misleading gradient signals. Furthermore, this subspace focus aligns with the intrinsic structure of the data, leading to more efficient and reliable learning.
PUTS Timestep#
Partial Uniform Timestep Sampling (PUTS) is a technique used in diffusion models to improve training efficiency. It addresses the fact that different timesteps in a diffusion model play distinct roles, especially in text-to-image synthesis. Prior works indicate that text conditioning has varying impacts across timesteps, but most focus on inference or training from scratch. PUTS strategically samples timesteps within a specific range where the text embedding has the most significant influence. This focuses computation on the most informative timesteps, skipping less influential ones. This tailored approach potentially leads to faster convergence and improved image quality by prioritizing the most impactful diffusion steps, making the training process more efficient overall.
Quantized Model#
Quantized models offer a promising avenue for efficient deep learning, particularly in resource-constrained environments. The core idea revolves around reducing the precision of numerical representations of weights and activations, typically from 32-bit floating-point to 8-bit integer or even lower. This leads to a smaller memory footprint, faster computation, and reduced energy consumption. However, quantization can introduce challenges, such as accuracy degradation due to the limited representational capacity. Careful design is needed to strike a balance between efficiency and performance, with techniques like quantization-aware training and post-training quantization playing crucial roles. Furthermore, specialized hardware, such as INT8-optimized processors, can significantly accelerate inference with quantized models. The trade-offs between different quantization schemes and their suitability for various tasks and hardware platforms remain active areas of research.
Memory Savings#
The document highlights the critical issue of memory consumption in diffusion models, especially during training, fine-tuning, and personalization. Addressing this, it introduces ZOODiP, a novel approach aimed at reducing memory footprint during personalization. The analysis dives into various techniques like quantization and zeroth-order optimization. Quantization is employed to minimize memory usage for weights and activations. Zeroth-order optimization is used to avoid the need for backpropagation, which is memory-intensive, and Subspace Gradient is introduced to mitigate noisy gradients, further enhancing memory efficiency. It emphasizes the importance of memory savings for on-device personalization, where resources are limited. The document shows a comparison of memory consumption with other methods, underscoring ZOODiP’s ability to significantly reduce memory demand, making diffusion model personalization more feasible on resource-constrained devices. Key aspects contributing to these savings include quantizing, subspace gradient usage, and targeted timestep sections.
More visual insights#
More on figures

🔼 This figure shows a comparison of the total VRAM (video RAM) usage of different Stable Diffusion personalization methods against their performance. Performance is evaluated using two metrics: image alignment score (CLIP-I) and text alignment score (CLIP-T). The chart visually represents the trade-off between memory efficiency and the quality of image and text alignment achieved by each method. It allows for a direct comparison of how much VRAM each technique requires to achieve a certain level of performance.
read the caption
(b) VRAM usage versus image and text alignment scores.

🔼 This figure analyzes the memory usage and performance of various Stable Diffusion personalization methods. The left panel shows a detailed breakdown of GPU memory consumption for each method using a batch size of 1. It highlights that ZOODIP (the authors’ method) uses significantly less memory than other methods like DreamBooth, Textual Inversion, PEQA, and TuneQDM. The right panel presents a comparison of memory usage and model performance, where performance is evaluated using text (CLIP-T) and image (CLIP-I) alignment scores. ZOODIP achieves comparable performance to other methods while exhibiting up to 8.2 times less memory consumption than DreamBooth. Memory usage was measured using the PyTorch profiler and the nvidia-smi command.
read the caption
Figure 1: Analysis of memory consumption and performance of Stable Diffusion personalization methods. (Left) GPU memory breakdown for each method on a Stable Diffusion personalization with a batch size of 1. ZOODiP (Ours) shows significantly higher memory efficiency compared to other methods. (Right) Comparison of memory usage versus performance across methods. Performance is measured with text (CLIP-T) and image (CLIP-I) alignment scores. ZOODiP achieves comparable performance to other methods while using significantly less memory (up to 8.2×8.2\times8.2 × less than DreamBooth). Memory usage was profiled using the PyTorch profiler and nvidia-smi command.

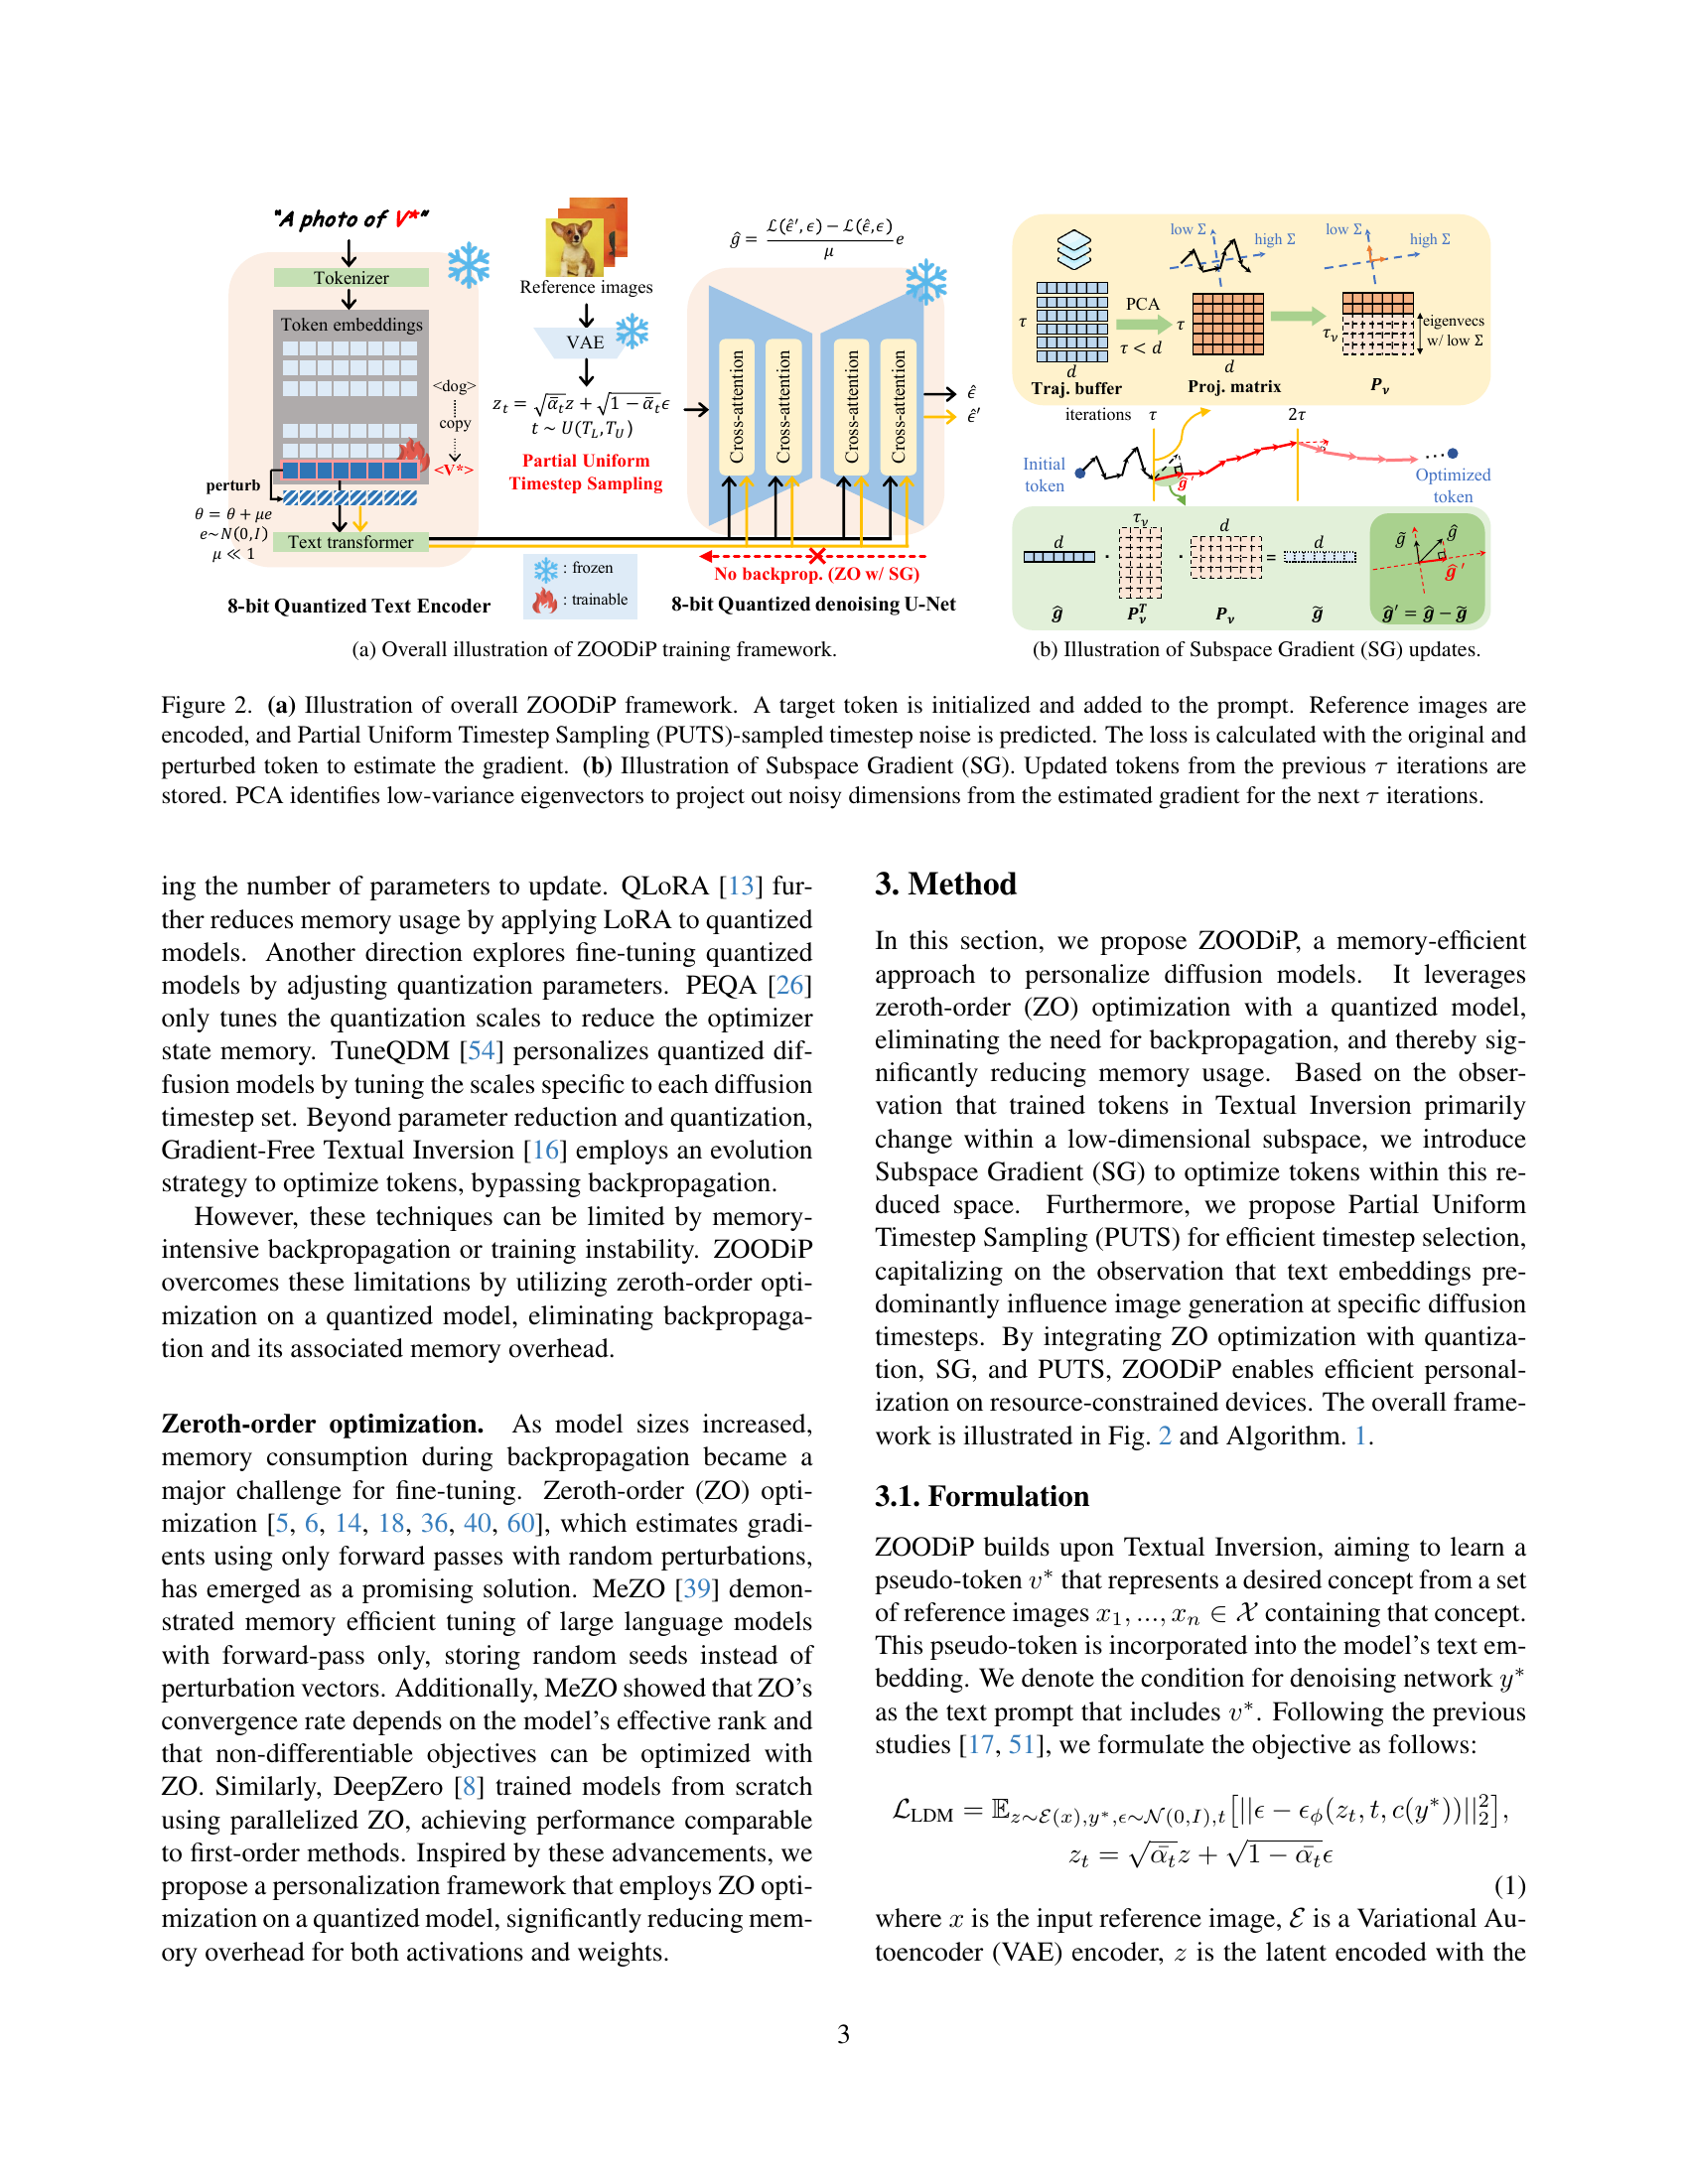
🔼 The figure illustrates the training framework of ZOODiP, a memory-efficient personalization method for diffusion models. It shows how a target token is initialized and added to a text prompt, reference images are encoded and processed through a VAE, and the noise is predicted using partial uniform timestep sampling. The gradient is calculated using zeroth-order optimization with subspace gradient and updated with no backpropagation. The overall framework combines zeroth-order optimization with a quantized model to minimize memory usage during the fine-tuning process.
read the caption
(a) Overall illustration of ZOODiP training framework.

🔼 This figure illustrates the Subspace Gradient (SG) update mechanism in ZOODiP. It shows how the algorithm denoises the noisy gradient estimates obtained from the zeroth-order optimization process by projecting them onto a lower-dimensional subspace spanned by the past history of the tokens. The past tokens are analyzed using Principal Component Analysis (PCA) to identify a low-variance subspace, and a projection matrix is constructed using the eigenvectors corresponding to the retained dimensions. Noisy gradient dimensions are eliminated by projecting out dimensions associated with low variance. The result is a refined gradient that improves training efficiency and stability.
read the caption
(b) Illustration of Subspace Gradient (SG) updates.

🔼 Figure 2 illustrates the ZOODiP framework. Panel (a) shows the process of personalization. A new token is added to the text prompt. Reference images are encoded using a Variational Autoencoder (VAE). PUTS (Partial Uniform Timestep Sampling) selects a subset of timesteps in the diffusion process. The model predicts noise at these timesteps. Then, the model calculates the loss using the original and a perturbed version of the token, estimating the gradient without backpropagation. Panel (b) shows how the Subspace Gradient (SG) method denoises this noisy gradient estimate. Token updates from the previous τ iterations are collected and used for Principal Component Analysis (PCA). PCA identifies low-variance directions, which are then projected out of the gradient to reduce noise before the next τ updates.
read the caption
Figure 2: (a) Illustration of overall ZOODiP framework. A target token is initialized and added to the prompt. Reference images are encoded, and Partial Uniform Timestep Sampling (PUTS)-sampled timestep noise is predicted. The loss is calculated with the original and perturbed token to estimate the gradient. (b) Illustration of Subspace Gradient (SG). Updated tokens from the previous τ𝜏\tauitalic_τ iterations are stored. PCA identifies low-variance eigenvectors to project out noisy dimensions from the estimated gradient for the next τ𝜏\tauitalic_τ iterations.

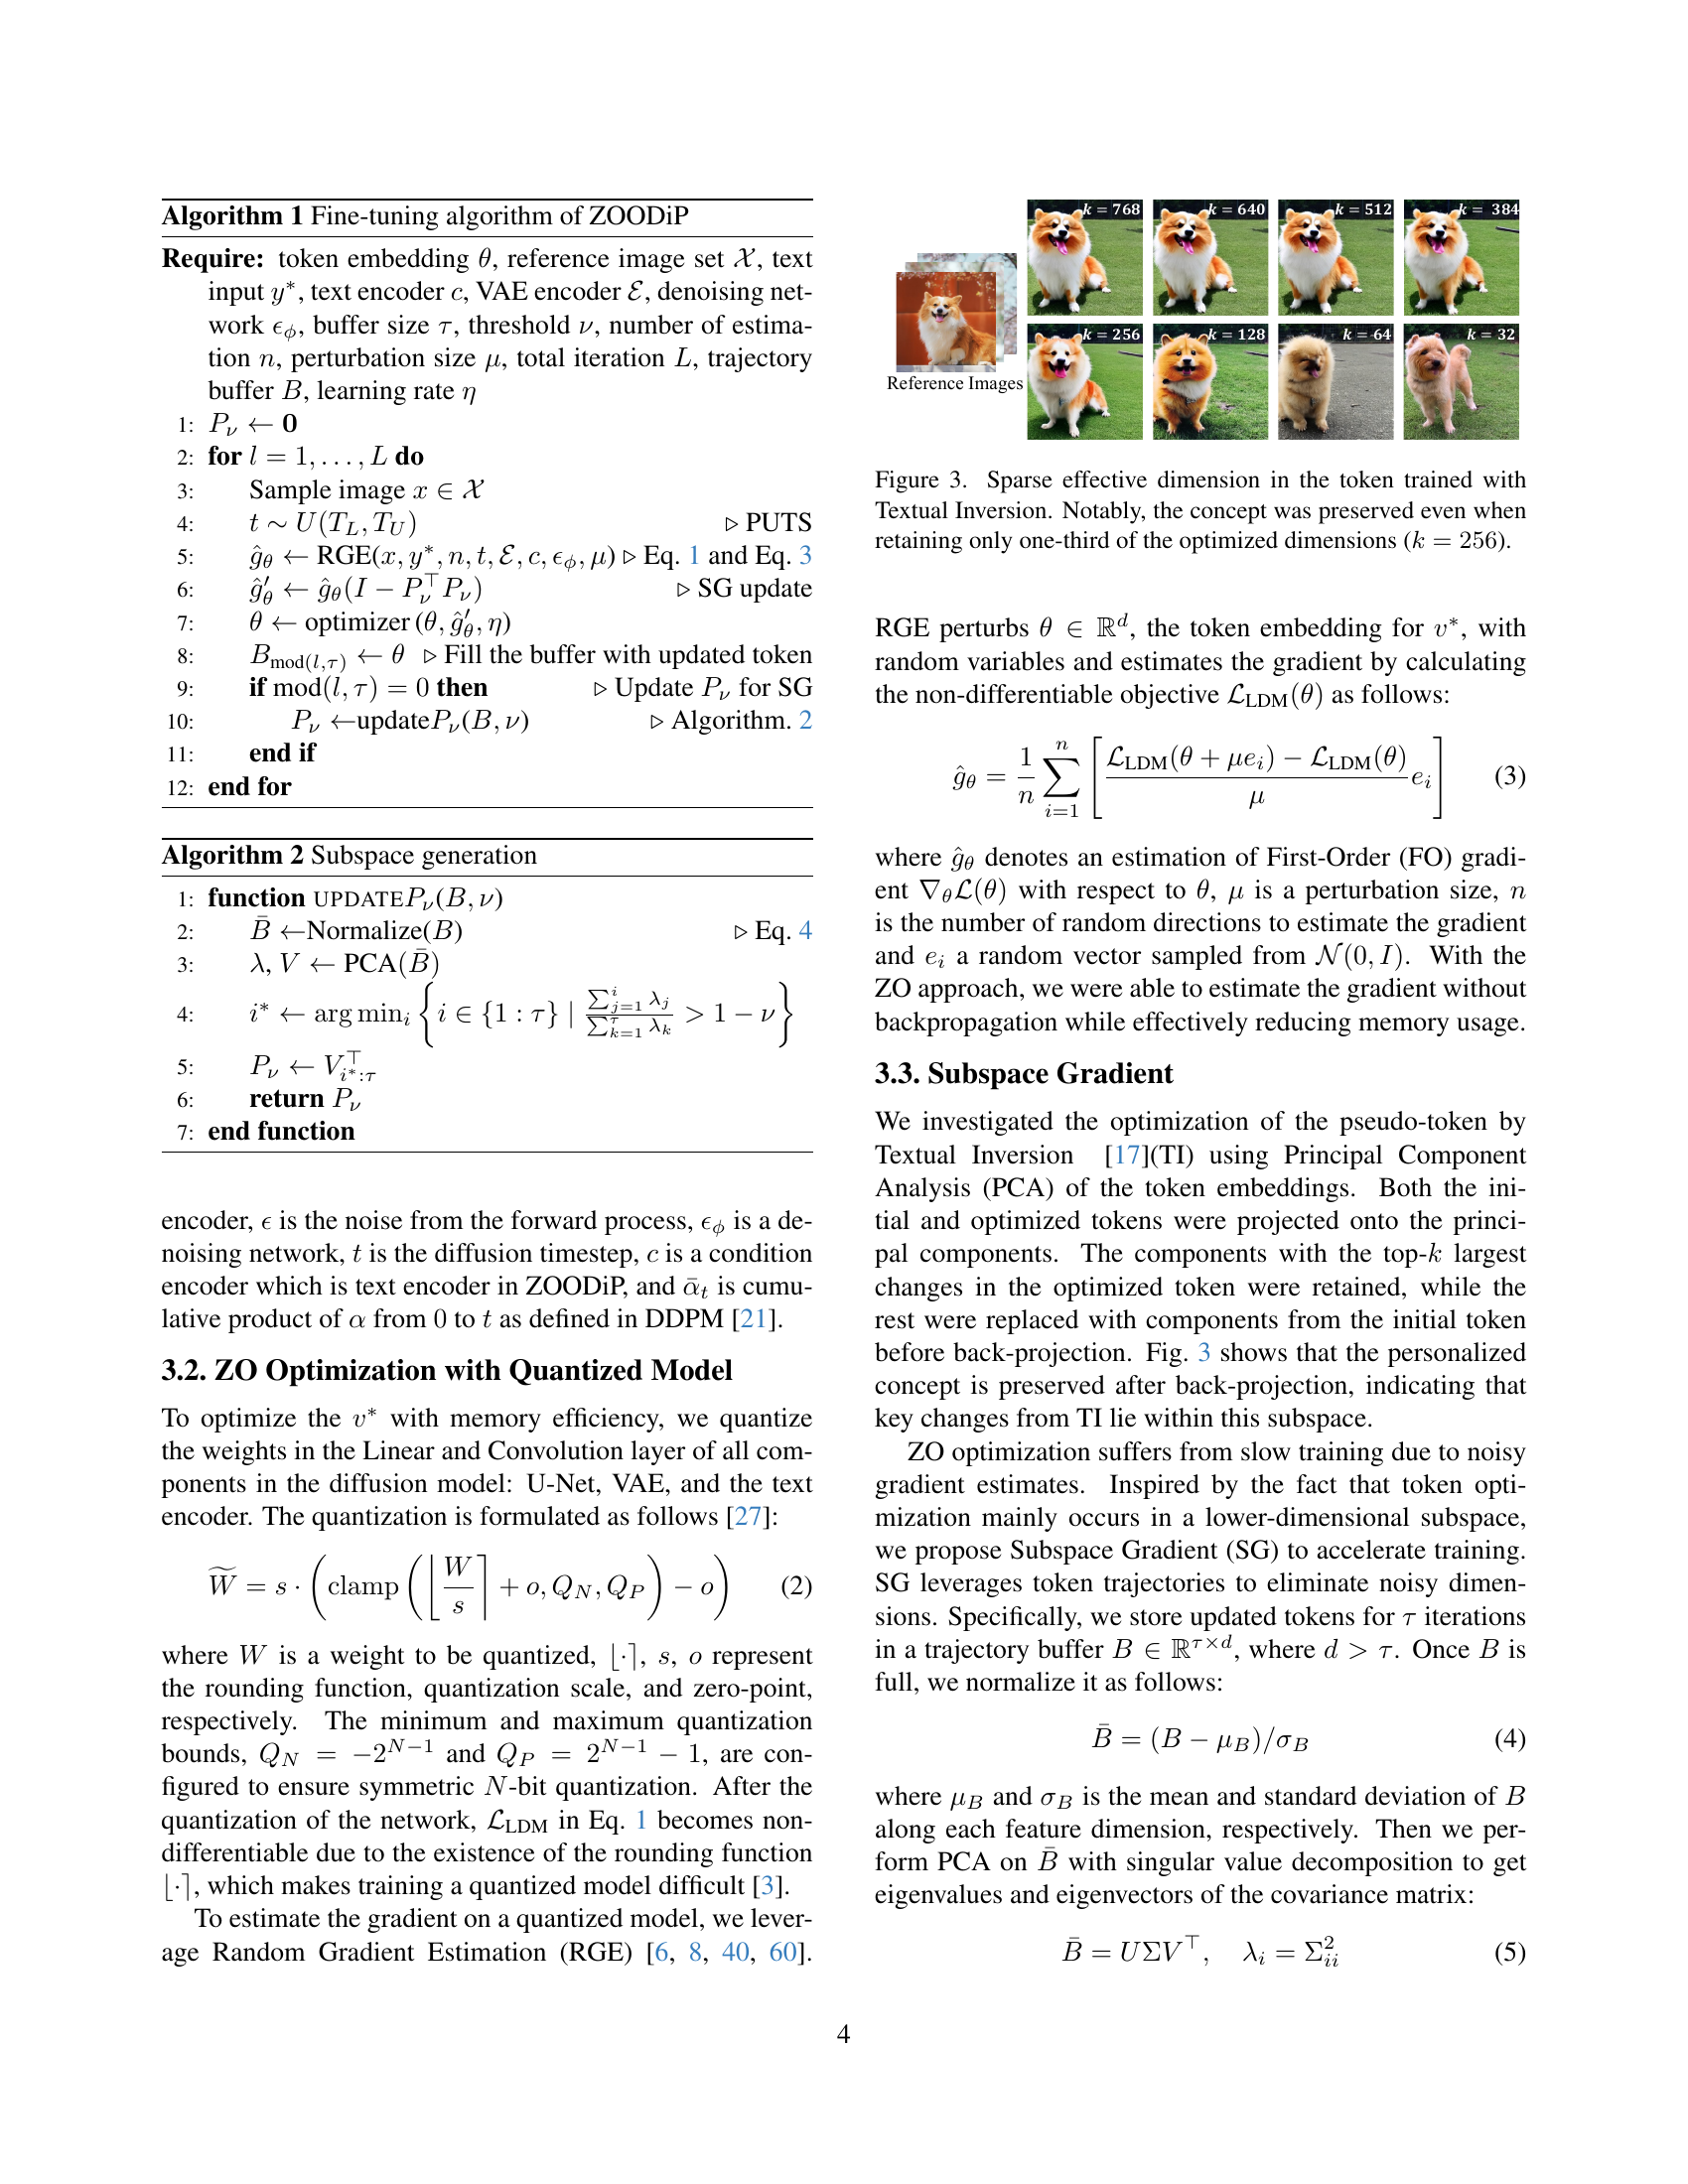
🔼 This figure shows the results of a principal component analysis (PCA) performed on token embeddings before and after personalization using Textual Inversion. The PCA reveals that the most significant changes during personalization are concentrated within a low-dimensional subspace. Even when only the top one-third of the principal components (k=256) are retained, the core concept of the personalized token is still preserved. This illustrates that Textual Inversion primarily modifies a small subset of the token’s embedding dimensions.
read the caption
Figure 3: Sparse effective dimension in the token trained with Textual Inversion. Notably, the concept was preserved even when retaining only one-third of the optimized dimensions (k=256𝑘256k=256italic_k = 256).
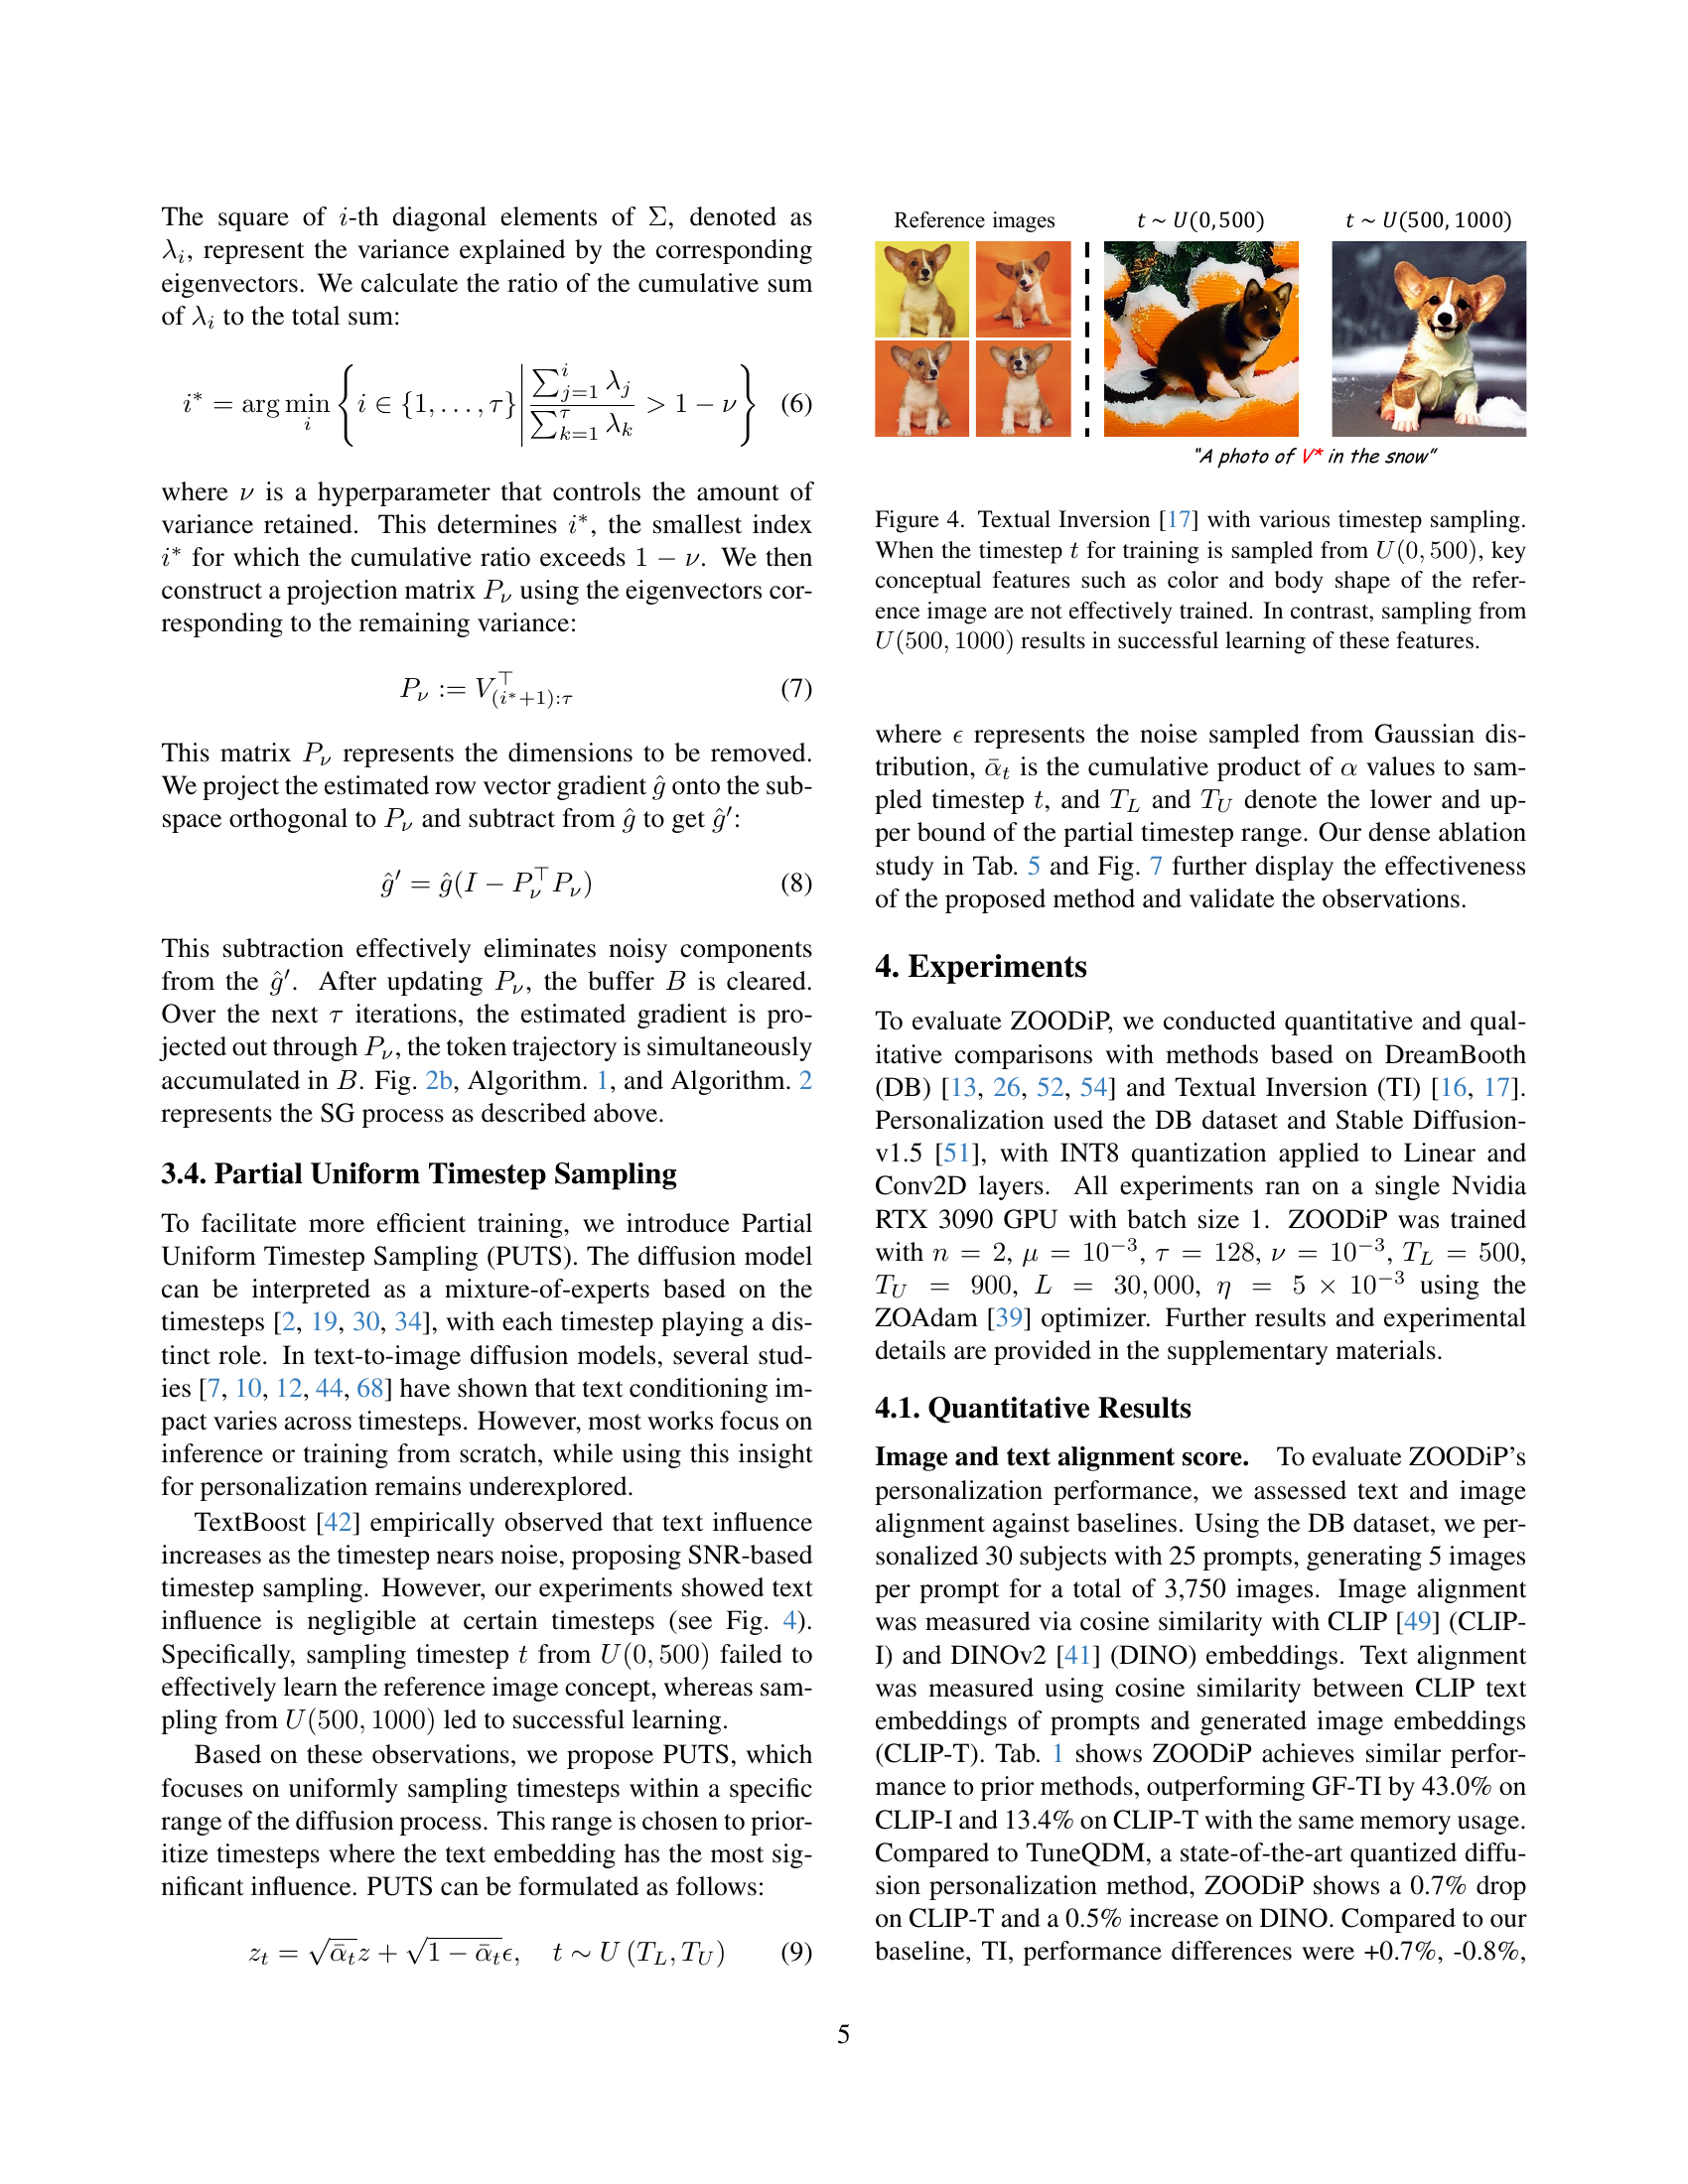
🔼 This figure shows the impact of different timestep sampling ranges on the effectiveness of Textual Inversion for image personalization. Using a uniform distribution between 0 and 500 for sampling the timestep t resulted in poor learning of key features like color and shape from the reference image. In contrast, using a uniform distribution between 500 and 1000 for the timestep resulted in successful learning, indicating that the later stage of the diffusion process is crucial for effectively incorporating the desired features from the reference images.
read the caption
Figure 4: Textual Inversion [17] with various timestep sampling. When the timestep t𝑡titalic_t for training is sampled from U(0,500)𝑈0500U(0,500)italic_U ( 0 , 500 ), key conceptual features such as color and body shape of the reference image are not effectively trained. In contrast, sampling from U(500,1000)𝑈5001000U(500,1000)italic_U ( 500 , 1000 ) results in successful learning of these features.

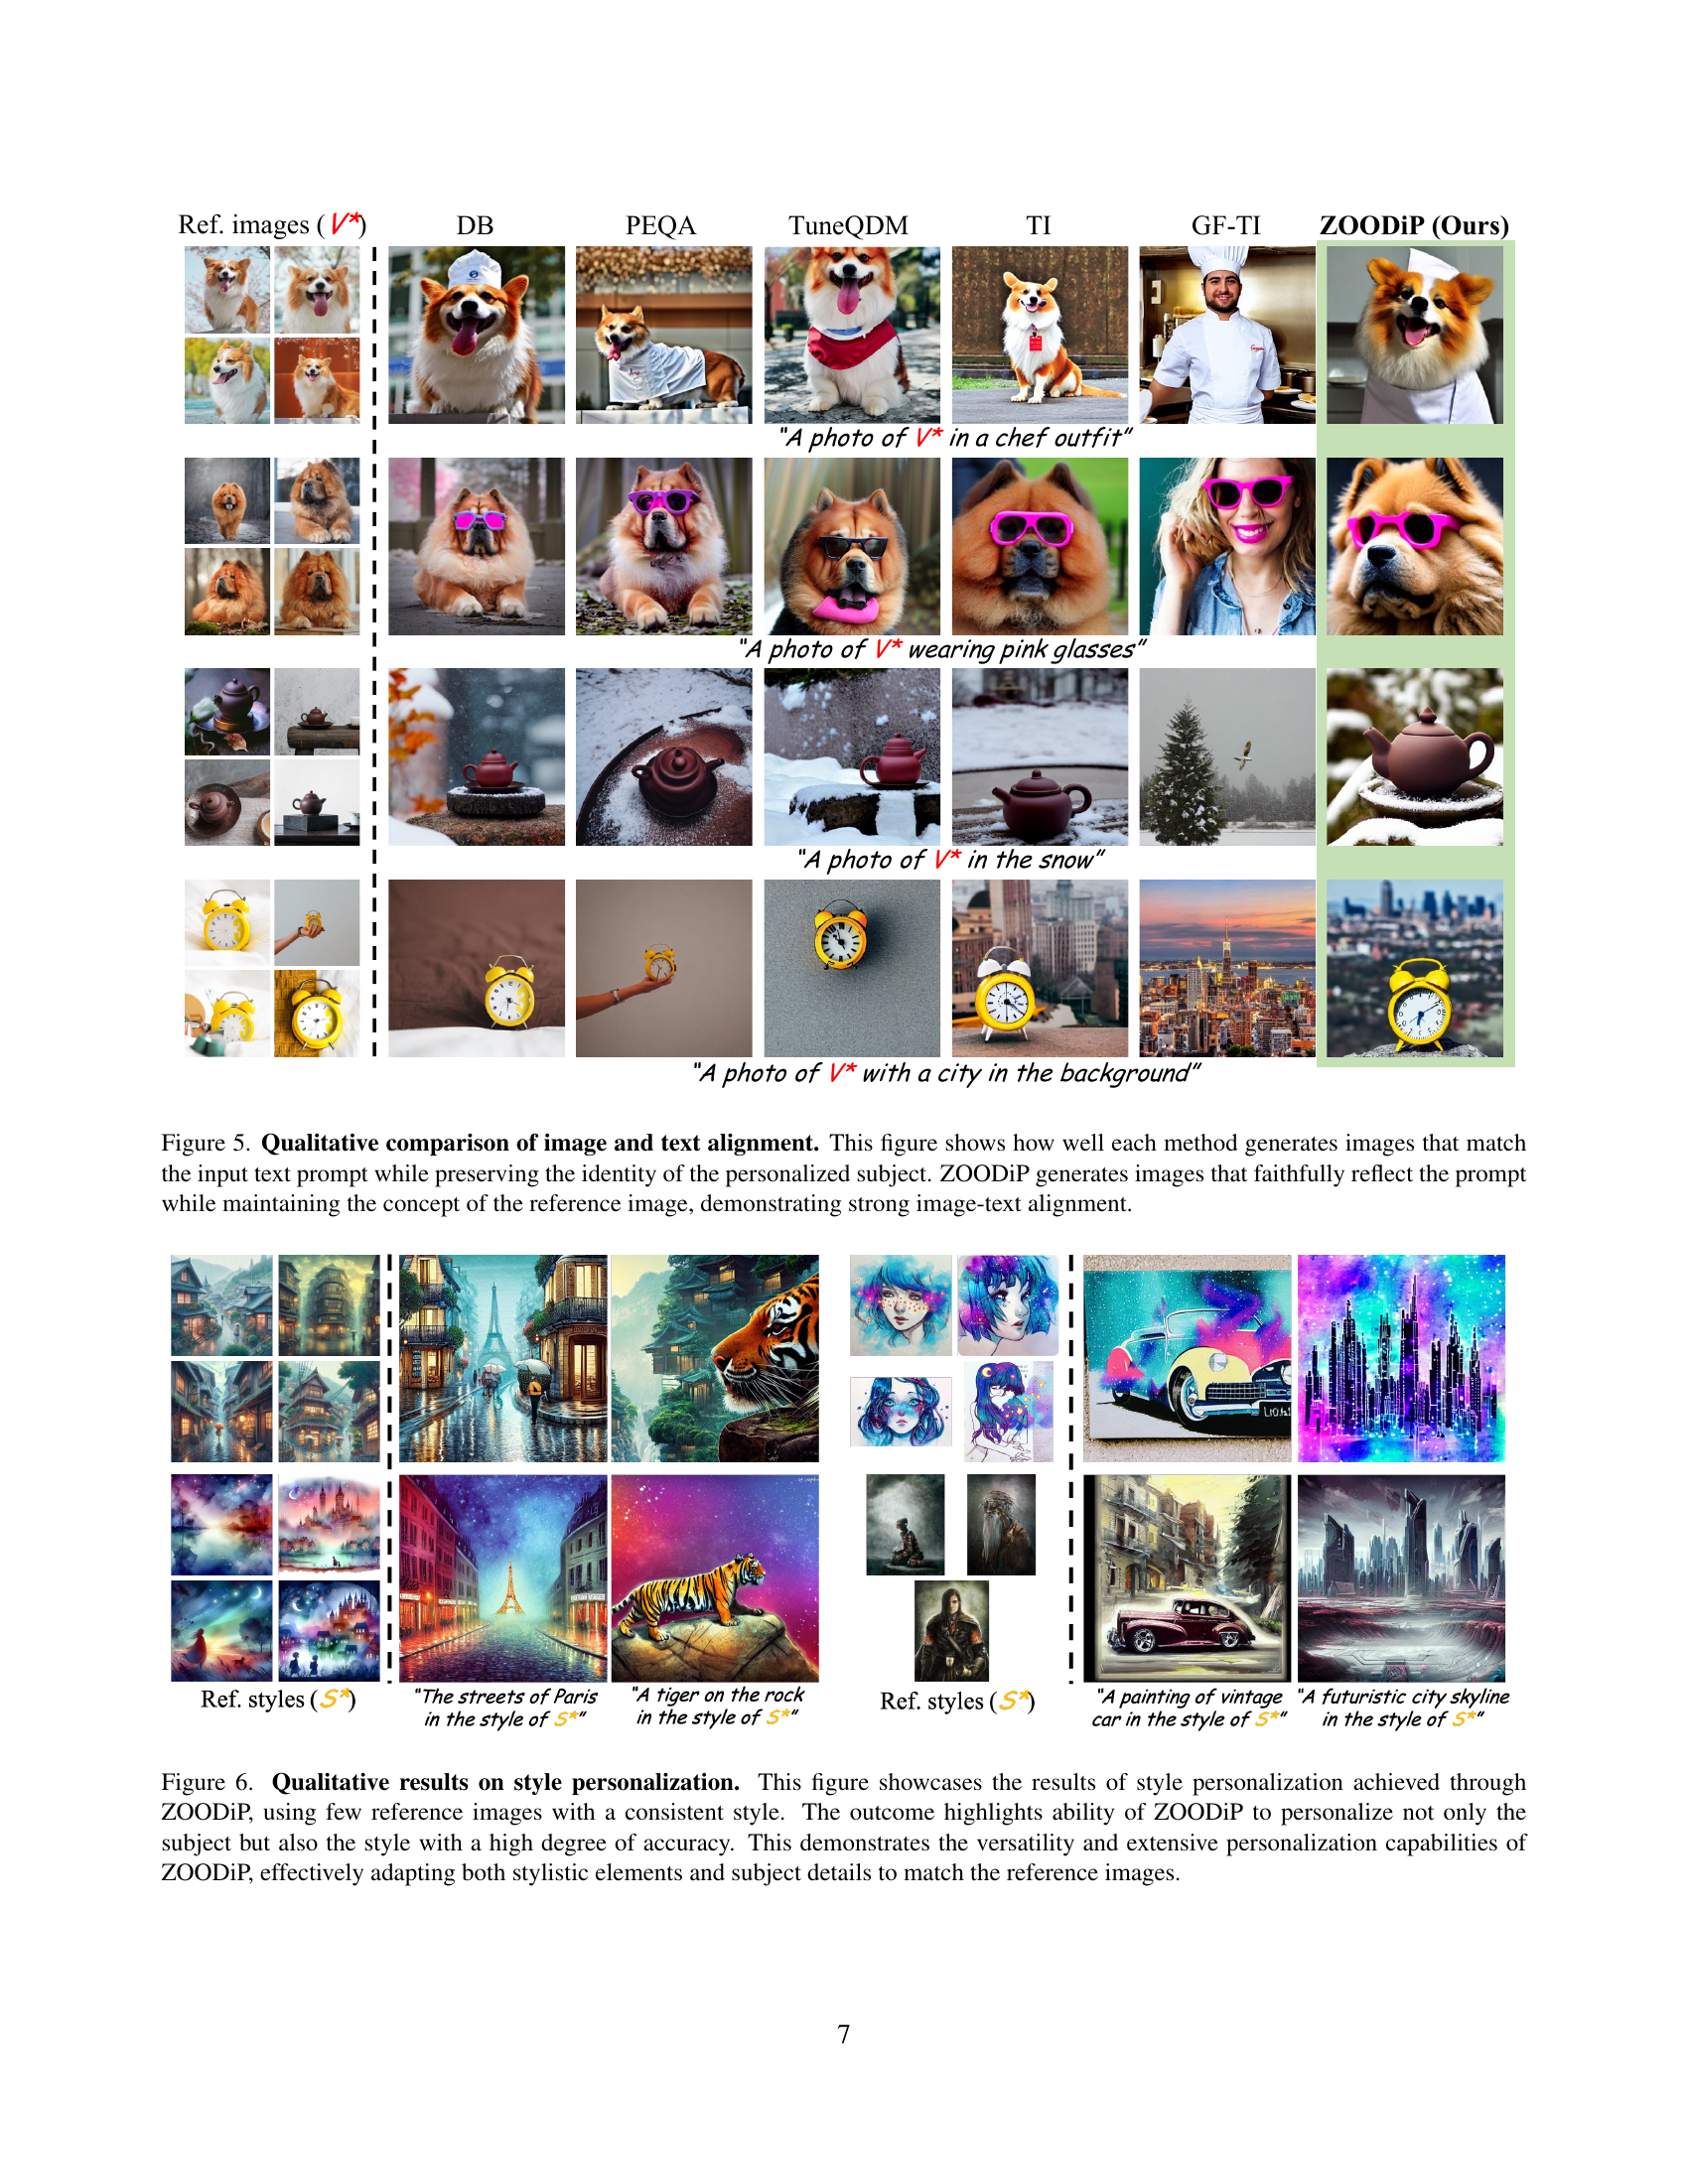
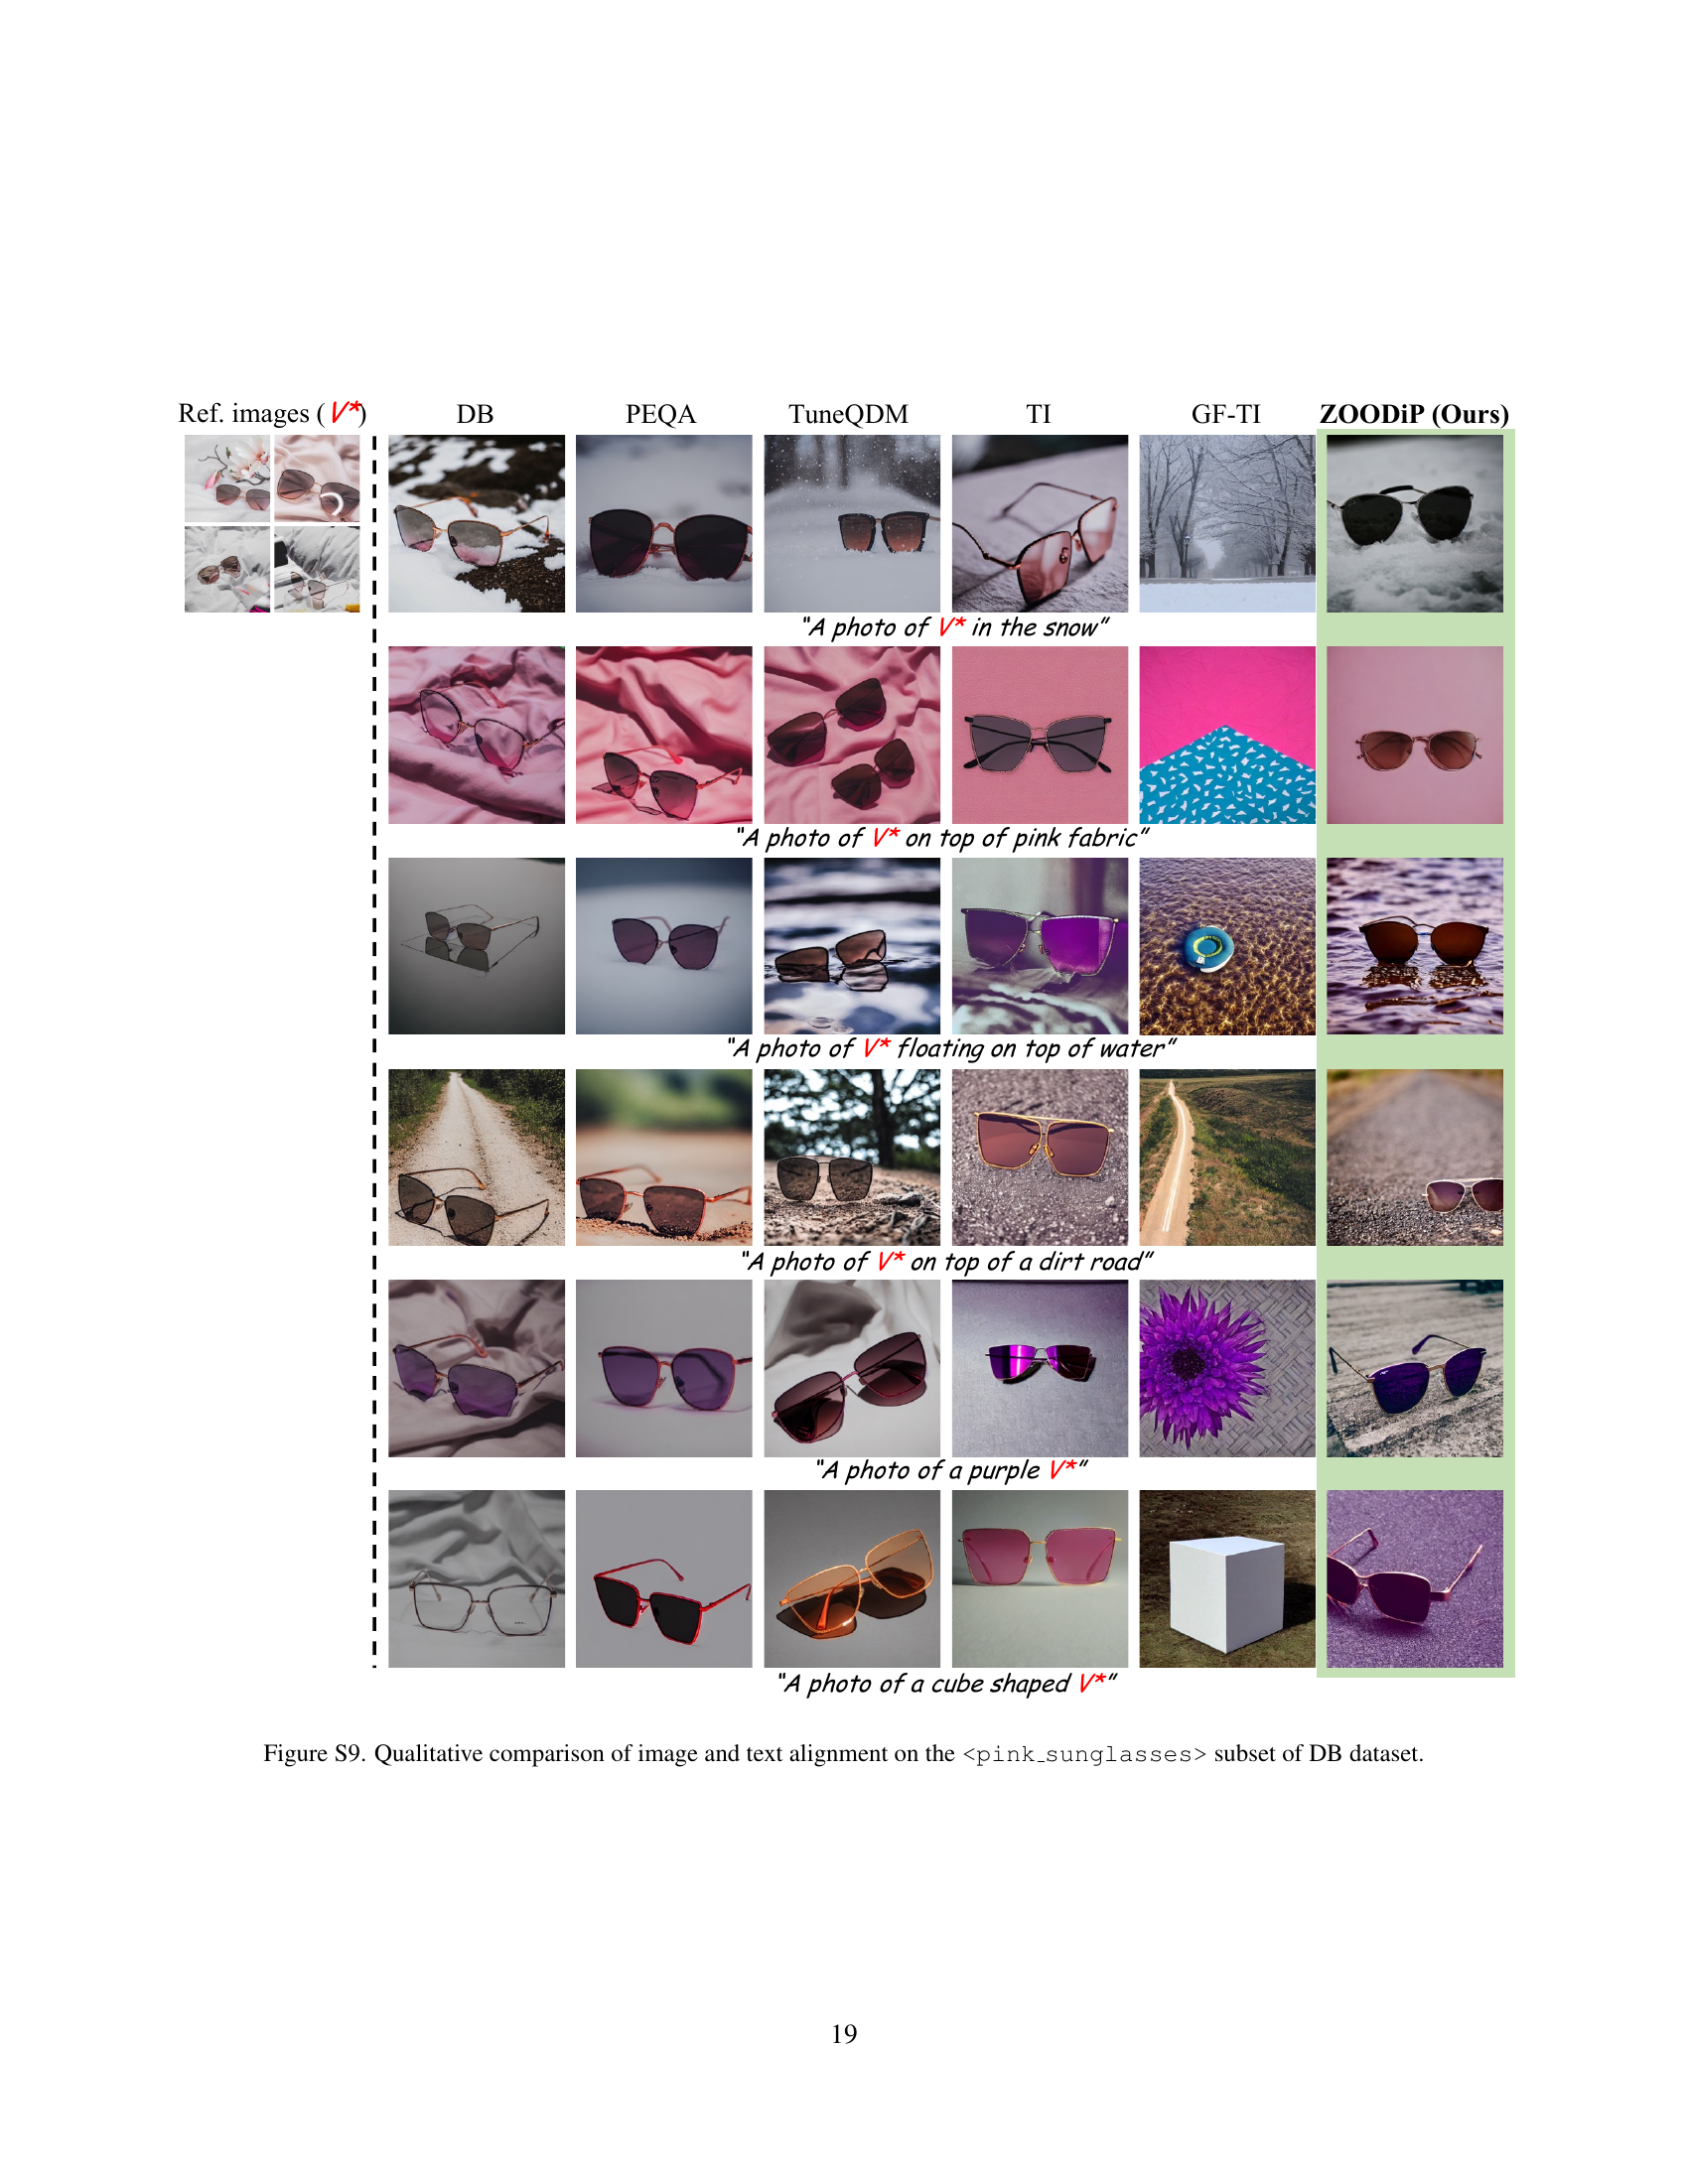
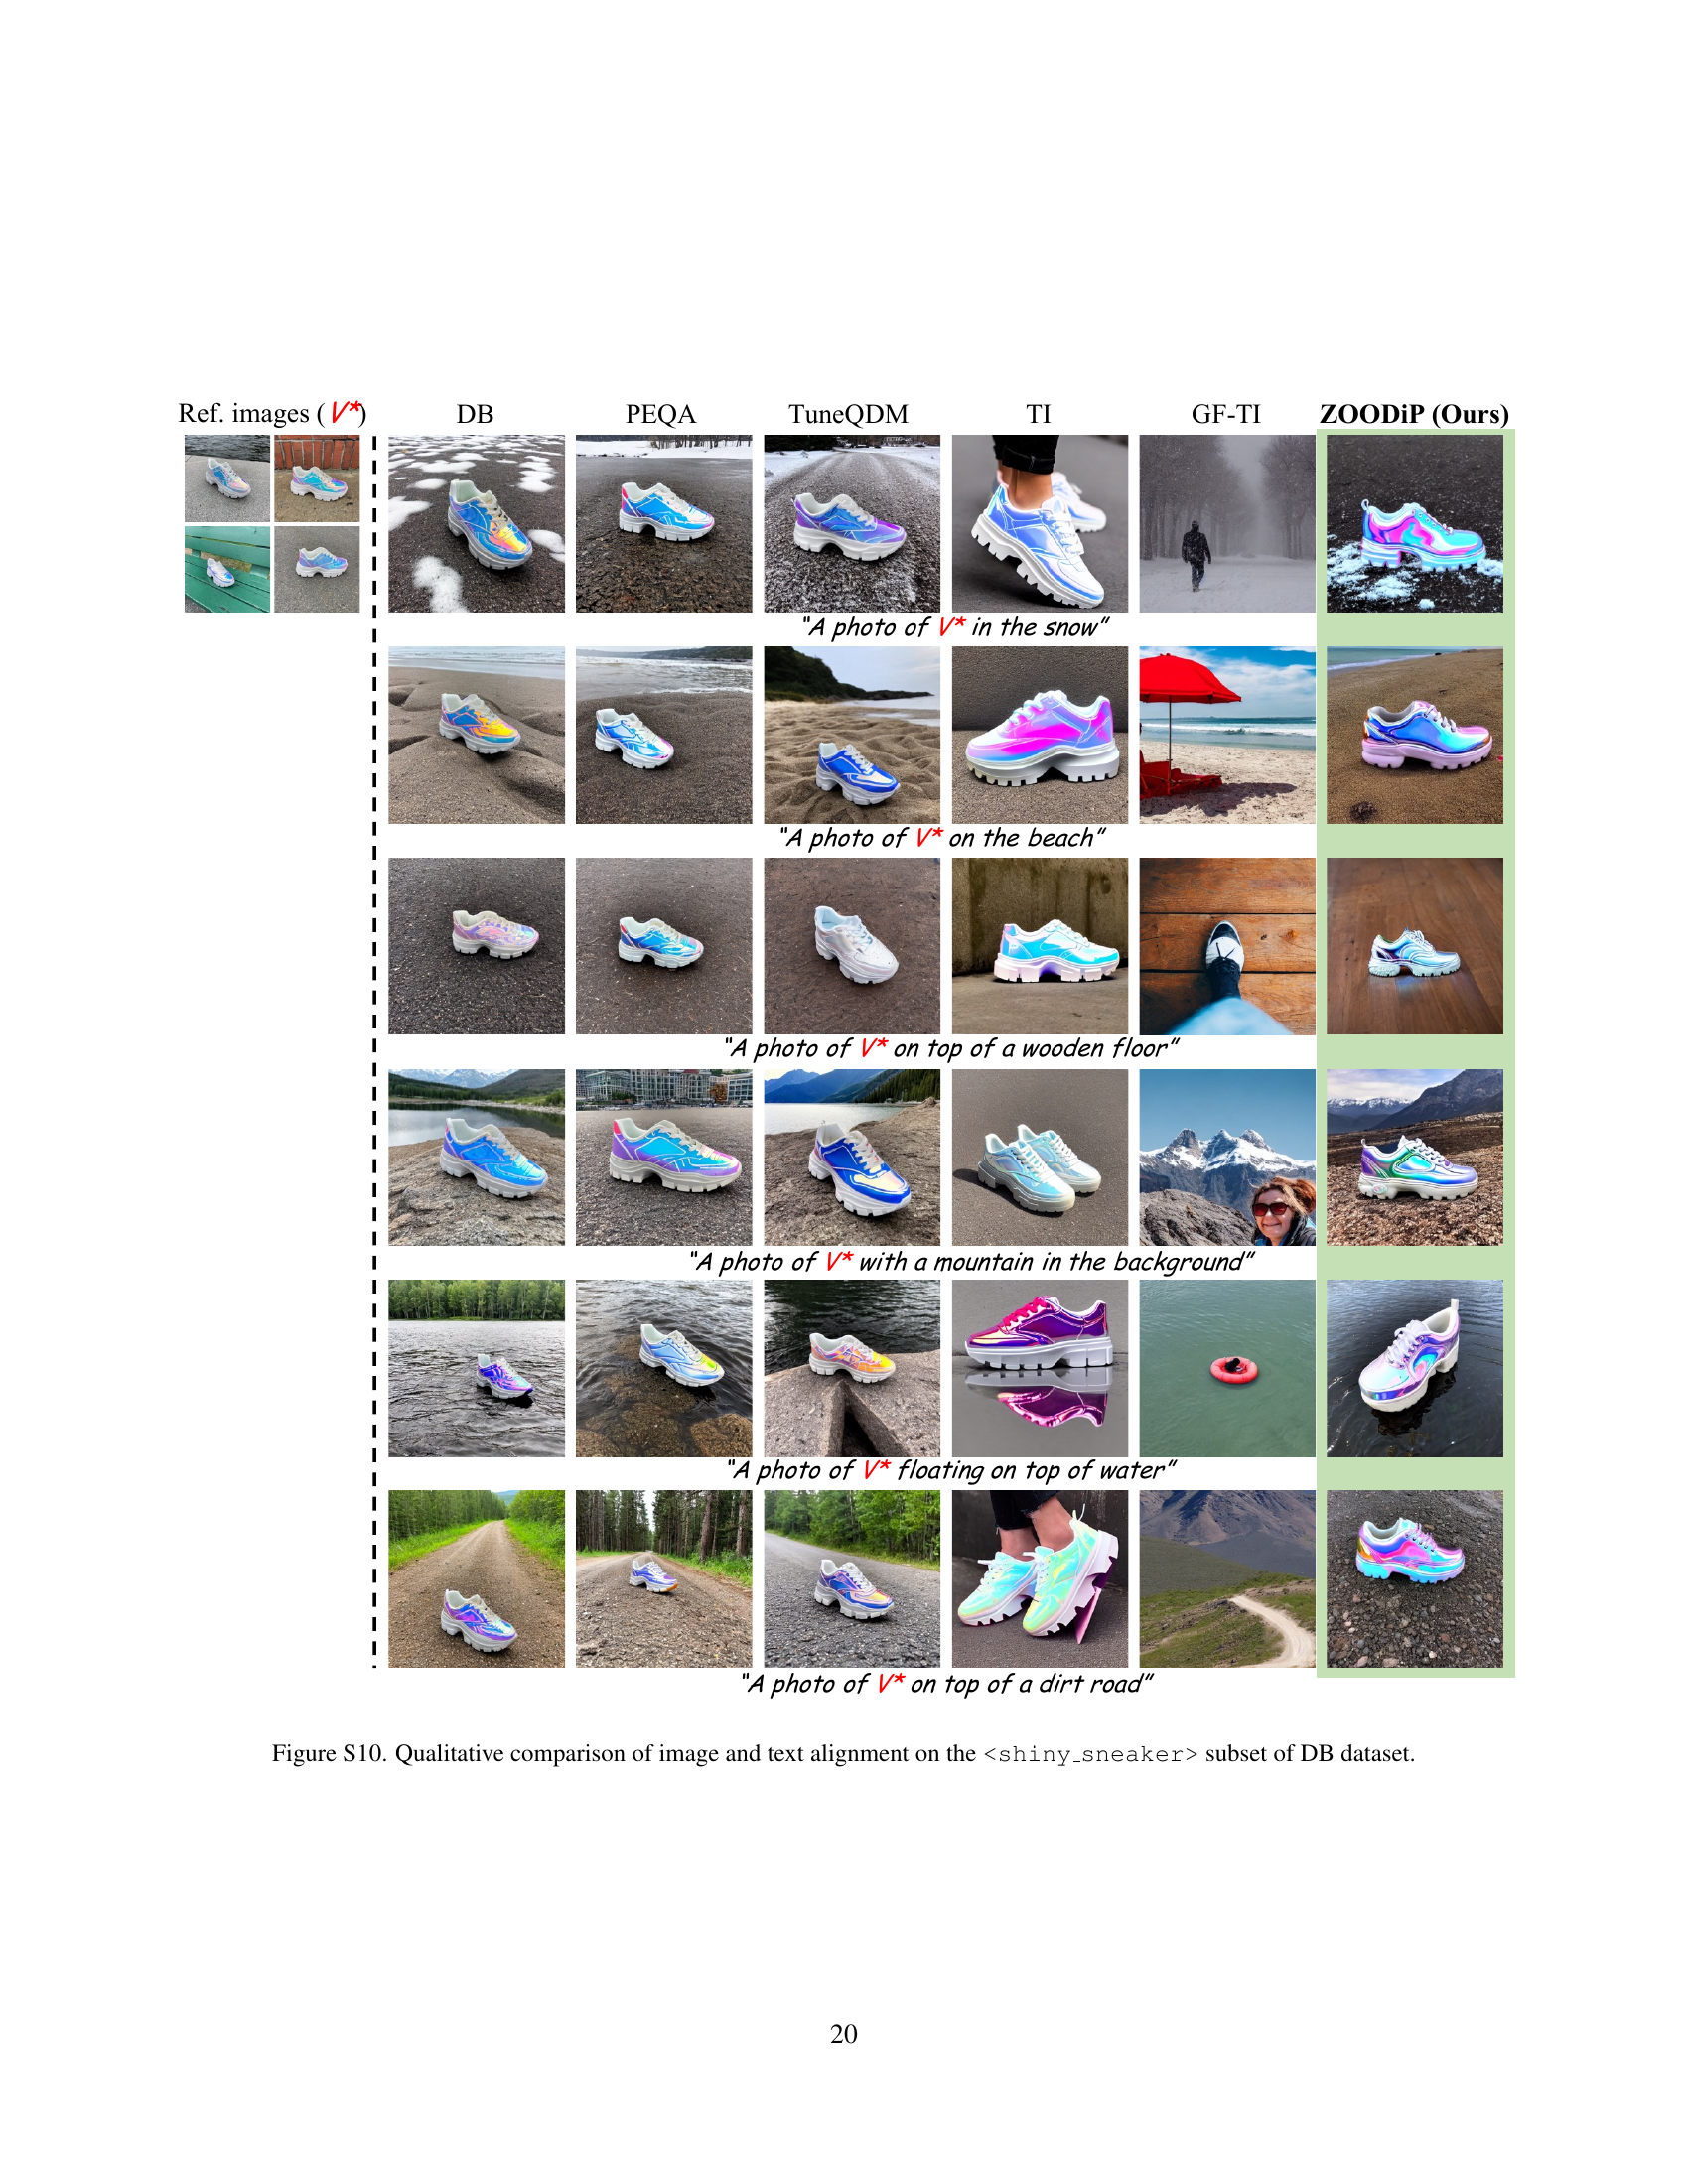
🔼 Figure 5 presents a qualitative comparison of image and text alignment across various personalization methods. The figure demonstrates the image generation capabilities of different methods, using the same prompts and reference images. Each method’s success in generating images that accurately match the prompt while preserving the identity of the personalized subject is visually demonstrated. ZOODiP’s images show particularly strong image-text alignment, closely mirroring both the prompt and the reference images.
read the caption
Figure 5: Qualitative comparison of image and text alignment. This figure shows how well each method generates images that match the input text prompt while preserving the identity of the personalized subject. ZOODiP generates images that faithfully reflect the prompt while maintaining the concept of the reference image, demonstrating strong image-text alignment.

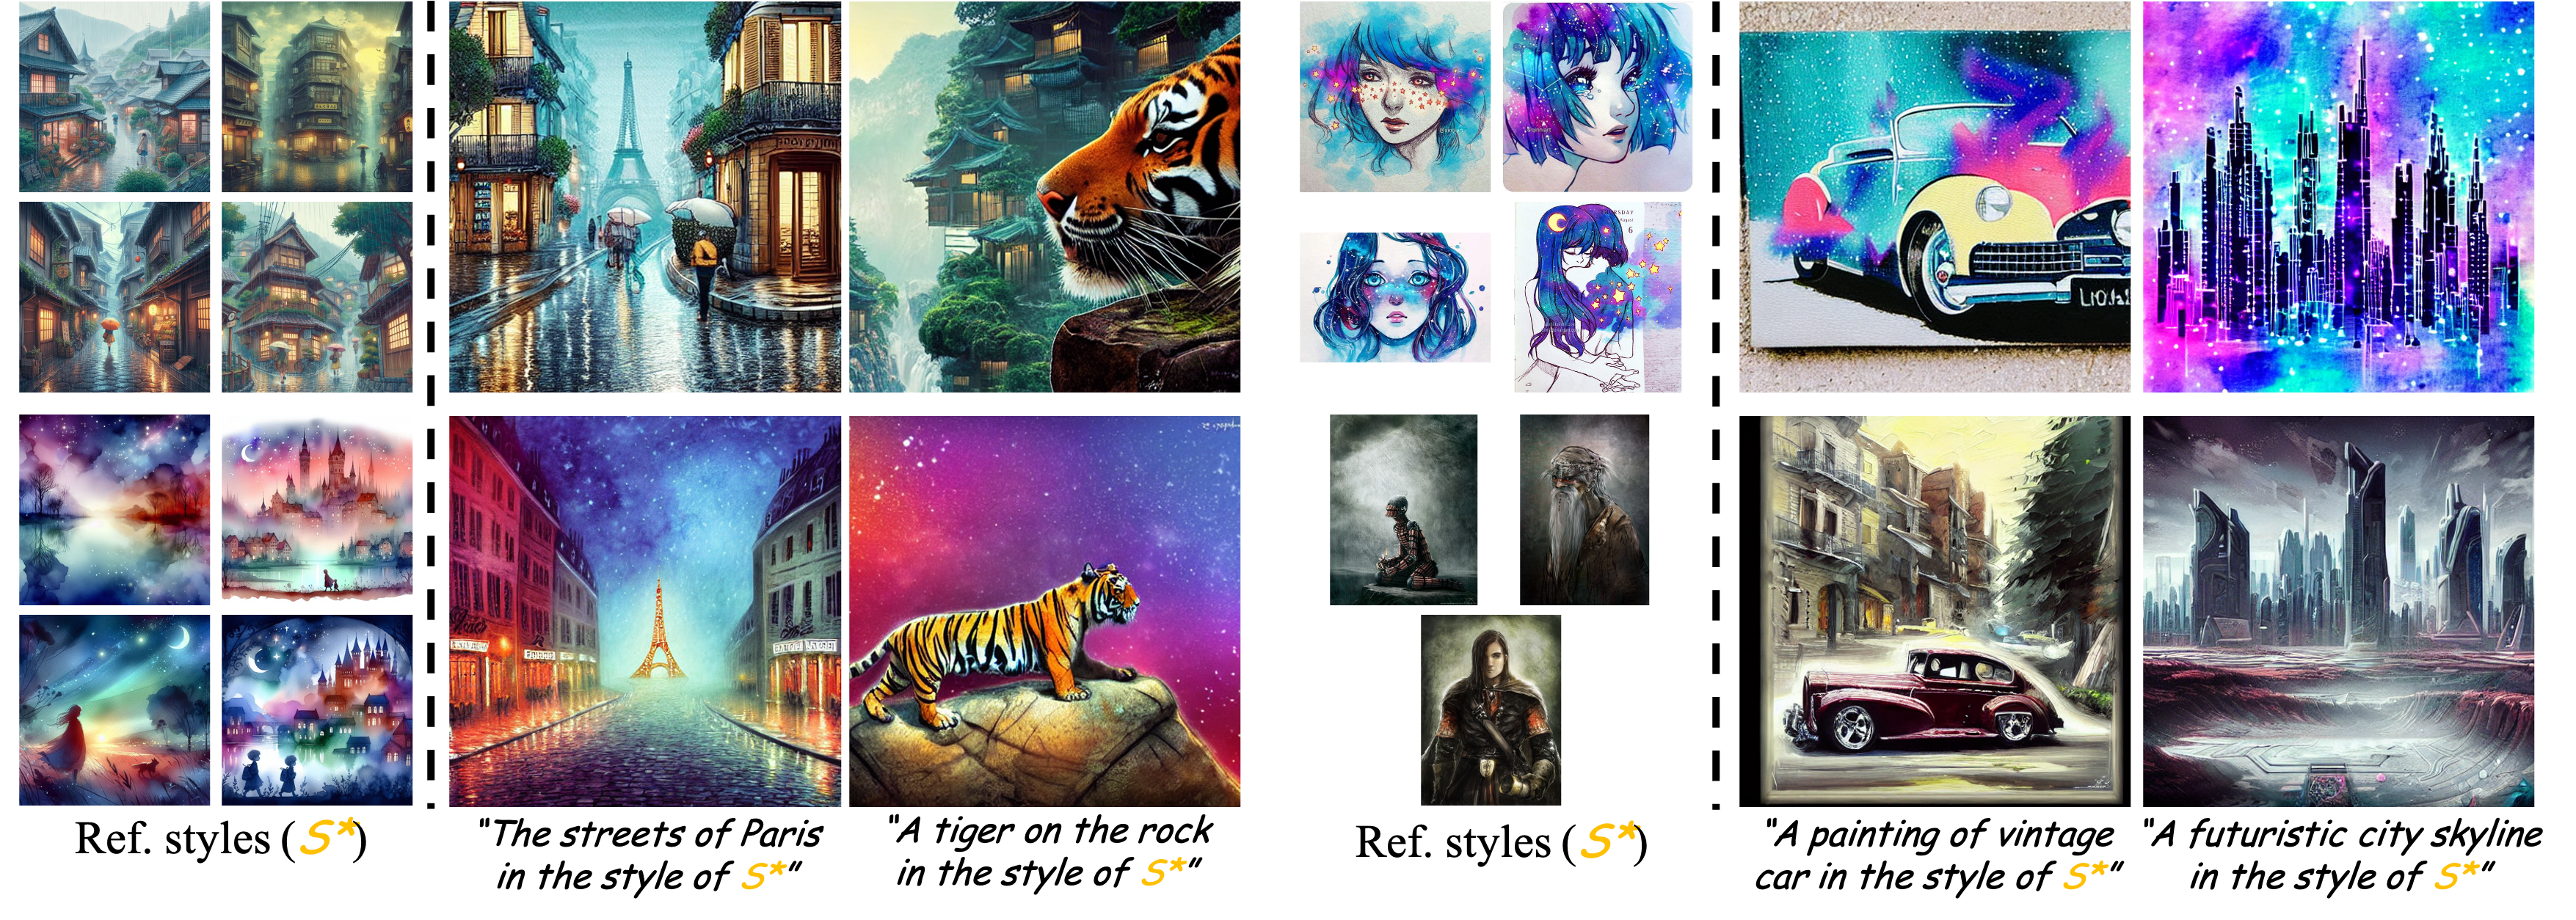
🔼 This figure demonstrates ZOODIP’s ability to personalize images by style, not just subject. Using a few reference images with a consistent style, ZOODIP accurately captures and applies that style to new images of the same subject. The results show a high degree of accuracy and demonstrate ZOODIP’s versatility in adapting stylistic elements and subject details to closely match the reference images. This showcases its extensive personalization capabilities.
read the caption
Figure 6: Qualitative results on style personalization. This figure showcases the results of style personalization achieved through ZOODiP, using few reference images with a consistent style. The outcome highlights ability of ZOODiP to personalize not only the subject but also the style with a high degree of accuracy. This demonstrates the versatility and extensive personalization capabilities of ZOODiP, effectively adapting both stylistic elements and subject details to match the reference images.

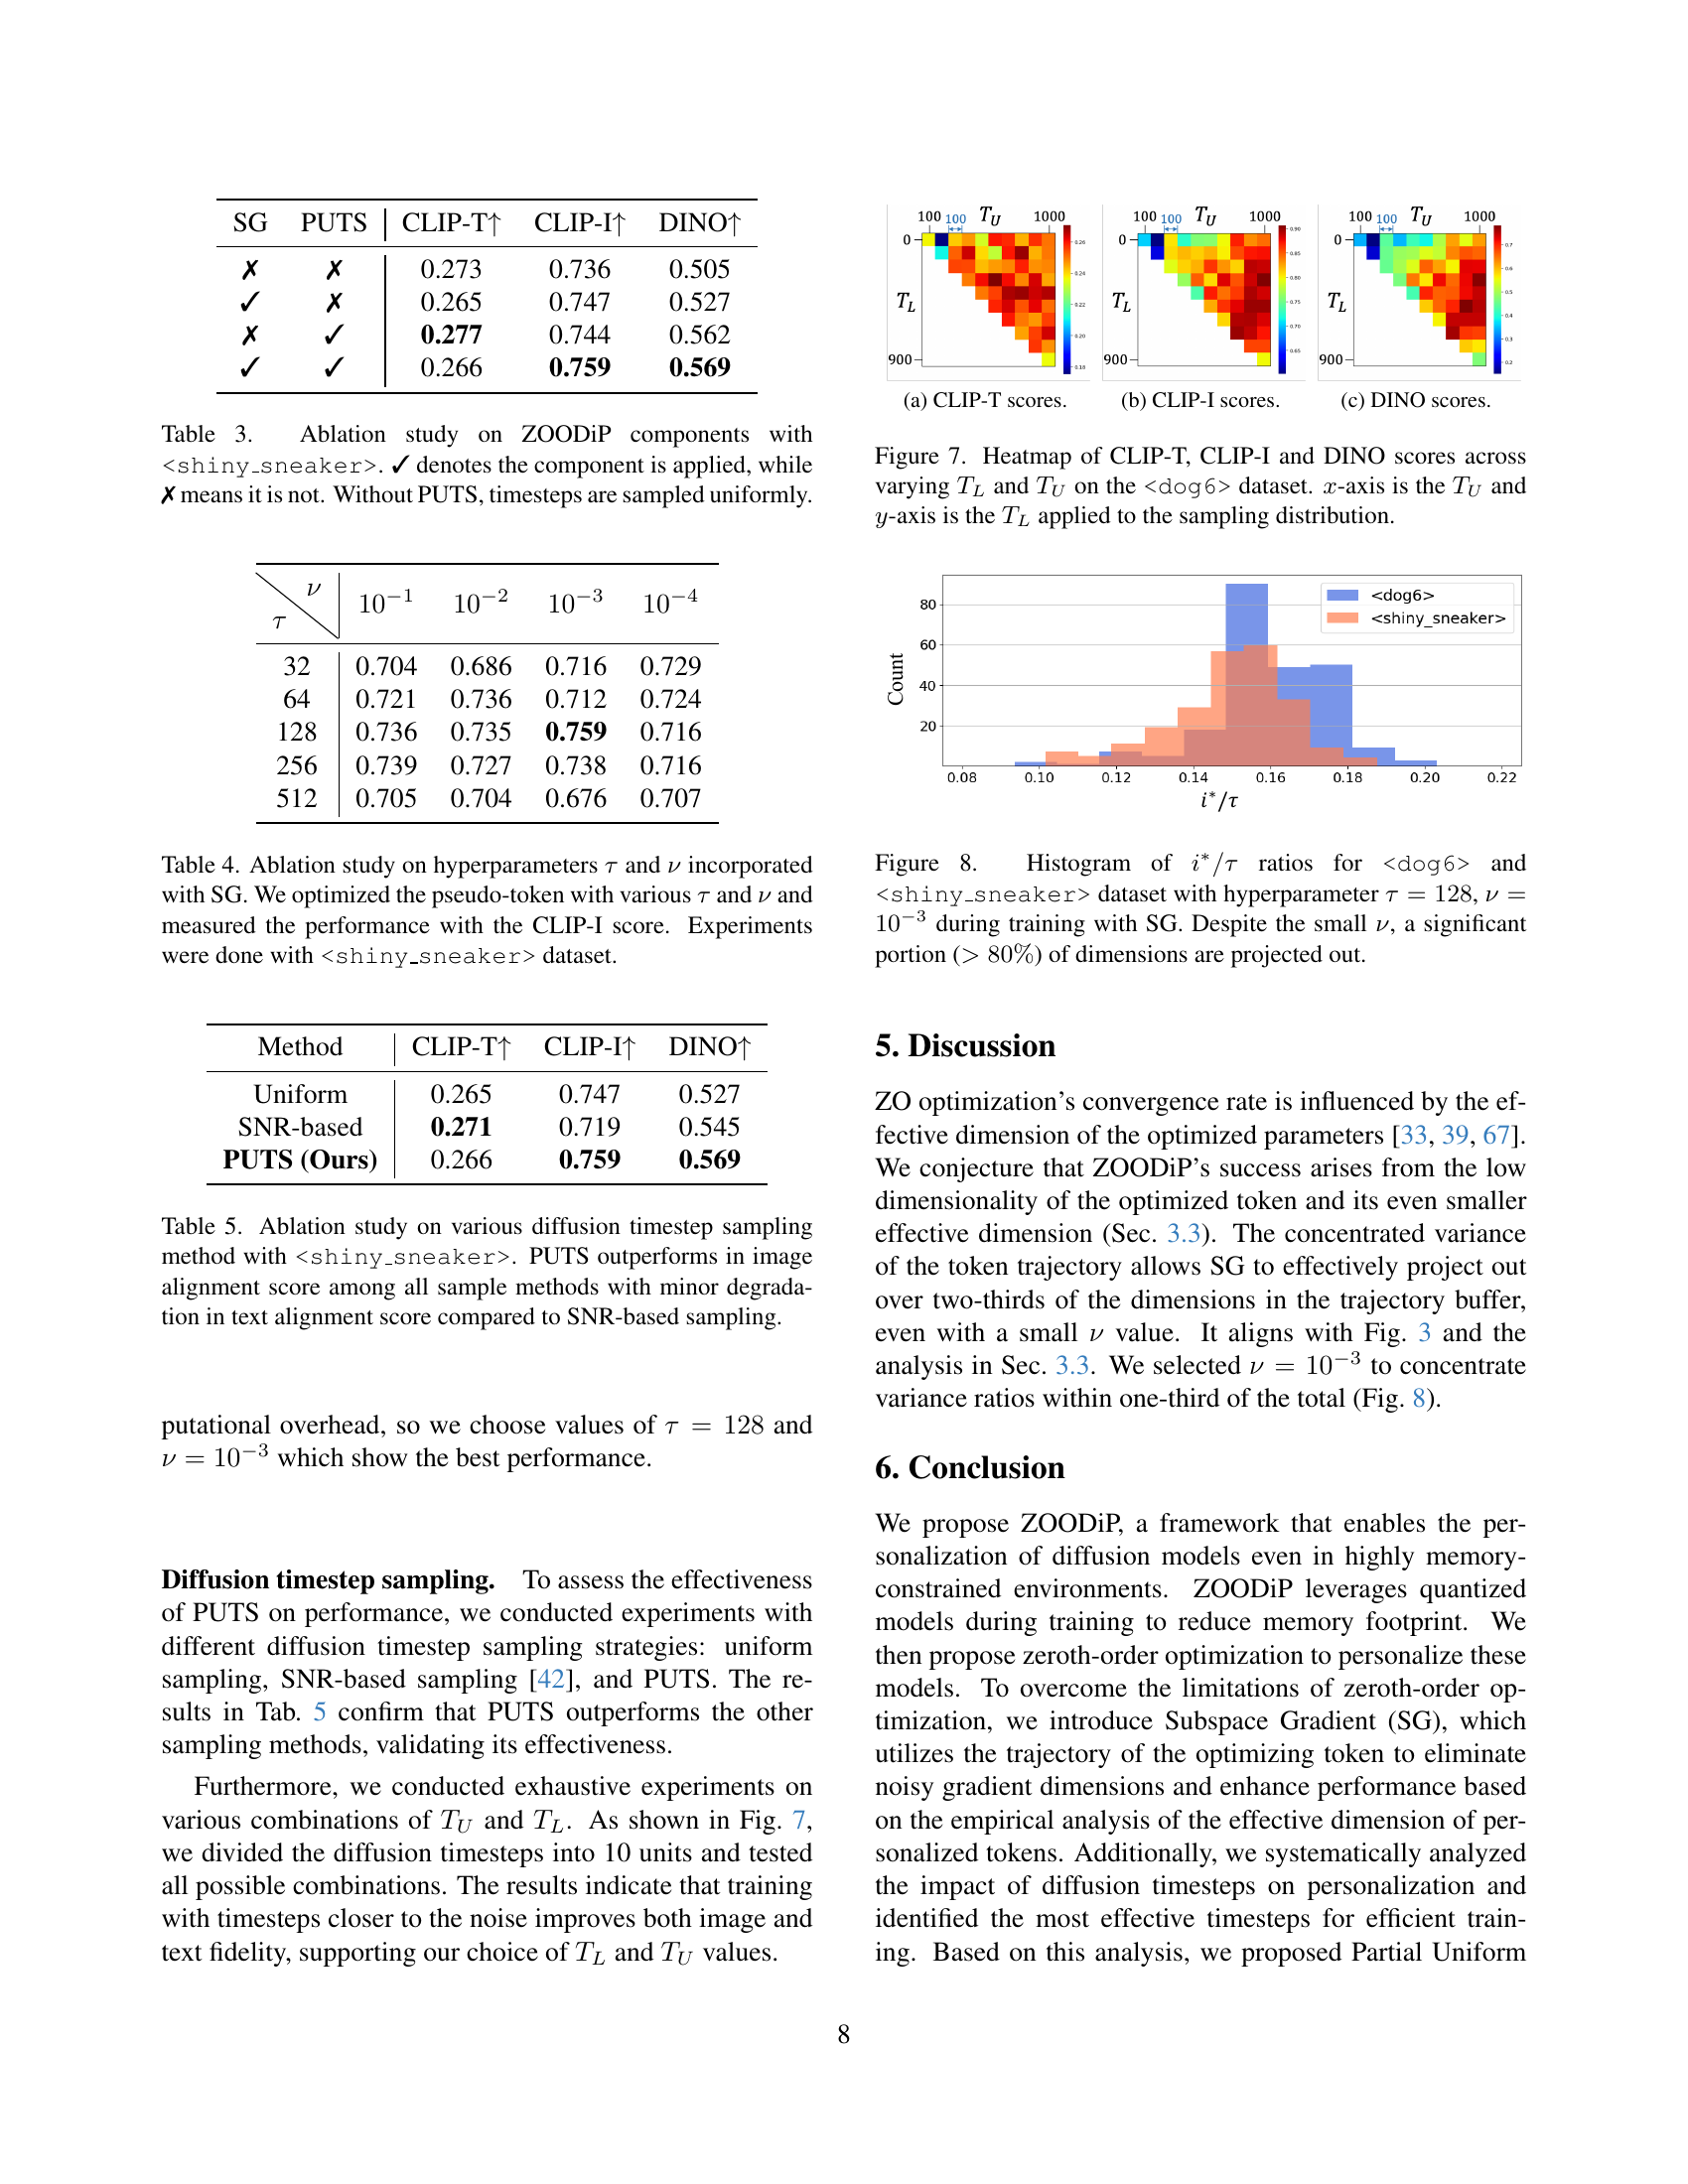
🔼 This figure presents a heatmap visualizing the CLIP-T scores obtained across various combinations of ‘TL’ and ‘TU’ parameters, which are used to define the range of timesteps in the Partial Uniform Timestep Sampling (PUTS) method. The heatmap helps illustrate how different ranges of timesteps sampled during training influence the final text-image alignment score (CLIP-T). The x-axis represents ‘TU’ (upper bound of timestep range) and the y-axis represents ‘TL’ (lower bound). The color intensity of each cell indicates the CLIP-T score achieved with that particular ‘TL’ and ‘TU’ combination, allowing for the identification of optimal parameter ranges that maximize performance.
read the caption
(a) CLIP-T scores.

🔼 This figure shows the CLIP-I (image alignment) scores for different methods across various personalization methods. CLIP-I scores measure the cosine similarity between the CLIP embeddings of the reference images and the generated images. Higher scores indicate that the generated images are more similar to the reference images. The x-axis represents the total VRAM usage (in GB), while the y-axis shows the CLIP-I score. Different personalization methods are represented by different colored markers. This visualization allows for a comparison of the trade-off between memory efficiency and performance for various personalization methods.
read the caption
(b) CLIP-I scores.

🔼 This figure shows the DINO (Self-Supervised visual representation learning) scores for different combinations of start and end timesteps used in Partial Uniform Timestep Sampling (PUTS). The heatmap visually represents the performance of the personalization process, with higher scores indicating better alignment between generated images and reference images.
read the caption
(c) DINO scores.

🔼 This figure visualizes the performance of the ZOODIP model across different ranges of timesteps during training. The heatmap shows CLIP-T, CLIP-I, and DINO scores (metrics for evaluating text-image alignment and image quality) as a function of the starting timestep (TL) and ending timestep (TU) of the partial uniform timestep sampling strategy used in the model. Warmer colors represent better performance. The x-axis represents TU and the y-axis represents TL, illustrating how the choice of timesteps affects the model’s ability to effectively personalize the Stable Diffusion model.
read the caption
Figure 7: Heatmap of CLIP-T, CLIP-I and DINO scores across varying TLsubscript𝑇𝐿T_{L}italic_T start_POSTSUBSCRIPT italic_L end_POSTSUBSCRIPT and TUsubscript𝑇𝑈T_{U}italic_T start_POSTSUBSCRIPT italic_U end_POSTSUBSCRIPT on thedataset. x𝑥xitalic_x-axis is the TUsubscript𝑇𝑈T_{U}italic_T start_POSTSUBSCRIPT italic_U end_POSTSUBSCRIPT and y𝑦yitalic_y-axis is the TLsubscript𝑇𝐿T_{L}italic_T start_POSTSUBSCRIPT italic_L end_POSTSUBSCRIPT applied to the sampling distribution.

🔼 This figure shows two histograms. Each histogram represents the ratio of the number of principal components retained after PCA to the total number of principal components (τ=128) for each of the two datasets:
and <shiny_sneaker>. The hyperparameters used are ν=10⁻³ and τ=128. A small value of ν is used, which should retain most of the variance. However, the histograms show that a significant portion (more than 80%) of the dimensions are projected out (removed). This indicates that the optimization process primarily focuses on a low-dimensional subspace, which is consistent with the findings described in Section 3.3 (Subspace Gradient). read the caption
Figure 8: Histogram of i∗/τsuperscript𝑖𝜏i^{*}/\tauitalic_i start_POSTSUPERSCRIPT ∗ end_POSTSUPERSCRIPT / italic_τ ratios forand dataset with hyperparameter τ=128𝜏128\tau=128italic_τ = 128, ν=10−3𝜈superscript103\nu=10^{-3}italic_ν = 10 start_POSTSUPERSCRIPT - 3 end_POSTSUPERSCRIPT during training with SG. Despite the small ν𝜈\nuitalic_ν, a significant portion (>80%absentpercent80>80\%> 80 %) of dimensions are projected out.
🔼 This figure displays a comparison of images generated using different levels of weight precision in a Stable Diffusion model. The prompt used for all generated images was ‘a photo of a dog.’ The images demonstrate the impact of reduced precision on image quality. The INT8 precision images closely match those generated with full precision (FP32), showing that there’s minimal loss in image quality. However, the INT4 images show significantly lower quality and artifacts, indicating a substantial trade-off between reduced memory requirements and image fidelity. This showcases that while lower-bit quantization saves memory, it can lead to noticeable degradation in the generated image’s visual quality.
read the caption
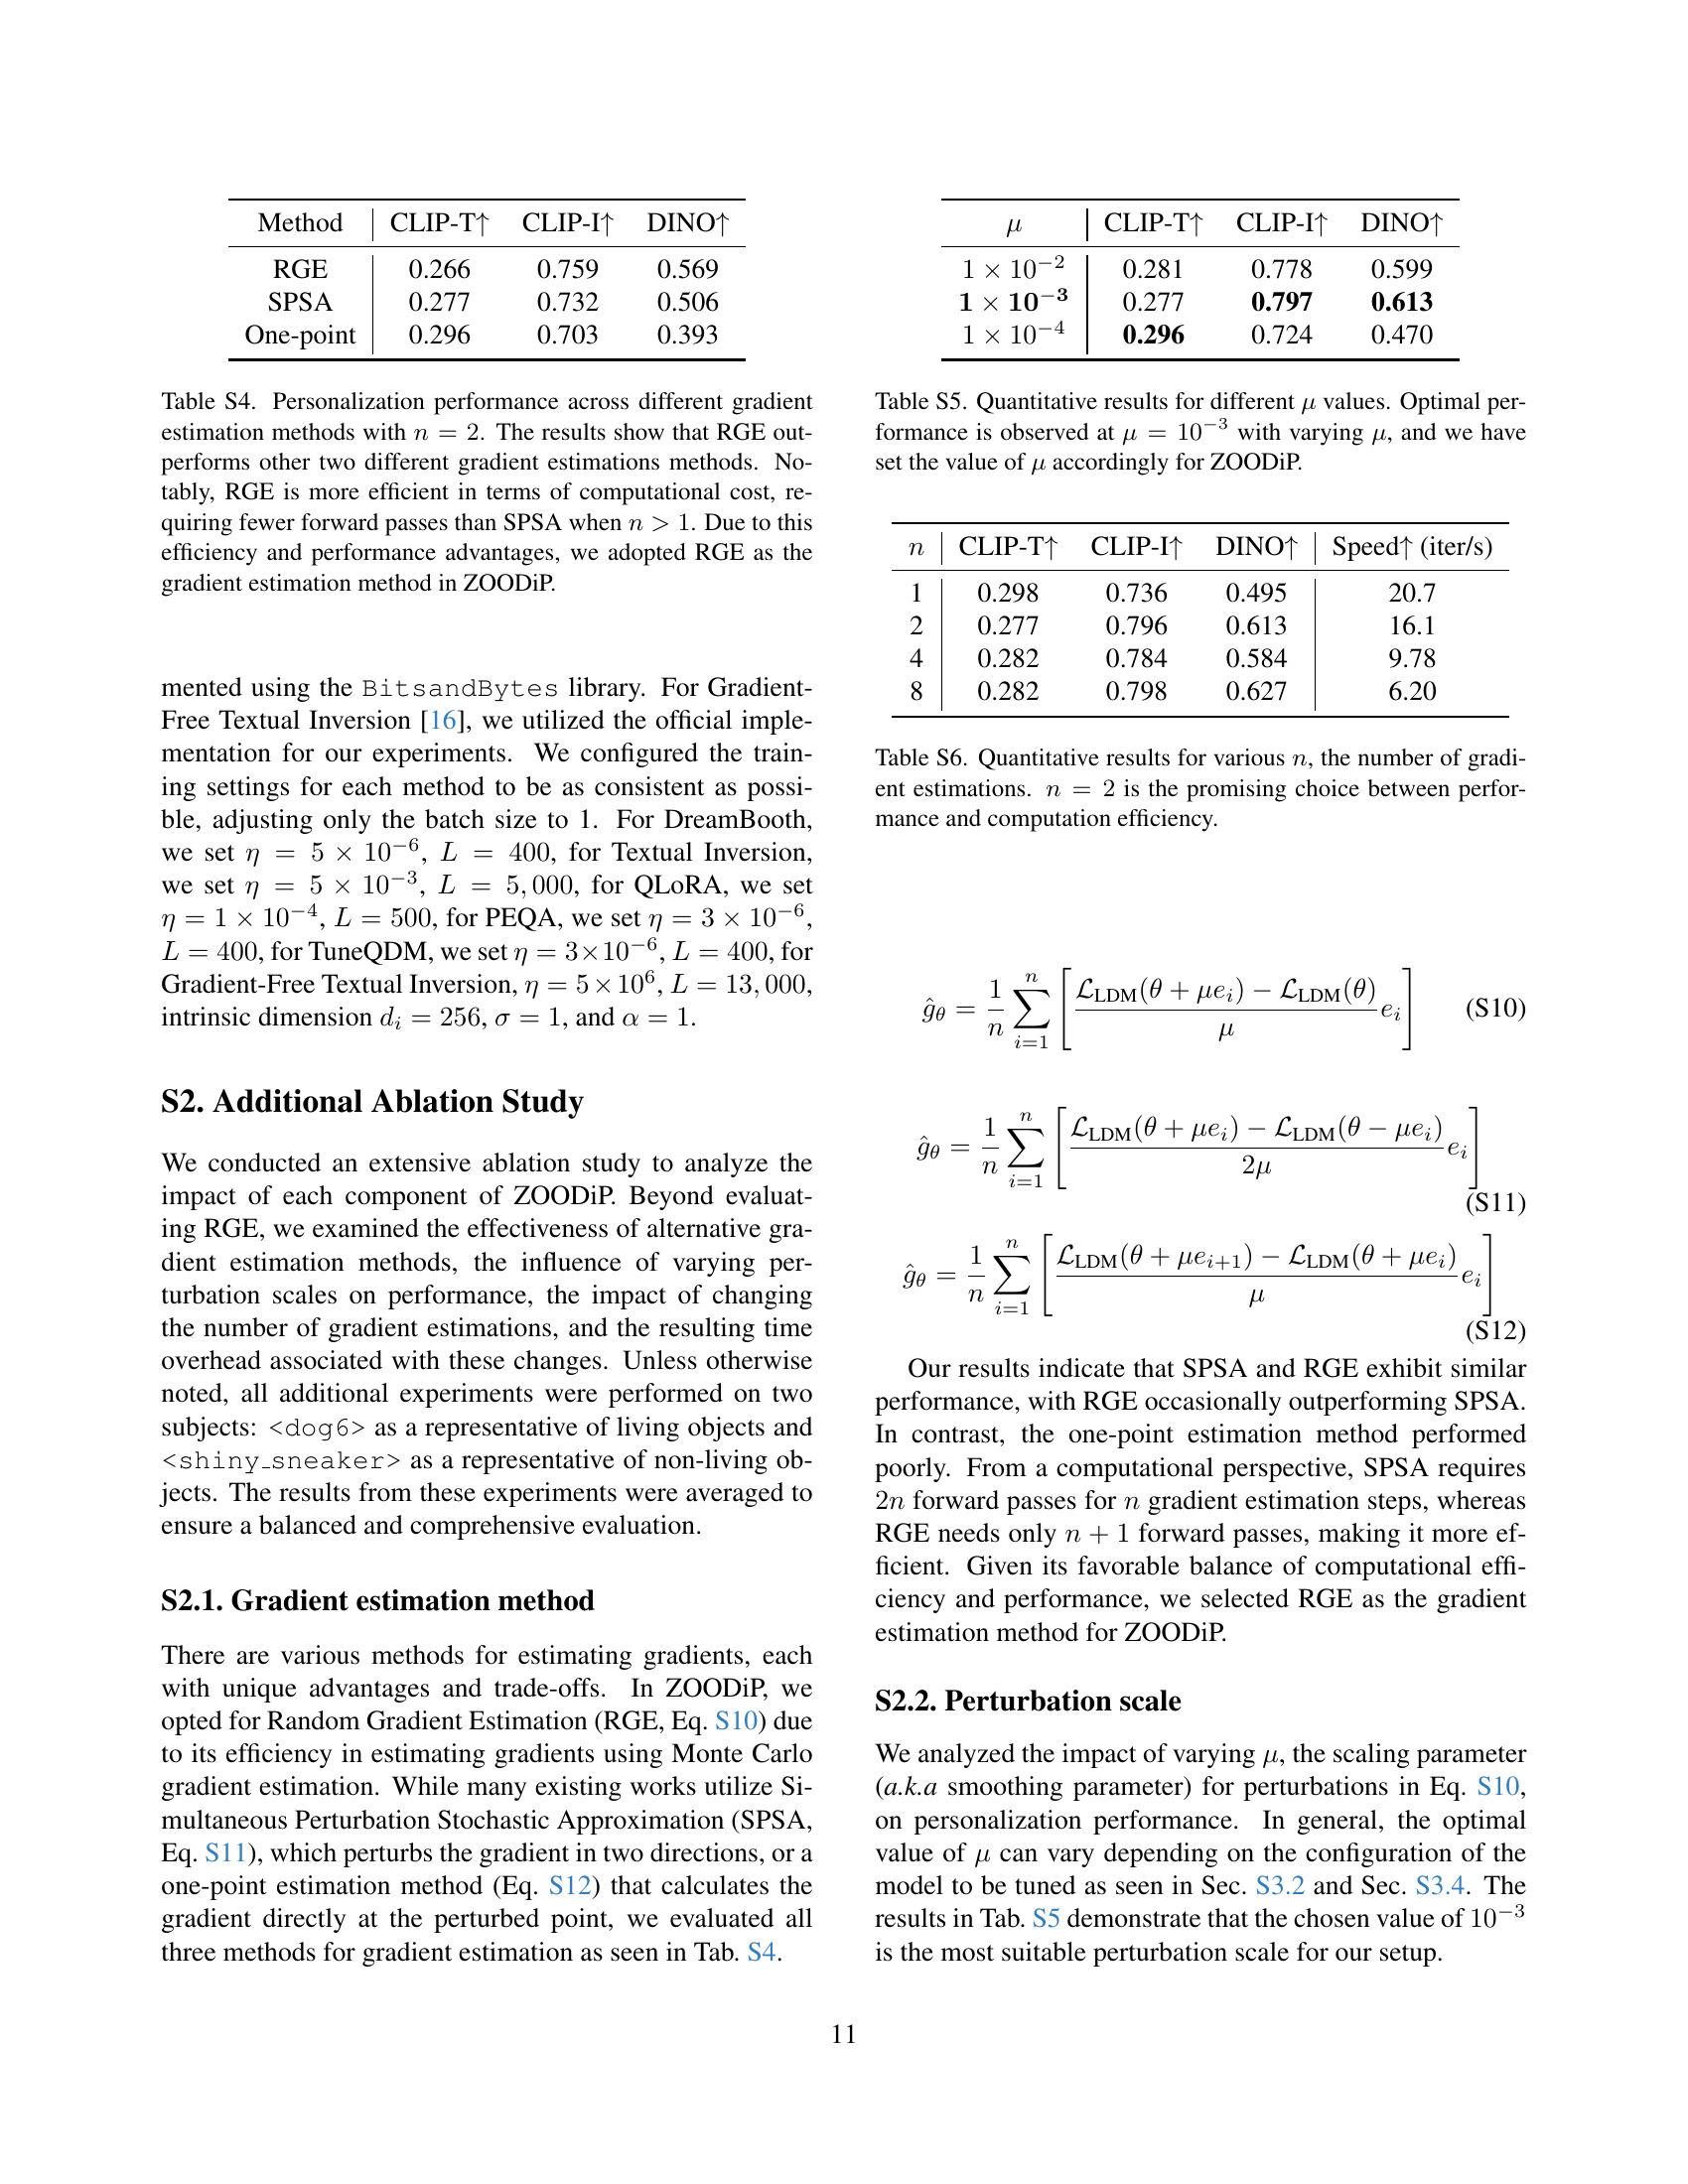
Figure S1: Generated images with the prompt “a photo of a dog” with various weight precision. While INT8 precision produces results nearly equivalent to full-precision performance, INT4 precision exhibits noticeable degradation in image quality, highlighting the trade-off between lower precision and fidelity.

🔼 This figure presents a qualitative comparison of images generated using 8-bit (INT8) and 4-bit (INT4) quantized U-Net models within the ZOODIP framework. The results demonstrate the impact of quantization on image quality. While the INT8 model produces high-fidelity images comparable to those generated using full-precision weights, a noticeable degradation in image quality is observed in images produced by the INT4 model. This illustrates the trade-off between reduced memory requirements (achieved through lower-bit quantization) and the fidelity of the generated images.
read the caption
Figure S2: Qualitative results of U-Net precision at INT8 and INT4 indataset. ZOODiP works on INT4 and INT8, but performance diminishes due to degradation caused by INT4 quantization.

🔼 Figure S3 presents a qualitative comparison of image diversity resulting from different personalization methods. The figure displays example images generated by DreamBooth, PEQA, TuneQDM, Textual Inversion, Gradient-Free Textual Inversion, and ZOODiP. By visually inspecting the generated images for each method, one can qualitatively assess the diversity of the output. The caption highlights that ZOODiP produces highly diverse images while using minimal memory resources, emphasizing its efficiency.
read the caption
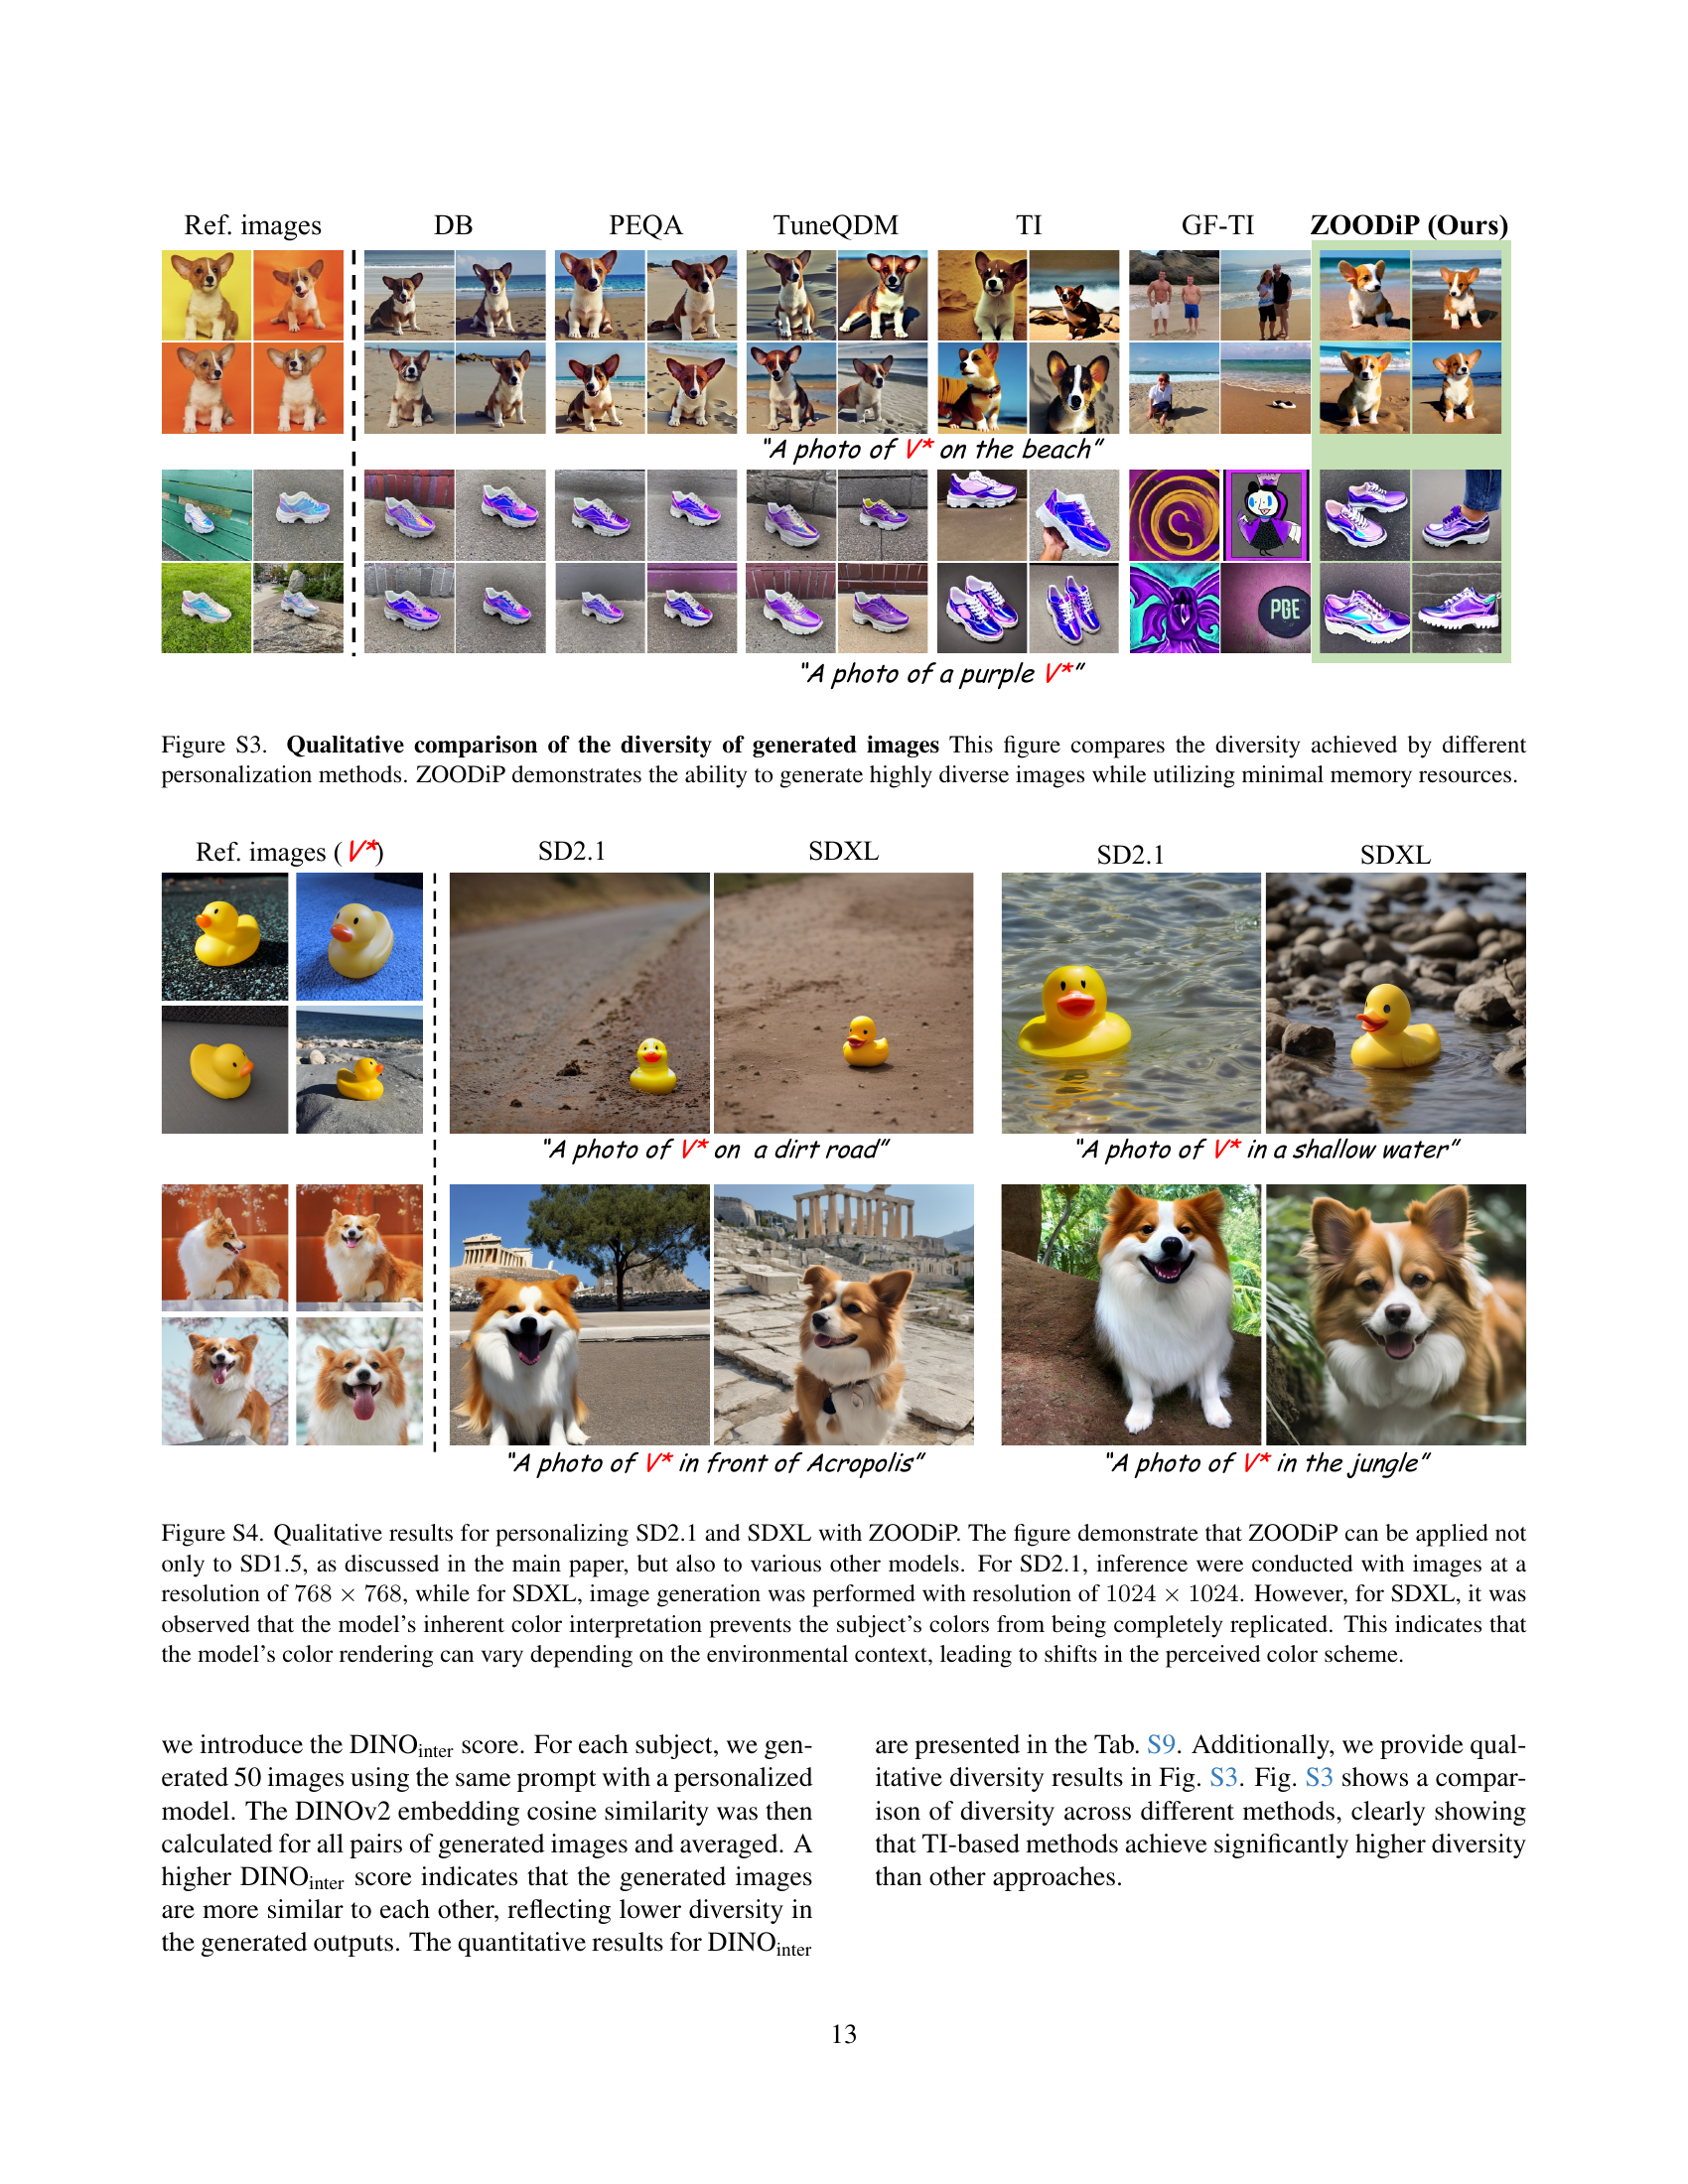
Figure S3: Qualitative comparison of the diversity of generated images This figure compares the diversity achieved by different personalization methods. ZOODiP demonstrates the ability to generate highly diverse images while utilizing minimal memory resources.

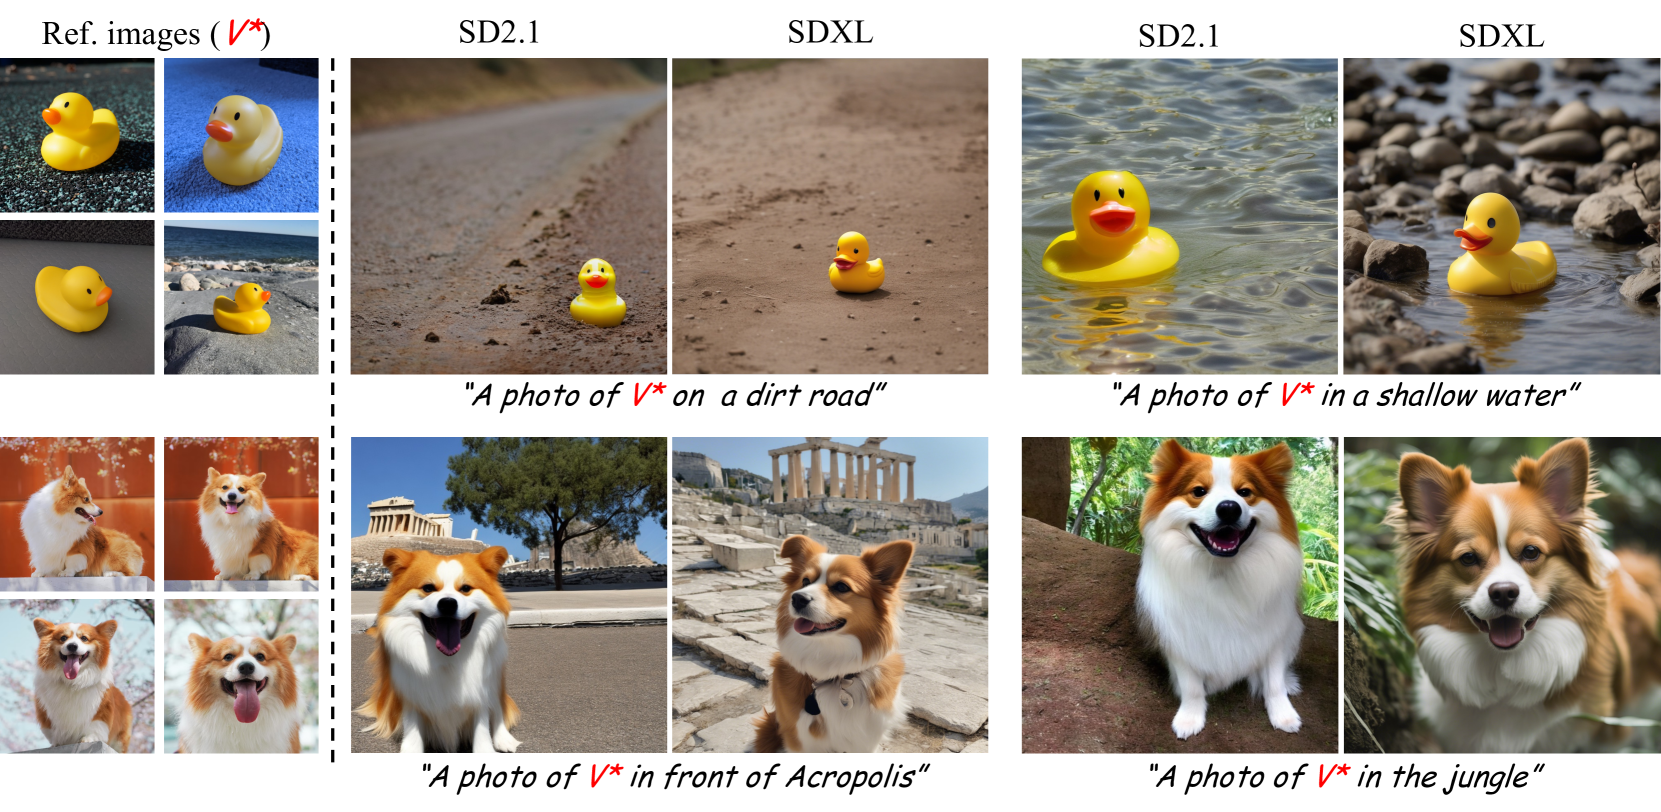
🔼 Figure S4 showcases ZOODIP’s adaptability to different diffusion models beyond the SD1.5 model discussed in the main paper. It demonstrates successful personalization on both SD2.1 (using 768x768 resolution images) and SDXL (using 1024x1024 resolution images). However, the results highlight a limitation: SDXL’s inherent color interpretation sometimes prevents perfectly accurate color replication of the subject, suggesting that environmental context influences color rendering in SDXL.
read the caption
Figure S4: Qualitative results for personalizing SD2.1 and SDXL with ZOODiP. The figure demonstrate that ZOODiP can be applied not only to SD1.5, as discussed in the main paper, but also to various other models. For SD2.1, inference were conducted with images at a resolution of 768×768768768768\times 768768 × 768, while for SDXL, image generation was performed with resolution of 1024×1024102410241024\times 10241024 × 1024. However, for SDXL, it was observed that the model’s inherent color interpretation prevents the subject’s colors from being completely replicated. This indicates that the model’s color rendering can vary depending on the environmental context, leading to shifts in the perceived color scheme.

🔼 This figure compares the performance of two methods for personalizing diffusion models: a naive zeroth-order optimization approach and the proposed ZOODIP method. The naive method, lacking the Subspace Gradient (SG) and Partial Uniform Timestep Sampling (PUTS) techniques, shows slower convergence during training and generates images less faithful to the reference image. In contrast, ZOODIP, utilizing SG and PUTS, demonstrates significantly faster training and produces images that are much better aligned with the subject in the reference image. The figure visually illustrates this by showing image outputs at various iteration steps for both methods, highlighting the superior performance of ZOODIP.
read the caption
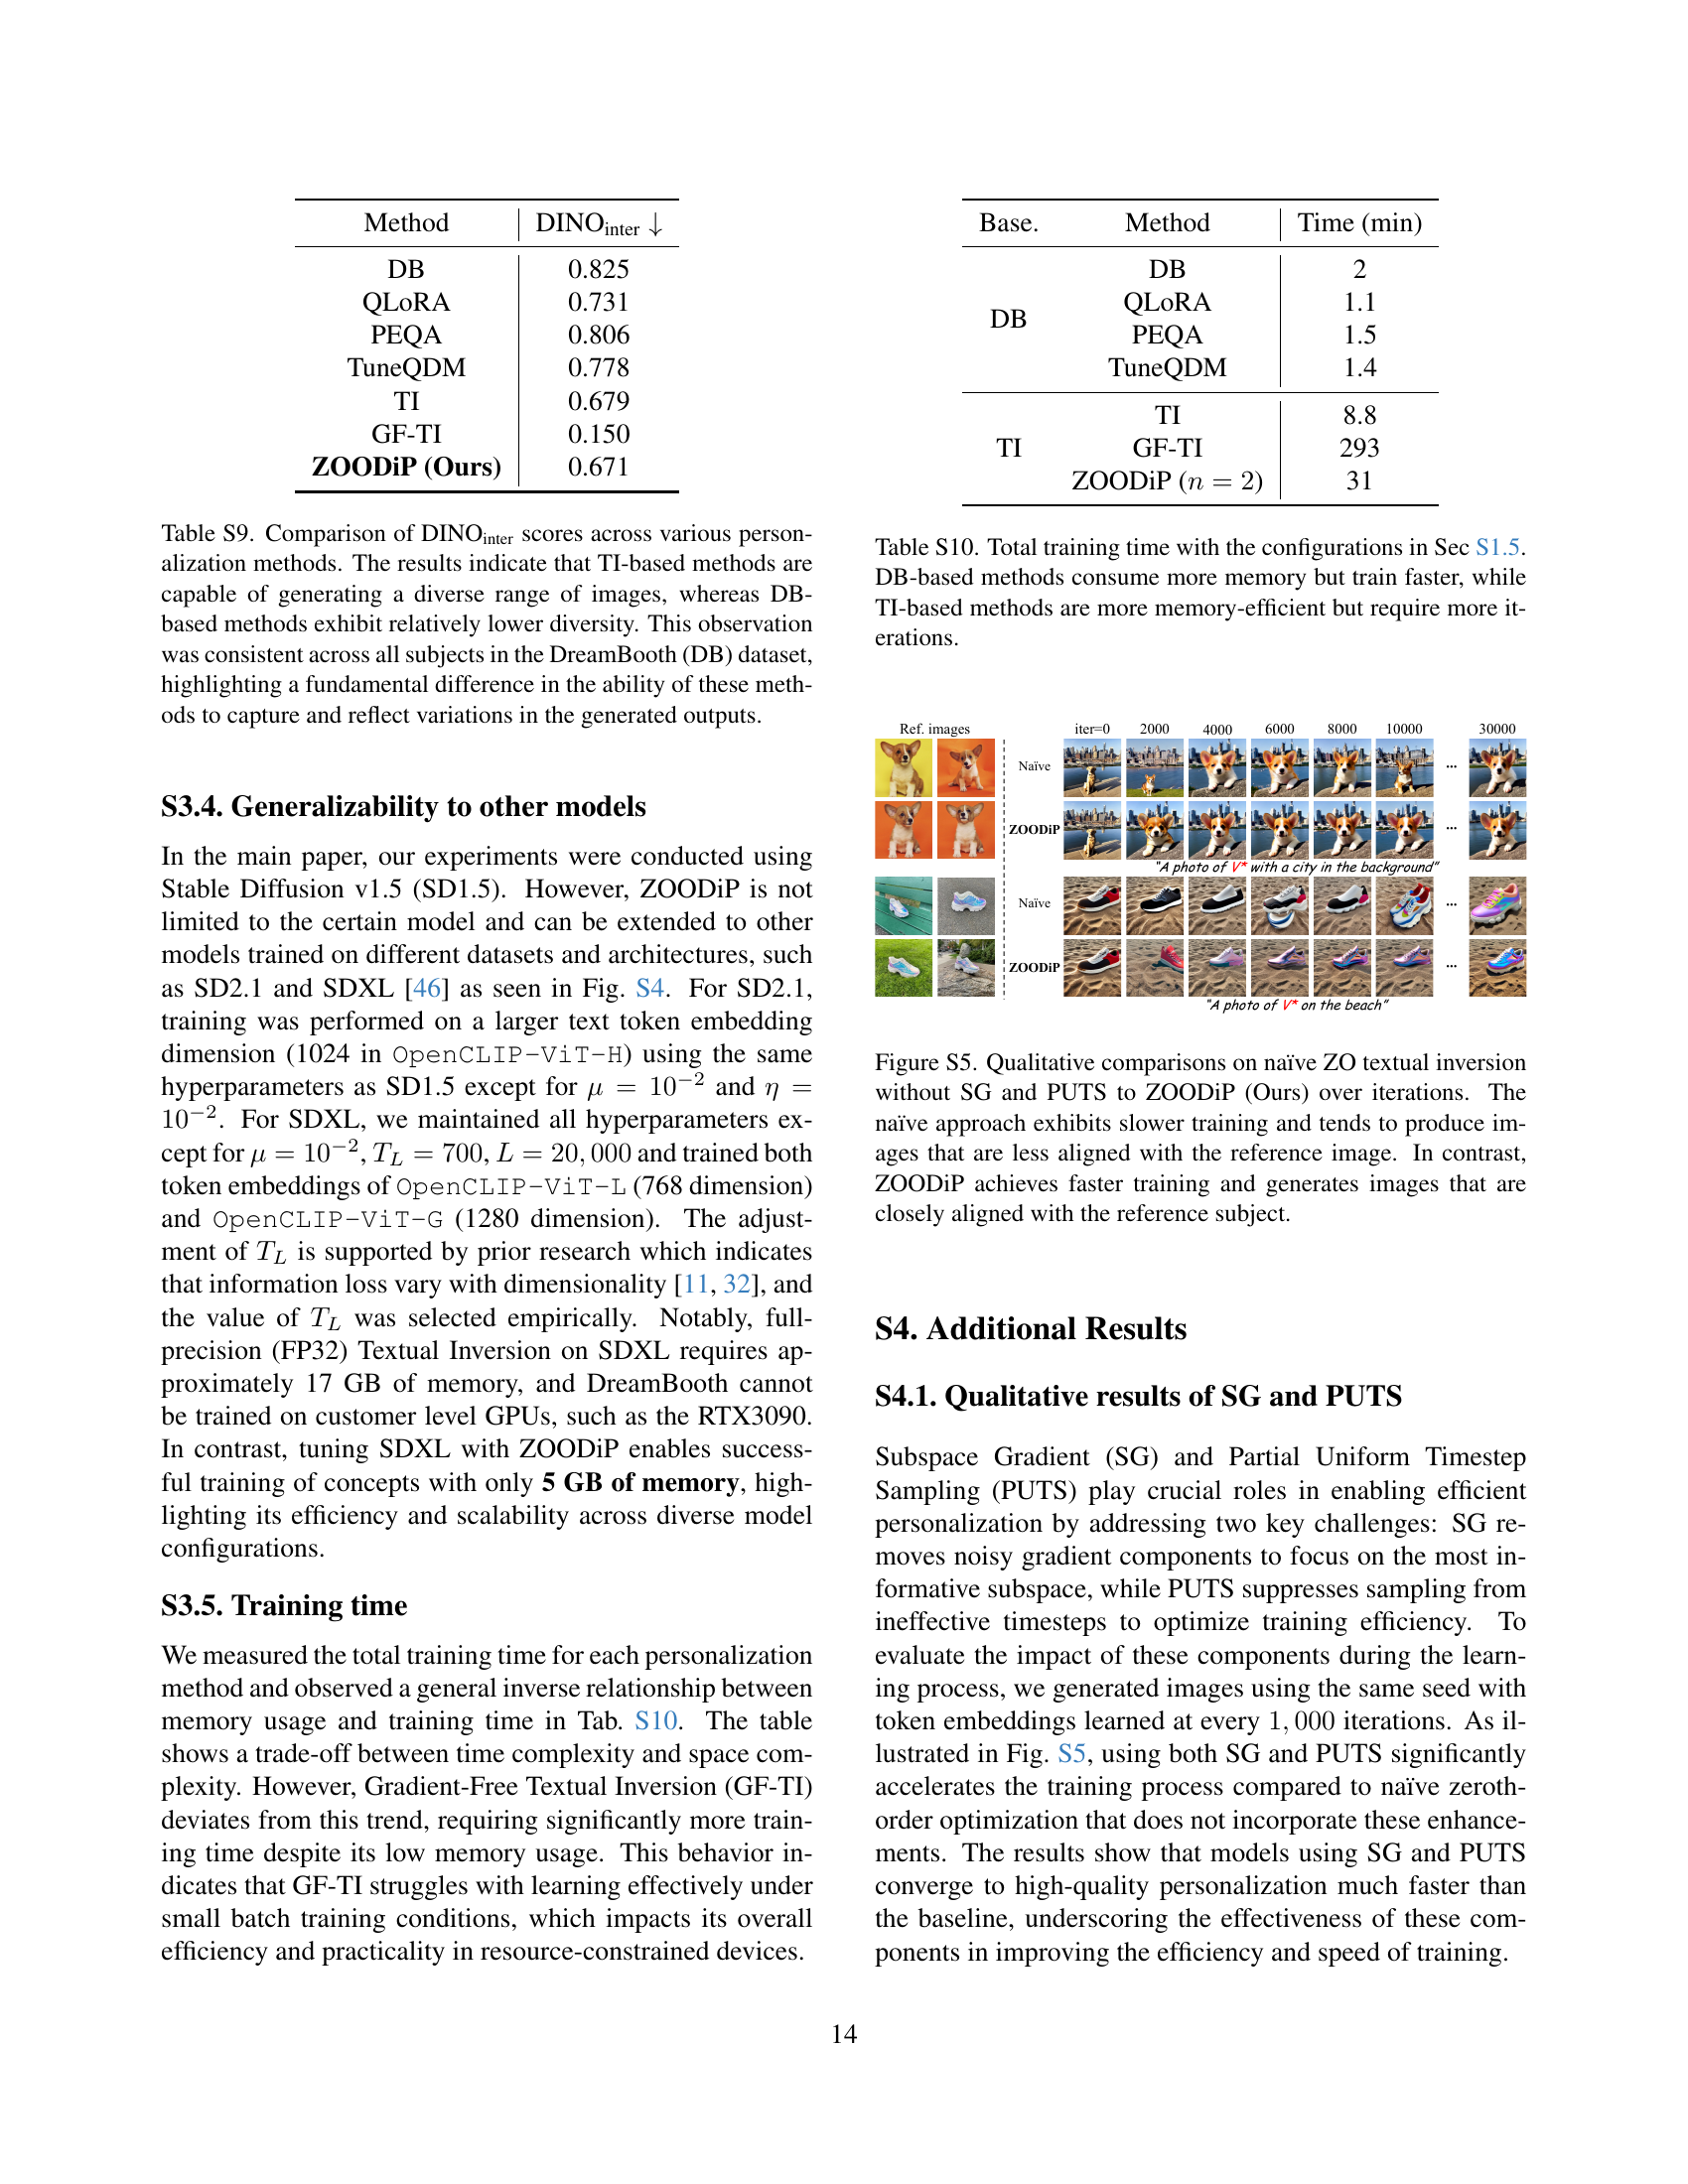
Figure S5: Qualitative comparisons on naïve ZO textual inversion without SG and PUTS to ZOODiP (Ours) over iterations. The naïve approach exhibits slower training and tends to produce images that are less aligned with the reference image. In contrast, ZOODiP achieves faster training and generates images that are closely aligned with the reference subject.

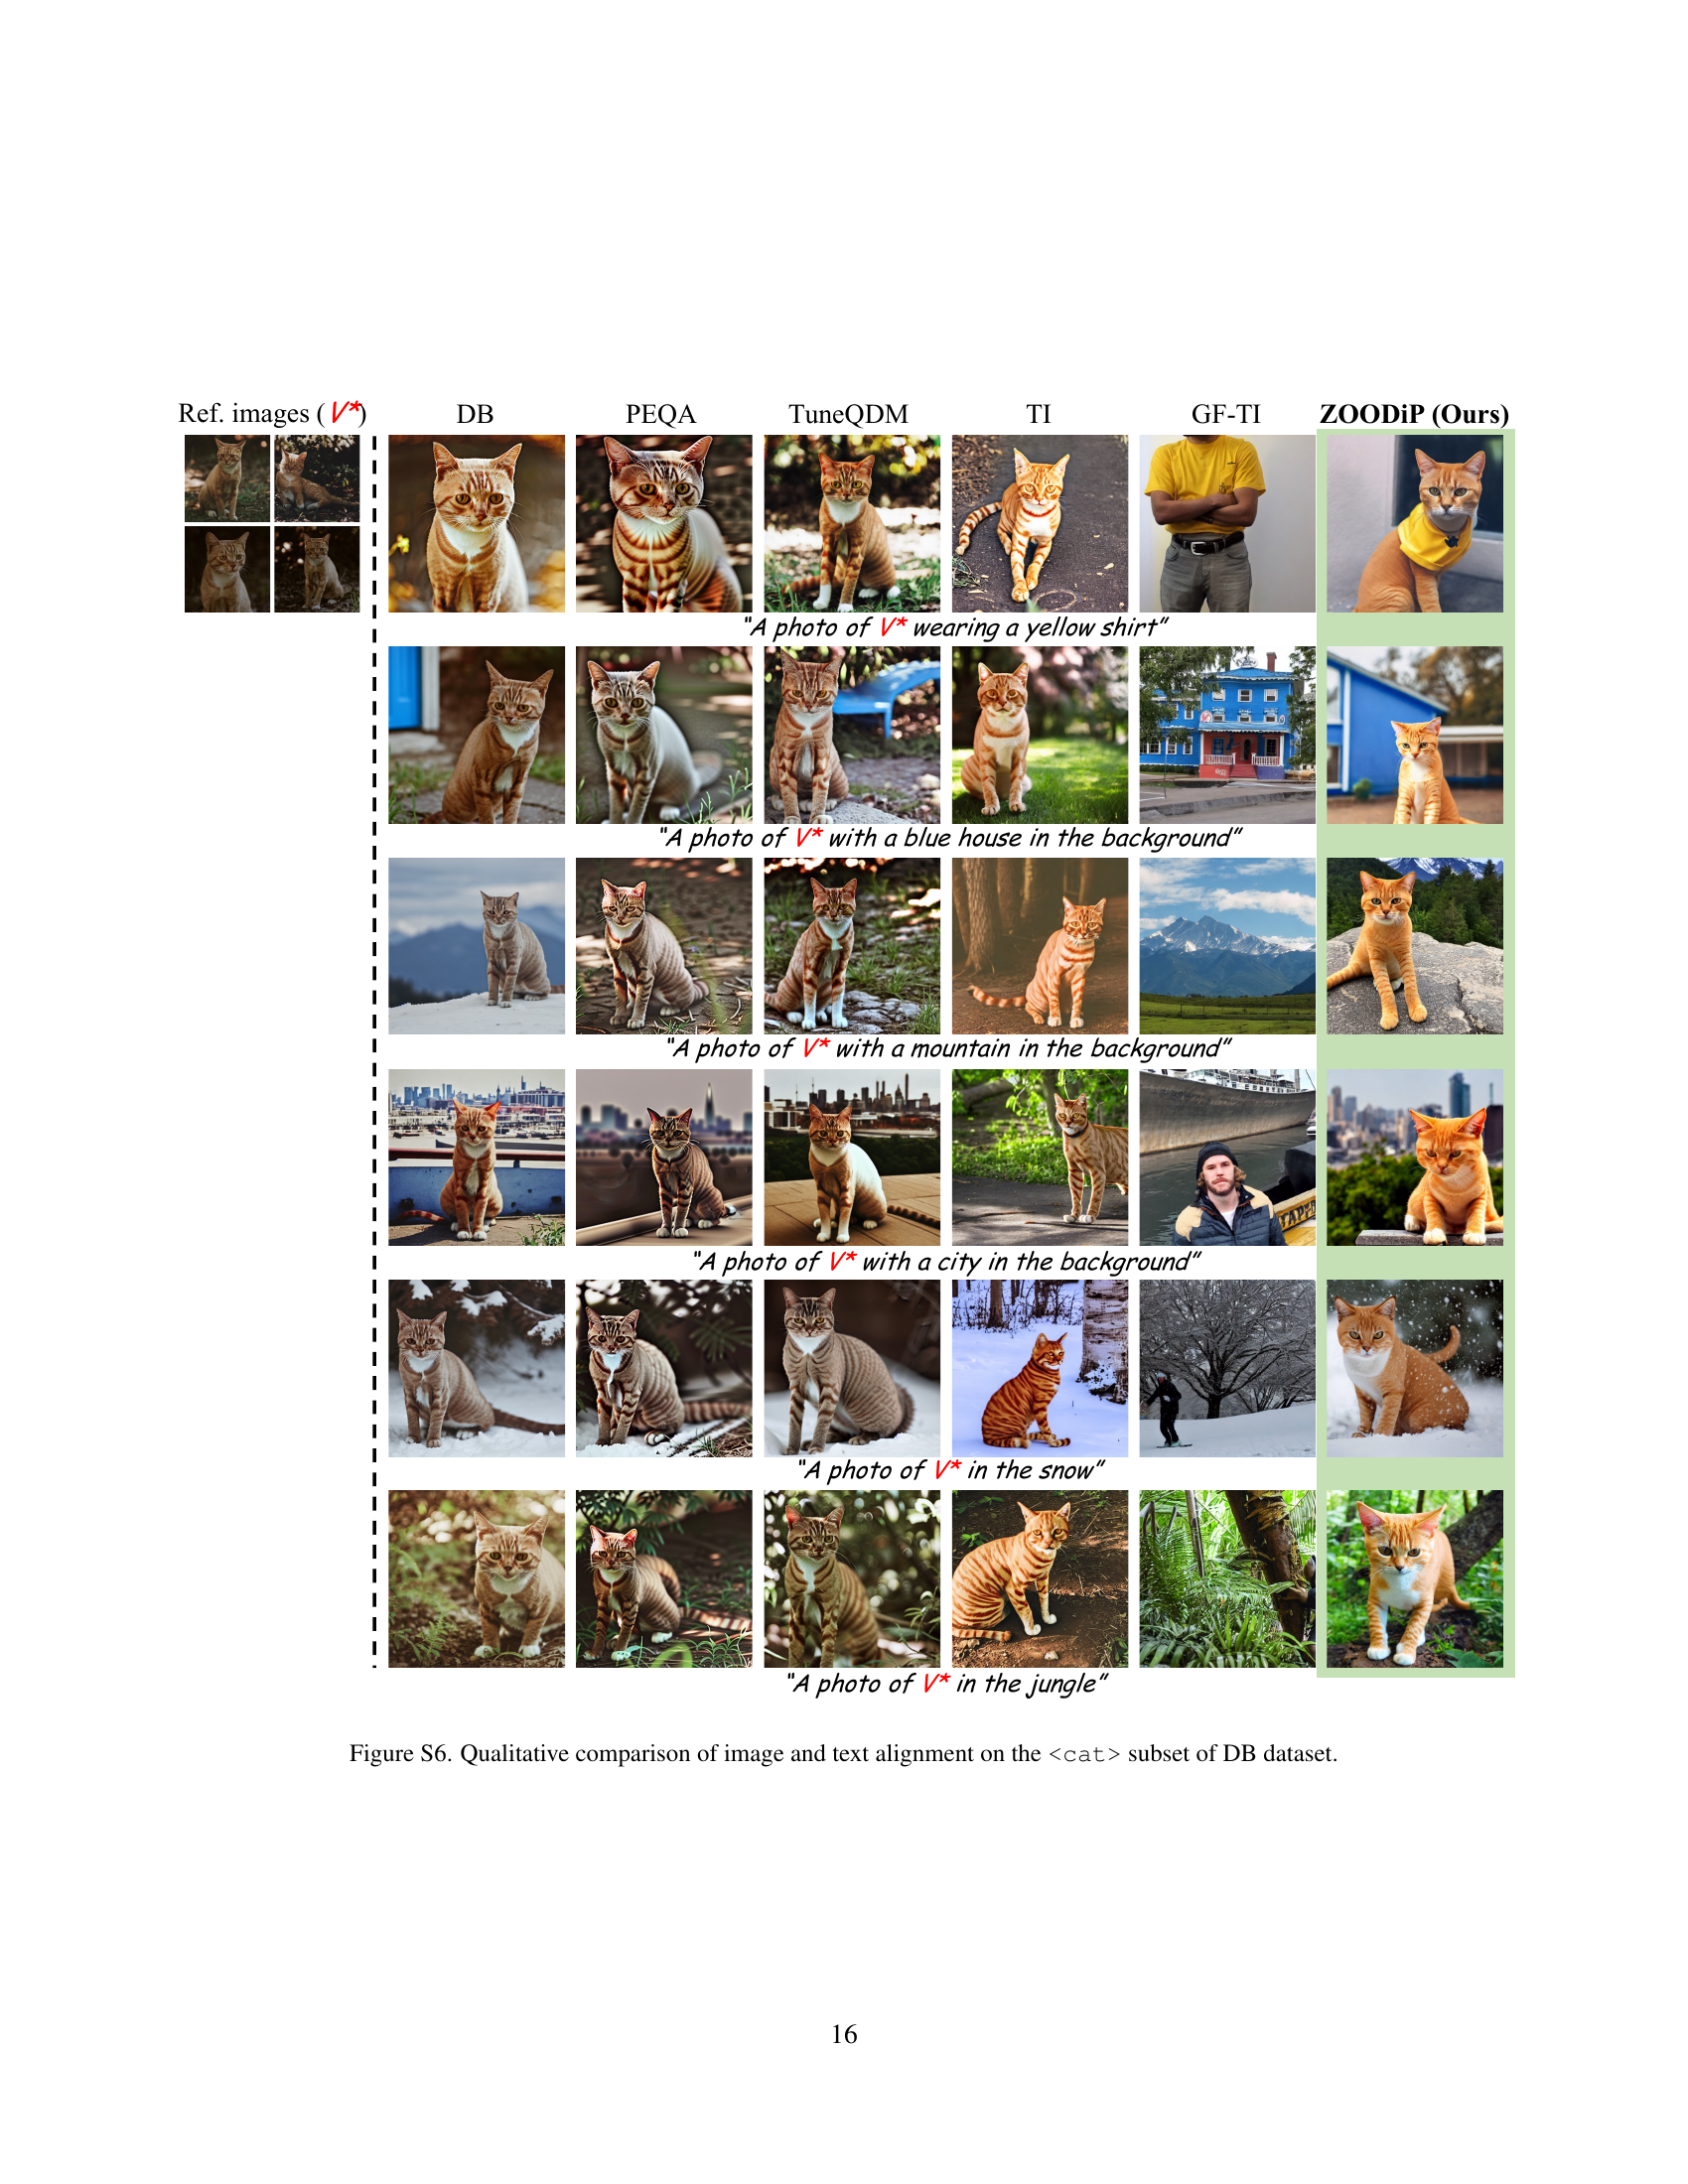
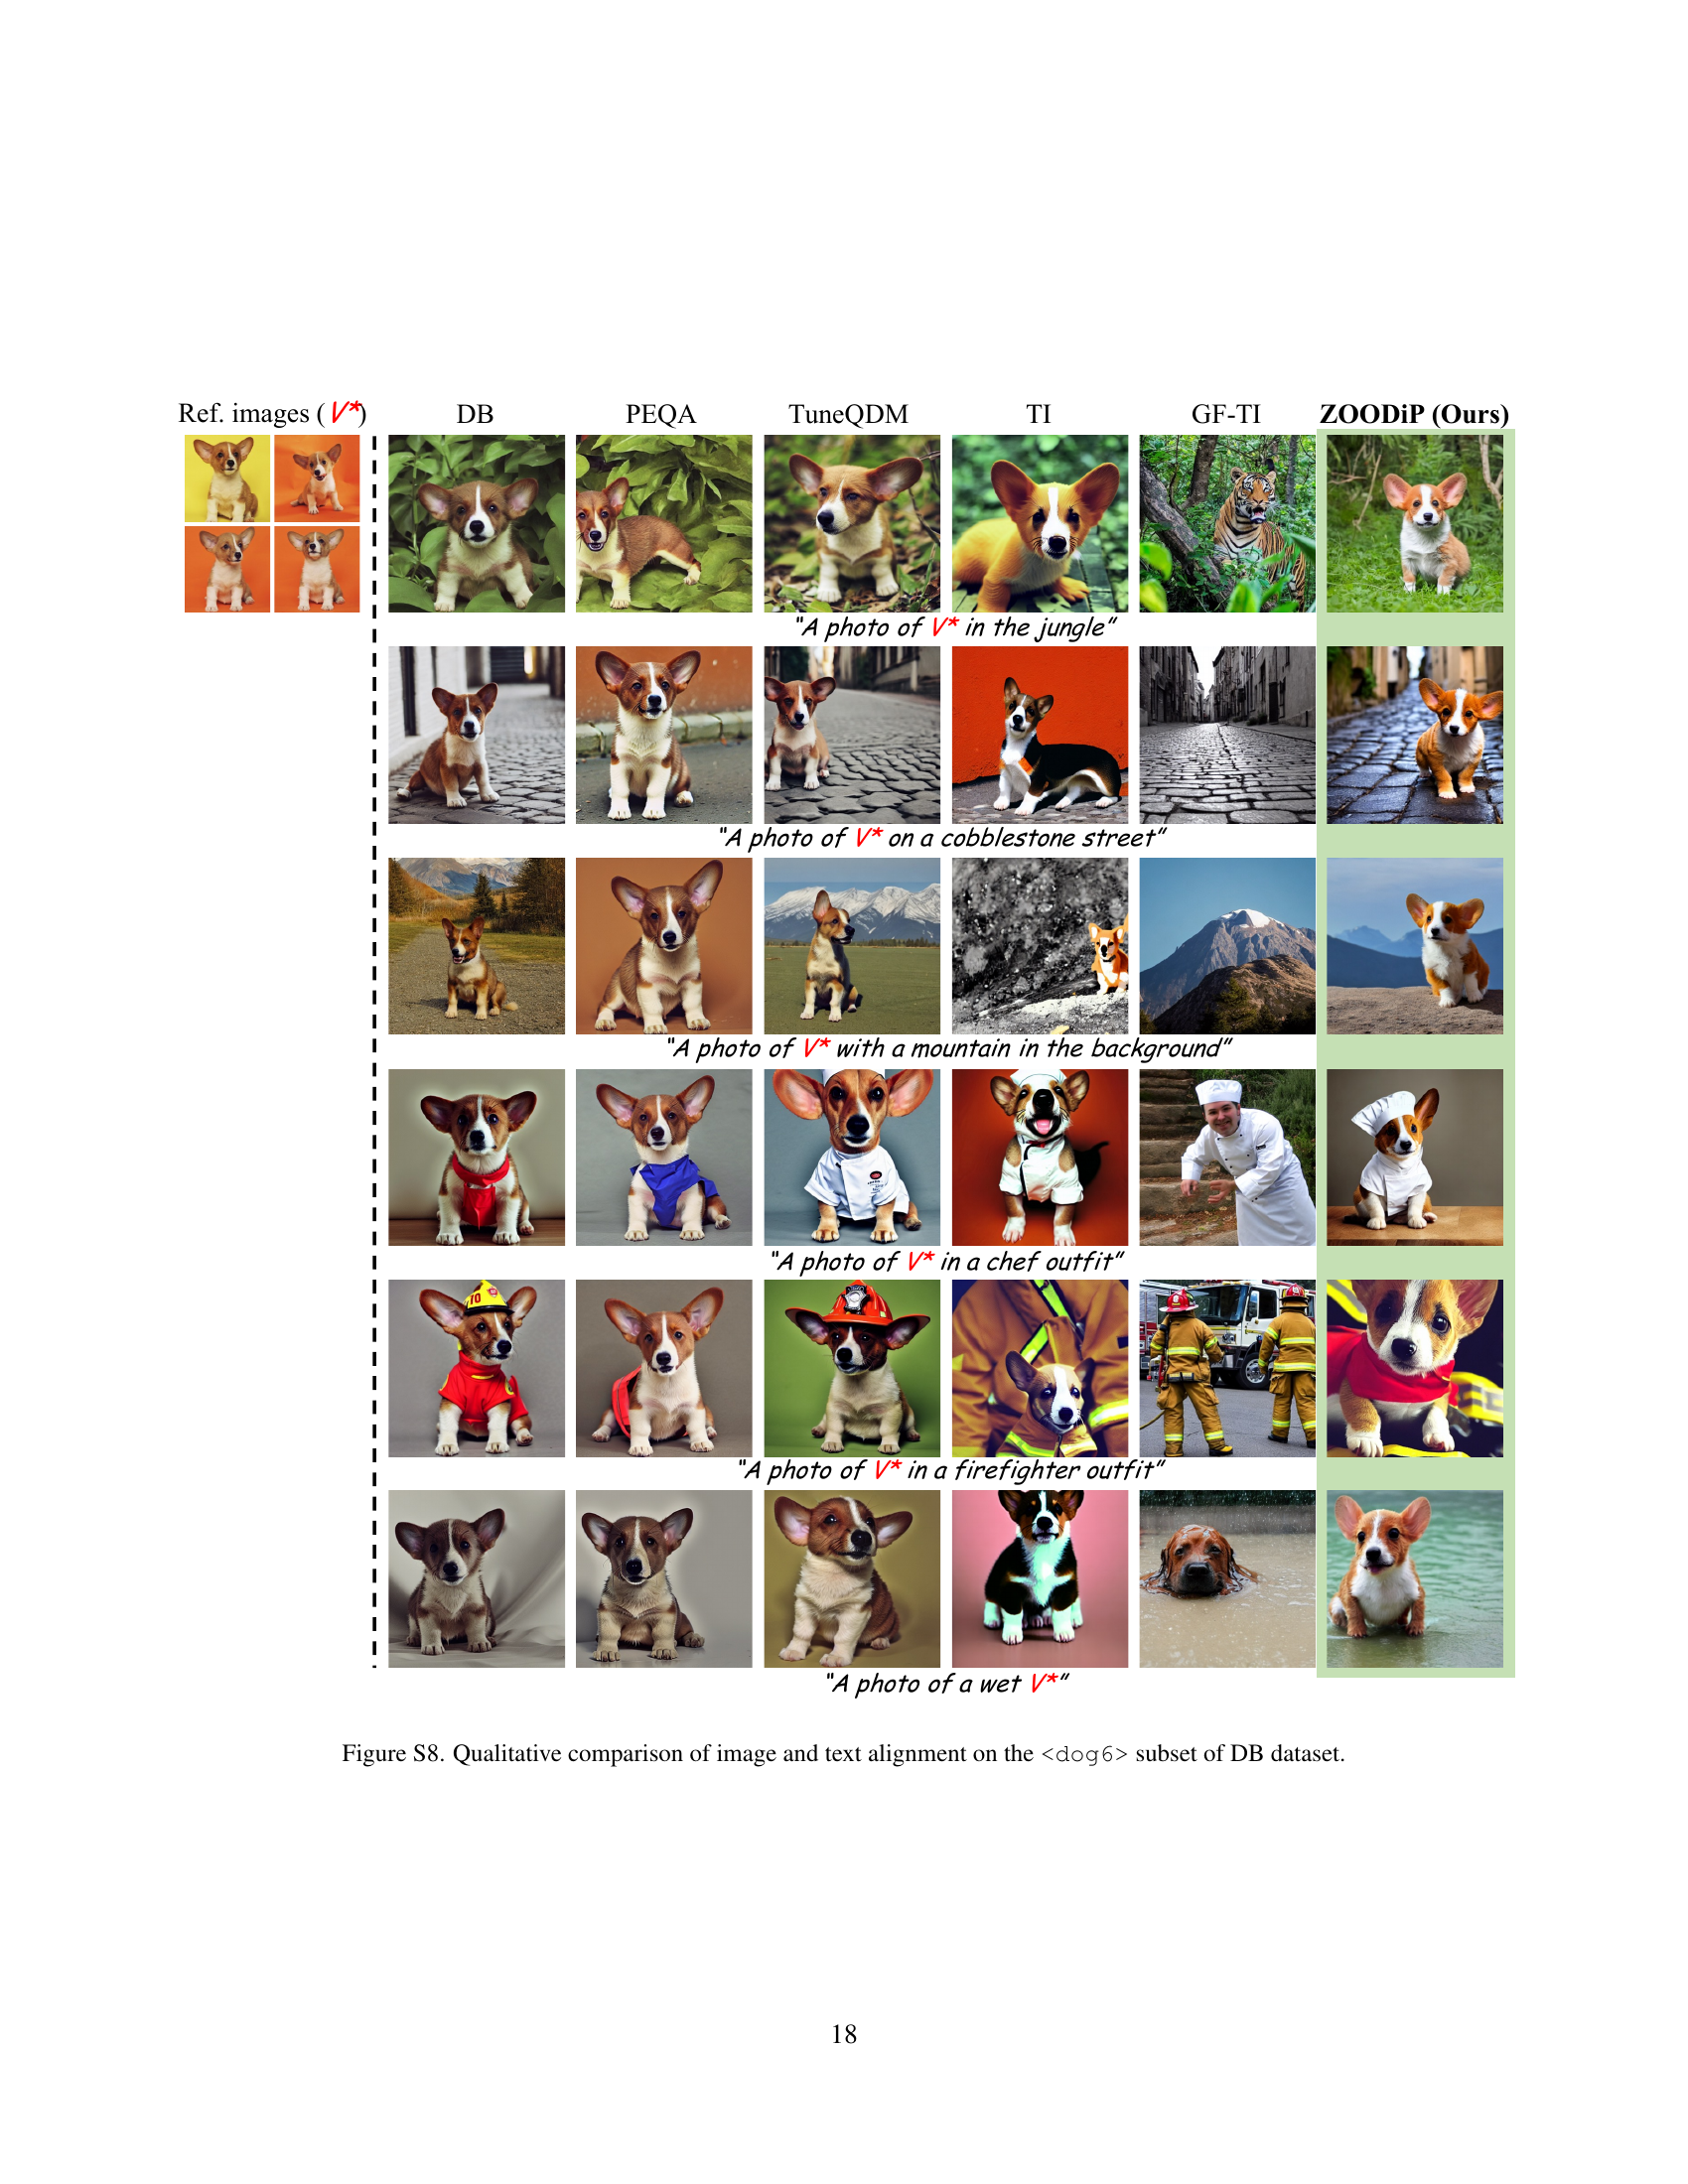
🔼 This figure presents a qualitative comparison of how well different personalization methods generate images that match both the given text prompt and the visual characteristics of a reference image. The methods compared include DreamBooth (DB), PEQA, TuneQDM, Textual Inversion (TI), Gradient-Free TI (GF-TI), and the proposed ZOODIP method. The comparison focuses specifically on images of cats, a subset of the DreamBooth (DB) dataset. The goal is to visually demonstrate the effectiveness of each method in capturing both textual and visual aspects of the target concept (the cat) when generating new images.
read the caption
Figure S6: Qualitative comparison of image and text alignment on thesubset of DB dataset.

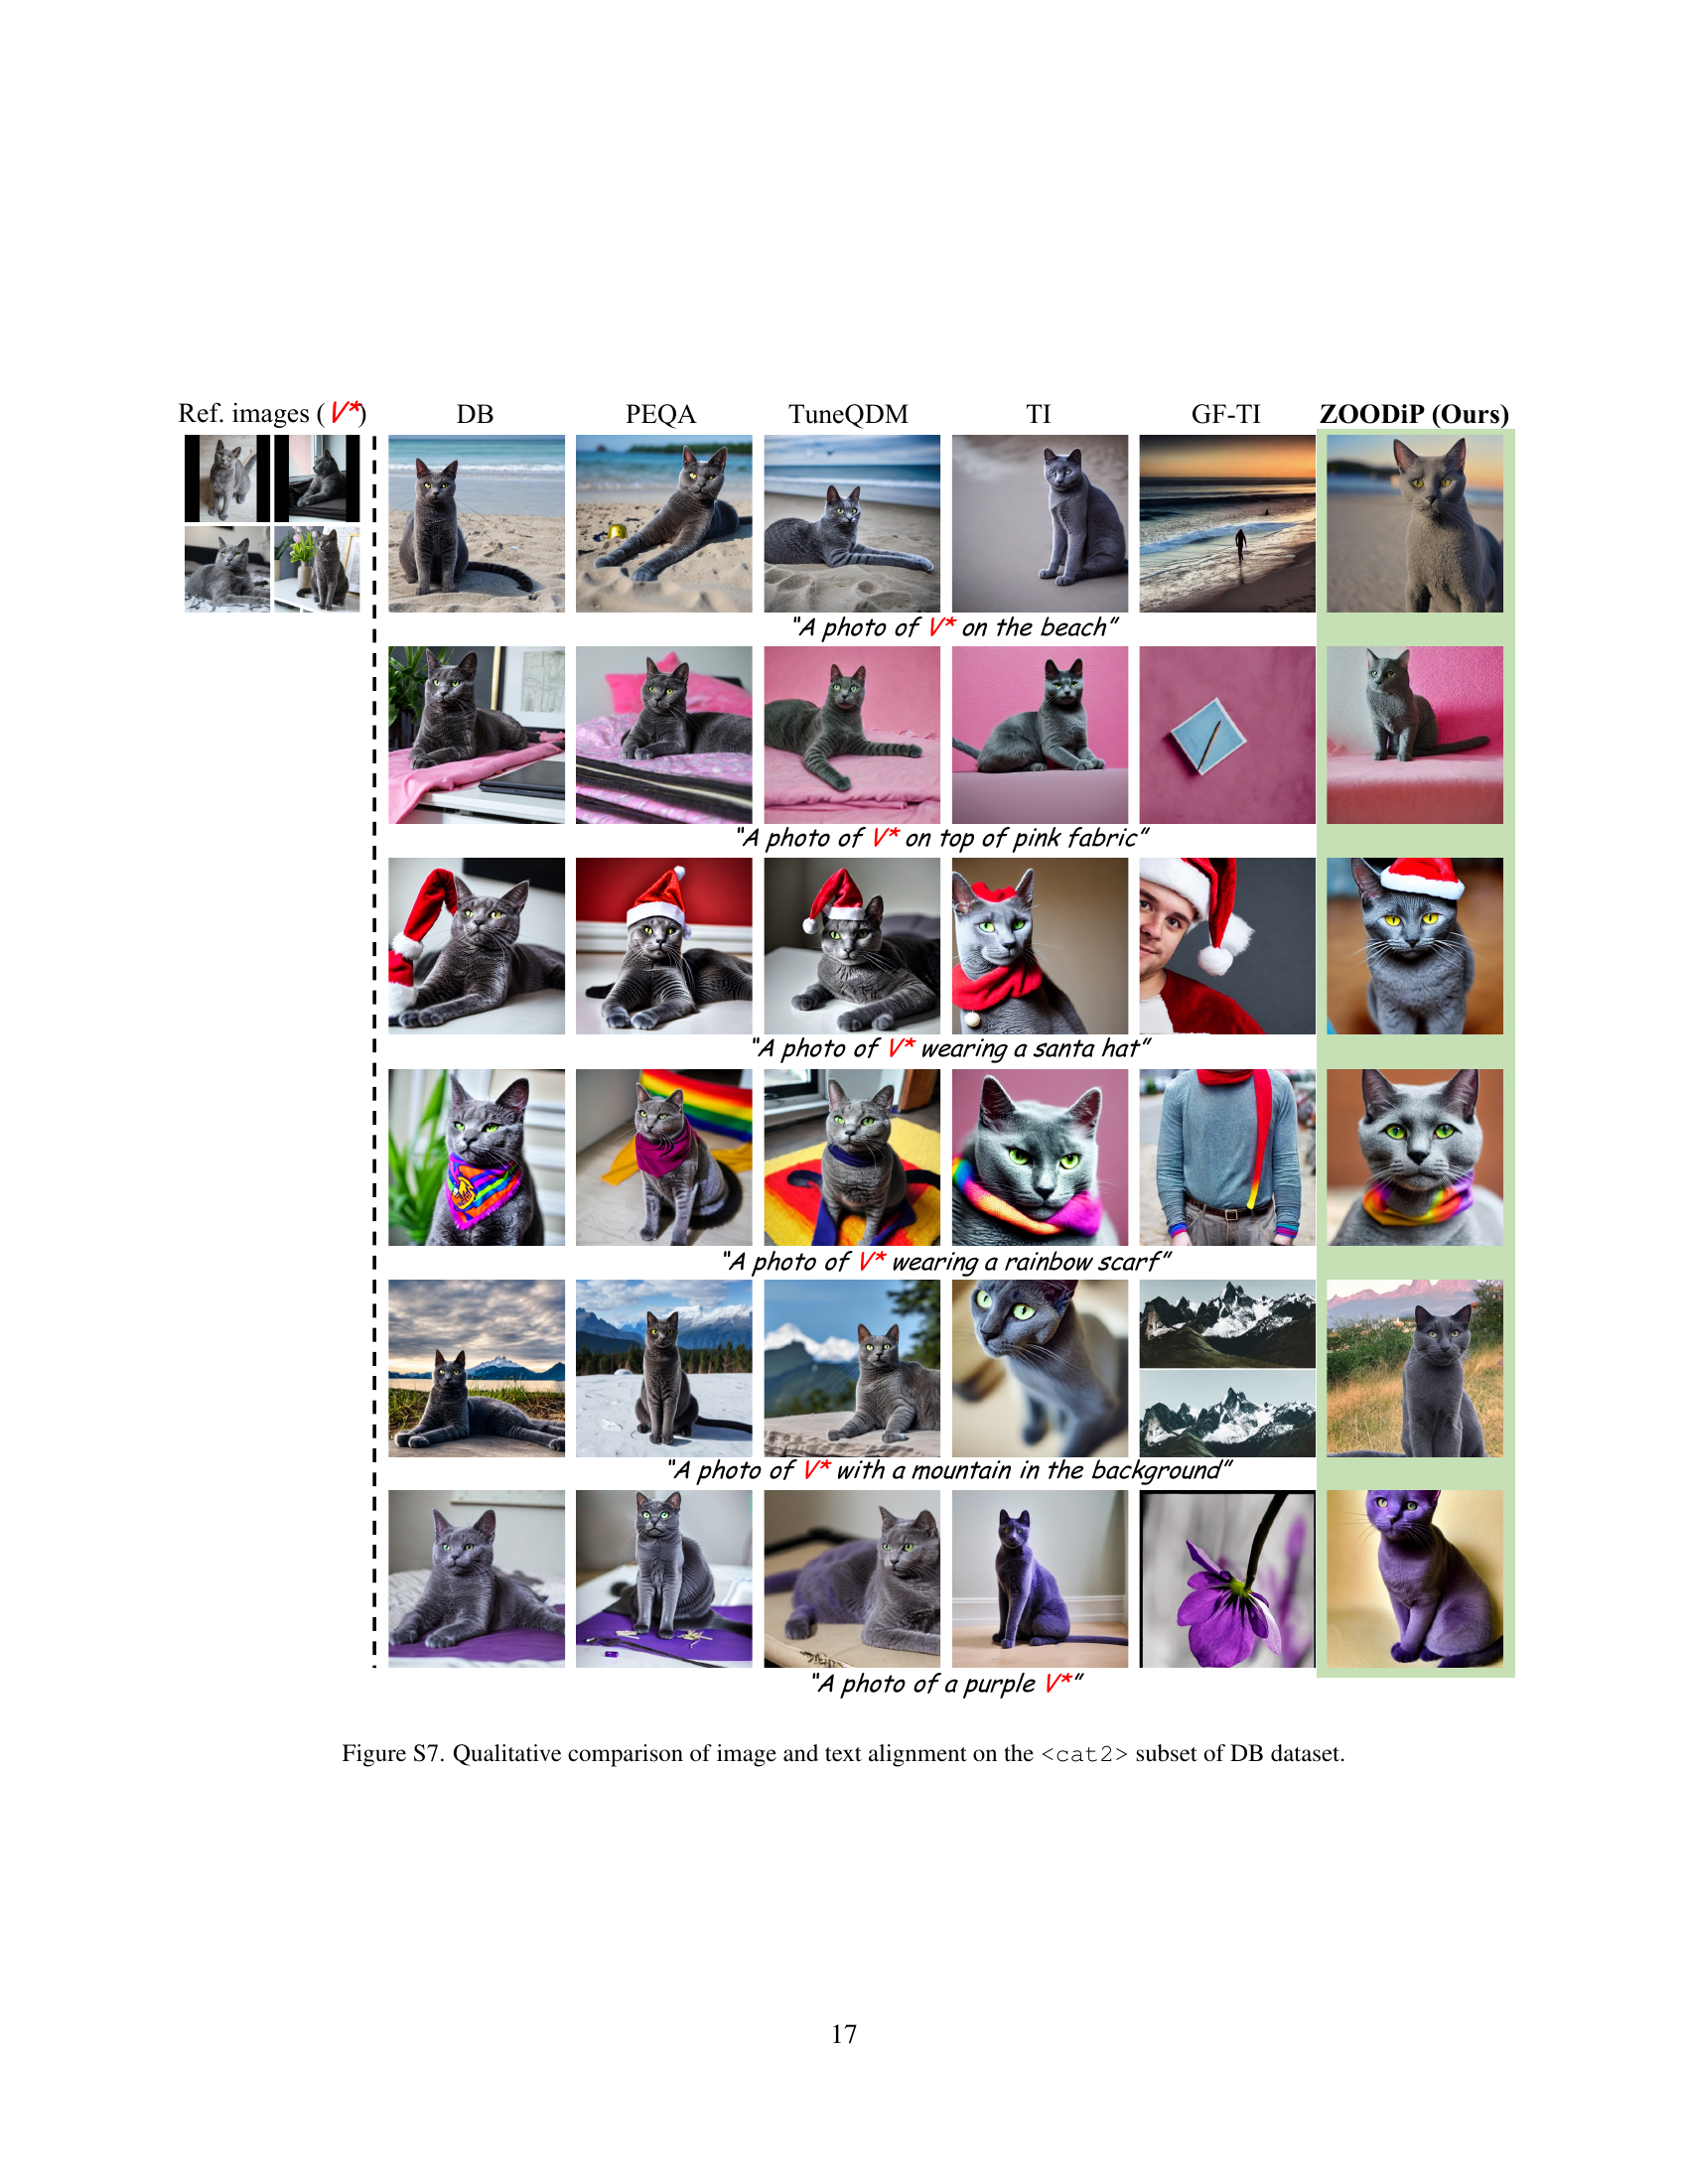
🔼 This figure displays a qualitative comparison of the results obtained from different personalization methods on a subset of the DreamBooth dataset focused on a specific cat. It shows generated images from several methods alongside reference images and text prompts used. The aim is to visually demonstrate the fidelity of each method’s image generation with respect to both visual similarity to the reference cat images and alignment with the textual description.
read the caption
Figure S7: Qualitative comparison of image and text alignment on thesubset of DB dataset.
More on tables
| Method | Prec. | Speed (iter/sec) |
| TI | FP32 | 9.42 |
| Ours () | FP16 | 22.3 |
| Ours () | 18.4 | |
| TuneQDM | INT8 | 4.94 |
| GF-TI | 0.74 | |
| Ours () | 20.7 | |
| Ours () | 16.1 |
🔼 This table compares the training speed of various diffusion model personalization methods, including ZOODIP and several baselines. It highlights the significant speed advantage of ZOODIP due to its use of zeroth-order optimization, which avoids the computationally expensive backpropagation step used in gradient-based methods. The table presents the training iterations per second for each method, indicating the number of training iterations that can be completed within one second. This reflects the efficiency of each method in adapting the model to personalized data.
read the caption
Table 2: Training speed comparisons of prior works and ZOODiP. ZOODiP achieves the fastest training speed by estimating gradients with only forward passes, bypassing backpropagation.
| SG | PUTS | CLIP-T | CLIP-I | DINO |
|---|---|---|---|---|
| ✗ | ✗ | 0.273 | 0.736 | 0.505 |
| ✓ | ✗ | 0.265 | 0.747 | 0.527 |
| ✗ | ✓ | 0.277 | 0.744 | 0.562 |
| ✓ | ✓ | 0.266 | 0.759 | 0.569 |
🔼 This table presents an ablation study evaluating the impact of different components of the ZOODiP model on its performance when personalizing images of shiny sneakers. It shows the results of training with various combinations of Subspace Gradient (SG) and Partial Uniform Timestep Sampling (PUTS), as well as a baseline using uniformly sampled timesteps without SG or PUTS. The table reports the CLIP-T, CLIP-I, and DINO scores, which measure text-image alignment and image quality, for each configuration. This allows assessing the relative contribution of each component towards achieving the final performance.
read the caption
Table 3: Ablation study on ZOODiP components with. ✓ denotes the component is applied, while ✗ means it is not. Without PUTS, timesteps are sampled uniformly.
| 32 | 0.704 | 0.686 | 0.716 | 0.729 |
|---|---|---|---|---|
| 64 | 0.721 | 0.736 | 0.712 | 0.724 |
| 128 | 0.736 | 0.735 | 0.759 | 0.716 |
| 256 | 0.739 | 0.727 | 0.738 | 0.716 |
| 512 | 0.705 | 0.704 | 0.676 | 0.707 |
🔼 This table presents the results of an ablation study investigating the impact of the hyperparameters (\tau) and (\nu) on the performance of the Subspace Gradient (SG) method within the ZOODiP framework. The study systematically varies (\tau) (the number of past gradient updates used to construct the subspace) and (\nu) (a hyperparameter controlling the amount of variance retained in the PCA dimensionality reduction). Performance is evaluated using the CLIP-I image alignment score. All experiments were conducted using the <shiny_sneaker> dataset from the DreamBooth dataset to ensure consistency.
read the caption
Table 4: Ablation study on hyperparameters τ𝜏\tauitalic_τ and ν𝜈\nuitalic_ν incorporated with SG. We optimized the pseudo-token with various τ𝜏\tauitalic_τ and ν𝜈\nuitalic_ν and measured the performance with the CLIP-I score. Experiments were done withdataset.
| Method | CLIP-T | CLIP-I | DINO |
|---|---|---|---|
| Uniform | 0.265 | 0.747 | 0.527 |
| SNR-based | 0.271 | 0.719 | 0.545 |
| PUTS (Ours) | 0.266 | 0.759 | 0.569 |
🔼 This table presents the results of an ablation study on different diffusion timestep sampling methods used in personalizing a Stable Diffusion model for the
<shiny_sneaker>subject. The study compared three methods: uniform sampling, SNR-based sampling, and Partial Uniform Timestep Sampling (PUTS), which was proposed in the paper. The table shows the performance of each method based on image and text alignment scores. The results indicate that PUTS achieves the best image alignment score but has a slightly lower text alignment score compared to the SNR-based method. This suggests a trade-off between image and text alignment when selecting a timestep sampling strategy.read the caption
Table 5: Ablation study on various diffusion timestep sampling method with. PUTS outperforms in image alignment score among all sample methods with minor degradation in text alignment score compared to SNR-based sampling.
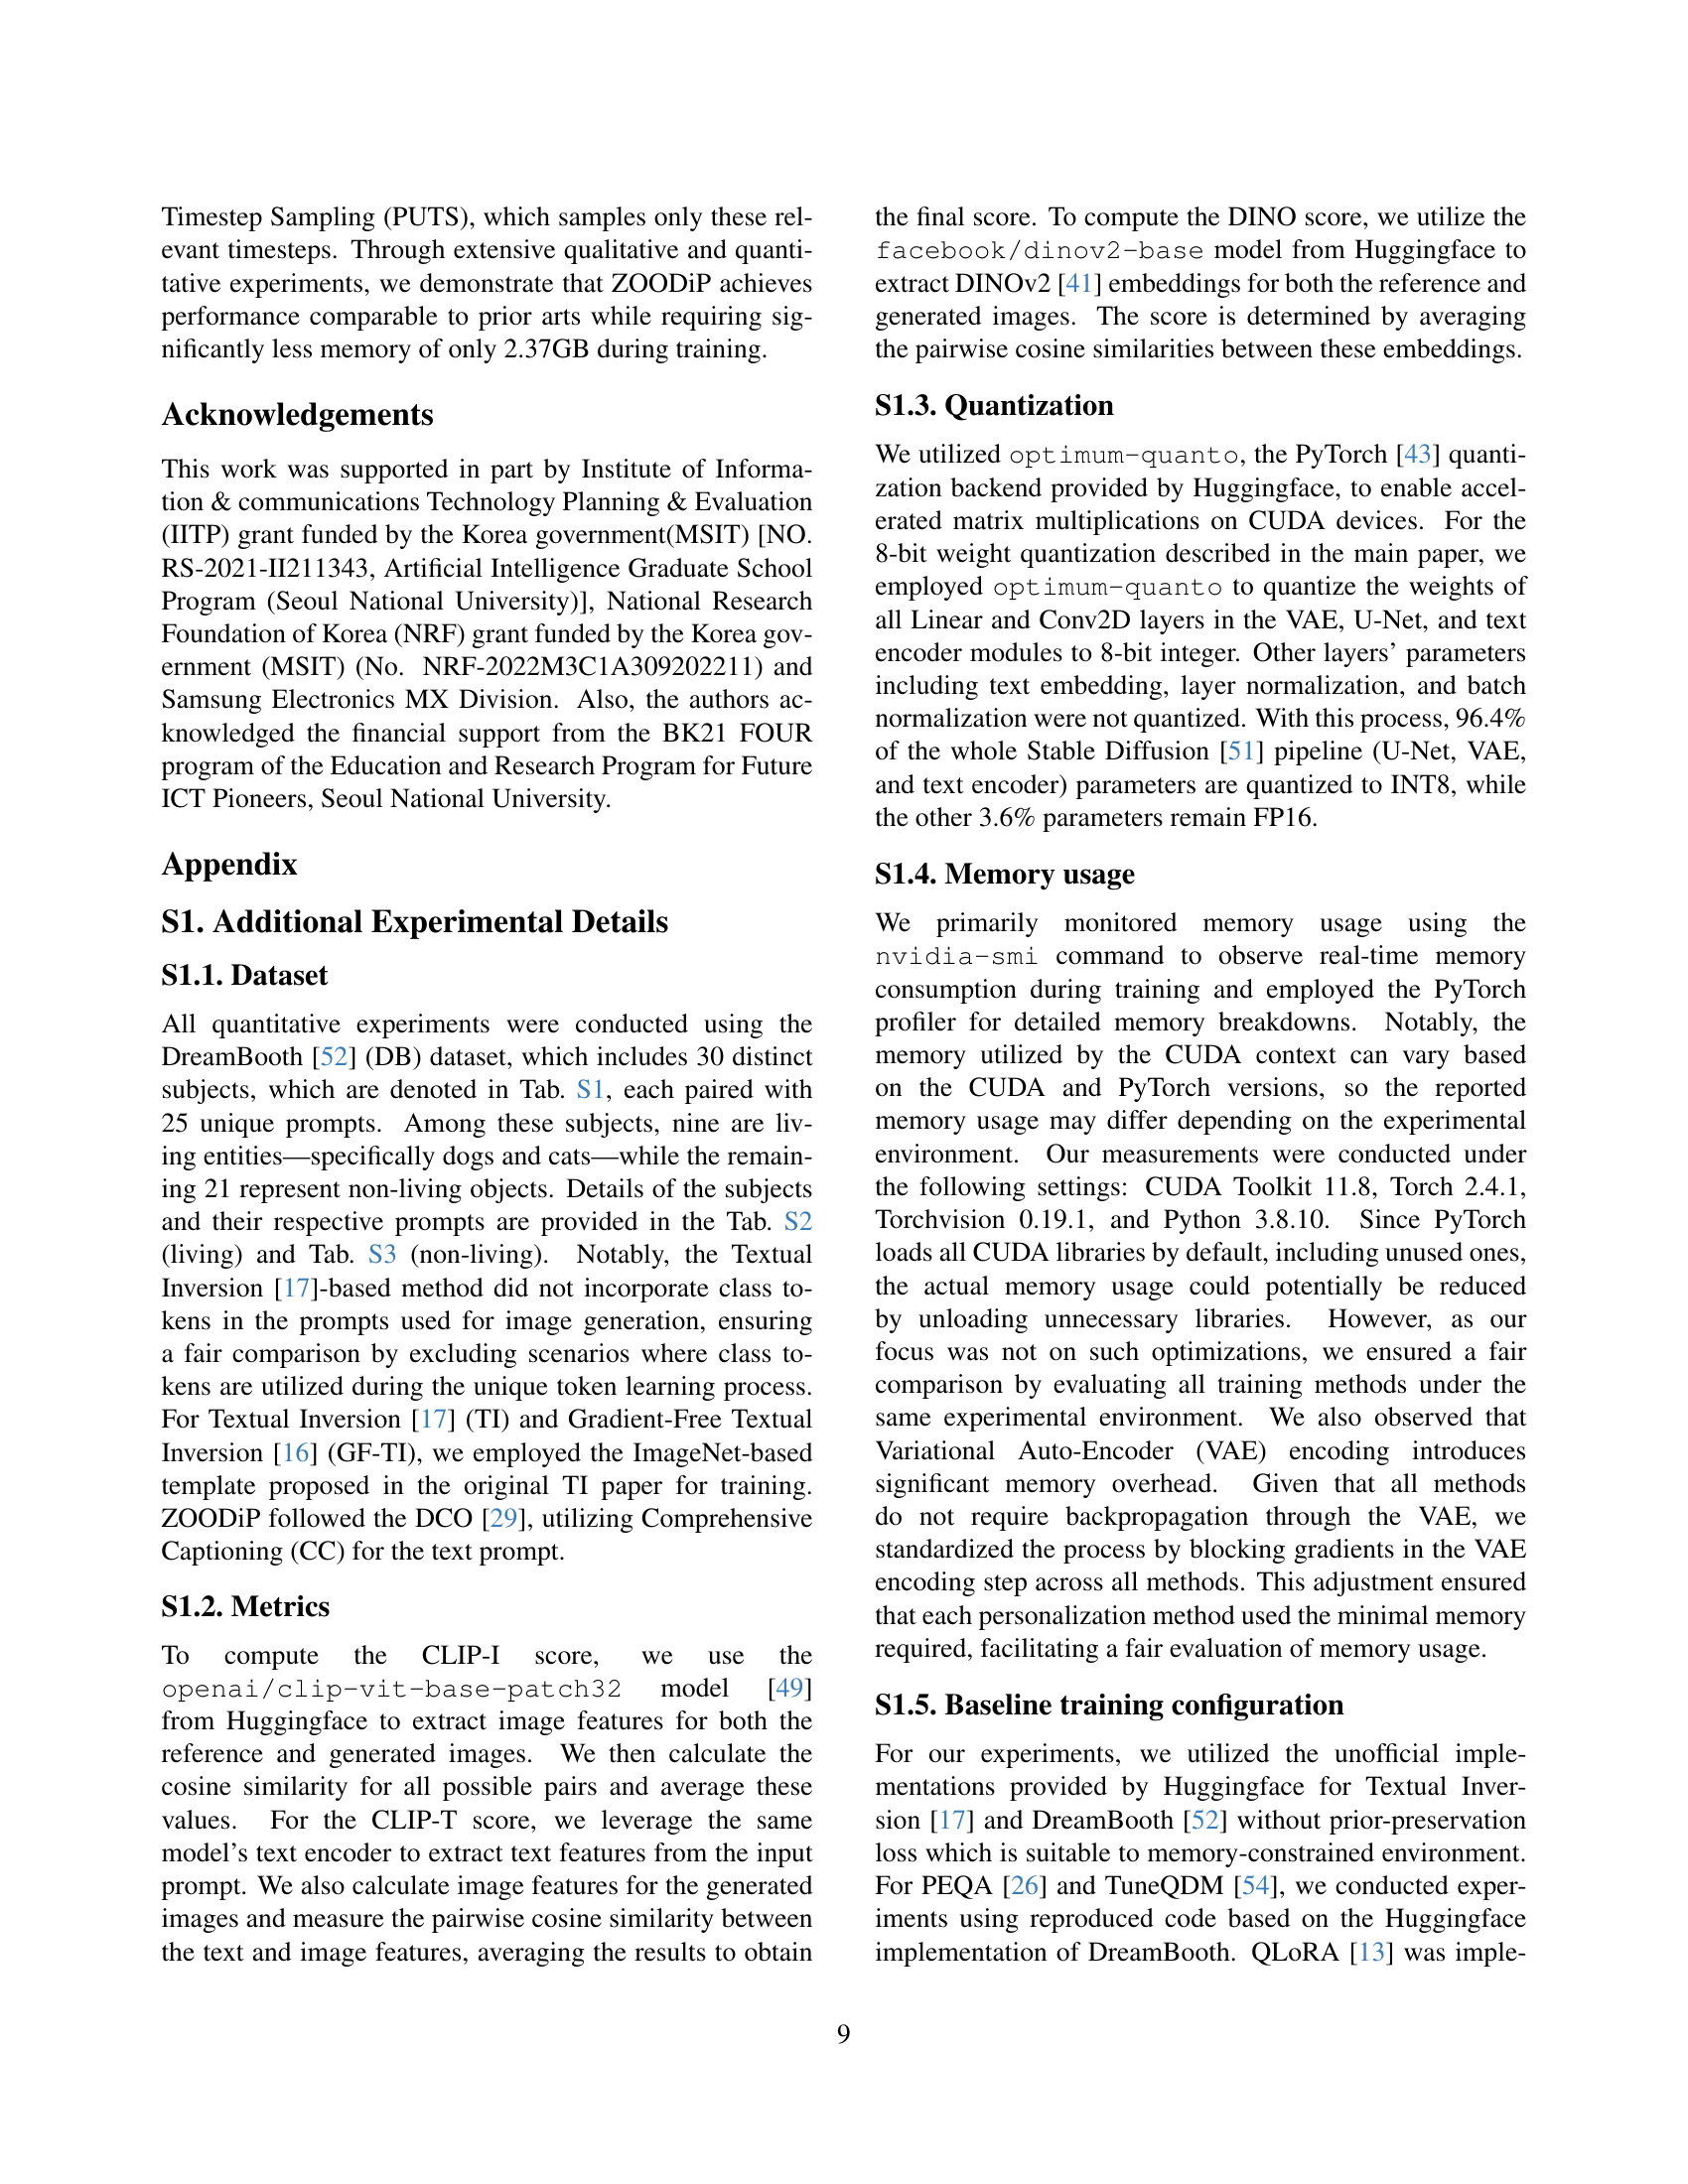
| Subjects in DreamBooth [52] dataset |
| backpack, backpack_dog, bear_plushie, berry_bowl, can, candle, cat, cat2, clock, colorful_sneaker, dog, dog2, dog3, dog5, dog6, dog7, dog8, duck_toy, fancy_boot, grey_sloth_plushie, monster_toy, pink_sunglasses, poop_emoji, rc_car, red_cartoon, robot_toy, shiny_sneaker, teapot, vase, wolf_plushie |
🔼 Table S1 lists all 30 subjects used in the DreamBooth dataset. The table provides the full names of the subjects, clarifying that the names used in the main paper are shortened versions of these longer subject names.
read the caption
Table S1: Full subjects name of DreamBooth dataset. The dataset names in the main paper are based on the corresponding subject datasets.
| Full prompt used in evaluation (living) | |
|---|---|
| 1 | ‘a {0} {1} in the jungle’.format(unique_token, class_token) |
| 2 | ‘a {0} {1} in the snow’.format(unique_token, class_token) |
| 3 | ‘a {0} {1} on the beach’.format(unique_token, class_token) |
| 4 | ‘a {0} {1} on a cobblestone street’.format(unique_token, class_token) |
| 5 | ‘a {0} {1} on top of pink fabric’.format(unique_token, class_token) |
| 6 | ‘a {0} {1} on top of a wooden floor’.format(unique_token, class_token) |
| 7 | ‘a {0} {1} with a city in the background’.format(unique_token, class_token) |
| 8 | ‘a {0} {1} with a mountain in the background’.format(unique_token, class_token) |
| 9 | ‘a {0} {1} with a blue house in the background’.format(unique_token, class_token) |
| 10 | ‘a {0} {1} on top of a purple rug in a forest’.format(unique_token, class_token) |
| 11 | ‘a {0} {1} wearing a red hat’.format(unique_token, class_token) |
| 12 | ‘a {0} {1} wearing a santa hat’.format(unique_token, class_token) |
| 13 | ‘a {0} {1} wearing a rainbow scarf’.format(unique_token, class_token) |
| 14 | ‘a {0} {1} wearing a black top hat and a monocle’.format(unique_token, class_token) |
| 15 | ‘a {0} {1} in a chef outfit’.format(unique_token, class_token) |
| 16 | ‘a {0} {1} in a firefighter outfit’.format(unique_token, class_token) |
| 17 | ‘a {0} {1} in a police outfit’.format(unique_token, class_token) |
| 18 | ‘a {0} {1} wearing pink glasses’.format(unique_token, class_token) |
| 19 | ‘a {0} {1} wearing a yellow shirt’.format(unique_token, class_token) |
| 20 | ‘a {0} {1} in a purple wizard outfit’.format(unique_token, class_token) |
| 21 | ‘a red {0} {1}’.format(unique_token, class_token) |
| 22 | ‘a purple {0} {1}’.format(unique_token, class_token) |
| 23 | ‘a shiny {0} {1}’.format(unique_token, class_token) |
| 24 | ‘a wet {0} {1}’.format(unique_token, class_token) |
| 25 | ‘a cube shaped {0} {1}’.format(unique_token, class_token) |
🔼 This table lists the prompts used to evaluate the personalization of living objects in the DreamBooth dataset. Each prompt contains a unique token representing the specific object to be personalized and a class token representing the object’s class. The table shows how varied prompts are used in evaluation and how the unique token is embedded within the prompt structure to facilitate personalized image generation.
read the caption
Table S2: Full prompts used in evaluation of living category objects. unique_token represents the special token corresponds to object which aims to personalize, and class_token denotes the class that unique_token is in.
| Full prompt used in evaluation (non-living) | |
|---|---|
| 1 | ‘a {0} {1} in the jungle’.format(unique_token, class_token) |
| 2 | ‘a {0} {1} in the snow’.format(unique_token, class_token) |
| 3 | ‘a {0} {1} on the beach’.format(unique_token, class_token) |
| 4 | ‘a {0} {1} on a cobblestone street’.format(unique_token, class_token) |
| 5 | ‘a {0} {1} on top of pink fabric’.format(unique_token, class_token) |
| 6 | ‘a {0} {1} on top of a wooden floor’.format(unique_token, class_token) |
| 7 | ‘a {0} {1} with a city in the background’.format(unique_token, class_token) |
| 8 | ‘a {0} {1} with a mountain in the background’.format(unique_token, class_token) |
| 9 | ‘a {0} {1} with a blue house in the background’.format(unique_token, class_token) |
| 10 | ‘a {0} {1} on top of a purple rug in a forest’.format(unique_token, class_token) |
| 11 | ‘a {0} {1} with a wheat field in the background’.format(unique_token, class_token) |
| 12 | ‘a {0} {1} with a tree and autumn leaves in the background’.format(unique_token, class_token) |
| 13 | ‘a {0} {1} with the Eiffel Tower in the background’.format(unique_token, class_token) |
| 14 | ‘a {0} {1} floating on top of water.format(unique_token, class_token) |
| 15 | ‘a {0} {1} floating in an ocean of milk’.format(unique_token, class_token) |
| 16 | ‘a {0} {1} on top of green grass with sunflowers around it’.format(unique_token, class_token) |
| 17 | ‘a {0} {1} on top of a mirror’.format(unique_token, class_token) |
| 18 | ‘a {0} {1} on top of the sidewalk in a crowded street’.format(unique_token, class_token) |
| 19 | ‘a {0} {1} on top of a dirt road’.format(unique_token, class_token) |
| 20 | ‘a {0} {1} on top of a white rug’.format(unique_token, class_token) |
| 21 | ‘a red {0} {1}’.format(unique_token, class_token) |
| 22 | ‘a purple {0} {1}’.format(unique_token, class_token) |
| 23 | ‘a shiny {0} {1}’.format(unique_token, class_token) |
| 24 | ‘a wet {0} {1}’.format(unique_token, class_token) |
| 25 | ‘a cube shaped {0} {1}’.format(unique_token, class_token) |
🔼 Table S3 shows the prompts used to evaluate the personalization of non-living objects in the DreamBooth dataset. Each prompt includes a unique token that represents the specific object to be personalized and a class token representing the category of the object. The table aids in understanding how different textual descriptions are used to assess the personalization capabilities of the model, focusing on non-living objects.
read the caption
Table S3: Full prompts used in evaluation of non-living category objects. unique_token represents the special token corresponds to object which aims to personalize, and class_token denotes the class that unique_token is in.
| Method | CLIP-T | CLIP-I | DINO |
|---|---|---|---|
| RGE | 0.266 | 0.759 | 0.569 |
| SPSA | 0.277 | 0.732 | 0.506 |
| One-point | 0.296 | 0.703 | 0.393 |
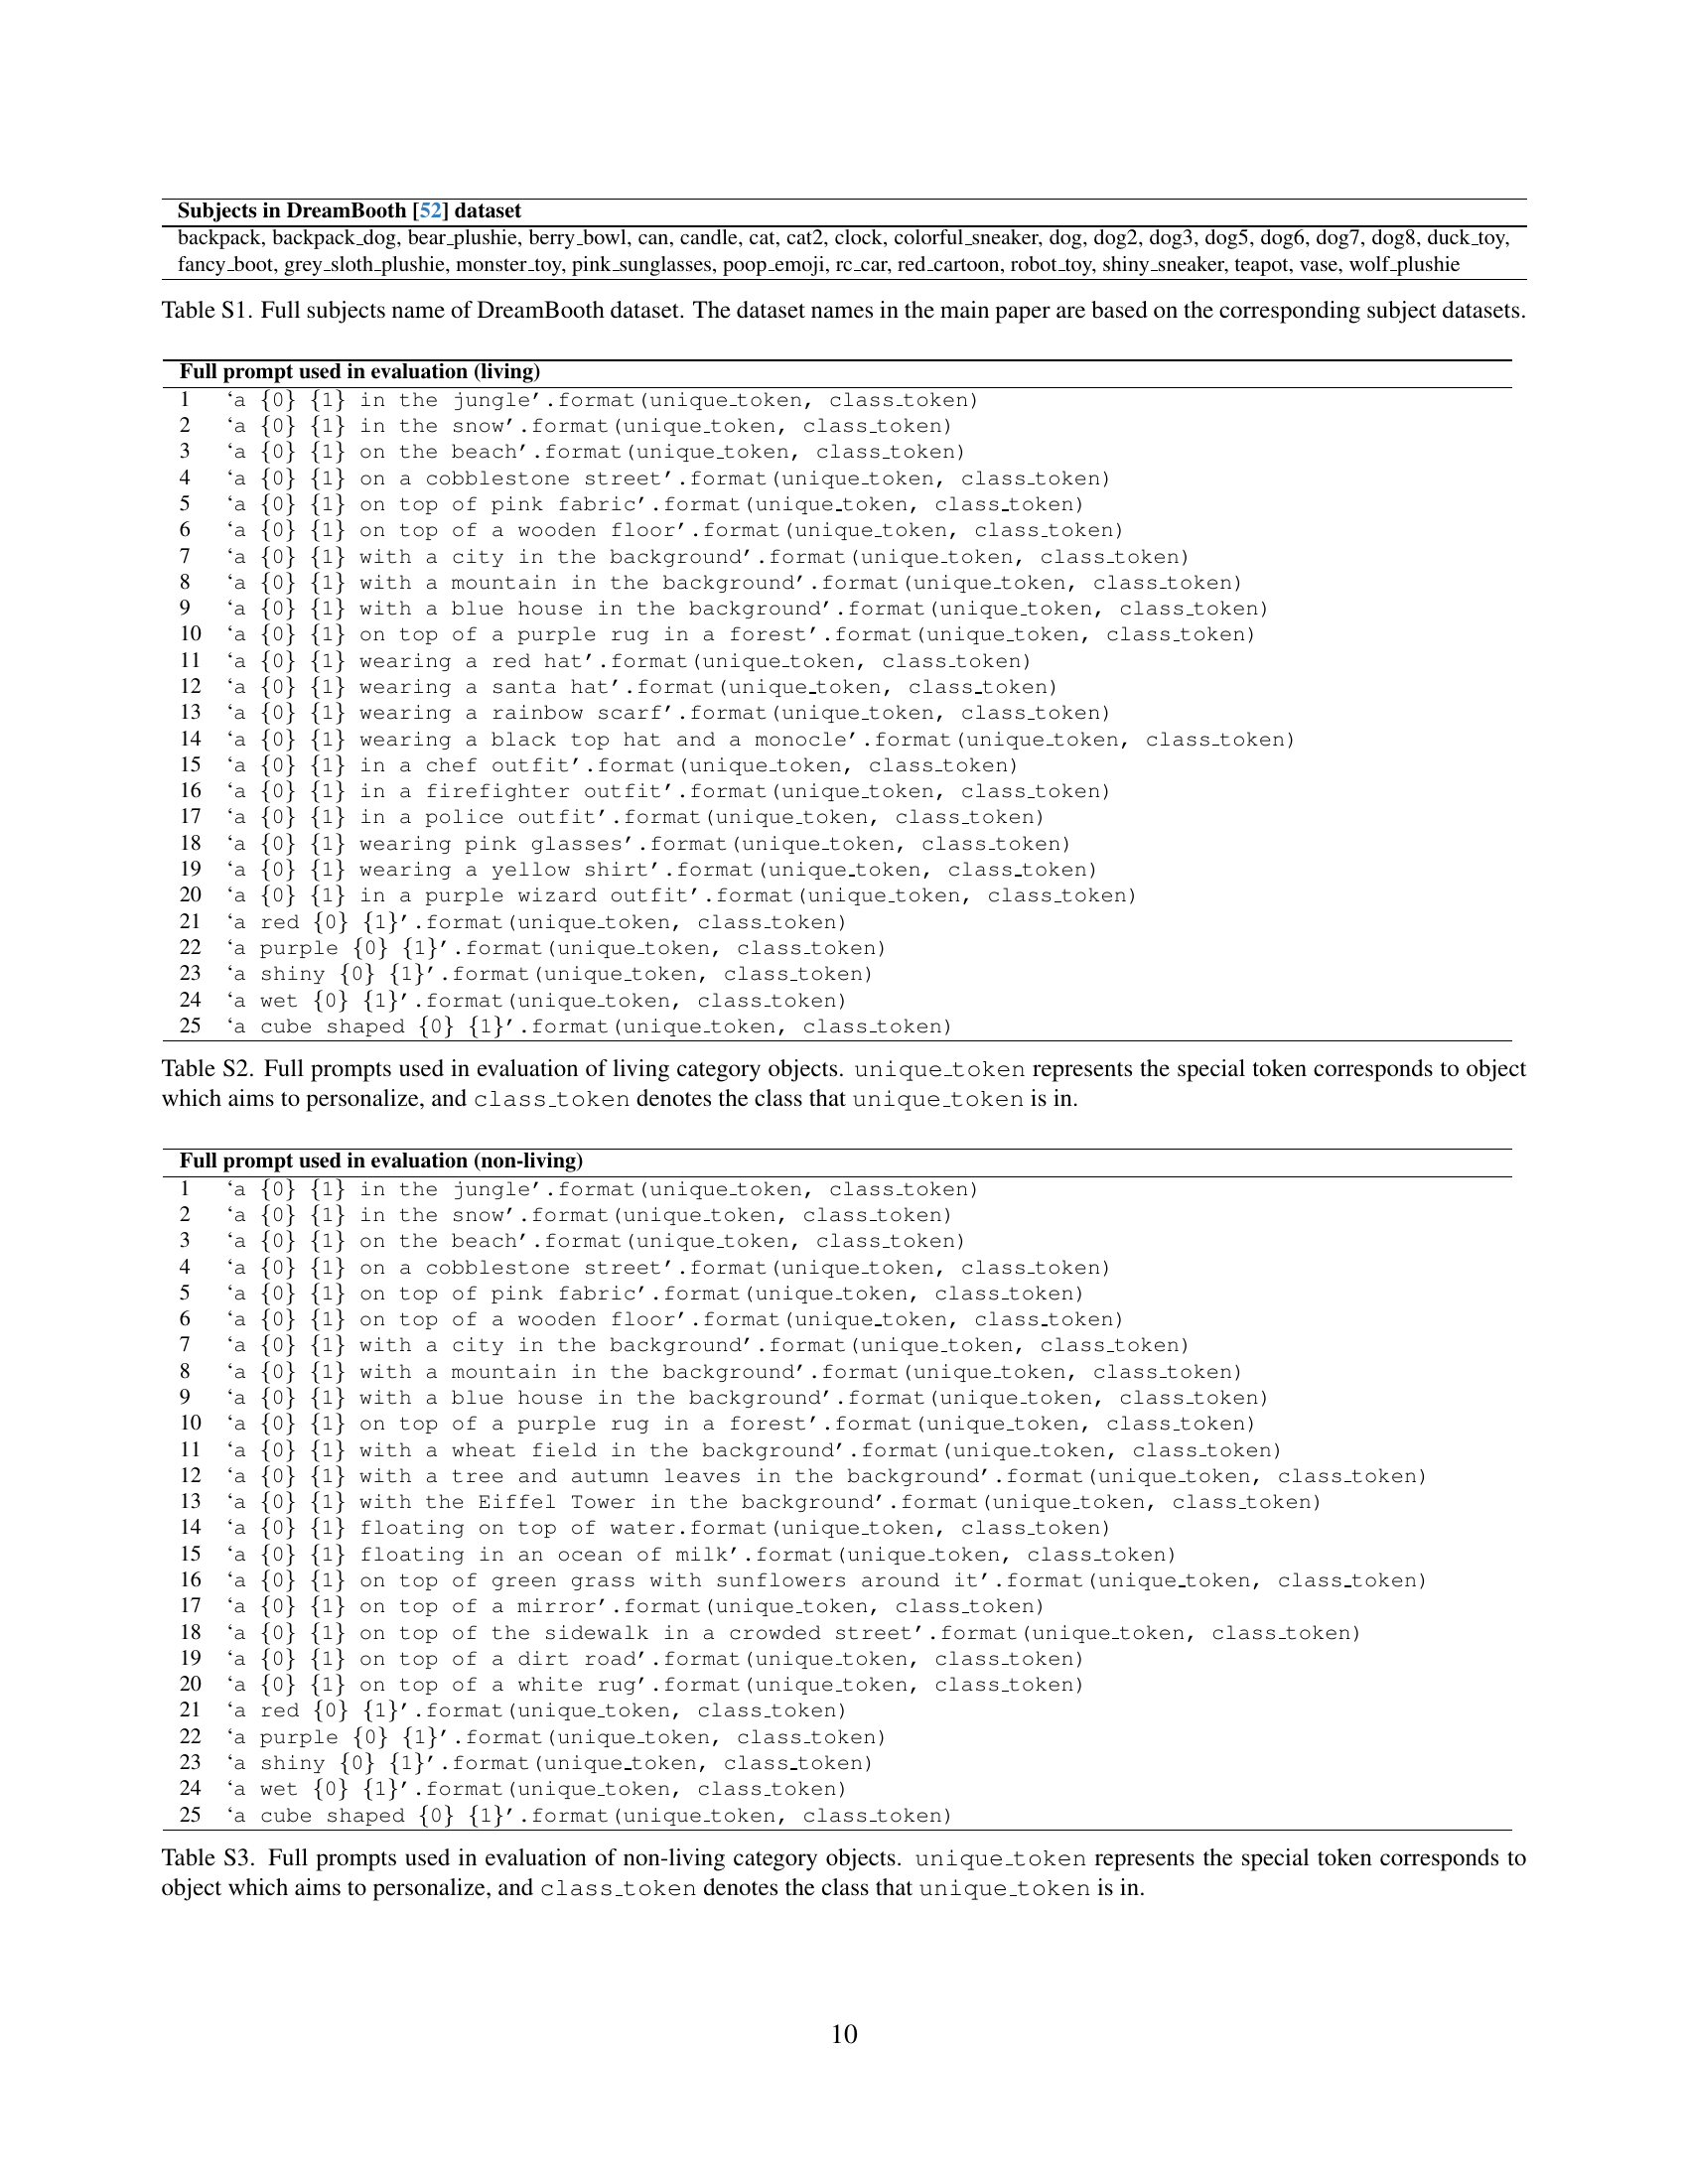
🔼 Table S4 details a comparison of different gradient estimation methods used in the personalization process of a diffusion model. Three methods are compared: Random Gradient Estimation (RGE), Simultaneous Perturbation Stochastic Approximation (SPSA), and a one-point estimation method. The comparison focuses on personalization performance (CLIP-T, CLIP-I, DINO scores) and computational efficiency (forward passes). The results show that RGE outperforms the other two methods in both performance and efficiency, especially when using more than one perturbation direction (n > 1). Due to its superior performance and efficiency, RGE was selected as the gradient estimation method for ZOODiP.
read the caption
Table S4: Personalization performance across different gradient estimation methods with n=2𝑛2n=2italic_n = 2. The results show that RGE outperforms other two different gradient estimations methods. Notably, RGE is more efficient in terms of computational cost, requiring fewer forward passes than SPSA when n>1𝑛1n>1italic_n > 1. Due to this efficiency and performance advantages, we adopted RGE as the gradient estimation method in ZOODiP.
| CLIP-T | CLIP-I | DINO | |
|---|---|---|---|
| 0.281 | 0.778 | 0.599 | |
| 0.277 | 0.797 | 0.613 | |
| 0.296 | 0.724 | 0.470 |
🔼 This table presents the results of experiments conducted to find the optimal perturbation size (μ) for the ZOODiP method. The experiments varied the value of μ and measured the performance using three metrics: CLIP-T, CLIP-I, and DINO. The results show that μ = 10⁻³ achieved the best performance, and this value was used in the final ZOODiP implementation.
read the caption
Table S5: Quantitative results for different μ𝜇\muitalic_μ values. Optimal performance is observed at μ=10−3𝜇superscript103\mu=10^{-3}italic_μ = 10 start_POSTSUPERSCRIPT - 3 end_POSTSUPERSCRIPT with varying μ𝜇\muitalic_μ, and we have set the value of μ𝜇\muitalic_μ accordingly for ZOODiP.
| CLIP-T | CLIP-I | DINO | Speed (iter/s) | |
|---|---|---|---|---|
| 1 | 0.298 | 0.736 | 0.495 | 20.7 |
| 2 | 0.277 | 0.796 | 0.613 | 16.1 |
| 4 | 0.282 | 0.784 | 0.584 | 9.78 |
| 8 | 0.282 | 0.798 | 0.627 | 6.20 |
🔼 This table presents a quantitative analysis of the impact of varying the number of gradient estimations (n) on the performance of the ZOODiP model. Different values of n were tested, and the results (CLIP-T, CLIP-I, DINO scores, and iteration speed) are shown to evaluate the trade-off between model performance and computational efficiency. The findings suggest that n=2 provides a good balance, offering strong performance with reasonable computational cost.
read the caption
Table S6: Quantitative results for various n𝑛nitalic_n, the number of gradient estimations. n=2𝑛2n=2italic_n = 2 is the promising choice between performance and computation efficiency.
| Method | PUTS | CLIP-T | CLIP-I | DINO |
|---|---|---|---|---|
| DB | ✗ | 0.266 | 0.853 | 0.751 |
| ✓ | 0.272 | 0.854 | 0.758 | |
| TI | ✗ | 0.241 | 0.798 | 0.584 |
| ✓ | 0.247 | 0.825 | 0.661 |
🔼 Table S7 presents a quantitative comparison of the performance improvements achieved by incorporating Partial Uniform Timestep Sampling (PUTS) into two gradient-based personalization methods: DreamBooth and Textual Inversion. The results demonstrate that PUTS enhances the performance of both methods, with a maximum improvement of 13.2%. Notably, the improvement is more substantial for Textual Inversion, highlighting the significant effect of PUTS on methods that are strongly influenced by the text encoder, such as Textual Inversion.
read the caption
Table S7: Quantitative results from applying PUTS to DreamBooth and Textual Inversion. The results confirm that PUTS enhances the performance of gradient-based personalization methods by up to 13.2%. The improvement was particularly pronounced in Textual Inversion, which is highly influenced by the text encoder, highlighting the significant impact of PUTS in this context.
| U-Net Precision | CLIP-T | CLIP-I | DINO |
|---|---|---|---|
| INT8 | 0.288 | 0.834 | 0.657 |
| INT4 | 0.212 | 0.835 | 0.647 |
🔼 This table presents a comparison of the performance of Stable Diffusion’s U-Net model using two different levels of precision: INT8 (8-bit integer) and INT4 (4-bit integer). The comparison focuses on a specific subset of the DreamBooth dataset, featuring images of a dog (indicated by
<dog6>). The metrics used to evaluate performance are CLIP-T (text-image alignment), CLIP-I (image alignment), and DINO (image alignment), providing a comprehensive assessment of how the different precision levels impact the model’s ability to generate images that align with both textual and visual references. This allows for an understanding of the trade-off between model accuracy and memory efficiency as the precision level decreases.read the caption
Table S8: The performance comparison between INT8 and INT4 for U-Net precision on thesubset of the DB dataset.
| Method | |
|---|---|
| DB | 0.825 |
| QLoRA | 0.731 |
| PEQA | 0.806 |
| TuneQDM | 0.778 |
| TI | 0.679 |
| GF-TI | 0.150 |
| ZOODiP (Ours) | 0.671 |
🔼 This table compares the diversity of images generated by different personalization methods using the DINOinter score. A lower DINOinter score indicates higher diversity. The results show that Textual Inversion (TI)-based methods produce more diverse images compared to DreamBooth (DB)-based methods. This difference in diversity is consistent across various subjects within the DreamBooth dataset, highlighting a fundamental distinction in the ability of these methods to capture and represent variations in image generation.
read the caption
Table S9: Comparison of DINOintersubscriptDINOinter\text{DINO}_{\text{inter}}DINO start_POSTSUBSCRIPT inter end_POSTSUBSCRIPT scores across various personalization methods. The results indicate that TI-based methods are capable of generating a diverse range of images, whereas DB-based methods exhibit relatively lower diversity. This observation was consistent across all subjects in the DreamBooth (DB) dataset, highlighting a fundamental difference in the ability of these methods to capture and reflect variations in the generated outputs.
| Base. | Method | Time (min) |
|---|---|---|
| DB | DB | 2 |
| QLoRA | 1.1 | |
| PEQA | 1.5 | |
| TuneQDM | 1.4 | |
| TI | TI | 8.8 |
| GF-TI | 293 | |
| ZOODiP () | 31 |
🔼 This table compares the training time of different personalization methods for diffusion models. It shows a trade-off between memory usage and training speed. DreamBooth (DB)-based methods, while consuming more memory, exhibit faster training times. Conversely, Textual Inversion (TI)-based methods are more memory-efficient but require a greater number of training iterations, resulting in longer overall training time.
read the caption
Table S10: Total training time with the configurations in Sec S1.5. DB-based methods consume more memory but train faster, while TI-based methods are more memory-efficient but require more iterations.
Full paper#