TL;DR#
Large Language Models (LLMs) have shown promise, but often struggle in specialized domains like cybersecurity due to limited domain-specific data. This creates a need for domain adaptation techniques, especially considering privacy and real-time monitoring requirements. Existing synthetic data generation methods often fall short in extracting and preserving critical domain knowledge, hindering their effectiveness.
To tackle this, the authors propose a new framework that generates high-quality synthetic training data for specialized domains, called ELTEX. This framework systematically integrates explicit domain indicator extraction with dynamic prompting, thus preserving critical domain nuances during data generation. The authors demonstrate its effectiveness in the context of blockchain-related cyberattack detection, showing that it can enable smaller models to achieve performance competitive with much larger models. A new synthetic dataset is also released to help spur further research.
Key Takeaways#
Why does it matter?#
This paper is important because it addresses the critical need for high-quality training data in specialized cybersecurity domains. By introducing a novel framework for synthetic data generation, it empowers researchers to develop resource-efficient models that can compete with larger architectures. This offers practical advantages for real-time monitoring and privacy-preserving applications, while paving the way for future work in adapting the framework to diverse domains.
Visual Insights#

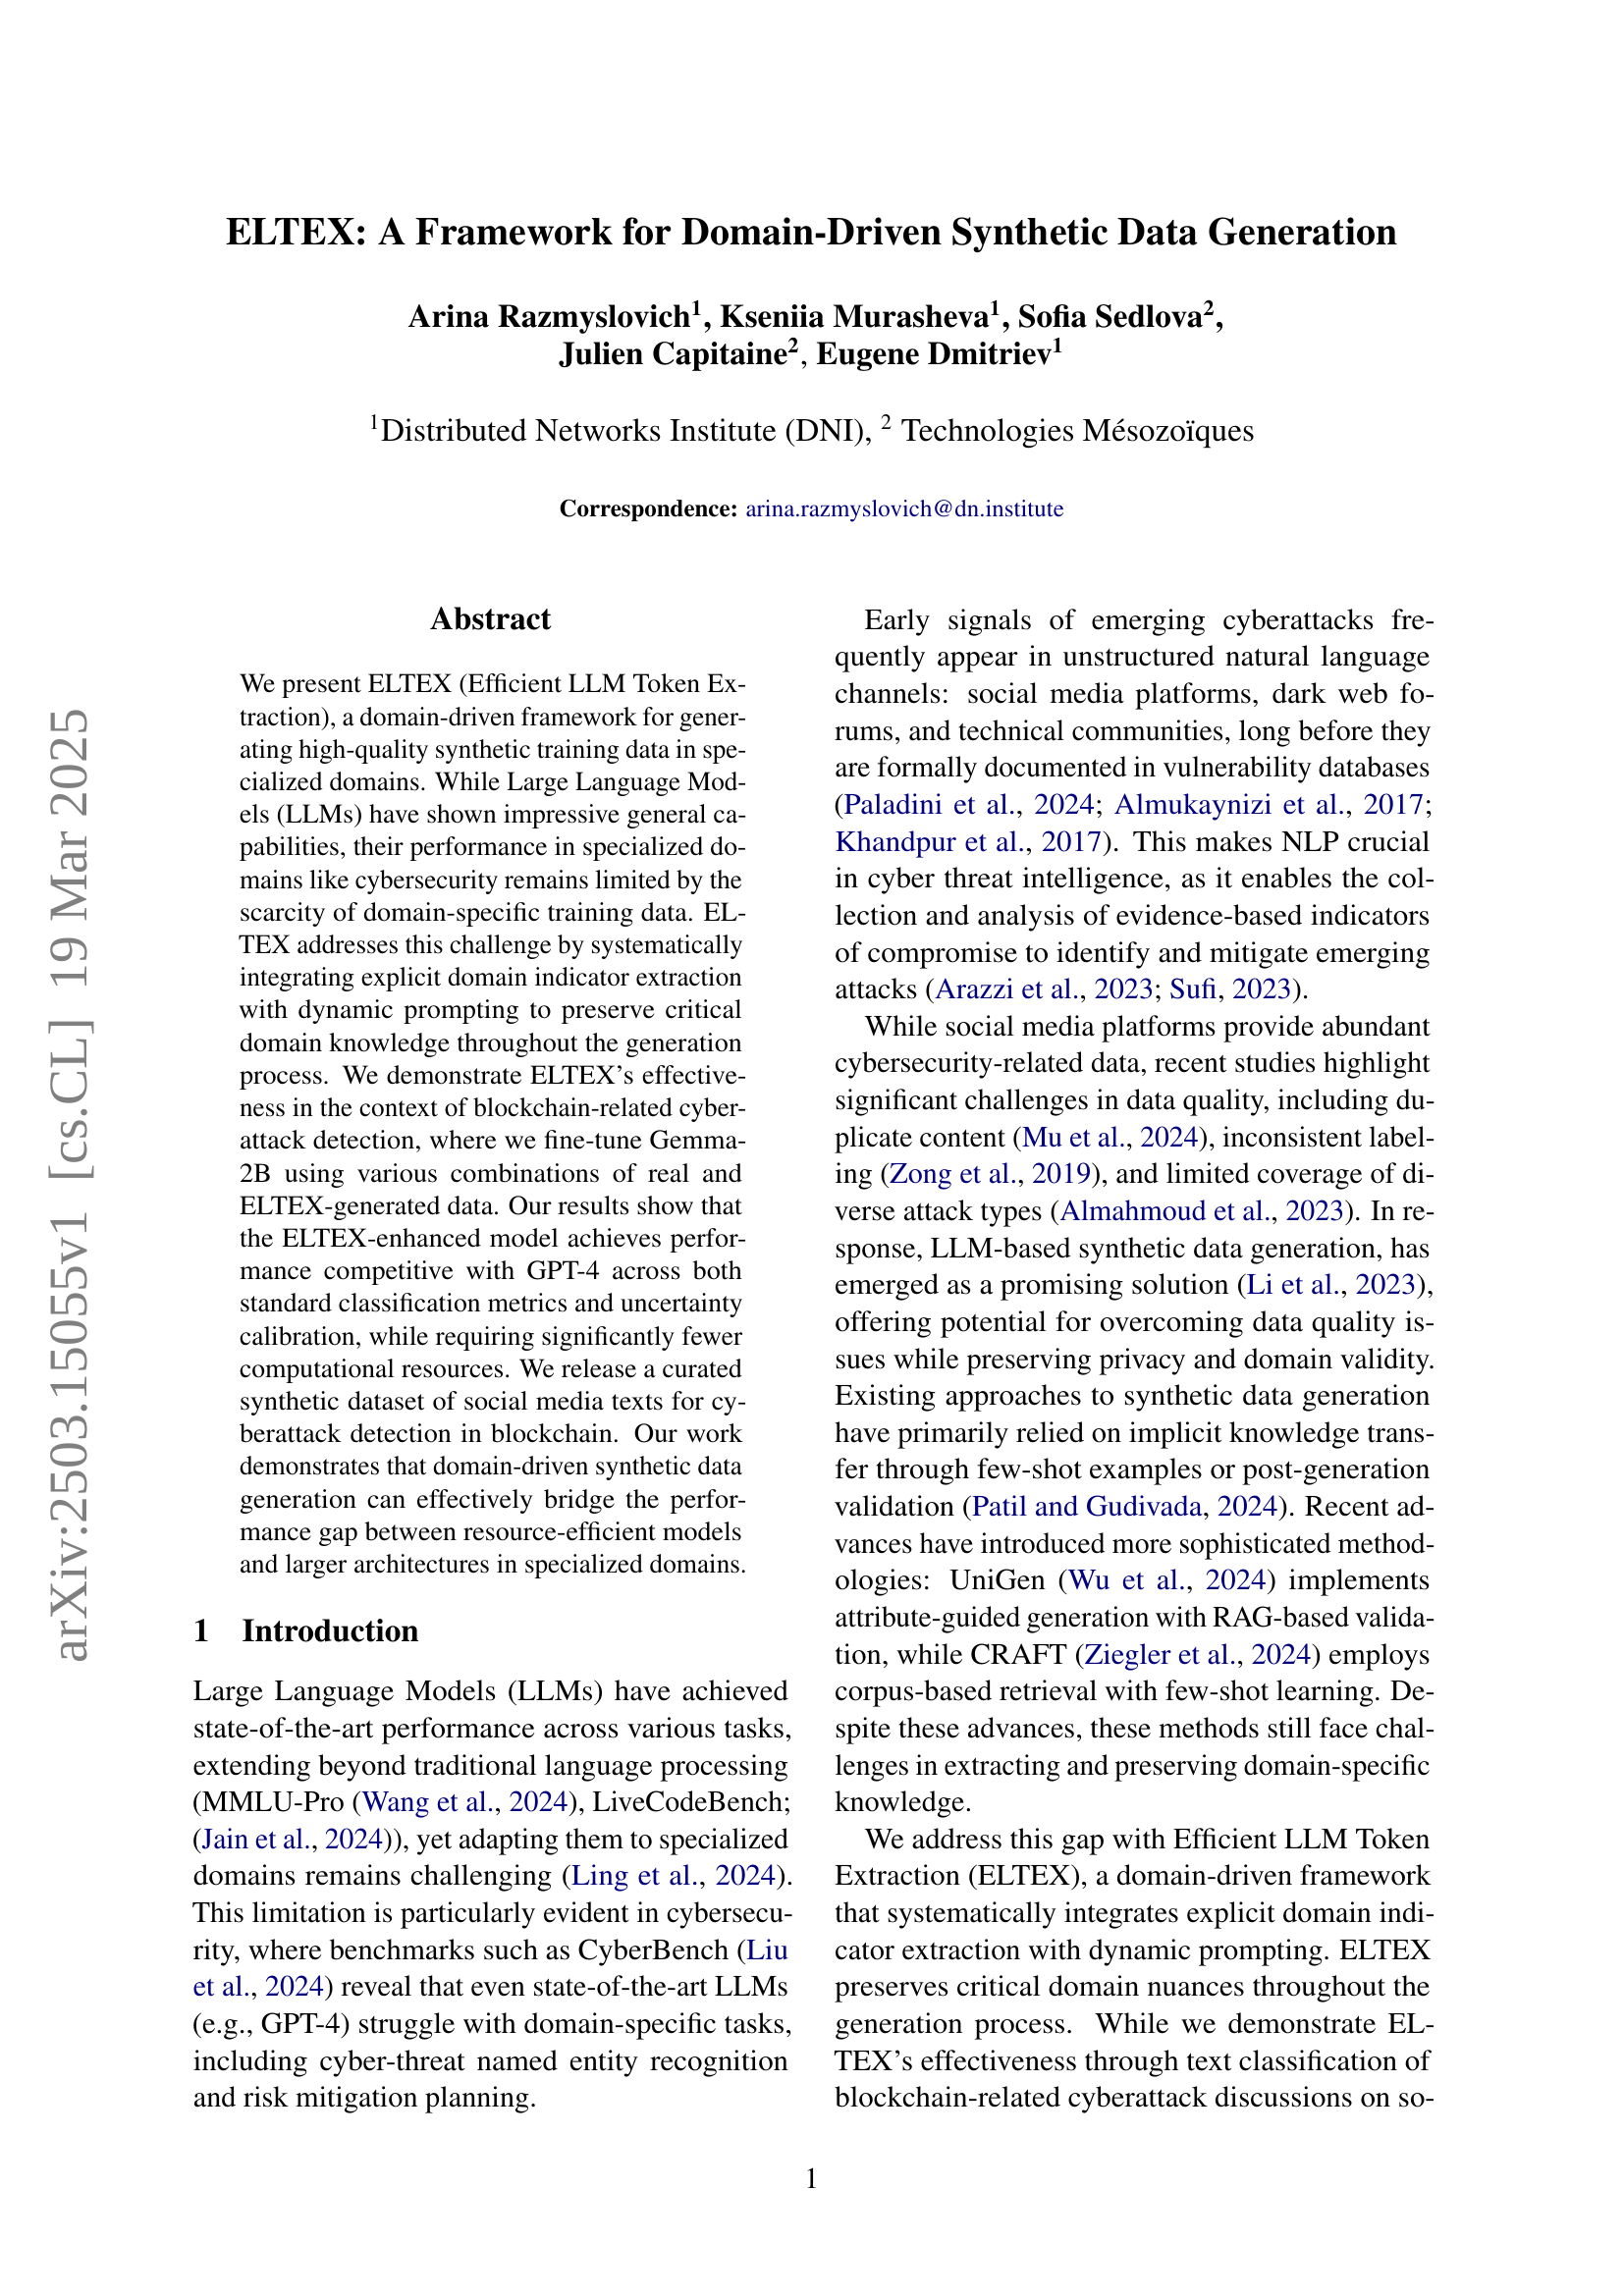
🔼 The ELTEX pipeline systematically integrates explicit domain indicator extraction with dynamic prompting to generate high-fidelity synthetic data. It consists of five main components: (1) sample data collection and deduplication, (2) token extraction prompt construction, (3) synthetic data generation, (4) final deduplication, and (5) post-generation quality assurance (QA). Each stage is designed to maintain the quality and diversity of the generated data while preserving critical domain nuances.
read the caption
Figure 1: Efficient LLM Token Extraction Pipeline
| Dataset | Cyberattack | General | Total |
|---|---|---|---|
| Real (Initial) | 1,078 | 688 | 1,766 |
| Real (Dedup) | 951 | 652 | 1,603 |
| Synthetic (Initial)* | 9,510 | 6,520 | 16,030 |
| Synthetic (Dedup) | 6,941 | 4,524 | 11,465 |
| Synthetic (Final) | 6,941 | 4,507 | 11,448 |
🔼 This table presents a quantitative overview of the dataset transformations throughout the ELTEX pipeline. It shows the number of samples at each stage: Initially, 1,766 real samples were collected and deduplicated, resulting in 1,603 remaining samples. The LLM then generated 16,030 synthetic samples (initial count is an approximation due to the inherent randomness of LLMs). After deduplication, 11,465 synthetic samples remained. Finally, a post-generation QA step further refined this, reducing the final synthetic dataset to 11,448 samples.
read the caption
Table 1: Datasets statistics throughout the pipeline. *Initial synthetic count is approximate due to the stochastic nature of LLM generation.
In-depth insights#
ELTEX: Nuanced Data#
ELTEX framework’s ability to generate nuanced data hinges on its design. It systematically integrates explicit domain knowledge with dynamic prompting. This process preserves critical domain nuances during generation, leading to high-fidelity, context-grounded synthetic data. By extracting and incorporating domain indicators, ELTEX ensures the generated data reflects subtle patterns and terminology specific to the domain. This approach allows the framework to capture the complexities that might be missed by LLMs relying solely on implicit knowledge transfer or post-generation validation.
Domain-Driven LLM#
Domain-Driven LLMs represent a paradigm shift, moving beyond general-purpose models. They emphasize specialized knowledge integration for enhanced performance in niche areas. This involves curated datasets, domain-specific architectures, and focused training. By tailoring models to particular fields, we can overcome limitations of generic LLMs, achieving higher accuracy and efficiency. This approach requires careful consideration of data scarcity, knowledge representation, and evaluation metrics to ensure robustness and relevance. ELTEX in this research paper provides valuable insights on this approach.
Hybrid Data Boost#
Hybrid Data Boost likely refers to enhancing model performance by combining real and synthetic data. This approach leverages the strengths of both: real data provides genuine patterns, while synthetic data, generated via methods such as LLMs, can augment datasets, addressing scarcity and bias. This strategy aims for improved generalization, filling gaps and balancing representations for robust performance. The method offers a way to bridge between actual and simulated data, boosting efficiency.
Synth Data Pipeline#
Synthetic data pipelines offer a promising avenue for augmenting limited datasets, especially in specialized domains. The key is balancing diversity and fidelity, ensuring the generated data reflects real-world nuances. A well-designed pipeline incorporates domain expertise through explicit indicator extraction and dynamic prompting, preserving critical knowledge. The pipeline involves stages like data collection, prompt construction, synthetic data generation, deduplication, and quality assurance. Moreover, considerations like balancing diversity and utility remain crucial throughout the generation process. A meticulous balance between task-specific details and broad coverage becomes essential for downstream model generalization.
Small Model Gains#
When we talk about small model gains, we are essentially referring to the improvements in performance or efficiency that can be achieved by using smaller, more compact machine learning models. This is particularly relevant in scenarios where computational resources are limited, such as in mobile devices or edge computing environments. Small models often require less memory, have faster inference times, and consume less power compared to their larger counterparts. The gains could arise from various optimization techniques. They could stem from model compression, quantization, or the use of more efficient architectures. While larger models might offer higher accuracy, the trade-offs in terms of resource utilization often make small models a more practical choice. They are easier to deploy and can still achieve near state-of-the-art.
More visual insights#
More on figures

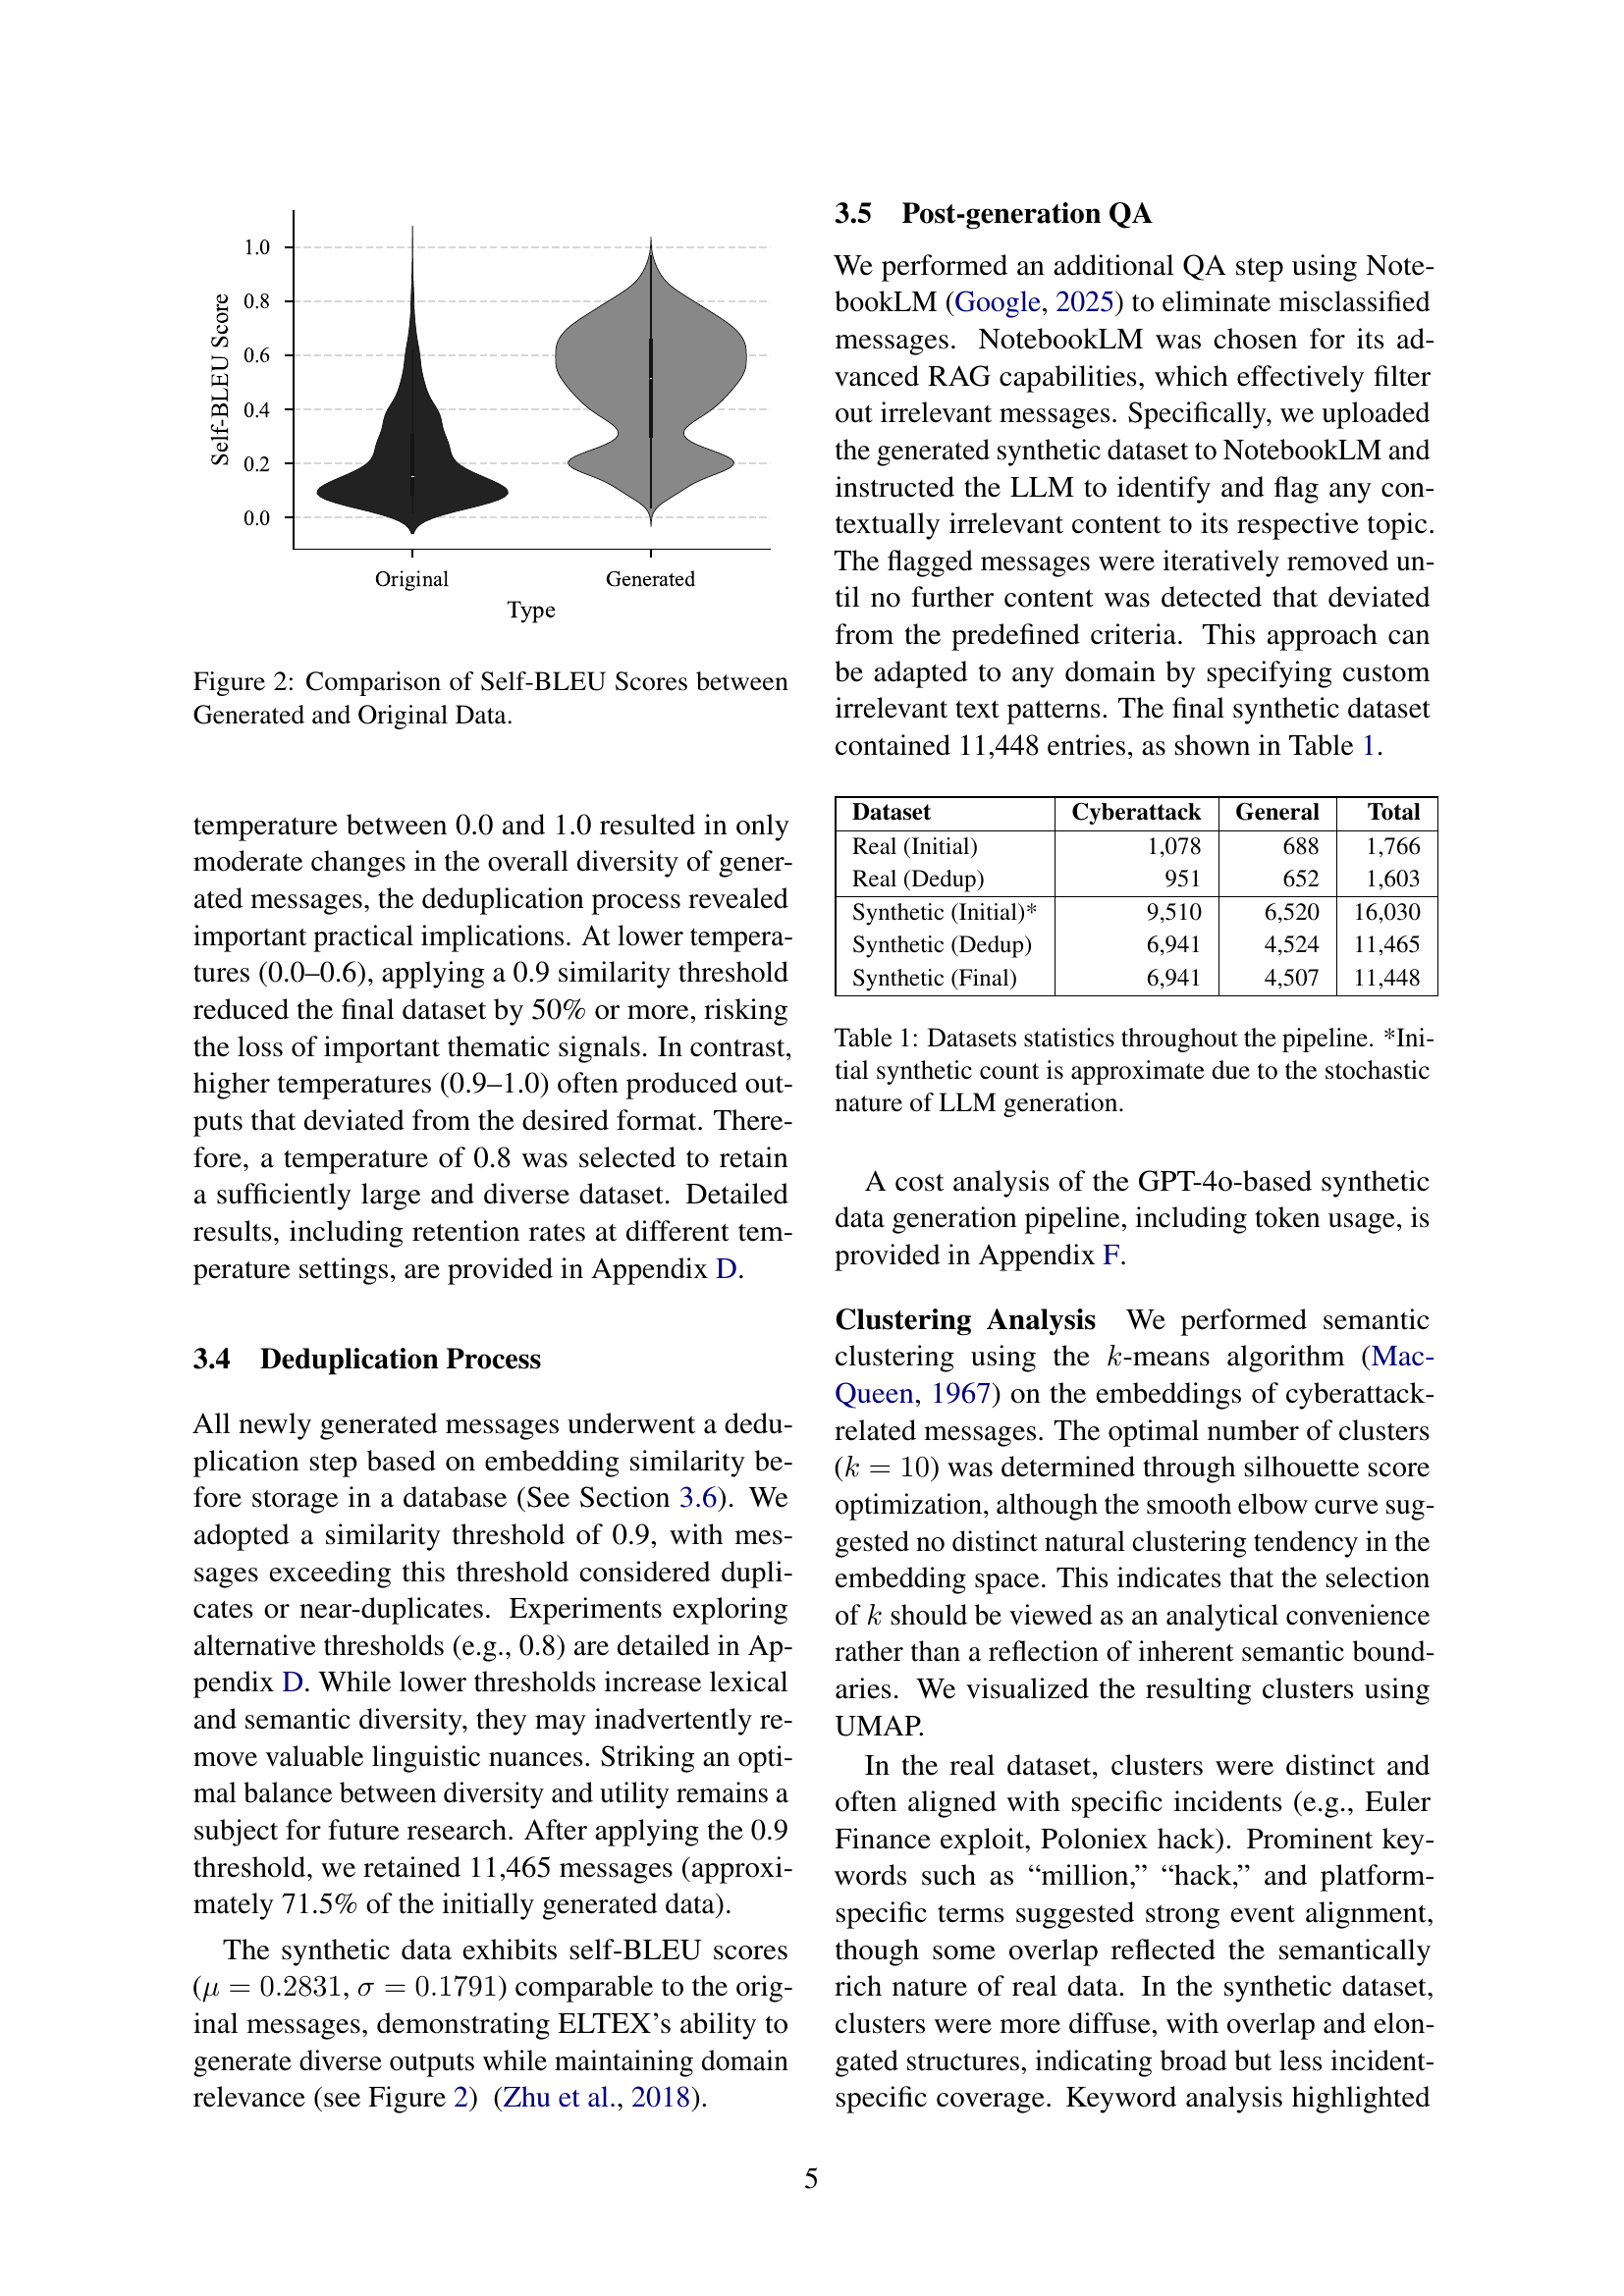
🔼 The figure shows a comparison of Self-BLEU scores for generated and original datasets. Self-BLEU is a metric measuring the similarity of generated text to itself; higher scores suggest higher coherence and quality in the generated data. The violin plot visualizes the distribution of Self-BLEU scores, allowing a comparison of the central tendency and the variability of the scores for both the generated (synthetic) and original (real) data. This helps to assess the quality of the synthetic data generated by the ELTEX framework. The comparison is crucial to understanding if the synthetic data retains similar linguistic characteristics to the original data.
read the caption
Figure 2: Comparison of Self-BLEU Scores between Generated and Original Data.

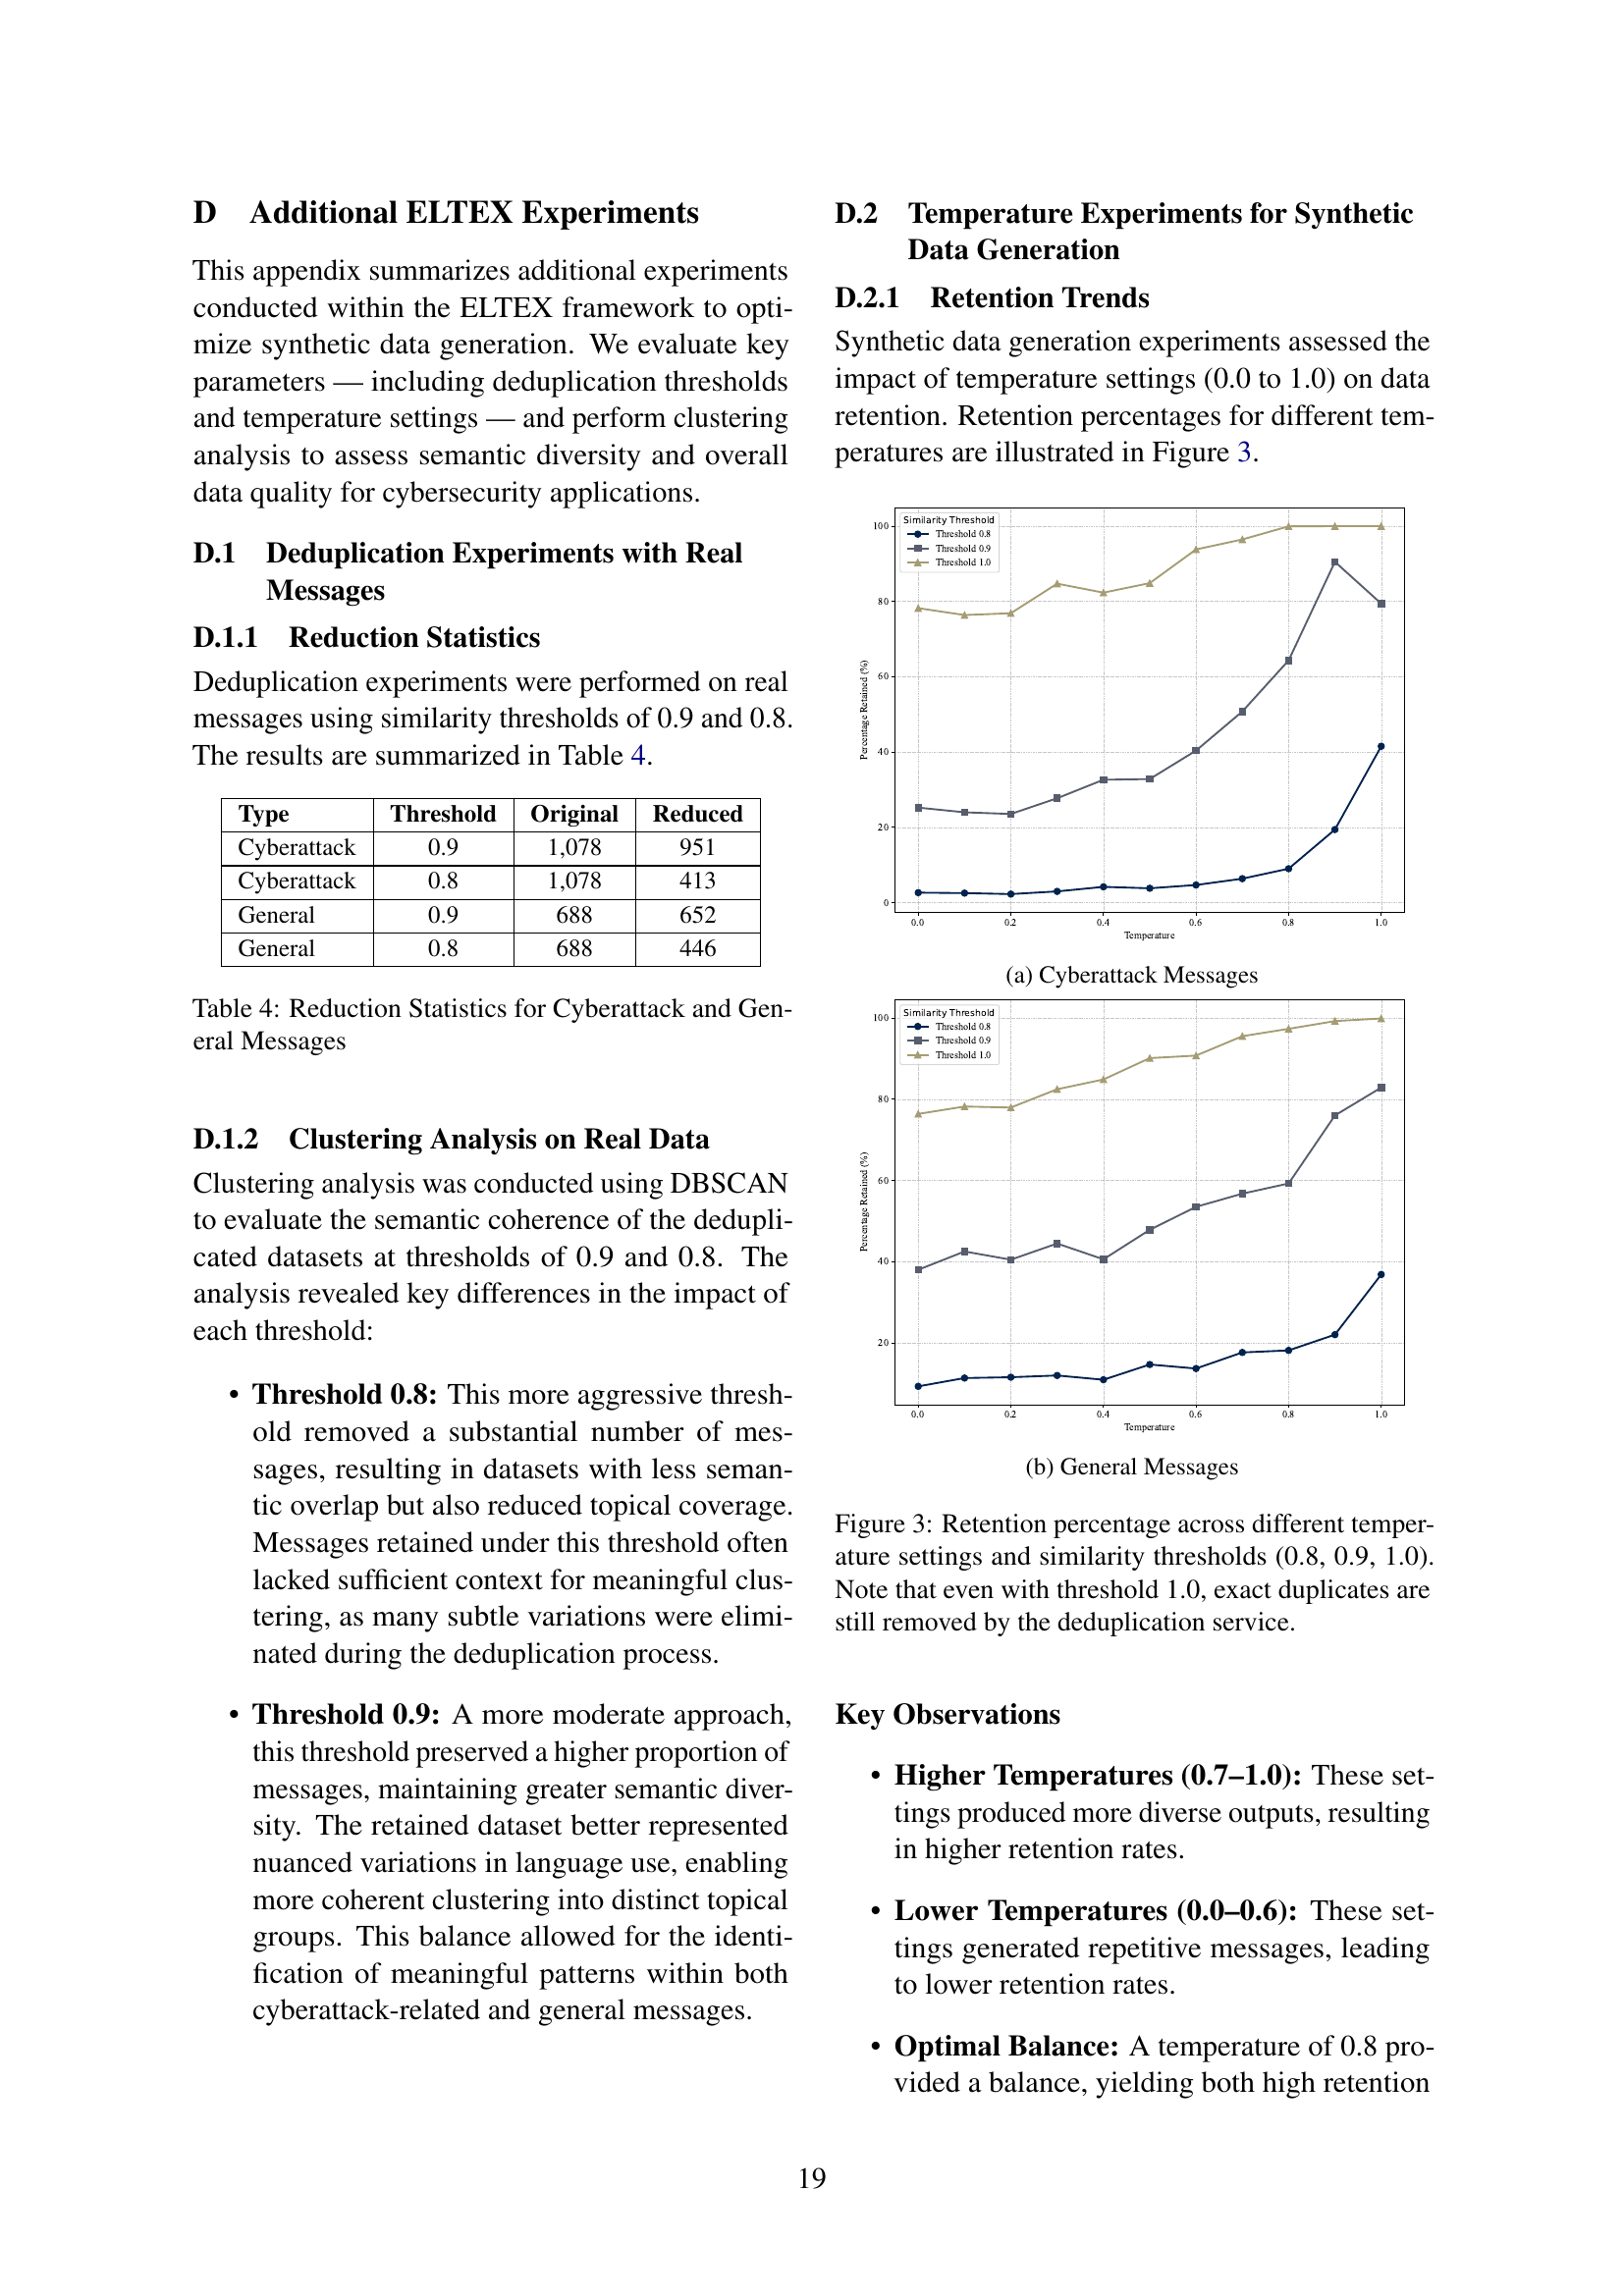
🔼 The figure shows the retention rate of cyberattack-related messages generated using different temperature settings during synthetic data generation. The x-axis represents the temperature values, ranging from 0.0 to 1.0, and the y-axis indicates the percentage of messages retained after the deduplication process. Different lines represent the retention rates achieved with different similarity thresholds (0.8, 0.9, and 1.0). The graph helps in determining the optimal temperature setting that balances message diversity and data retention.
read the caption
(a) Cyberattack Messages

🔼 The figure shows the retention percentage of general messages generated using different temperature settings during synthetic data generation. The x-axis represents the temperature values, ranging from 0.0 to 1.0, while the y-axis displays the percentage of generated messages retained after the deduplication process. Multiple lines represent different similarity thresholds (0.8, 0.9, and 1.0) used during deduplication, showcasing how the retention rate changes at various temperatures and thresholds.
read the caption
(b) General Messages

🔼 This figure shows how the retention rate of synthetic data generated by a language model is affected by varying temperature settings (a measure of randomness) and similarity thresholds used for deduplication. Each line represents a different threshold (0.8, 0.9, or 1.0), showing the percentage of generated messages retained after deduplication at each temperature setting. Even with the strictest threshold (1.0), some exact duplicates were removed by a separate deduplication process.
read the caption
Figure 3: Retention percentage across different temperature settings and similarity thresholds (0.8, 0.9, 1.0). Note that even with threshold 1.0, exact duplicates are still removed by the deduplication service.

🔼 This figure shows the results of applying the UMAP dimensionality reduction technique to the DBSCAN clustering results of real cyberattack-related messages. Each point represents a message, colored and positioned based on its cluster assignment and embedding. The plot reveals the distribution and relationships among different clusters, allowing for insights into the semantic structure of the real data. This visual representation is helpful in understanding the diverse patterns and relationships within the messages. The non-uniform distribution of points and clusters suggests that real-world data often exhibits both distinct and overlapping events.
read the caption
(a) Real Data
More on tables
| Primary Attack Type | Training Set (Pre-May 2024) | Test Set (May ’24–Jan ’25) |
|---|---|---|
| Social Engineering & Phishing | Credential theft, wallet phishing | Email compromise, custodian impersonation |
| Smart Contract Exploits | Token claim vulnerabilities, flash loans | Token sale exploits, parameter manipulation |
| Exchange Security Breaches | Hot wallet compromises, key theft | System access exploits, API vulnerabilities |
| DeFi Protocol Attacks | Liquidity pool manipulation, bridge exploits | Cross-chain vulnerabilities, protocol exploits |
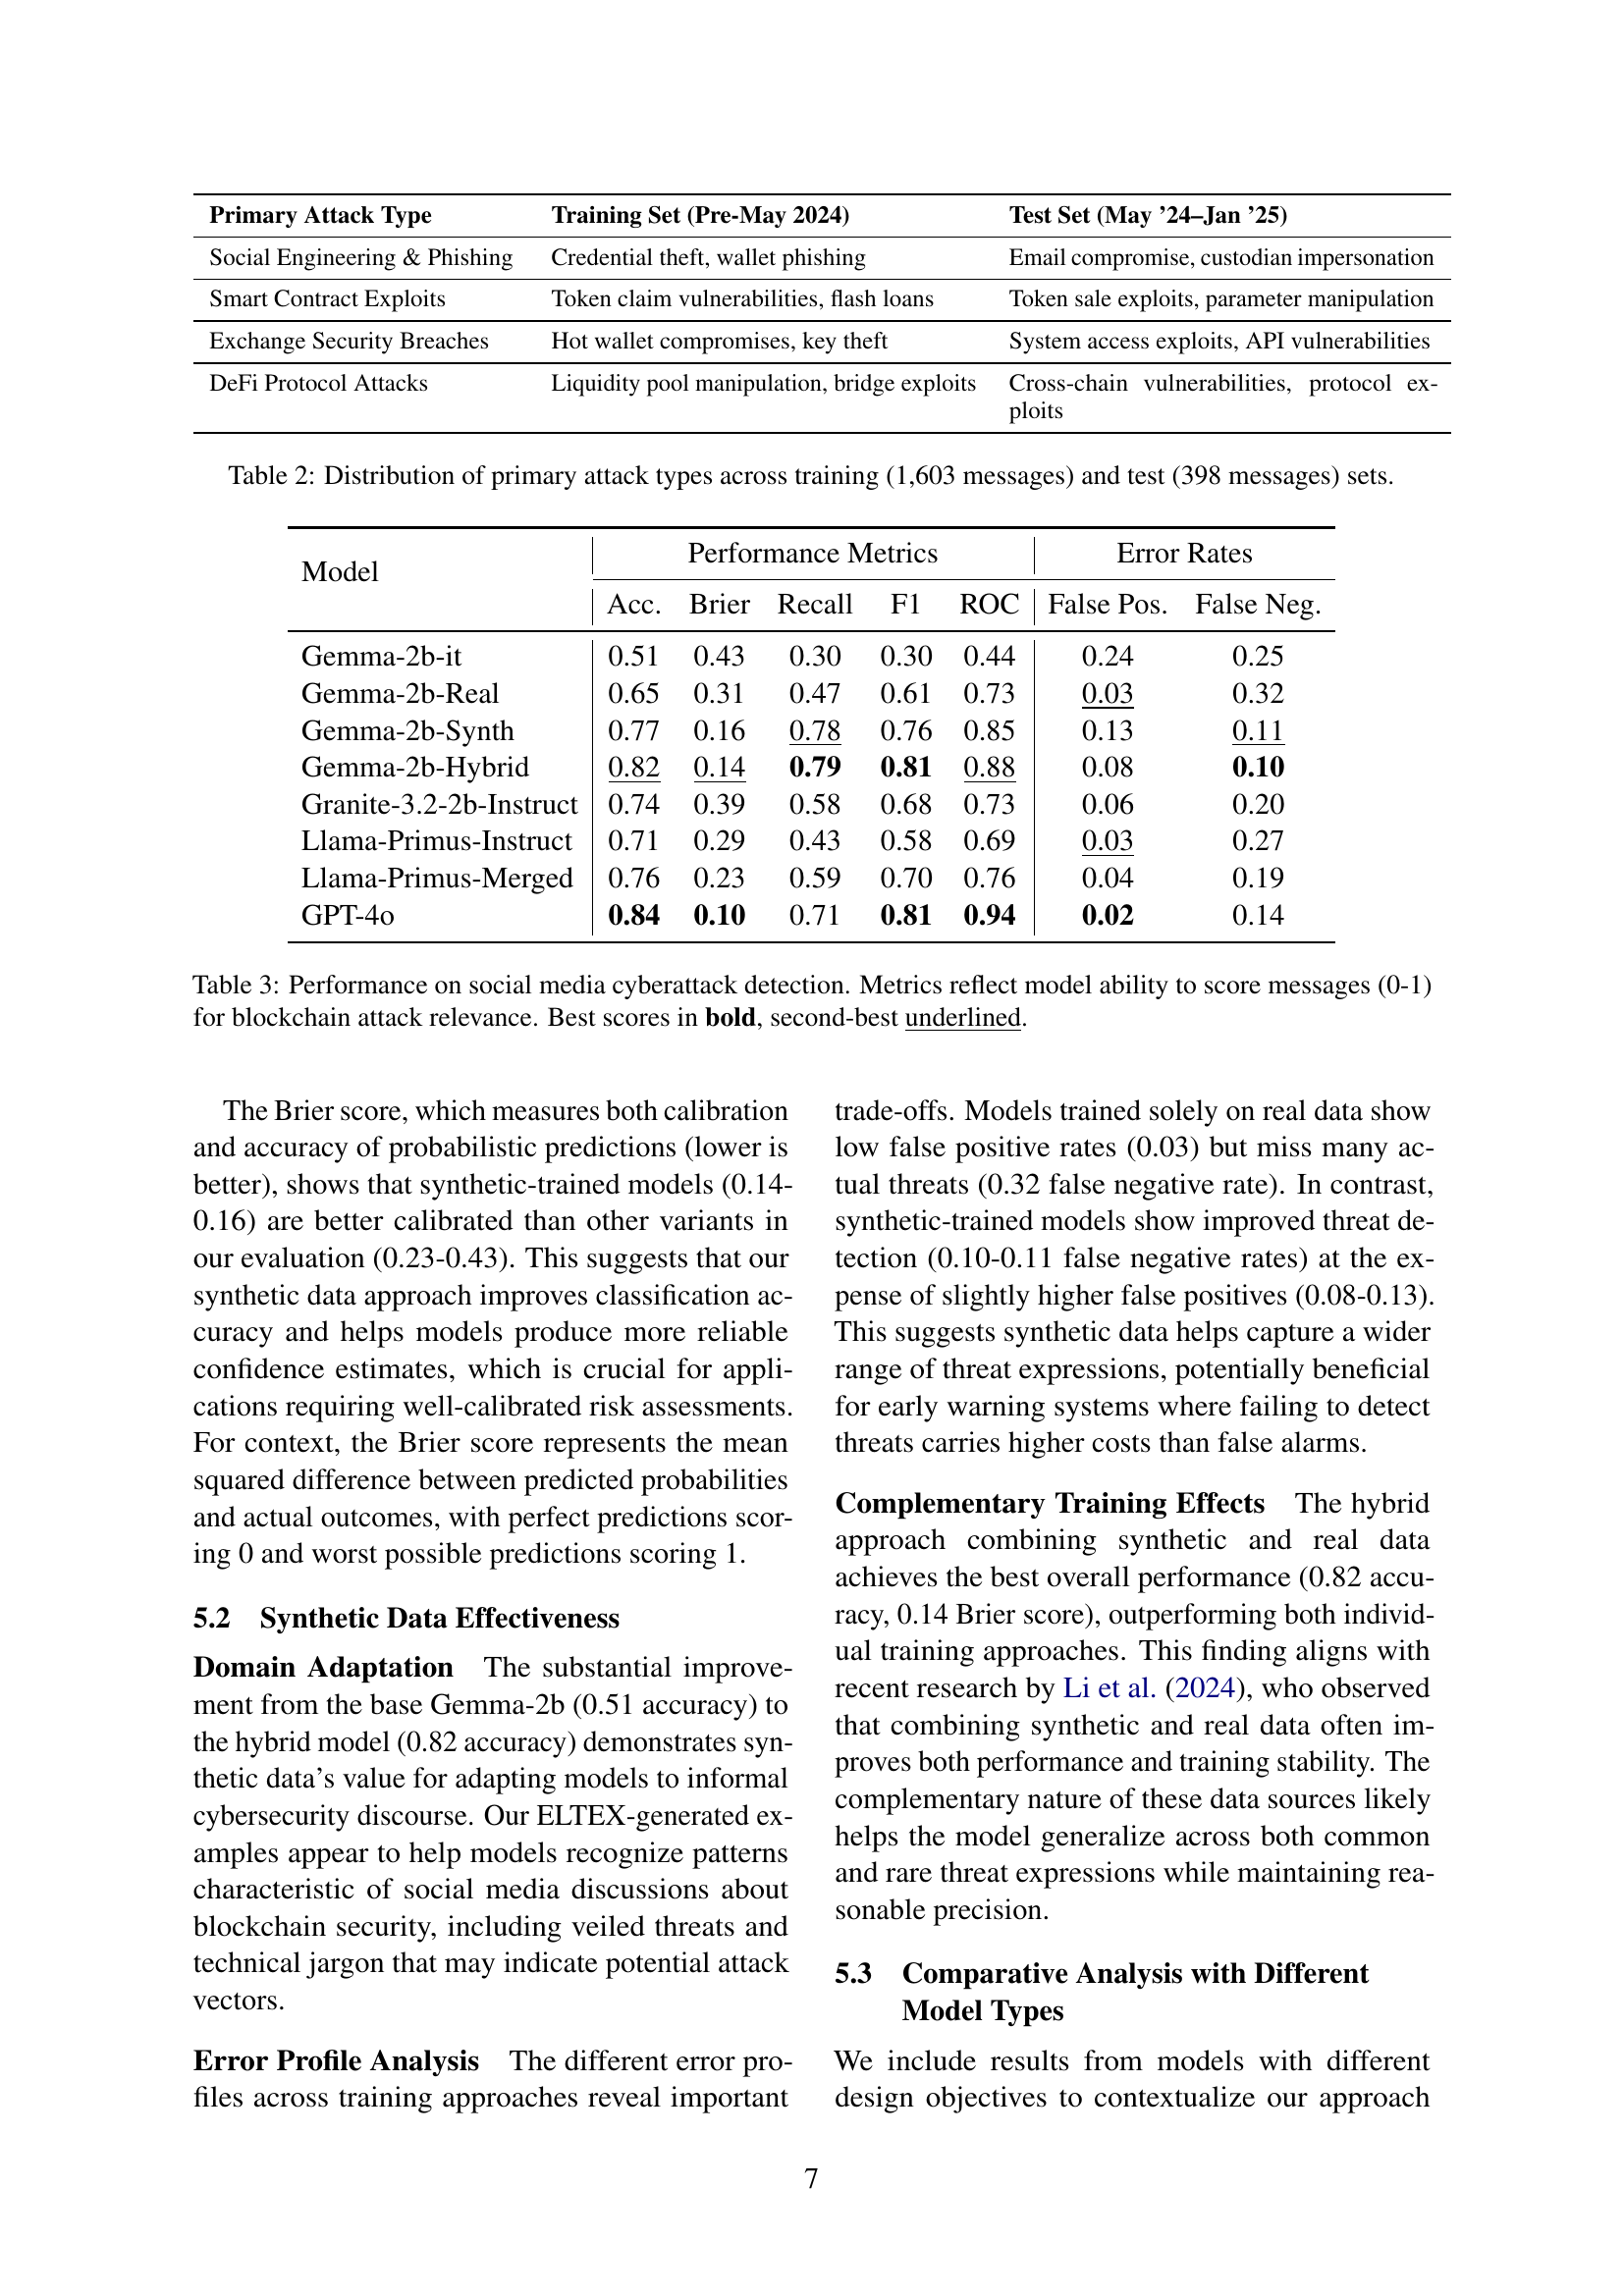
🔼 This table shows the distribution of primary attack types used in training and testing the model for blockchain-related cyberattack detection. It breaks down the number of messages in the training set (1603) and the test set (398) that correspond to each of the four primary attack types: Social Engineering & Phishing, Smart Contract Exploits, Exchange Security Breaches, and DeFi Protocol Attacks. The training and testing sets are designed to be temporally distinct, with the training data covering events prior to May 2024 and test data focusing on later events.
read the caption
Table 2: Distribution of primary attack types across training (1,603 messages) and test (398 messages) sets.
| Model | Performance Metrics | Error Rates | |||||
|---|---|---|---|---|---|---|---|
| Acc. | Brier | Recall | F1 | ROC | False Pos. | False Neg. | |
| Gemma-2b-it | 0.51 | 0.43 | 0.30 | 0.30 | 0.44 | 0.24 | 0.25 |
| Gemma-2b-Real | 0.65 | 0.31 | 0.47 | 0.61 | 0.73 | 0.03 | 0.32 |
| Gemma-2b-Synth | 0.77 | 0.16 | 0.78 | 0.76 | 0.85 | 0.13 | 0.11 |
| Gemma-2b-Hybrid | 0.82 | 0.14 | 0.79 | 0.81 | 0.88 | 0.08 | 0.10 |
| Granite-3.2-2b-Instruct | 0.74 | 0.39 | 0.58 | 0.68 | 0.73 | 0.06 | 0.20 |
| Llama-Primus-Instruct | 0.71 | 0.29 | 0.43 | 0.58 | 0.69 | 0.03 | 0.27 |
| Llama-Primus-Merged | 0.76 | 0.23 | 0.59 | 0.70 | 0.76 | 0.04 | 0.19 |
| GPT-4o | 0.84 | 0.10 | 0.71 | 0.81 | 0.94 | 0.02 | 0.14 |
🔼 This table presents the performance of different models on a social media cyberattack detection task. The models are evaluated based on their ability to assign a score (between 0 and 1) to messages indicating the likelihood of a blockchain-related attack. The metrics used to assess performance include accuracy, Brier score (a measure of calibration and accuracy of probabilistic predictions), recall, F1 score, and ROC AUC. The table compares the performance of a base model (Gemma-2b), models fine-tuned on real data, synthetic data generated by ELTEX, and a hybrid approach (using both real and synthetic data). It also includes comparative results from other models, such as GPT-40, Granite-3.2-2b, and Llama models fine-tuned on the Primus dataset, allowing for a broader performance assessment. The best scores are highlighted in bold, while the second-best scores are underlined.
read the caption
Table 3: Performance on social media cyberattack detection. Metrics reflect model ability to score messages (0-1) for blockchain attack relevance. Best scores in bold, second-best underlined.
| Type | Threshold | Original | Reduced |
|---|---|---|---|
| Cyberattack | 0.9 | 1,078 | 951 |
| Cyberattack | 0.8 | 1,078 | 413 |
| General | 0.9 | 688 | 652 |
| General | 0.8 | 688 | 446 |
🔼 This table presents the results of deduplication experiments performed on real-world social media messages related to cyberattacks and general blockchain topics. It shows the number of messages initially collected (‘Original’) and the number remaining after deduplication using two different similarity thresholds (0.9 and 0.8). The results are broken down by message type (Cyberattack and General). Comparing the ‘Original’ and ‘Reduced’ counts for each threshold illustrates the impact of the deduplication process on dataset size and the potential trade-off between retaining a larger amount of data versus removing potentially redundant or similar entries.
read the caption
Table 4: Reduction Statistics for Cyberattack and General Messages
| Cluster | Top Keywords (frequency) |
|---|---|
| Euler Finance | finance (129), million (89), defi (60), protocol (59), exploit (55), attack (38), euler (37), exploited (35), curve (32) |
| Poloniex/HTX | poloniex (63), exchange (58), htx (53), million (42), justin (32), sun (32), crypto (30), hack (30), hacker (24) |
| Bridge Exploit | bridge (51), multichain (40), orbit (38), chain (31), million (29), hack (27), exploit (18), protocol (14), hacked (11) |
| Atomic Wallet | wallet (73), atomic (68), users (21), hack (19), security (14), funds (11), crypto (10), million (9) |
🔼 This table shows the results of clustering analysis performed on real-world cyberattack-related social media data. The data was clustered using the DBSCAN algorithm, and the table highlights the top keywords associated with each of the resulting clusters. Each cluster represents a specific real-world cybersecurity event or incident, with the keywords reflecting the key themes, entities, and terminology associated with that event. The frequency of each keyword within its cluster is indicated in parentheses. This table demonstrates how real-world cyberattack data exhibits a high degree of event-specificity.
read the caption
Table 5: Representative Clusters in Real Data (Event-Specific Organization)
| Cluster | Top Keywords (frequency) |
|---|---|
| Network | transaction (366), attack (274), network (269), potential (260), mining (250), blockchain (216), unusual (202), alert (174) |
| Wallet | dormant (245), wallet (96), addresses (81), activation (77), activity (73), suddenly (62), sudden (54), wallets (53) |
| Market | price (368), manipulation (230), market (207), exchange (172), rapid (171), fluctuations (90), trading (85) |
| Governance | governance (333), community (206), sentiment (86), irregularities (79), proposal (73), manipulation (63), voting (49) |
🔼 This table displays the results of a clustering analysis performed on a synthetic dataset of social media messages related to cybersecurity threats in the blockchain domain. The analysis grouped similar messages into clusters based on semantic similarity. The table shows ten clusters identified by the analysis, and for each cluster, it lists the top keywords that characterize the messages within that cluster. The keyword frequencies are given in parentheses. The organization of the clusters reflects broad categories of cyber threats in the blockchain space, rather than specific incidents, showing that the synthetic dataset focuses on generating diverse examples covering a range of threat types.
read the caption
Table 6: Representative Clusters in Synthetic Data (Category-Based Organization)
Full paper#