TL;DR#
Diffusion models have become a key framework in visual generation, and integrating Mixture of Experts (MoE) shows promise for improving scalability and performance. However, visual signals in diffusion models have distinct characteristics like high spatial redundancy and temporal variation in denoising task complexity. Previous routing strategies have limitations in adapting to these characteristics, potentially leading to inefficient model utilization and suboptimal performance.
This paper introduces Race-DiT, a MoE model with a flexible routing strategy called Expert Race, allowing dynamic expert allocation to critical tokens. By letting tokens and experts compete and selecting top candidates, the model dynamically assigns experts to critical tokens. Per-layer regularization addresses shallow layer learning challenges, and router similarity loss prevents mode collapse, ensuring better expert utilization. Experiments on ImageNet validate the approach’s effectiveness, showing significant performance gains and promising scaling properties.
Key Takeaways#
Why does it matter?#
This paper is important for researchers because it introduces a novel MoE routing strategy and addresses the limitations of existing methods, enhancing scalability and performance. It opens new research avenues in diffusion models.
Visual Insights#

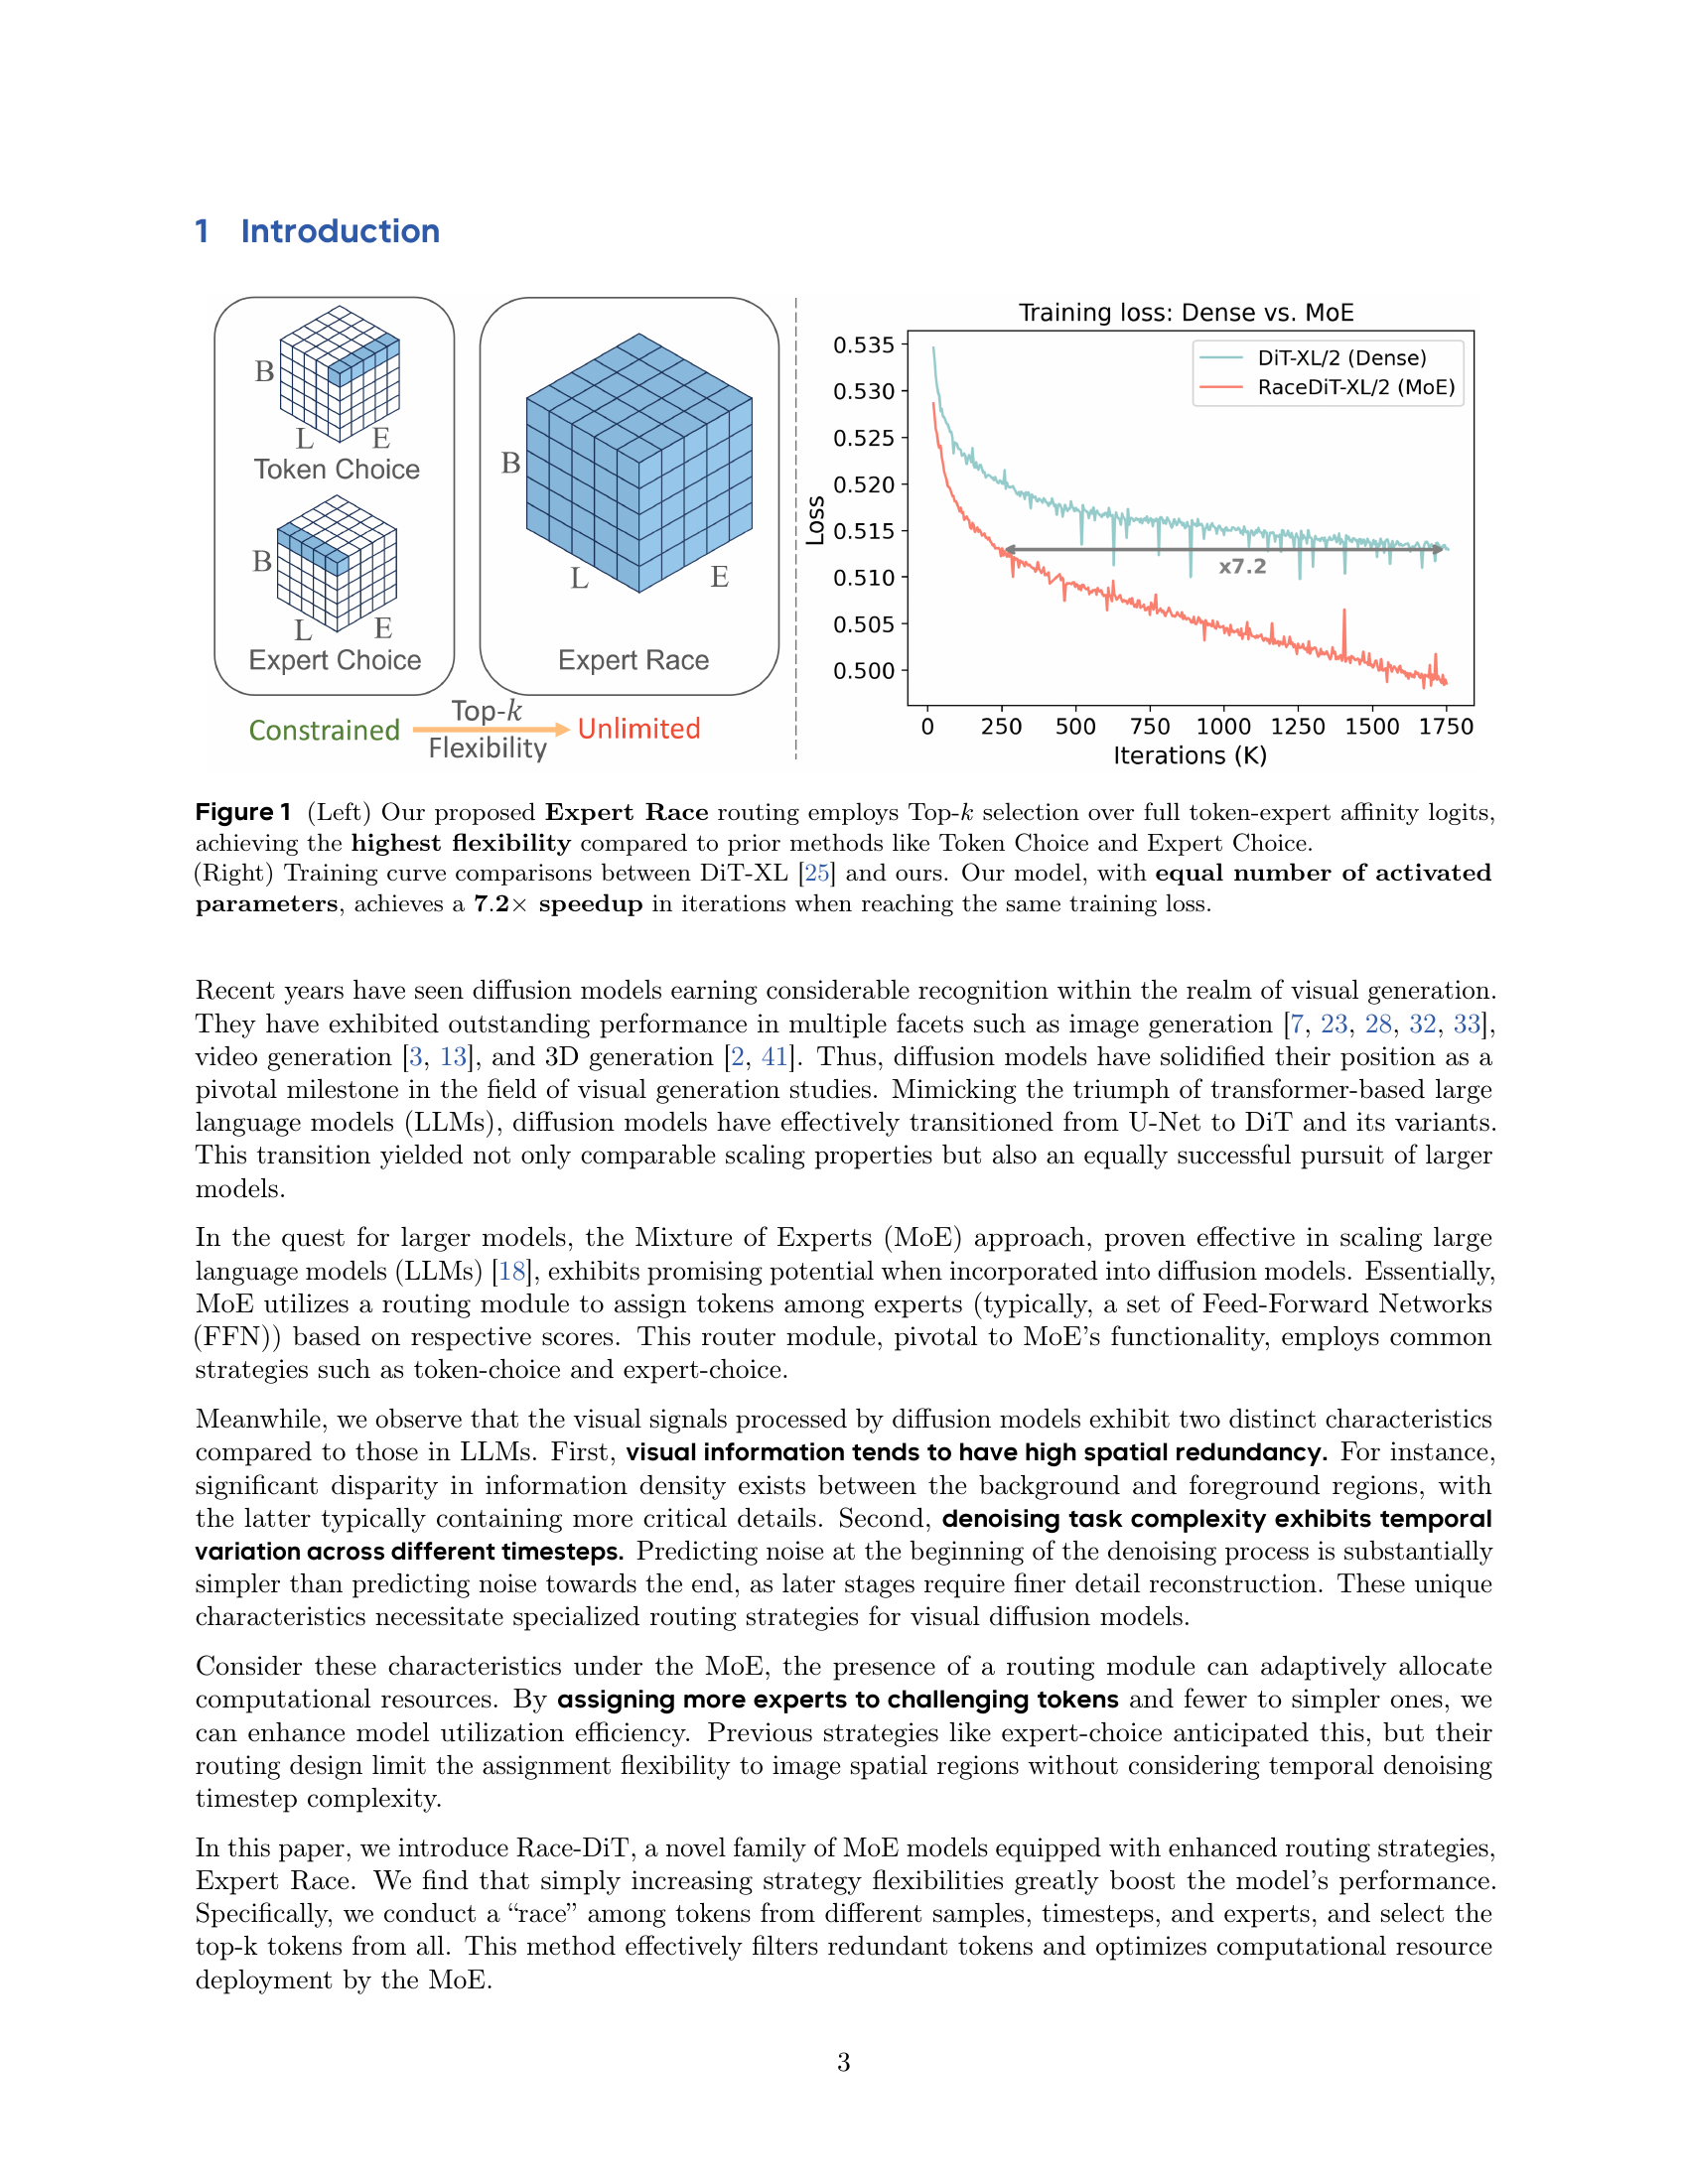
🔼 This figure shows a comparison of different routing strategies in Mixture of Experts (MoE) models for diffusion transformers. The left panel illustrates the proposed ‘Expert Race’ routing strategy, which uses a Top-k selection to choose the best combination of tokens and experts, providing greater flexibility compared to previous methods such as ‘Token Choice’ and ‘Expert Choice’. The right panel presents a training curve comparison between the proposed model (Race-DiT) and the DiT-XL model from the literature. Despite having the same number of activated parameters, the proposed model achieves a 7.2x speedup in reaching the same training loss, demonstrating its efficiency and scalability.
read the caption
Figure 1: (Left) Our proposed Expert Race routing employs Top-k𝑘kitalic_k selection over full token-expert affinity logits, achieving the highest flexibility compared to prior methods like Token Choice and Expert Choice. (Right) Training curve comparisons between DiT-XL [25] and ours. Our model, with equal number of activated parameters, achieves a 7.2×\mathbf{7.2\times}bold_7.2 × speedup in iterations when reaching the same training loss.
| Method | |||
| Token-choice | |||
| Expert-choice | |||
| Expert-Race |
🔼 This table presents the results of an ablation study that investigates the impact of different routing strategies (Token Choice, Expert Choice, and Expert Race) and gating functions (softmax, sigmoid, and identity) on the performance of a diffusion transformer model. The performance is measured using three metrics: FID (Fréchet Inception Distance), CMMD (Classifier-based Metric for Measuring Diffusion Models), and CLIP (Contrastive Language–Image Pre-training). Lower FID and CMMD scores indicate better image quality, while a higher CLIP score indicates better alignment between the generated images and their text descriptions.
read the caption
Table 1: Ablation study on routing strategy and gating function.
In-depth insights#
Expert Race MoE#
The concept of “Expert Race MoE” likely represents a Mixture of Experts architecture where experts dynamically compete to process input tokens. This allows for flexible routing, enabling the model to allocate computational resources to the most complex or informative parts of the input. Key features would include a racing mechanism for experts selection, potentially using top-k selection or learnable thresholds. The benefits could be enhanced performance, faster convergence, and better scaling properties compared to traditional MoE approaches with fixed expert assignments. Challenges might involve ensuring fair competition among experts, preventing mode collapse, and maintaining training stability. This innovative approach promises significant advancements in the field.
Routing Strategy#
The routing strategy is pivotal for MoE performance, enabling dynamic expert allocation based on input complexity. Expert Race stands out, enabling more flexibility in expert assignments across both spatial image regions and temporal denoising steps, leading to more adaptive allocation patterns. The choice of gating function is also an important consideration, and the work found that identity gating outperforms both softmax and sigmoid variants, preserving the partial ordering of scores across different tokens, which is crucial for the selection of relevant token-expert combinations.
Balancing Loads#
Balancing loads in MoE models is critical. Uneven expert utilization hinders performance. Traditional methods promote uniform distribution, but may cause collapse where experts learn similar rules, negating benefits. More effective strategies consider diverse expert combinations and router similarity. Techniques to assess balance include metrics measuring violation of capacity limits and pairwise combination ratios, leading to improved generation quality and load-balancing performance. A key approach would be maximizing specialization by promoting pairwise diversity among experts and computing cross-correlation matrices.
DiT Scaling Laws#
Scaling laws are crucial for understanding how model performance improves with increasing compute, data, and model size. For Diffusion Transformers (DiT), understanding these laws would involve analyzing how metrics like FID and IS change as we scale the number of parameters, training data, or the size of the transformer blocks. Key insights would include identifying the optimal balance between network depth and width, the effect of increased dataset diversity, and the diminishing returns as models get larger. Understanding these scaling laws provides guidance for efficiently allocating resources, designing better architectures, and predicting the performance of even larger DiTs. MoEs further influence these laws.
Per-Layer Reg.#
Per-Layer Regularization addresses a critical challenge in scaling diffusion transformers with Mixture of Experts (MoE), specifically the imbalance in learning speed between shallow and deep layers. In pre-normalization architectures like DiT, adaLN can amplify the outputs of deeper layers, overshadowing the contributions of shallower layers. This leads to slower learning in early layers, hindering the MoE training process, where expert assignment might struggle initially with noisy inputs. The technique introduces a pre-layer regularization that enhances gradients in a supervised manner, without altering the core network. This is achieved by adding a projection layer and applying auxiliary loss. This layer predicts output target. Supervising these predictions effectively boosts the contributions of shallow layers, resulting in overall improved MoE performance and faster convergence. This also stabilizes training.
More visual insights#
More on figures

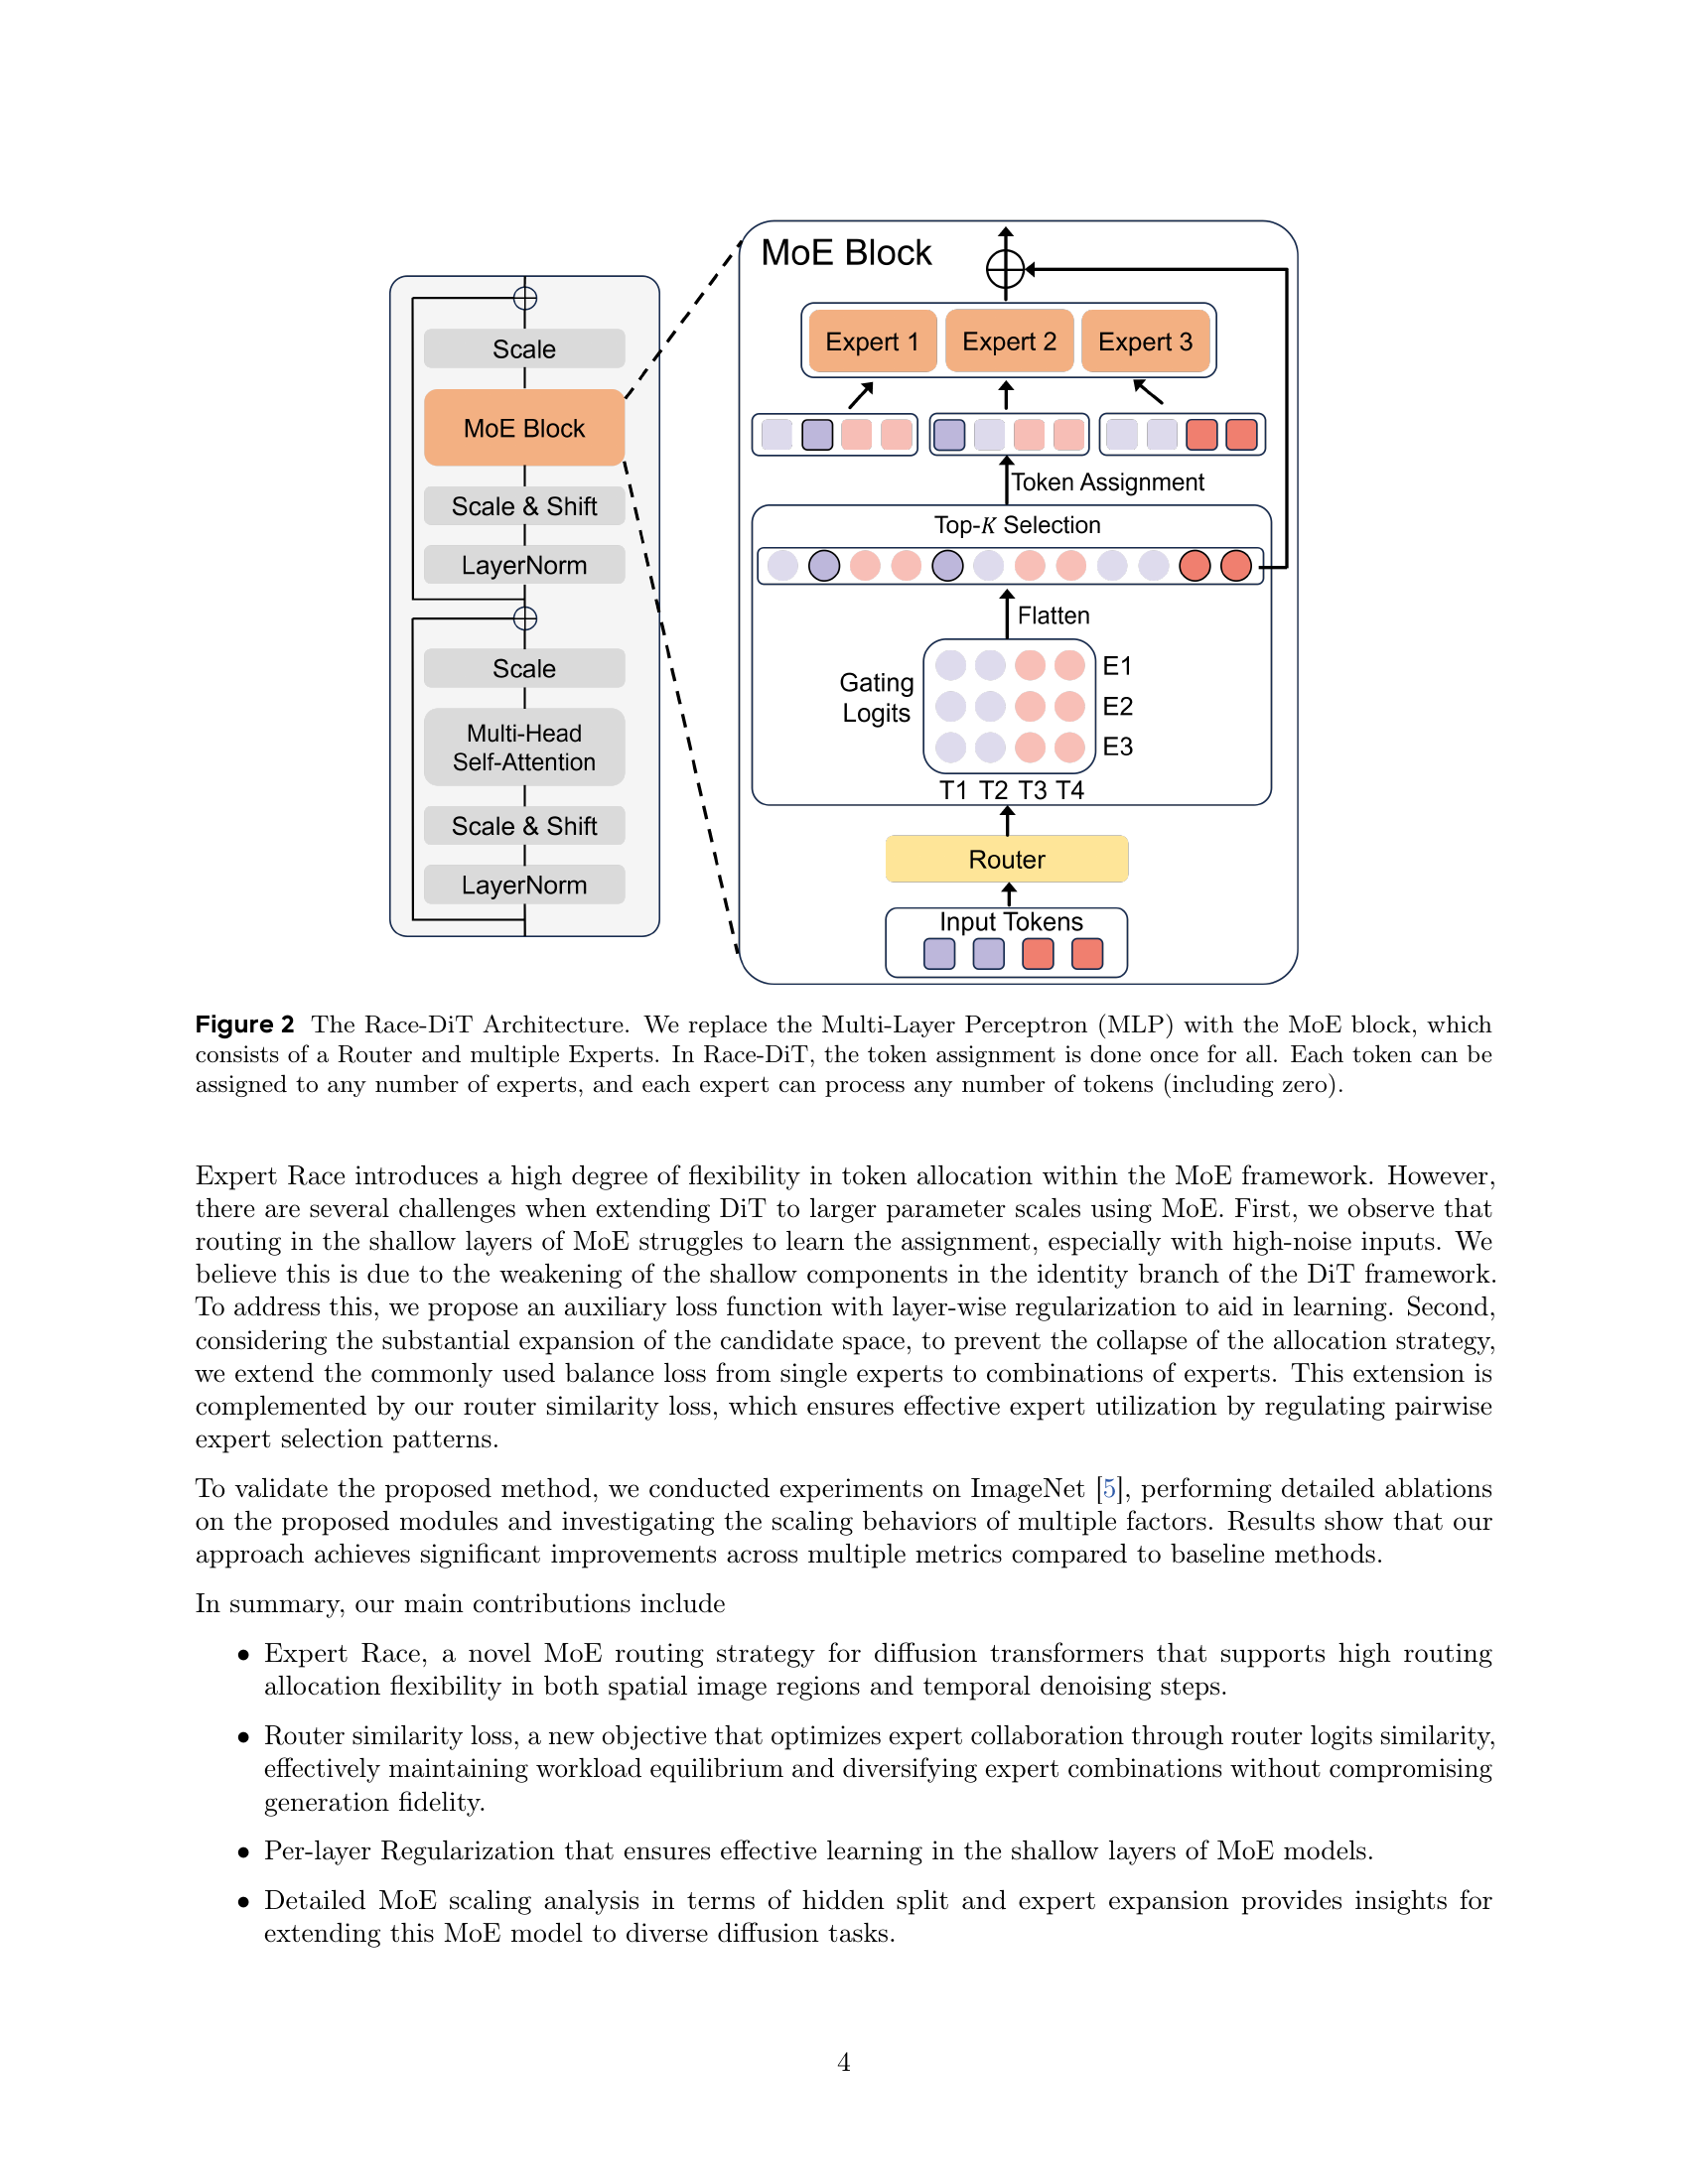
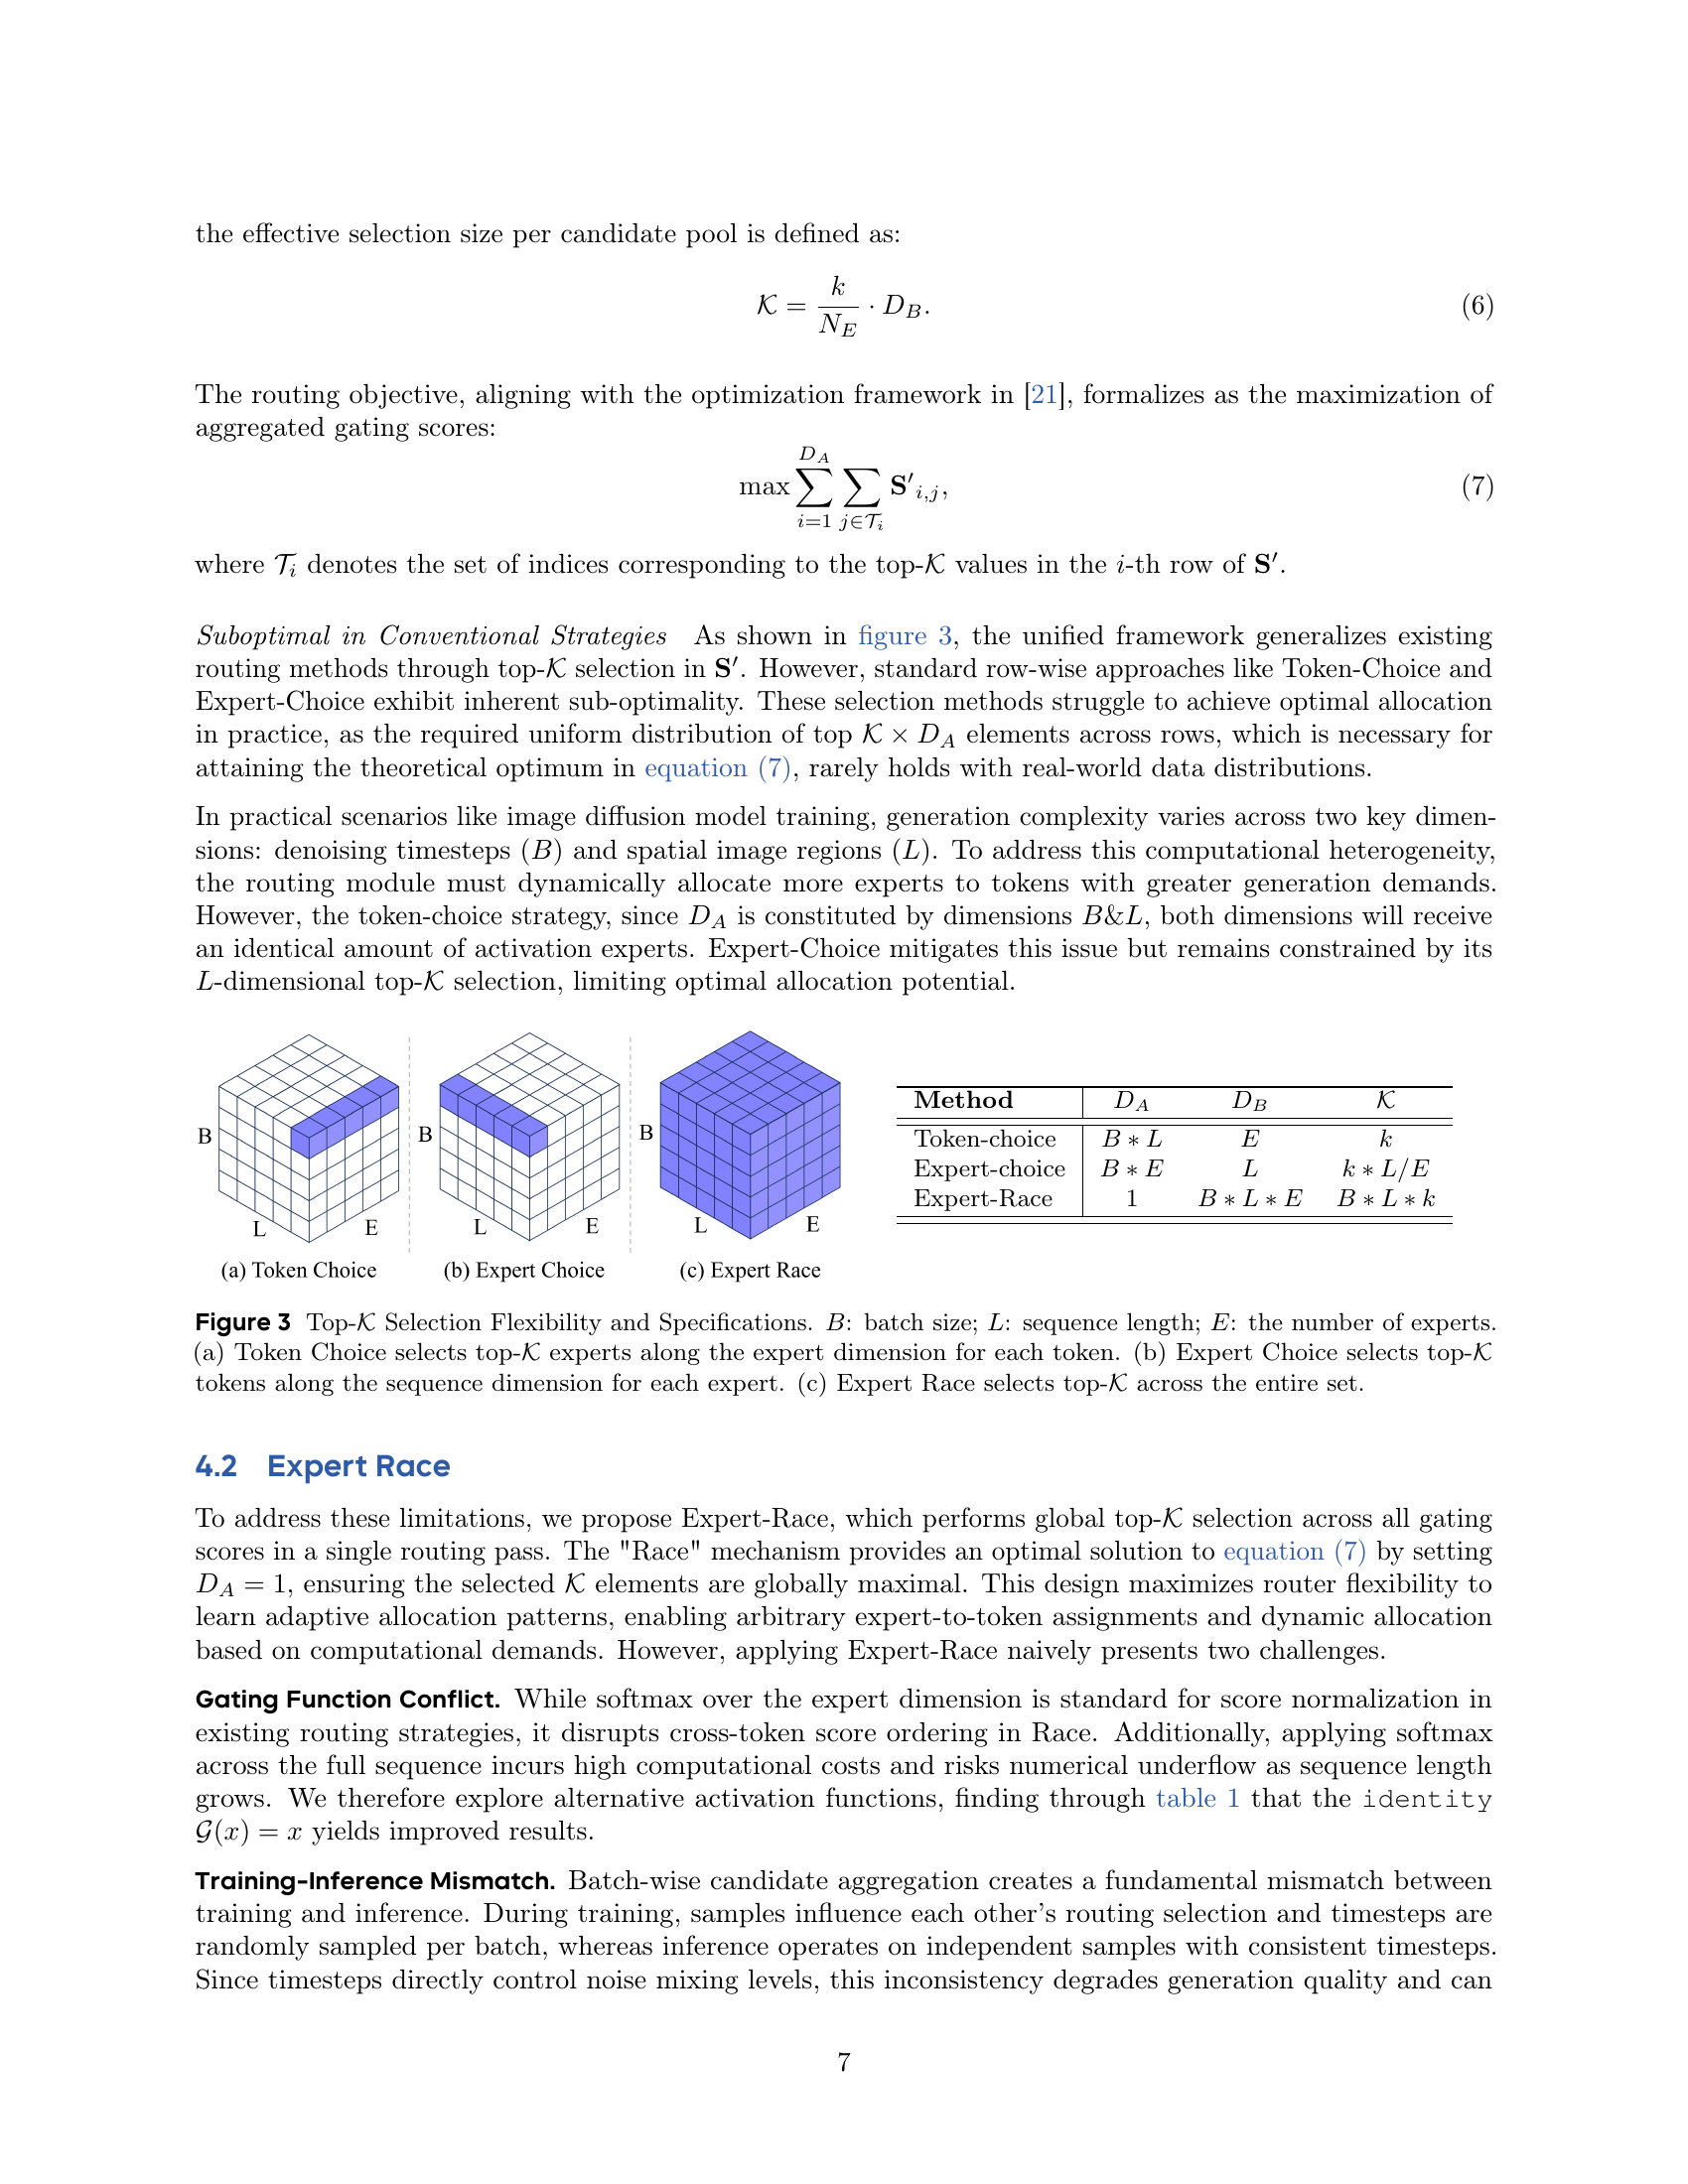
🔼 This figure illustrates the architecture of Race-DiT, a novel Mixture of Experts (MoE) model for diffusion transformers. The key innovation is the replacement of the traditional Multi-Layer Perceptron (MLP) with a MoE block. This block comprises a router and multiple experts. The model’s routing mechanism is designed for flexibility: token assignment happens only once, and each token can be routed to zero or more experts, with each expert potentially processing a varying number of tokens. This differs from previous methods, where each token was typically assigned to a fixed number of experts. The flexibility allows for dynamic and efficient resource allocation in processing image data.
read the caption
Figure 2: The Race-DiT Architecture. We replace the Multi-Layer Perceptron (MLP) with the MoE block, which consists of a Router and multiple Experts. In Race-DiT, the token assignment is done once for all. Each token can be assigned to any number of experts, and each expert can process any number of tokens (including zero).

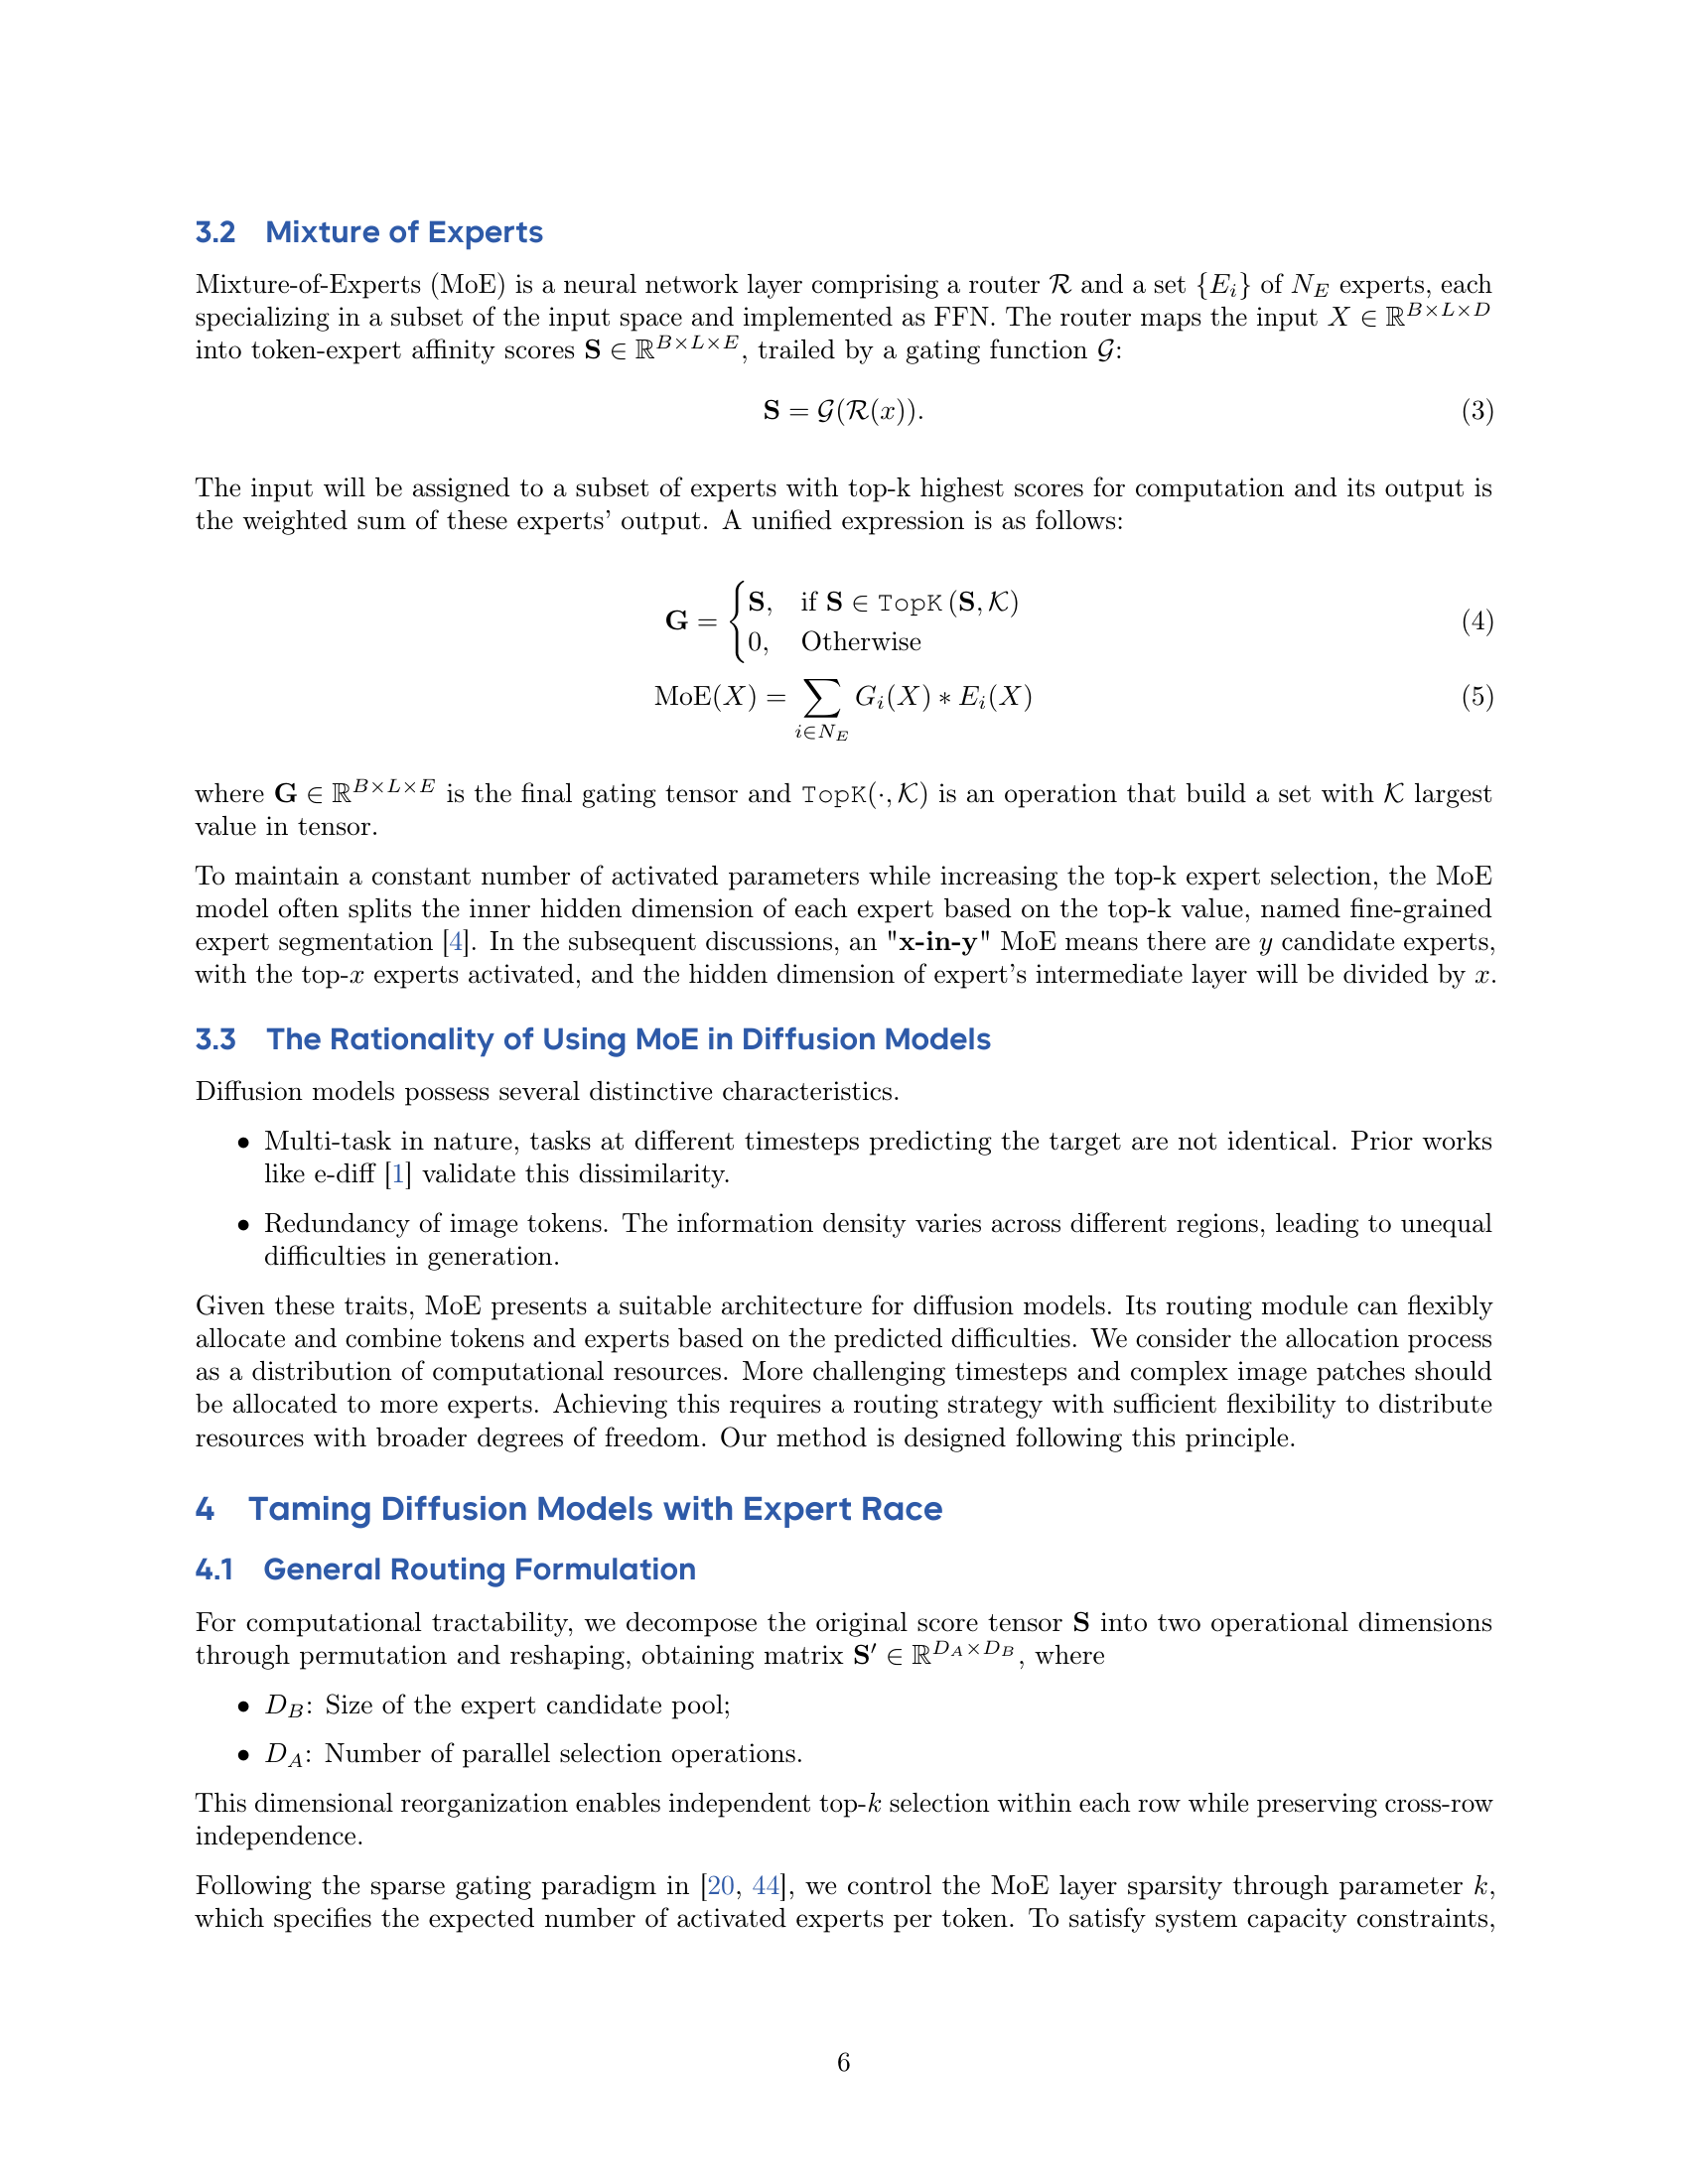
🔼 This figure compares three different routing strategies in Mixture of Experts (MoE) models for diffusion transformers: Token Choice, Expert Choice, and Expert Race. Token Choice selects the top 𝐾 experts for each token independently. Expert Choice selects the top 𝐾 tokens for each expert independently. Expert Race, in contrast, performs a global selection, choosing the top 𝐾 token-expert pairs across the entire set, offering the greatest flexibility. The variables 𝐵, 𝐿, and 𝐸 represent batch size, sequence length, and the number of experts, respectively.
read the caption
Figure 3: Top-𝒦𝒦\mathcal{K}caligraphic_K Selection Flexibility and Specifications. B𝐵Bitalic_B: batch size; L𝐿Litalic_L: sequence length; E𝐸Eitalic_E: the number of experts. (a) Token Choice selects top-𝒦𝒦\mathcal{K}caligraphic_K experts along the expert dimension for each token. (b) Expert Choice selects top-𝒦𝒦\mathcal{K}caligraphic_K tokens along the sequence dimension for each expert. (c) Expert Race selects top-𝒦𝒦{\mathcal{K}}caligraphic_K across the entire set.

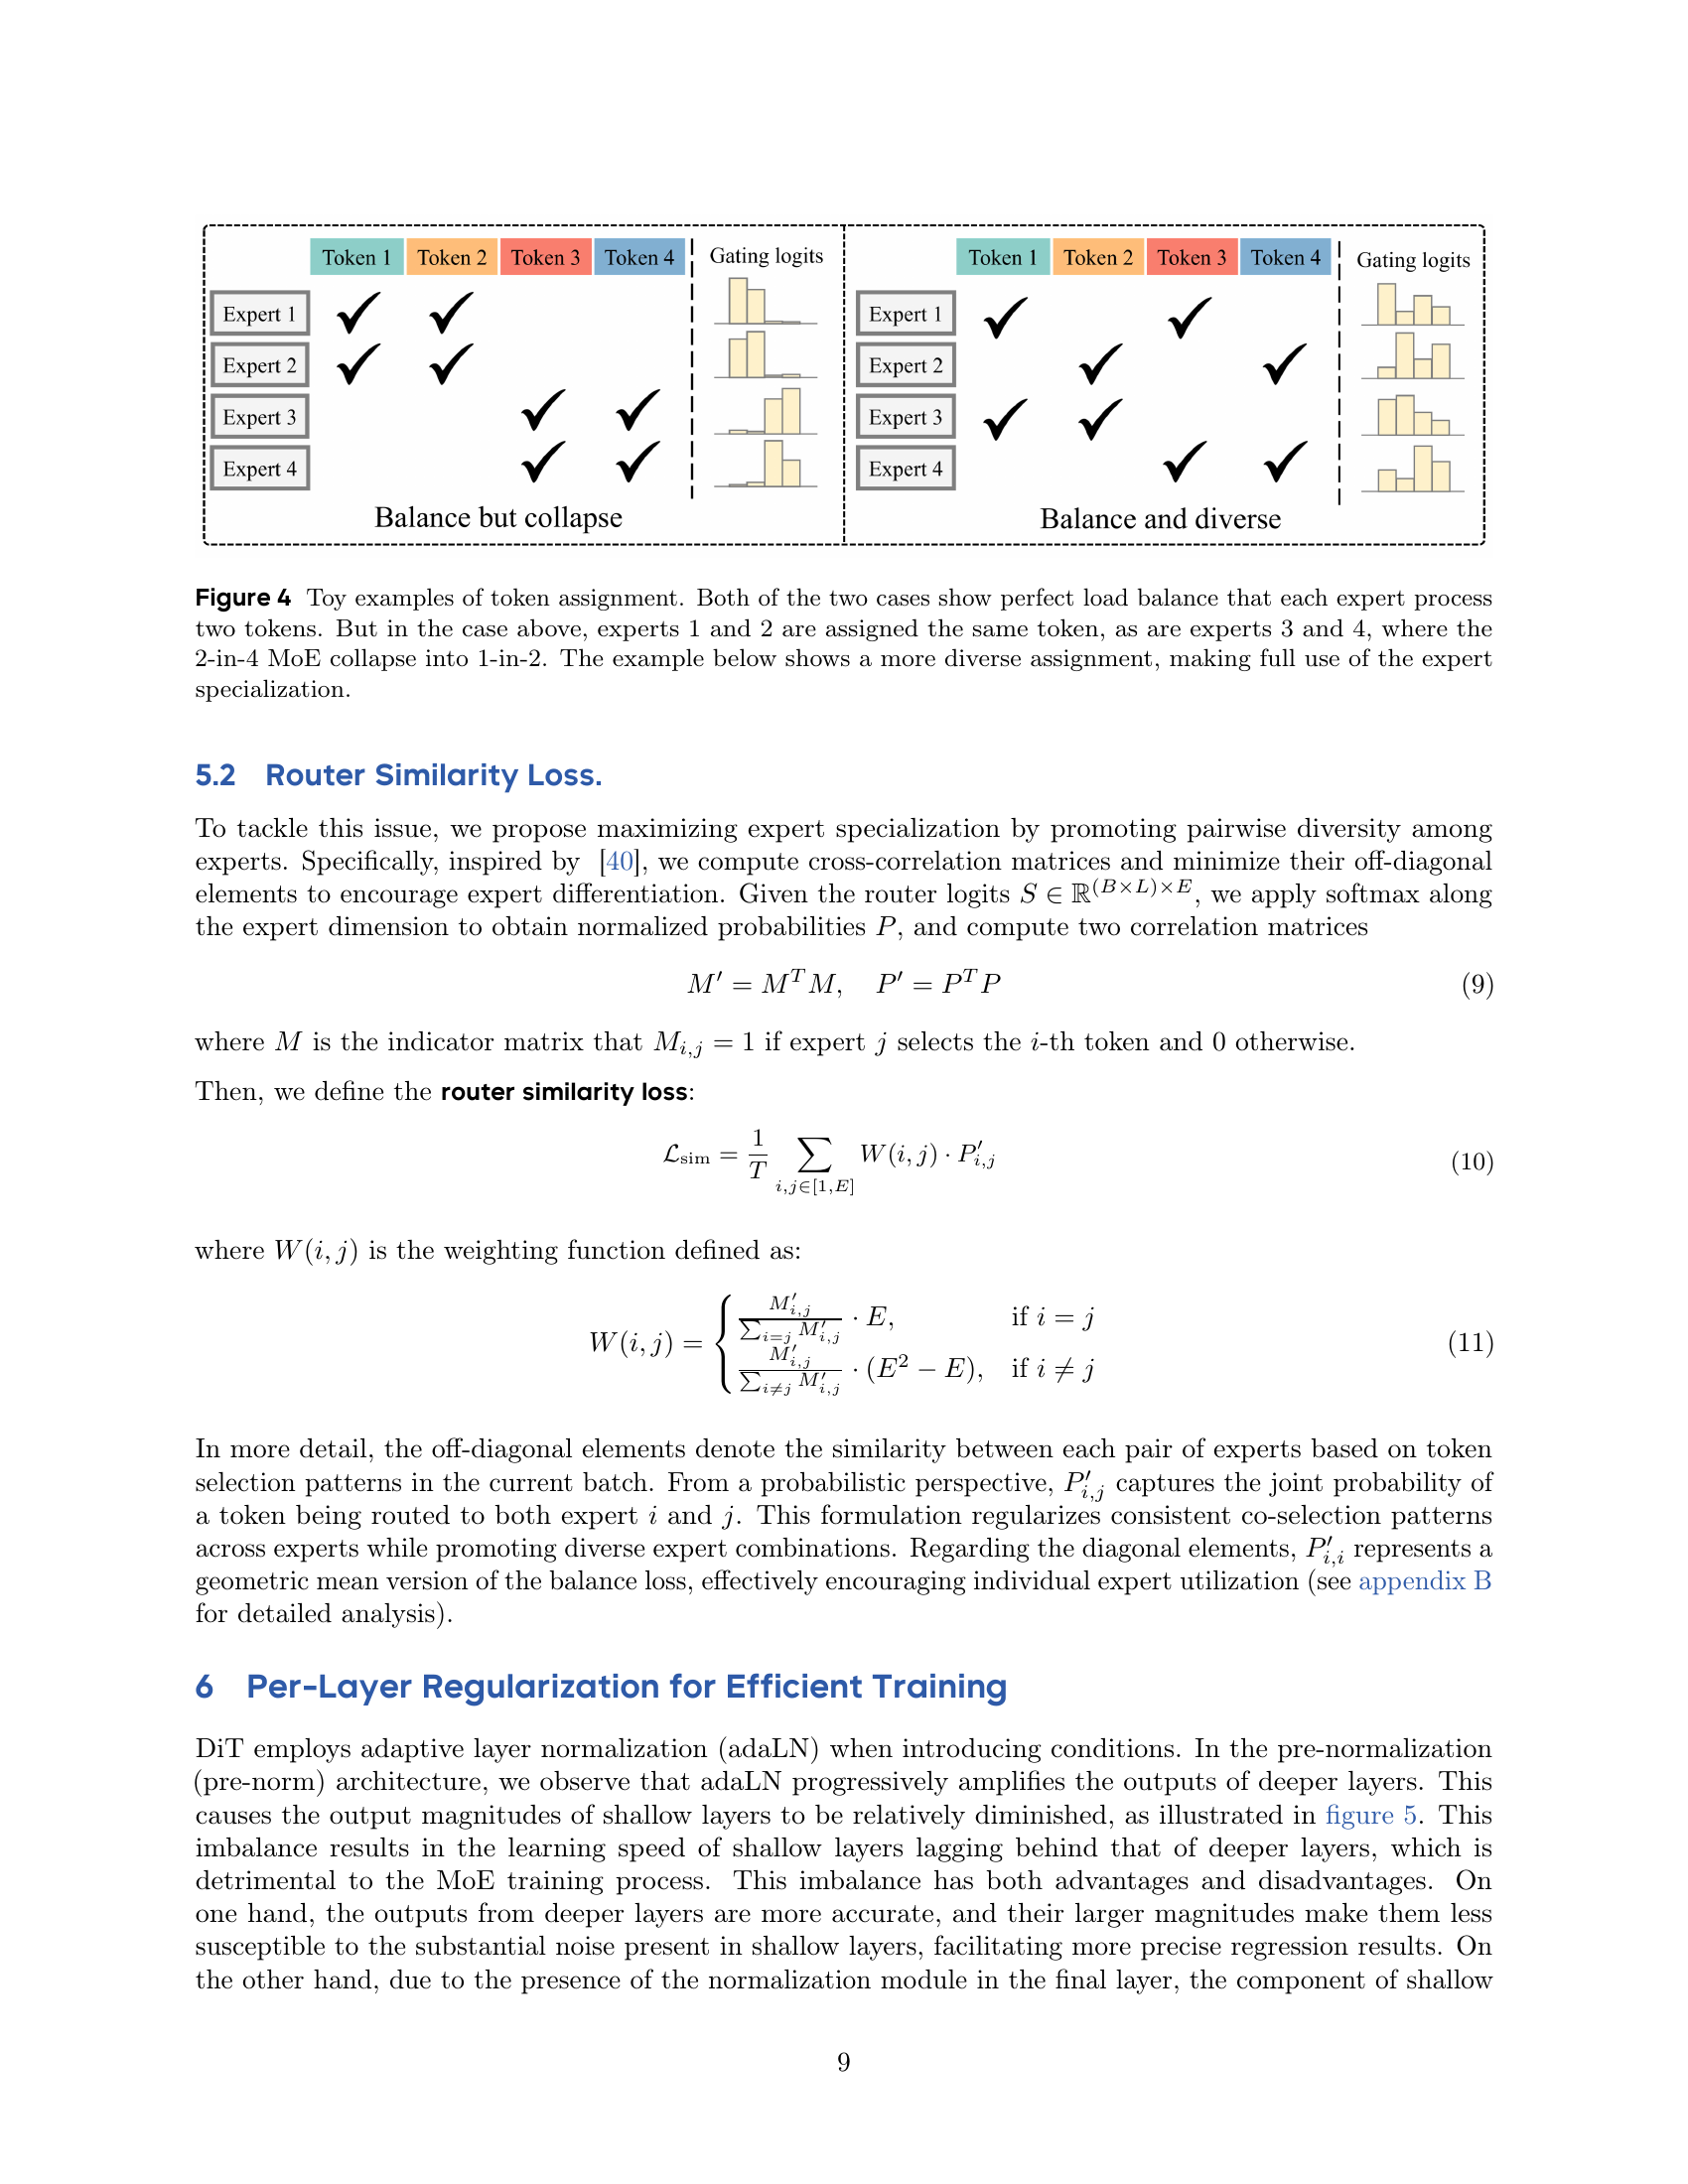
🔼 This figure illustrates the concept of load balancing in Mixture of Experts (MoE) models. The top panel shows a scenario where, despite each expert processing two tokens (achieving perfect load balance), experts 1 and 2 are assigned identical tokens, as are experts 3 and 4. This results in a collapse where the effective number of experts is reduced from four to two, negating the benefits of having multiple experts. The bottom panel demonstrates a more desirable allocation, where each expert is assigned unique tokens, leading to better utilization of expert specialization and improved model performance.
read the caption
Figure 4: Toy examples of token assignment. Both of the two cases show perfect load balance that each expert process two tokens. But in the case above, experts 1 and 2 are assigned the same token, as are experts 3 and 4, where the 2-in-4 MoE collapse into 1-in-2. The example below shows a more diverse assignment, making full use of the expert specialization.

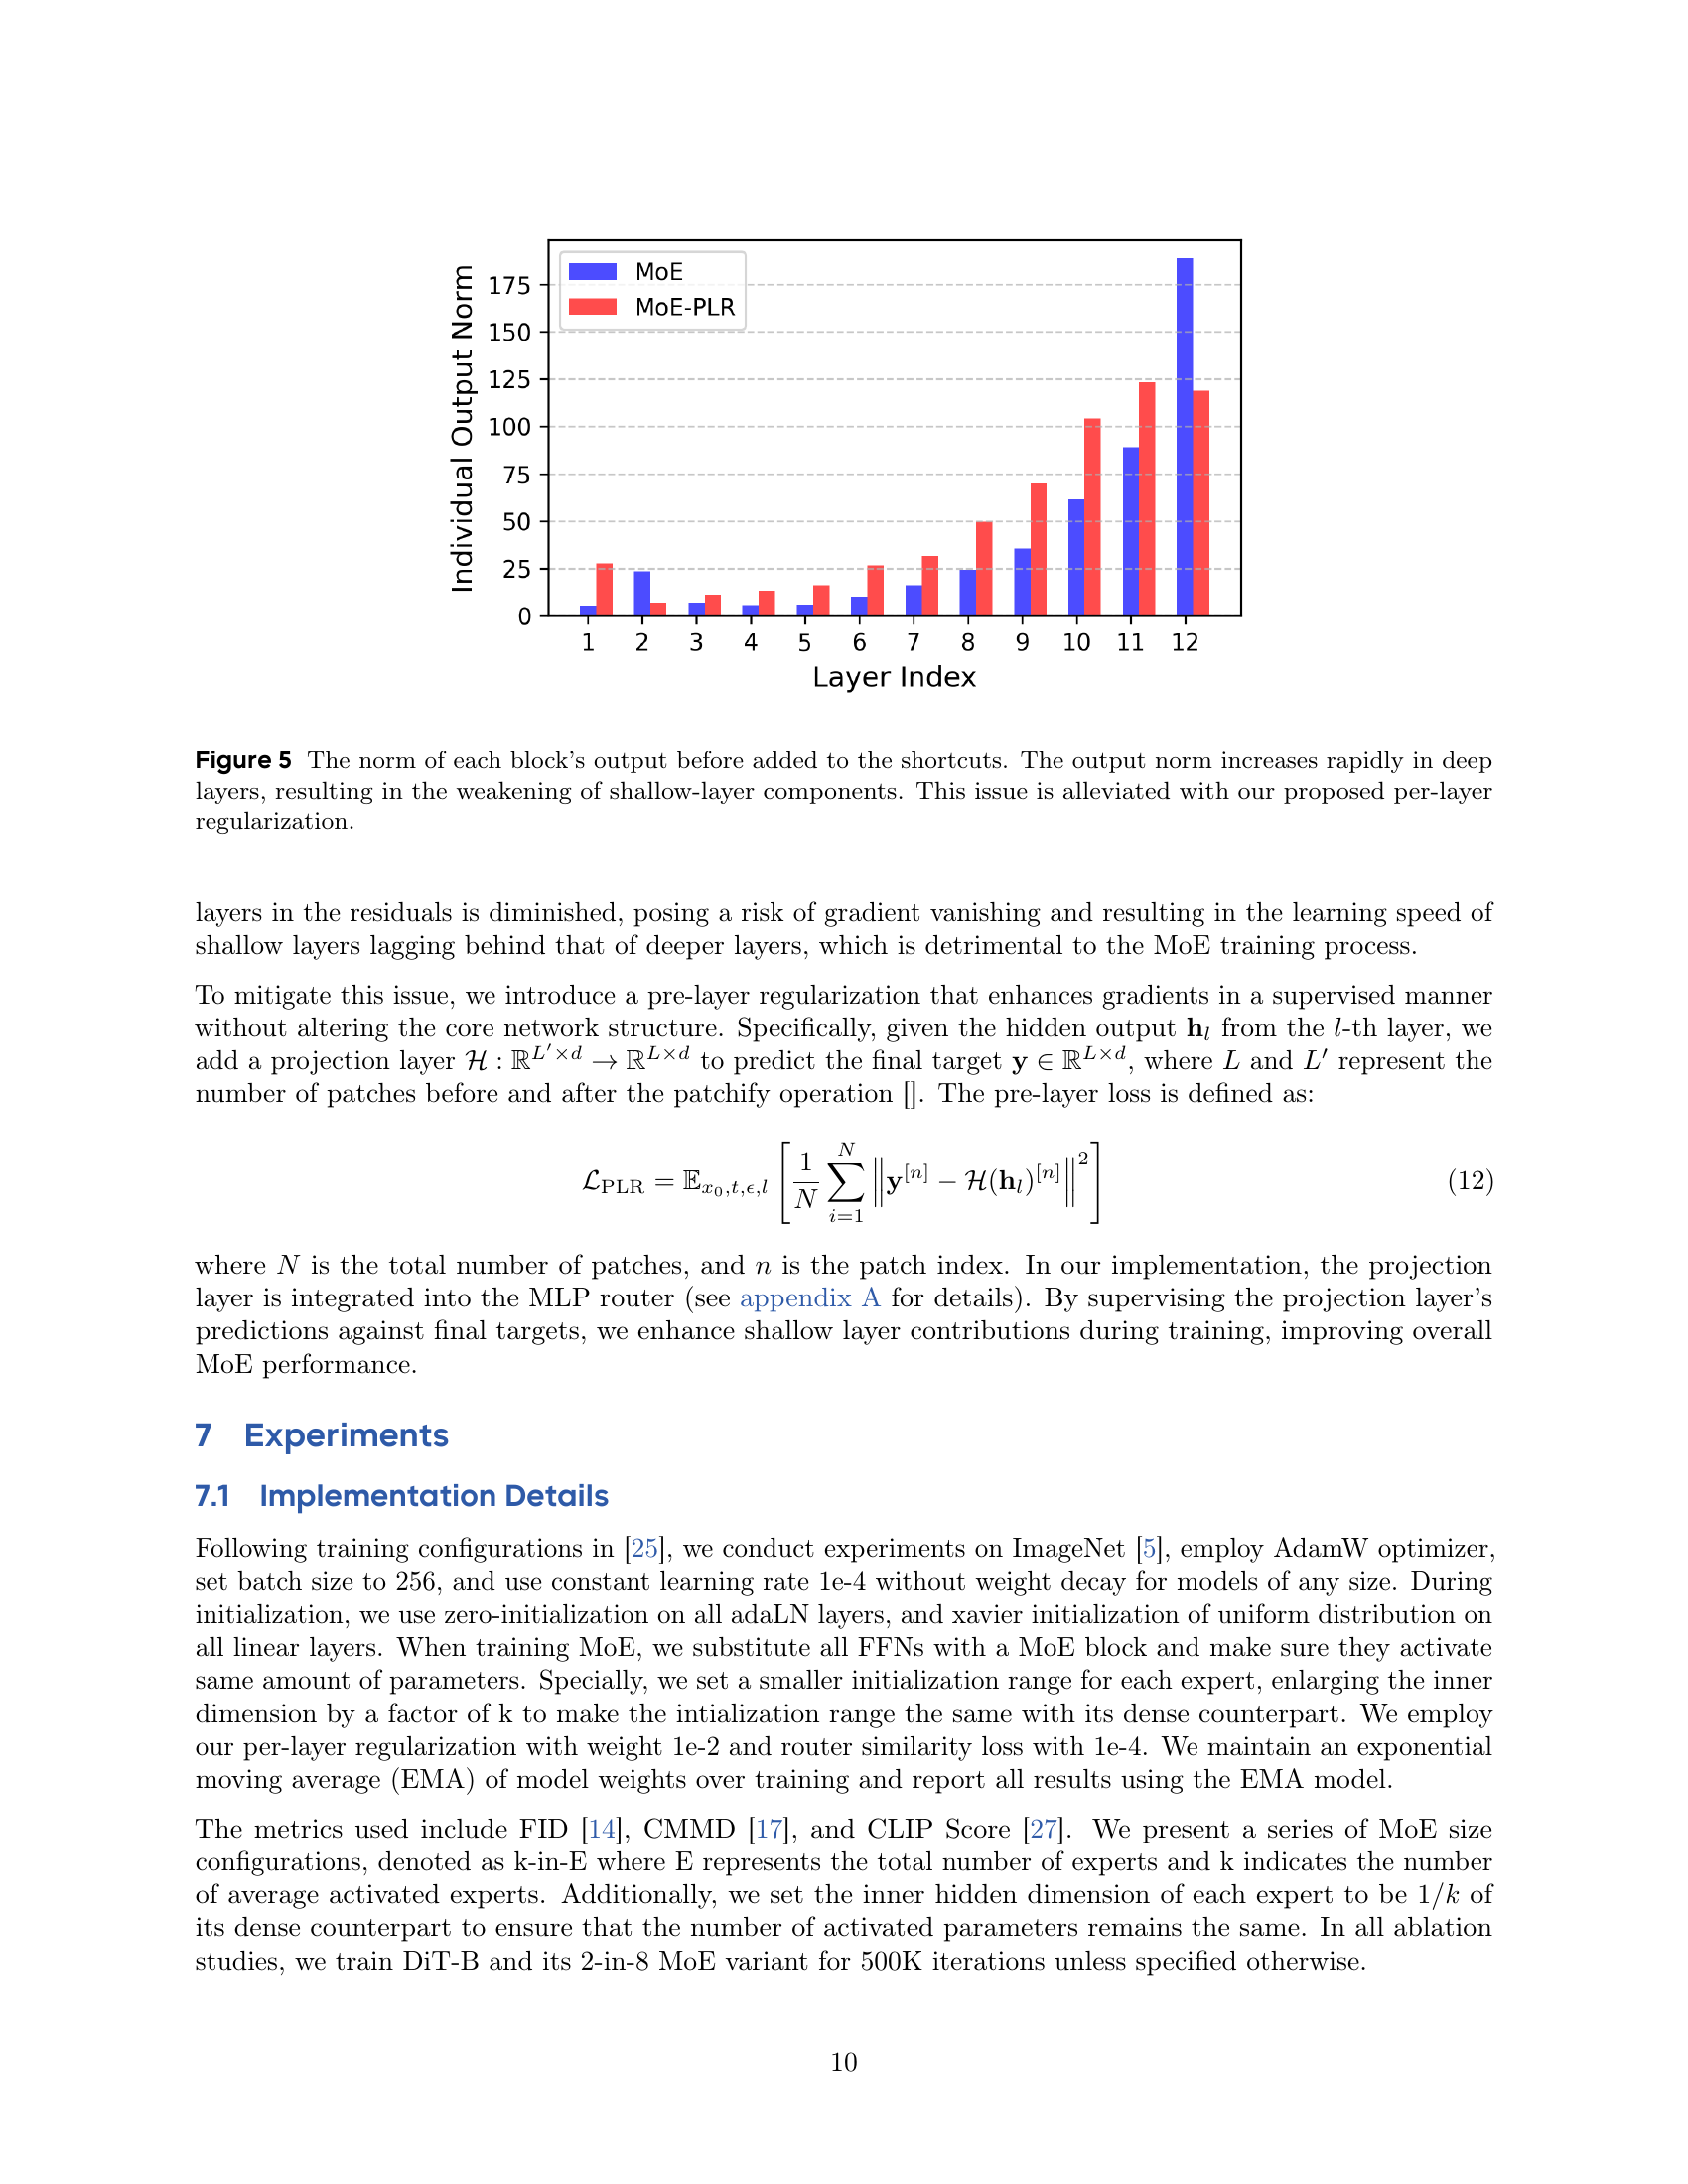
🔼 This figure displays the norm of each block’s output in a diffusion model before it’s added to the skip connections (shortcuts). It shows that the norm grows significantly larger in deeper layers compared to shallower layers. This disparity weakens the shallower layers in terms of their influence on the overall network output. The researchers address this issue with their proposed method: per-layer regularization.
read the caption
Figure 5: The norm of each block’s output before added to the shortcuts. The output norm increases rapidly in deep layers, resulting in the weakening of shallow-layer components. This issue is alleviated with our proposed per-layer regularization.

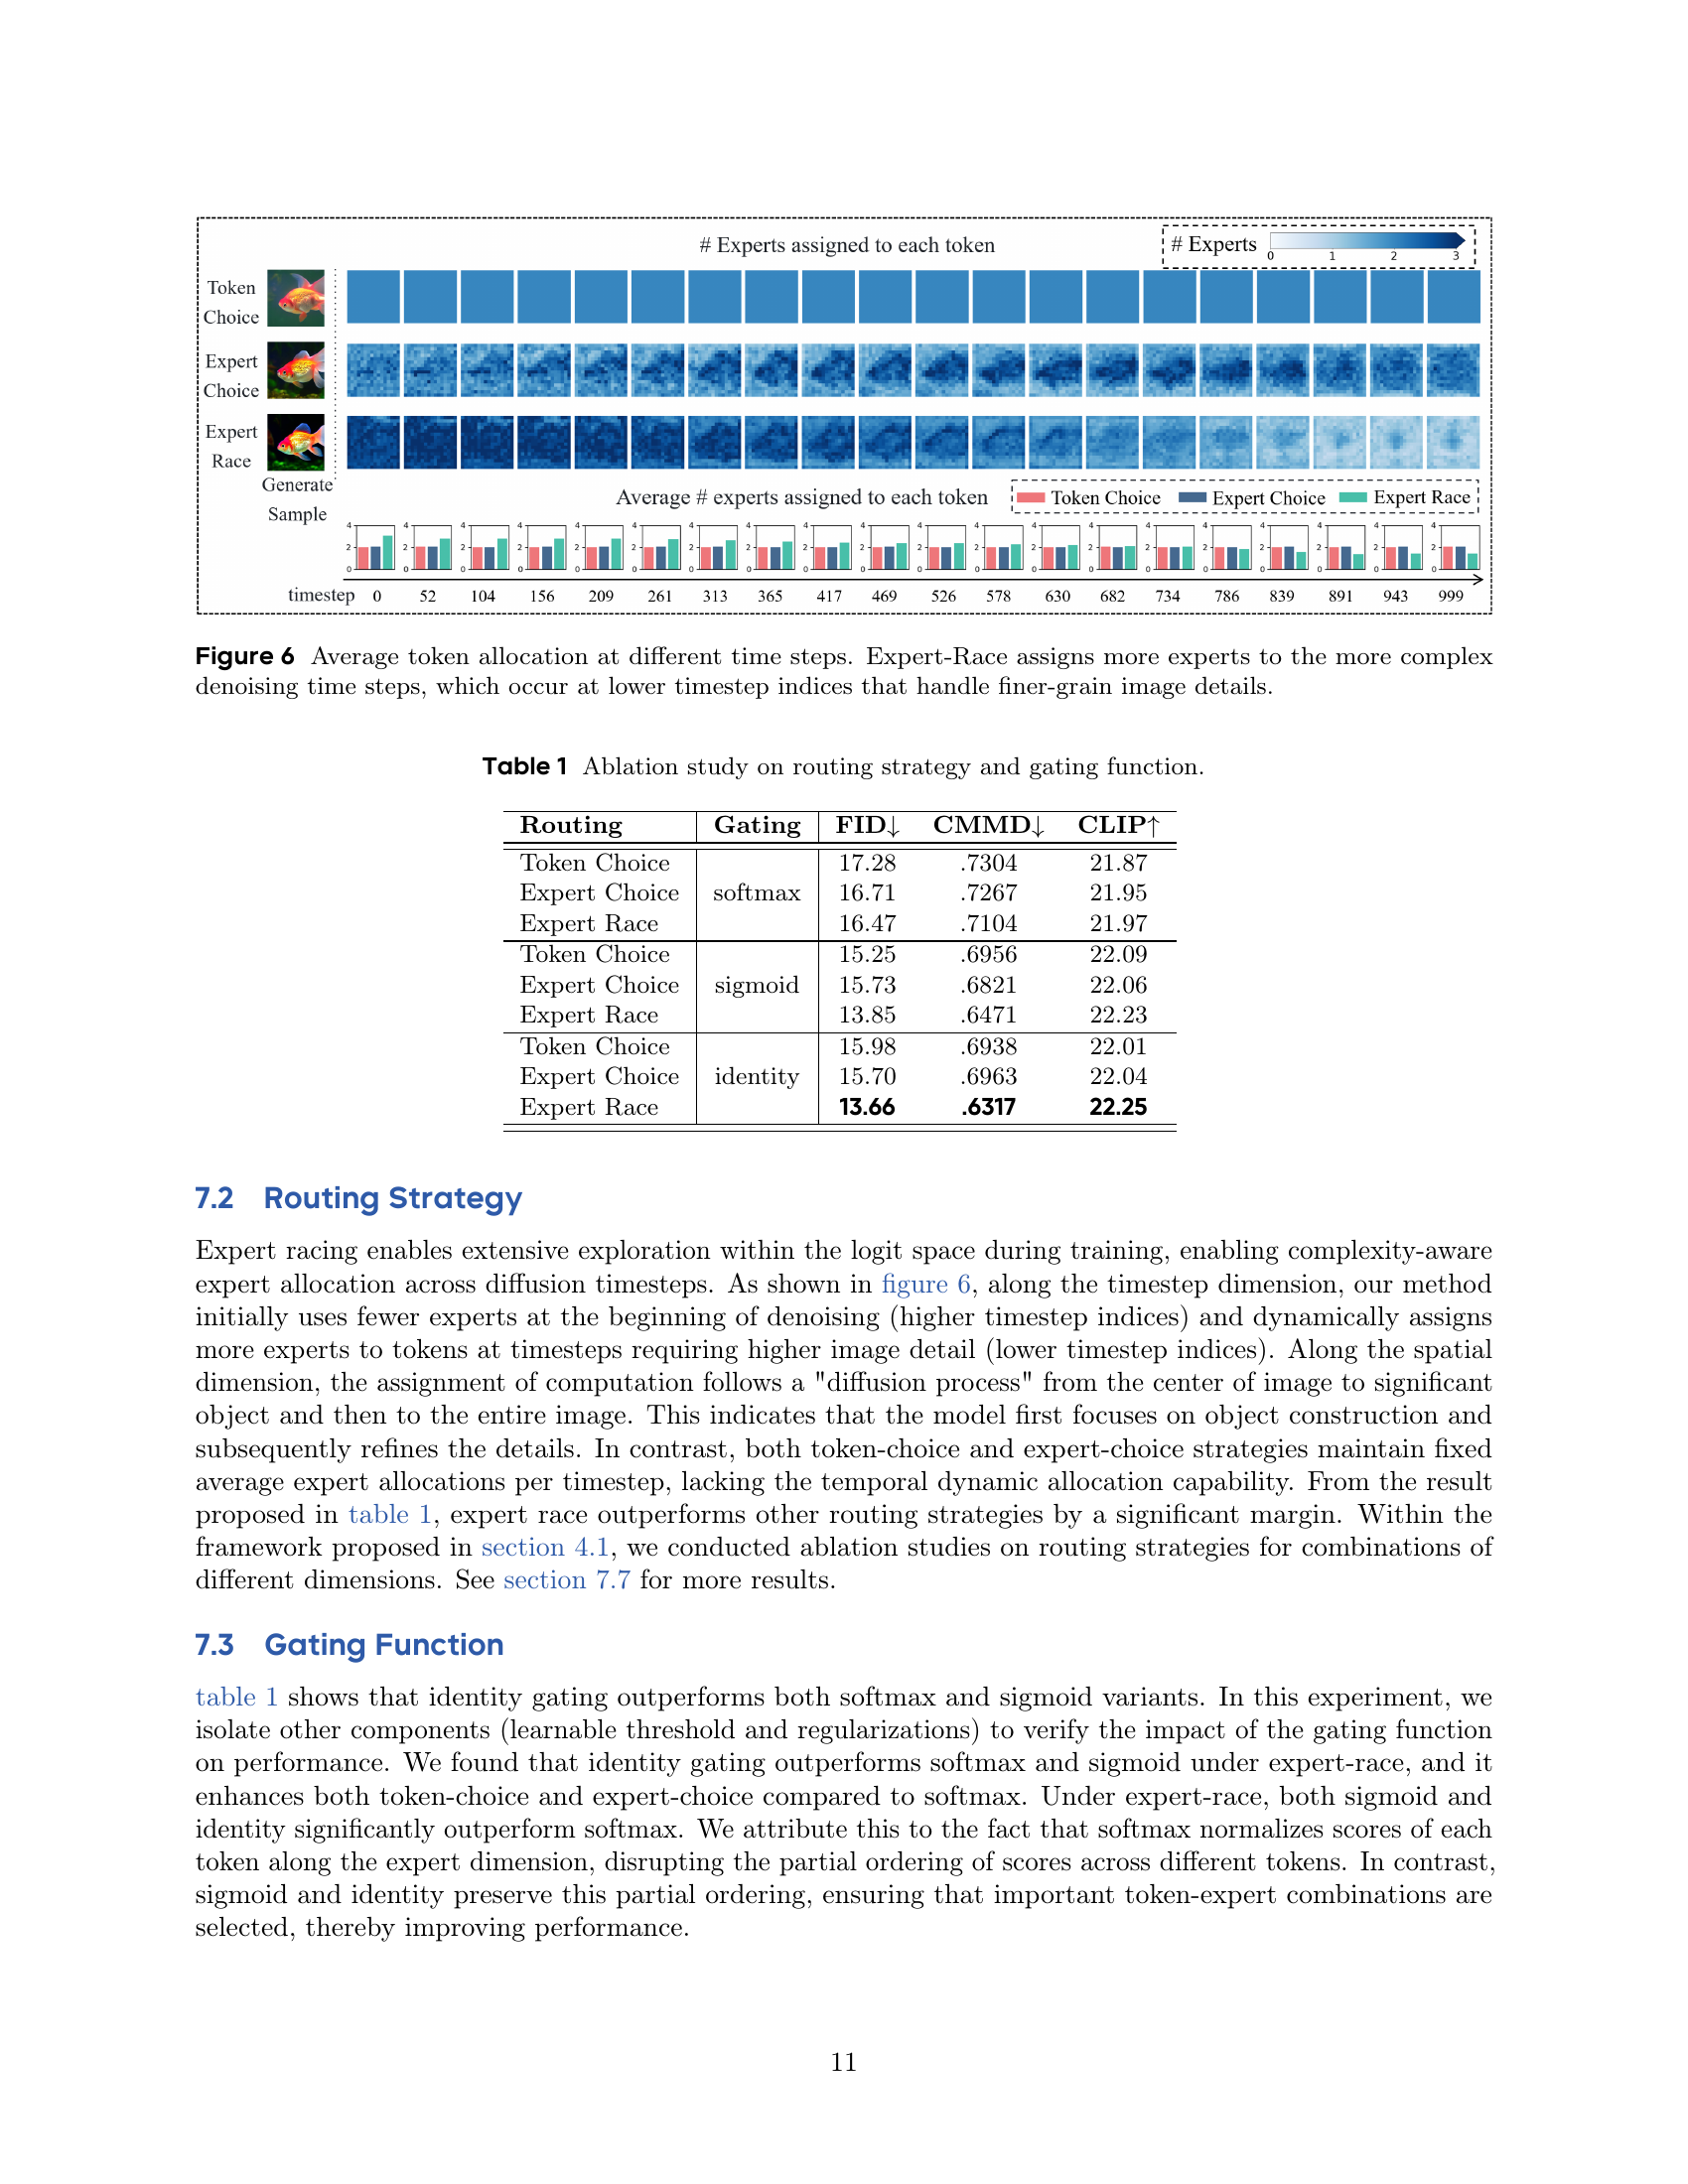
🔼 This figure visualizes the dynamic allocation of experts across different time steps during the image denoising process in the Expert Race model. It shows that the Expert Race method intelligently assigns a higher number of experts to the more challenging time steps, which are those earlier in the process (represented by lower timestep indices) that are focused on generating finer image details. In contrast to other methods, Expert Race adapts the number of experts based on the complexity of the task at each step, allowing for more efficient resource utilization.
read the caption
Figure 6: Average token allocation at different time steps. Expert-Race assigns more experts to the more complex denoising time steps, which occur at lower timestep indices that handle finer-grain image details.

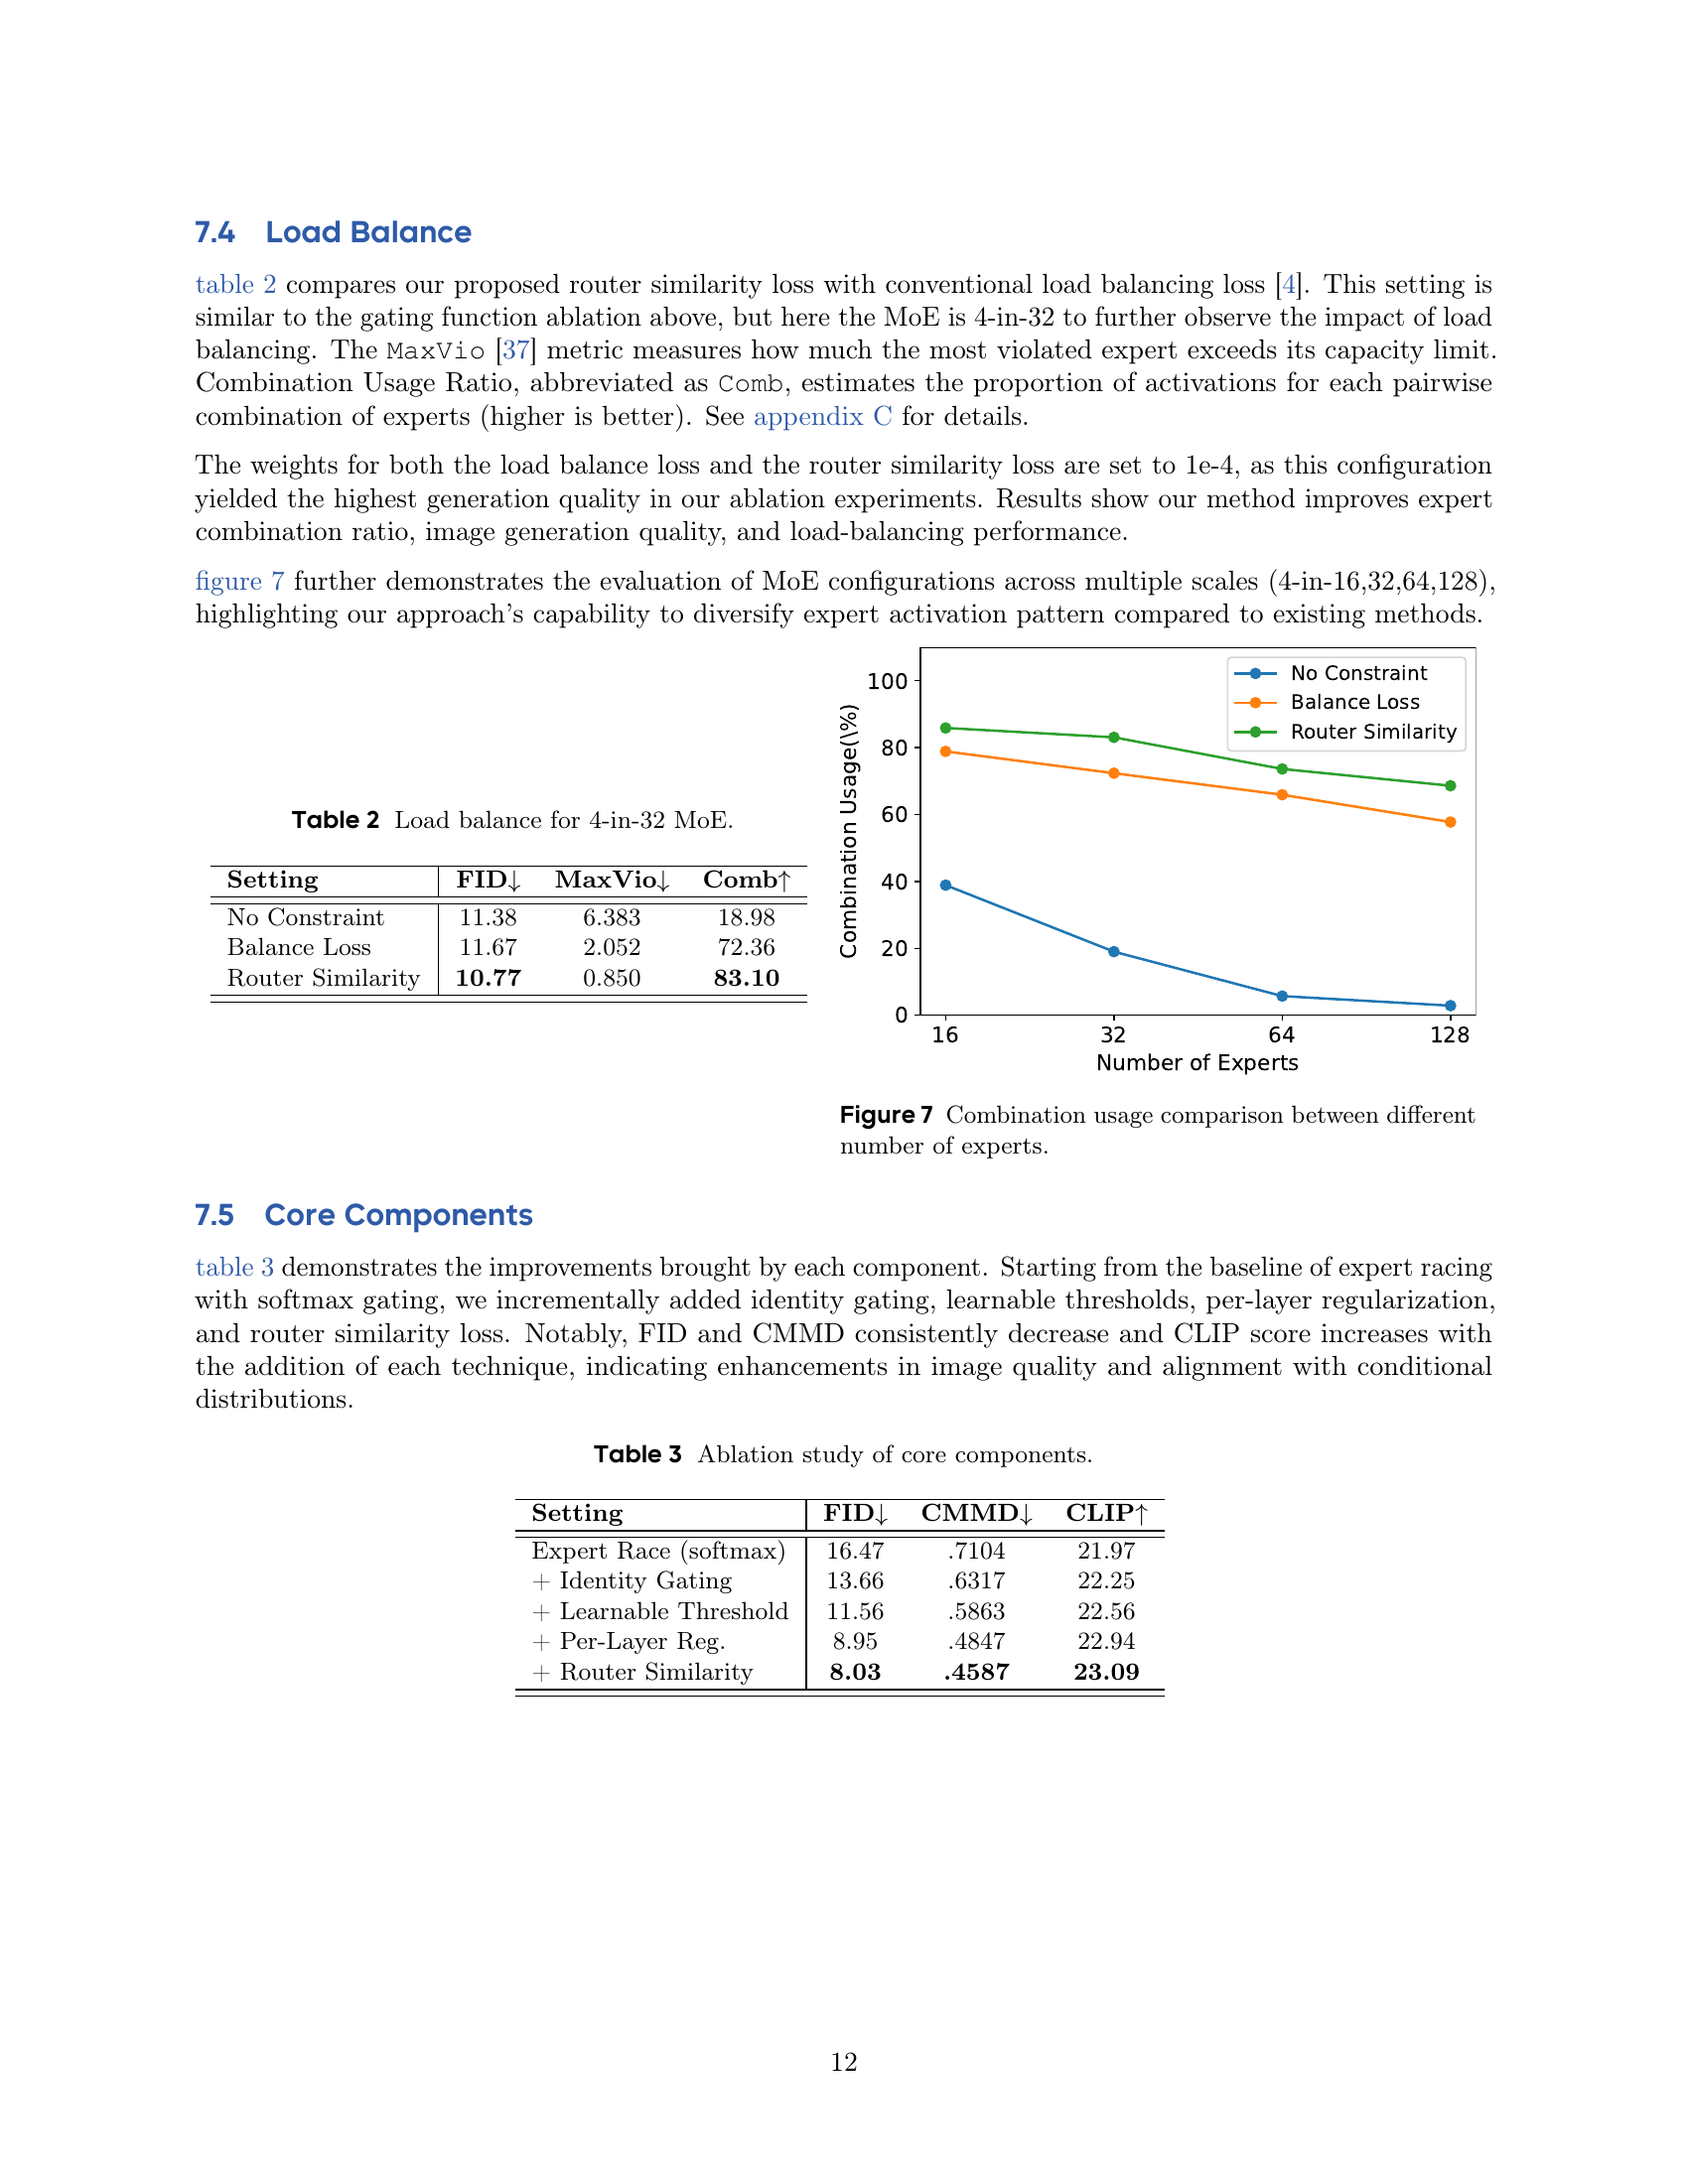
🔼 This figure shows the effectiveness of the proposed router similarity loss in promoting diversity among expert activations. It compares the usage of expert combinations (pairs of experts activated together) across different model sizes, varying the number of experts from 16 to 128. The models incorporating the router similarity loss show significantly higher combination usage than those without, indicating a more diverse and efficient use of experts. The models using the standard balance loss fall between those with no constraint and the router similarity loss.
read the caption
Figure 7: Combination usage comparison between different number of experts.

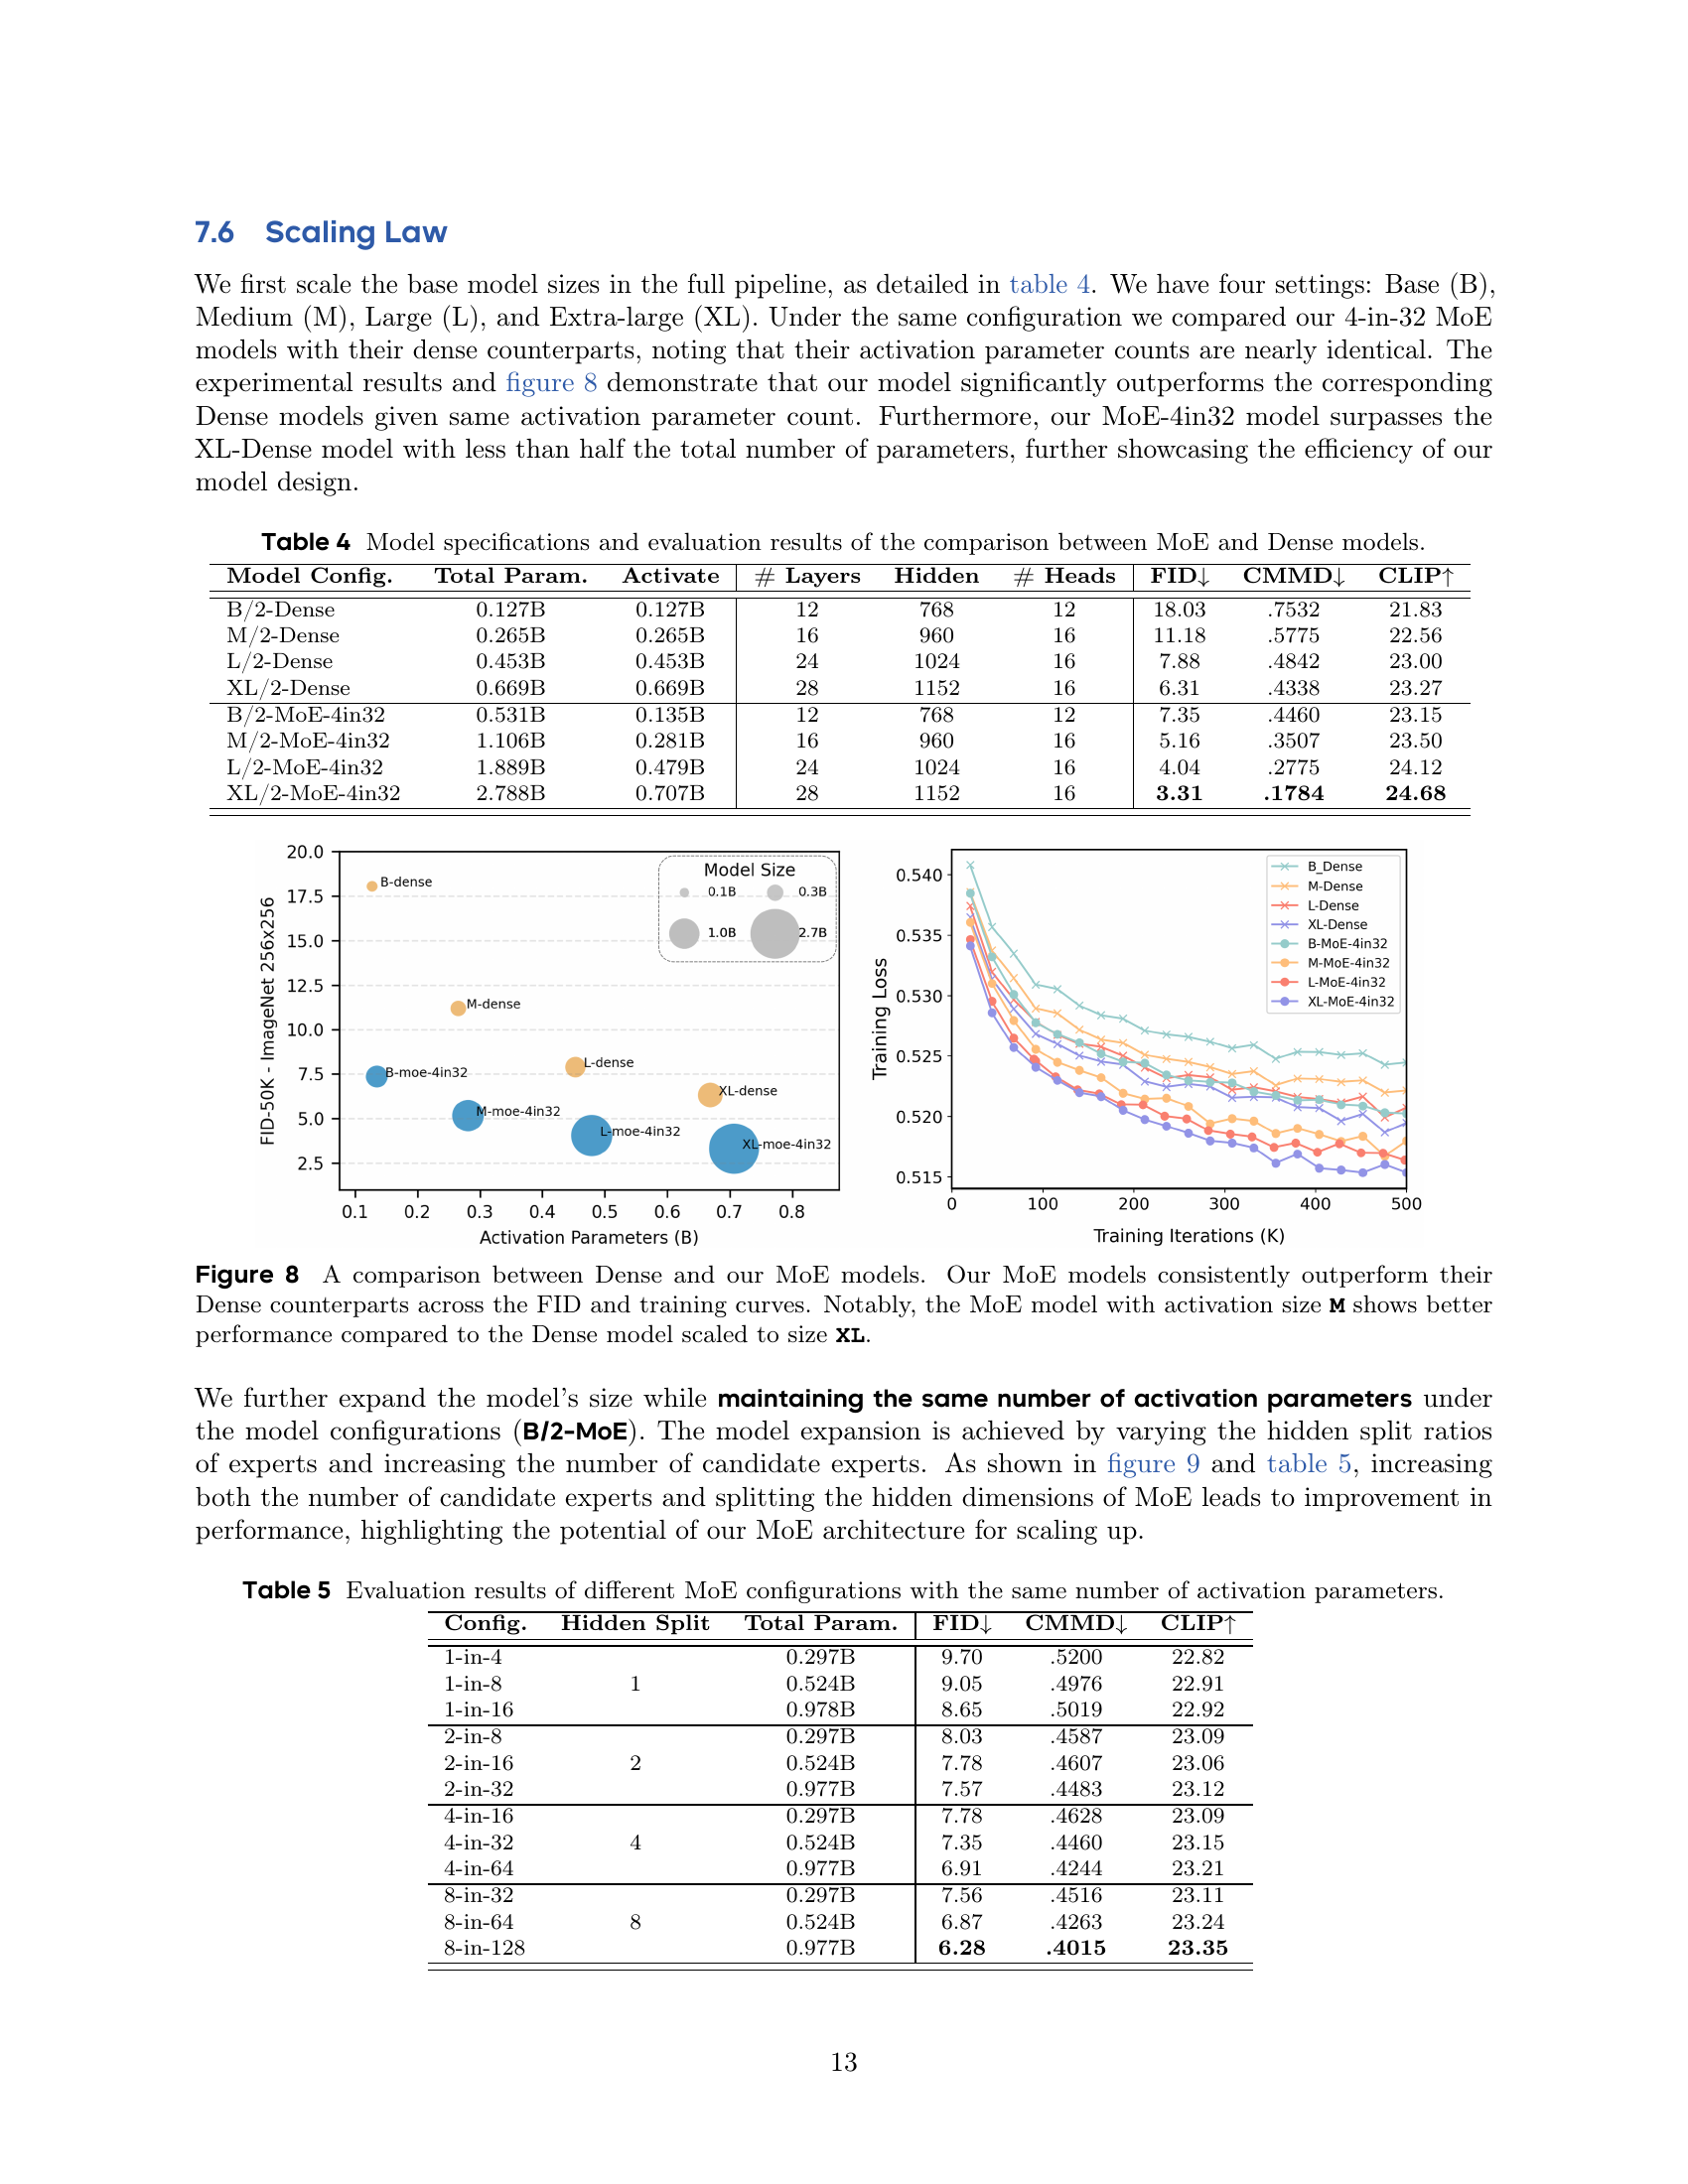
🔼 Figure 8 presents a comparison of the performance of dense and MoE models across different scales (Base, Medium, Large, and Extra-Large). It shows training loss curves and FID (Fréchet Inception Distance) scores for both types of models. The key takeaway is that the MoE models consistently achieve lower training loss and better FID scores compared to their dense counterparts, demonstrating improved efficiency. Furthermore, the MoE model with a medium activation size outperforms the dense model at the extra-large scale, highlighting the scalability benefits of the MoE approach.
read the caption
Figure 8: A comparison between Dense and our MoE models. Our MoE models consistently outperform their Dense counterparts across the FID and training curves. Notably, the MoE model with activation size M shows better performance compared to the Dense model scaled to size XL.

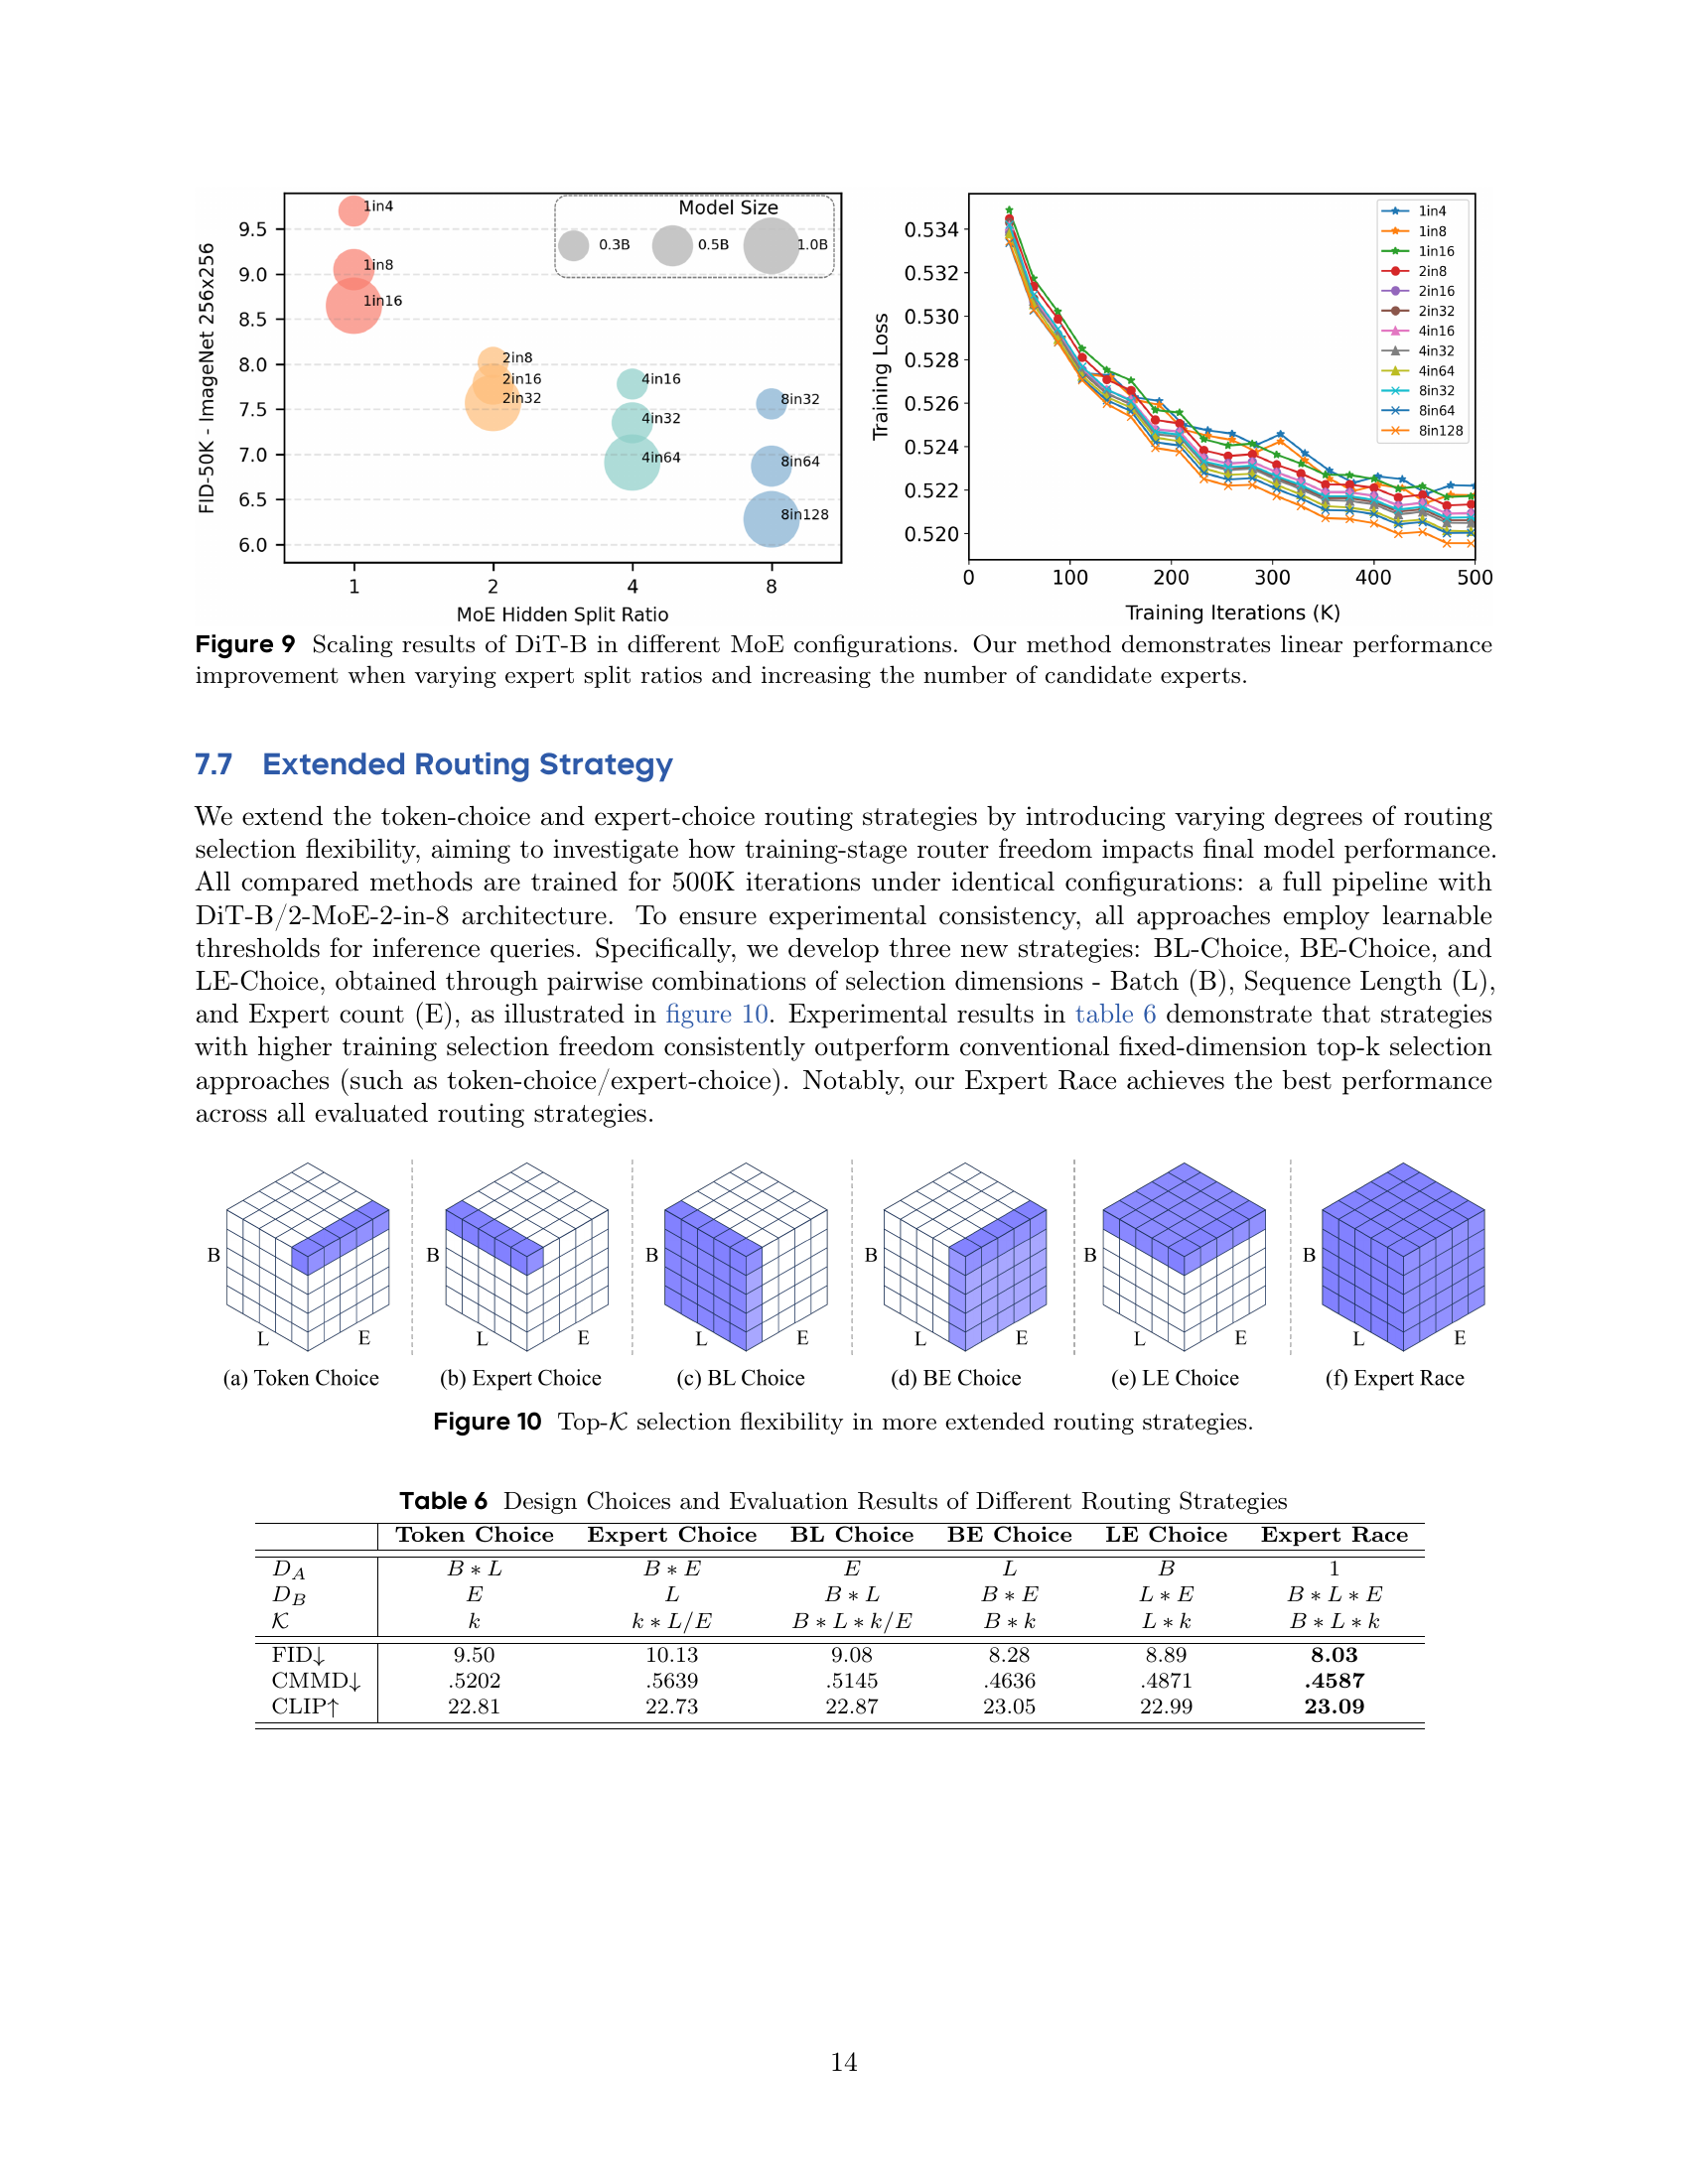
🔼 Figure 9 presents scaling experiments performed on the DiT-B model with various MoE configurations. The x-axis represents the ratio of hidden dimension split to the number of experts (hidden split ratio) while the y-axis displays the FID score (Fréchet Inception Distance), a measure of image generation quality, on the ImageNet 256x256 dataset. The different colored lines represent different MoE configurations (e.g., 1-in-4, 2-in-8, etc.), where ‘x-in-y’ indicates that ‘x’ experts are activated out of ‘y’ candidates. The results show a roughly linear decrease in FID scores (improvement in image quality) as the model size increases by adjusting either the number of candidate experts or the split ratio. This demonstrates that the proposed Expert Race method scales effectively and achieves consistent improvement in performance.
read the caption
Figure 9: Scaling results of DiT-B in different MoE configurations. Our method demonstrates linear performance improvement when varying expert split ratios and increasing the number of candidate experts.

🔼 This figure illustrates different routing strategies used in Mixture of Experts (MoE) models. It compares the flexibility of selecting the top-k tokens and experts in the model. (a) shows Token Choice which selects top-k experts for each token independently. (b) shows Expert Choice which selects top-k tokens for each expert independently. (c) to (e) expand the selection flexibility by choosing the top-k experts in various combinations of batch, sequence length, and experts. (f) Expert Race which selects top-k across the entire set, offering the maximum flexibility.
read the caption
Figure 10: Top-𝒦𝒦\mathcal{K}caligraphic_K selection flexibility in more extended routing strategies.

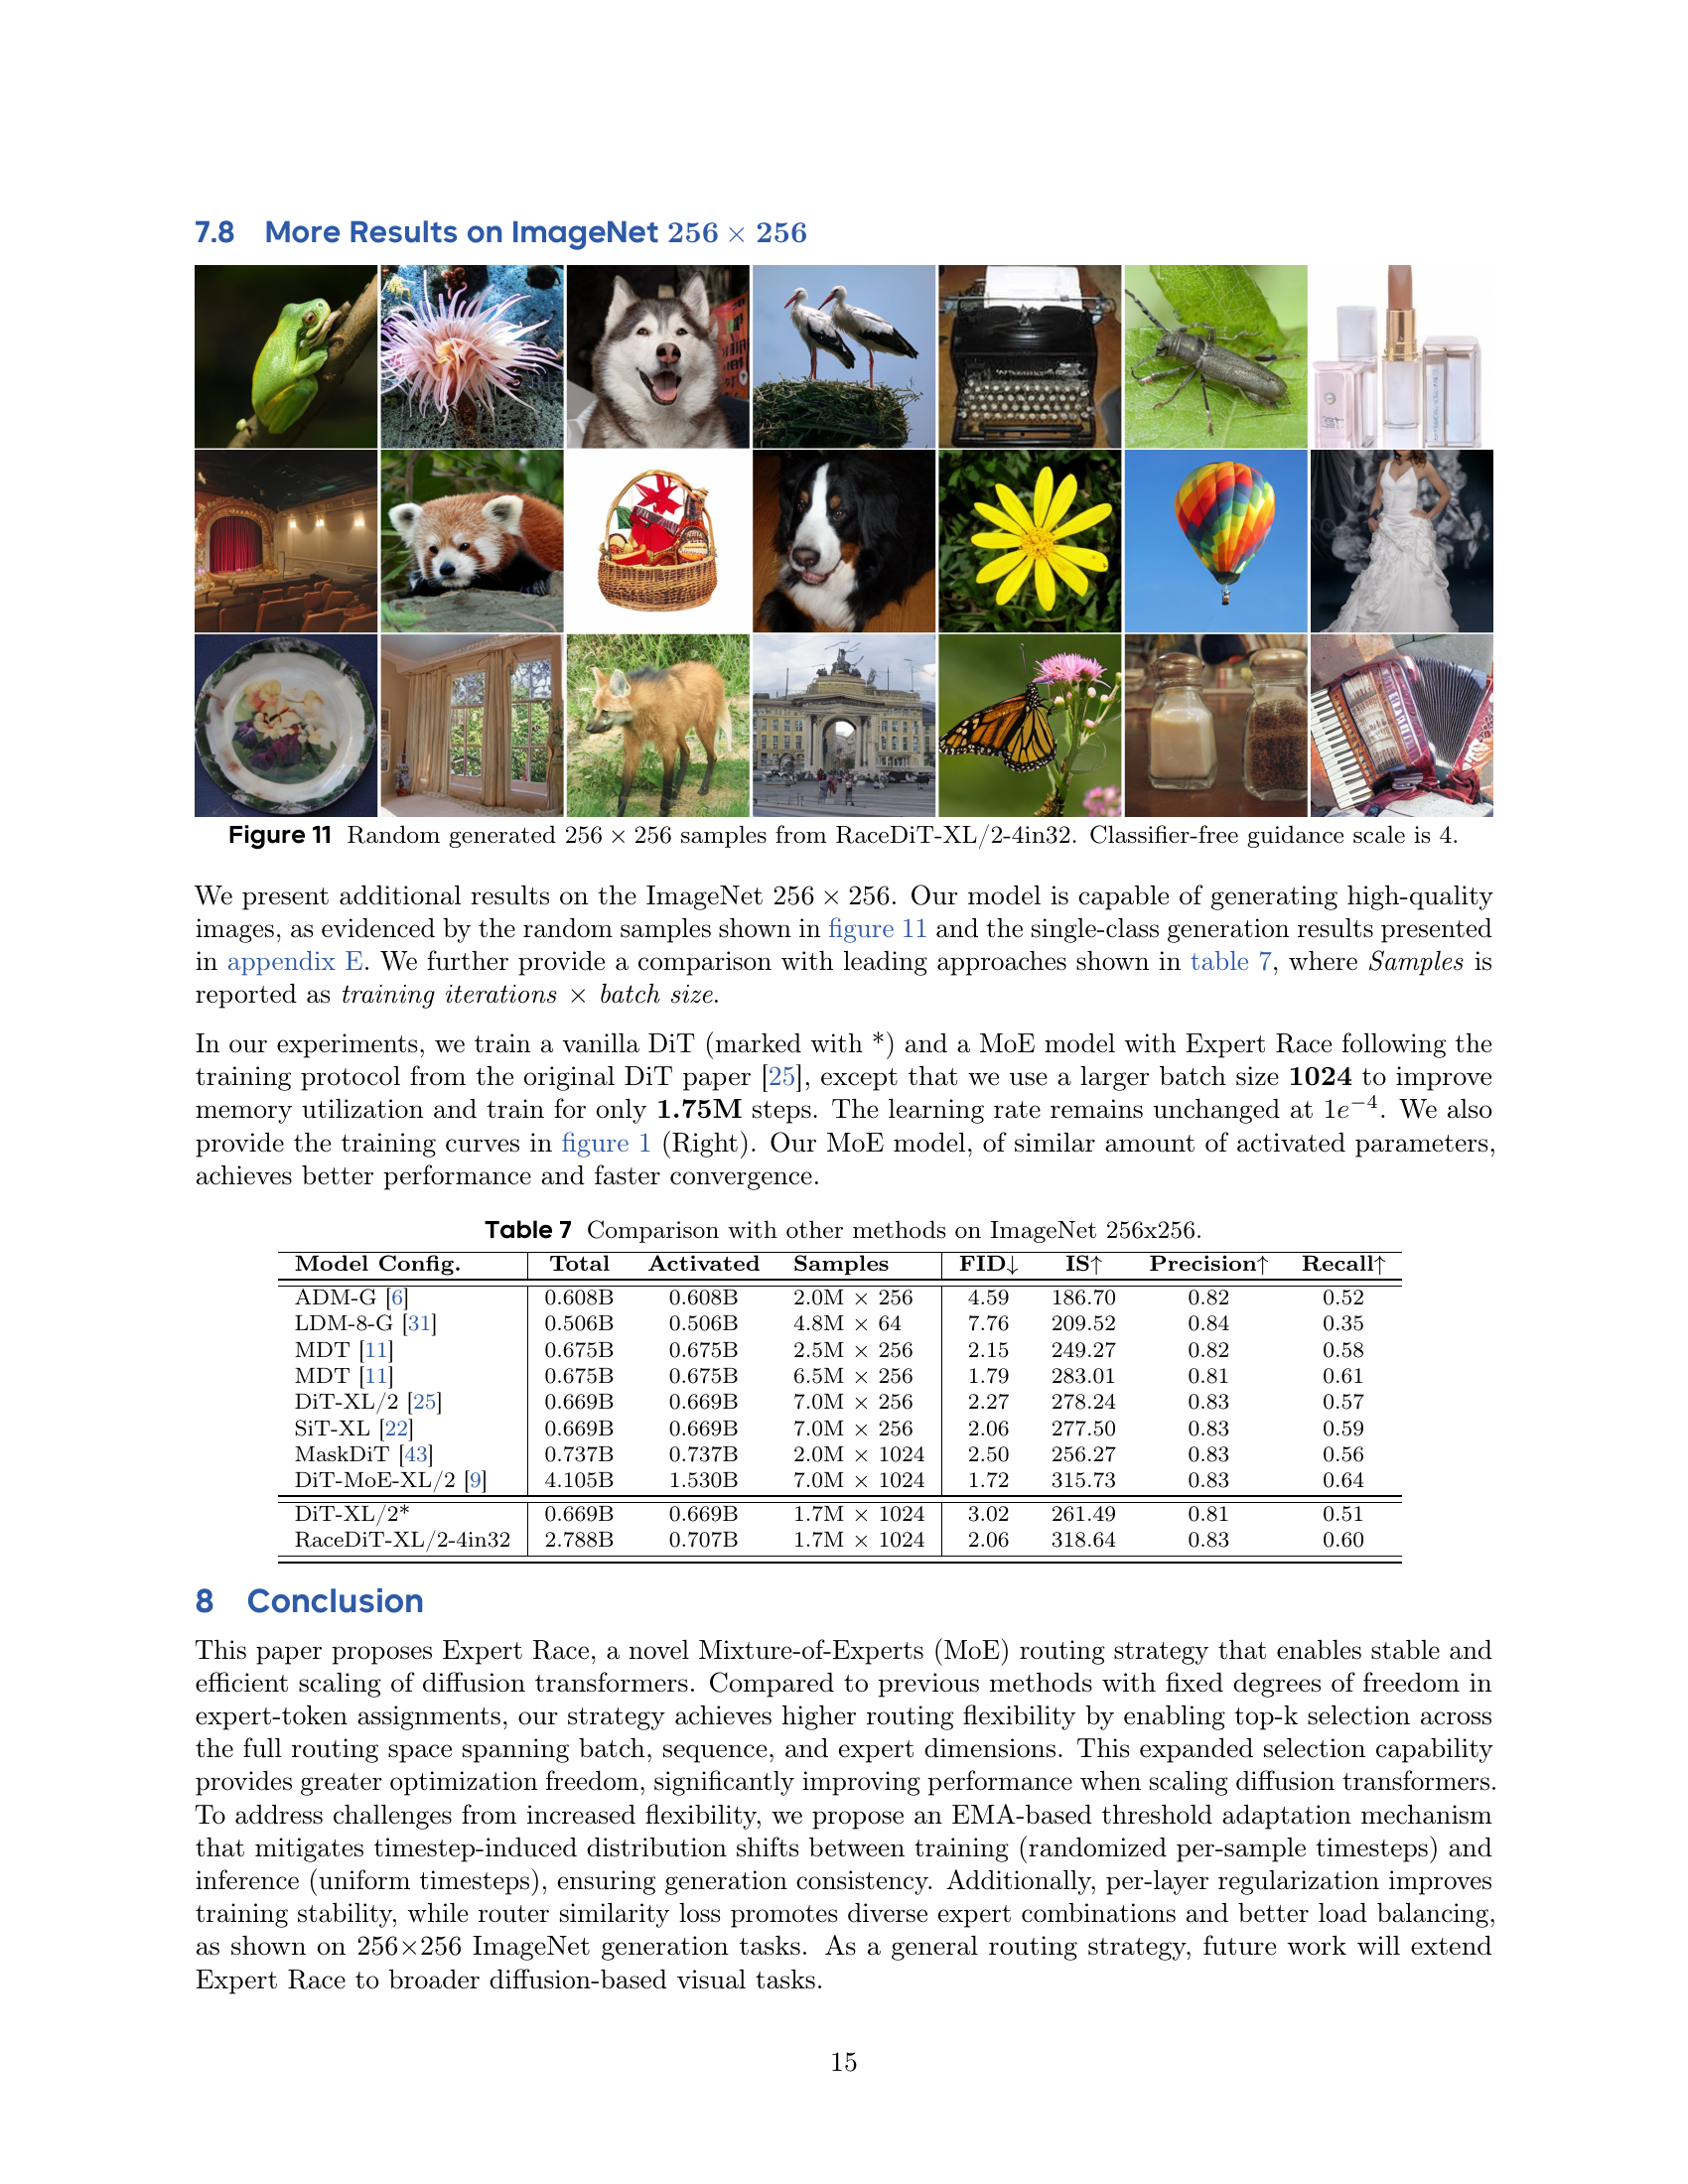
🔼 This figure displays several 256x256 images generated by the RaceDiT-XL/2-4in32 model. The model uses a Mixture-of-Experts (MoE) architecture, and the images demonstrate the model’s ability to generate diverse and high-quality images. A classifier-free guidance scale of 4 was used during generation.
read the caption
Figure 11: Random generated 256×256256256256\times 256256 × 256 samples from RaceDiT-XL/2-4in32. Classifier-free guidance scale is 4.

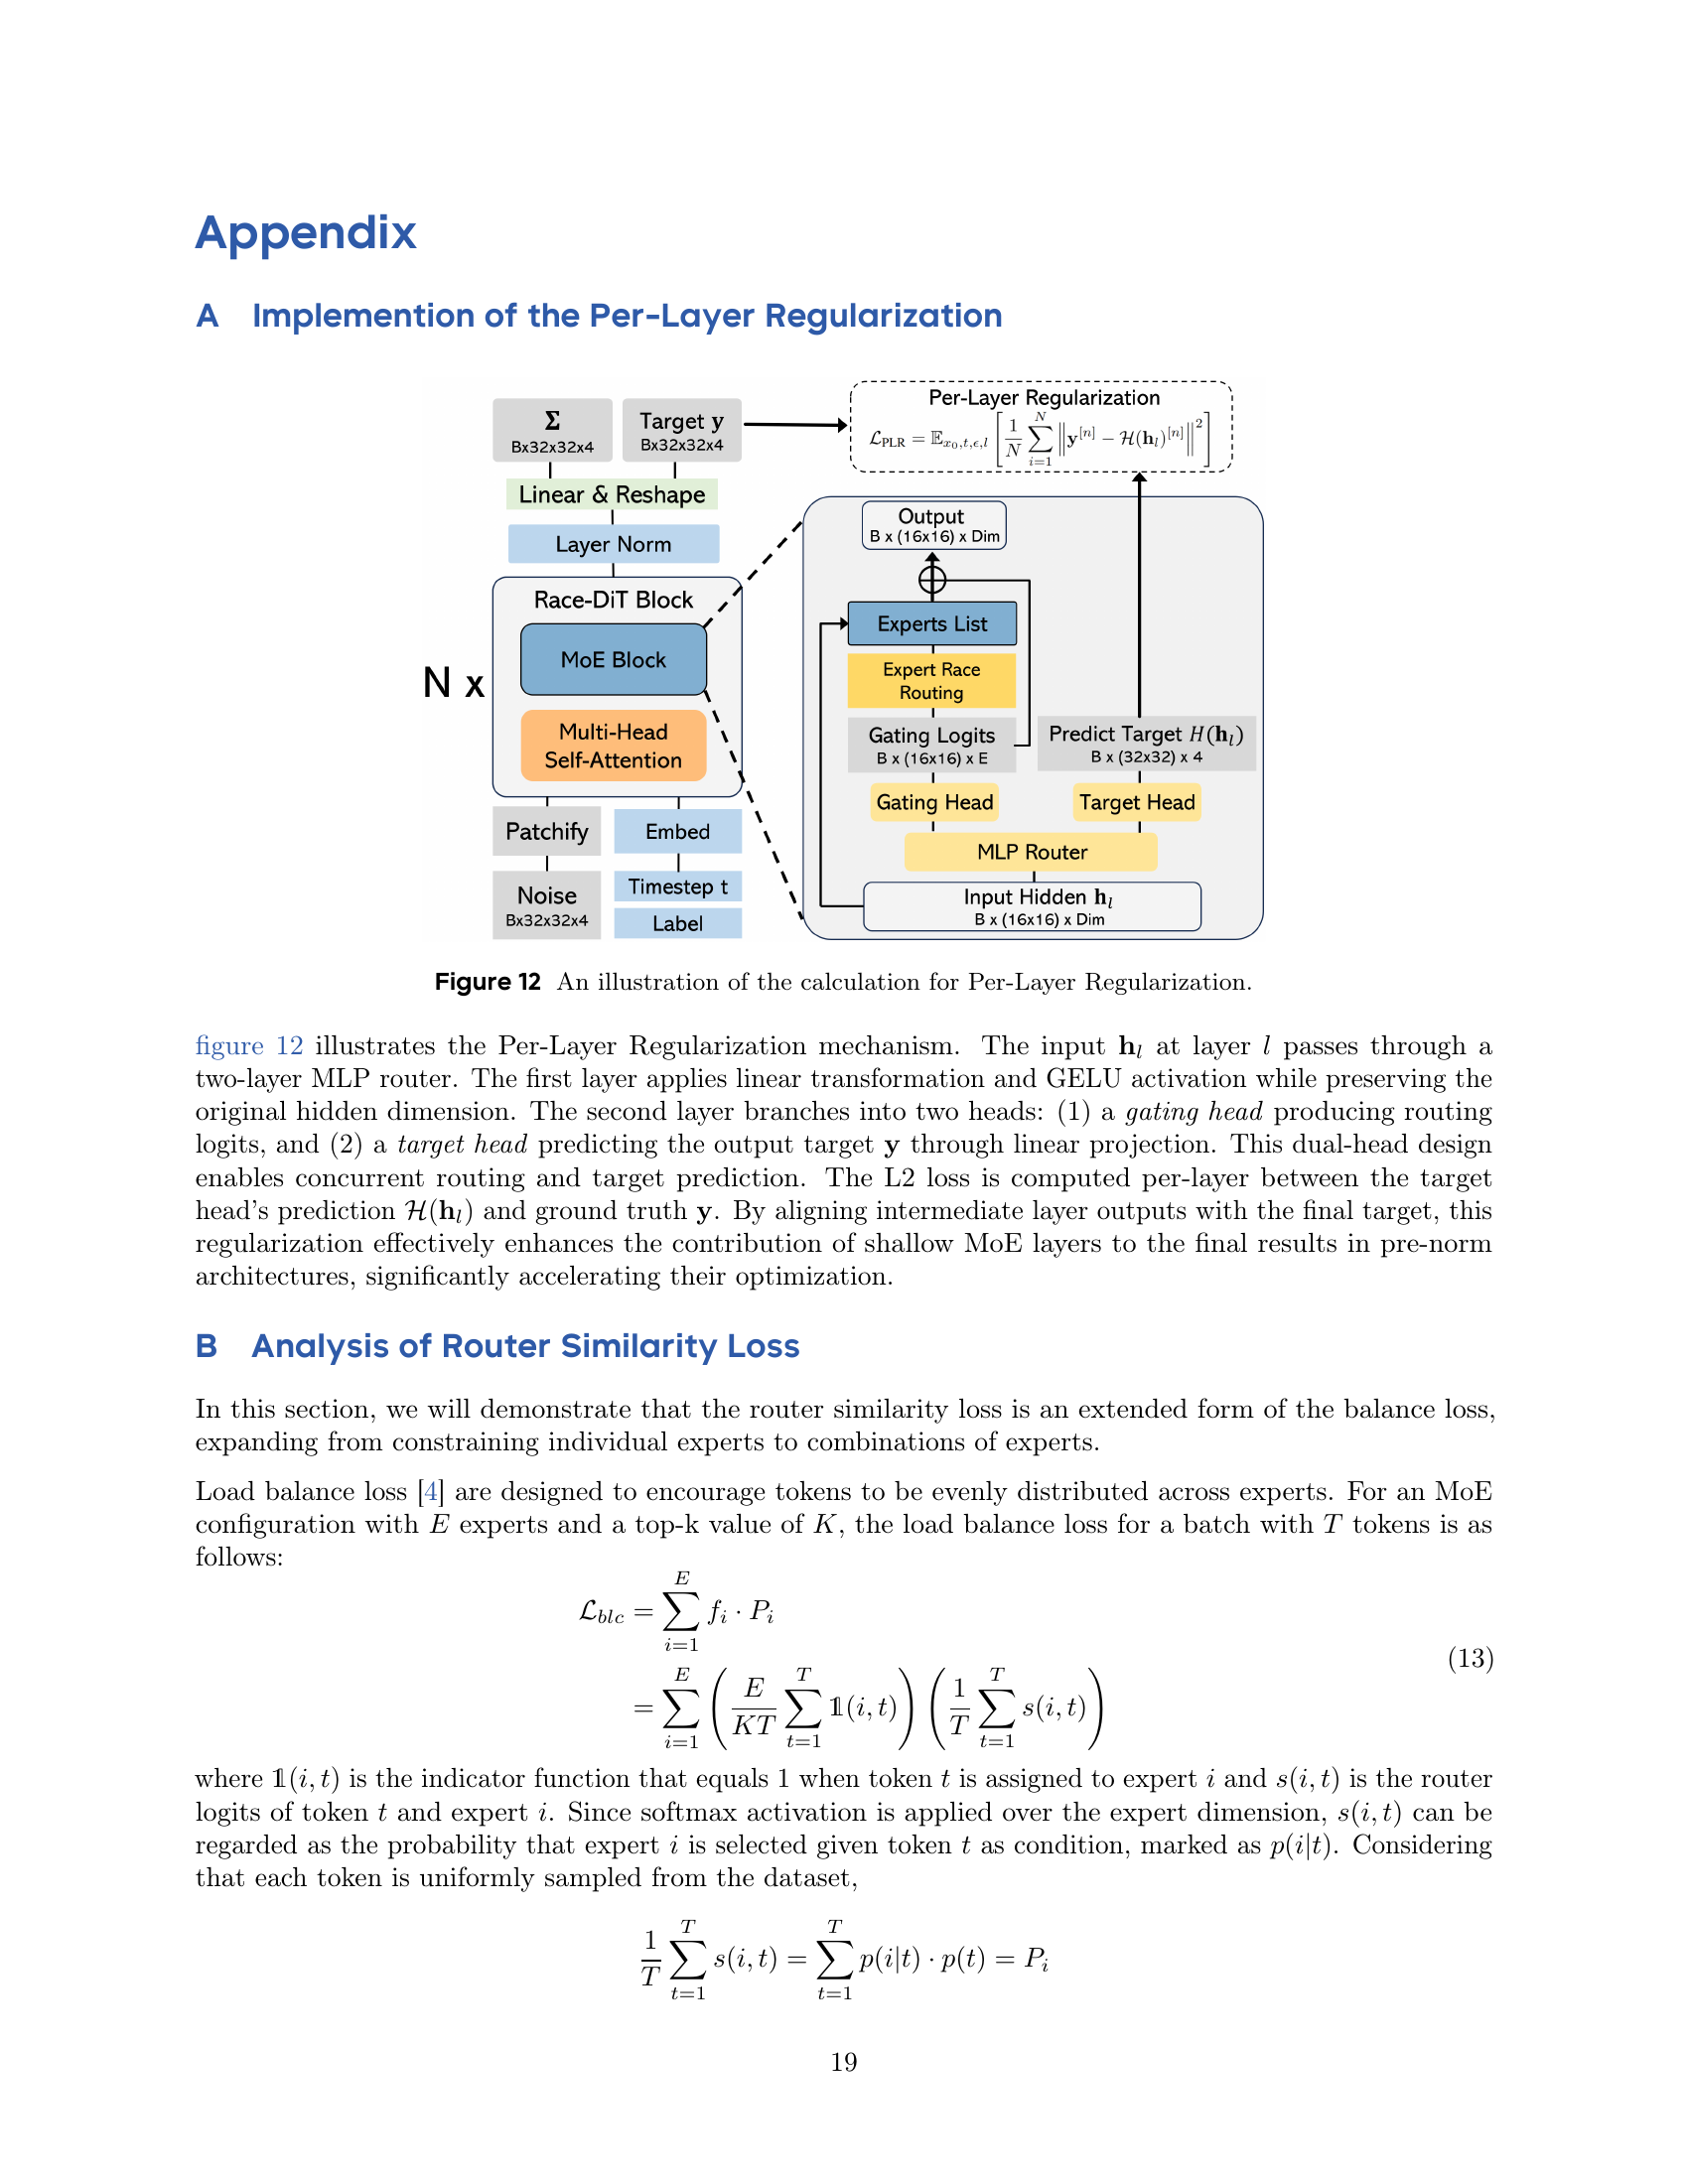
🔼 This figure illustrates the Per-Layer Regularization (PLR) method. The input (hidden activation, hᵢ) from layer i is fed into a two-layer Multi-Layer Perceptron (MLP) router. The first layer performs a linear transformation and GELU activation, maintaining the original hidden dimension. The second layer splits into two branches: a gating head that produces routing logits for the MoE, and a target head which makes a prediction of the final target (y). The L2 loss between the prediction from the target head (H(hᵢ)) and the ground truth target (y) is calculated for each layer. This process aligns intermediate layer outputs with the final target, improving the optimization of the shallow MoE layers. This addresses the issue of shallower layers lagging behind deeper layers in training due to adaLN’s amplification of deeper layer outputs.
read the caption
Figure 12: An illustration of the calculation for Per-Layer Regularization.

🔼 This figure illustrates the process of calculating the Combination Usage metric. This metric quantifies the diversity of expert pairings used in the model. It starts by creating a histogram showing the frequency of each unique pair of experts activated together across all tokens. These counts are then sorted in descending order and normalized to obtain a sorted normalized histogram. Finally, a cumulative sum is computed, and the percentage of combinations whose cumulative sum is less than 95% is calculated and reported as the Combination Usage. This value indicates the proportion of commonly activated expert pairs, thus reflecting the degree of diversity in how experts are used.
read the caption
Figure 13: Compute process of Combination Usage.

🔼 This figure compares the training curves of the DiT-MoE model from a related work [9] and the proposed RaceDiT model. It shows the training loss plotted against the number of training iterations. The comparison illustrates the relative training speed and efficiency of the two models. The RaceDiT model appears to converge faster to a lower loss than DiT-MoE, suggesting improved training performance.
read the caption
Figure 14: Training curve comparisons between DiT-MoE [9] and our model.

🔼 This figure displays several images of macaws generated by the RaceDiT-XL/2-4in32 model. The images are 256x256 pixels, generated with a classifier-free guidance scale of 4.0. The model successfully generates a variety of macaw images with different poses and backgrounds, demonstrating its ability to produce high-quality and diverse outputs. The label ‘Macaw (88)’ indicates the class ID of 88 used for conditional generation.
read the caption
Figure 15: Samples from RaceDiT-XL/2-4in32 (256×256256256256\times 256256 × 256). Classifier-free guidance: 4.0 Label: Macaw (88)

🔼 This figure displays several images of loggerhead turtles generated by the RaceDiT-XL/2-4in32 model, a Mixture of Experts (MoE) model for diffusion transformers. The images are 256x256 pixels. The model utilized a classifier-free guidance scale of 4.0 during generation. The ’loggerhead turtle’ label was used as a prompt to guide the generation process.
read the caption
Figure 16: Samples from RaceDiT-XL/2-4in32 (256×256256256256\times 256256 × 256). Classifier-free guidance: 4.0 Label: loggerhead turtle (33)

🔼 This figure displays a sample of images generated by the RaceDiT-XL/2-4in32 model, which is a Mixture of Experts (MoE) diffusion model. The images are 256x256 pixels and the classifier-free guidance scale was set to 4.0. All the images in the sample depict lions, showcasing the model’s ability to generate high-quality images of a specific class.
read the caption
Figure 17: Samples from RaceDiT-XL/2-4in32 (256×256256256256\times 256256 × 256). Classifier-free guidance: 4.0 Label: lion (291)

🔼 This figure displays sample images generated by the RaceDiT-XL/2-4in32 model, a diffusion transformer model employing the Expert Race routing strategy. The images are 256x256 pixels and were generated using a classifier-free guidance scale of 4.0. The specific label used for generation is ’lesser panda’ (class ID 387). The figure showcases the model’s ability to generate high-quality, realistic images of lesser pandas.
read the caption
Figure 18: Samples from RaceDiT-XL/2-4in32 (256×256256256256\times 256256 × 256). Classifier-free guidance: 4.0 Label: lesser panda (387)

🔼 This figure displays several images generated by the RaceDiT-XL/2-4in32 model, a diffusion model that utilizes a Mixture of Experts (MoE) architecture. The images are all 256x256 pixels in size and were generated with a classifier-free guidance scale of 4.0. The specific label used for generating these examples was ‘convertible’ (ImageNet class ID 511). This showcases the model’s ability to generate high-quality and diverse images of convertibles.
read the caption
Figure 19: Samples from RaceDiT-XL/2-4in32 (256×256256256256\times 256256 × 256). Classifier-free guidance: 4.0 Label: convertible (511)

🔼 This figure displays a set of images generated by the RaceDiT-XL/2-4in32 model, a Mixture-of-Experts (MoE) diffusion model. The images are 256x256 pixels in size and are conditioned on the label ‘balloon’ (class ID 417). The classifier-free guidance scale used was 4.0. The figure visually demonstrates the model’s ability to generate diverse and realistic images of hot air balloons.
read the caption
Figure 20: Samples from RaceDiT-XL/2-4in32(256×256256256256\times 256256 × 256). Classifier-free guidance: 4.0 Label: balloon (417)
More on tables
| Routing | Gating | FID | CMMD | CLIP |
| Token Choice | softmax | 17.28 | .7304 | 21.87 |
| Expert Choice | 16.71 | .7267 | 21.95 | |
| Expert Race | 16.47 | .7104 | 21.97 | |
| Token Choice | sigmoid | 15.25 | .6956 | 22.09 |
| Expert Choice | 15.73 | .6821 | 22.06 | |
| Expert Race | 13.85 | .6471 | 22.23 | |
| Token Choice | identity | 15.98 | .6938 | 22.01 |
| Expert Choice | 15.70 | .6963 | 22.04 | |
| Expert Race | 13.66 | .6317 | 22.25 |
🔼 This table presents an ablation study comparing the performance of different load balancing strategies within a Mixture-of-Experts (MoE) model with a 4-in-32 configuration. It shows the FID (Fréchet Inception Distance) score, the maximum violation (MaxVio) of expert capacity, and the combination usage (Comb) for three settings: no constraint, the use of a balance loss, and the use of the proposed router similarity loss. Lower FID indicates better image generation quality, lower MaxVio indicates better load balance, and higher Comb indicates more diverse utilization of expert combinations. The results demonstrate that the proposed router similarity loss achieves the best balance between FID score and load balance.
read the caption
Table 2: Load balance for 4-in-32 MoE.
| Setting | FID | MaxVio | Comb |
| No Constraint | 11.38 | 6.383 | 18.98 |
| Balance Loss | 11.67 | 2.052 | 72.36 |
| Router Similarity | 10.77 | 0.850 | 83.10 |
🔼 This table presents the results of an ablation study examining the impact of individual components on the performance of the Expert Race model. It shows how adding each component (identity gating, learnable threshold, per-layer regularization, and router similarity loss) incrementally improves the model’s performance, as measured by FID, CMMD, and CLIP scores. The baseline model uses Expert Race with softmax gating, and subsequent rows add one component at a time to show its contribution.
read the caption
Table 3: Ablation study of core components.
| Setting | FID | CMMD | CLIP |
| Expert Race (softmax) | 16.47 | .7104 | 21.97 |
| + Identity Gating | 13.66 | .6317 | 22.25 |
| + Learnable Threshold | 11.56 | .5863 | 22.56 |
| + Per-Layer Reg. | 8.95 | .4847 | 22.94 |
| + Router Similarity | 8.03 | .4587 | 23.09 |
🔼 This table presents a comparison of model performance between Mixture-of-Experts (MoE) and dense models of varying sizes. It details the number of parameters, activated parameters, layers, hidden units, heads, and evaluation metrics (FID, CMMD, and CLIP) for each model configuration. The results demonstrate the effectiveness of the MoE approach in achieving comparable or better performance while using significantly fewer parameters than the equivalent dense models.
read the caption
Table 4: Model specifications and evaluation results of the comparison between MoE and Dense models.
| Model Config. | Total Param. | Activate | # Layers | Hidden | # Heads | FID | CMMD | CLIP |
| B/2-Dense | 0.127B | 0.127B | 12 | 768 | 12 | 18.03 | .7532 | 21.83 |
| M/2-Dense | 0.265B | 0.265B | 16 | 960 | 16 | 11.18 | .5775 | 22.56 |
| L/2-Dense | 0.453B | 0.453B | 24 | 1024 | 16 | 7.88 | .4842 | 23.00 |
| XL/2-Dense | 0.669B | 0.669B | 28 | 1152 | 16 | 6.31 | .4338 | 23.27 |
| B/2-MoE-4in32 | 0.531B | 0.135B | 12 | 768 | 12 | 7.35 | .4460 | 23.15 |
| M/2-MoE-4in32 | 1.106B | 0.281B | 16 | 960 | 16 | 5.16 | .3507 | 23.50 |
| L/2-MoE-4in32 | 1.889B | 0.479B | 24 | 1024 | 16 | 4.04 | .2775 | 24.12 |
| XL/2-MoE-4in32 | 2.788B | 0.707B | 28 | 1152 | 16 | 3.31 | .1784 | 24.68 |
🔼 This table presents the findings of an ablation study on various configurations of the Mixture of Experts (MoE) model, focusing on scalability. It maintains a consistent number of activated parameters across different model variations. The variations involve changing the number of experts and how the hidden layer dimensions are split among those experts. The goal is to assess how different configurations with the same activation parameter count influence the model’s performance as measured by FID, CMMD, and CLIP scores. This helps to understand the impact of MoE configuration choices on efficiency and performance gains during scaling.
read the caption
Table 5: Evaluation results of different MoE configurations with the same number of activation parameters.
| Config. | Hidden Split | Total Param. | FID | CMMD | CLIP |
| 1-in-4 | 1 | 0.297B | 9.70 | .5200 | 22.82 |
| 1-in-8 | 0.524B | 9.05 | .4976 | 22.91 | |
| 1-in-16 | 0.978B | 8.65 | .5019 | 22.92 | |
| 2-in-8 | 2 | 0.297B | 8.03 | .4587 | 23.09 |
| 2-in-16 | 0.524B | 7.78 | .4607 | 23.06 | |
| 2-in-32 | 0.977B | 7.57 | .4483 | 23.12 | |
| 4-in-16 | 4 | 0.297B | 7.78 | .4628 | 23.09 |
| 4-in-32 | 0.524B | 7.35 | .4460 | 23.15 | |
| 4-in-64 | 0.977B | 6.91 | .4244 | 23.21 | |
| 8-in-32 | 8 | 0.297B | 7.56 | .4516 | 23.11 |
| 8-in-64 | 0.524B | 6.87 | .4263 | 23.24 | |
| 8-in-128 | 0.977B | 6.28 | .4015 | 23.35 |
🔼 This table presents a comparison of different routing strategies used in the Mixture of Experts (MoE) model for diffusion transformers. It shows the impact of varying the dimensions considered during top-k selection in the routing process, examining the trade-offs between flexibility and performance. The strategies range from conventional methods like token-choice and expert-choice to the proposed Expert Race and new variations combining different choices of dimensions (batch size, sequence length, and number of experts). Evaluation metrics include FID (Fréchet Inception Distance), CMMD (Classifier-based Multi-Metric Distance), and CLIP (Contrastive Language–Image Pre-training) score, providing a comprehensive assessment of image generation quality.
read the caption
Table 6: Design Choices and Evaluation Results of Different Routing Strategies
| Token Choice | Expert Choice | BL Choice | BE Choice | LE Choice | Expert Race | |
| FID | 9.50 | 10.13 | 9.08 | 8.28 | 8.89 | 8.03 |
| CMMD | .5202 | .5639 | .5145 | .4636 | .4871 | .4587 |
| CLIP | 22.81 | 22.73 | 22.87 | 23.05 | 22.99 | 23.09 |
🔼 This table presents a comparison of the RaceDiT model’s performance against other state-of-the-art diffusion models on the ImageNet 256x256 dataset. The comparison includes several key metrics: FID (Fréchet Inception Distance), IS (Inception Score), Precision, and Recall. Lower FID scores indicate better image quality, while higher IS scores, precision, and recall suggest better sample diversity and fidelity. The table also lists the total and activated parameters of each model, as well as the number of samples used in the evaluation. This allows for a comprehensive comparison of model performance considering factors such as model size and training resources.
read the caption
Table 7: Comparison with other methods on ImageNet 256x256.
| Model Config. | Total | Activated | Samples | FID | IS | Precision | Recall |
| ADM-G [6] | 0.608B | 0.608B | 2.0M 256 | 4.59 | 186.70 | 0.82 | 0.52 |
| LDM-8-G [31] | 0.506B | 0.506B | 4.8M 64 | 7.76 | 209.52 | 0.84 | 0.35 |
| MDT [11] | 0.675B | 0.675B | 2.5M 256 | 2.15 | 249.27 | 0.82 | 0.58 |
| MDT [11] | 0.675B | 0.675B | 6.5M 256 | 1.79 | 283.01 | 0.81 | 0.61 |
| DiT-XL/2 [25] | 0.669B | 0.669B | 7.0M 256 | 2.27 | 278.24 | 0.83 | 0.57 |
| SiT-XL [22] | 0.669B | 0.669B | 7.0M 256 | 2.06 | 277.50 | 0.83 | 0.59 |
| MaskDiT [43] | 0.737B | 0.737B | 2.0M 1024 | 2.50 | 256.27 | 0.83 | 0.56 |
| DiT-MoE-XL/2 [9] | 4.105B | 1.530B | 7.0M 1024 | 1.72 | 315.73 | 0.83 | 0.64 |
| DiT-XL/2* | 0.669B | 0.669B | 1.7M 1024 | 3.02 | 261.49 | 0.81 | 0.51 |
| RaceDiT-XL/2-4in32 | 2.788B | 0.707B | 1.7M 1024 | 2.06 | 318.64 | 0.83 | 0.60 |
🔼 This table compares the performance of the proposed RaceDiT model against the DiT-MoE model. It shows a comparison of total parameters, activated parameters, the number of training iterations, FID (Fréchet Inception Distance), CMMD (Classifier-Matching Distance), and CLIP scores. Lower FID and CMMD scores indicate better image generation quality, while higher CLIP scores show better alignment with textual descriptions. The results demonstrate that RaceDiT achieves comparable or better performance with fewer parameters.
read the caption
Table 8: Comparison to DiT-MoE
Full paper#