TL;DR#
Reasoning LLMs face challenges like fragmented data & black-box logic in finance, limiting real-world use. There is a need for a language model tailored for financial reasoning to address financial data, uncontrollable reasoning logic, and weak business generalization ability.
This paper introduces a financial LLM. It uses a two-stage framework: high-quality financial reasoning dataset construction and training via SFT & RL. The model demonstrates strong reasoning and decision-making for areas like compliance & robo-advisory for solving financial industry challenges.
Key Takeaways#
Why does it matter?#
This paper is vital for AI finance researchers. It introduces Fin-R1, which tackles key financial data challenges & offers a path to more accurate, interpretable financial AI. Its RL-driven approach and impressive benchmark results open new research avenues.
Visual Insights#

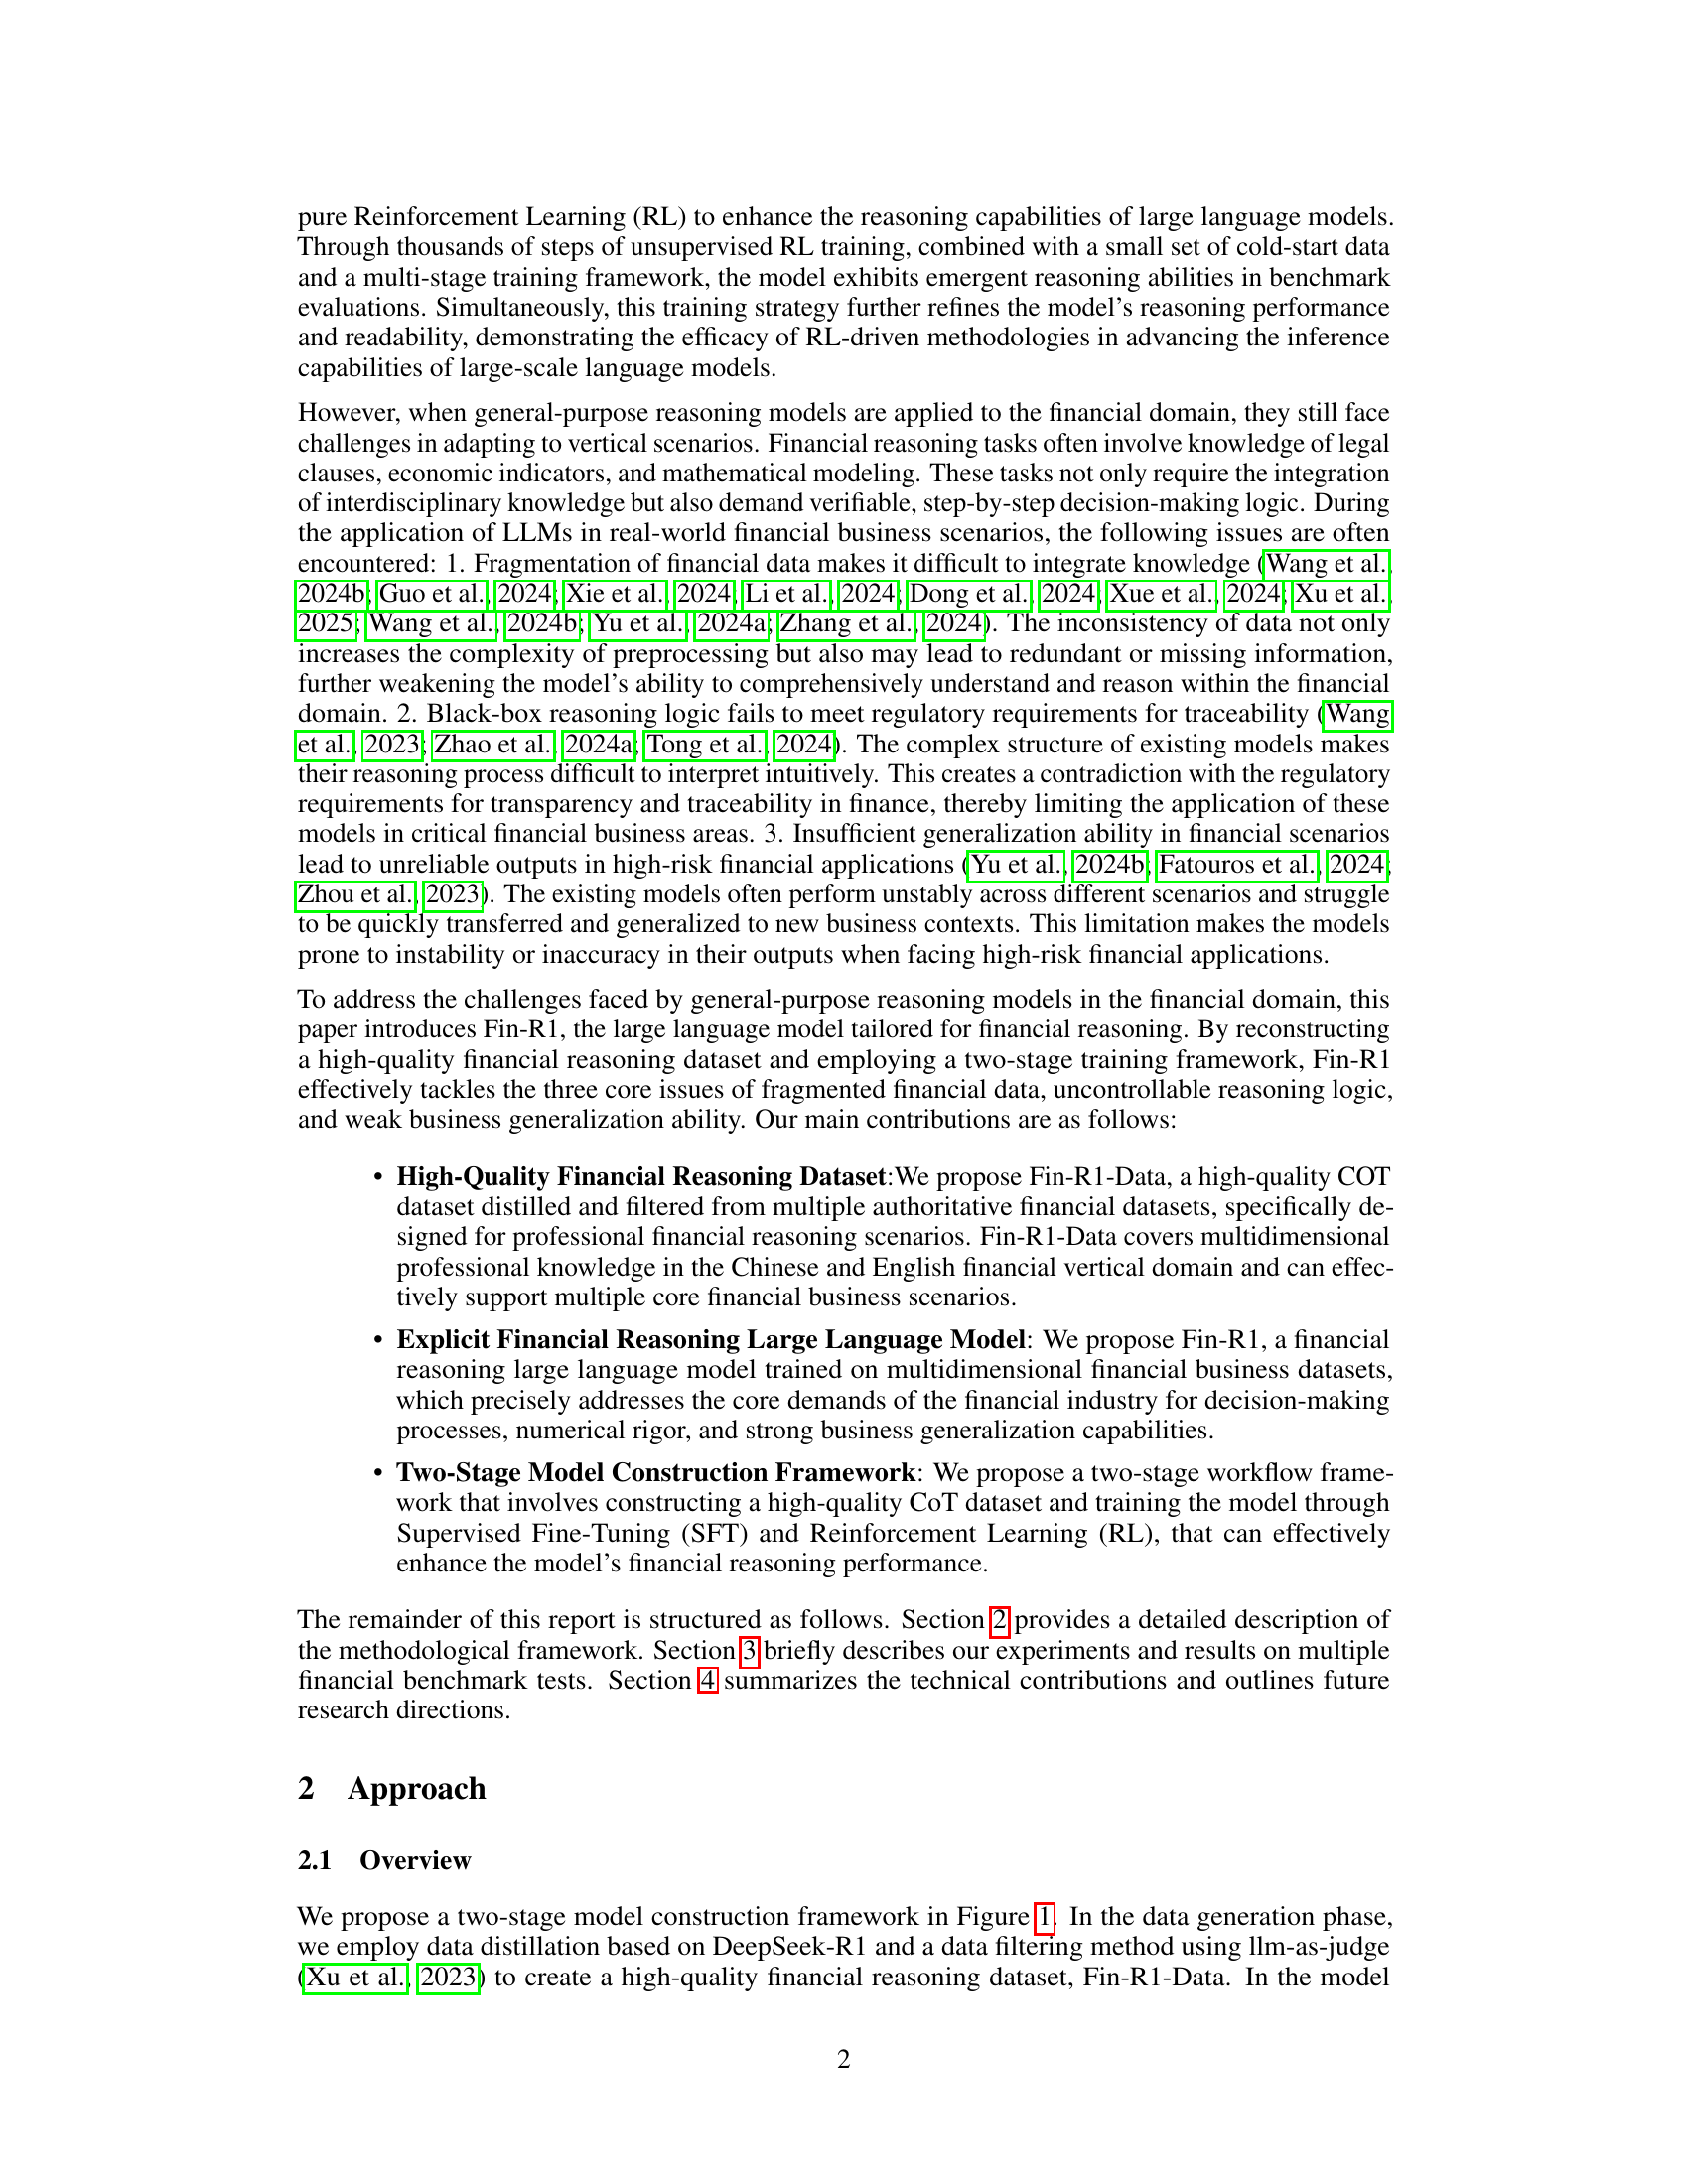
🔼 This figure illustrates the two-stage process of creating the Fin-R1 model. Stage 1 focuses on data generation, where DeepSeek-R1 is used to produce Chain-of-Thought (CoT) data, followed by a quality filtering step using Qwen2.5-72B-Instruct. Stage 2 involves model training. First, Supervised Fine-Tuning (SFT) is performed on a base model, followed by optimization using the Group Relative Policy Optimization (GRPO) algorithm. The final Fin-R1 model is then evaluated across various tasks including financial code generation, professional knowledge questions and business knowledge questions, showcasing its capabilities in different financial applications.
read the caption
Figure 1: The pipeline for constructing Fin-R1. The diagram depicts the two-stage construction framework of Fin-R1: Data Generation (using DeepSeek-R1 for reasoning to generate CoT data, followed by quality filtering with the Qwen2.5-72B-Instruct) and Model Training (including SFT pretraining and GRPO optimization for Fin-R1). Additionally, the right side highlights the performance of Fin-R1 in financial code generation, professional knowledge, and business knowledge.
| Data Category | Data Category Description | Source | Proportion |
| Financial Code | Financial Quantitative Strategy Code Generation | FinanceQT | 0.2% |
| Financial Expertise | Financial Terminology Explanation, Q&A on Financial Expertise, Financial Calculations | Finance-Instruct-500K | 18.2% |
| FinanceIQ | 3.4% | ||
| FinPEE | 0.3% | ||
| Non-reasoning Financial Business Knowledge | Content Generation in Financial Business, Regulatory Compliance, Financial Knowledge, Financial Cognition, Financial Logic | Ant-Finance | 2.0% |
| FinCorpus | 48.4% | ||
| Financial Reasoning Business Knowledge | Numerical Reasoning on Financial Data, Financial News Sentiment Classification, Financial News Classification, Financial Causal Relationship Extraction | FinQA | 4.8% |
| ConvFinQA | 12.3% | ||
| TFNS | 4.0% | ||
| FinCUGE | 6.4% |
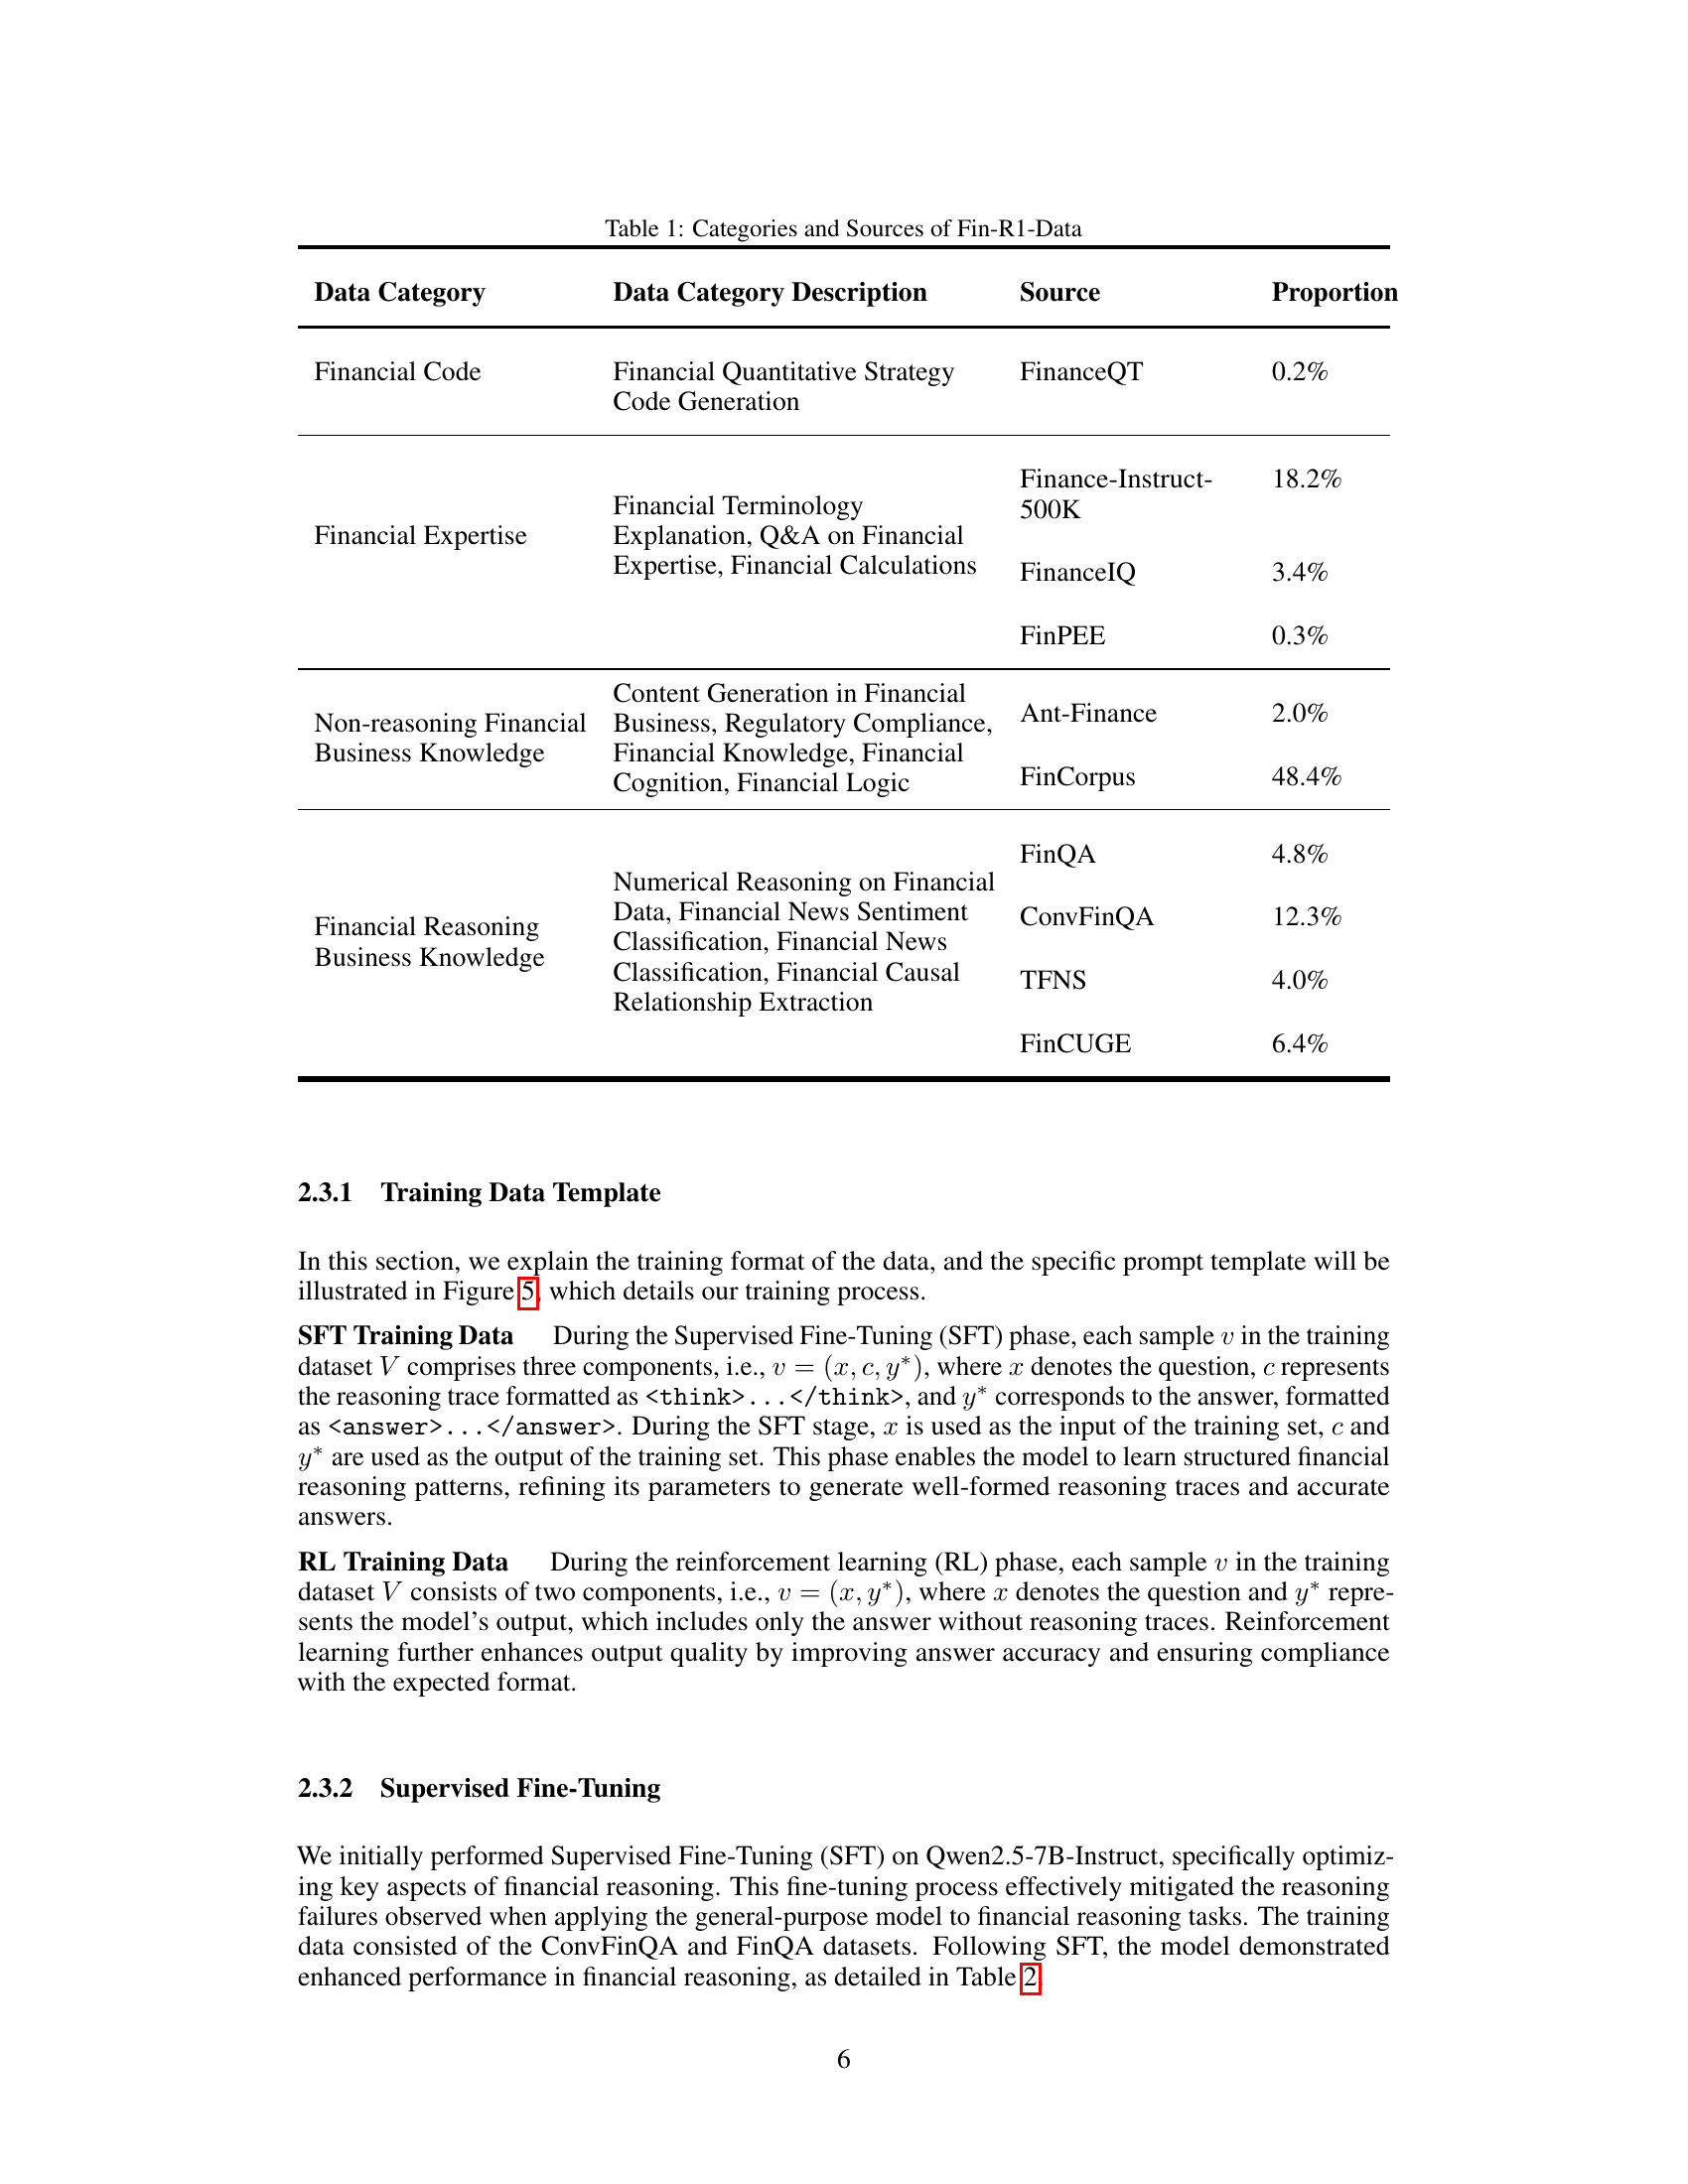
🔼 This table details the composition of the Fin-R1-Data dataset, breaking down the data by category (Financial Code, Financial Expertise, Non-reasoning Financial Business Knowledge, Financial Reasoning Business Knowledge) and indicating the source and proportion of each category within the dataset.
read the caption
Table 1: Categories and Sources of Fin-R1-Data
In-depth insights#
Fin-R1: Overview#
While the document doesn’t have a specific ‘Fin-R1: Overview’ section, it introduces Fin-R1, a large language model tailored for financial reasoning. It underscores the limitations of general-purpose LLMs in handling financial complexities, highlighting issues like data fragmentation, opaque reasoning processes hindering traceability for regulatory compliance, and inadequate generalization across diverse financial scenarios. The model is designed to tackle core challenges in financial AI applications. Fin-R1 uses a new high-quality financial reasoning dataset and has a two-stage training framework using supervised fine-tuning and reinforcement learning to enhance the model’s performance.
RL for Reasoning#
Reinforcement Learning (RL) presents a compelling approach to enhance reasoning capabilities in language models, particularly for tasks requiring sequential decision-making or complex problem-solving. Unlike supervised learning, RL allows the model to learn through trial and error, optimizing for a specific reward signal that reflects the desired reasoning outcome. This is particularly valuable when explicit reasoning paths are unknown or difficult to define. The exploration-exploitation paradigm inherent in RL enables models to discover novel and potentially more effective reasoning strategies. RL-based training can also improve a model’s robustness to noisy or incomplete information by encouraging it to adapt its reasoning process based on feedback from the environment. However, designing effective reward functions and ensuring sample efficiency remain key challenges in applying RL to reasoning tasks. Further research could explore hybrid approaches combining RL with supervised pre-training to leverage the strengths of both paradigms and enable more sophisticated reasoning capabilities.
Fin-R1-Data Details#
The paper introduces Fin-R1-Data, a high-quality dataset crucial for training the Fin-R1 financial reasoning model. Constructed from diverse sources like Ant Finance and FinPEE, it encompasses reasoning and non-reasoning financial scenarios. The authors employed DeepSeek-R1 for CoT generation, followed by rigorous filtering using Qwen2.5-72B-Instruct for quality assessment. This meticulous process ensures data accuracy, logical coherence, and relevance to financial tasks. Fin-R1-Data covers various domains, including professional knowledge, business scenarios, and even financial code, reflecting its comprehensive design. The dataset’s creation addresses the challenges of fragmented financial data and the need for verifiable decision-making in AI applications, enhancing Fin-R1’s performance in complex financial reasoning.
GRPO Algorithm#
The Group Relative Policy Optimization (GRPO) algorithm leverages reinforcement learning to improve model output by comparing candidate outputs and prioritizing those exceeding group averages. During each training iteration, various outputs are sampled, each receiving a reward. A group-relative advantage is calculated by normalizing rewards relative to the group’s mean and standard deviation, emphasizing superior performers. The policy update maximizes an objective function, incorporating an importance sampling ratio quantifying the likelihood of generating an output under the new versus old policy. A clipping operator restricts update magnitudes to maintain training stability, while Kullback-Leibler divergence penalizes deviations from a reference policy.
Limited Fin Data#
The research acknowledges limitations stemming from constrained training data, specifically confined to ConvFinQA and FinQA datasets. This narrow scope impacts the model’s generalization capability across diverse financial scenarios. Future work aims to expand training datasets for improved robustness. Acknowledging these data-related constraints is vital for assessing the model’s applicability and guiding future research to address these limitations and enhance real-world effectiveness.
More visual insights#
More on figures

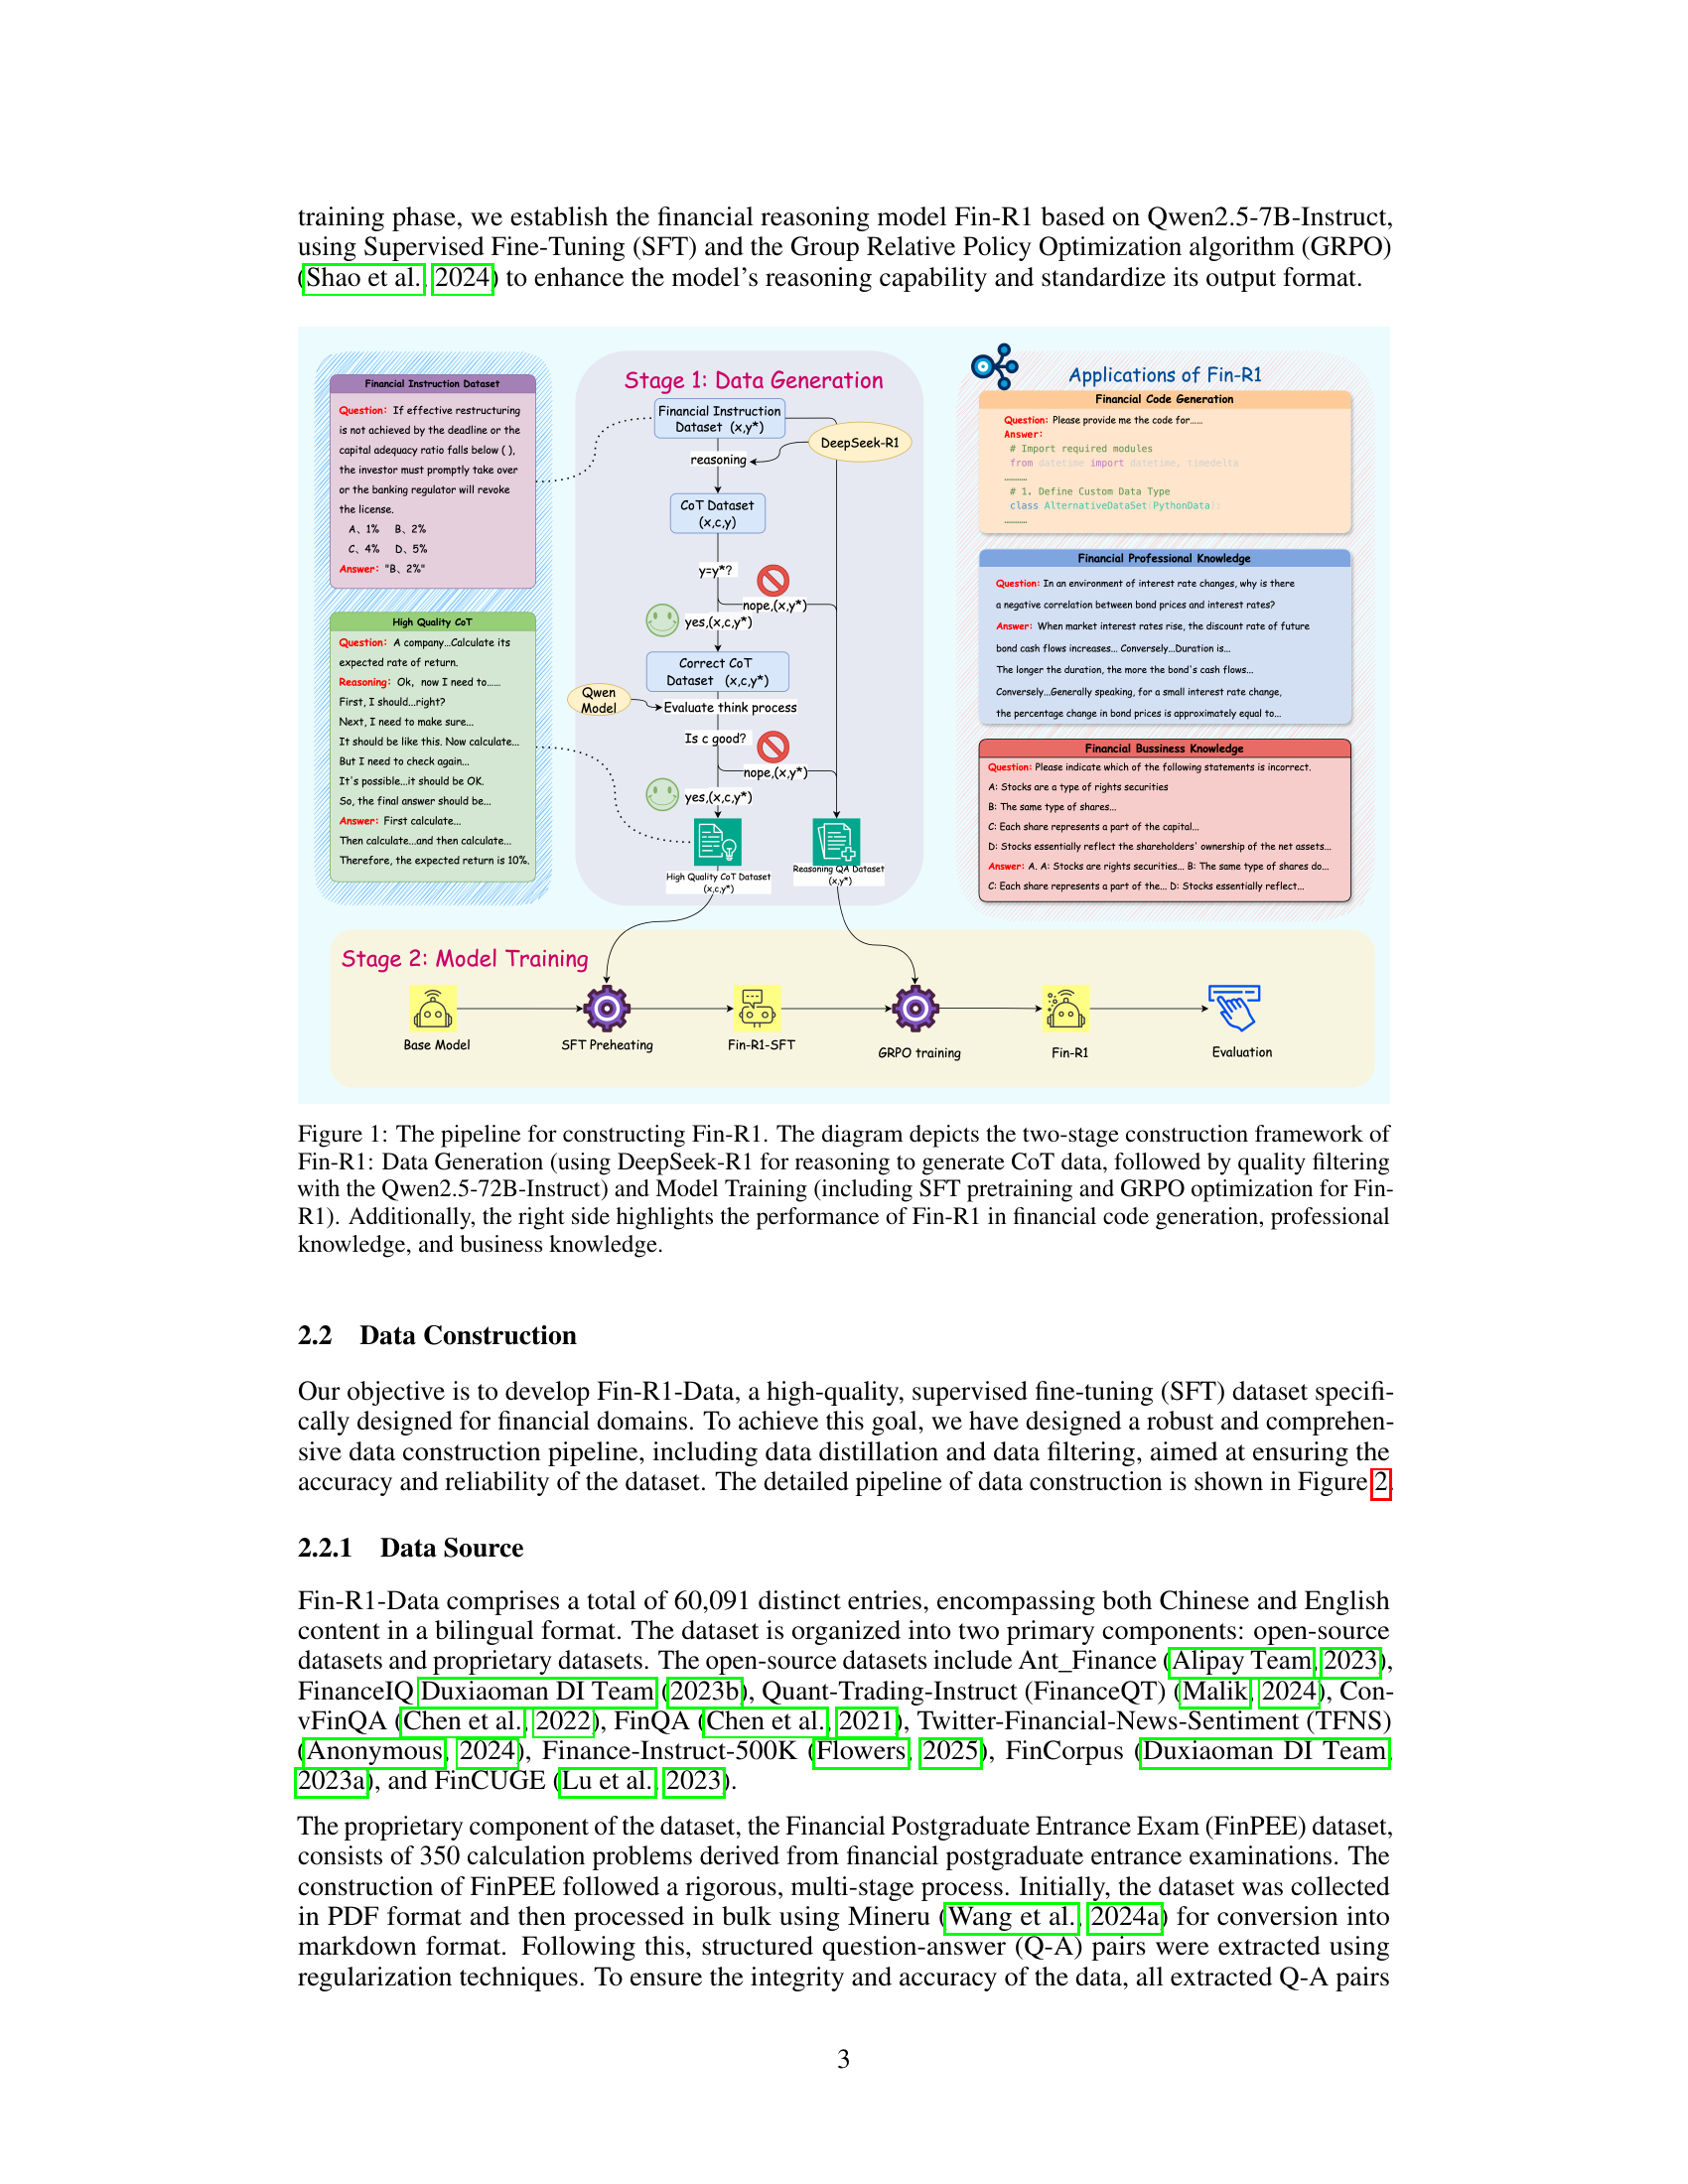
🔼 Figure 2 illustrates the three-stage data construction pipeline for Fin-R1-Data. First, data distillation uses DeepSeek-R1 to generate a large dataset of question-answer pairs, along with reasoning traces. Second, answer check filters this data using an LLM (Qwen2.5-72B-Instruct) to verify the accuracy of DeepSeek-R1’s answers, discarding inaccurate entries. Finally, reasoning selection employs another LLM to evaluate the quality and logical coherence of the reasoning traces, retaining only the highest-quality entries. The ‘Reasoning’ and ‘Thinking’ labels in the diagram represent the reasoning trace generated by the model and the LLM’s evaluation of that trace, respectively.
read the caption
Figure 2: Stage 1-The pipeline of data construction: (1) Data Distillation, (2) Answer Check, where an LLM evaluates the accuracy of responses generated by DeepSeek-R1, and (3) Reasoning Selection, where an LLM assesses and scores reasoning trajectories to ensure logical coherence and quality. 'Reasoning' represents the reasoning output, while 'Thinking' refers to the evaluation process of the judgment model.

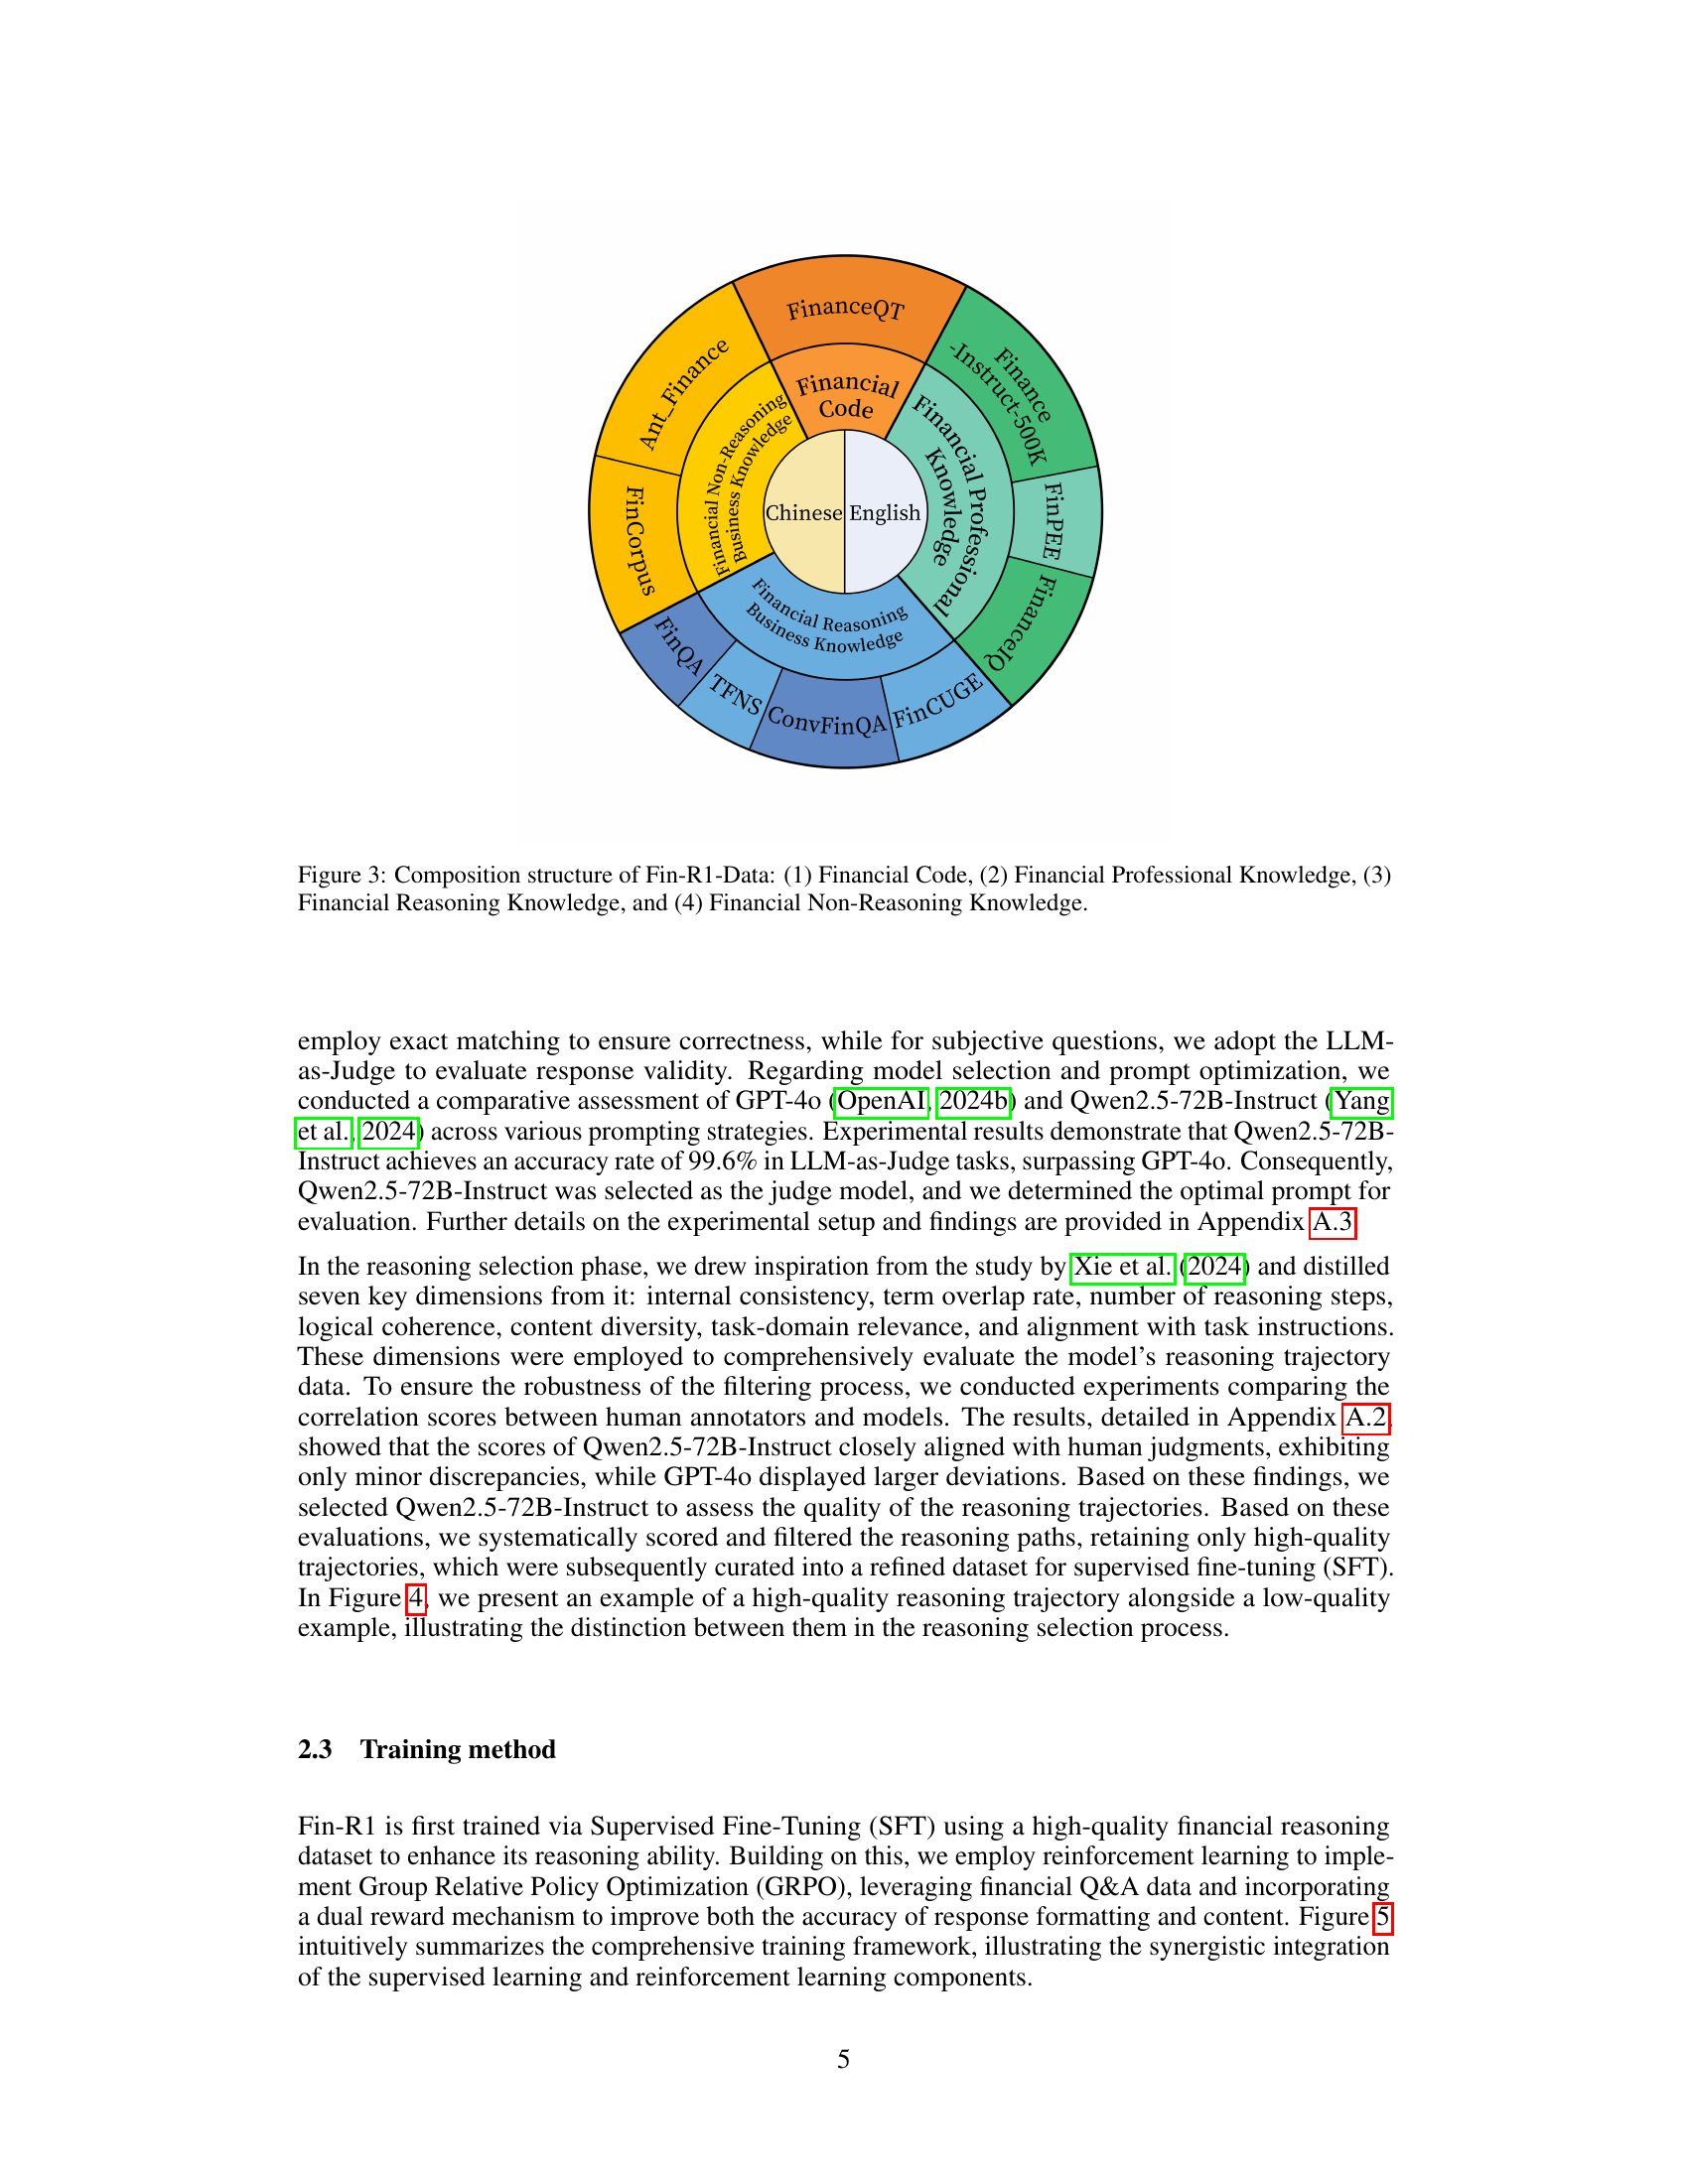
🔼 The figure illustrates the composition of the Fin-R1-Data dataset, which is divided into four main categories: Financial Code, Financial Professional Knowledge, Financial Reasoning Knowledge, and Financial Non-Reasoning Knowledge. Each category contains various sub-categories of financial data used to train the Fin-R1 model. This breakdown shows the diverse types of financial information incorporated into the training data, encompassing both code and textual data across different levels of professional expertise and reasoning demands. The proportions of each category within the dataset are not explicitly shown in the figure but are discussed within the paper.
read the caption
Figure 3: Composition structure of Fin-R1-Data: (1) Financial Code, (2) Financial Professional Knowledge, (3) Financial Reasoning Knowledge, and (4) Financial Non-Reasoning Knowledge.

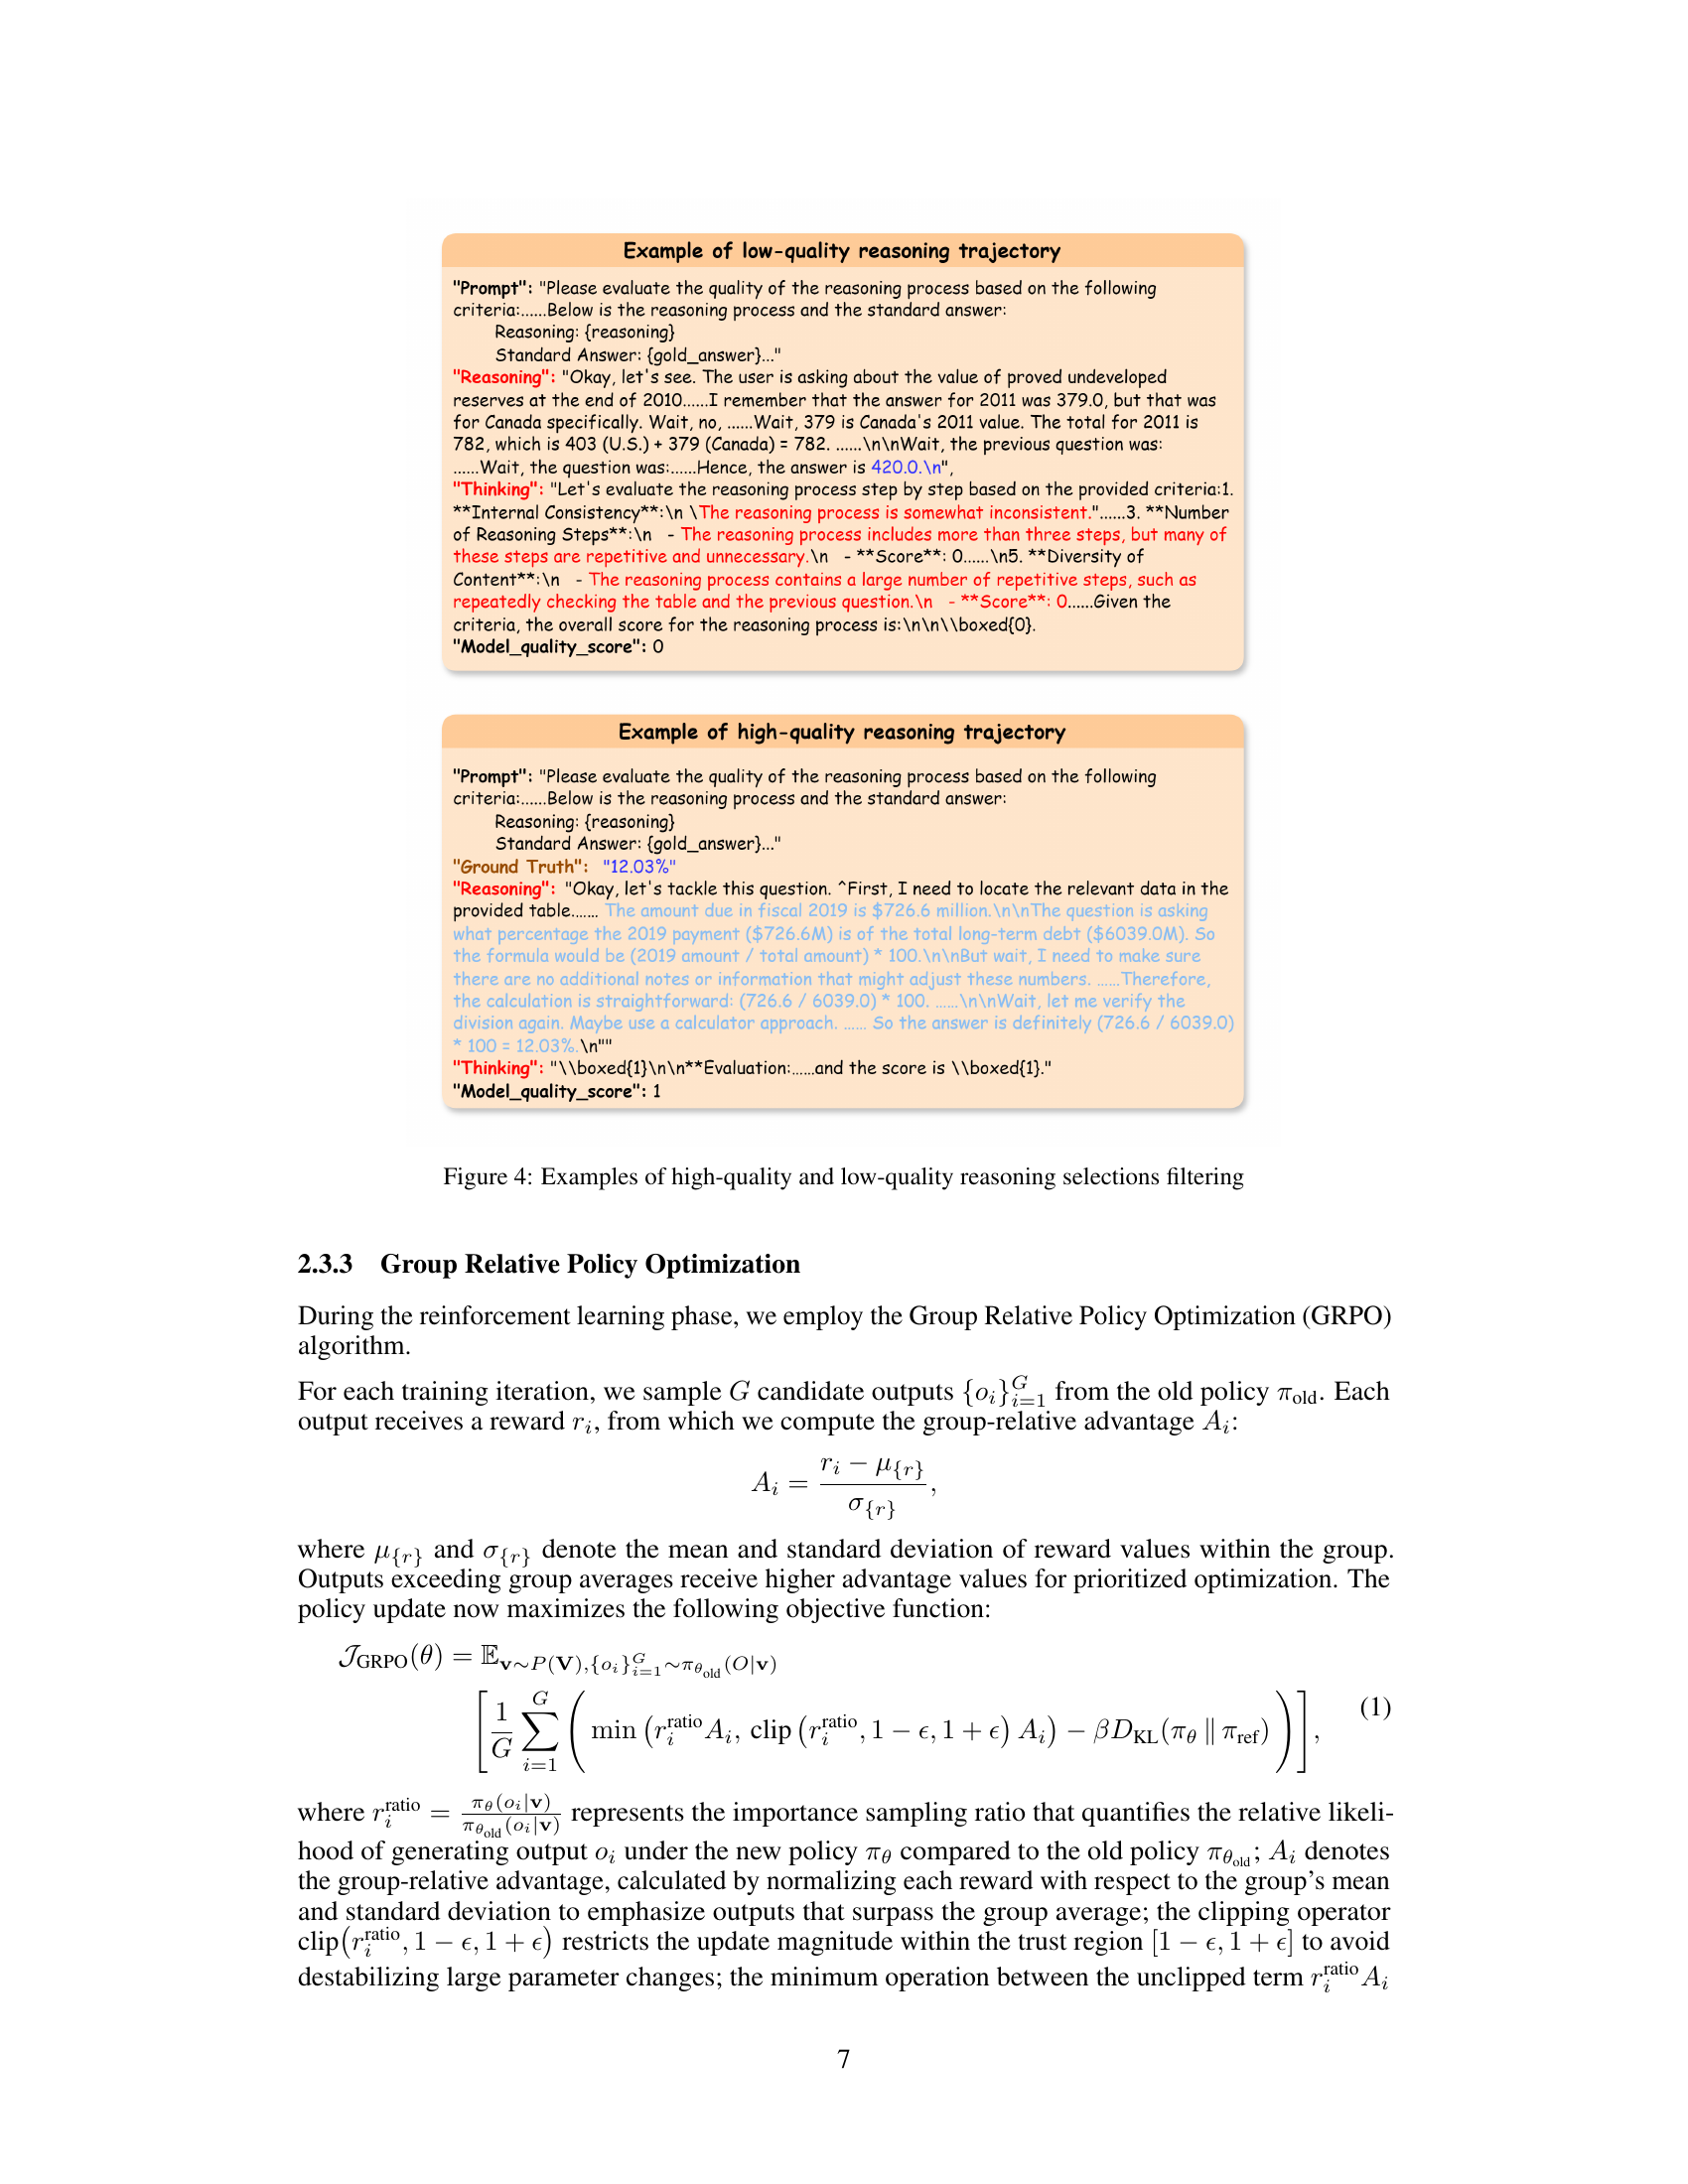
🔼 This figure showcases examples of high-quality versus low-quality reasoning processes. The examples illustrate the filtering mechanism used to curate the Fin-R1-Data dataset. High-quality reasoning is characterized by clear, concise, and logical steps, while low-quality reasoning shows inconsistency, redundancy, or illogical jumps in the thought process. The differences highlight the criteria used to select only high-quality reasoning examples for training the Fin-R1 model.
read the caption
Figure 4: Examples of high-quality and low-quality reasoning selections filtering

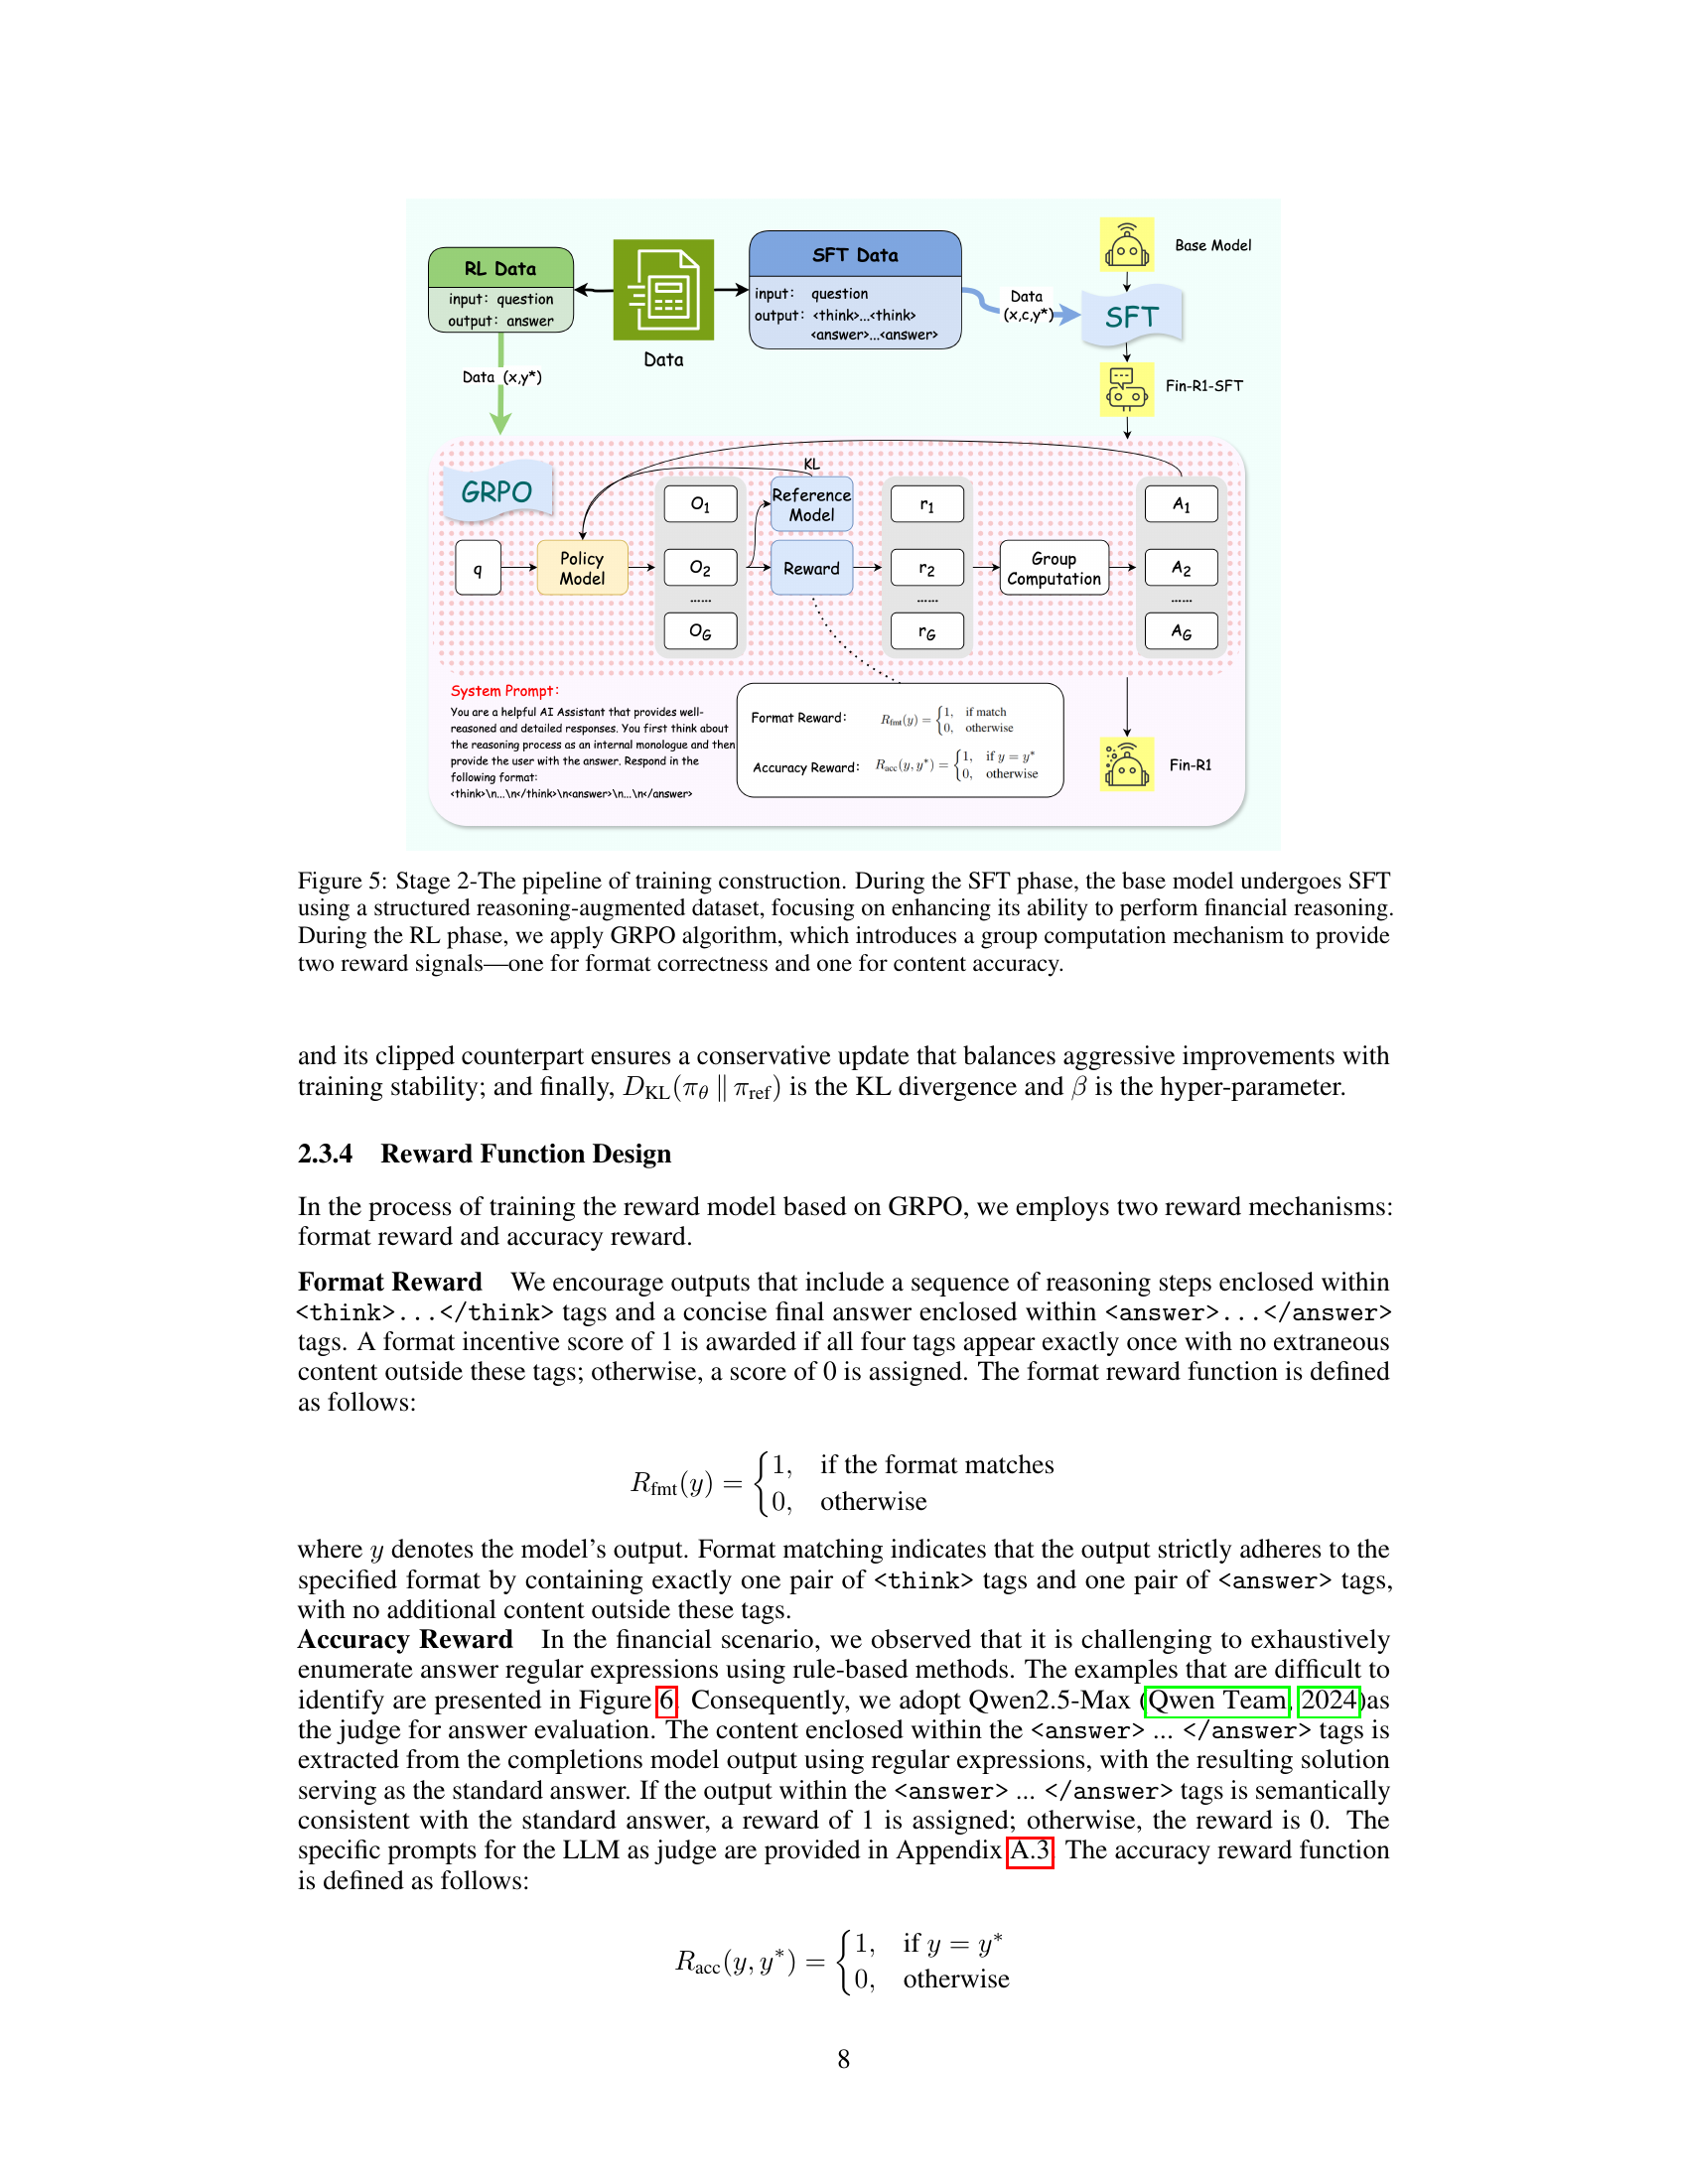
🔼 This figure illustrates the two-stage training process for the Fin-R1 model. Stage 1 involves supervised fine-tuning (SFT) using a structured dataset to improve the model’s financial reasoning capabilities. The input to the SFT phase is a question (x) and the output is both a chain of thought reasoning process (c) and the answer (y*). Stage 2 utilizes reinforcement learning with the Group Relative Policy Optimization (GRPO) algorithm. Here the input is only a question (x) and the output is just the answer (y*). GRPO employs a group computation mechanism to provide two reward signals: one for ensuring the response adheres to the correct format, and another for evaluating the accuracy of the answer itself. This two-stage approach aims to enhance both the reasoning quality and the formatting consistency of the model’s outputs.
read the caption
Figure 5: Stage 2-The pipeline of training construction. During the SFT phase, the base model undergoes SFT using a structured reasoning-augmented dataset, focusing on enhancing its ability to perform financial reasoning. During the RL phase, we apply GRPO algorithm, which introduces a group computation mechanism to provide two reward signals—one for format correctness and one for content accuracy.

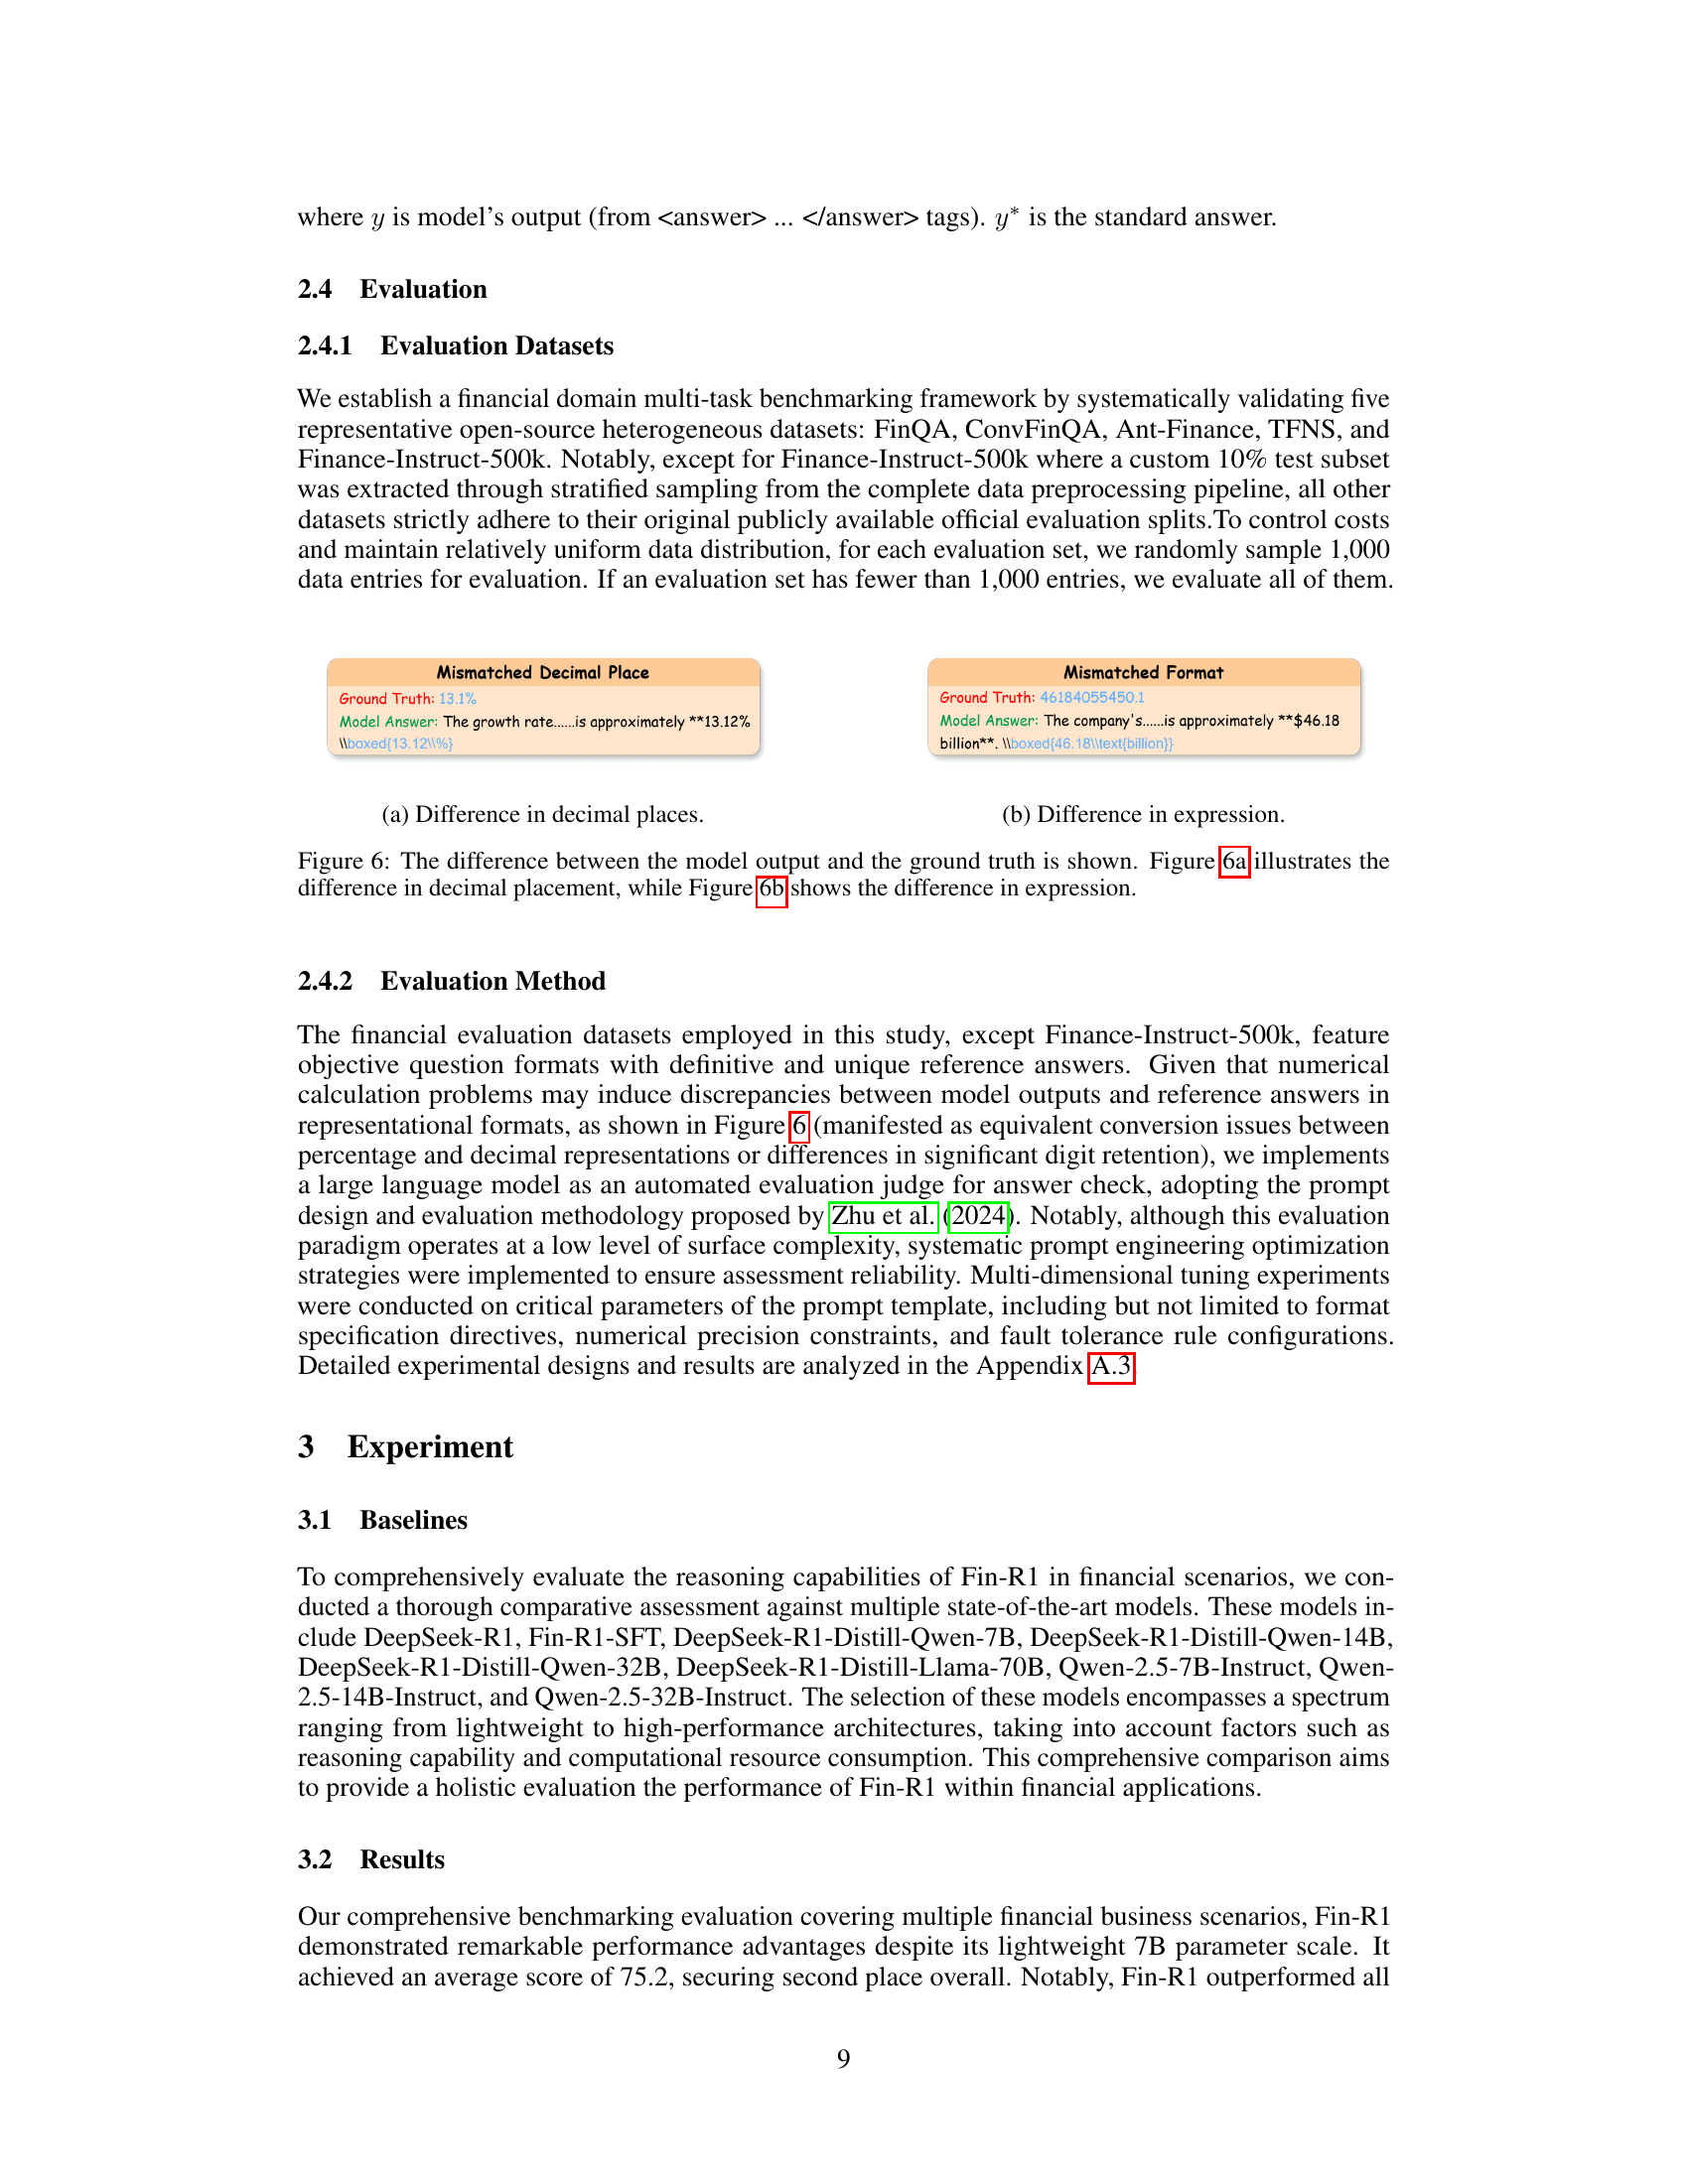
🔼 The figure shows an example of a discrepancy between model output and ground truth due to a difference in the number of decimal places. The ground truth shows 13.1%, while the model answer shows 13.12%. This highlights a challenge in evaluating model accuracy when dealing with numerical results where minor variations might be considered acceptable depending on the application context. This difference is considered a minor error.
read the caption
(a) Difference in decimal places.

🔼 The figure illustrates an example where the model’s response differs from the ground truth due to variations in expression rather than numerical values. The ground truth provides a numerical value while the model response gives an equivalent value expressed differently. For instance, the ground truth might be ‘46184055450.1’, while the model provides ‘$46.18 billion’, representing the same quantity but in a different format. This highlights a challenge in evaluating model accuracy when different but equivalent representations of information are involved.
read the caption
(b) Difference in expression.

🔼 Figure 6 demonstrates discrepancies between model-generated outputs and ground truth values in numerical responses. Panel (a) shows a mismatch in the number of decimal places, while panel (b) illustrates a difference in how the numerical value is expressed (e.g., percentage vs. decimal). These discrepancies highlight challenges in evaluating the accuracy of numerical answers produced by LLMs in financial contexts, as different formats expressing the same numerical quantity may be classified as incorrect.
read the caption
Figure 6: The difference between the model output and the ground truth is shown. Figure 6 illustrates the difference in decimal placement, while Figure 6 shows the difference in expression.

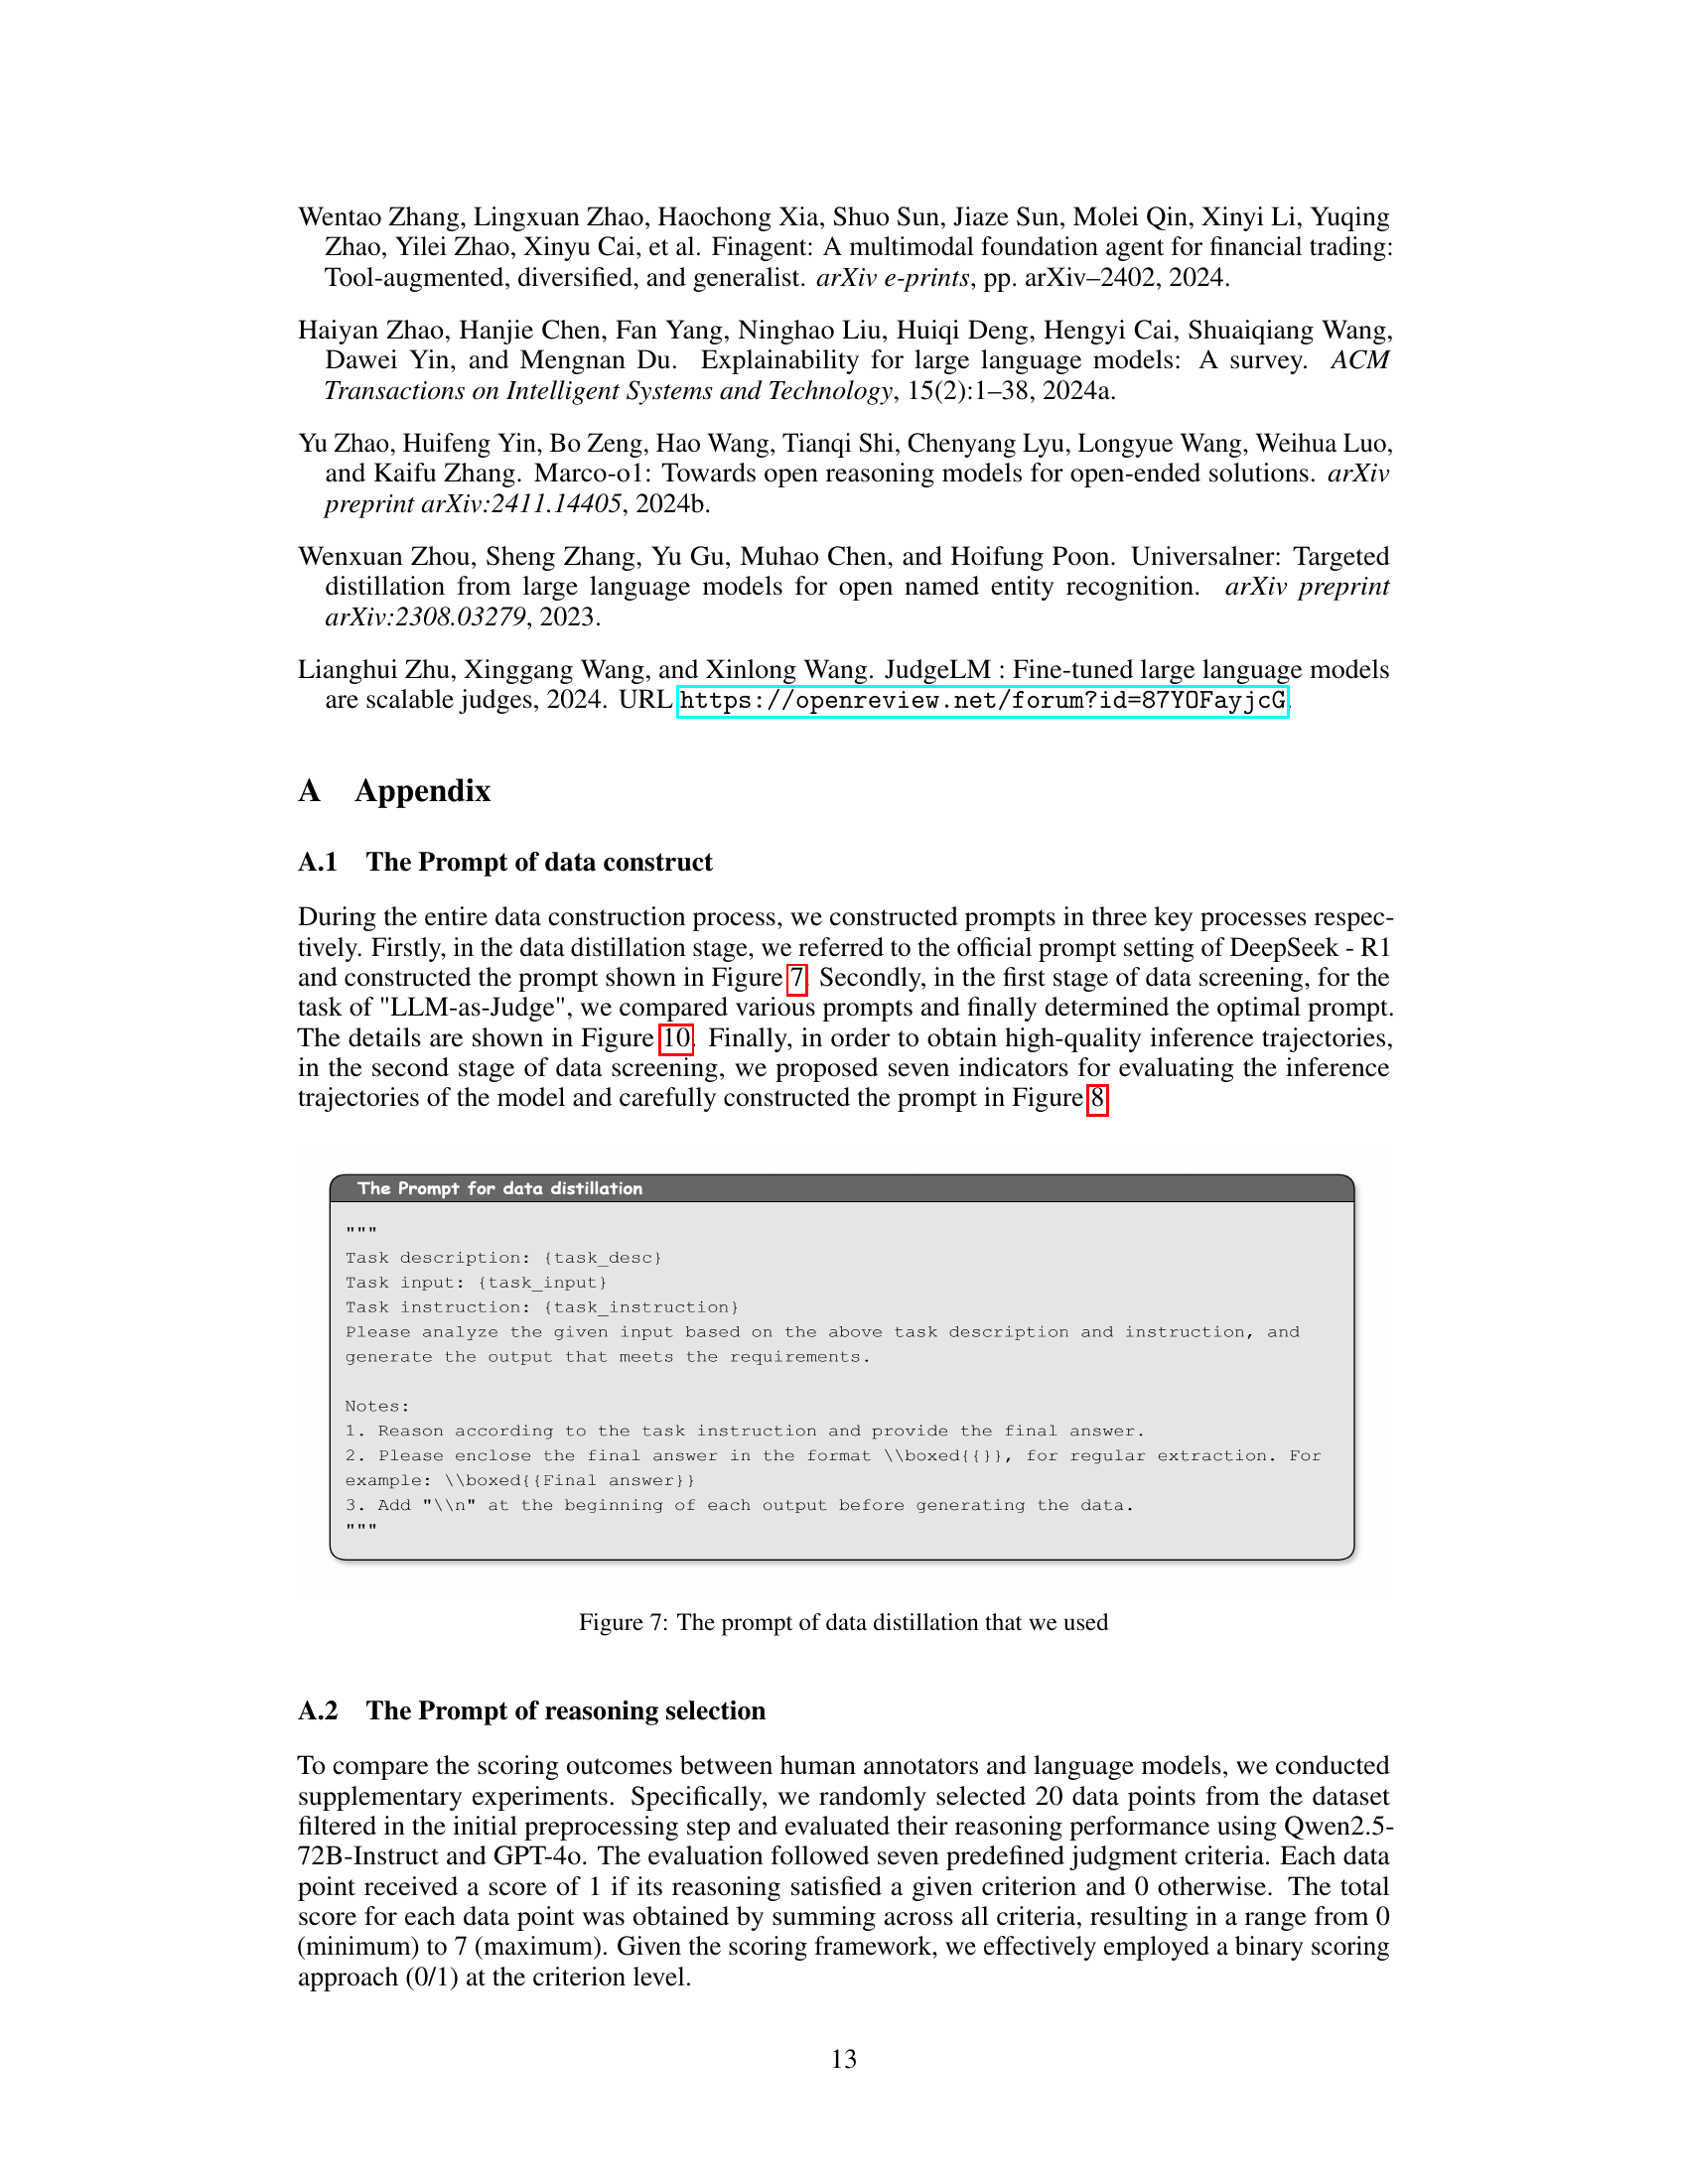
🔼 This figure shows the prompt used in the data distillation phase of Fin-R1’s development. The prompt instructs the model to analyze the provided input based on a given task description and instruction, generating an output that meets the requirements. Specific instructions emphasize the importance of reasoning according to task instructions, enclosing the final answer within a \boxed{} format for easy extraction, and adding a newline character (’\n’) at the beginning of each output to maintain consistency. The goal of this prompt is to generate high-quality chain-of-thought (CoT) reasoning sequences for training the financial reasoning model.
read the caption
Figure 7: The prompt of data distillation that we used

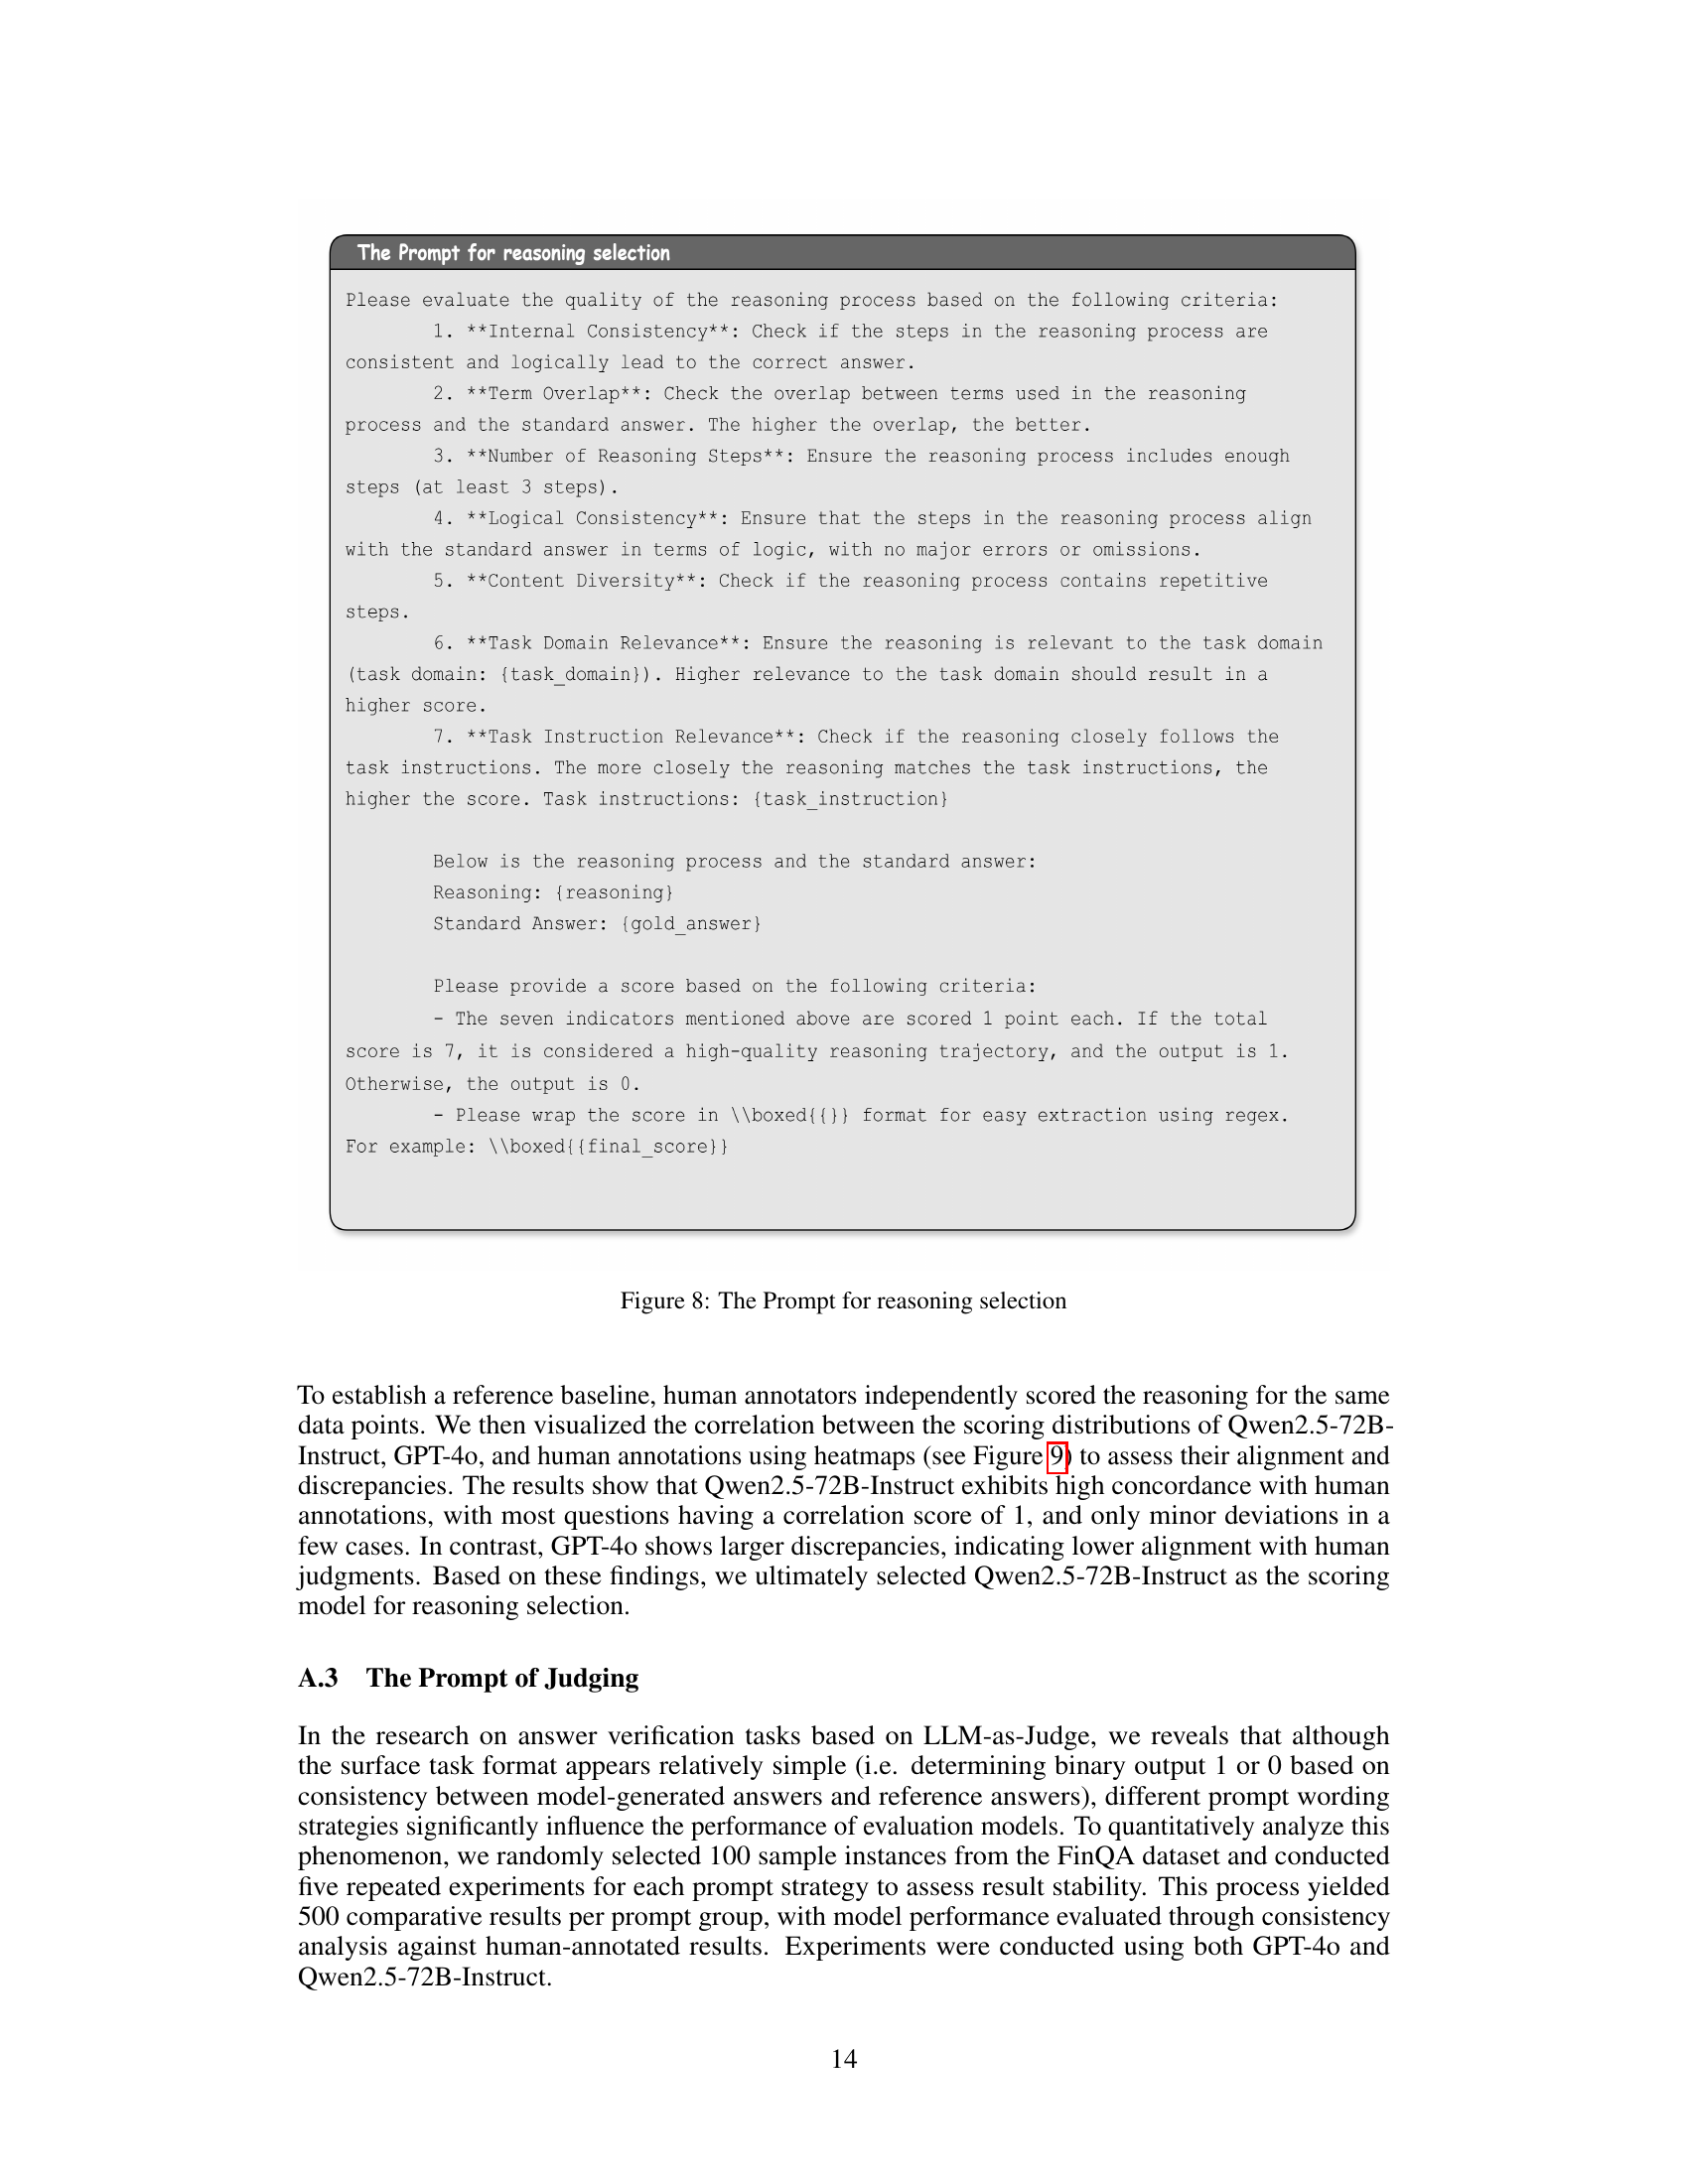
🔼 This figure shows the prompt used for the reasoning selection stage in the data construction process. The prompt provides a detailed rubric for evaluating the quality of the reasoning process generated by a language model. This rubric includes seven key criteria, each scored individually (0 or 1), to provide a holistic assessment. The criteria assess factors such as internal consistency, term overlap with the standard answer, number of reasoning steps, logical consistency, content diversity, relevance to the task domain, and alignment with task instructions. The prompt also provides clear instructions on how to format the response (using boxed{ } for easy extraction using regex) and a clear example of how the evaluation should be performed.
read the caption
Figure 8: The Prompt for reasoning selection

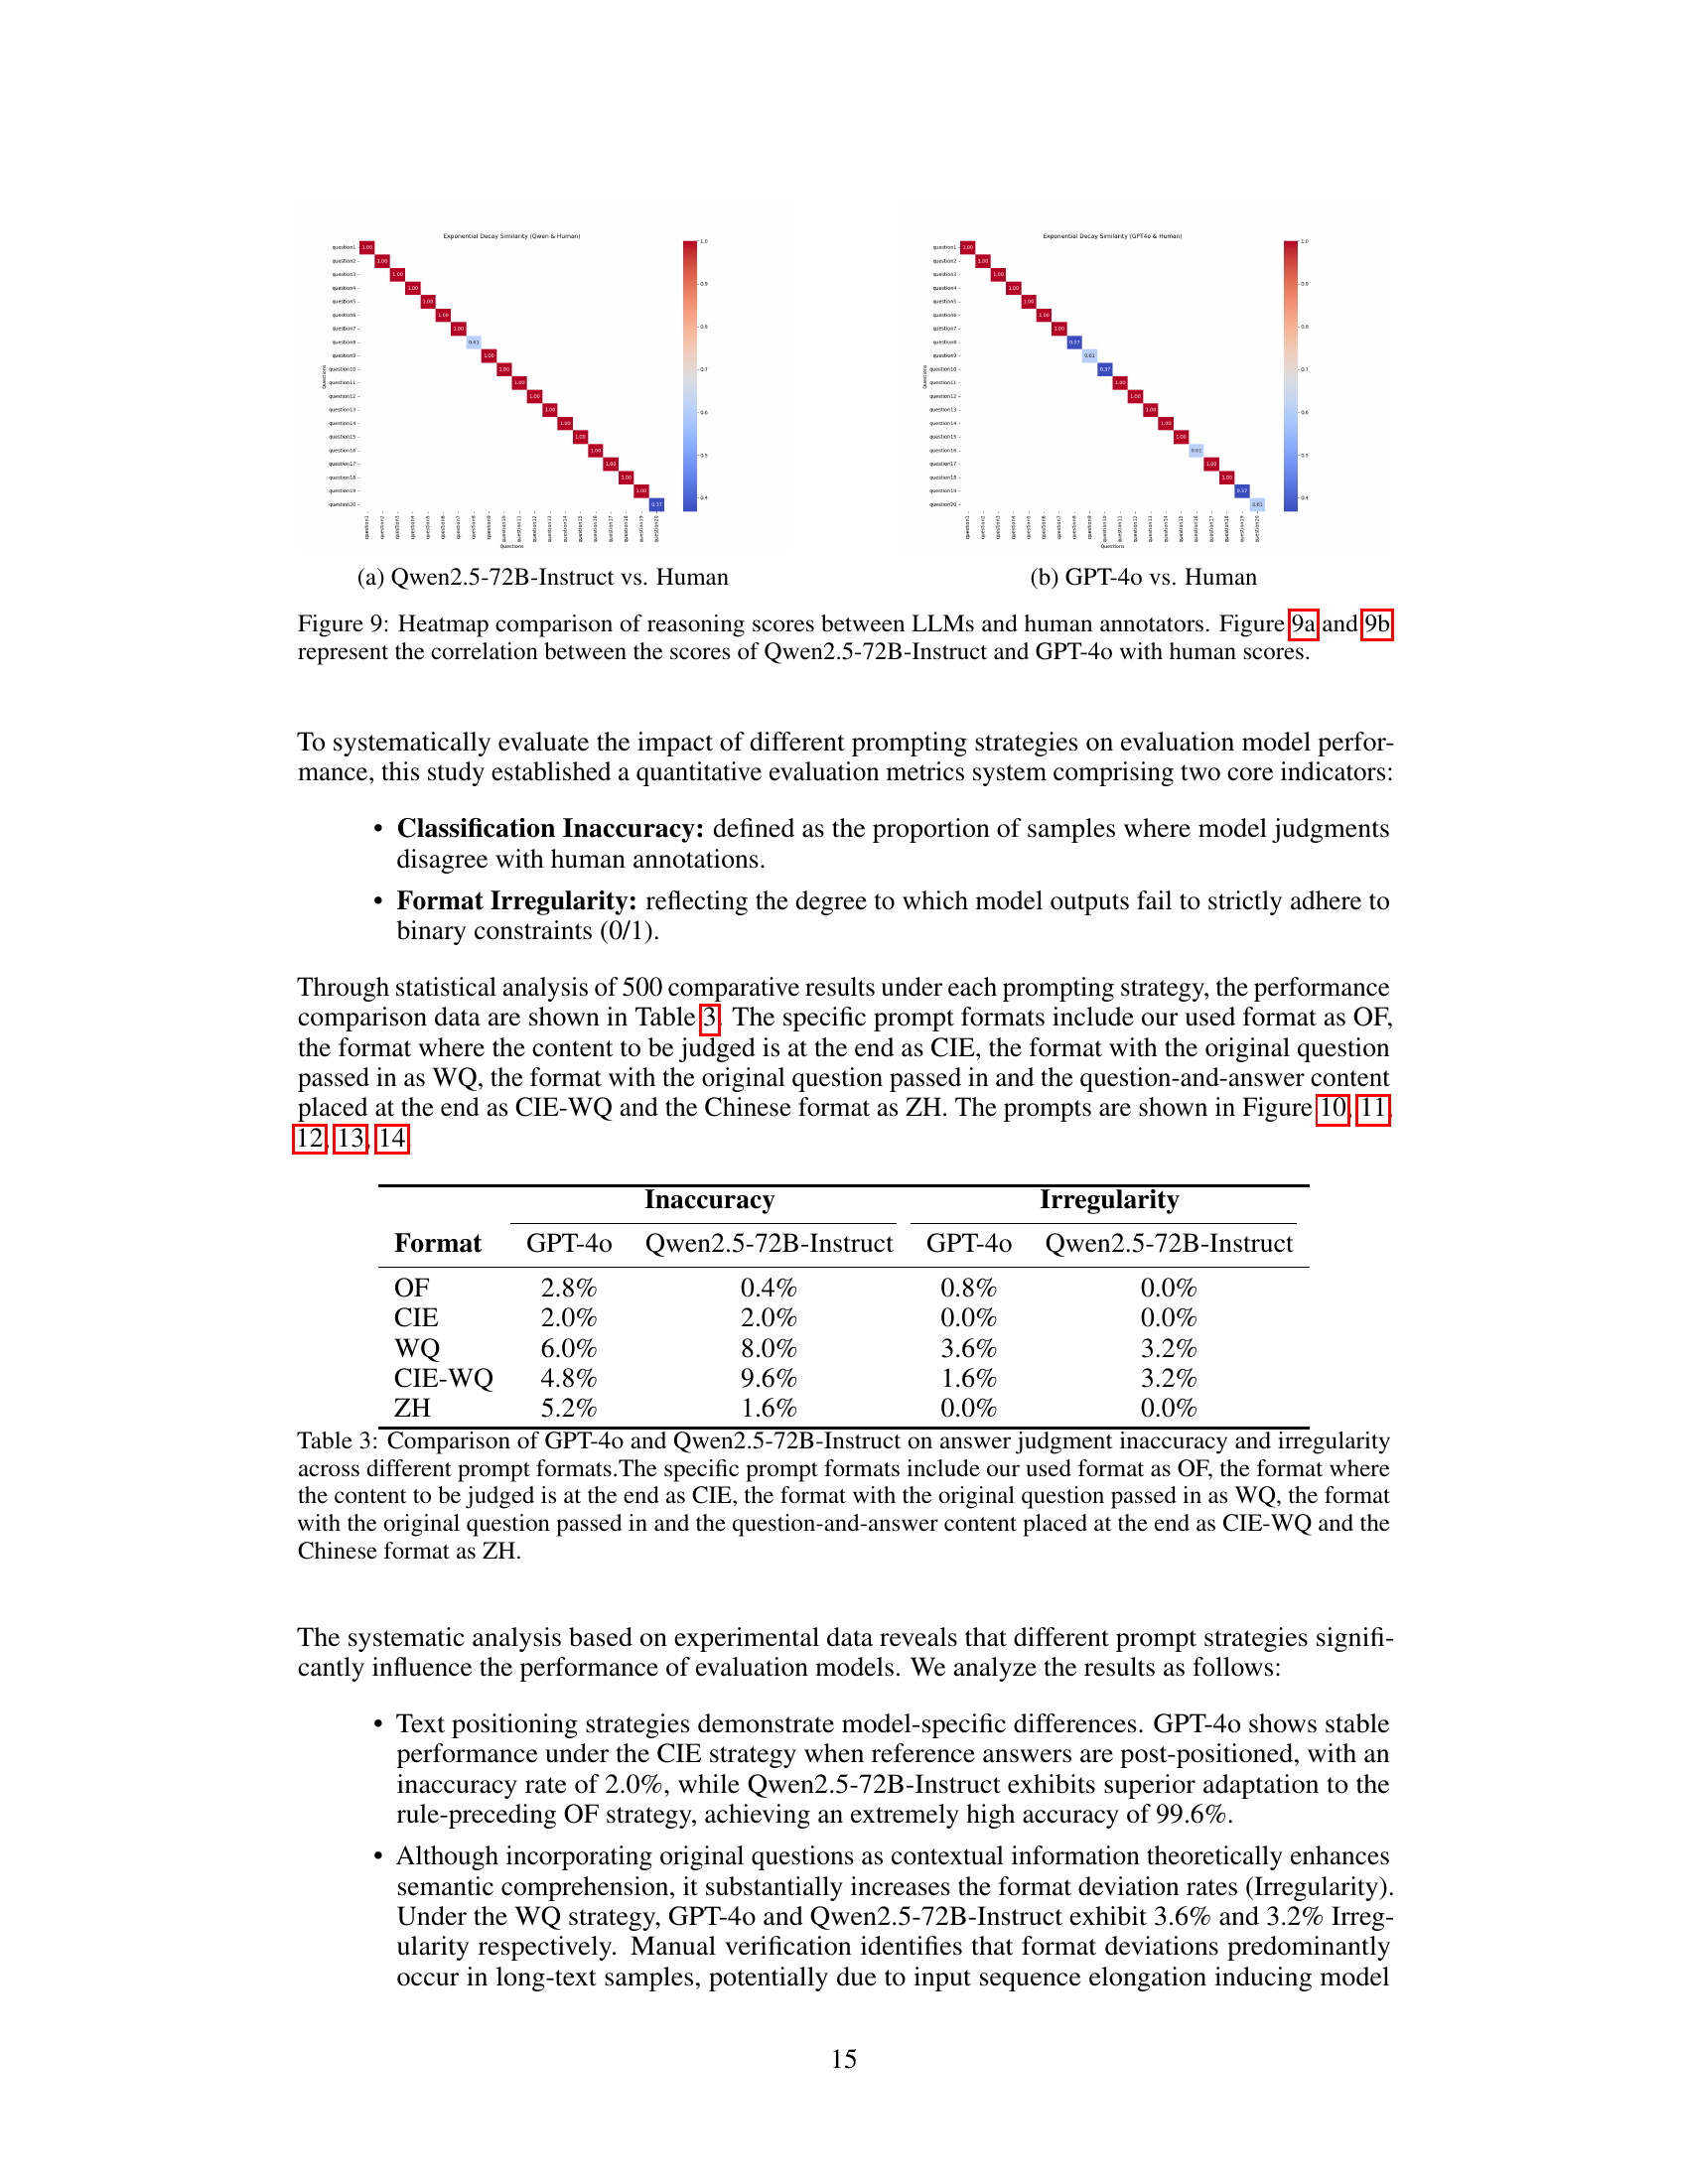
🔼 Heatmap visualizing the correlation between the reasoning scores assigned by the Qwen2.5-72B-Instruct language model and human evaluators. Each cell in the heatmap represents the correlation between the scores given by one human evaluator and the model for a particular data point. The intensity of the color in the cell indicates the strength of the correlation, ranging from strong positive correlation (dark red) to strong negative correlation (dark blue). This visual representation helps assess the degree of agreement between human and model evaluations, providing insights into the model’s ability to effectively capture the nuances of financial reasoning processes.
read the caption
(a) Qwen2.5-72B-Instruct vs. Human

🔼 This heatmap visualizes the correlation between GPT-4’s reasoning scores and human scores for the same set of financial reasoning tasks. Each cell represents the correlation coefficient between the scores assigned by GPT-4 and a human evaluator for a specific task. A darker cell indicates a stronger positive correlation (higher agreement), while a lighter cell indicates a weaker or negative correlation (less agreement). This figure helps to assess the alignment and discrepancies between GPT-4’s evaluation of reasoning quality and human judgment.
read the caption
(b) GPT-4o vs. Human

🔼 This figure visualizes the correlation between the reasoning scores assigned by two large language models (LLMs), Qwen-2.5-72B-Instruct and GPT-4, and human annotators. Two heatmaps are presented. Each heatmap shows the correlation between one LLM’s scores and human scores for a set of reasoning tasks. The heatmaps allow for a visual comparison of how well each LLM’s assessment aligns with human judgment on reasoning quality.
read the caption
Figure 9: Heatmap comparison of reasoning scores between LLMs and human annotators. Figure 9 and 9 represent the correlation between the scores of Qwen2.5-72B-Instruct and GPT-4o with human scores.

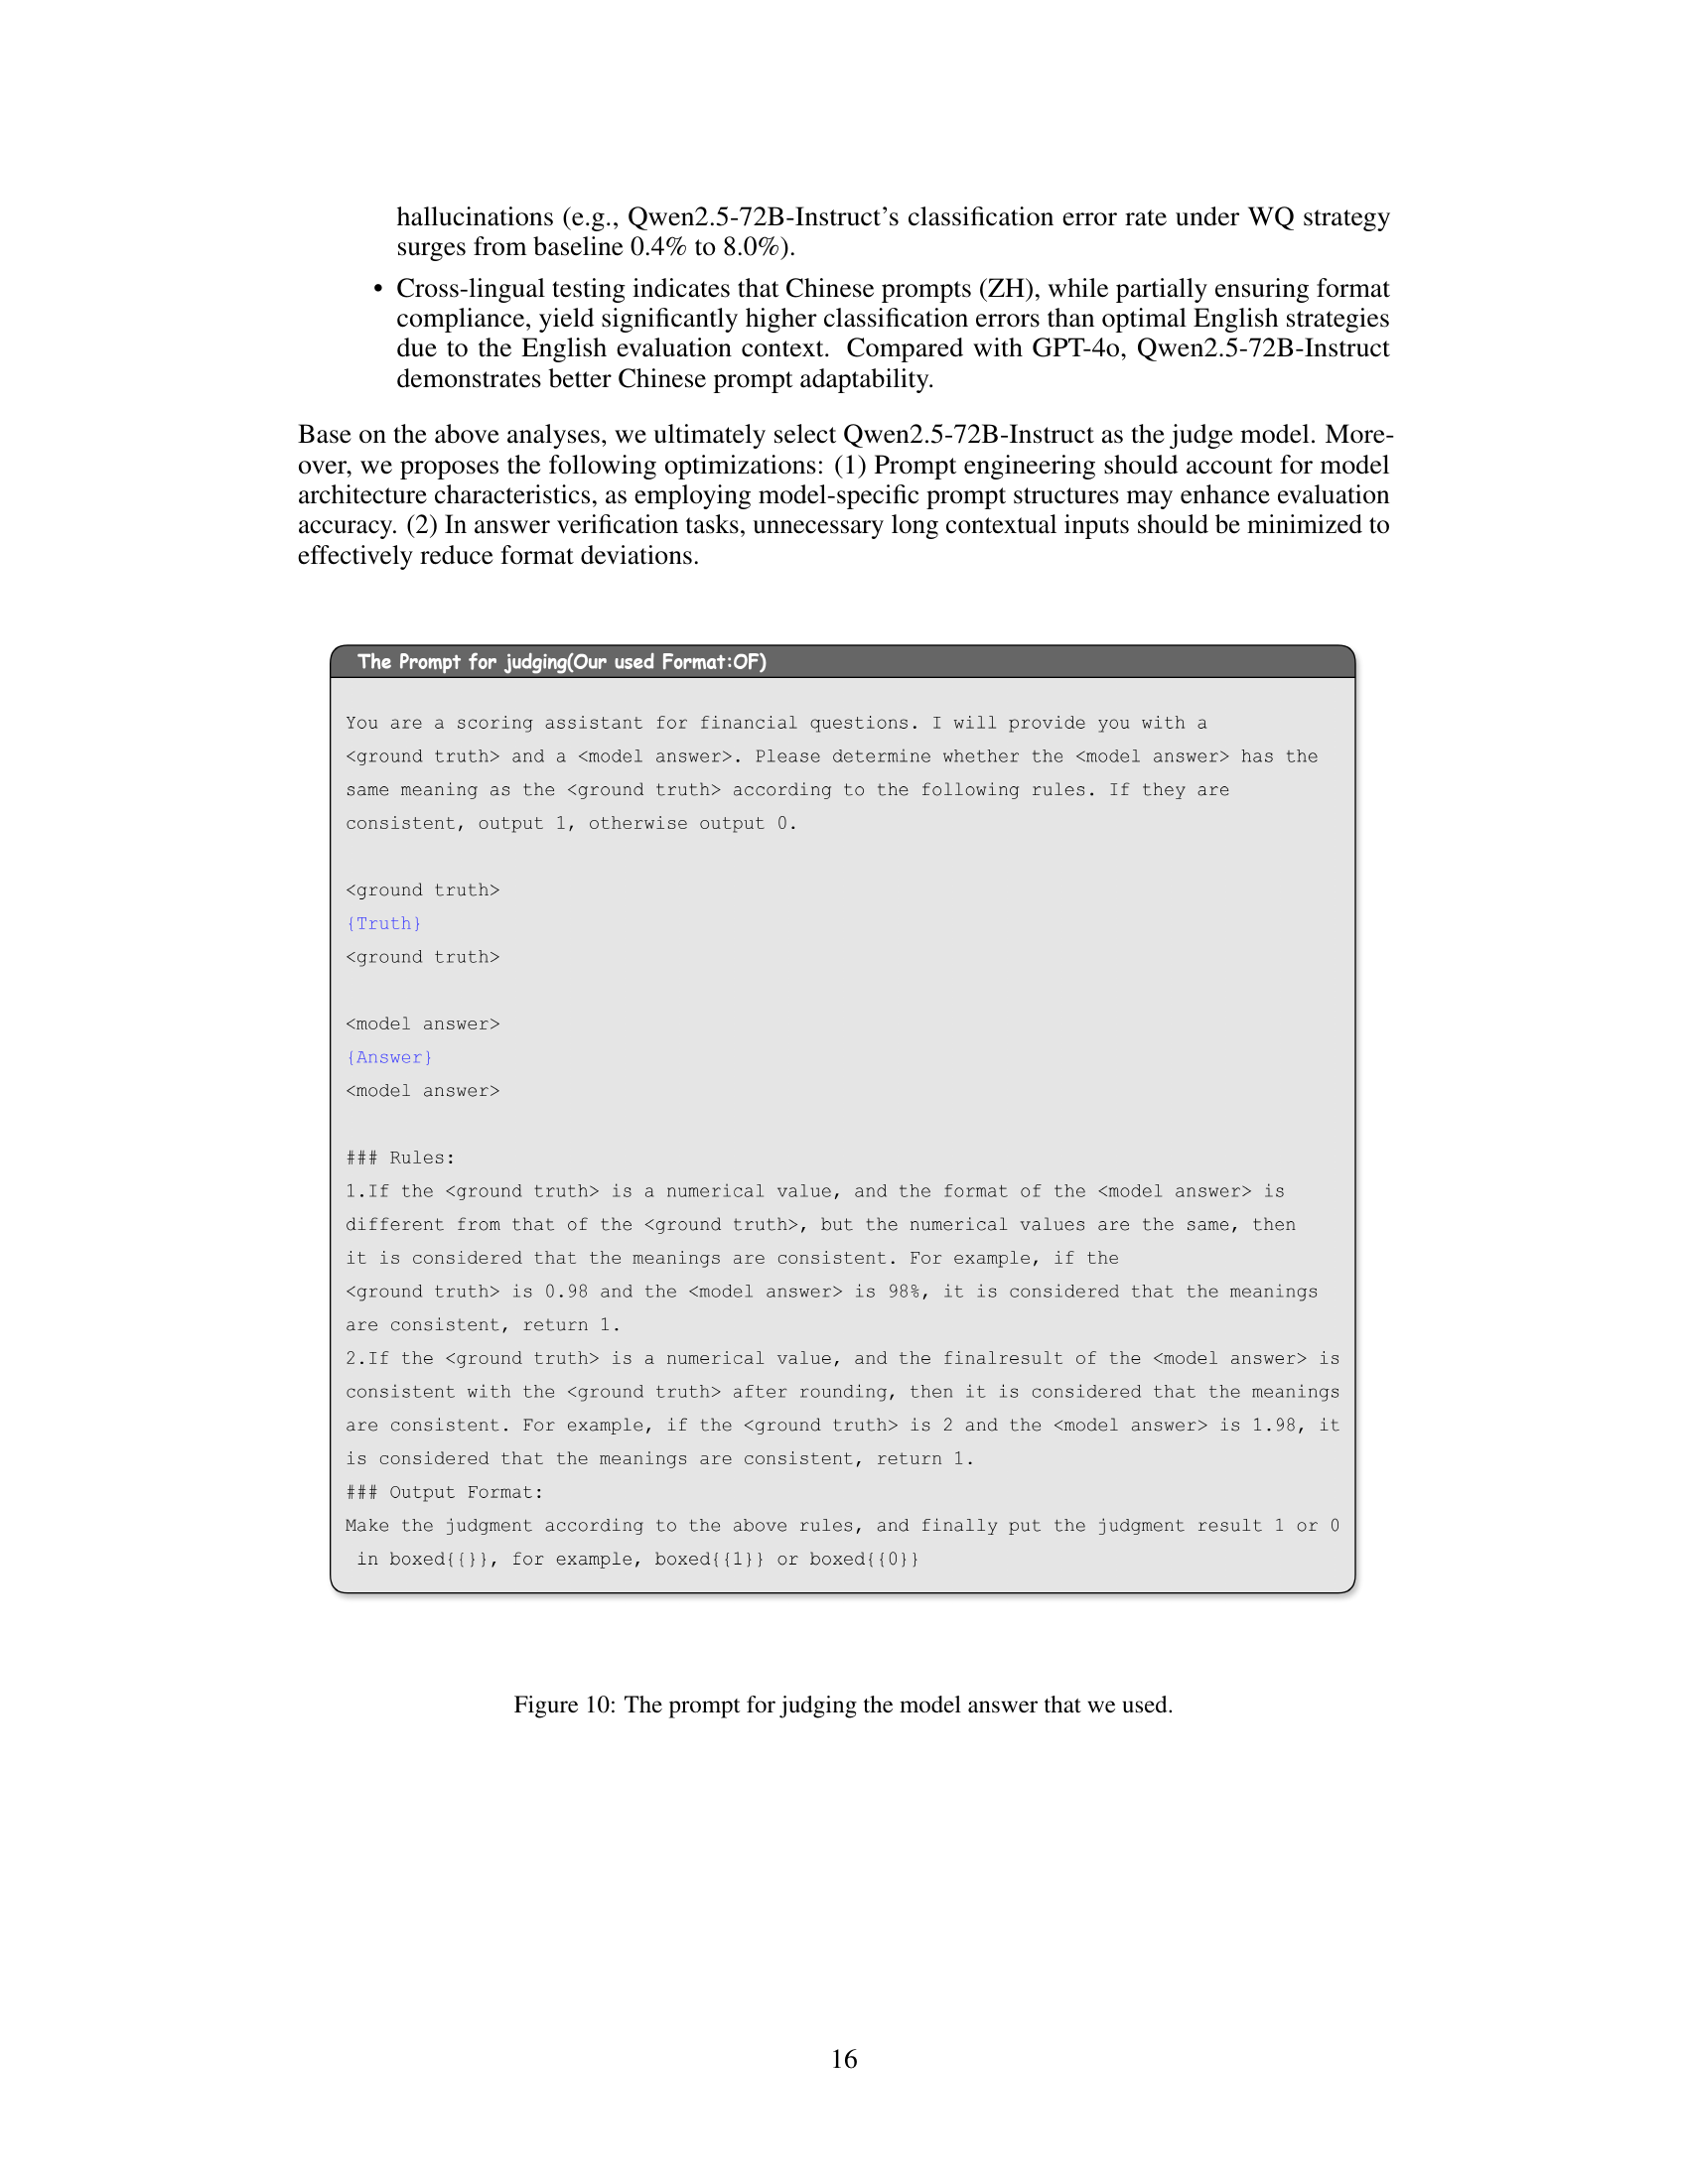
🔼 This figure shows the prompt used for evaluating the quality of model-generated answers. The prompt instructs the evaluator (an LLM) to compare a model’s answer to a ground truth answer and assign a score of 1 if they match in meaning and 0 otherwise. The instructions include specific criteria for handling numerical answers with different formats or minor rounding differences. The goal is to objectively assess whether the model’s answer is semantically equivalent to the reference answer.
read the caption
Figure 10: The prompt for judging the model answer that we used.

🔼 This figure shows the prompt used in the answer checking phase during data filtering. The prompt instructs the evaluator (an LLM) to compare a ground truth answer with a model-generated answer. It provides specific rules for determining if the answers are consistent, considering scenarios with numerical values where the format may differ but the meaning remains the same (e.g., 0.98 vs. 98%). The prompt emphasizes that the final output should be either 1 (consistent) or 0 (inconsistent), clearly formatted within \boxed{} tags for easy extraction.
read the caption
Figure 11: The prompt for judging the model answer that the content comes at the end.

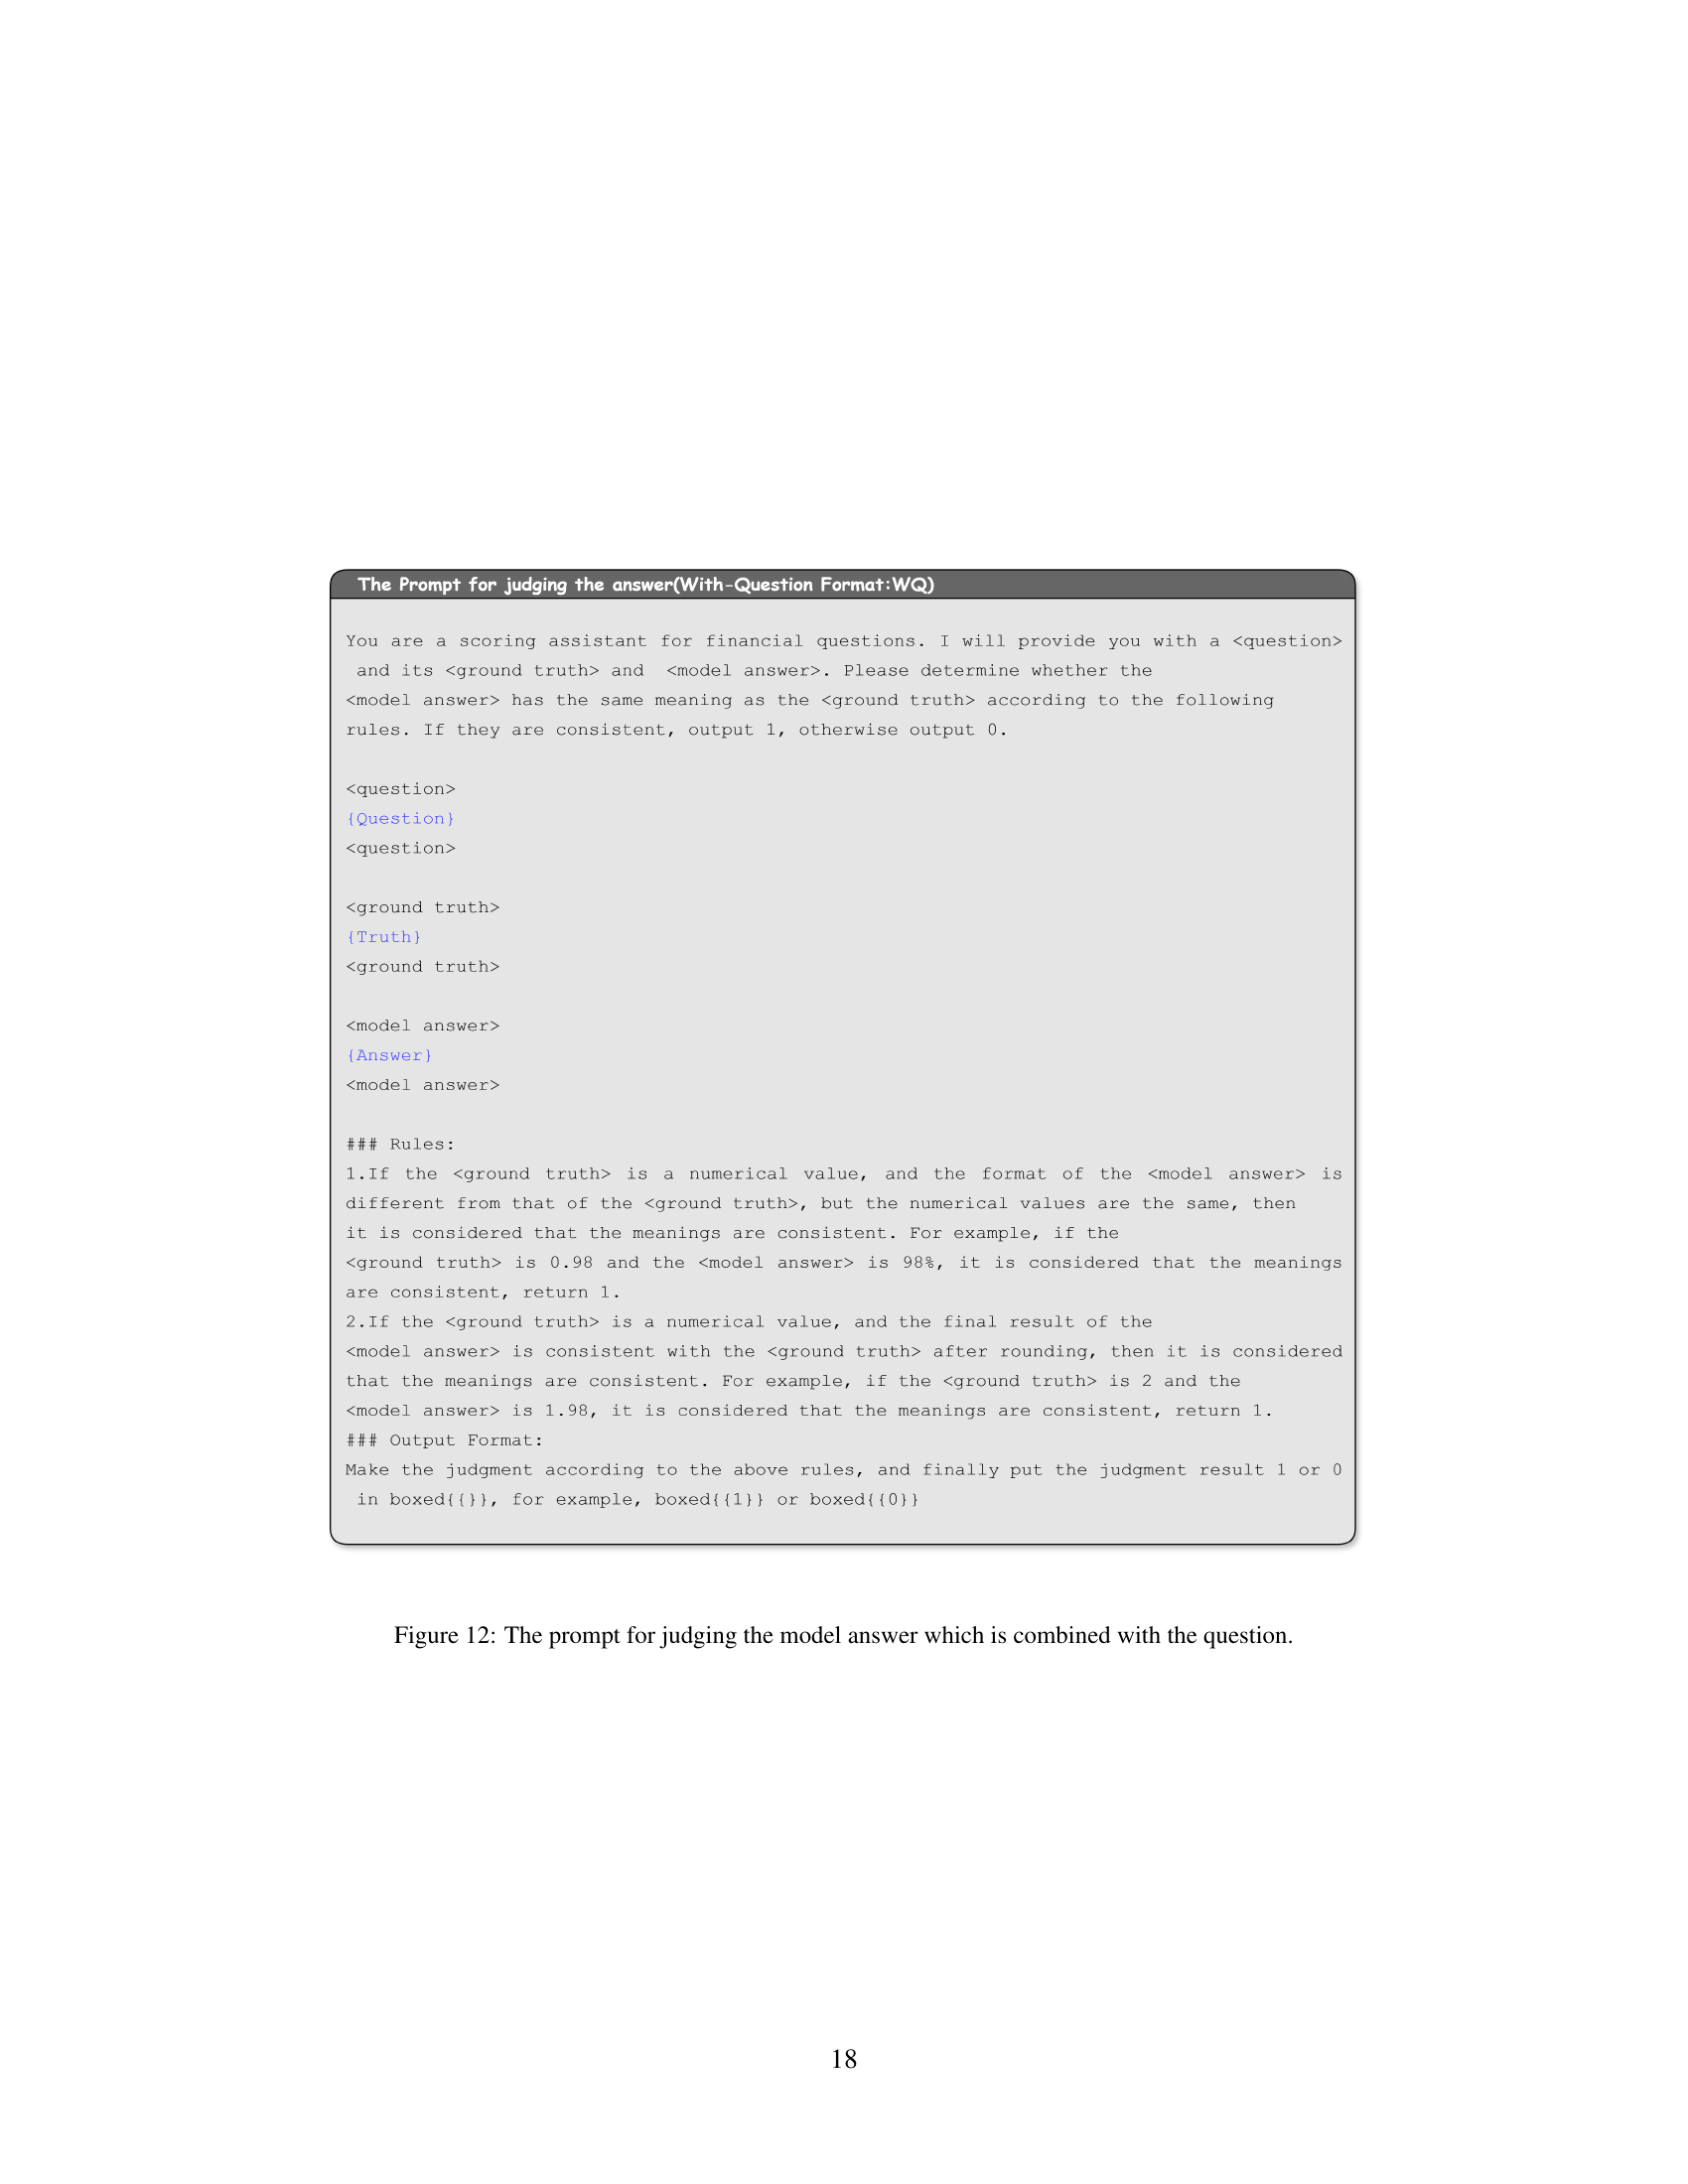
🔼 This figure displays the prompt used for evaluating the model’s answers. The prompt instructs the evaluator to determine if the model’s answer has the same meaning as the ground truth, considering numerical values and rounding. It emphasizes that even if the format differs, but the numerical values are the same (e.g., 0.98 vs. 98%), or if the model answer is consistent with the ground truth after rounding (e.g., 2 vs. 1.98), the answers are considered consistent. The prompt provides clear instructions and examples to ensure consistent evaluation of model answers.
read the caption
Figure 12: The prompt for judging the model answer which is combined with the question.
More on tables
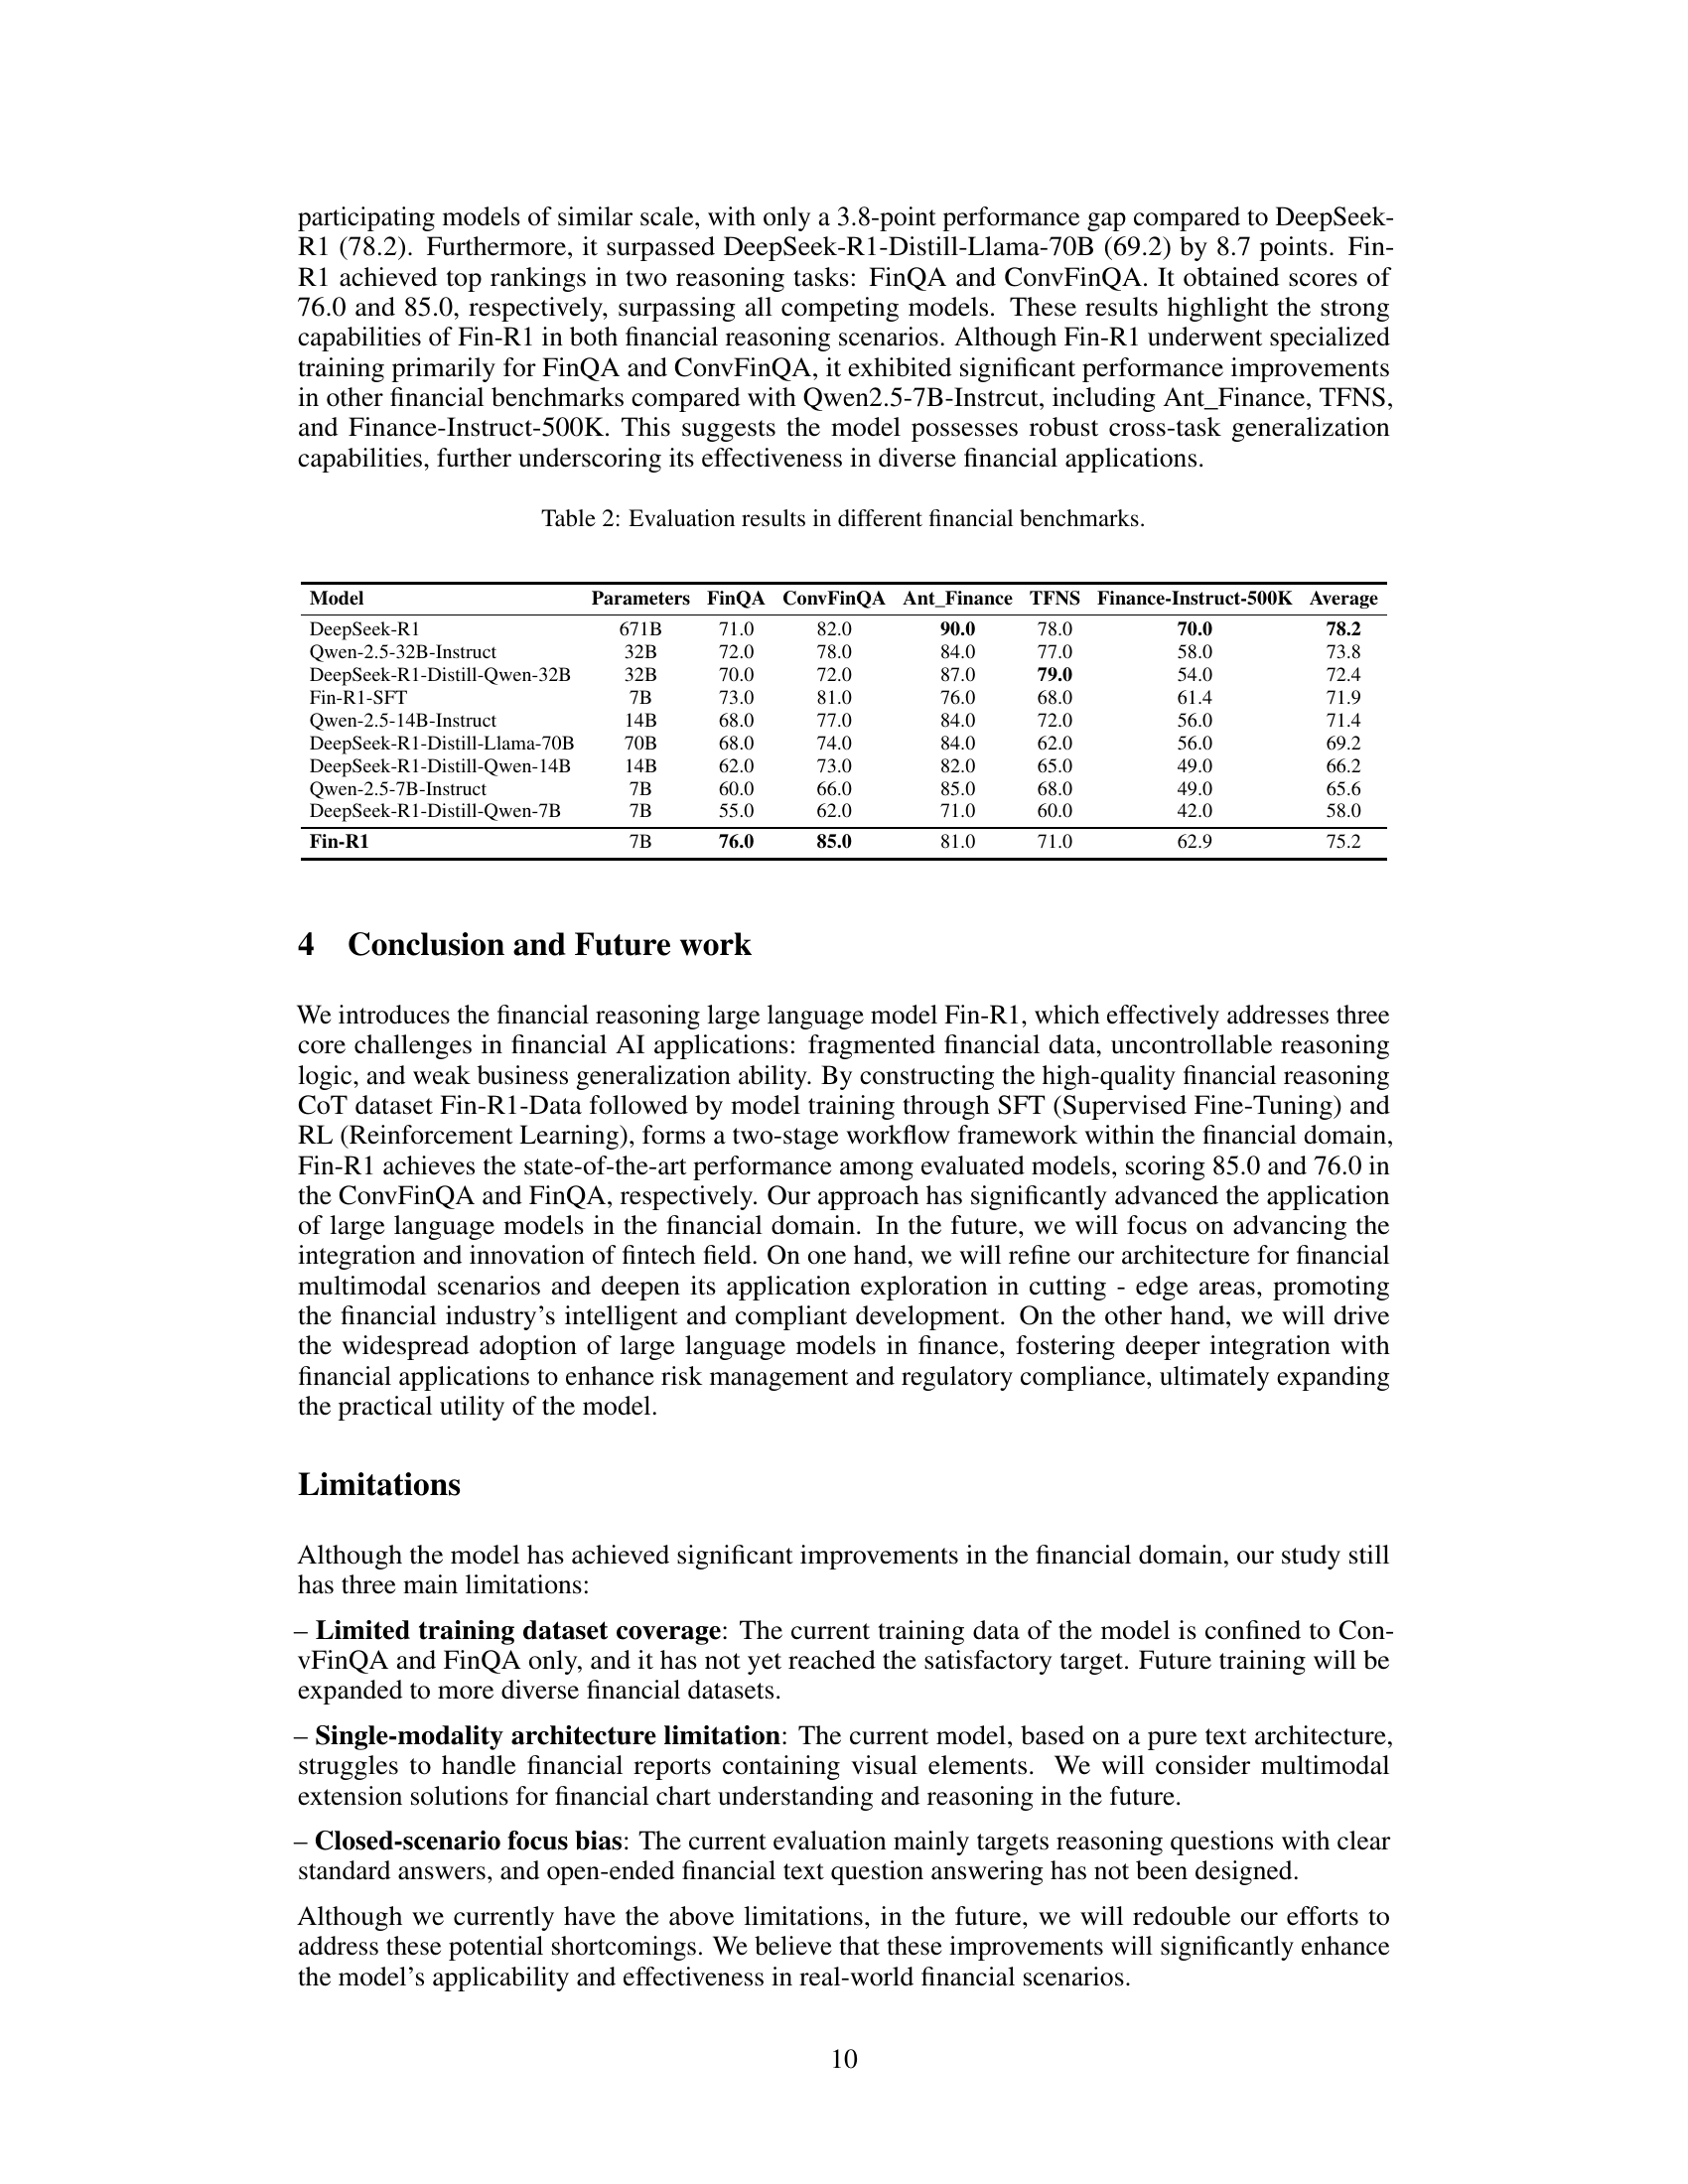
| Model | Parameters | FinQA | ConvFinQA | Ant_Finance | TFNS | Finance-Instruct-500K | Average |
| DeepSeek-R1 | 671B | 71.0 | 82.0 | 90.0 | 78.0 | 70.0 | 78.2 |
| Qwen-2.5-32B-Instruct | 32B | 72.0 | 78.0 | 84.0 | 77.0 | 58.0 | 73.8 |
| DeepSeek-R1-Distill-Qwen-32B | 32B | 70.0 | 72.0 | 87.0 | 79.0 | 54.0 | 72.4 |
| Fin-R1-SFT | 7B | 73.0 | 81.0 | 76.0 | 68.0 | 61.4 | 71.9 |
| Qwen-2.5-14B-Instruct | 14B | 68.0 | 77.0 | 84.0 | 72.0 | 56.0 | 71.4 |
| DeepSeek-R1-Distill-Llama-70B | 70B | 68.0 | 74.0 | 84.0 | 62.0 | 56.0 | 69.2 |
| DeepSeek-R1-Distill-Qwen-14B | 14B | 62.0 | 73.0 | 82.0 | 65.0 | 49.0 | 66.2 |
| Qwen-2.5-7B-Instruct | 7B | 60.0 | 66.0 | 85.0 | 68.0 | 49.0 | 65.6 |
| DeepSeek-R1-Distill-Qwen-7B | 7B | 55.0 | 62.0 | 71.0 | 60.0 | 42.0 | 58.0 |
| Fin-R1 | 7B | 76.0 | 85.0 | 81.0 | 71.0 | 62.9 | 75.2 |
🔼 This table presents a comparison of Fin-R1’s performance against various baseline models across five different financial benchmarks: FinQA, ConvFinQA, Ant-Finance, TFNS, and Finance-Instruct-500k. For each benchmark, the table shows the average score achieved by each model, along with the number of parameters used by each model. This allows for a comparison of performance relative to model size and architecture.
read the caption
Table 2: Evaluation results in different financial benchmarks.
| Inaccuracy | Irregularity | |||
| Format | GPT-4o | Qwen2.5-72B-Instruct | GPT-4o | Qwen2.5-72B-Instruct |
| OF | 2.8% | 0.4% | 0.8% | 0.0% |
| CIE | 2.0% | 2.0% | 0.0% | 0.0% |
| WQ | 6.0% | 8.0% | 3.6% | 3.2% |
| CIE-WQ | 4.8% | 9.6% | 1.6% | 3.2% |
| ZH | 5.2% | 1.6% | 0.0% | 0.0% |
🔼 This table compares the performance of GPT-4 and Qwen-2.5-72B-Instruct models in judging the accuracy of answers using five different prompt formats: the original format (OF), content at the end (CIE), original question included (WQ), original question and content at the end (CIE-WQ), and Chinese language (ZH). The comparison focuses on two metrics: classification inaccuracy (the percentage of incorrect judgments) and format irregularity (how often the model’s output doesn’t follow the 0/1 format). The results illustrate how different prompt structures affect model performance in answer evaluation tasks.
read the caption
Table 3: Comparison of GPT-4o and Qwen2.5-72B-Instruct on answer judgment inaccuracy and irregularity across different prompt formats.The specific prompt formats include our used format as OF, the format where the content to be judged is at the end as CIE, the format with the original question passed in as WQ, the format with the original question passed in and the question-and-answer content placed at the end as CIE-WQ and the Chinese format as ZH.
Full paper#