TL;DR#
Recent advances use next-token prediction to unify generation/understanding, but 3D structural tasks lag behind. These tasks in AI for Science have largely evolved independently. To address this gap, this paper introduces Uni-3DAR, a unified framework integrating 3D generation/understanding tasks via autoregressive prediction. Uni-3DAR employs hierarchical tokenization, compressing 3D space using an octree. It tokenizes fine-grained structure, capturing atom types/coordinates. Two optimizations are introduced for efficiency: a two-level subtree compression, which reduces the octree token sequence, and a masked next-token prediction tailored for varying token positions.
Uni-3DAR unifies diverse 3D generation/understanding tasks. Extensive experiments on microscopic 3D tasks (molecules, proteins, polymers, crystals) validate its effectiveness/versatility. Uni-3DAR surpasses diffusion models, achieving significant relative improvement. The method also delivers inference speeds much faster than previous methods. The code is publicly available, inviting further research and development in this area. The model achieves gains in efficiency while also setting a new state of the art in performance.
Key Takeaways#
Why does it matter?#
This paper introduces Uni-3DAR, offering a unified approach to 3D structural tasks. Its efficiency gains and versatile framework provide researchers with new tools for exploring and understanding 3D data, potentially accelerating discoveries in AI for science.
Visual Insights#
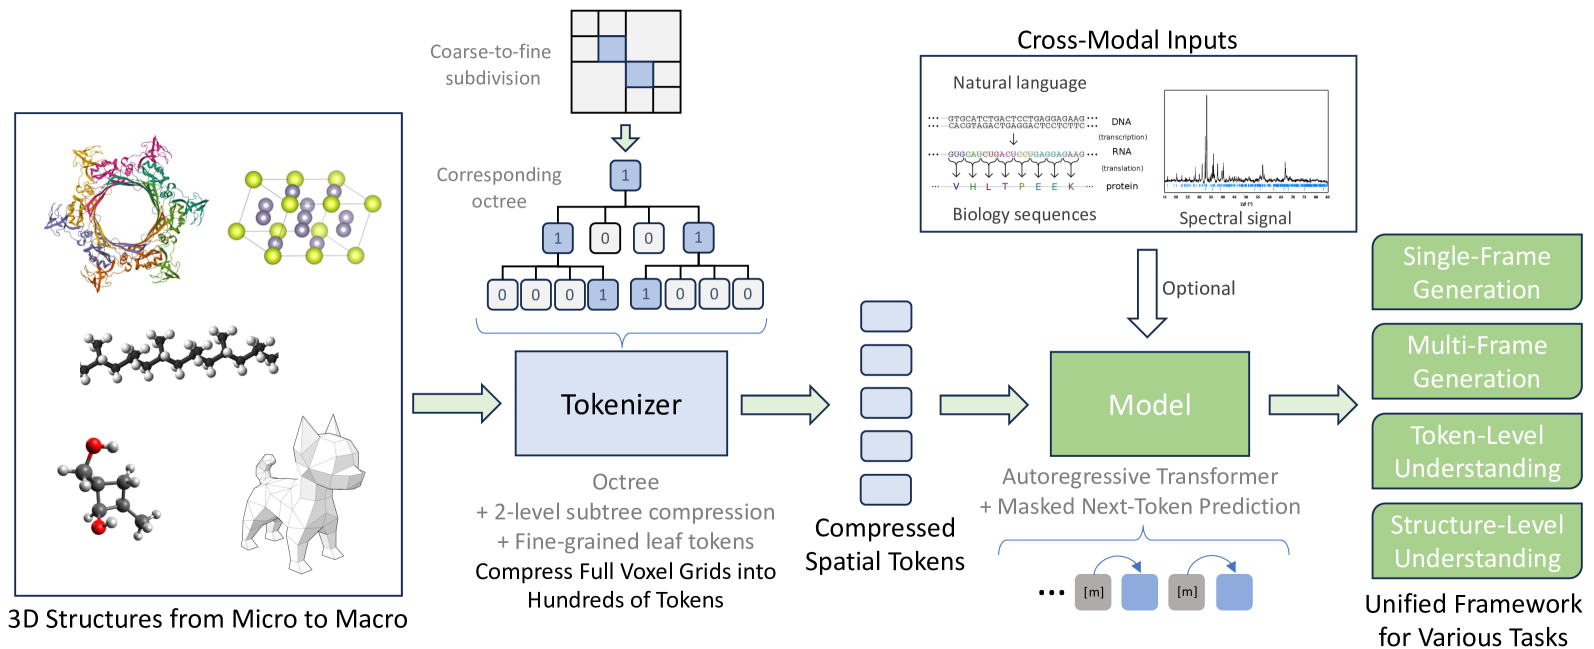
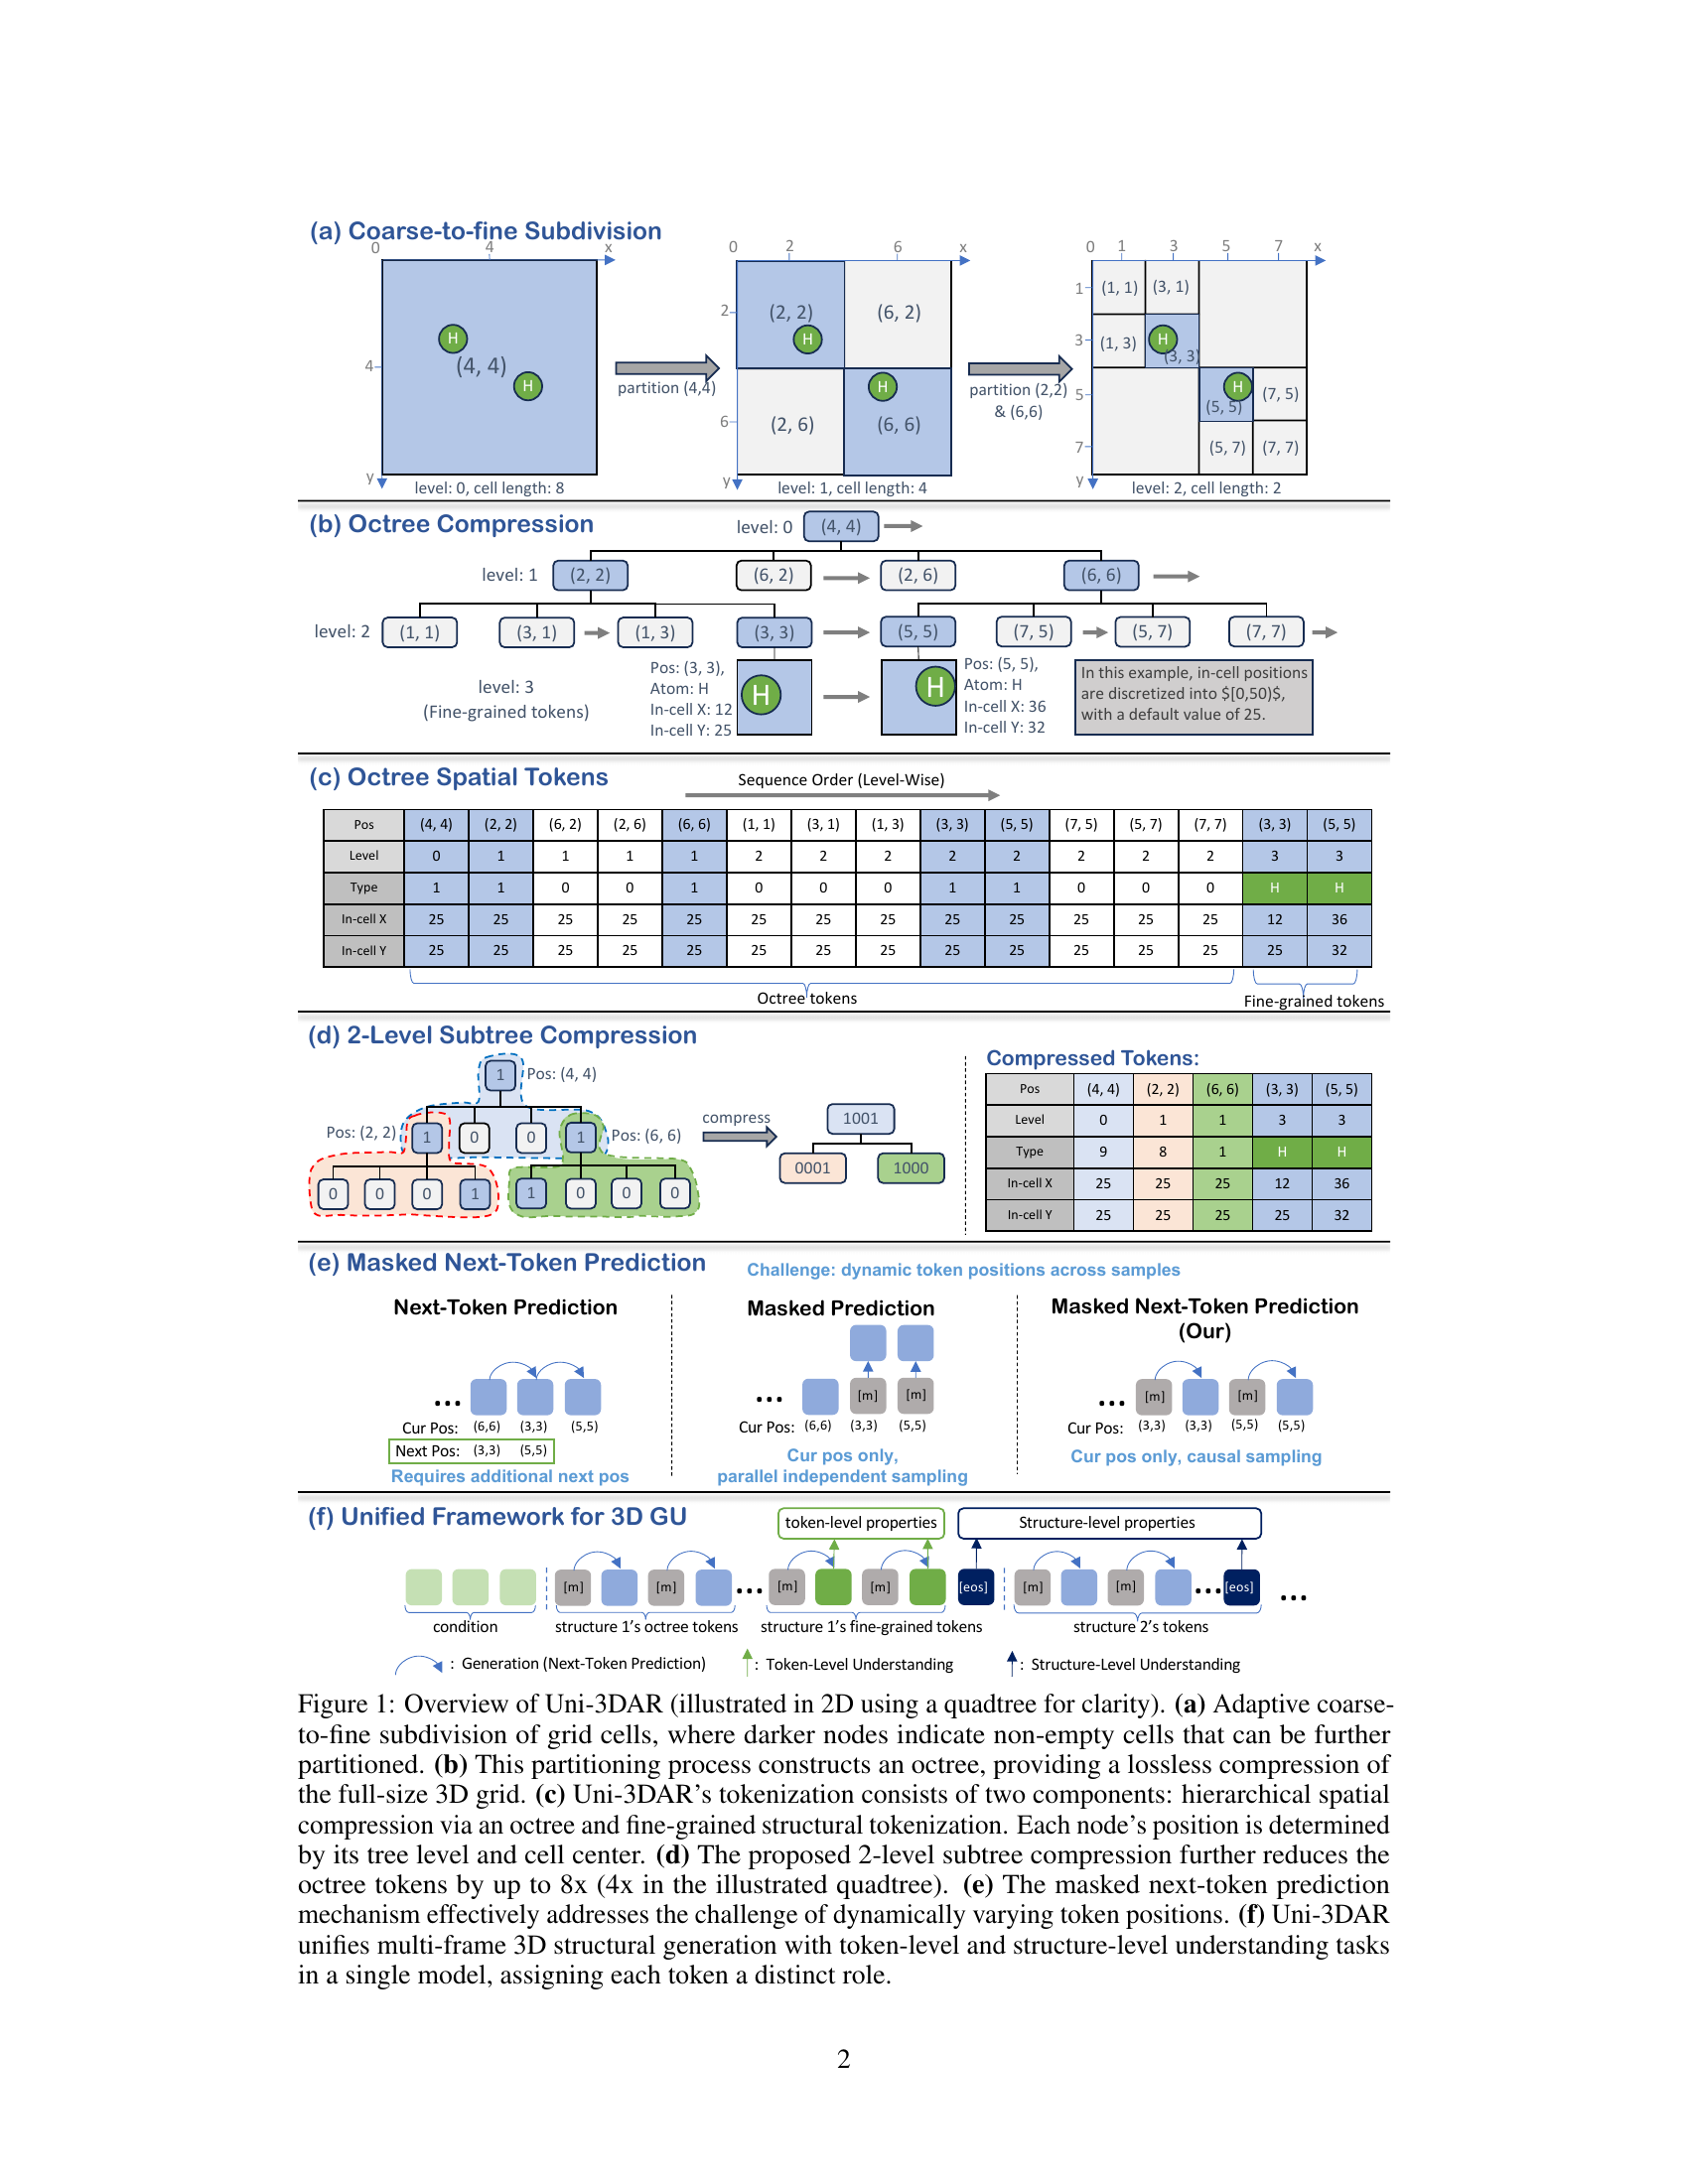
🔼 This figure provides a comprehensive overview of the Uni-3DAR model. Panel (a) illustrates the adaptive coarse-to-fine subdivision of grid cells used to construct the octree. Panel (b) shows how the octree is built and compresses the full 3D grid. Panel (c) explains Uni-3DAR’s two-component tokenization: hierarchical spatial compression via an octree and a fine-grained structural tokenization. Panel (d) presents the 2-level subtree compression optimization which reduces the octree token sequence. Panel (e) illustrates the masked next-token prediction mechanism, showing how it addresses the problem of dynamically varying token positions in Uni-3DAR. Lastly, panel (f) shows the unified framework for 3D generation and understanding tasks within Uni-3DAR.
read the caption
Figure 1: Overview of Uni-3DAR (illustrated in 2D using a quadtree for clarity). (a) Adaptive coarse-to-fine subdivision of grid cells, where darker nodes indicate non-empty cells that can be further partitioned. (b) This partitioning process constructs an octree, providing a lossless compression of the full-size 3D grid. (c) Uni-3DAR’s tokenization consists of two components: hierarchical spatial compression via an octree and fine-grained structural tokenization. Each node’s position is determined by its tree level and cell center. (d) The proposed 2-level subtree compression further reduces the octree tokens by up to 8x (4x in the illustrated quadtree). (e) The masked next-token prediction mechanism effectively addresses the challenge of dynamically varying token positions. (f) Uni-3DAR unifies multi-frame 3D structural generation with token-level and structure-level understanding tasks in a single model, assigning each token a distinct role.
| Section | Data Type | Single-Frame Gen. | Multi-Frame Gen. | Token Und. | Structure Und. |
| Sec. 3.1 | Molecule | ✓ | |||
| Sec. 3.2 | Crystal + PXRD | ✓ | |||
| Sec. 3.3 | Protein | ✓ | ✓ | ||
| Sec. 3.4 | Protein + Molecule | ✓ | |||
| Sec. 3.5 | Molecule | ✓ | ✓ | ||
| Sec. 3.6 | Polymer | ✓ | ✓ |
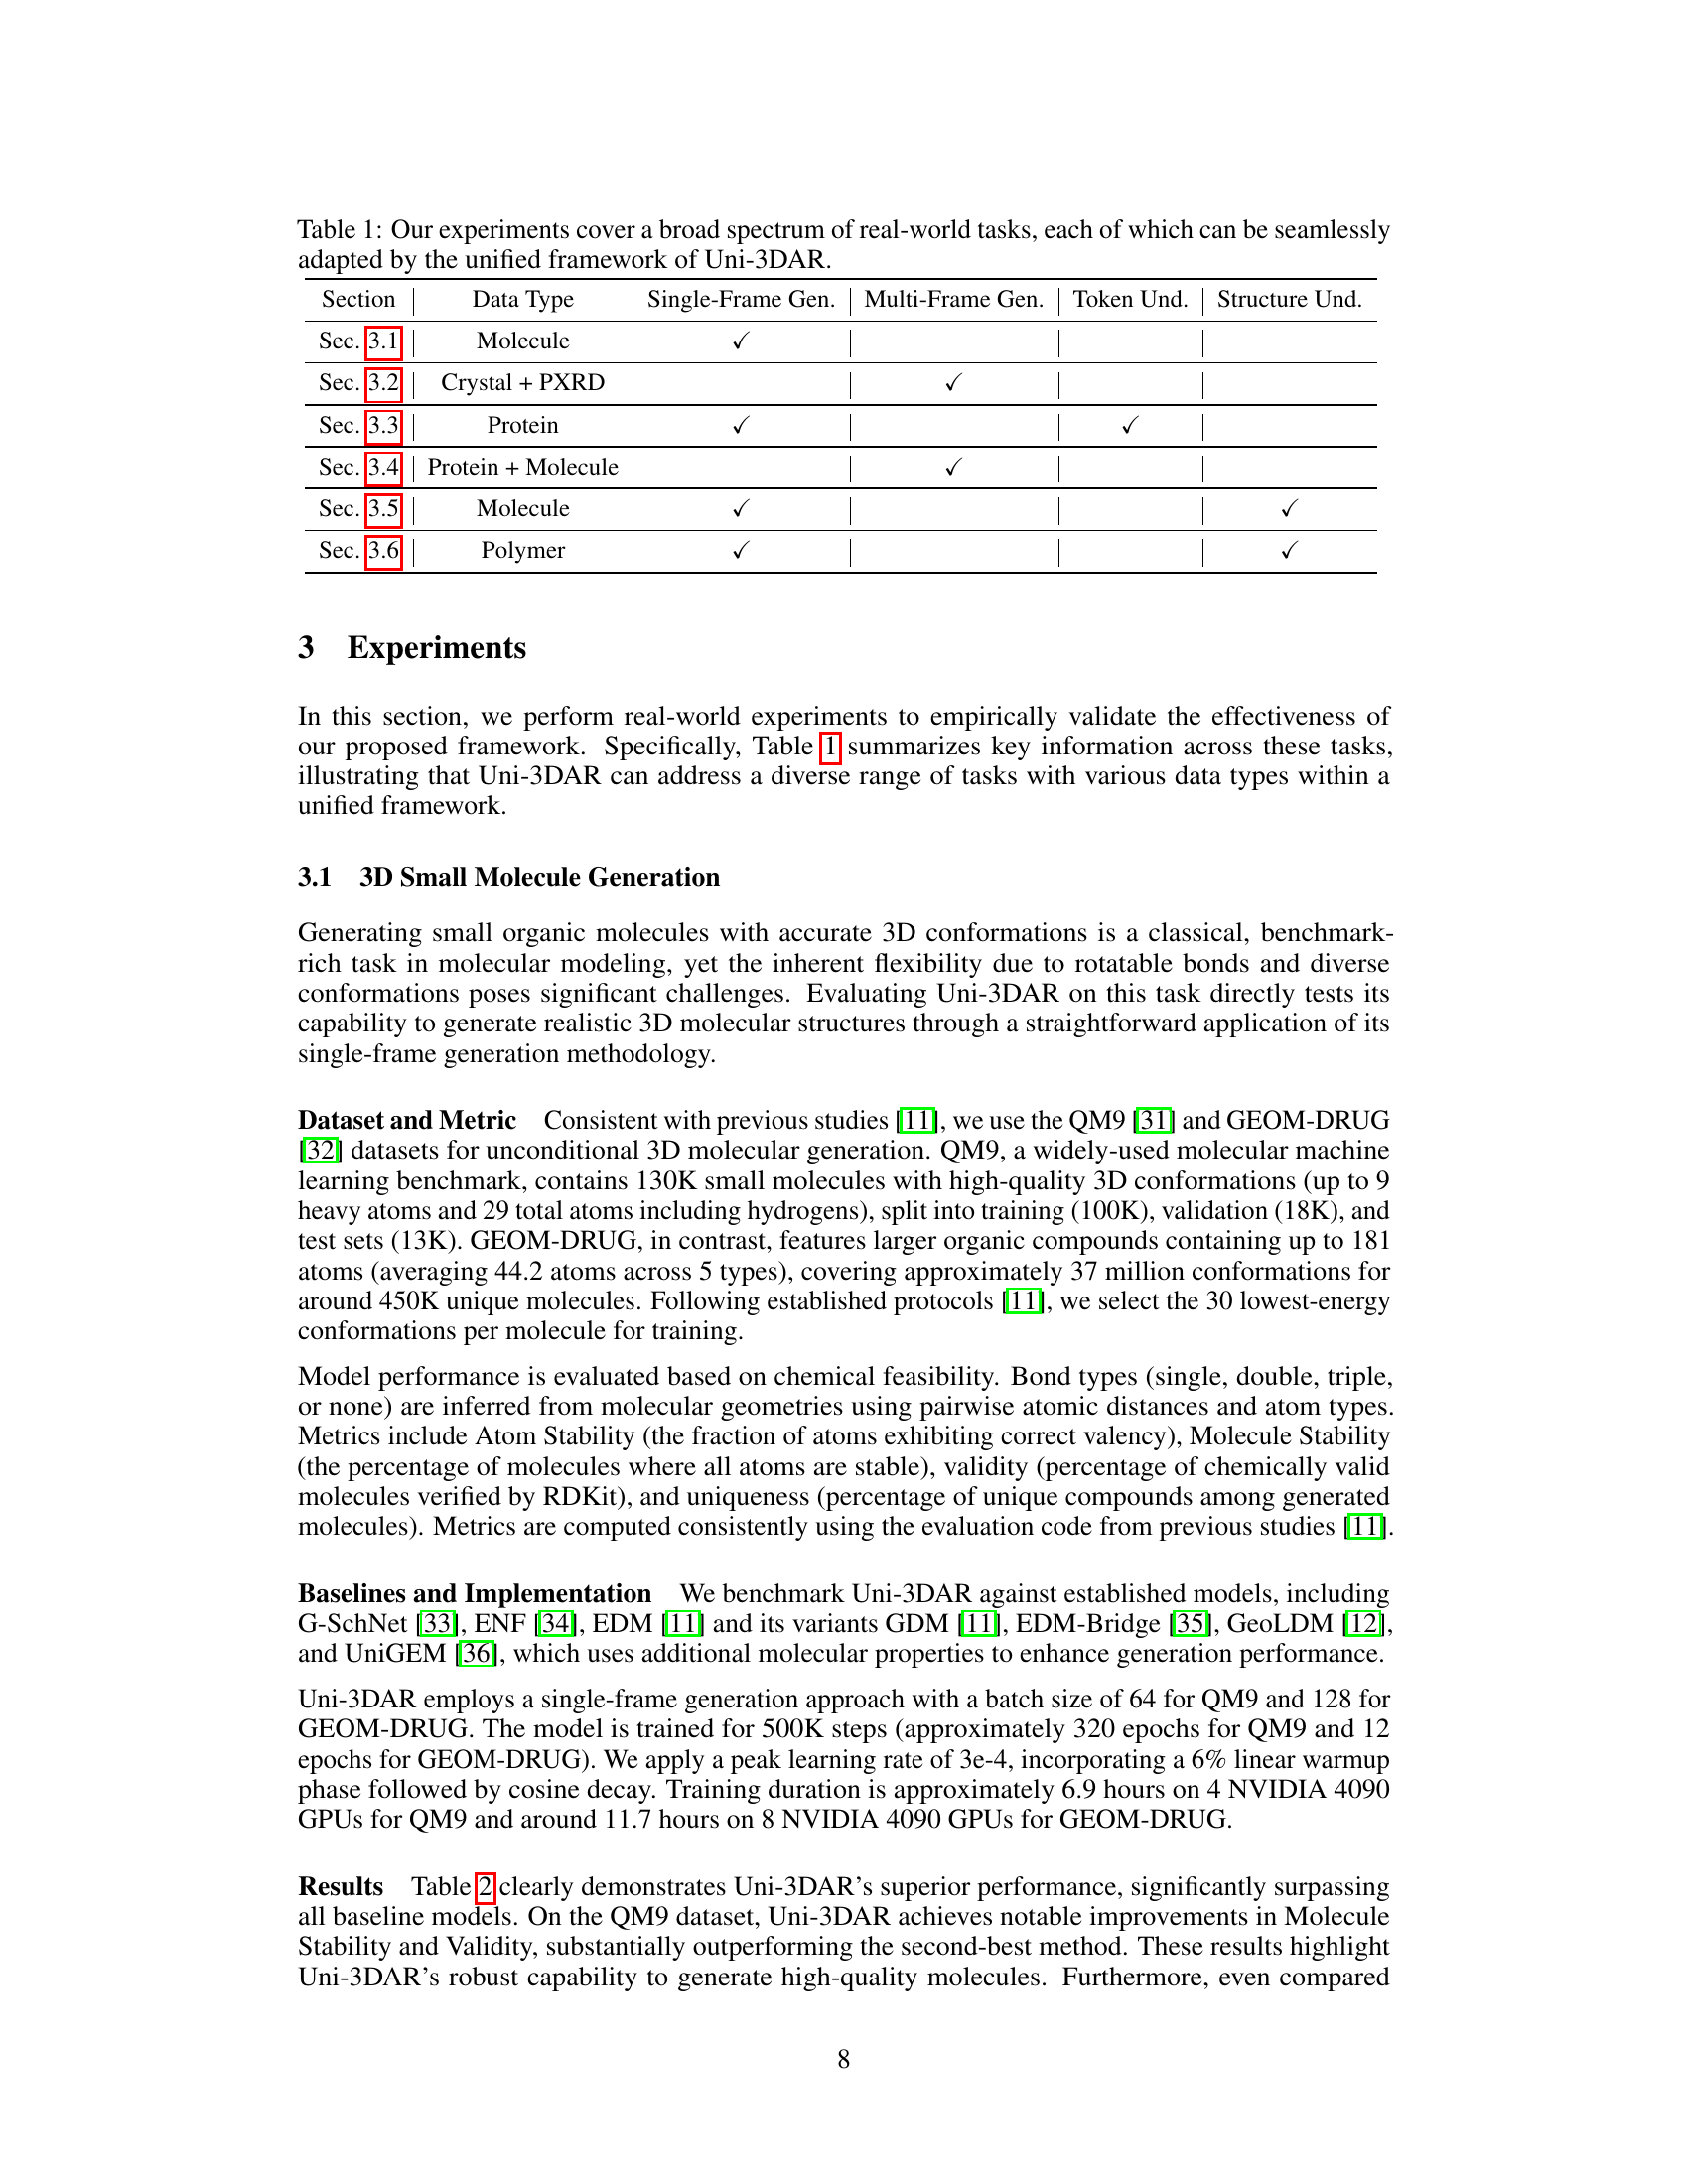
🔼 This table summarizes the various real-world applications that are addressed by the Uni-3DAR framework. It categorizes different tasks based on the type of 3D data (Molecules, Crystals, Proteins, or Polymers) and the nature of the task (Single-Frame Generation, Multi-Frame Generation, Token-level Understanding, or Structure-level Understanding). A checkmark indicates that the task can be performed using the Uni-3DAR framework. The table highlights the framework’s versatility and broad applicability in solving various 3D structural problems.
read the caption
Table 1: Our experiments cover a broad spectrum of real-world tasks, each of which can be seamlessly adapted by the unified framework of Uni-3DAR.
In-depth insights#
Uni-3DAR Intro#
The paper introduces Uni-3DAR, a novel framework unifying 3D generation and understanding through autoregressive prediction. It addresses the limitations of existing methods by using a hierarchical tokenization strategy based on octrees, which efficiently compresses 3D space while preserving spatial context. Two key optimizations enhance efficiency: 2-level subtree compression and masked next-token prediction. This allows Uni-3DAR to outperform previous state-of-the-art diffusion models significantly in both accuracy and inference speed, unifying diverse 3D tasks like molecule, protein, polymer and crystal modelling.
Tokenization Adv.#
The paper introduces a novel hierarchical tokenization method for 3D structures. It leverages an octree to compress 3D space, capitalizing on the inherent sparsity of such structures. This is augmented with fine-grained tokenization to capture details like atom types and spatial coordinates. This method efficiently compresses the 3D grid, addressing limitations of point-based and voxel-based approaches. The octree efficiently compresses 3D space, and a two-level subtree compression strategy further reduces sequence length. The method concatenates tokens level-by-level to produce a coarse-to-fine 1D token sequence. The fine-grained structural tokenization enables the encoding of essential details like atom types and precise coordinates for microscopic 3D structures. To solve the dynamic tokens’ positions problem, the team uses a masked next-token prediction strategy.
Masked Predic.#
In the context of the document, “Masked Predic.” likely refers to masked prediction techniques, a common strategy in machine learning. This technique involves selectively masking parts of the input data and training the model to predict the masked portions. It has proven effective in various domains, including natural language processing (NLP) where it is used to pretrain models like BERT. The document likely explores how masked prediction can be adapted for 3D structural data. Key benefits of masking include enabling bidirectional context learning and reducing reliance on specific input orderings. The challenge here might be efficiently applying it to hierarchical or spatial data. Success lies in designing a suitable masking strategy that preserves relevant information and aligns with the 3D structure’s properties. The framework would also need to consider the impact on computational costs. Optimizations that make masked prediction tractable for large and complex 3D structures would be essential.
3D Task Unifier#
The concept of a ‘3D Task Unifier’ is compelling, suggesting a framework that integrates diverse 3D tasks (generation, understanding, manipulation) into a single architecture. This would move beyond task-specific models, enabling transfer learning and synergistic improvements. Key challenges include finding a common representation for diverse 3D data (point clouds, meshes, voxels) and designing an architecture capable of handling varying input/output formats and task requirements. Such a unifier necessitates robust 3D understanding, leveraging geometric priors and spatial relationships. Furthermore, effectively balancing performance across different tasks and preventing negative transfer are critical considerations for a successful ‘3D Task Unifier’.
Beyond Micro.?#
When considering expanding beyond microscopic scales in 3D structure modeling, new challenges and opportunities emerge. Computational cost becomes a significant factor as the size and complexity of the structures increase. Efficient data structures and algorithms are needed to handle the larger datasets. Multi-scale modeling approaches could be employed to represent different levels of detail at different scales. Understanding interactions between different scales will also become important. For instance, how do microscopic properties affect macroscopic behavior? Such problems requires models capable of bridging these scales. Further, data acquisition becomes harder. The data will be collected from different sources and modalities. It is important to consider integration of different modalities for better insights and prediction. This integration will require robust methods for data fusion and alignment. Finally, visualization and interpretation of the models will be crucial to extract meaningful insights. New tools will be needed for the exploration and analysis of large, complex 3D structures.
More visual insights#
More on figures

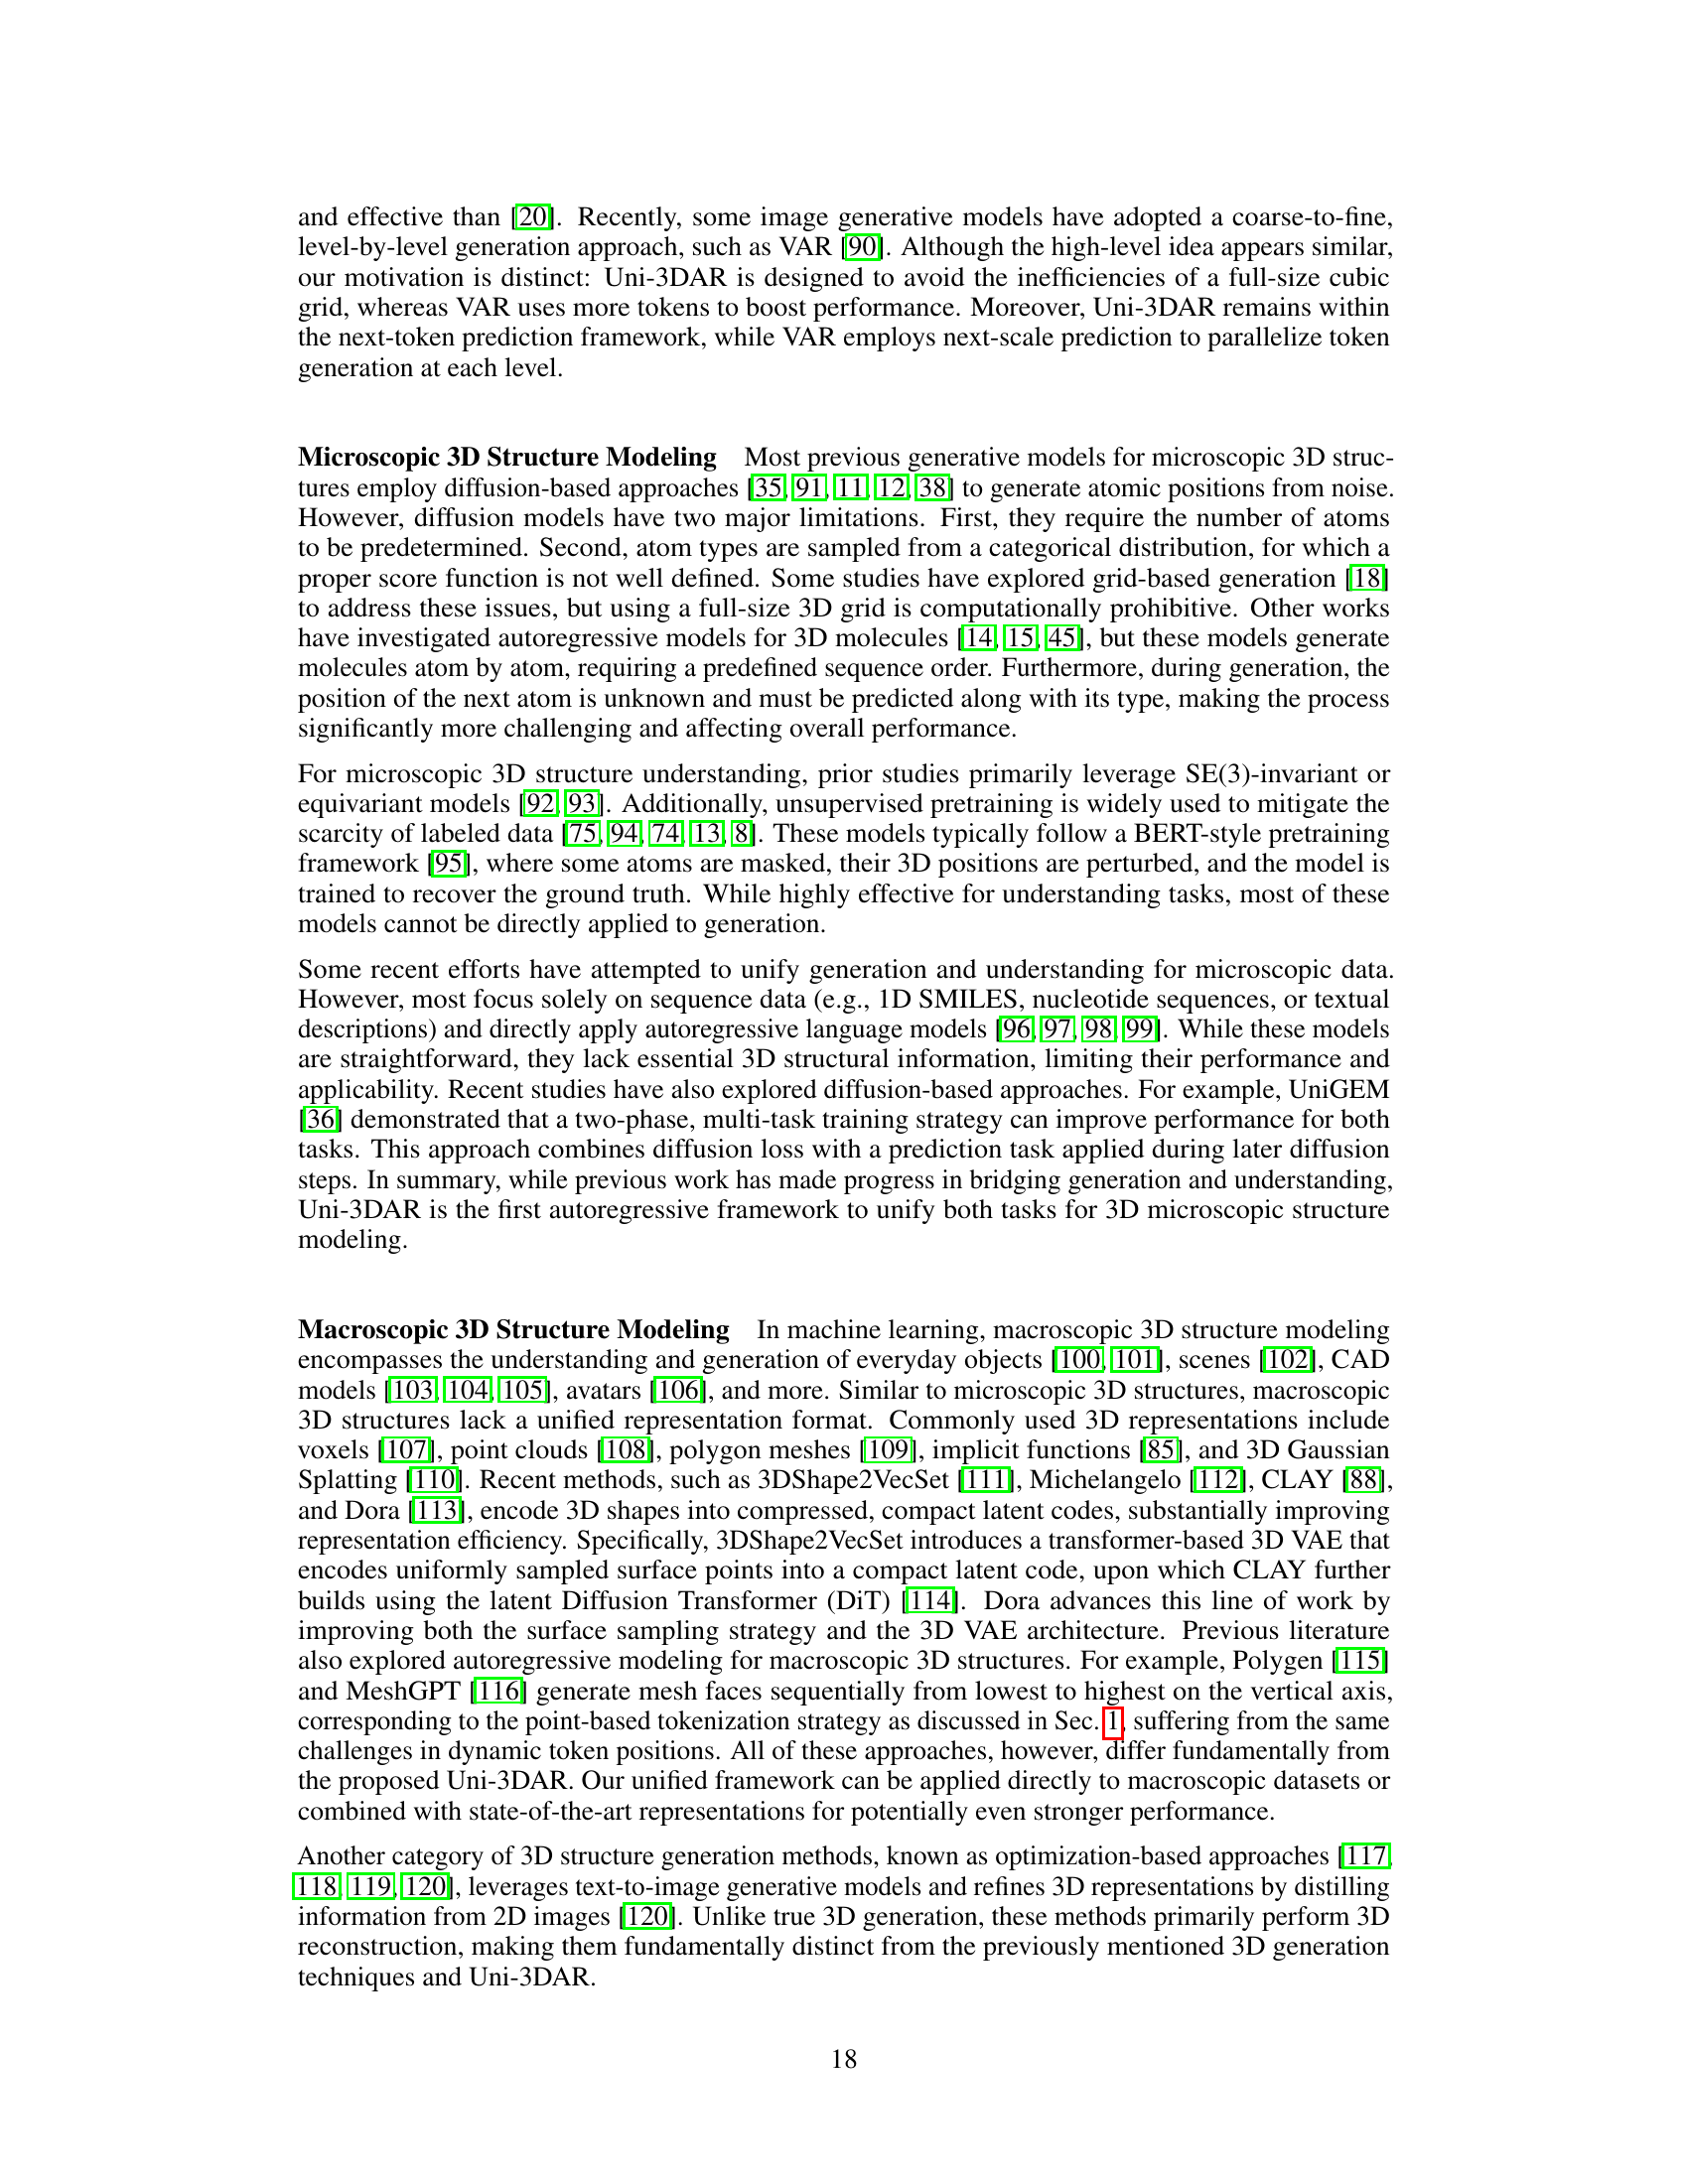
🔼 Figure 2 presents a comparison of Uni-3DAR’s inference speed against a diffusion-based generative model (GeoLDM). The left panel shows the throughput (molecules generated per second) for various batch sizes, demonstrating that Uni-3DAR significantly outperforms GeoLDM across all batch sizes, achieving up to a 21.8x speedup at larger batch sizes and a 7.5x speedup at a batch size of 64. The right panel illustrates the impact of the rank ratio (𝑟) parameter, which controls the diversity of sampling, on Uni-3DAR’s generation speed, showing its efficiency even with diverse sampling.
read the caption
Figure 2: Left: Uni-3DAR generation speed on different batch sizes compared with the diffusion-based method; Right: Uni-3DAR generation speed on different rank ratios r𝑟ritalic_r compared with the diffusion-based method (higher is better).

🔼 This figure showcases examples of 3D molecular structures generated by the Uni-3DAR model without any specific input or conditioning. The structures were generated as part of the unconditional generation experiment on the QM9 dataset, a benchmark dataset commonly used in molecular machine learning. Each structure represents a different small molecule, highlighting the model’s ability to generate a diverse range of realistic and chemically plausible 3D conformations.
read the caption
Figure SI-1: Unconditional 3D molecular generation samples of QM9 dataset.

🔼 This figure displays various 3D molecular structures generated by the Uni-3DAR model. The structures are from the GEOM-DRUG dataset which contains larger organic molecules compared to the QM9 dataset. The figure visually demonstrates Uni-3DAR’s ability to generate diverse, complex, and chemically plausible 3D molecular structures with many atoms, showing its effectiveness for this challenging task.
read the caption
Figure SI-2: Unconditional 3D molecular generation samples of GEOM-DRUG dataset.
More on tables
| QM9 | DRUG | |||||
| Atom Sta(%) | Mol Sta(%) | Valid(%) | V U(%) | Atom Sta(%) | Valid(%) | |
| Data | 99.0 | 95.2 | 97.7 | 97.7 | 86.5 | 99.9 |
| ENF [34] | 85.0 | 4.9 | 40.2 | 39.4 | - | - |
| G-Schnet [33] | 95.7 | 68.1 | 85.5 | 80.3 | - | - |
| GDM [11] | 97.0 | 63.2 | - | - | 75.0 | 90.8 |
| GDM-AUG [11] | 97.6 | 71.6 | 90.4 | 89.5 | 77.7 | 91.8 |
| EDM [11] | 98.7 | 82.0 | 91.9 | 90.7 | 81.3 | 92.6 |
| EDM-Bridge [35] | 98.8 | 84.6 | 92.0 | 90.7 | 82.4 | 92.8 |
| GeoLDM [12] | 98.9 | 89.4 | 93.8 | 92.7 | 84.4 | 99.3 |
| UniGEM* [36] | 99.0 | 89.8 | 95.0 | 93.2 | 85.1 | 98.4 |
| Uni-3DAR | 99.4 | 93.7 | 98.0 | 94.0 | 85.5 | 99.4 |
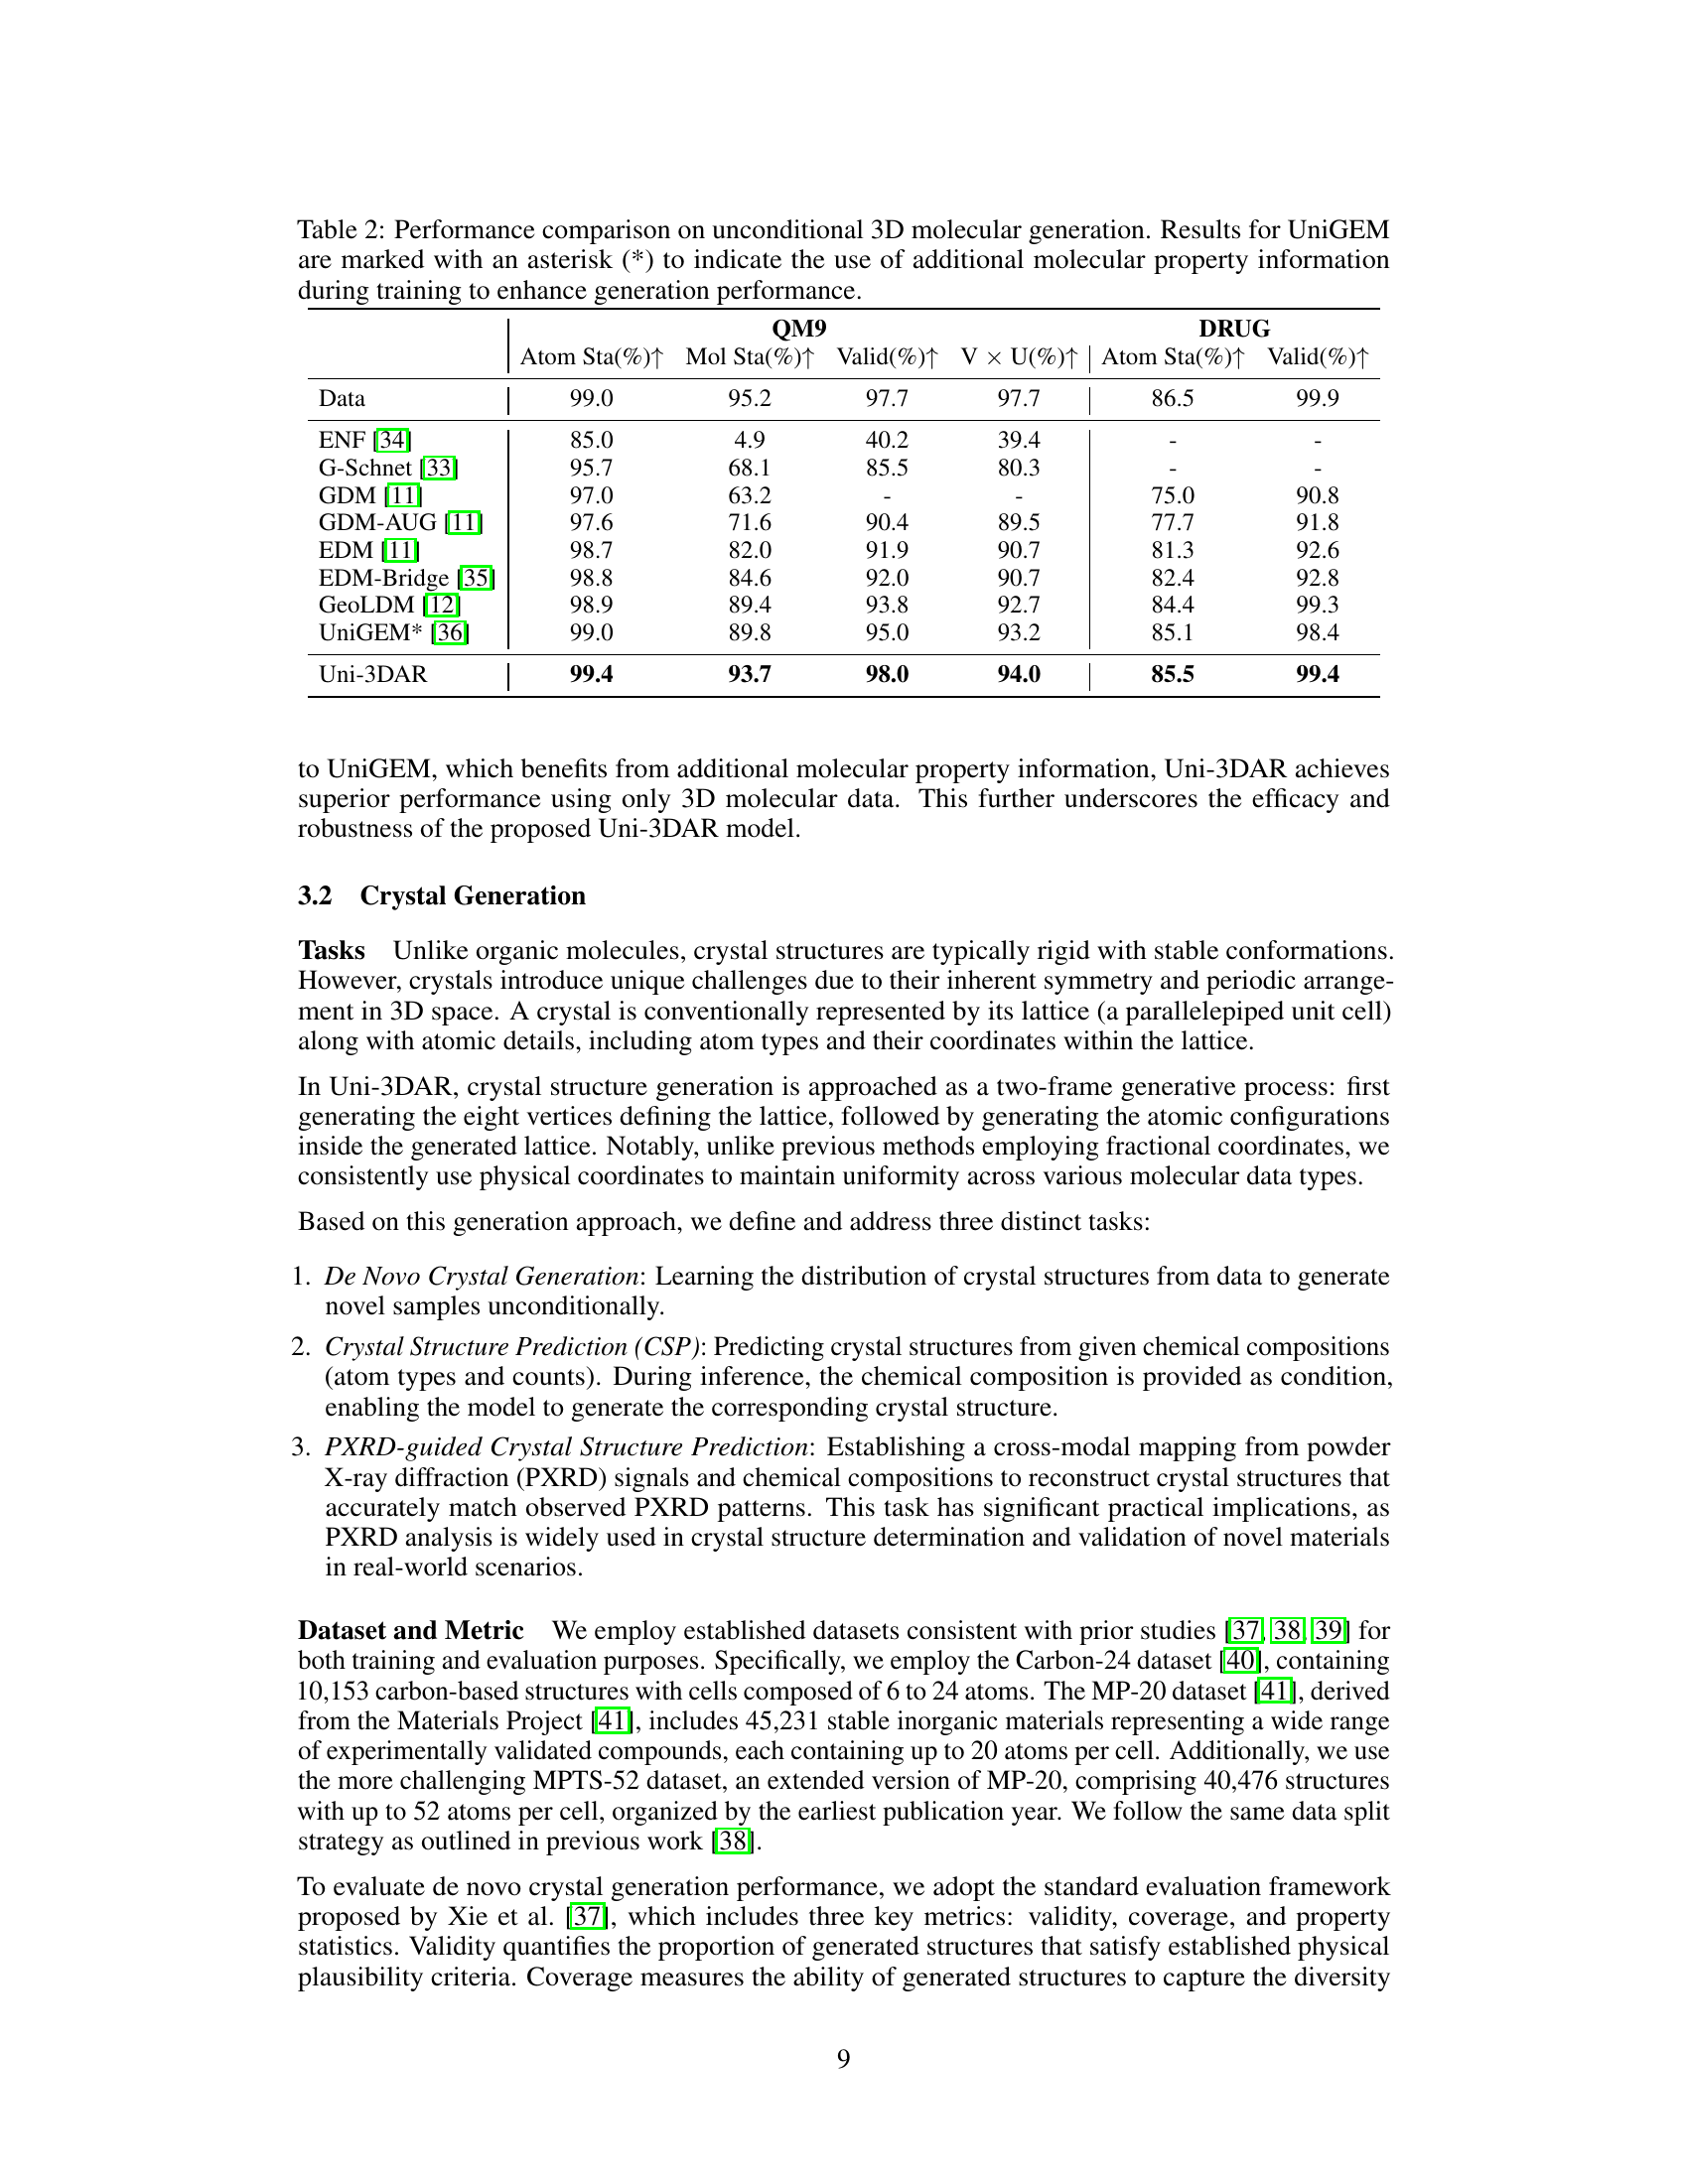
🔼 This table compares the performance of Uni-3DAR against other state-of-the-art models on the task of generating small organic molecules with accurate 3D conformations. The metrics used include atom stability, molecule stability, validity, and uniqueness. The QM9 and GEOM-DRUG datasets were used for evaluation, and UniGEM’s results are marked with an asterisk to indicate the use of additional molecular property information during training. This highlights Uni-3DAR’s performance relative to others, particularly in terms of generating chemically valid and unique molecules, even when compared to methods leveraging additional input data.
read the caption
Table 2: Performance comparison on unconditional 3D molecular generation. Results for UniGEM are marked with an asterisk (*) to indicate the use of additional molecular property information during training to enhance generation performance.
| Data | Method | Validity (%) | Coverage (%) | Property | ||||
| Struc. | Comp. | COV-R | COV-P | |||||
| Carbon-24 | FTCP [43] | 0.08 | – | 0.00 | 0.00 | 5.206 | 19.05 | – |
| G-SchNet [44] | 99.94 | – | 0.00 | 0.00 | 0.9427 | 1.320 | – | |
| P-G-SchNet [44] | 48.39 | – | 0.00 | 0.00 | 1.533 | 134.7 | – | |
| CDVAE [37] | 100.0 | – | 99.80 | 83.08 | 0.1407 | 0.2850 | – | |
| DiffCSP [38] | 100.0 | – | 99.90 | 97.27 | 0.0805 | 0.0820 | – | |
| Uni-3DAR | 99.99 | – | 100.0 | 98.16 | 0.0660 | 0.0289 | – | |
| MP-20 | FTCP [43] | 1.55 | 48.37 | 4.72 | 0.09 | 23.71 | 160.9 | 0.7363 |
| G-SchNet [44] | 99.65 | 75.96 | 38.33 | 99.57 | 3.034 | 42.09 | 0.6411 | |
| P-G-SchNet [44] | 77.51 | 76.40 | 41.93 | 99.74 | 4.04 | 2.448 | 0.6234 | |
| CDVAE [37] | 100.0 | 86.70 | 99.15 | 99.49 | 0.6875 | 0.2778 | 1.432 | |
| DiffCSP [38] | 100.0 | 83.25 | 99.71 | 99.76 | 0.3502 | 0.1247 | 0.3398 | |
| FlowMM [39] | 96.85 | 83.19 | 99.49 | 99.58 | 0.239 | – | 0.083 | |
| Uni-3DAR | 99.89 | 90.31 | 99.62 | 99.83 | 0.4768 | 0.1237 | 0.0694 | |
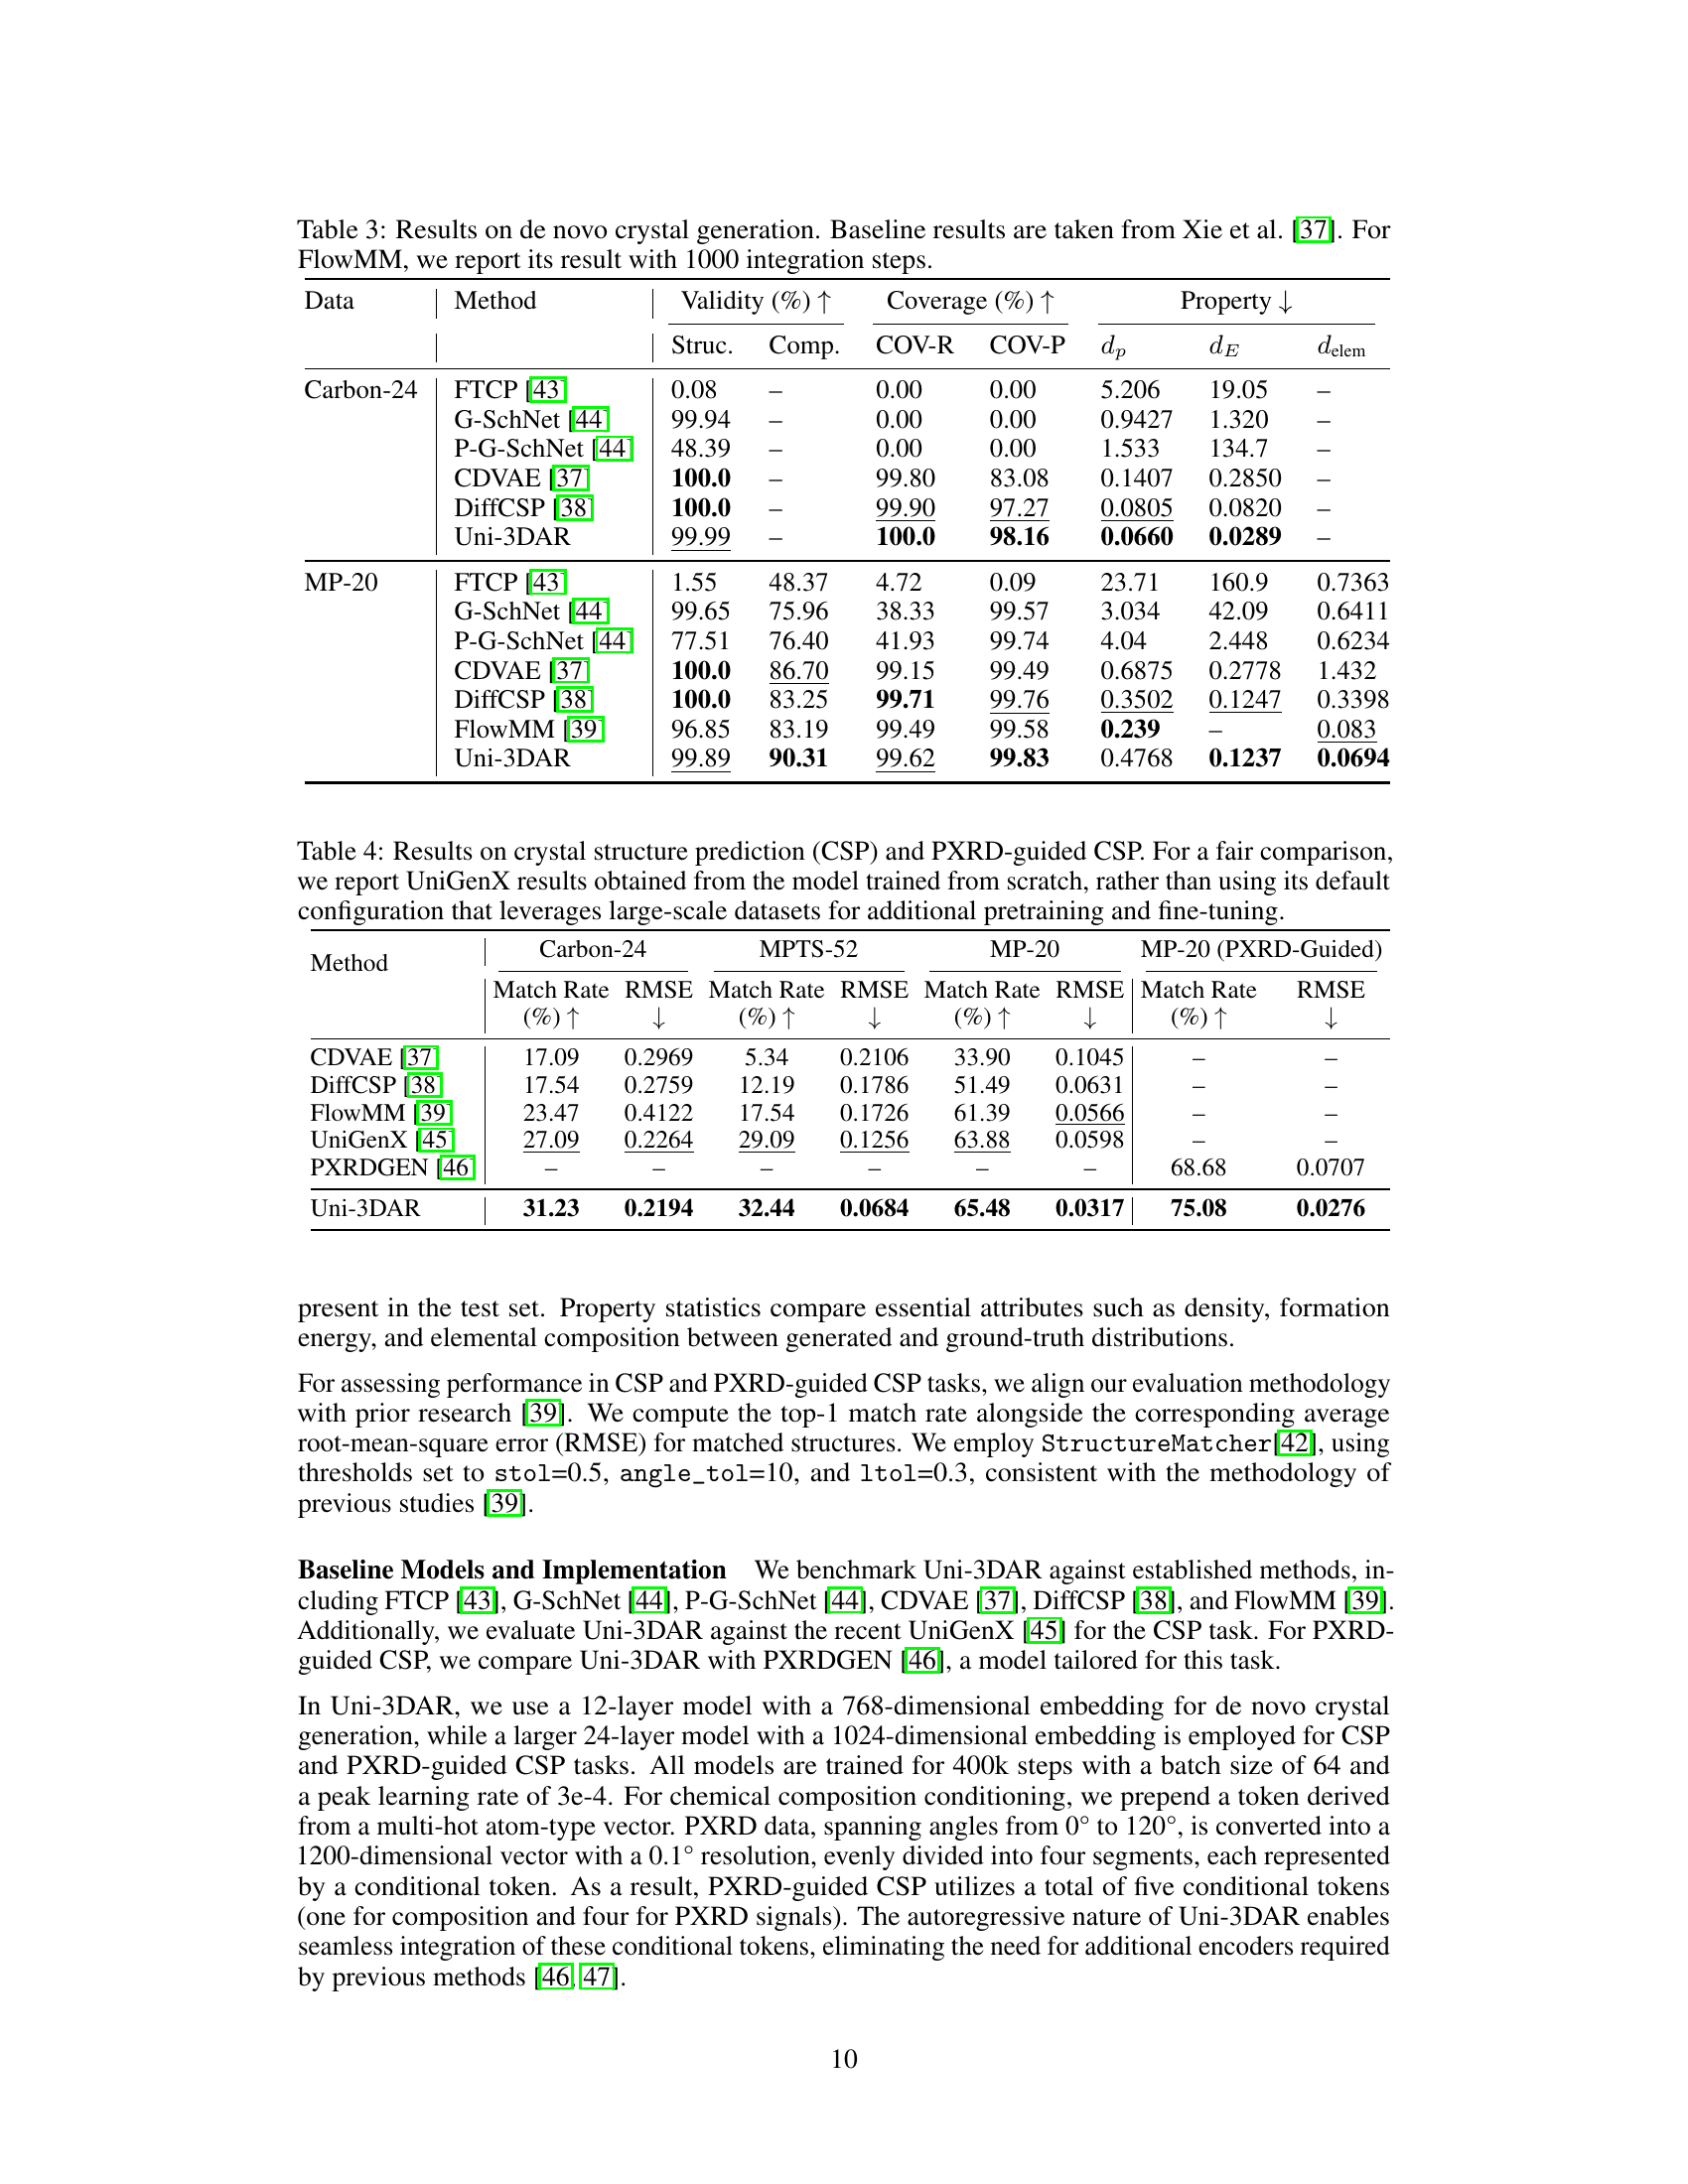
🔼 Table 3 presents the results of de novo crystal generation experiments, comparing the performance of Uni-3DAR against several baseline methods. The metrics used are Validity (percentage of generated structures that meet physical plausibility criteria), Coverage (how well the generated structures represent the diversity of the dataset), and Property statistics (how close the properties of generated structures are to the ground truth). The dataset used is Carbon-24 and MP-20. For FlowMM, the results reported are based on running 1000 integration steps. This table allows for comparison of Uni-3DAR’s performance to other methods in the area of crystal generation.
read the caption
Table 3: Results on de novo crystal generation. Baseline results are taken from Xie et al. [37]. For FlowMM, we report its result with 1000 integration steps.
| Method | Carbon-24 | MPTS-52 | MP-20 | MP-20 (PXRD-Guided) | |||||||||||||||||||
|
|
|
|
|
|
|
| ||||||||||||||||
| CDVAE [37] | 17.09 | 0.2969 | 5.34 | 0.2106 | 33.90 | 0.1045 | – | – | |||||||||||||||
| DiffCSP [38] | 17.54 | 0.2759 | 12.19 | 0.1786 | 51.49 | 0.0631 | – | – | |||||||||||||||
| FlowMM [39] | 23.47 | 0.4122 | 17.54 | 0.1726 | 61.39 | 0.0566 | – | – | |||||||||||||||
| UniGenX [45] | 27.09 | 0.2264 | 29.09 | 0.1256 | 63.88 | 0.0598 | – | – | |||||||||||||||
| PXRDGEN [46] | – | – | – | – | – | – | 68.68 | 0.0707 | |||||||||||||||
| Uni-3DAR | 31.23 | 0.2194 | 32.44 | 0.0684 | 65.48 | 0.0317 | 75.08 | 0.0276 | |||||||||||||||
🔼 This table presents the results of crystal structure prediction (CSP) and PXRD-guided CSP experiments. For a fair comparison with UniGenX, the results shown are from a model trained from scratch without any additional large-scale pretraining or fine-tuning, which UniGenX usually employs. The table compares the performance of Uni-3DAR against other existing methods and shows metrics such as match rate and RMSE to evaluate the accuracy of crystal structure prediction based on chemical composition (CSP) and powder X-ray diffraction data (PXRD-guided CSP).
read the caption
Table 4: Results on crystal structure prediction (CSP) and PXRD-guided CSP. For a fair comparison, we report UniGenX results obtained from the model trained from scratch, rather than using its default configuration that leverages large-scale datasets for additional pretraining and fine-tuning.
| Match Rate |
| (%) |
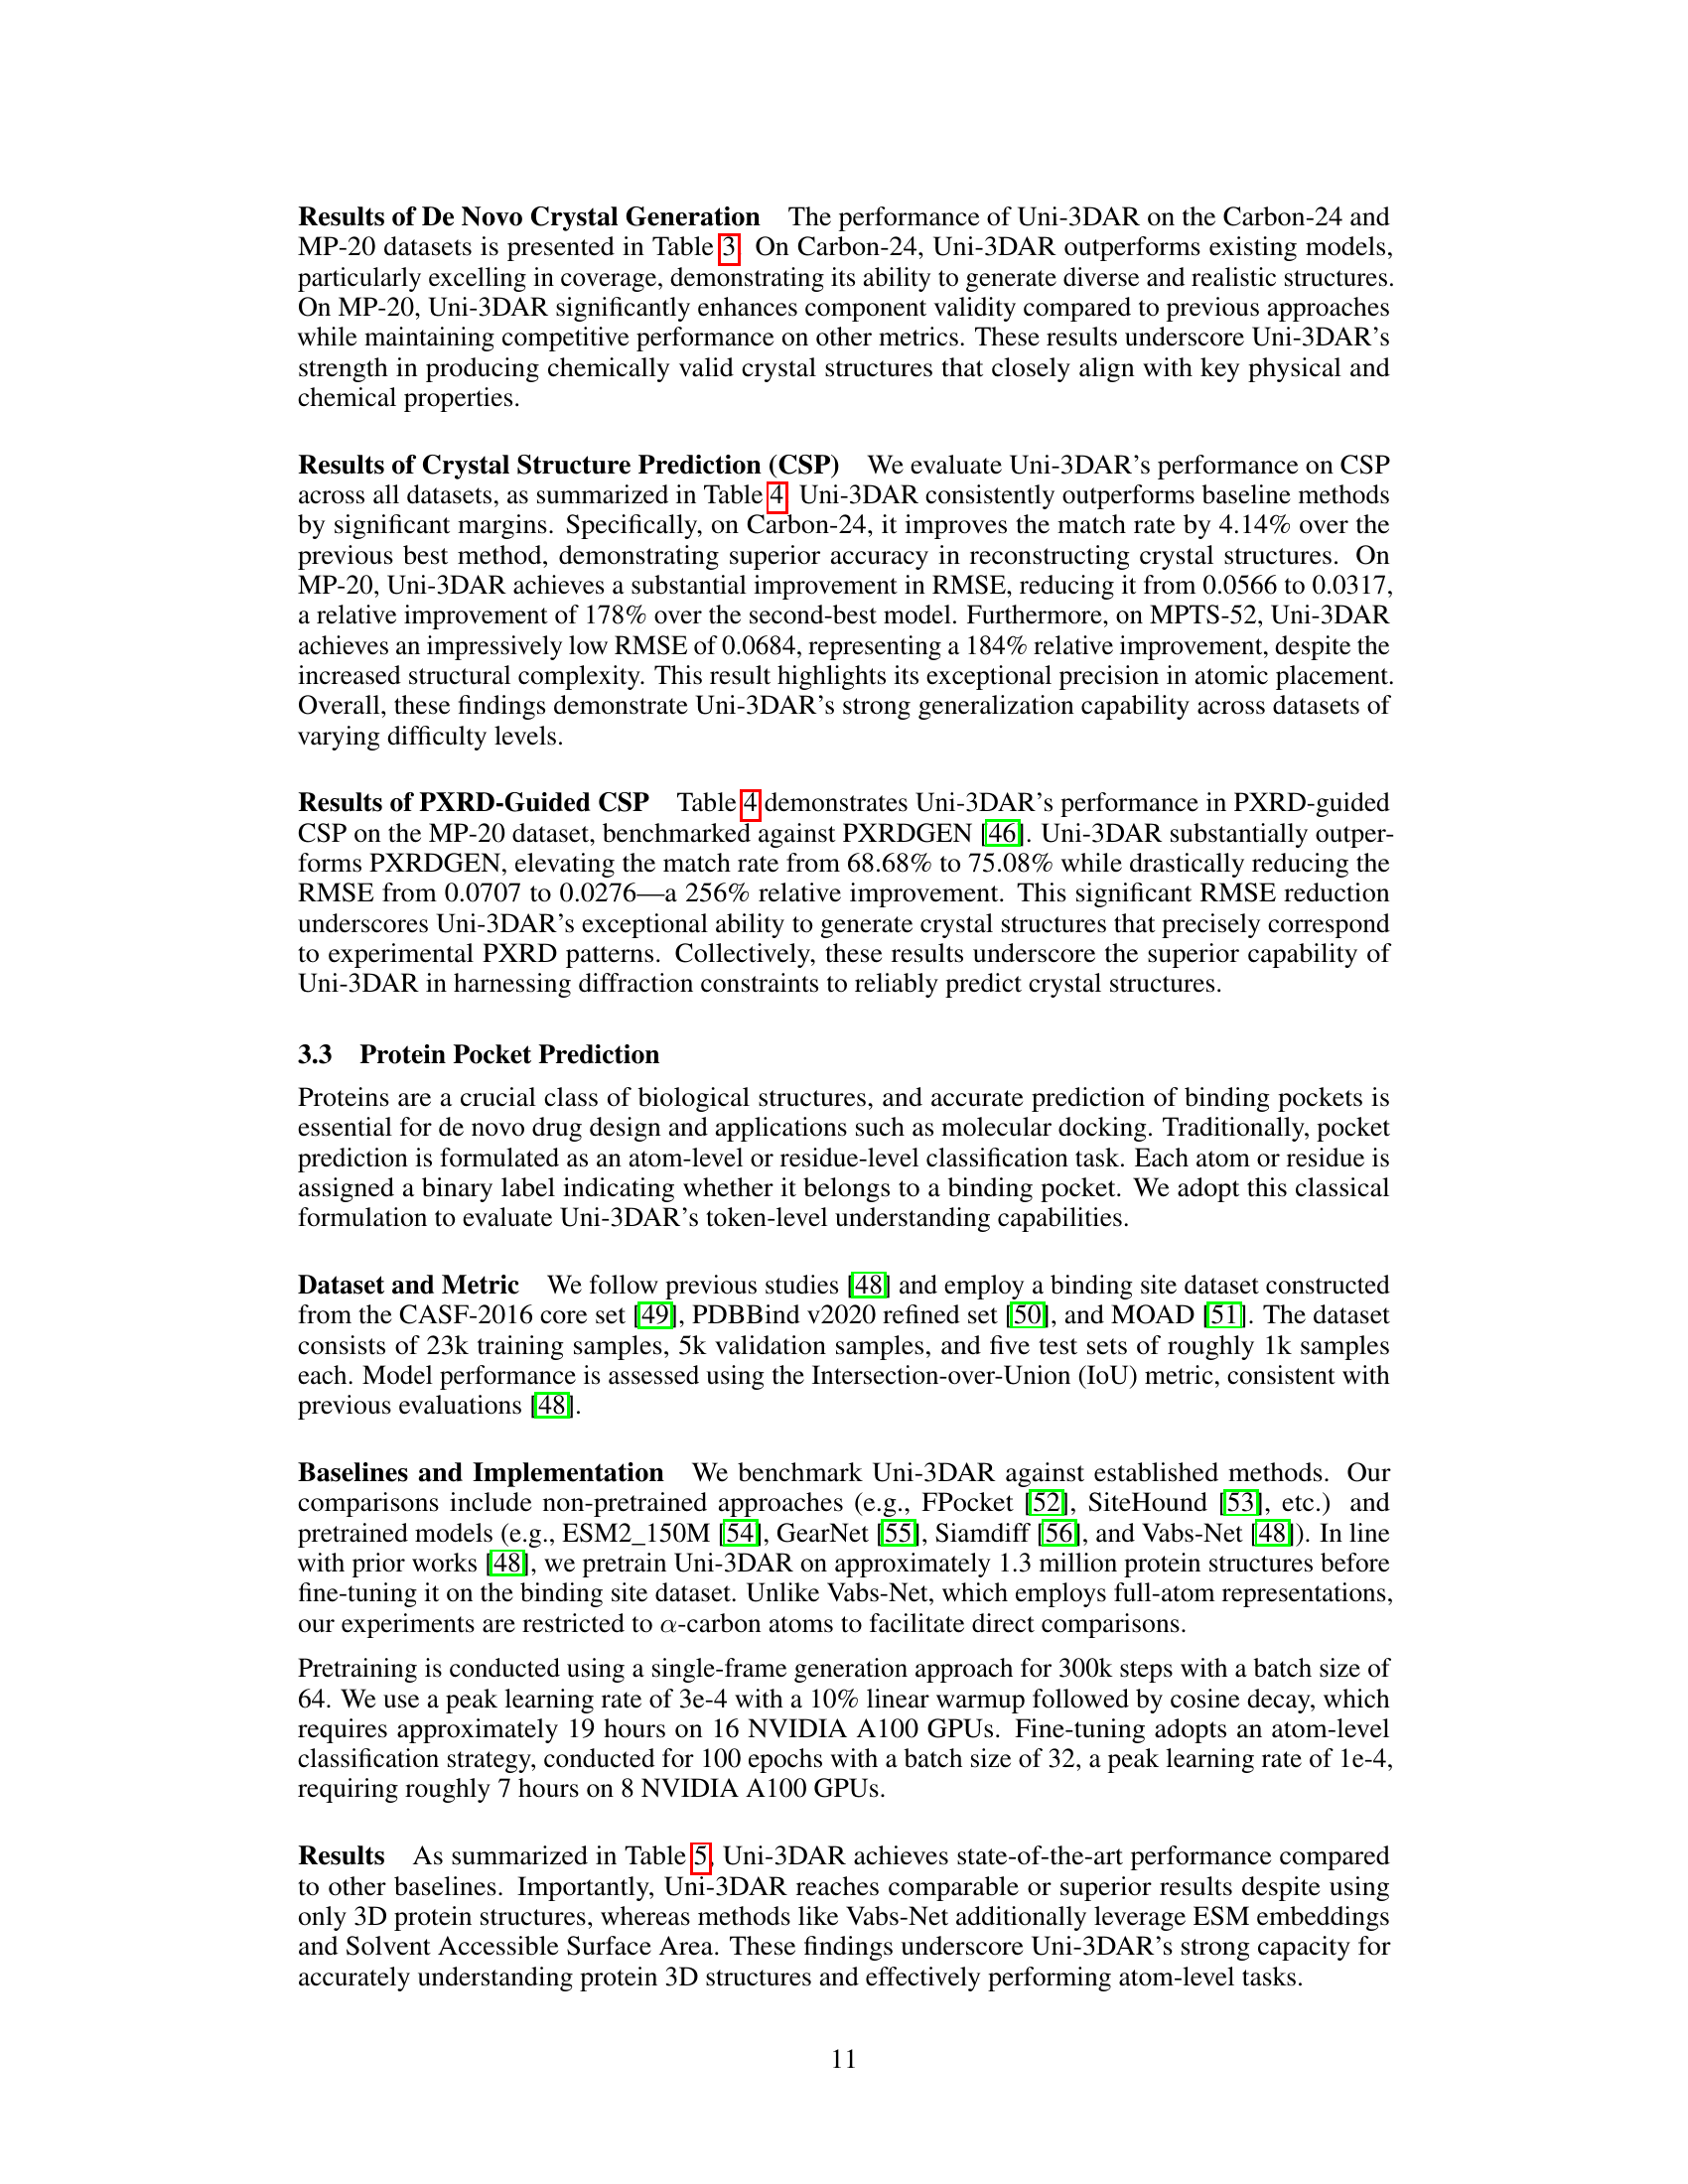
🔼 Table 5 presents the Intersection over Union (IoU) scores for atom-level protein binding site prediction. The IoU metric quantifies the overlap between predicted and actual binding sites. The table compares the performance of Uni-3DAR against various baseline methods. For a fair comparison, results for the Vabs-Net model are shown using only alpha-carbon atoms, rather than the full atomic representation used in the original work. Higher IoU scores indicate better performance in identifying binding sites.
read the caption
Table 5: Results for atom-level binding site prediction measured by IoU (%). Baseline results are taken from Zhao et al. [48]. For a fair comparison with other methods, we report Vabs-Net’s result using only α𝛼\alphaitalic_α-carbon atoms.
| RMSE |
🔼 Table 6 presents a comparison of molecular docking performance using two key metrics: Top1-RMSD and Top5-RMSD. These metrics measure the root-mean-square deviation (RMSD) between the predicted ligand binding pose and the actual pose. The table compares the performance of Uni-3DAR against two sets of baseline methods. The first group consists of five classical, non-machine-learning based docking software tools. The second group includes eight state-of-the-art deep-learning based docking methods. The results shown in the table are taken directly from a separate study (Cao et al. [60]). The best performing method for each metric is shown in bold, and the second best is underlined.
read the caption
Table 6: Comparison of docking performance on the Top1- and Top5-RMSD metrics. The first group of five baselines comprises classical docking software, while the second group of eight baselines consists of deep learning–based methods. The results are reproduced directly from Cao et al. [60]. The best outcomes are shown in bold, and the second-best are underlined.
| Match Rate |
| (%) |
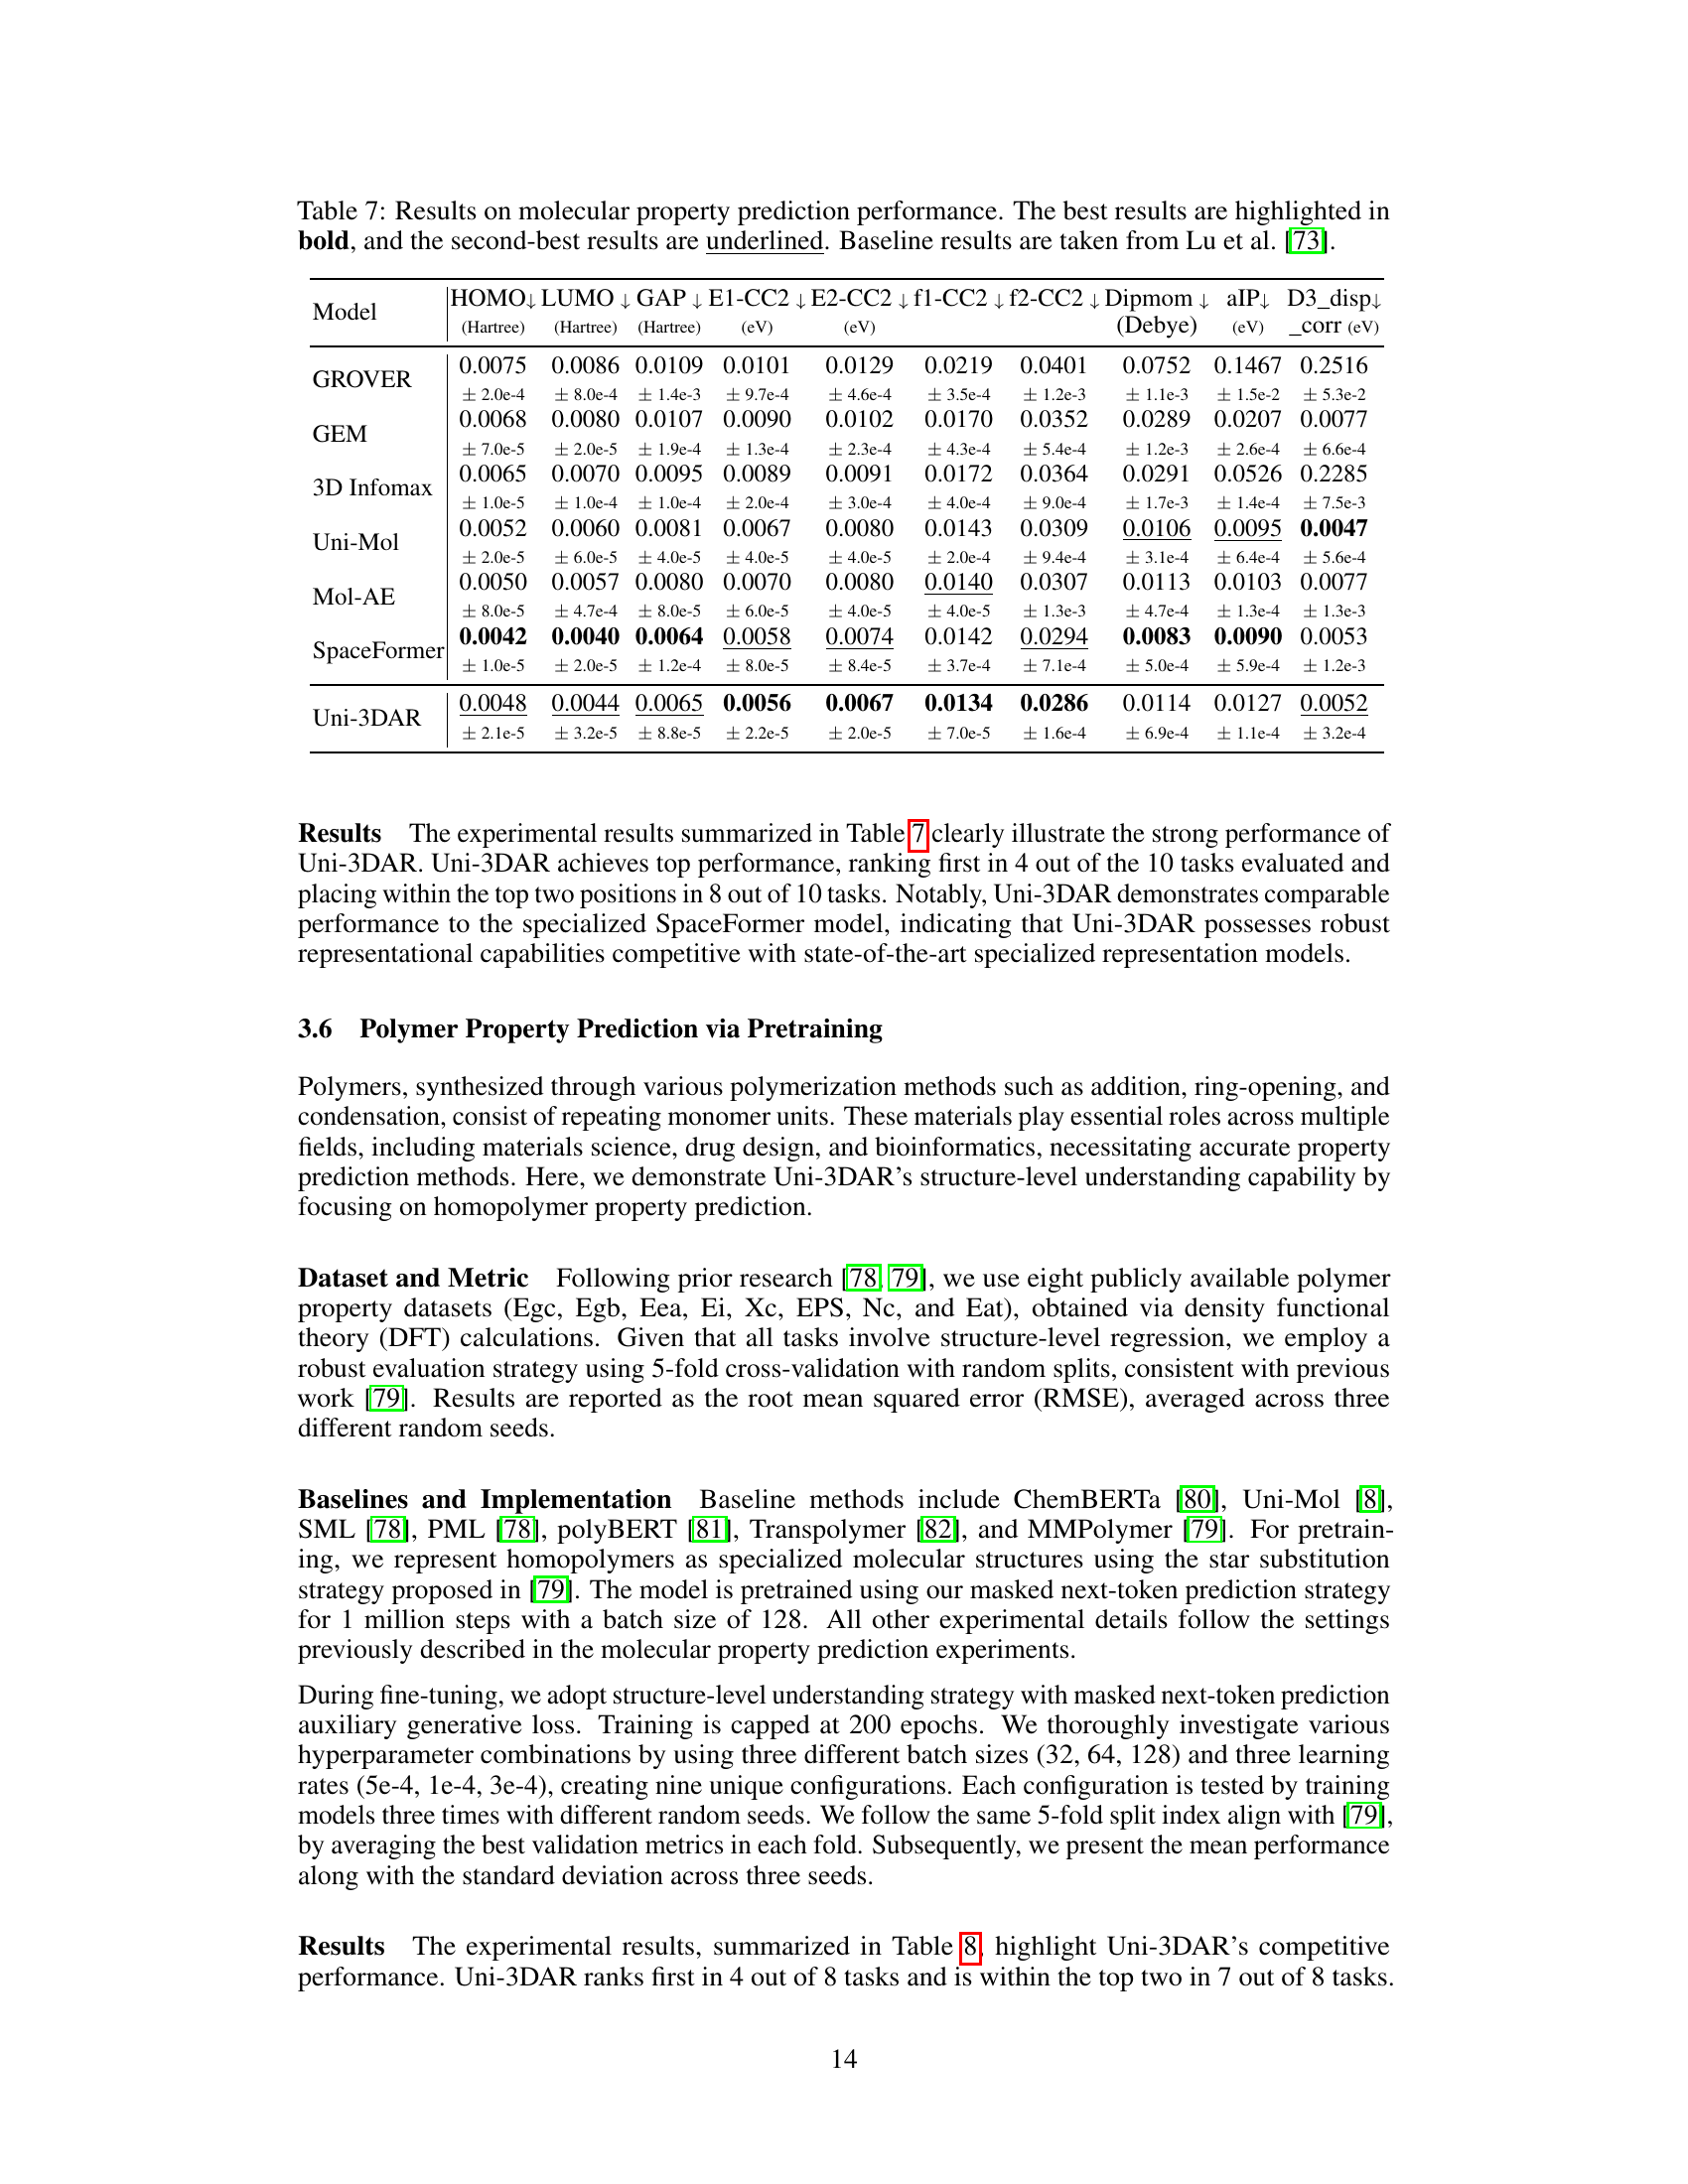
🔼 Table 7 presents a comparison of different machine learning models’ performance on predicting various molecular properties. The models are evaluated across ten different properties, and their mean absolute error (MAE) is reported for each property. The table highlights the best-performing model for each property in bold and the second-best in underline. This allows for easy comparison of Uni-3DAR’s performance against established baselines (from Lu et al. [73]). The results demonstrate Uni-3DAR’s competitiveness in molecular property prediction, showcasing its ability to achieve state-of-the-art performance on several key properties.
read the caption
Table 7: Results on molecular property prediction performance. The best results are highlighted in bold, and the second-best results are underlined. Baseline results are taken from Lu et al. [73].
| RMSE |
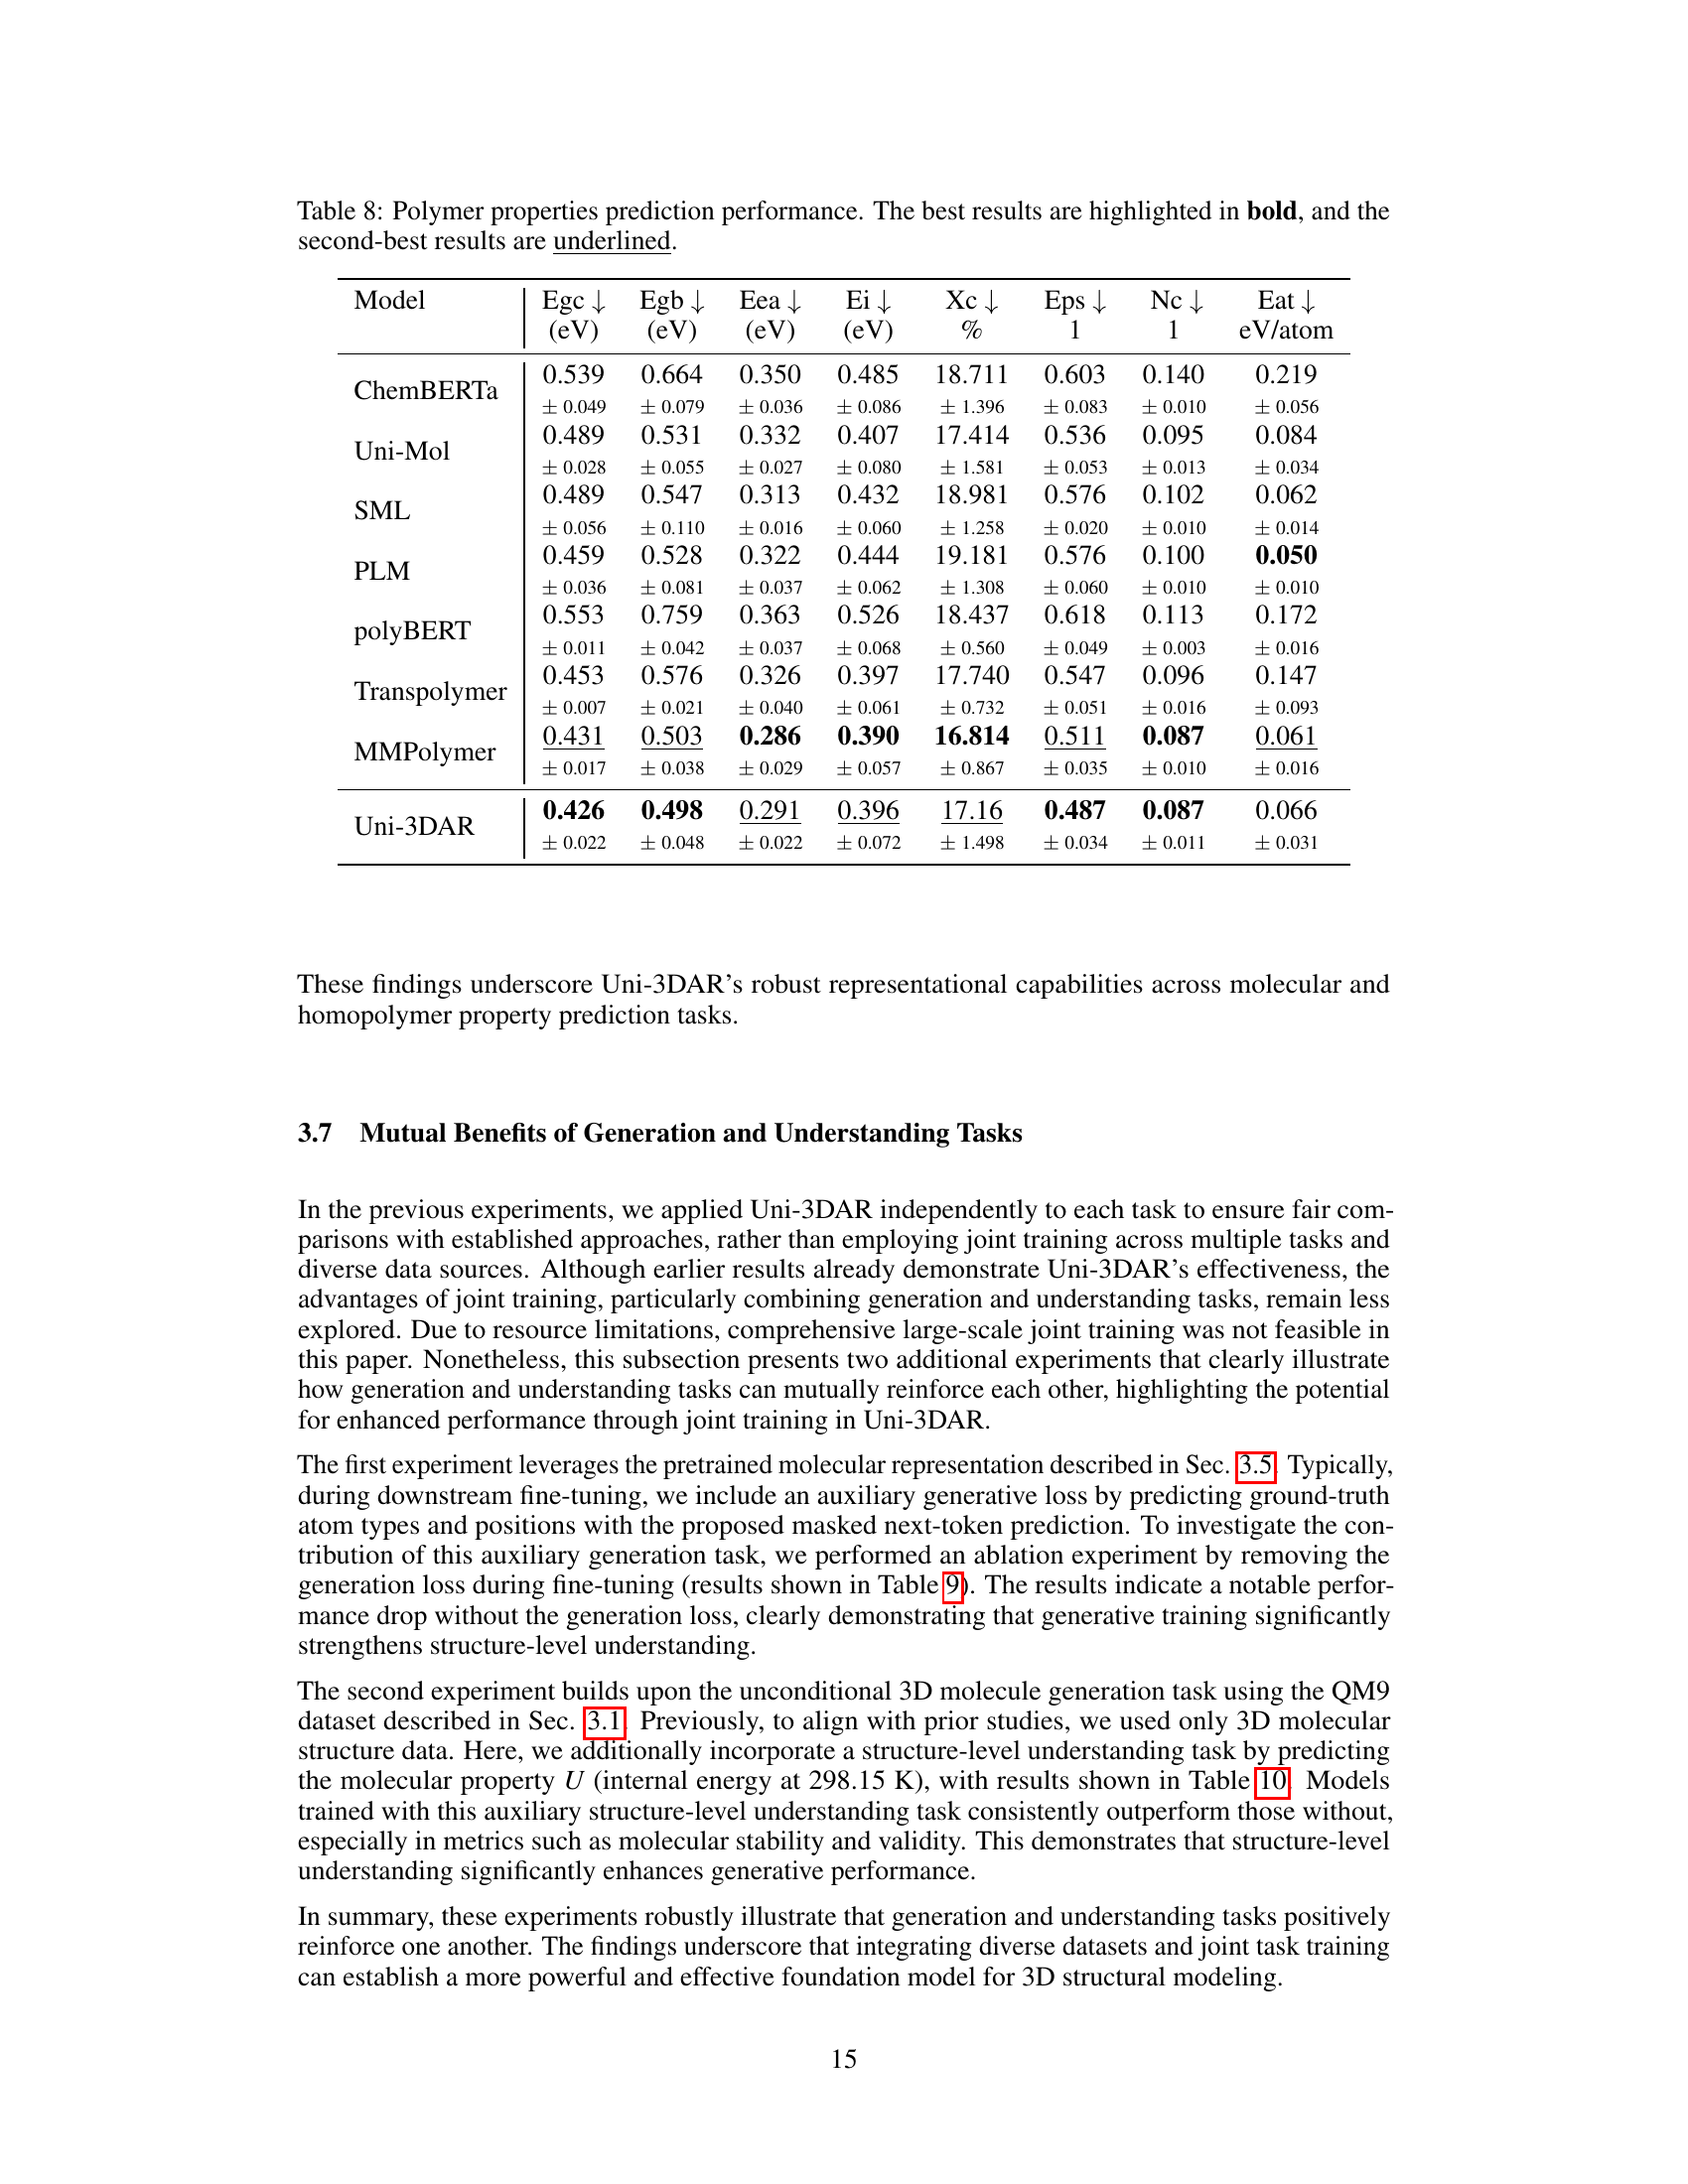
🔼 Table 8 presents a comparison of the performance of various models on predicting eight different polymer properties. For each property, the table shows the mean absolute error (MAE) achieved by each model. The MAE is a measure of the average difference between the model’s predictions and the actual values. Lower MAE values indicate better performance. The best result for each property is shown in bold, and the second-best result is underlined. This table allows for a direct comparison of the accuracy of different models in predicting various polymer properties, providing insights into the relative strengths and weaknesses of each model.
read the caption
Table 8: Polymer properties prediction performance. The best results are highlighted in bold, and the second-best results are underlined.
| Match Rate |
| (%) |
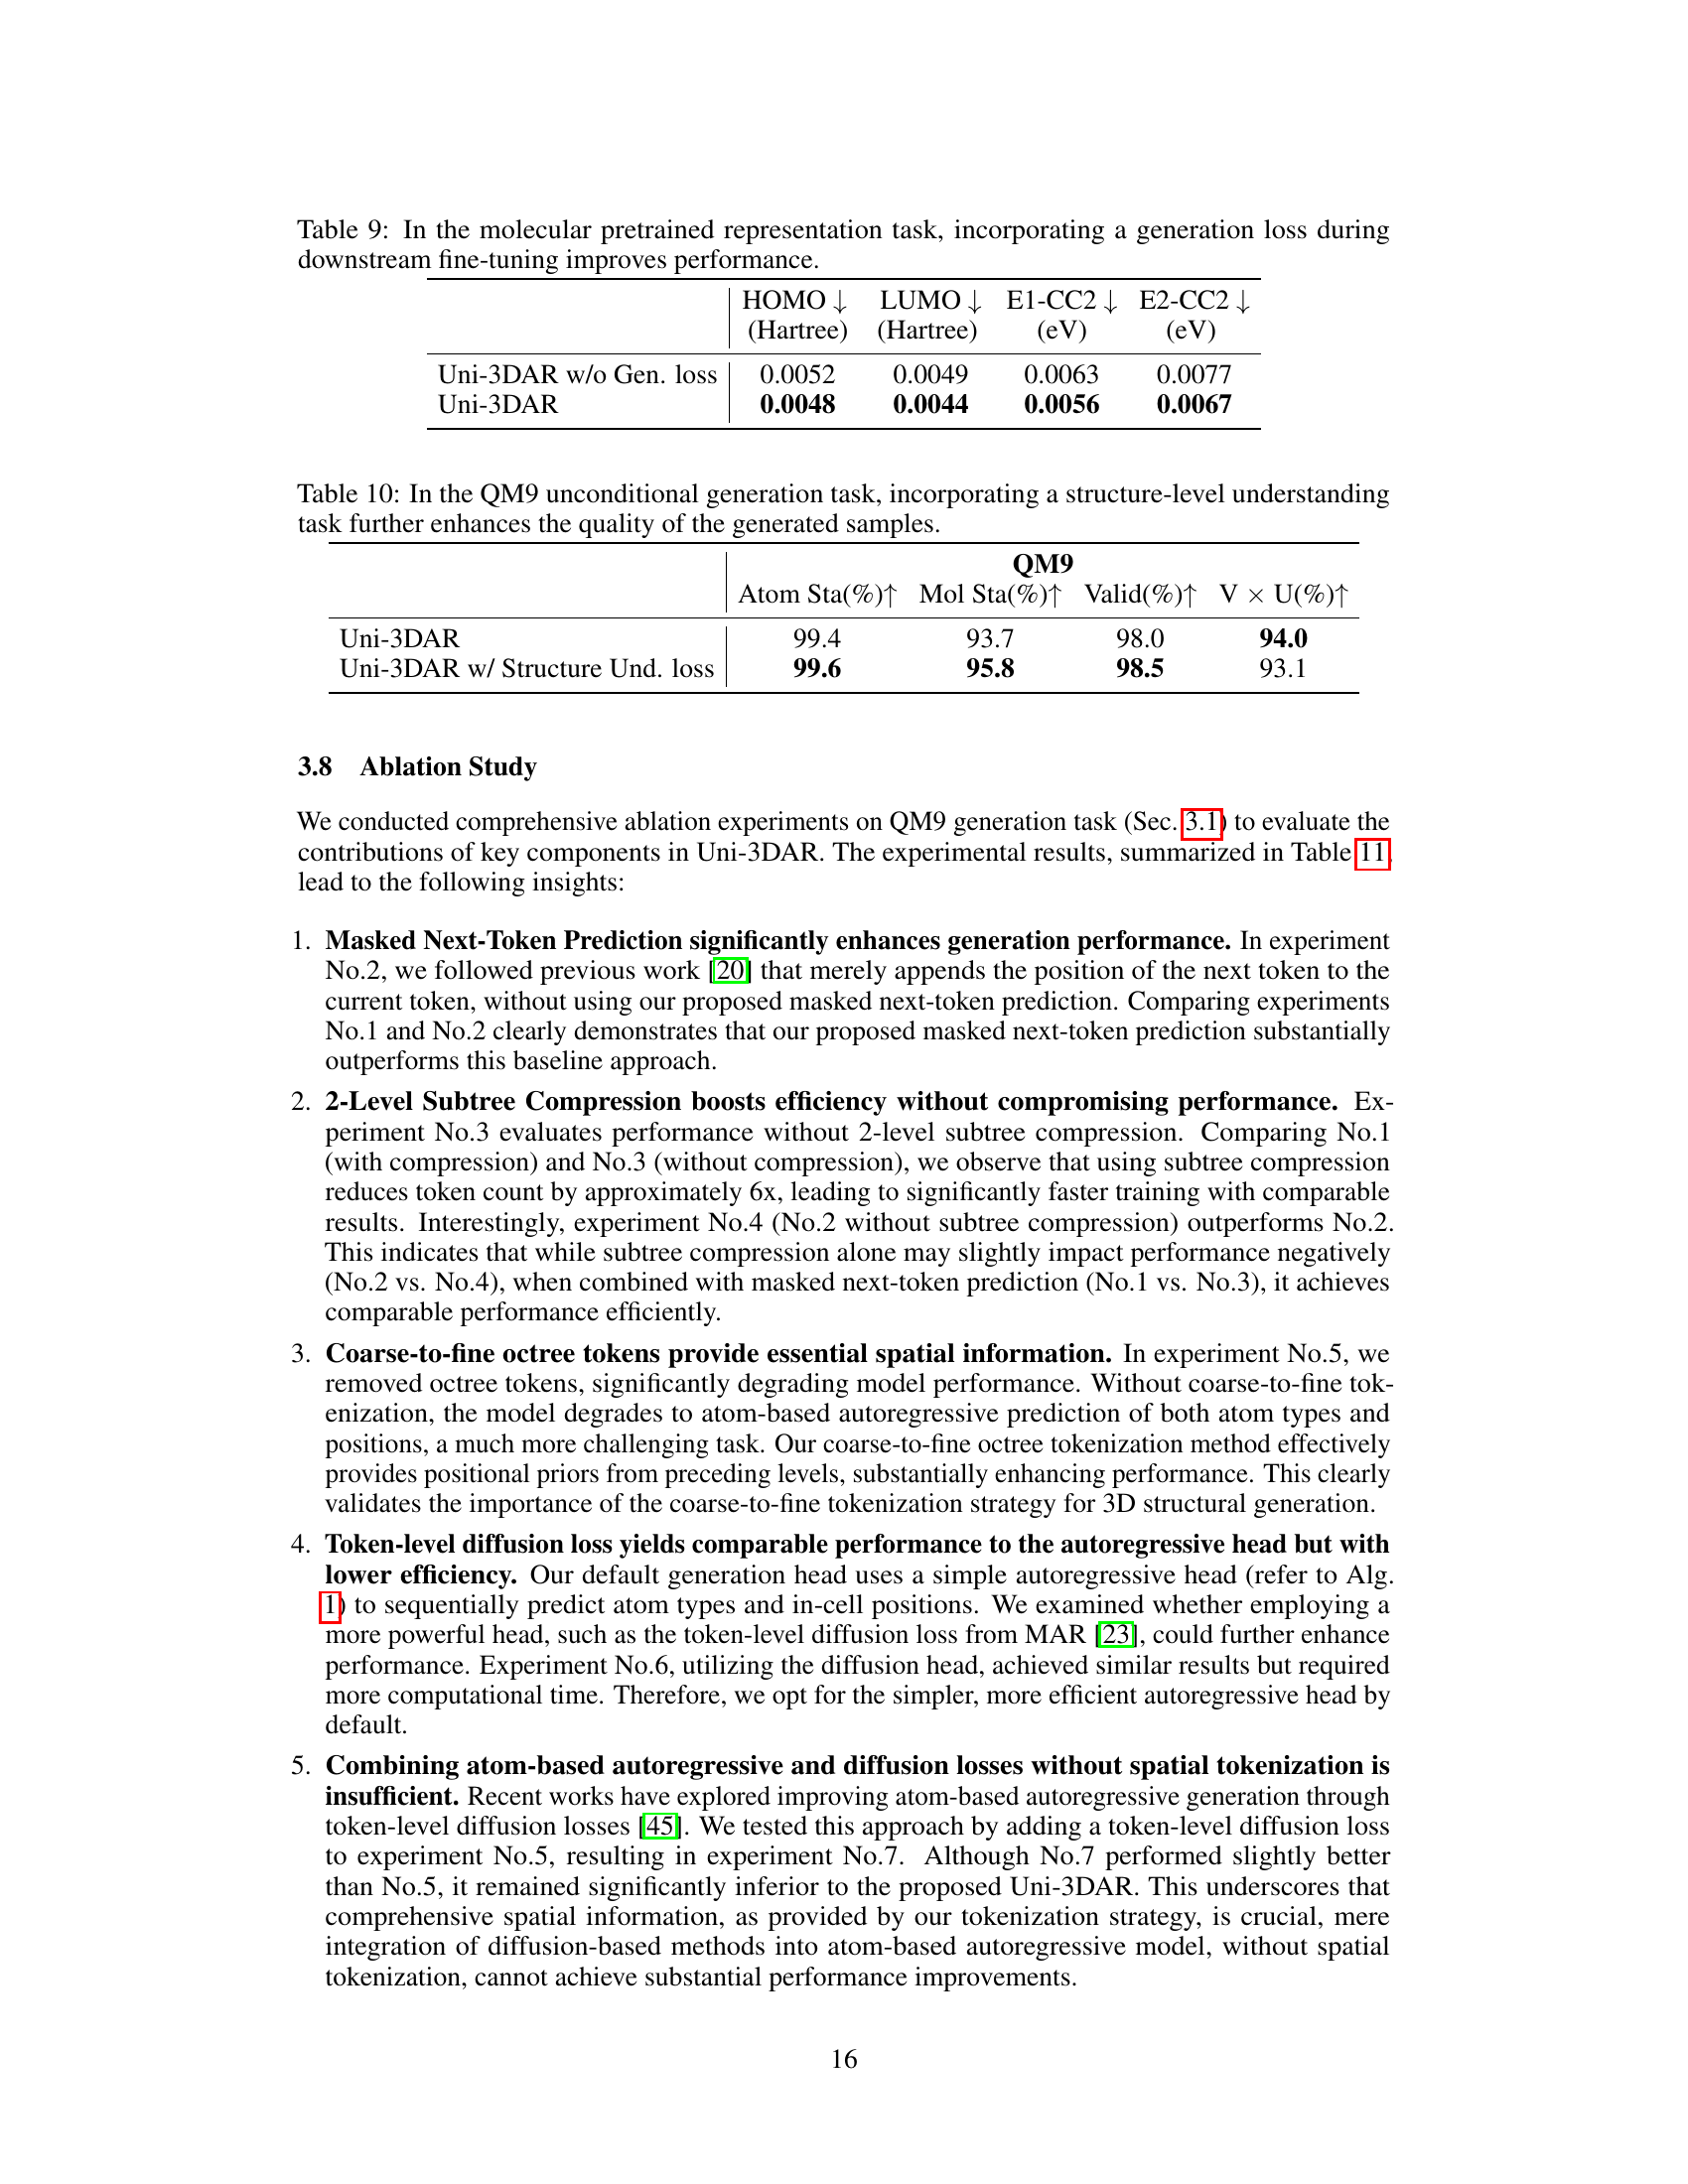
🔼 This table presents the ablation study result of incorporating a generation loss during downstream fine-tuning in the molecular pretrained representation task. The results show that including the generation loss improves the performance on downstream tasks such as predicting HOMO, LUMO, E1-CC2, and E2-CC2.
read the caption
Table 9: In the molecular pretrained representation task, incorporating a generation loss during downstream fine-tuning improves performance.
| RMSE |
🔼 This table presents an ablation study on the QM9 dataset. Specifically, it compares the results of unconditional 3D molecule generation using only the generation task versus also incorporating a structure-level understanding task (predicting the internal energy). The results demonstrate that adding the structure-level understanding improves the quality of the generated molecules, reflected in higher atom stability, molecule stability, validity, and uniqueness scores.
read the caption
Table 10: In the QM9 unconditional generation task, incorporating a structure-level understanding task further enhances the quality of the generated samples.
| Match Rate |
| (%) |
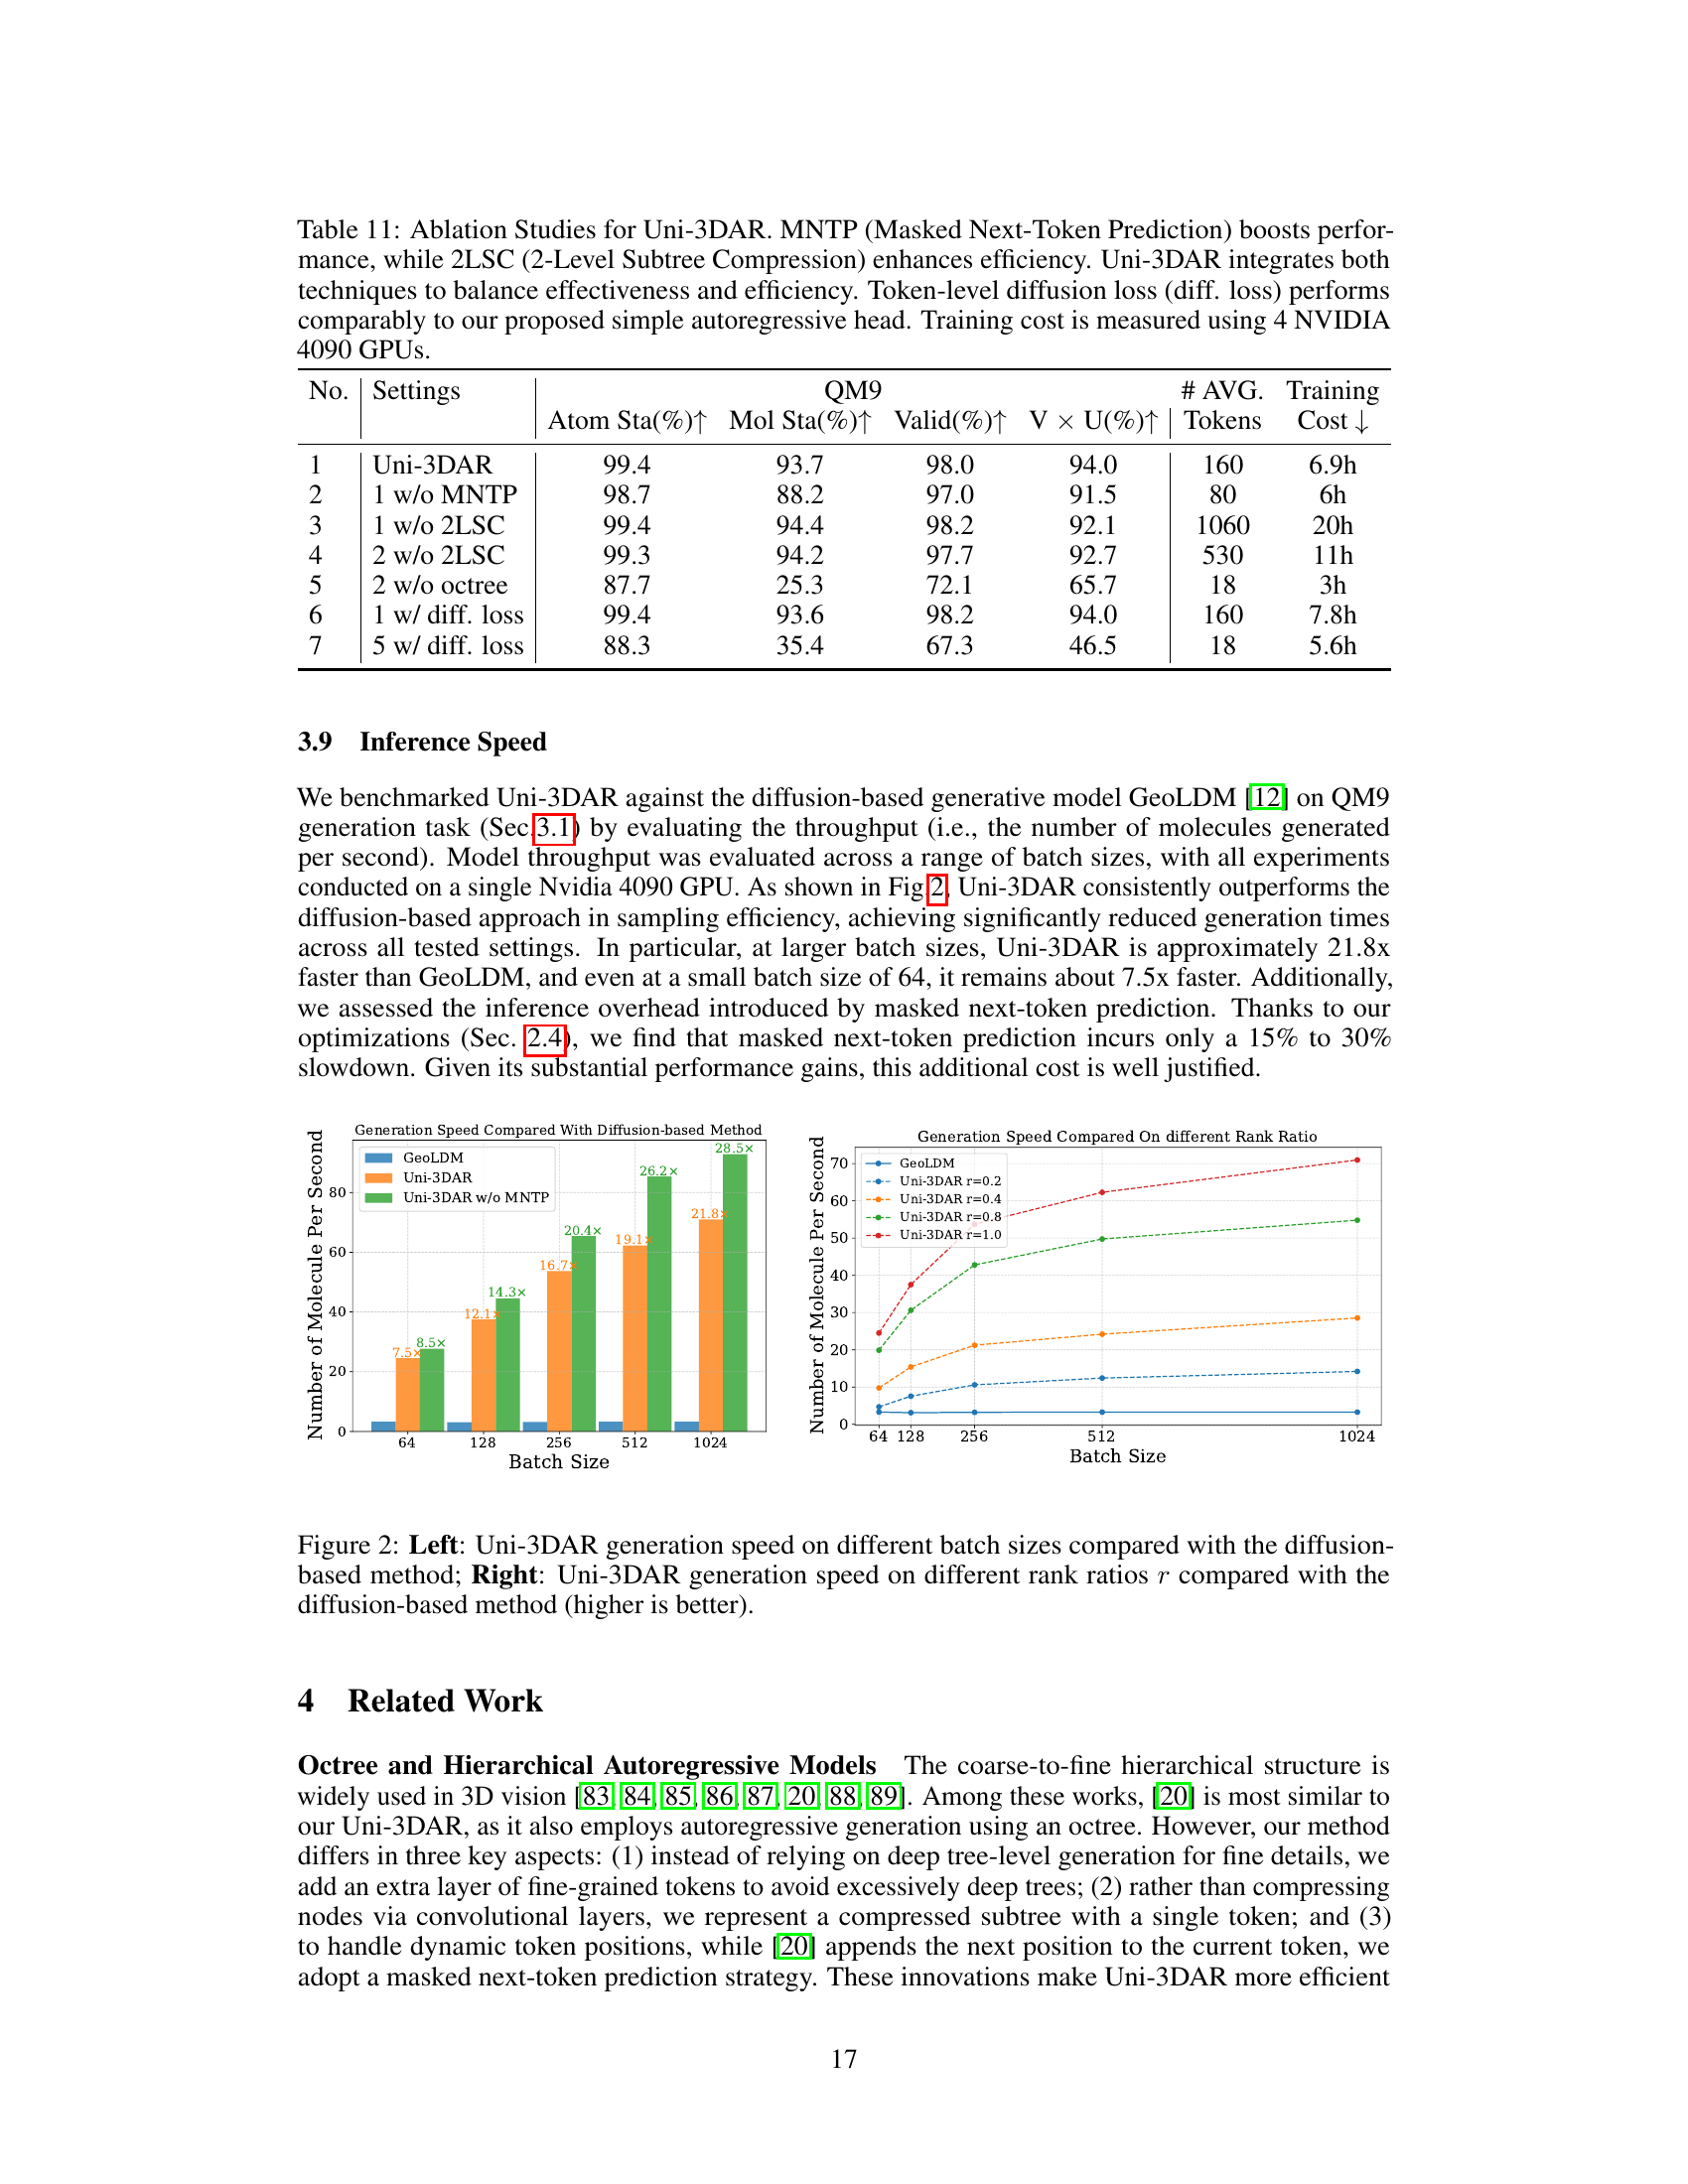
🔼 This ablation study analyzes the impact of different components within the Uni-3DAR model on its performance and efficiency. Specifically, it isolates the effects of Masked Next-Token Prediction (MNTP), 2-Level Subtree Compression (2LSC), and the use of a token-level diffusion loss compared to the simpler autoregressive head proposed in the paper. The results are shown in terms of Atom Stability, Molecule Stability, Validity, Uniqueness, the number of tokens used, and training time on 4 NVIDIA 4090 GPUs. The table demonstrates the effectiveness of MNTP in improving performance, the efficiency gains from 2LSC in reducing training time and token count, and the comparable performance of the diffusion loss to the simpler, more efficient autoregressive head. It highlights Uni-3DAR’s ability to balance model performance with computational efficiency.
read the caption
Table 11: Ablation Studies for Uni-3DAR. MNTP (Masked Next-Token Prediction) boosts performance, while 2LSC (2-Level Subtree Compression) enhances efficiency. Uni-3DAR integrates both techniques to balance effectiveness and efficiency. Token-level diffusion loss (diff. loss) performs comparably to our proposed simple autoregressive head. Training cost is measured using 4 NVIDIA 4090 GPUs.
Full paper#