TL;DR#
Generalized Few-Shot Point Cloud Segmentation(GFS-PCS) improves models with few samples and retains base class segmentation. Current methods are limited by sparse knowledge. Meanwhile, 3D vision-language models(VLMs) have rich knowledge, but also noisy. Therefore, it is important to improve the performance of models in novel class generalization for real world usage.
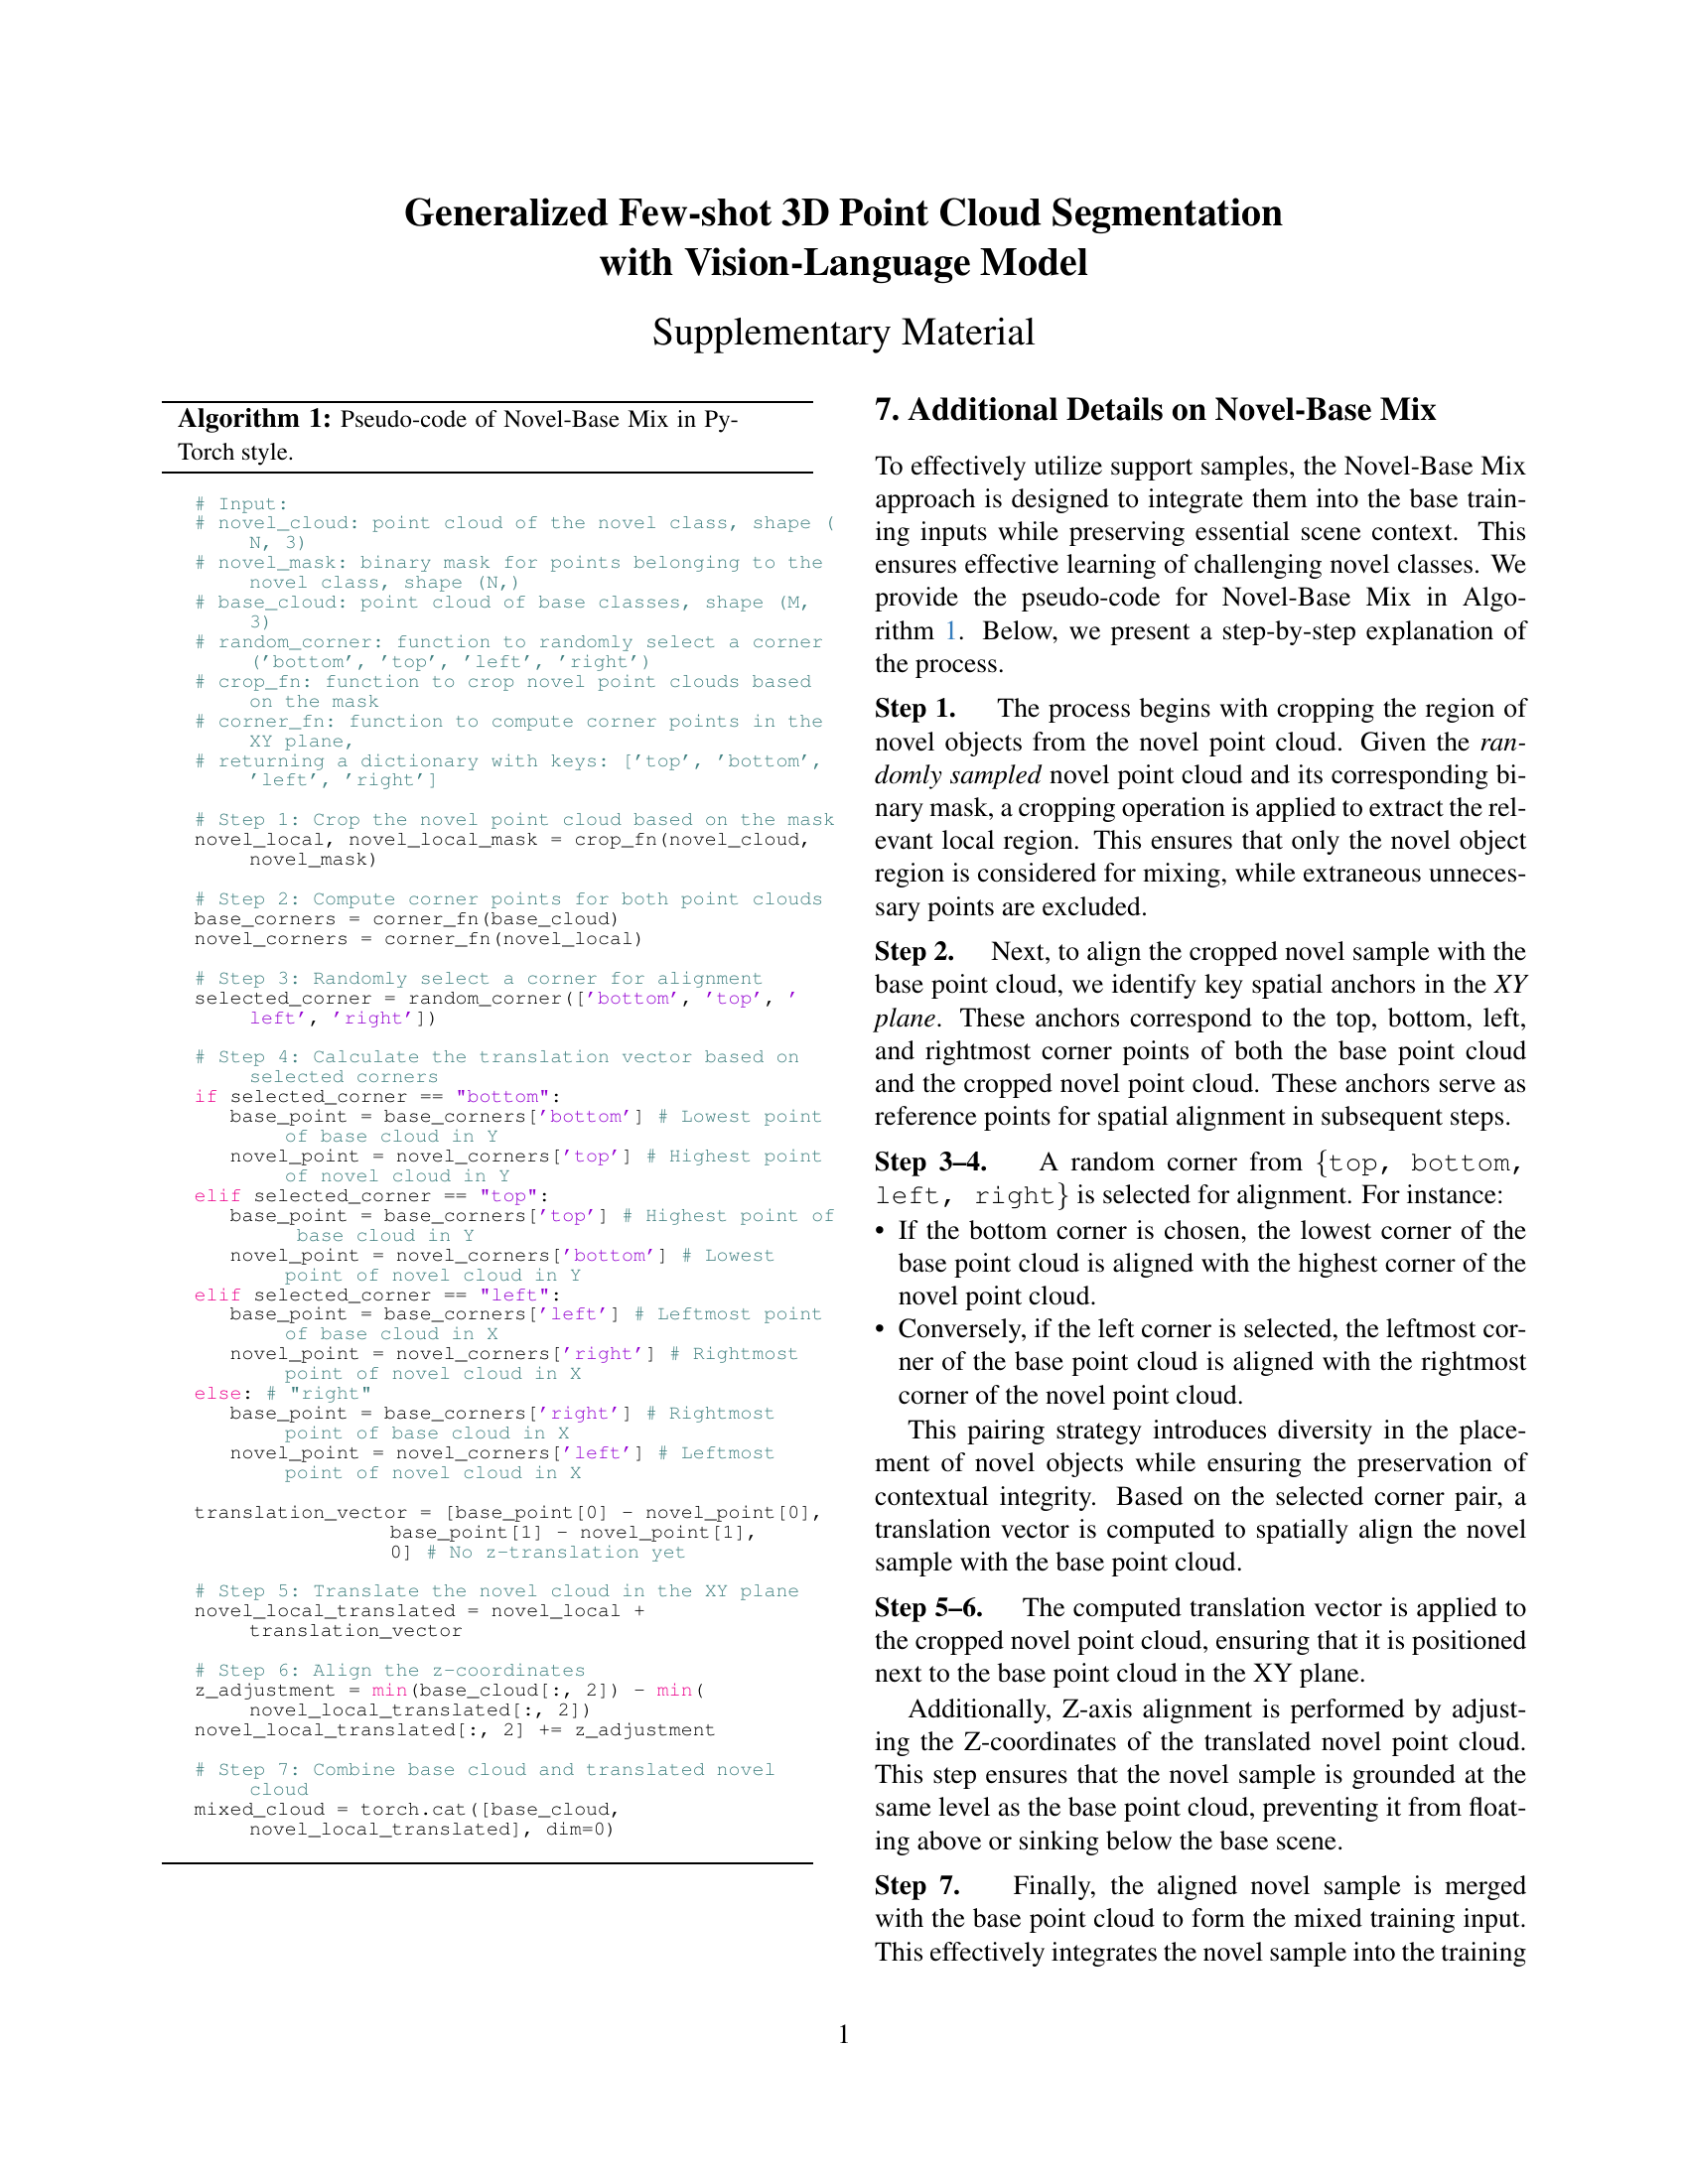
This paper introduces a new framework named GFS-VL, to address these issues. It incorporates 3 new methods, including a pseudo-label selection to filter noisy data, adaptive infilling approach to enrich regions, and a novel-base mix strategy to embed few-shot samples into scenes. The work also introduces 2 challenging benchmarks. Experiments show the effectiveness of the framework.
Key Takeaways#
Why does it matter?#
This paper pioneers a novel GFS-PCS framework, bridging the gap between 3D VLMs and few-shot learning. By introducing challenging benchmarks and open-sourcing code, it propels real-world applications and inspires future research in 3D semantic understanding.
Visual Insights#

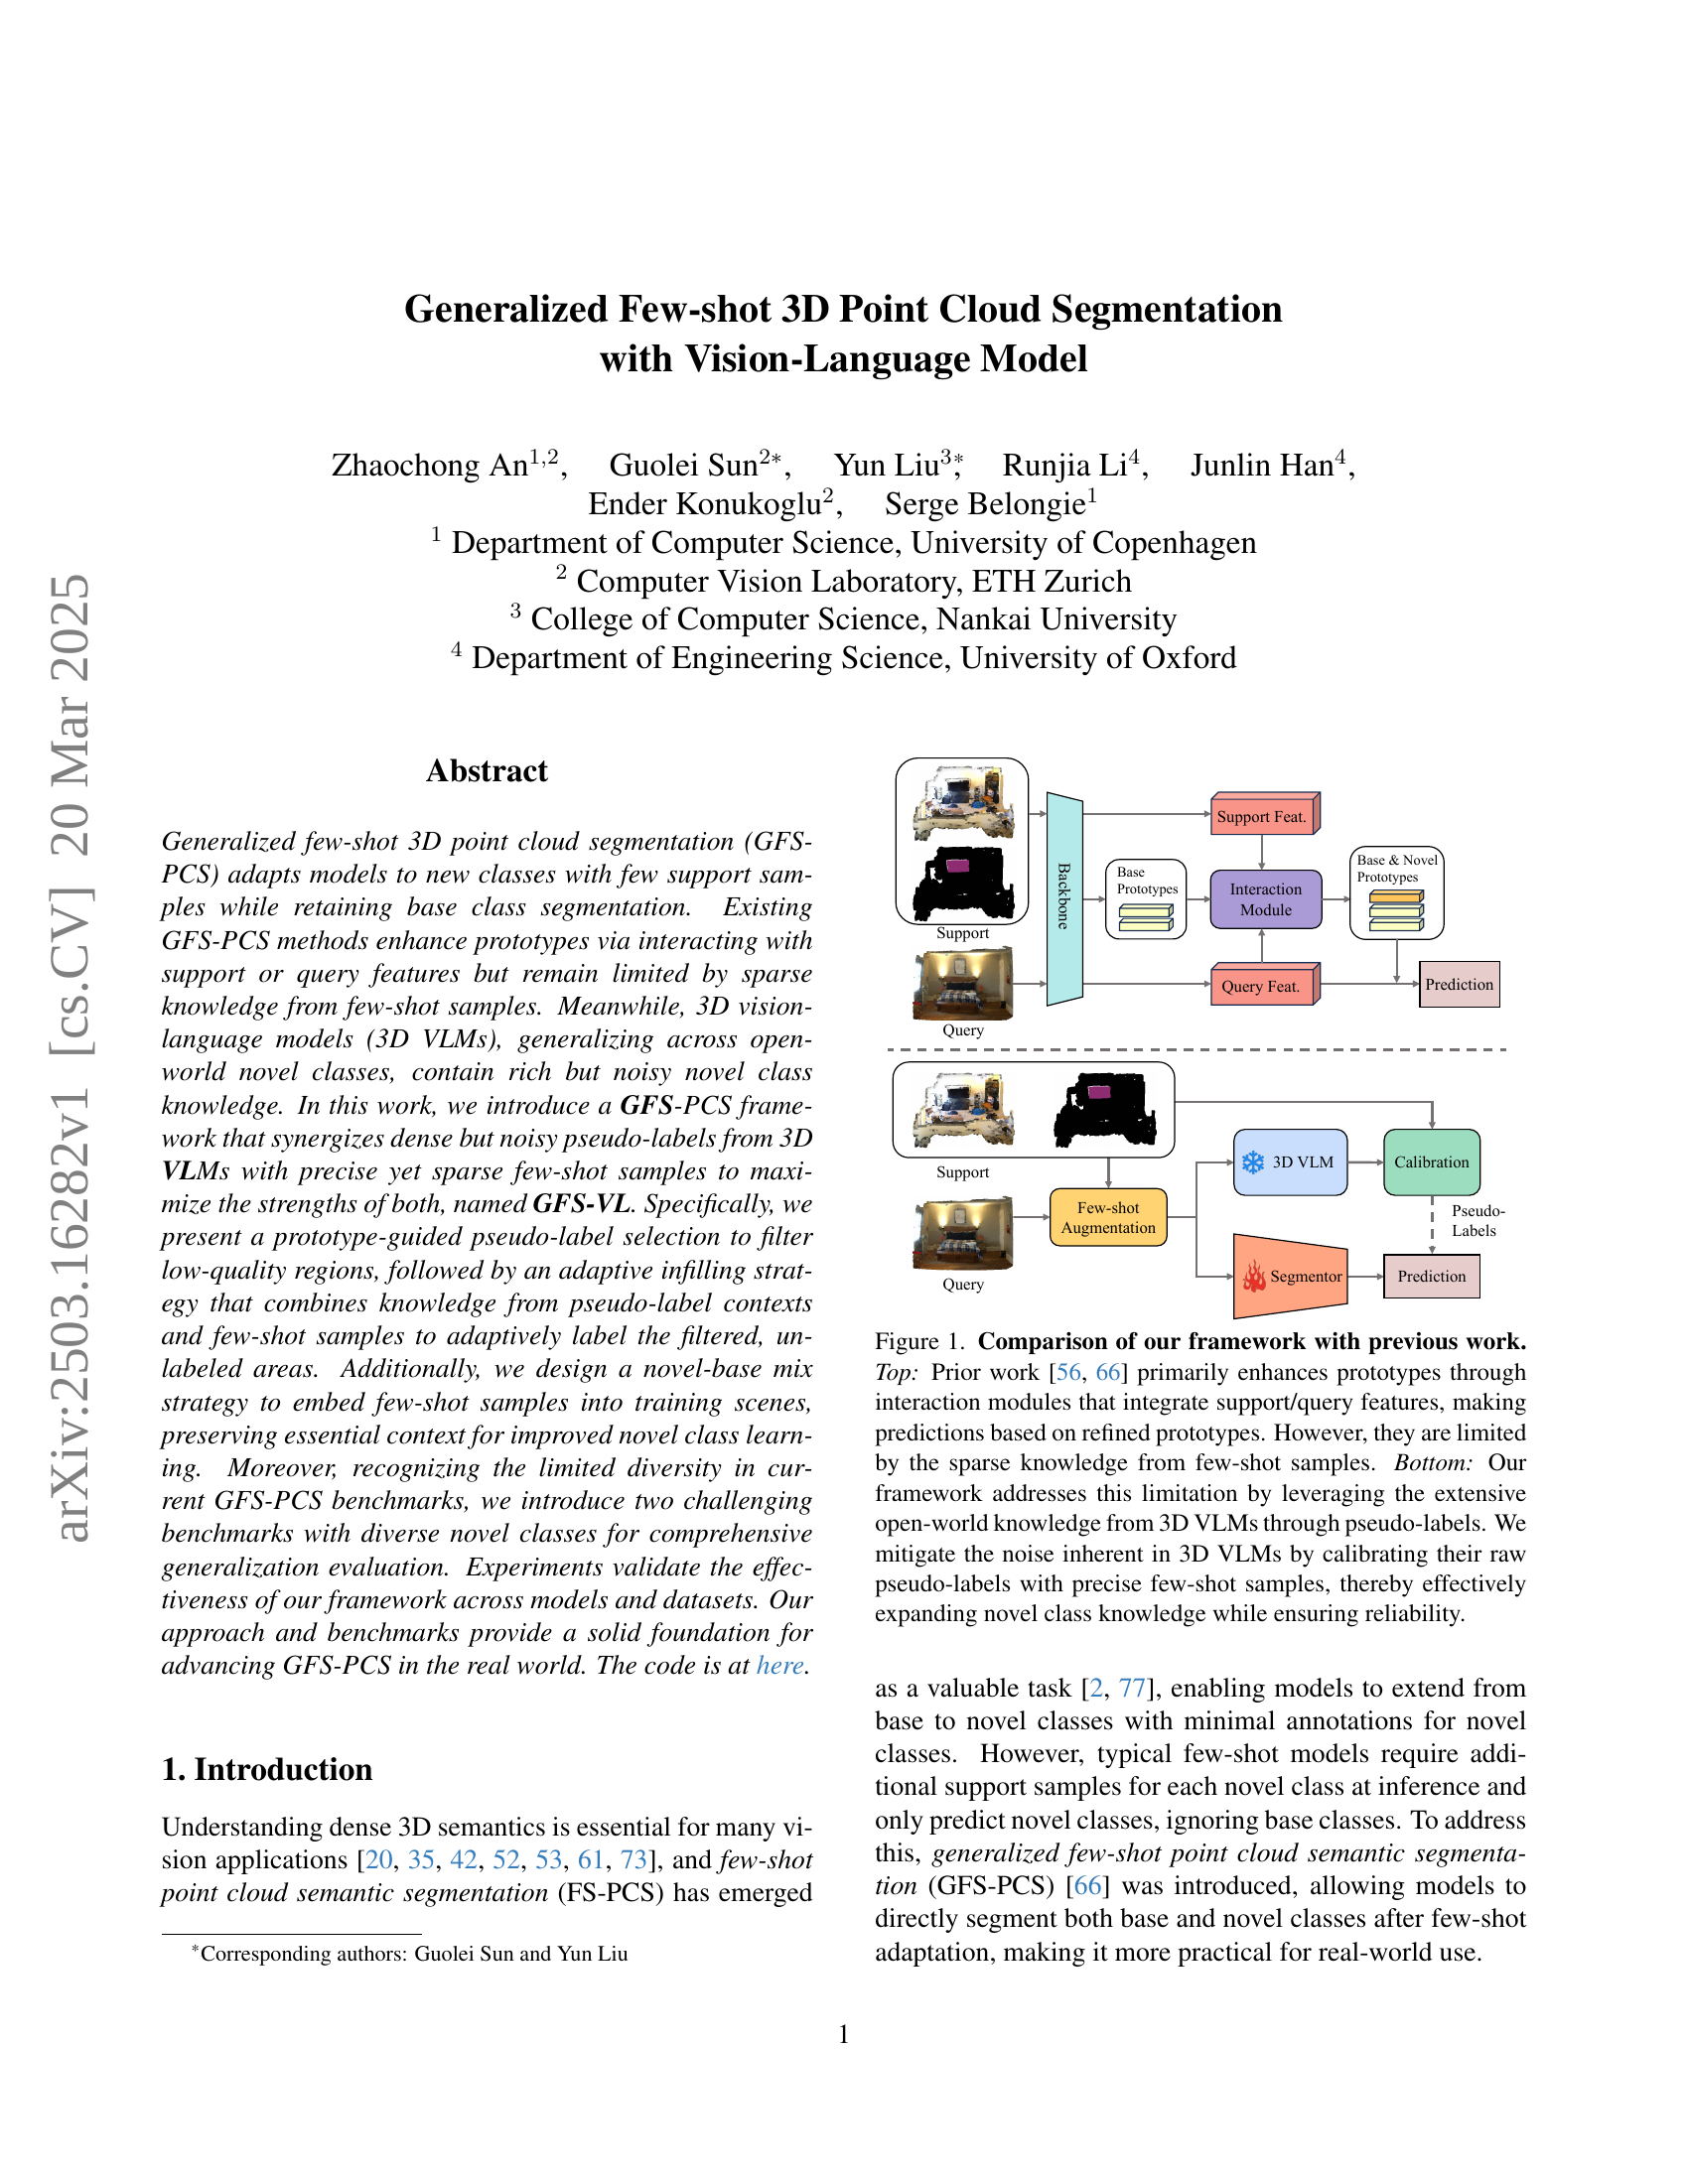
🔼 Figure 1 compares the proposed framework with existing methods for generalized few-shot 3D point cloud segmentation. The top panel illustrates traditional approaches that refine class prototypes using support and query features. These methods are limited by the sparse data available in few-shot learning scenarios. In contrast, the bottom panel shows the proposed framework, which leverages the rich knowledge of 3D vision-language models (VLMs) to generate pseudo-labels for novel classes. To address the noise inherent in VLM predictions, the framework calibrates these pseudo-labels with precise few-shot samples, effectively expanding the knowledge about novel classes while maintaining reliability.
read the caption
Figure 1: Comparison of our framework with previous work. Top: Prior work [56, 66] primarily enhances prototypes through interaction modules that integrate support/query features, making predictions based on refined prototypes. However, they are limited by the sparse knowledge from few-shot samples. Bottom: Our framework addresses this limitation by leveraging the extensive open-world knowledge from 3D VLMs through pseudo-labels. We mitigate the noise inherent in 3D VLMs by calibrating their raw pseudo-labels with precise few-shot samples, thereby effectively expanding novel class knowledge while ensuring reliability.
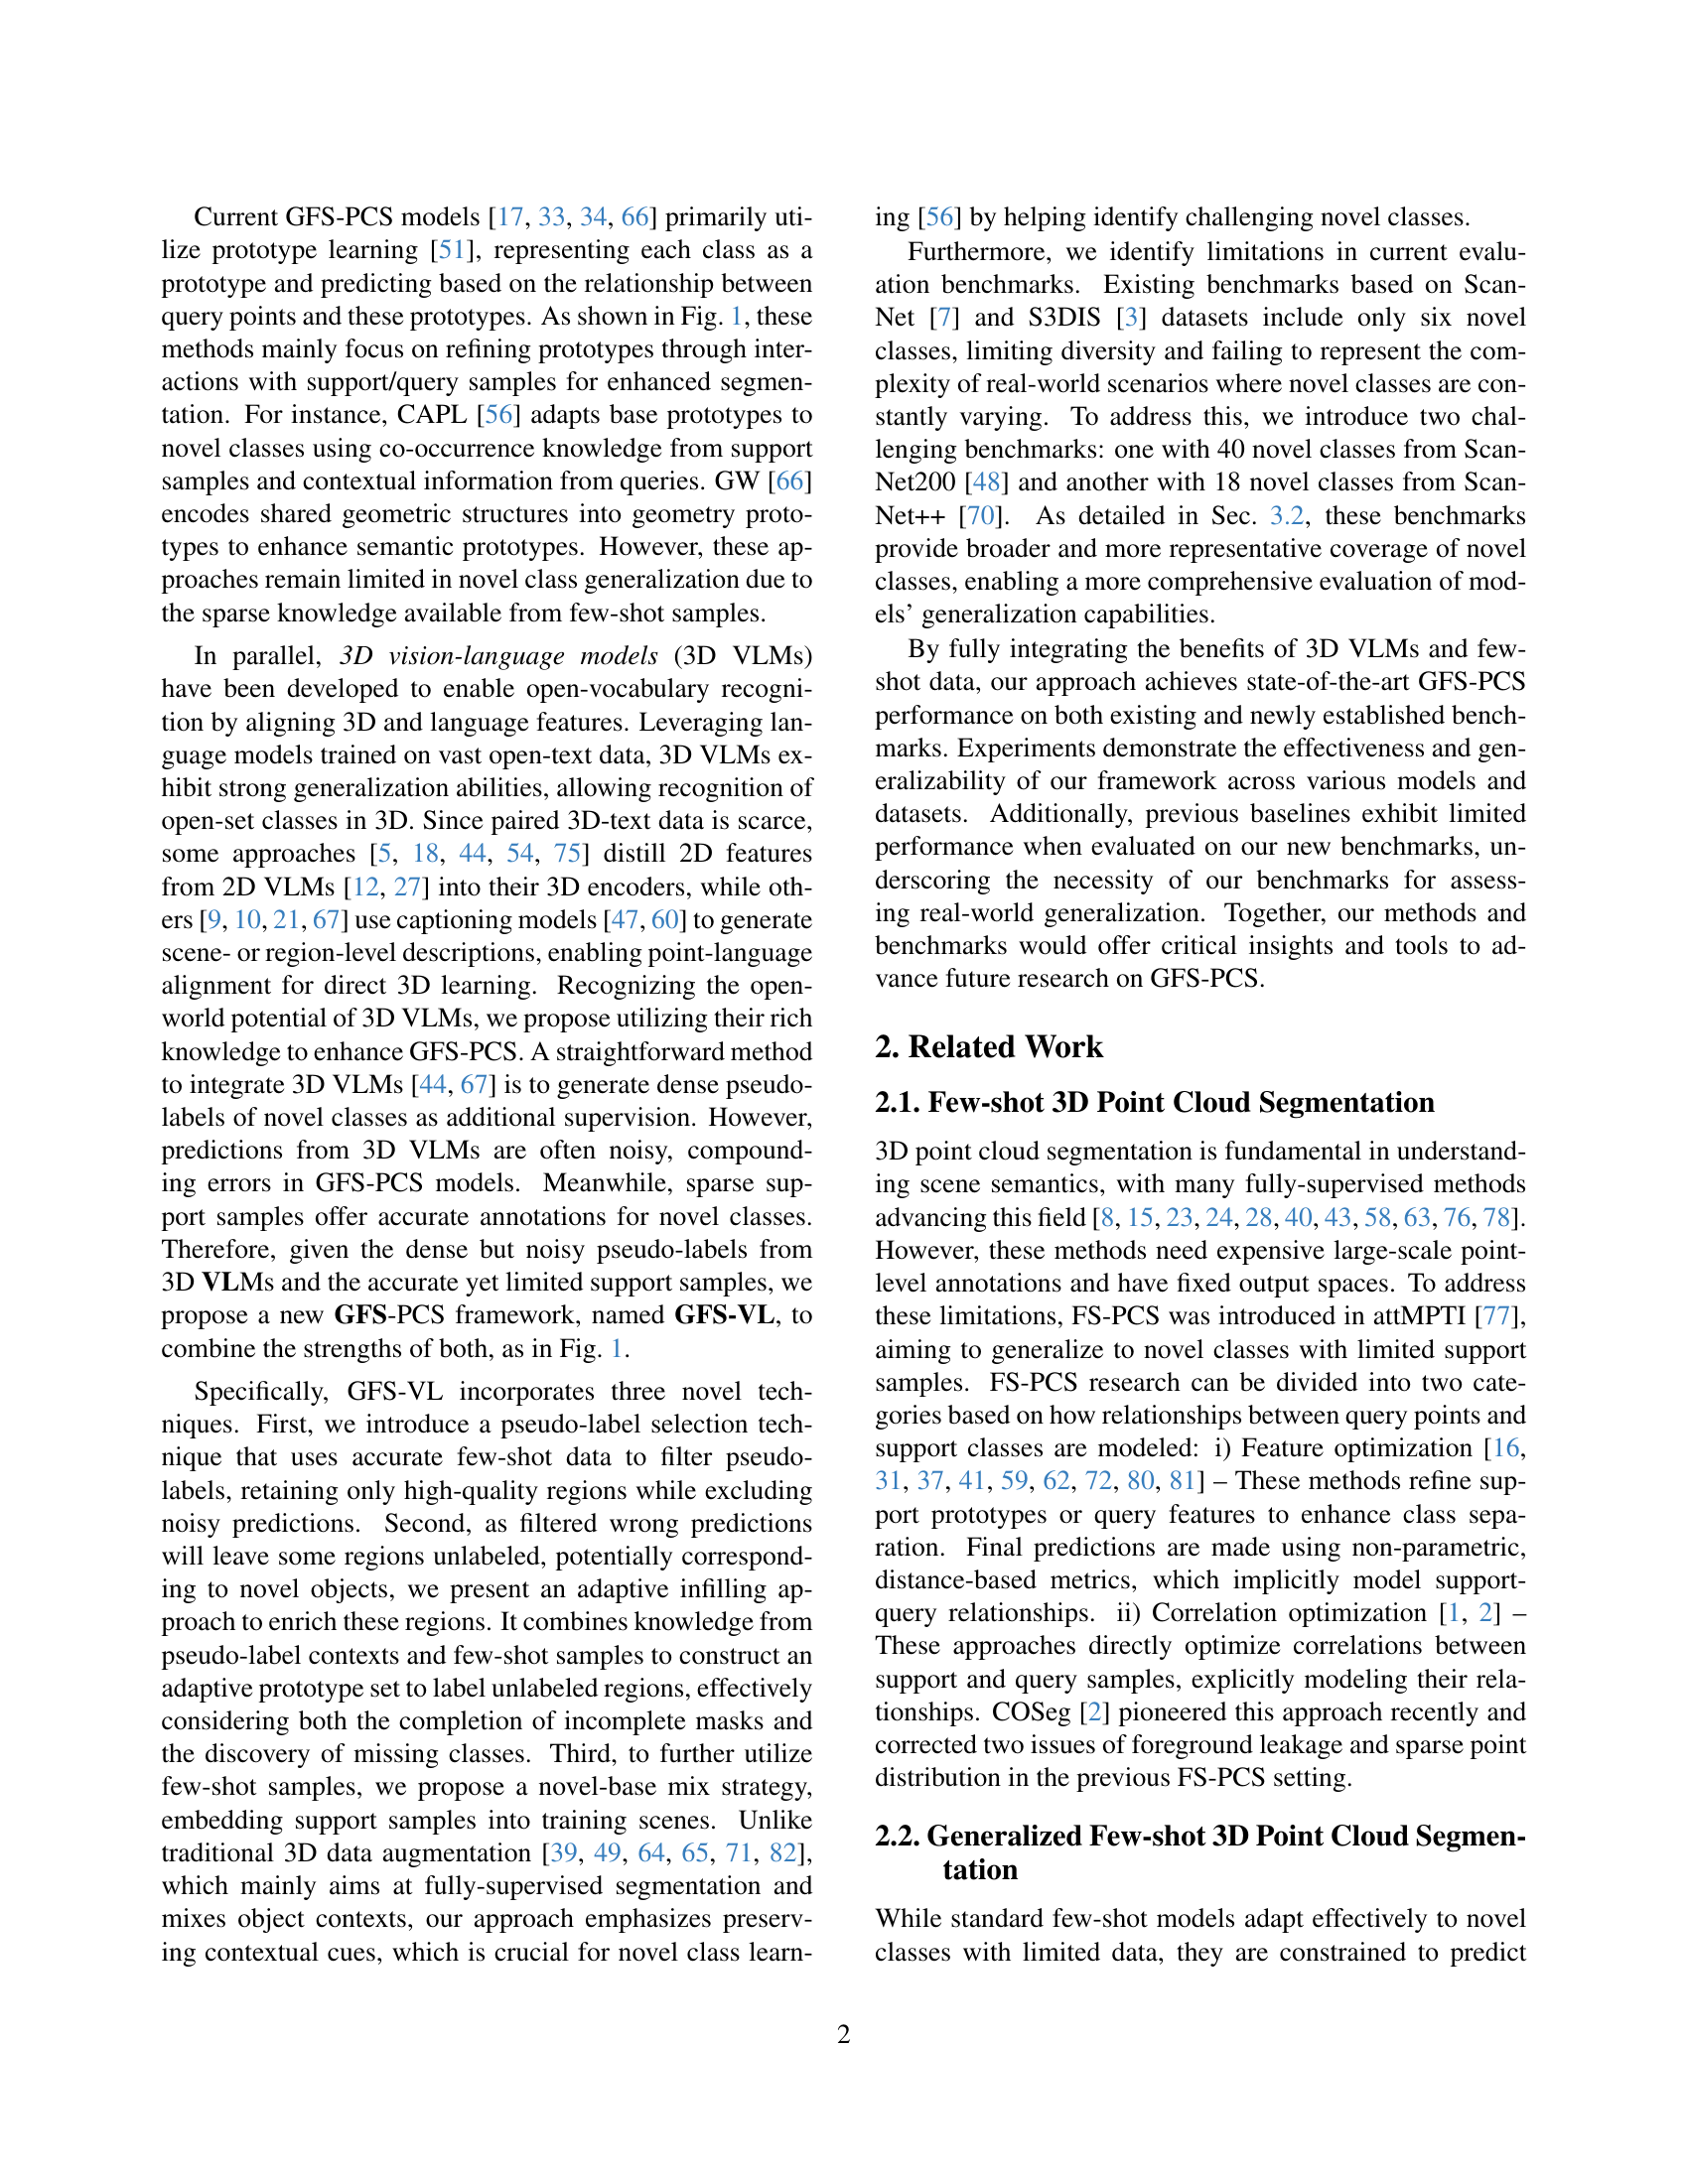
| Dataset | Base | Novel | Max (F) | Min (F) | Max (P) | Min (P) |
|---|---|---|---|---|---|---|
| S3DIS | 7 | 6 | 185 | 29 | 59,929 | 30,013 |
| ScanNet | 13 | 6 | 411 | 133 | 4,479 | 1,148 |
| ScanNet200 | 12 | 45 | 733 | 102 | 12,641 | 279 |
| ScanNet++ | 12 | 18 | 143 | 82 | 84,375 | 604 |
🔼 This table presents a statistical overview of four datasets commonly used for evaluating Generalized Few-shot 3D Point Cloud Segmentation (GFS-PCS) models. For each dataset, it lists the number of base classes (already known to the model) and novel classes (new classes the model must learn). Crucially, it also shows the frequency distribution of novel classes. ‘Max (F)’ and ‘Min (F)’ represent the maximum and minimum number of times each novel class appears in the dataset, indicating class imbalance. Similarly, ‘Max (P)’ and ‘Min (P)’ show the maximum and minimum average number of points per novel class, further highlighting the variability in data representation for different novel classes.
read the caption
Table 1: Statistics for GFS-PCS benchmarks across four datasets. Base/Novel indicates the number of base and novel classes. Max/Min (F) is the maximum and minimum occurrences of each novel class across the entire dataset, while Max/Min (P) is the maximum and minimum average number of points per novel class.
In-depth insights#
3D VLM Synergy#
The synergy of 3D Vision-Language Models (VLMs) holds immense potential for advancing various 3D understanding tasks. 3D VLMs can bring rich semantic knowledge learned from vast text and image datasets, offering broad comprehension of objects and scenes. However, VLMs often struggle with geometric precision and fine-grained details crucial for tasks like segmentation or reconstruction. By combining VLMs with methods specializing in 3D geometry, such as point cloud processing or neural radiance fields, we can create powerful systems. For example, a VLM could provide high-level semantic labels, while a point cloud network refines the object boundaries. This fusion addresses the limitations of each approach, resulting in more robust and accurate 3D scene understanding. The challenge lies in effectively integrating information from different modalities and representations, and future research directions include developing attention mechanisms, cross-modal embeddings, and end-to-end training strategies.
Pseudo-Labeling#
Pseudo-labeling emerges as a pivotal technique, strategically leveraging the open-world knowledge embedded in 3D VLMs to augment few-shot learning. Recognizing the inherent noise in VLM predictions, frameworks emphasize selective incorporation of pseudo-labels, prioritizing high-quality regions through strategies like prototype-guided selection. This filters unreliable predictions, mitigating error accumulation. Crucially, methods employ adaptive infilling to address filtered regions, blending contextual knowledge from pseudo-labels and precise few-shot samples. This balances novel class knowledge expansion and data reliability. By combining noisy pseudo-labels with accurate samples, enhances novel class learning while maintaining robustness.
Novel-Base Mix#
The Novel-Base Mix technique seems crucial for integrating few-shot learning with broader scene understanding. By embedding support samples directly into training scenes, the model learns novel classes within a relevant context. This preserves contextual cues, aiding the model in identifying hard-to-detect objects by not losing important relationships that may exist between objects or categories. Unlike standard data augmentation that focuses on object patterns independently, this approach emphasizes holistic scene comprehension that effectively improves novel class learning, yielding stronger generalization by having seen the object/category in relevant environments.
New Benchmarks#
Creating new benchmarks is crucial for advancing research. Existing datasets might lack diversity or complexity, hindering accurate model evaluation. Introducing new benchmarks with more varied and challenging data helps to rigorously test the generalization capabilities of models. A good benchmark also fosters fair comparisons across different methods, providing a solid foundation for real-world applications and driving further innovation in the field. It is important to have a benchmark that adequately reflects real-world complexities so that it can encourage more research.
Context Matters!#
The importance of context in machine learning, particularly in tasks like few-shot learning and 3D scene understanding, cannot be overstated. Models must move beyond simply recognizing objects in isolation and instead understand their relationships with the surrounding environment. This is especially crucial when dealing with novel classes or adapting to new domains, as relying solely on object-level features can lead to poor generalization. Context provides vital cues for disambiguation, helping models to infer the function, state, and likely interactions of objects within a scene. For instance, the presence of a sink and mirror strongly suggests a bathroom setting, which in turn influences the interpretation of other objects present. Data augmentation strategies should also prioritize preserving contextual information to avoid misleading the models. A holistic understanding of context is essential for achieving robust and reliable performance in real-world applications.
More visual insights#
More on figures

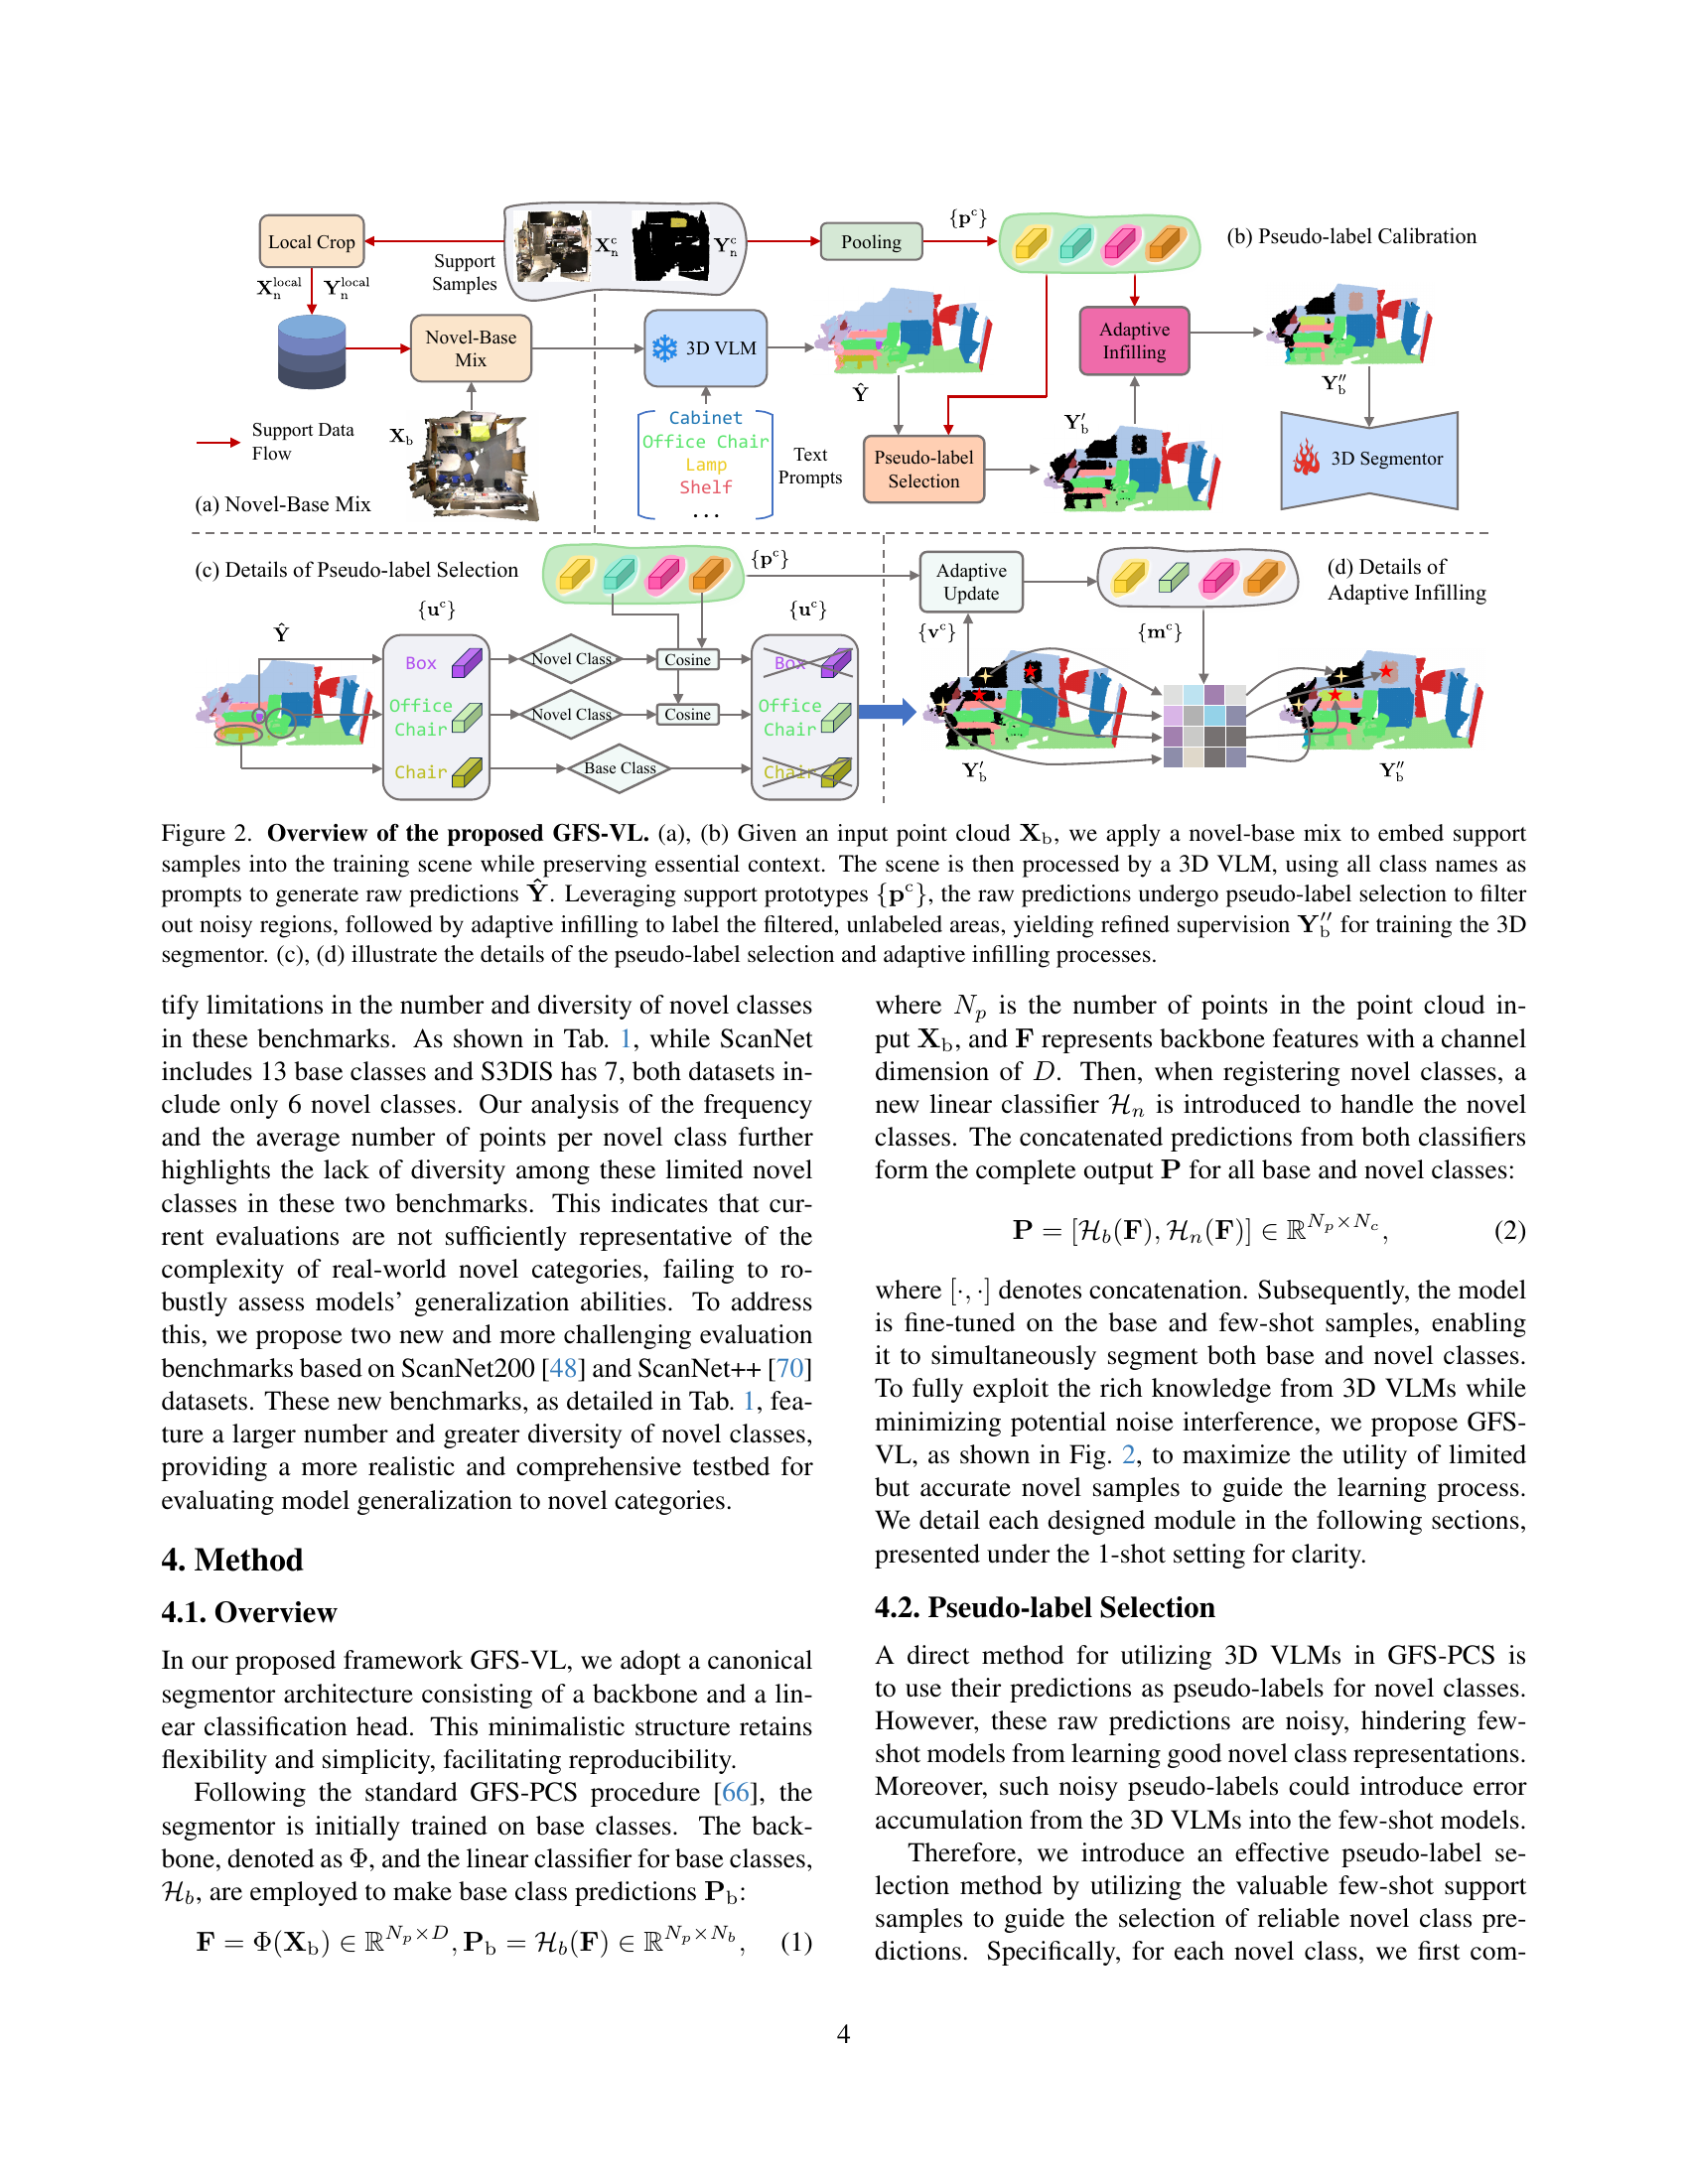
🔼 Figure 2 illustrates the GFS-VL framework. First, a novel-base mix (a,b) integrates support samples into the input point cloud (𝐗b) while preserving context. This augmented data is fed into a 3D Vision-Language Model (VLM) to generate raw predictions (𝐘̂). Then, pseudo-label selection (c) filters out noisy predictions from 𝐘̂ using support prototypes (𝐩c), and adaptive infilling (d) labels remaining unlabeled regions. The refined supervision (𝐘b′′) is then used to train the 3D segmentor.
read the caption
Figure 2: Overview of the proposed GFS-VL. (a), (b) Given an input point cloud 𝐗bsubscript𝐗b\mathbf{X}_{\rm b}bold_X start_POSTSUBSCRIPT roman_b end_POSTSUBSCRIPT, we apply a novel-base mix to embed support samples into the training scene while preserving essential context. The scene is then processed by a 3D VLM, using all class names as prompts to generate raw predictions 𝐘^^𝐘\mathbf{\hat{Y}}over^ start_ARG bold_Y end_ARG. Leveraging support prototypes {𝐩c}superscript𝐩c\{\mathbf{p}^{\rm c}\}{ bold_p start_POSTSUPERSCRIPT roman_c end_POSTSUPERSCRIPT }, the raw predictions undergo pseudo-label selection to filter out noisy regions, followed by adaptive infilling to label the filtered, unlabeled areas, yielding refined supervision 𝐘b′′subscriptsuperscript𝐘′′b\mathbf{Y}^{\rm\prime\prime}_{\rm b}bold_Y start_POSTSUPERSCRIPT ′ ′ end_POSTSUPERSCRIPT start_POSTSUBSCRIPT roman_b end_POSTSUBSCRIPT for training the 3D segmentor. (c), (d) illustrate the details of the pseudo-label selection and adaptive infilling processes.

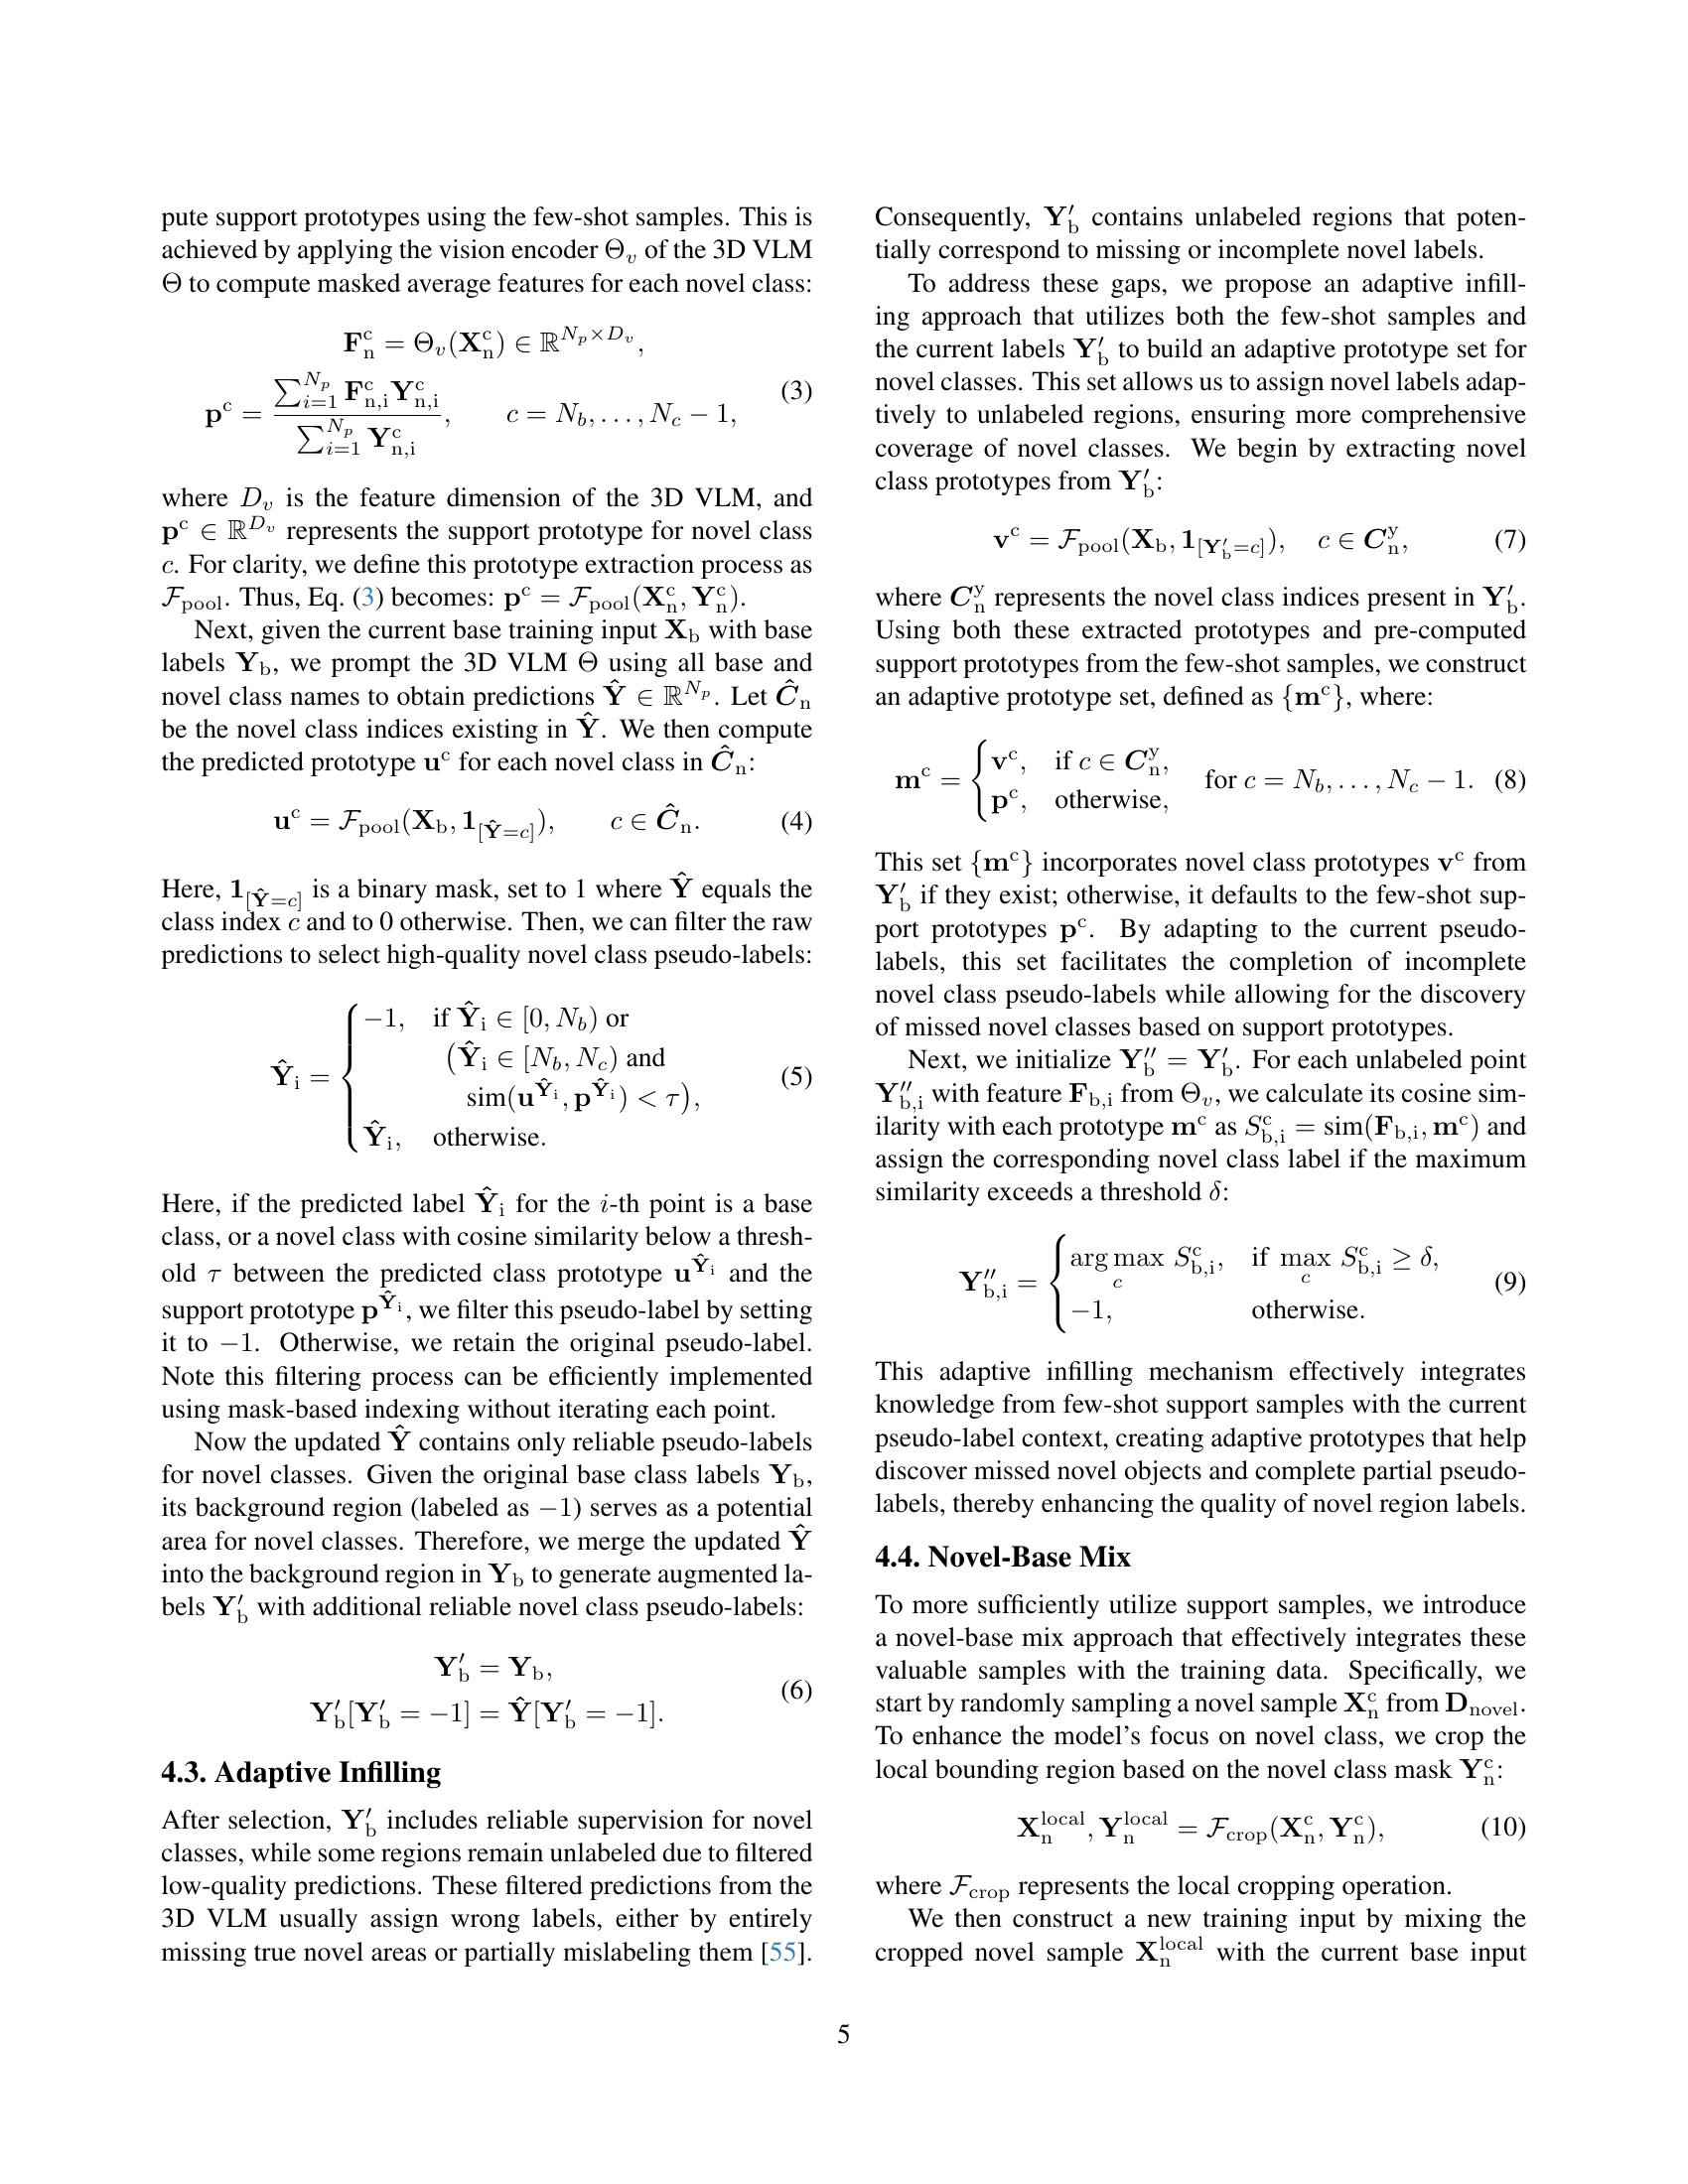
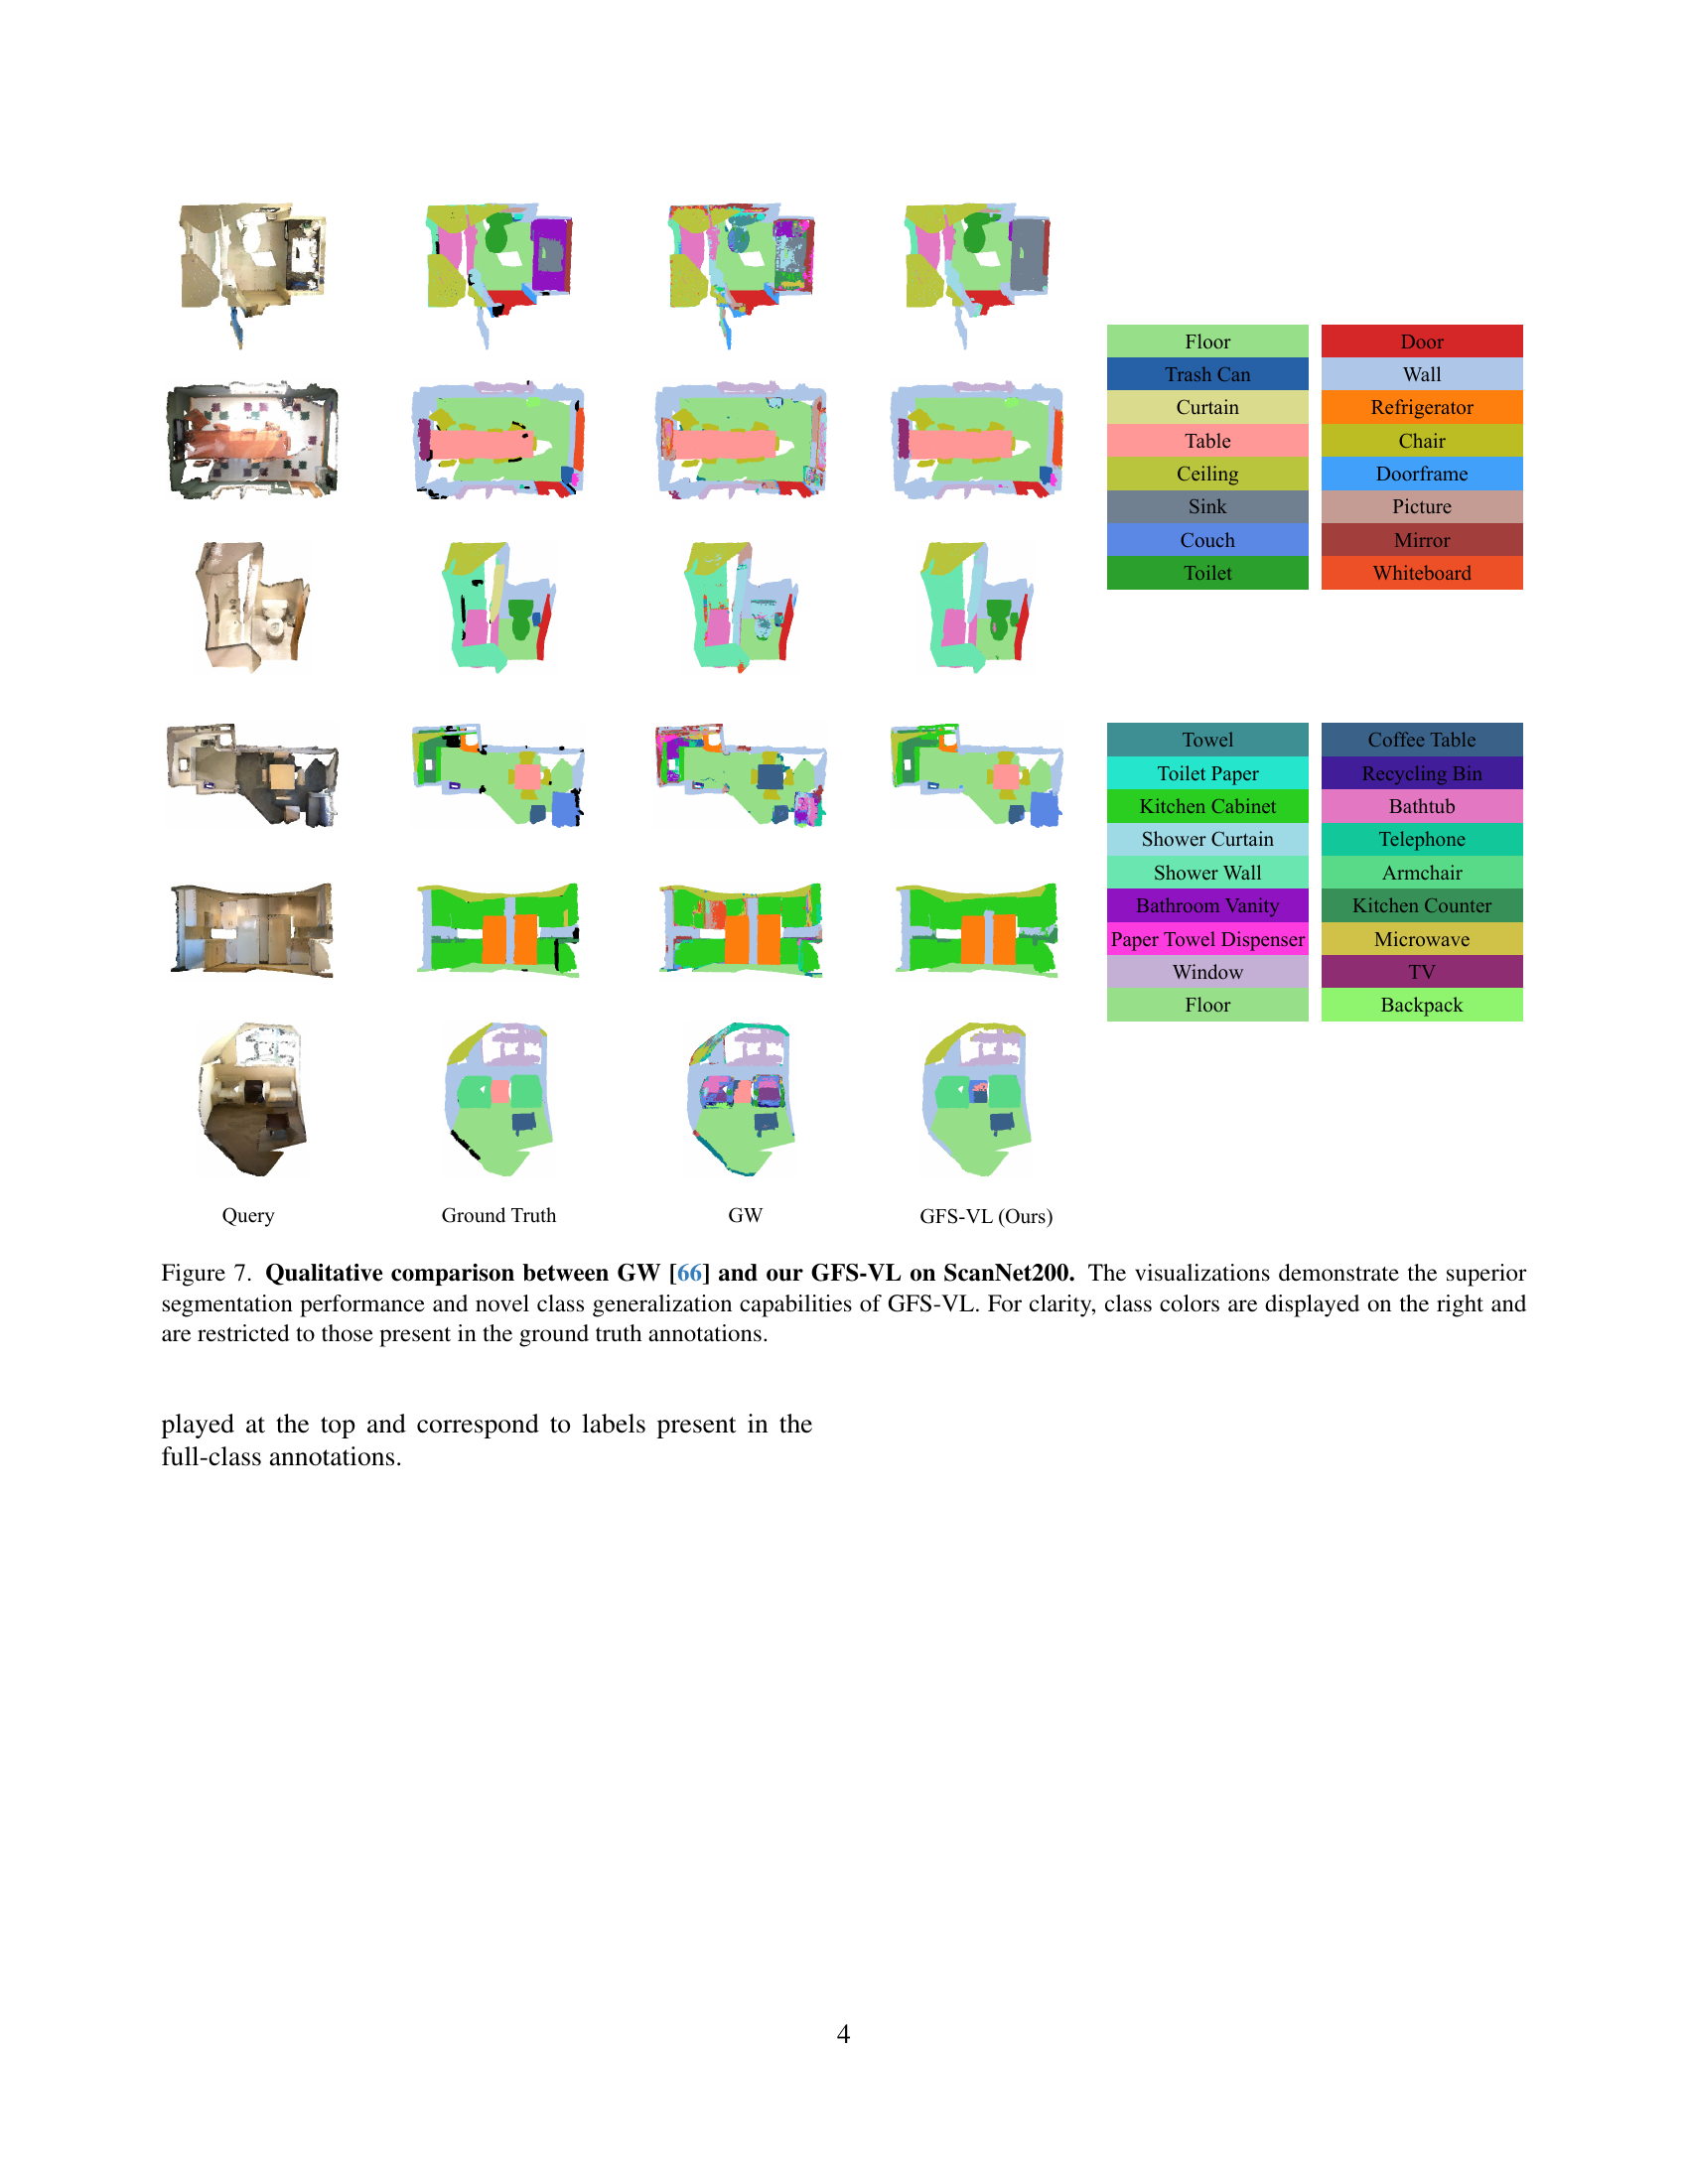
🔼 This figure presents a qualitative comparison of the segmentation results obtained using two different methods: GW [66] and the proposed GFS-VL method, on the ScanNet200 dataset. The comparison highlights the effectiveness of the GFS-VL approach. For each scene, there are three columns: the ground truth segmentation, the segmentation produced by GW, and the segmentation produced by GFS-VL. The color coding for each class is shown at the top of the figure, allowing for easy visual comparison between the methods. This allows one to visually assess the accuracy and quality of each segmentation method in segmenting various objects and scene elements within the selected scenes from the ScanNet200 dataset.
read the caption
Figure 3: Qualitative comparison between GW [66] and our GFS-VL on ScanNet200. Class colors are shown at the top.

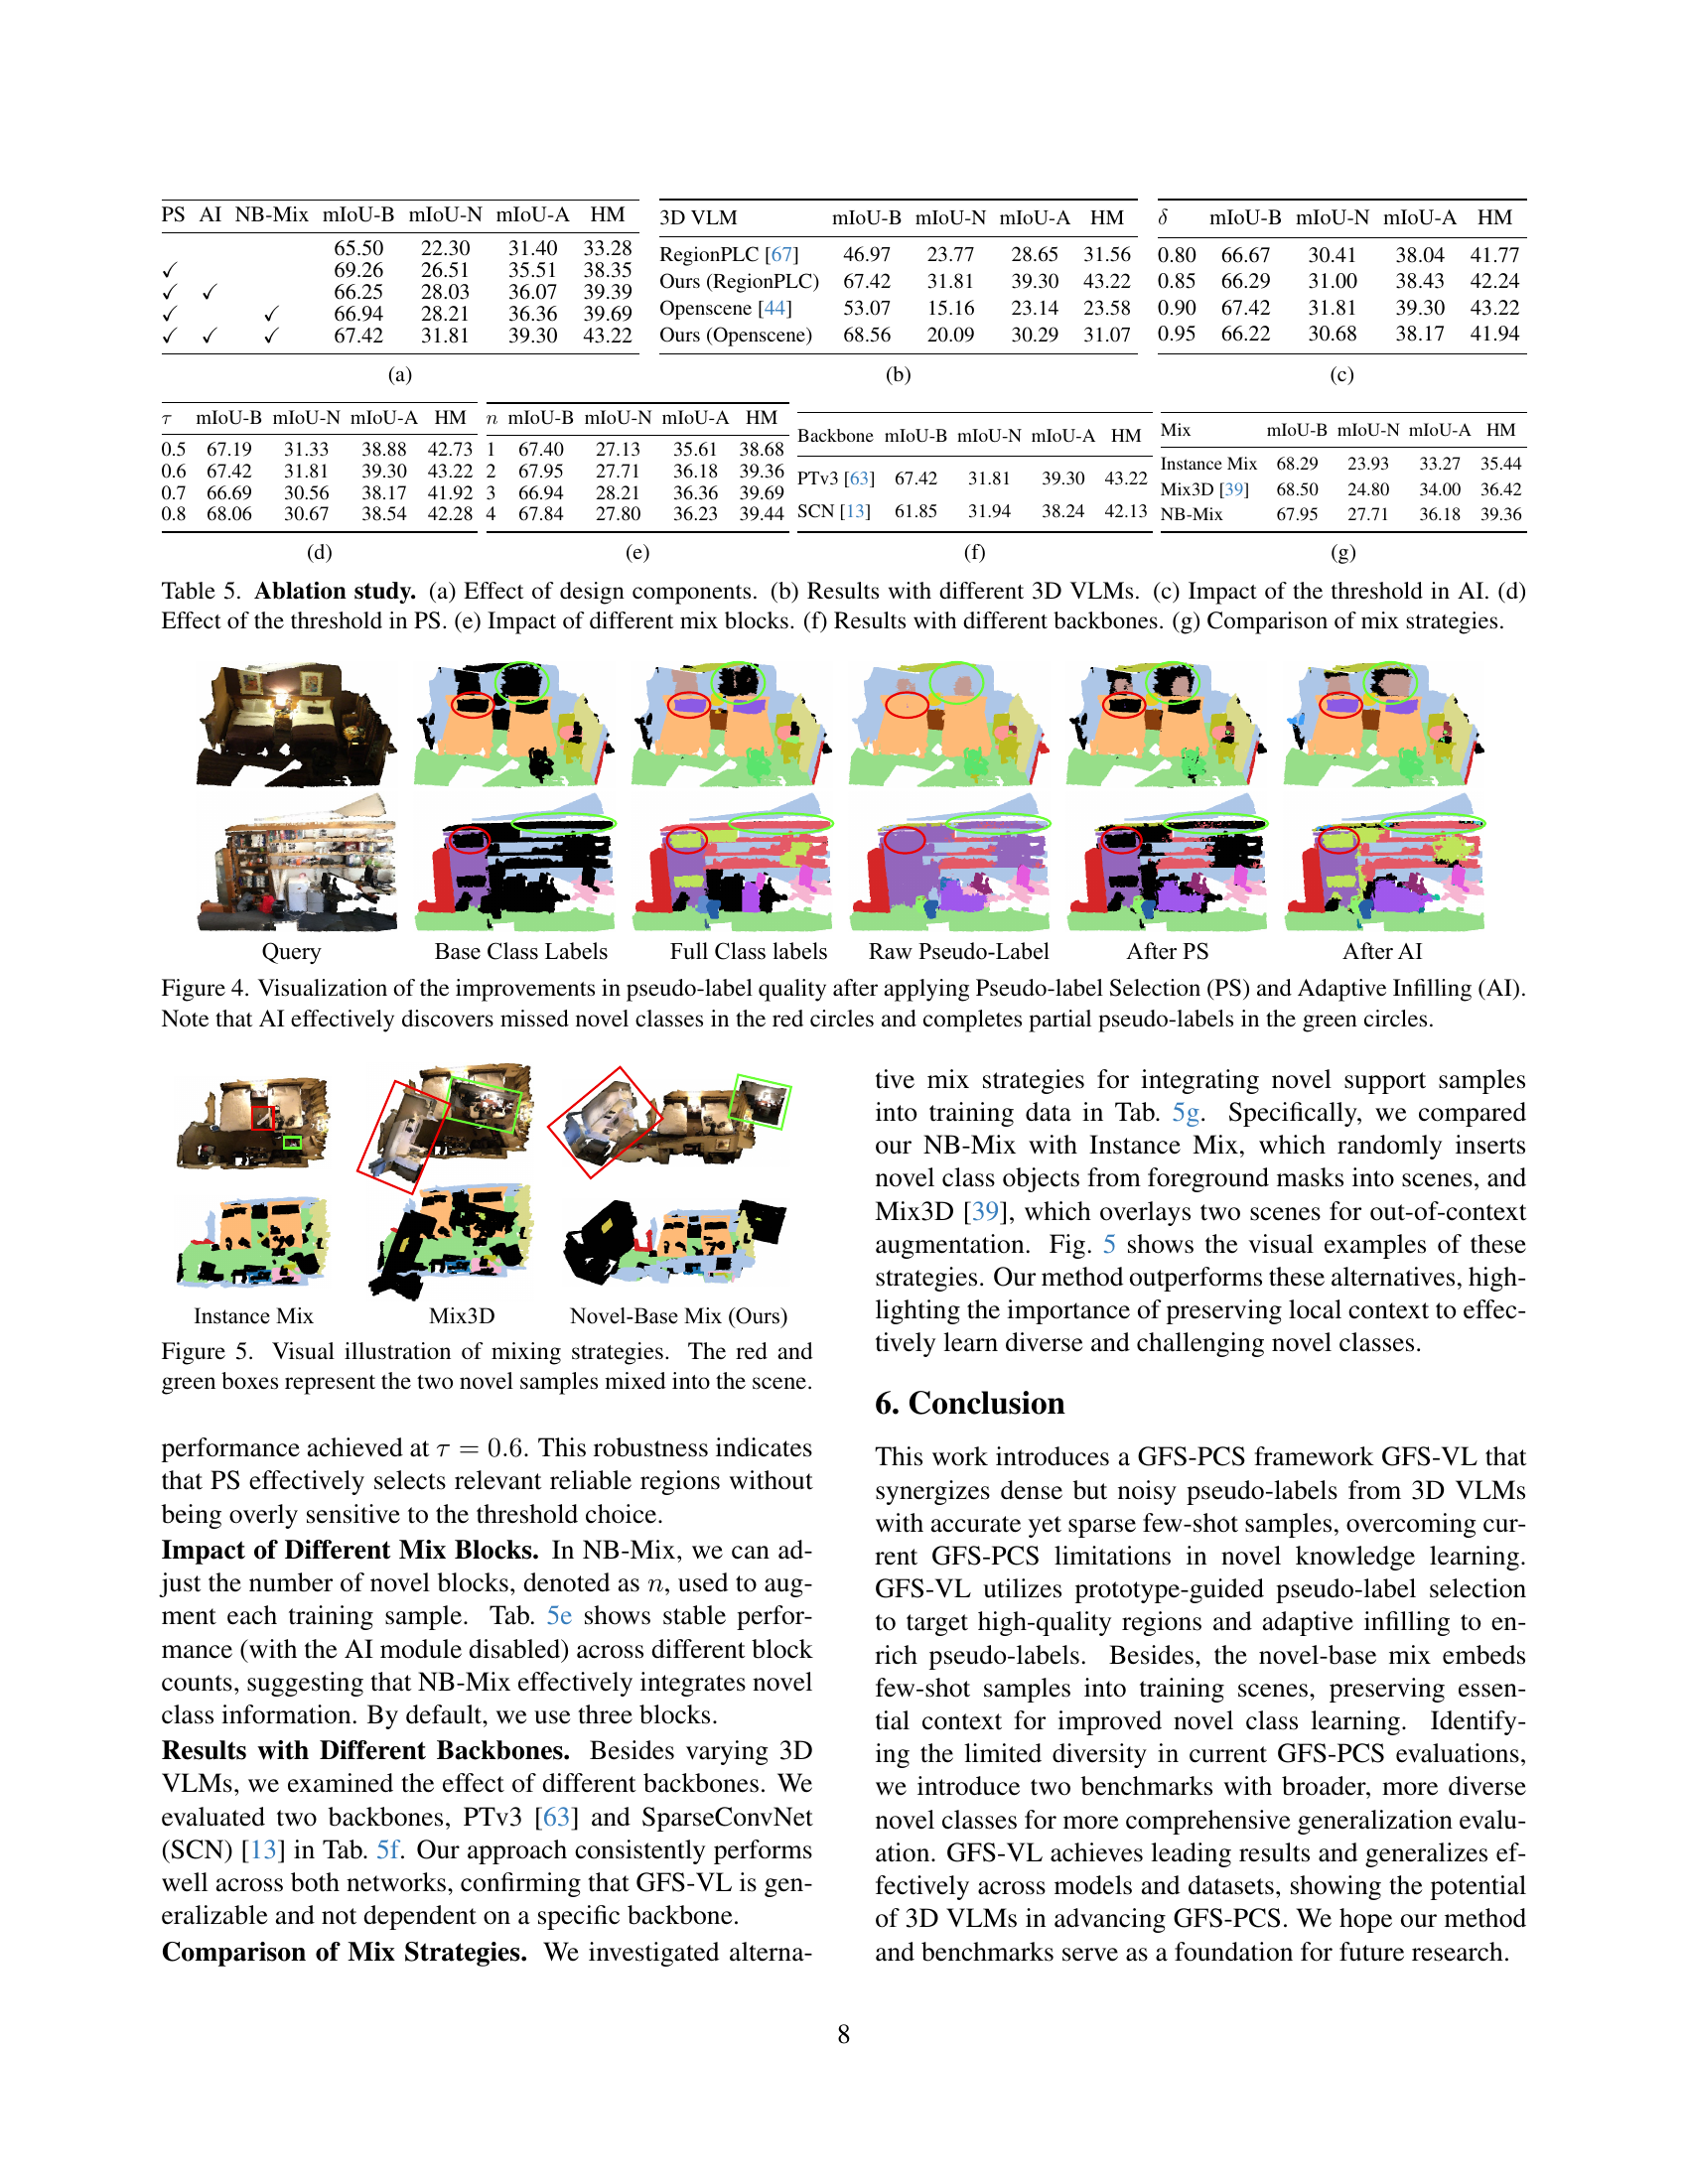
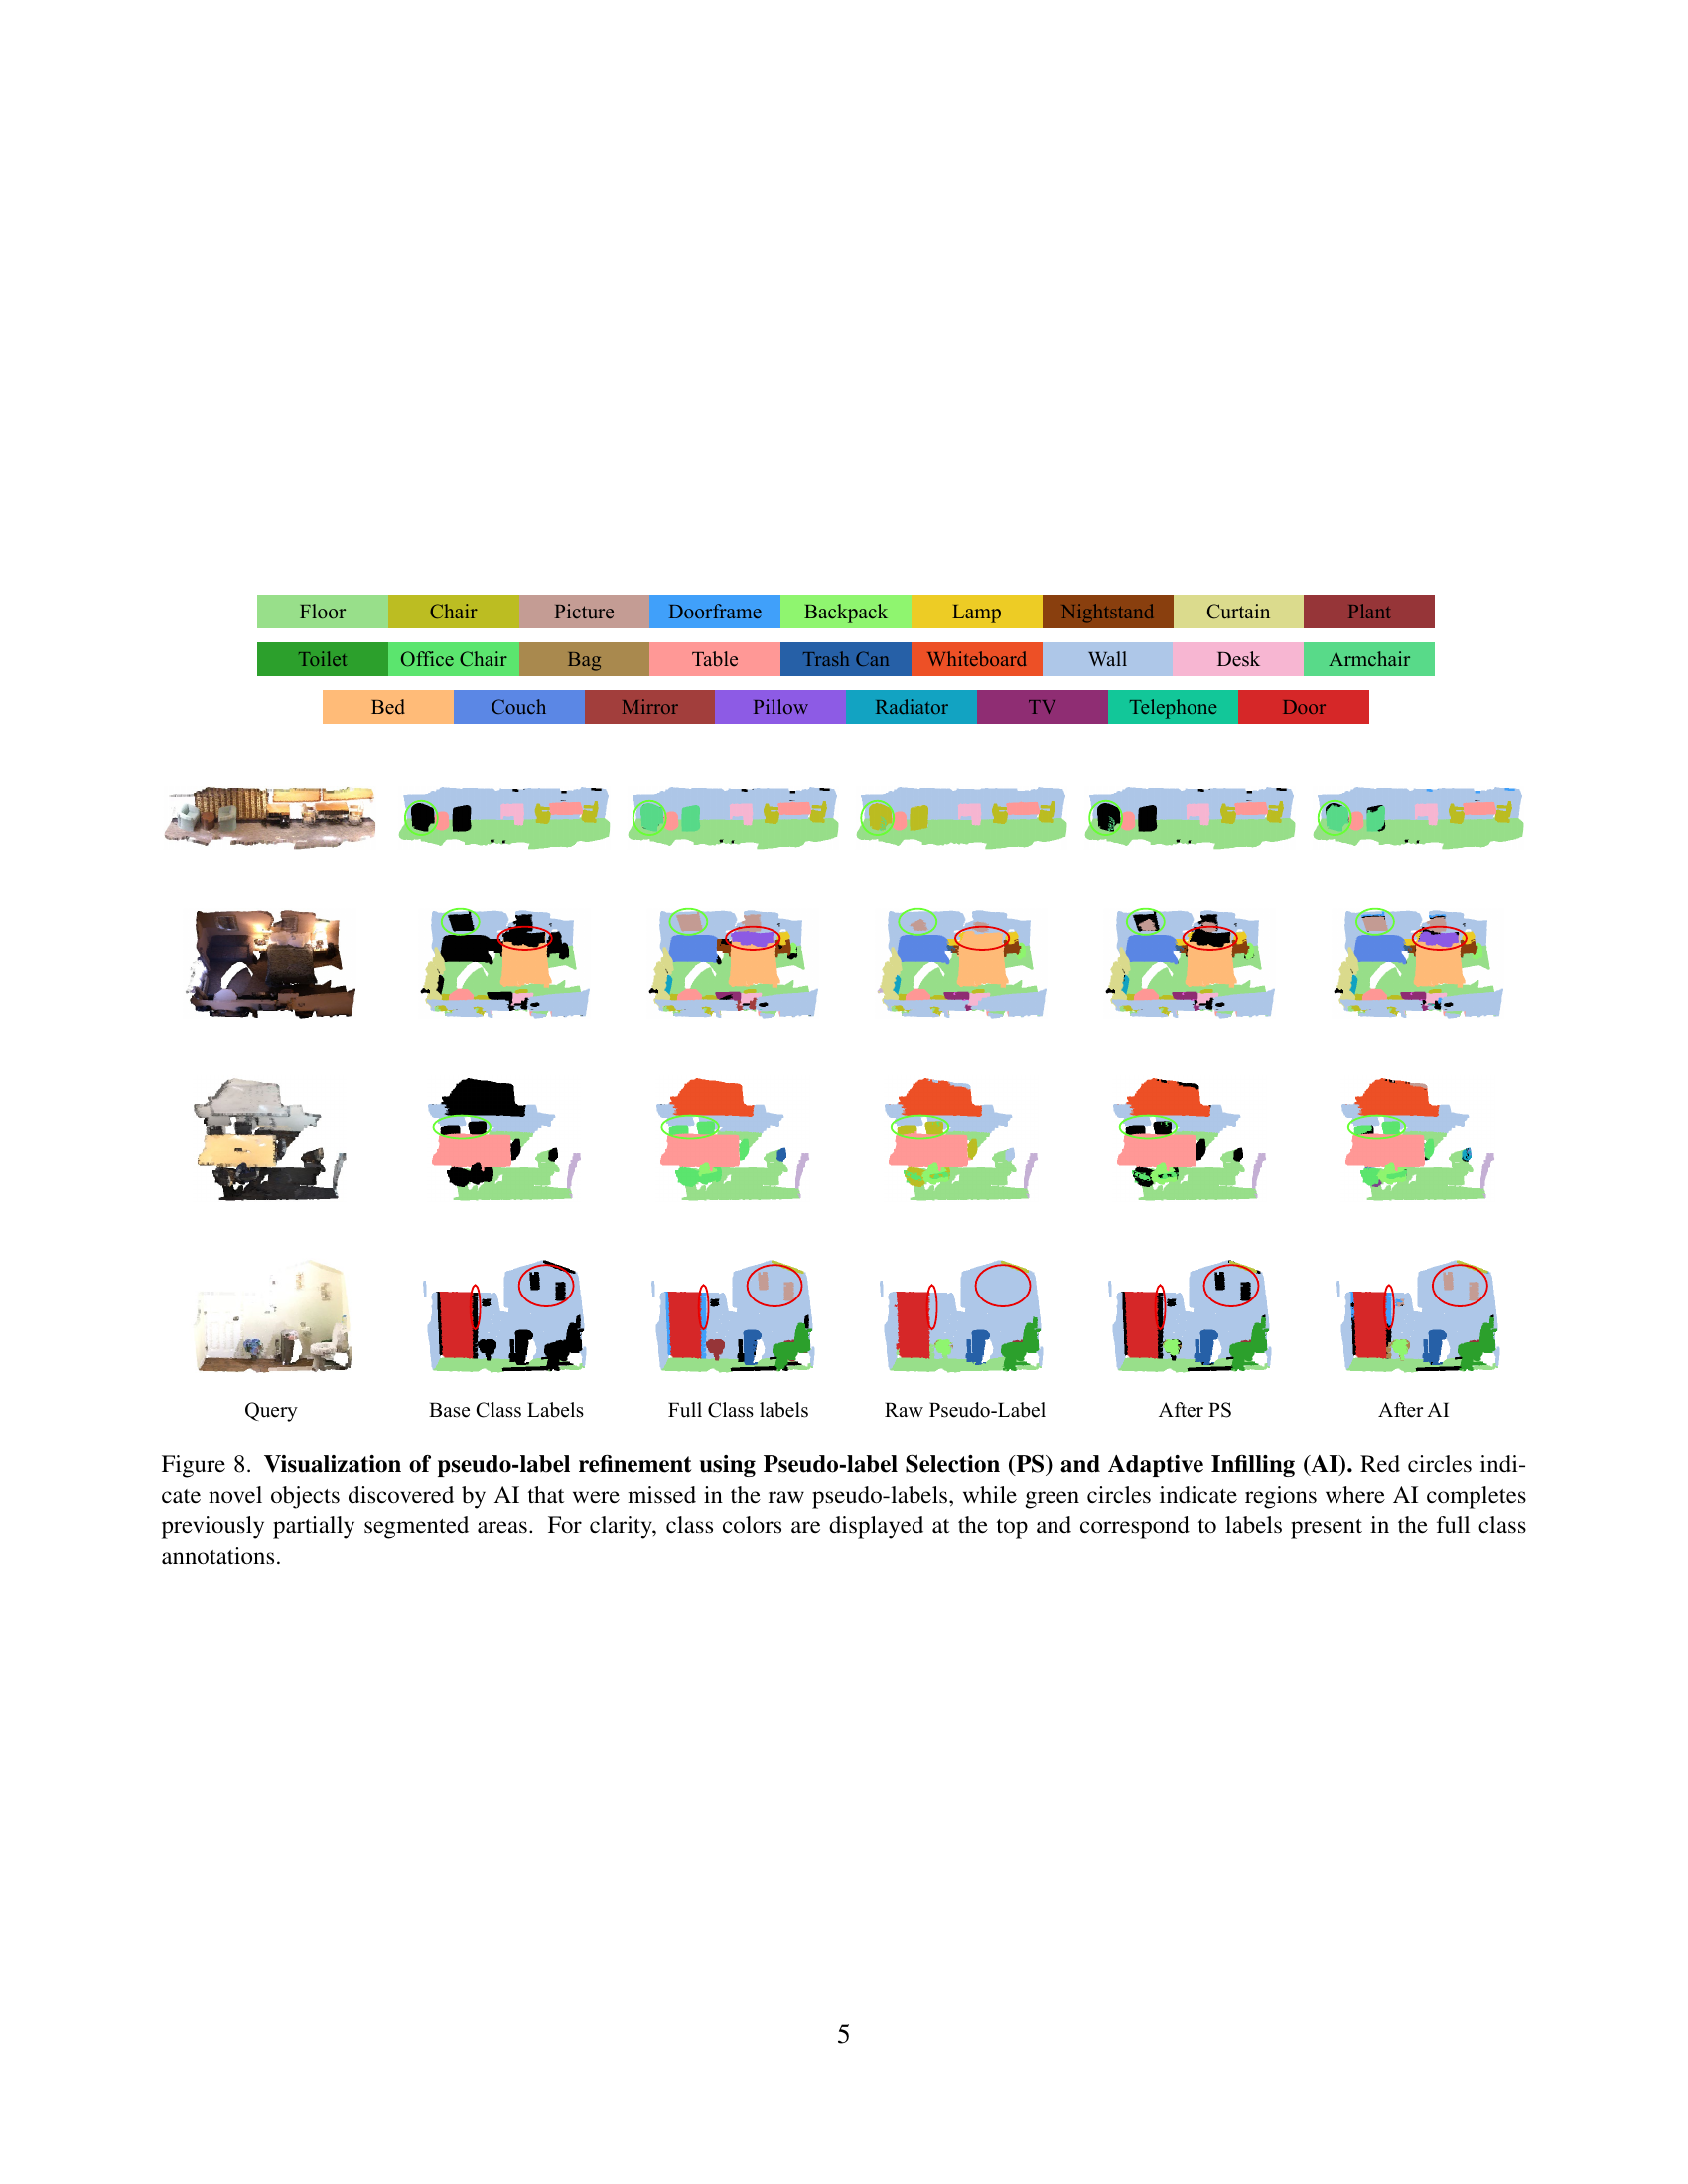
🔼 Figure 4 presents a visual comparison of pseudo-labels before and after applying the proposed pseudo-label selection (PS) and adaptive infilling (AI) methods. The figure showcases how PS effectively filters out noisy predictions from the 3D Vision-Language Model (VLM), resulting in cleaner pseudo-labels. It then demonstrates how AI successfully addresses incomplete or missing labels, particularly for novel classes. This is visualized by highlighting regions where AI identifies missed novel object classes (red circles) and fills in partially labeled regions (green circles) to improve the overall quality and completeness of the pseudo-labels.
read the caption
Figure 4: Visualization of the improvements in pseudo-label quality after applying Pseudo-label Selection (PS) and Adaptive Infilling (AI). Note that AI effectively discovers missed novel classes in the red circles and completes partial pseudo-labels in the green circles.

🔼 Figure 5 compares three different data augmentation strategies: (a) Instance Mix randomly inserts novel class objects from foreground masks into scenes; (b) Mix3D overlays two scenes for out-of-context augmentation; and (c) Novel-Base Mix, which is the proposed method in this paper. The red and green boxes highlight the novel samples incorporated into the training scene using the different techniques. Novel-Base Mix focuses on preserving the contextual cues in the scene, which is crucial for improved novel class learning.
read the caption
Figure 5: Visual illustration of mixing strategies. The red and green boxes represent the two novel samples mixed into the scene.

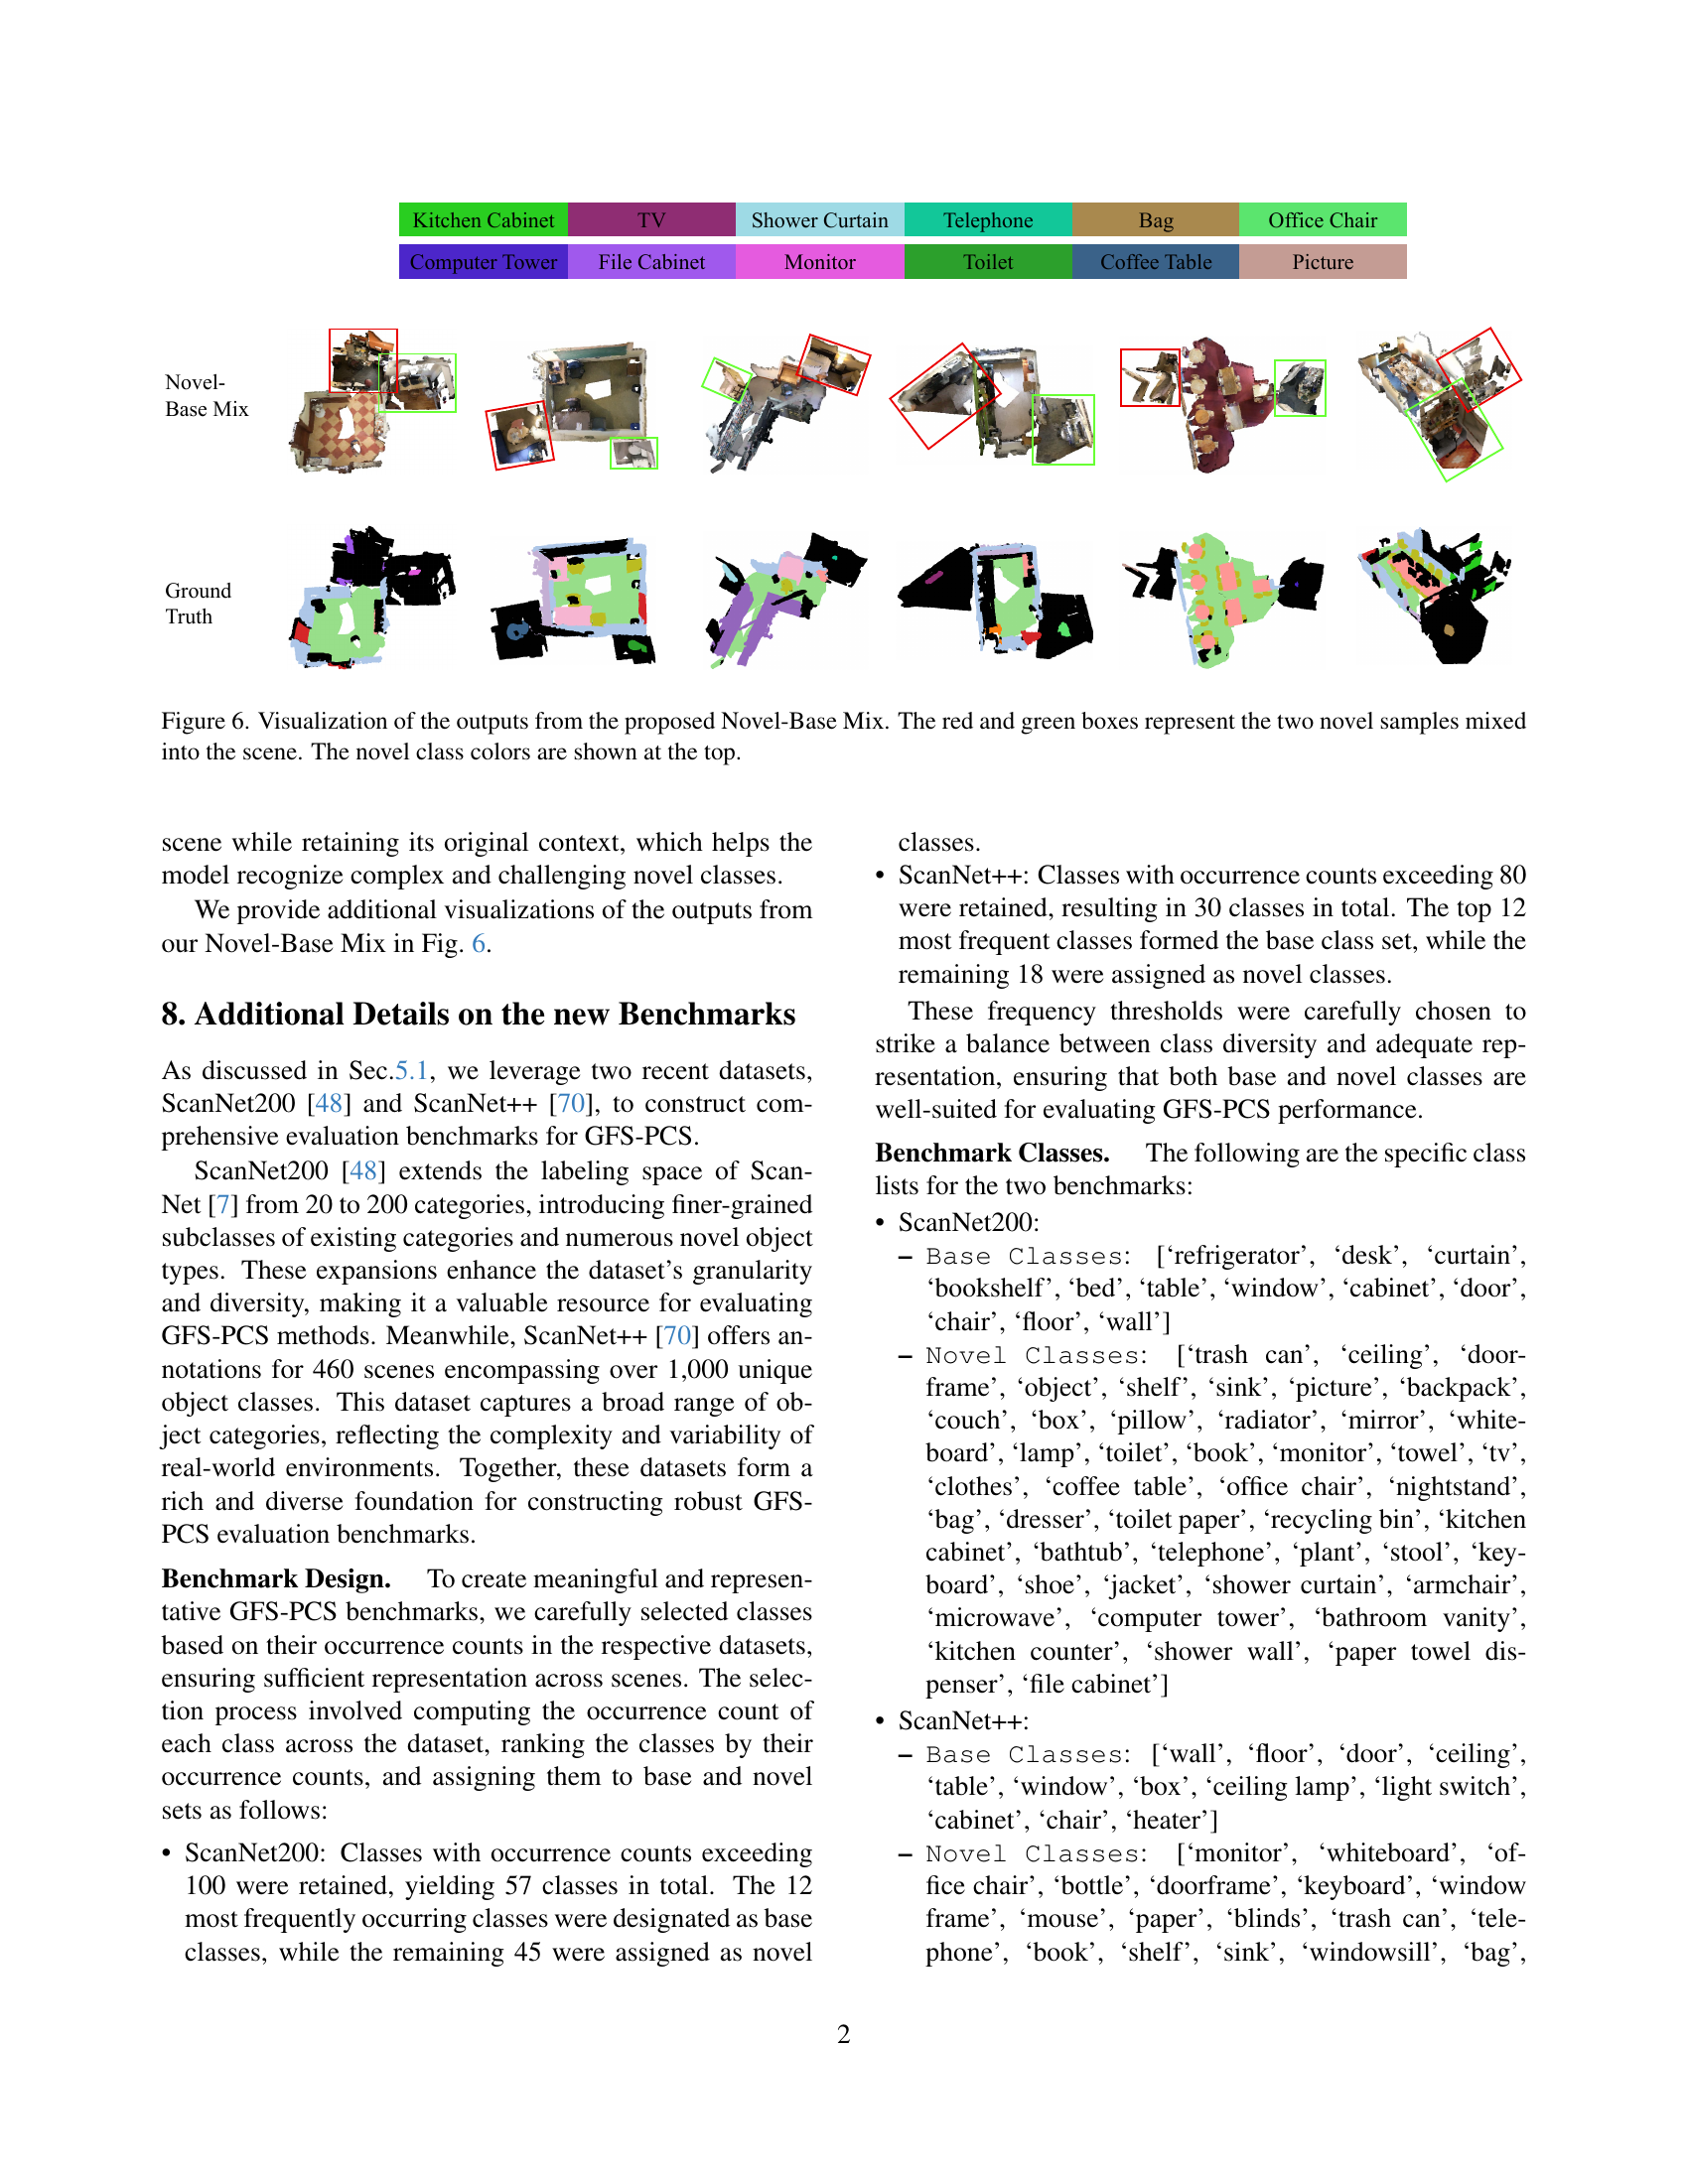
🔼 This figure visualizes the results of the Novel-Base Mix data augmentation technique. The Novel-Base Mix method integrates novel class samples into the training data while preserving the essential context of the base scene. This helps the model learn to identify novel classes more effectively. The image shows several point cloud segmentation results. Each segmentation shows the same scene with base classes and two novel classes added. The red and green boxes highlight the locations of the two novel samples which have been incorporated into the scene. The novel class labels are displayed at the top of the image for reference. The image demonstrates how the technique integrates the novel classes into a typical scene.
read the caption
Figure 6: Visualization of the outputs from the proposed Novel-Base Mix. The red and green boxes represent the two novel samples mixed into the scene. The novel class colors are shown at the top.

🔼 Figure 7 presents a qualitative comparison of the performance of the proposed GFS-VL model against the GW model on the ScanNet200 dataset. The figure displays several example point cloud segmentation results. Each row shows a different scene, with the ‘Query’ column showing the input point cloud, ‘Ground Truth’ showing the accurate segmentation labels, ‘GW’ showing the segmentation results produced by the GW model, and ‘GFS-VL (Ours)’ displaying the results from the proposed GFS-VL model. The visualizations clearly highlight GFS-VL’s improved accuracy and ability to generalize to novel classes, demonstrating its superior performance compared to the GW model. To enhance clarity and focus on the key differences, the color legend only includes classes present in the ground truth annotations for each scene.
read the caption
Figure 7: Qualitative comparison between GW [66] and our GFS-VL on ScanNet200. The visualizations demonstrate the superior segmentation performance and novel class generalization capabilities of GFS-VL. For clarity, class colors are displayed on the right and are restricted to those present in the ground truth annotations.

🔼 Figure 8 visualizes the improvement in pseudo-label quality achieved by the proposed method’s Pseudo-label Selection (PS) and Adaptive Infilling (AI) modules. The figure showcases several examples of point cloud segmentations at different stages of processing. The first column (‘Query’) shows the initial input point cloud. The second column (‘Base Class Labels’) displays the base class labels before any novel class prediction. The third column (‘Full Class Labels’) displays the ground truth, including novel classes. The next three columns show the results after applying the 3D VLM, applying the Pseudo-label Selection (PS) module, and applying the Adaptive Infilling (AI) module. Red circles highlight novel objects identified by AI but missed by the initial 3D VLM prediction, while green circles show areas where AI successfully fills in previously incomplete or partially incorrect segmentation of novel classes. The colors at the top correspond to the class labels, offering a clear visual comparison between the different processing stages. This demonstrates how AI and PS refine the initially noisy 3D VLM predictions to produce much higher quality pseudo-labels.
read the caption
Figure 8: Visualization of pseudo-label refinement using Pseudo-label Selection (PS) and Adaptive Infilling (AI). Red circles indicate novel objects discovered by AI that were missed in the raw pseudo-labels, while green circles indicate regions where AI completes previously partially segmented areas. For clarity, class colors are displayed at the top and correspond to labels present in the full class annotations.
More on tables
| Method | 5-shot | 1-shot | |||||||
|---|---|---|---|---|---|---|---|---|---|
| mIoU-B | mIoU-N | mIoU-A | HM | mIoU-B | mIoU-N | mIoU-A | HM | ||
| Fully Supervised | 68.70 | 39.32 | 45.51 | 50.02 | 68.70 | 39.32 | 45.51 | 50.02 | |
| PIFS [4] | 28.78 | 3.82 | 9.07 | 6.71 | 17.84 | 2.87 | 6.02 | 4.88 | |
| attMPTI [77] | 37.13 | 4.99 | 11.76 | 8.79 | 54.84 | 3.28 | 14.14 | 6.17 | |
| COSeg [2] | 57.67 | 5.21 | 16.25 | 9.54 | 47.03 | 4.03 | 13.09 | 7.42 | |
| GW [66] | 59.28 | 8.30 | 19.03 | 14.55 | 55.23 | 6.47 | 16.74 | 11.56 | |
| GFS-VL (ours) | 67.57 | 31.67 | 39.23 | 43.12 | 68.48 | 29.18 | 37.45 | 40.92 | |
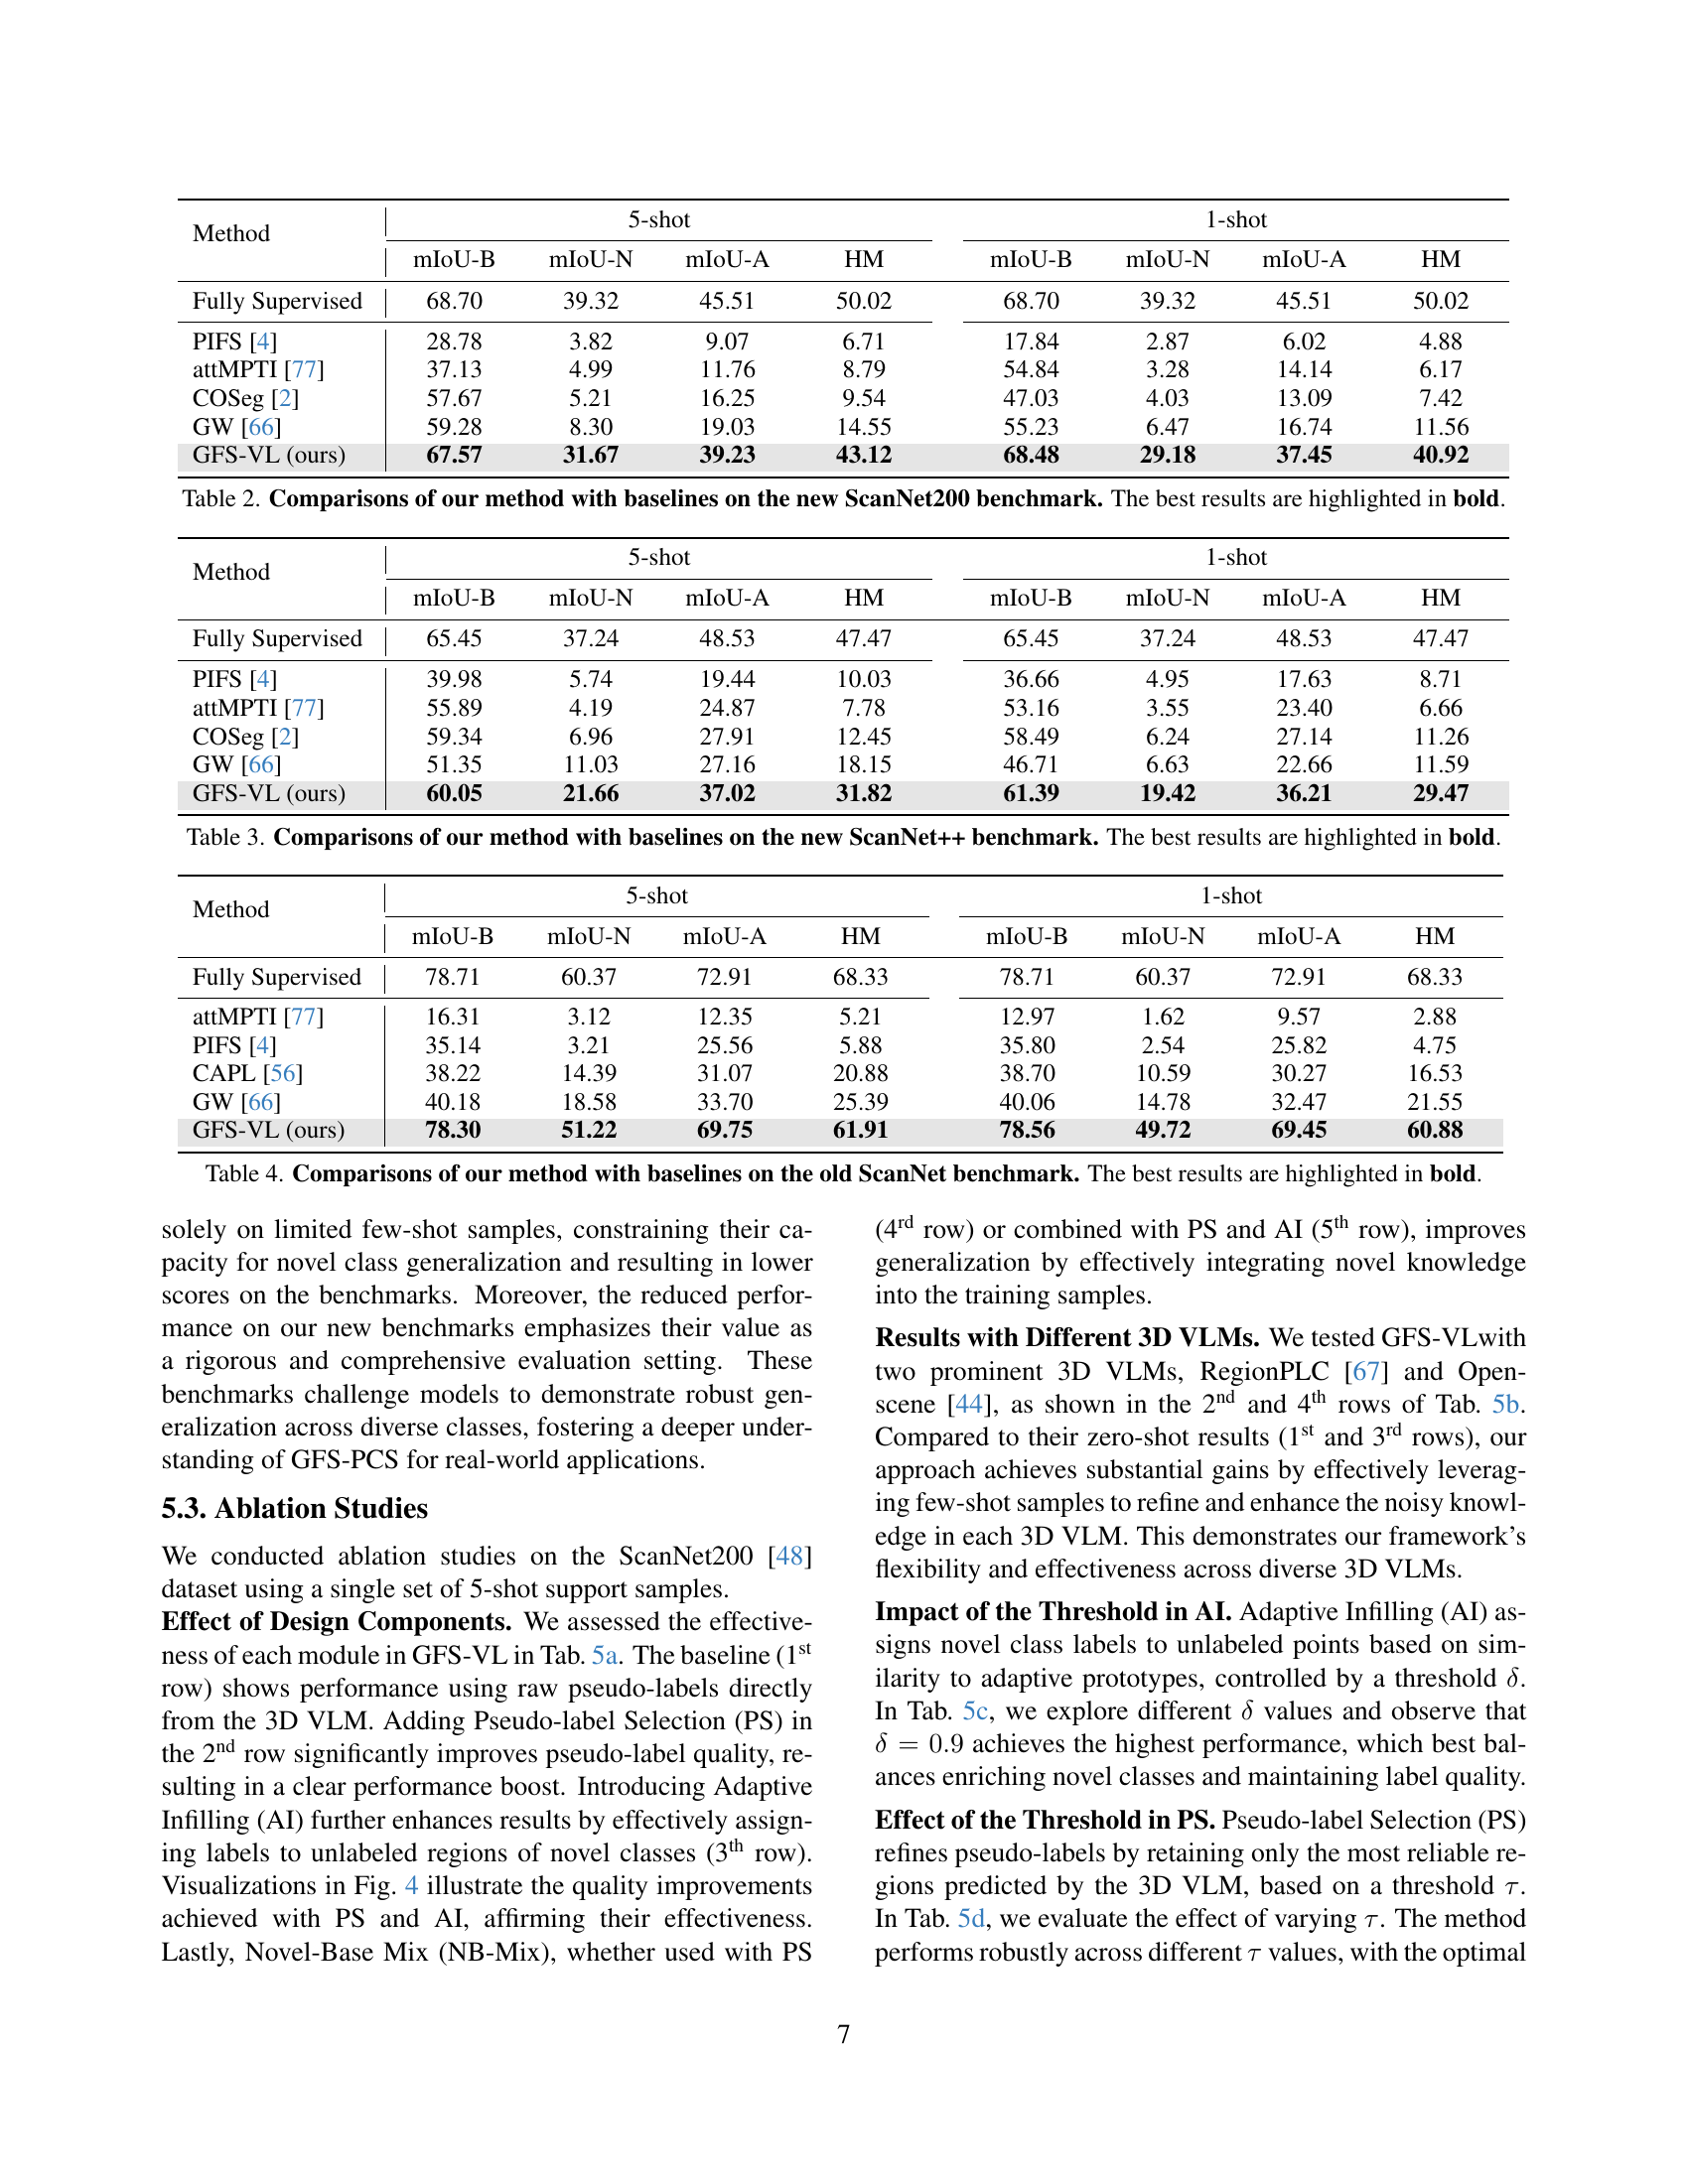
🔼 This table presents a comparison of the performance of different methods on the ScanNet200 benchmark dataset for generalized few-shot 3D point cloud segmentation. The methods compared include several baselines from prior work and the proposed method (GFS-VL). The performance is evaluated using four metrics: mean Intersection over Union (mIoU) for base classes (mIoU-B), mIoU for novel classes (mIoU-N), mIoU for all classes (mIoU-A), and the harmonic mean of mIoU-B and mIoU-N (HM). Results are shown for both 5-shot and 1-shot settings, indicating the number of support samples used for novel class learning. The best performing method for each metric is shown in bold.
read the caption
Table 2: Comparisons of our method with baselines on the new ScanNet200 benchmark. The best results are highlighted in bold.
| Method | 5-shot | 1-shot | |||||||
|---|---|---|---|---|---|---|---|---|---|
| mIoU-B | mIoU-N | mIoU-A | HM | mIoU-B | mIoU-N | mIoU-A | HM | ||
| Fully Supervised | 65.45 | 37.24 | 48.53 | 47.47 | 65.45 | 37.24 | 48.53 | 47.47 | |
| PIFS [4] | 39.98 | 5.74 | 19.44 | 10.03 | 36.66 | 4.95 | 17.63 | 8.71 | |
| attMPTI [77] | 55.89 | 4.19 | 24.87 | 7.78 | 53.16 | 3.55 | 23.40 | 6.66 | |
| COSeg [2] | 59.34 | 6.96 | 27.91 | 12.45 | 58.49 | 6.24 | 27.14 | 11.26 | |
| GW [66] | 51.35 | 11.03 | 27.16 | 18.15 | 46.71 | 6.63 | 22.66 | 11.59 | |
| GFS-VL (ours) | 60.05 | 21.66 | 37.02 | 31.82 | 61.39 | 19.42 | 36.21 | 29.47 | |
🔼 This table presents a comparison of the performance of different methods on the ScanNet++ benchmark dataset for generalized few-shot 3D point cloud segmentation. It shows the mean Intersection over Union (mIoU) scores for base classes (mIoU-B), novel classes (mIoU-N), and all classes (mIoU-A), as well as the harmonic mean (HM) of mIoU-B and mIoU-N. The comparison includes the proposed method (GFS-VL) and several baseline methods (Fully Supervised, PIFS, attMPTI, COSeg, and GW) for both 5-shot and 1-shot scenarios. The best performing method for each metric is highlighted in bold, demonstrating the effectiveness of the proposed approach.
read the caption
Table 3: Comparisons of our method with baselines on the new ScanNet++ benchmark. The best results are highlighted in bold.
| Method | 5-shot | 1-shot | |||||||
|---|---|---|---|---|---|---|---|---|---|
| mIoU-B | mIoU-N | mIoU-A | HM | mIoU-B | mIoU-N | mIoU-A | HM | ||
| Fully Supervised | 78.71 | 60.37 | 72.91 | 68.33 | 78.71 | 60.37 | 72.91 | 68.33 | |
| attMPTI [77] | 16.31 | 3.12 | 12.35 | 5.21 | 12.97 | 1.62 | 9.57 | 2.88 | |
| PIFS [4] | 35.14 | 3.21 | 25.56 | 5.88 | 35.80 | 2.54 | 25.82 | 4.75 | |
| CAPL [56] | 38.22 | 14.39 | 31.07 | 20.88 | 38.70 | 10.59 | 30.27 | 16.53 | |
| GW [66] | 40.18 | 18.58 | 33.70 | 25.39 | 40.06 | 14.78 | 32.47 | 21.55 | |
| GFS-VL (ours) | 78.30 | 51.22 | 69.75 | 61.91 | 78.56 | 49.72 | 69.45 | 60.88 | |
🔼 This table presents a comparison of the proposed GFS-VL method against several baseline methods for generalized few-shot 3D point cloud segmentation on the established ScanNet benchmark. It shows the performance metrics (mIoU-B for base classes, mIoU-N for novel classes, mIoU-A for all classes, and HM, the harmonic mean of mIoU-B and mIoU-N) achieved by each method under both 5-shot and 1-shot learning scenarios. The ‘Fully Supervised’ row represents an upper performance bound, achieved by training a model with complete ground truth labels. The best performing method for each metric is highlighted in bold, allowing for easy comparison of the effectiveness of different approaches in handling both base and novel classes with limited training data.
read the caption
Table 4: Comparisons of our method with baselines on the old ScanNet benchmark. The best results are highlighted in bold.
| PS | AI | NB-Mix | mIoU-B | mIoU-N | mIoU-A | HM |
|---|---|---|---|---|---|---|
| 65.50 | 22.30 | 31.40 | 33.28 | |||
| ✓ | 69.26 | 26.51 | 35.51 | 38.35 | ||
| ✓ | ✓ | 66.25 | 28.03 | 36.07 | 39.39 | |
| ✓ | ✓ | 66.94 | 28.21 | 36.36 | 39.69 | |
| ✓ | ✓ | ✓ | 67.42 | 31.81 | 39.30 | 43.22 |
🔼 Table 5a presents ablation study results assessing the individual and combined contributions of the three novel techniques introduced in the GFS-VL framework: Pseudo-label Selection (PS), Adaptive Infilling (AI), and Novel-Base Mix (NB-Mix). Each row represents a different combination of these techniques, showing the impact on mIoU-B (base class mean Intersection over Union), mIoU-N (novel class mIoU), mIoU-A (overall mIoU), and HM (harmonic mean of mIoU-B and mIoU-N) metrics. The baseline uses raw pseudo-labels from the 3D VLM without any filtering or refinement. The results demonstrate the incremental improvements achieved by progressively incorporating PS, AI, and NB-Mix into the framework, highlighting their effectiveness in enhancing the accuracy and completeness of the novel class predictions.
read the caption
(a)
| 3D VLM | mIoU-B | mIoU-N | mIoU-A | HM |
|---|---|---|---|---|
| RegionPLC [67] | 46.97 | 23.77 | 28.65 | 31.56 |
| Ours (RegionPLC) | 67.42 | 31.81 | 39.30 | 43.22 |
| Openscene [44] | 53.07 | 15.16 | 23.14 | 23.58 |
| Ours (Openscene) | 68.56 | 20.09 | 30.29 | 31.07 |
🔼 This table presents ablation study results, specifically focusing on the impact of different components within the GFS-VL framework. It details the effects of using raw pseudo-labels, pseudo-label selection, adaptive infilling, and the novel-base mix strategy on the model’s performance, measured by mIoU-B (base class mIoU), mIoU-N (novel class mIoU), mIoU-A (overall mIoU), and HM (harmonic mean of mIoU-B and mIoU-N). The results showcase the incremental improvement achieved by adding each component and the overall effectiveness of the GFS-VL framework.
read the caption
(b)
| mIoU-B | mIoU-N | mIoU-A | HM | |
|---|---|---|---|---|
| 0.80 | 66.67 | 30.41 | 38.04 | 41.77 |
| 0.85 | 66.29 | 31.00 | 38.43 | 42.24 |
| 0.90 | 67.42 | 31.81 | 39.30 | 43.22 |
| 0.95 | 66.22 | 30.68 | 38.17 | 41.94 |
🔼 Table 5c presents ablation study results, specifically focusing on how the threshold (δ) in the Adaptive Infilling (AI) module impacts the model’s performance. It shows that various thresholds were tested, and δ = 0.9 achieves the best results.
read the caption
(c)
| mIoU-B | mIoU-N | mIoU-A | HM | |
|---|---|---|---|---|
| 0.5 | 67.19 | 31.33 | 38.88 | 42.73 |
| 0.6 | 67.42 | 31.81 | 39.30 | 43.22 |
| 0.7 | 66.69 | 30.56 | 38.17 | 41.92 |
| 0.8 | 68.06 | 30.67 | 38.54 | 42.28 |
🔼 This table presents ablation study results, specifically focusing on the impact of varying the threshold (τ) in the Pseudo-label Selection (PS) module of the GFS-VL framework. The experiment is performed on the ScanNet200 dataset with a single set of 5-shot support samples. The table shows how changes in the threshold affect the performance metrics (mIoU-B, mIoU-N, mIoU-A, and HM) of the model. It demonstrates the robustness of the Pseudo-label Selection module across different threshold values.
read the caption
(d)
| mIoU-B | mIoU-N | mIoU-A | HM | |
|---|---|---|---|---|
| 1 | 67.40 | 27.13 | 35.61 | 38.68 |
| 2 | 67.95 | 27.71 | 36.18 | 39.36 |
| 3 | 66.94 | 28.21 | 36.36 | 39.69 |
| 4 | 67.84 | 27.80 | 36.23 | 39.44 |
🔼 Table 5e shows the ablation study on the impact of using different numbers of novel mix blocks (n) on the model’s performance. It demonstrates that the model is robust to variations in the number of blocks used in the novel-base mix strategy, indicating that the strategy effectively integrates novel class information into the training process, regardless of the precise number of blocks.
read the caption
(e)
🔼 Table 5f presents ablation study results focusing on the impact of different backbones on the model’s performance. The table compares the model’s performance using two different backbones: Point Transformer V3 (PTv3) and SparseConvNet (SCN). The metrics used for comparison are mIoU-B (mean Intersection over Union for base classes), mIoU-N (mean IoU for novel classes), mIoU-A (mean IoU for all classes), and HM (harmonic mean of mIoU-B and mIoU-N). The results demonstrate the model’s robustness and generalizability across different backbones.
read the caption
(f)
| Mix | mIoU-B | mIoU-N | mIoU-A | HM |
|---|---|---|---|---|
| Instance Mix | 68.29 | 23.93 | 33.27 | 35.44 |
| Mix3D [39] | 68.50 | 24.80 | 34.00 | 36.42 |
| NB-Mix | 67.95 | 27.71 | 36.18 | 39.36 |
🔼 Table 5g compares different data mixing strategies for integrating novel support samples into the training data. The methods compared are Instance Mix, which randomly inserts novel class objects into scenes; Mix3D, which overlays two scenes to create out-of-context data augmentation; and the proposed Novel-Base Mix (NB-Mix). The table shows the impact of each mixing strategy on the performance metrics mIoU-B, mIoU-N, mIoU-A, and HM (harmonic mean of mIoU-B and mIoU-N), demonstrating the effectiveness of NB-Mix in preserving essential scene context for improved novel class learning.
read the caption
(g)
Full paper#