TL;DR#
Autoregressive visual generation relies on tokenizers to compress images. Discrete tokens offer simple modeling but lose information and tokenizer training faces instability. Conversely, continuous tokens retain visual details but need complex distribution modeling, complicating the generation. This paper aims to resolve the dilemma.
The paper introduces TokenBridge, a new method, maintaining the strong representation of continuous tokens while keeping the modeling simplicity of discrete tokens. This approach decouples discretization from tokenizer training through post-training quantization. A dimension-wise quantization independently discretizes each feature dimension, with an autoregressive prediction mechanism. TokenBridge matches continuous methods’ quality while using standard categorical prediction.
Key Takeaways#
Why does it matter?#
TokenBridge presents a novel approach in visual generation, merging the strengths of discrete and continuous tokens. By simplifying autoregressive modeling, it offers researchers a more efficient path to high-quality visual synthesis. This work can impact future studies, offering new methods for enhanced AI development.
Visual Insights#

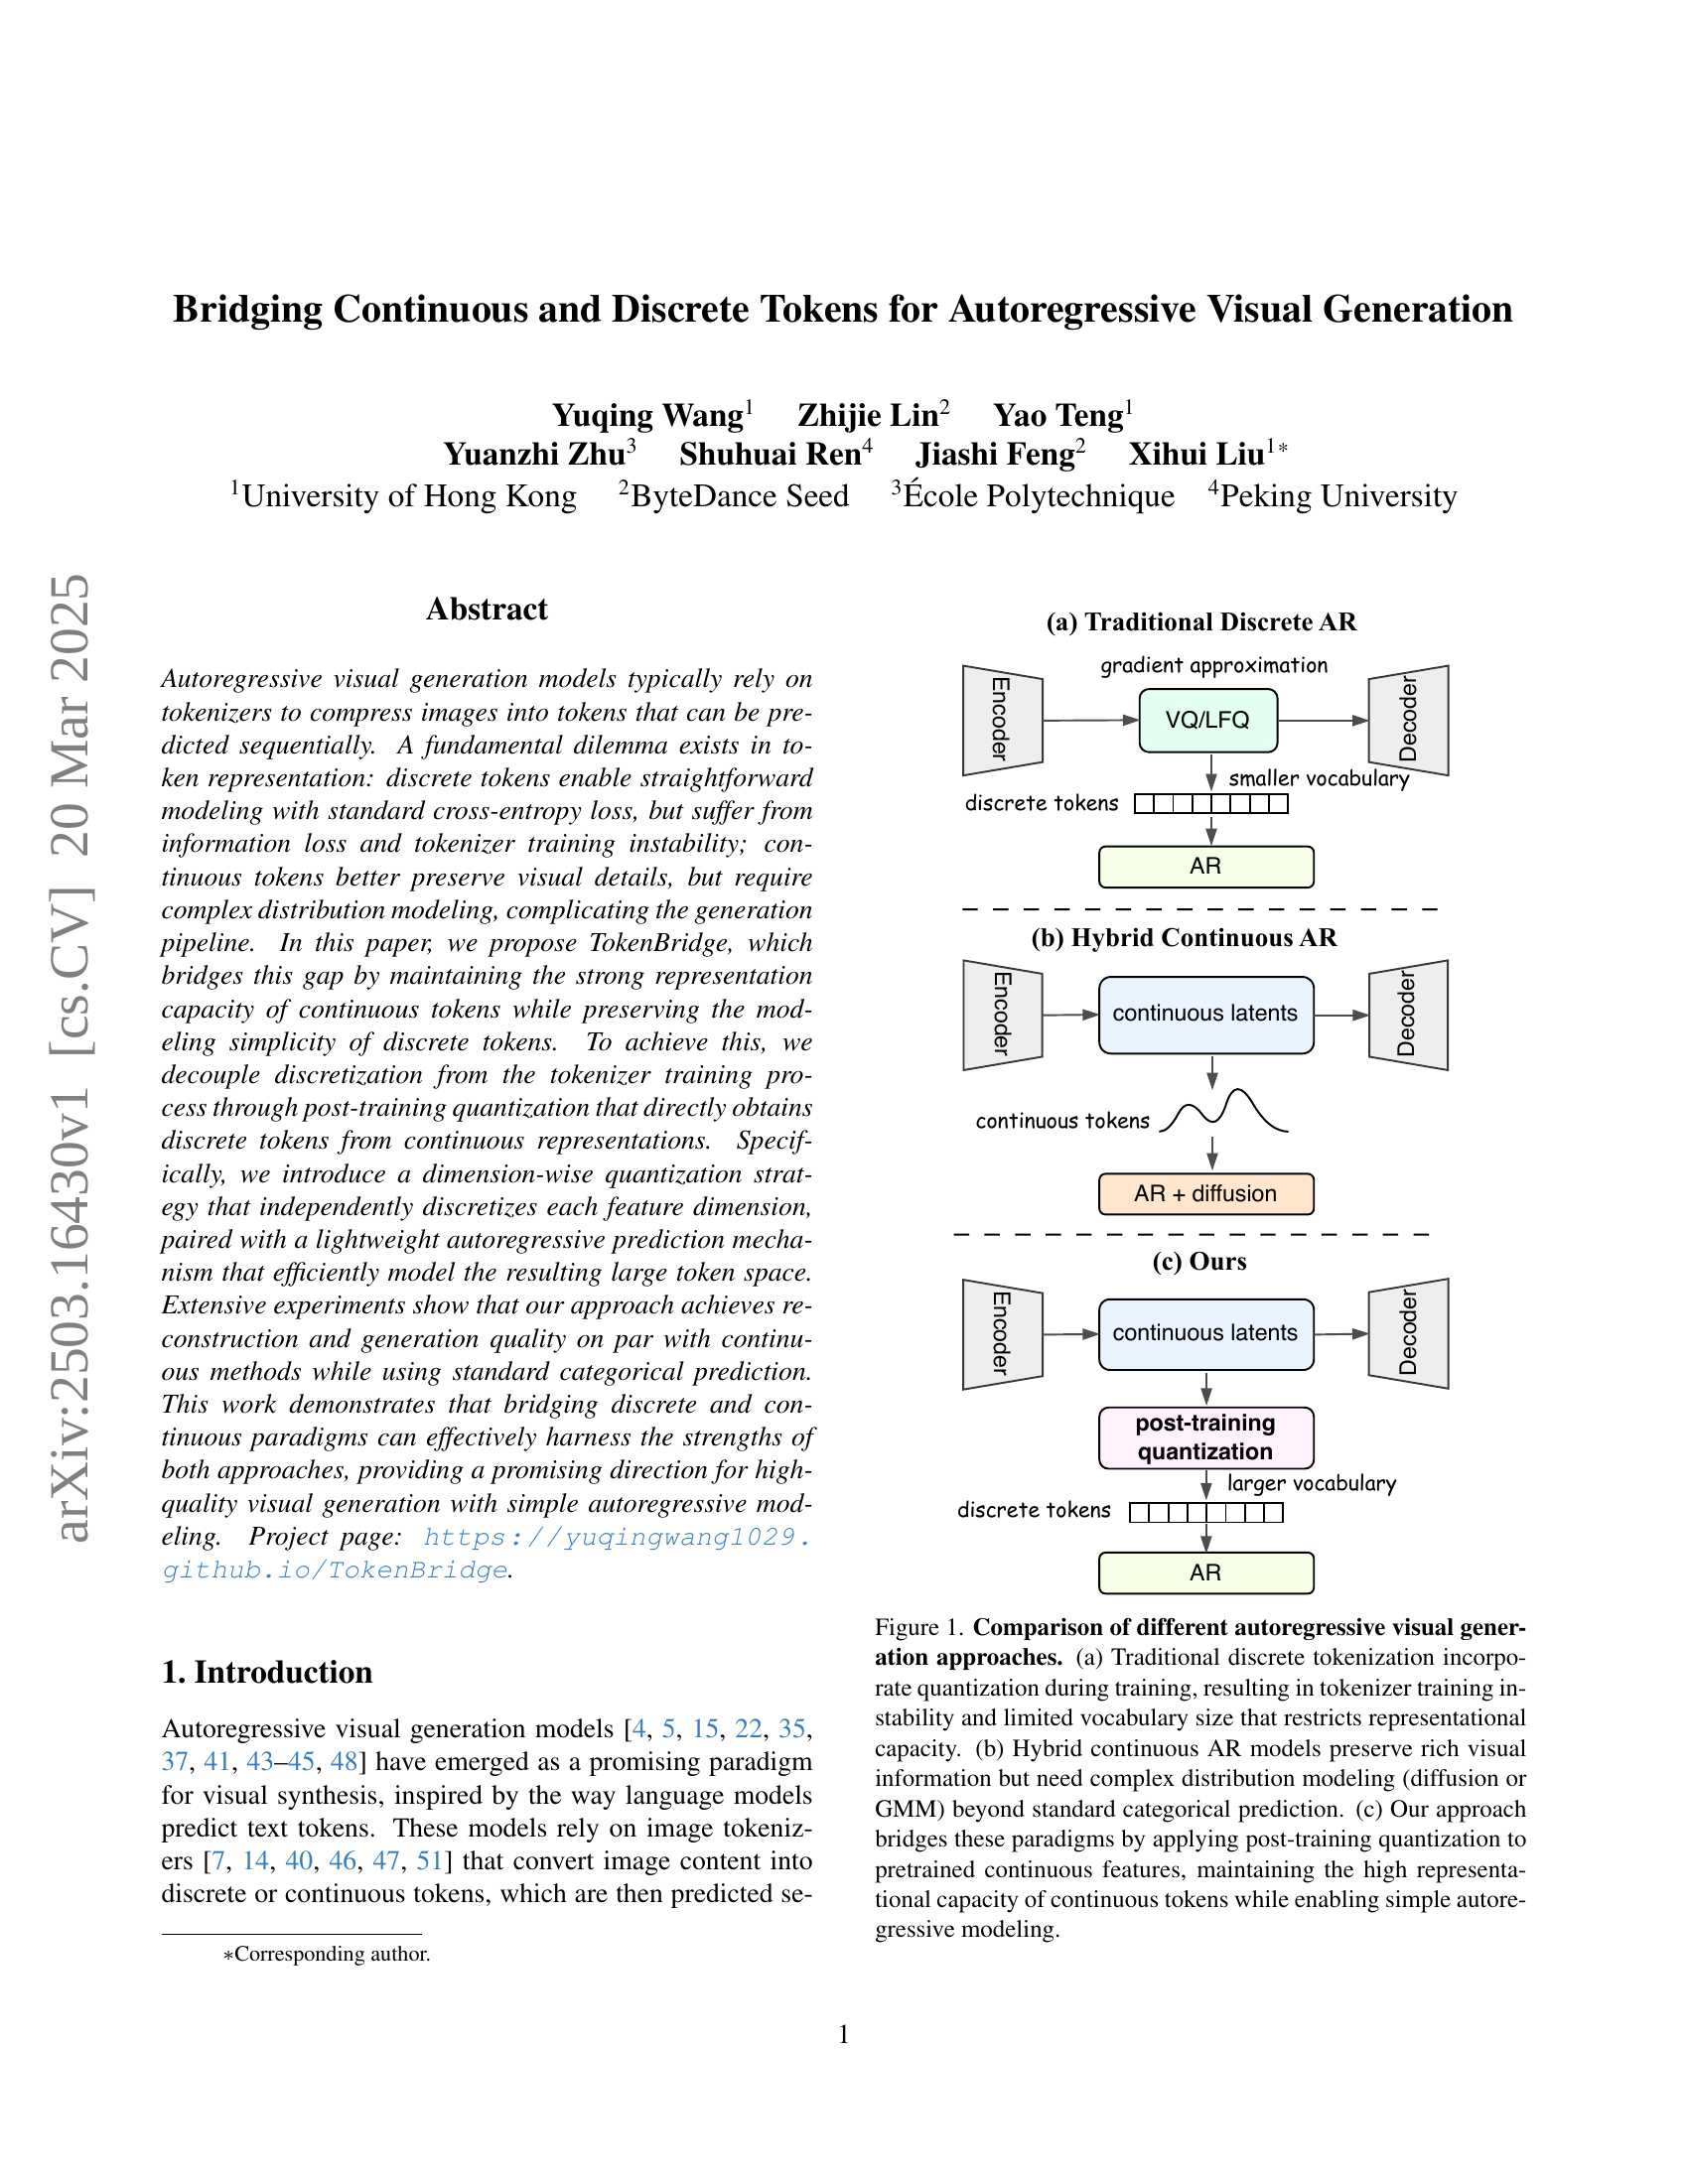
🔼 This figure compares three different approaches to autoregressive visual generation. (a) shows the traditional method using discrete tokens, where quantization during training leads to instability and limits the model’s ability to represent fine visual details. (b) illustrates a hybrid approach using continuous tokens, preserving detail but requiring complex distribution modeling like diffusion or Gaussian Mixture Models for prediction. (c) presents the proposed ‘TokenBridge’ method, which leverages pretrained continuous features and applies post-training quantization to achieve the simplicity of discrete tokens while retaining the representational power of continuous tokens, enabling straightforward autoregressive modeling.
read the caption
Figure 1: Comparison of different autoregressive visual generation approaches. (a) Traditional discrete tokenization incorporate quantization during training, resulting in tokenizer training instability and limited vocabulary size that restricts representational capacity. (b) Hybrid continuous AR models preserve rich visual information but need complex distribution modeling (diffusion or GMM) beyond standard categorical prediction. (c) Our approach bridges these paradigms by applying post-training quantization to pretrained continuous features, maintaining the high representational capacity of continuous tokens while enabling simple autoregressive modeling.
| Method | rFID | IS | |
| VAE | - | 1.11 | 306.1 |
| Ours | 8 | 3.69 | 250.3 |
| Ours | 16 | 1.33 | 296.8 |
| Ours | 32 | 1.12 | 303.8 |
| Ours | 64 | 1.11 | 305.4 |
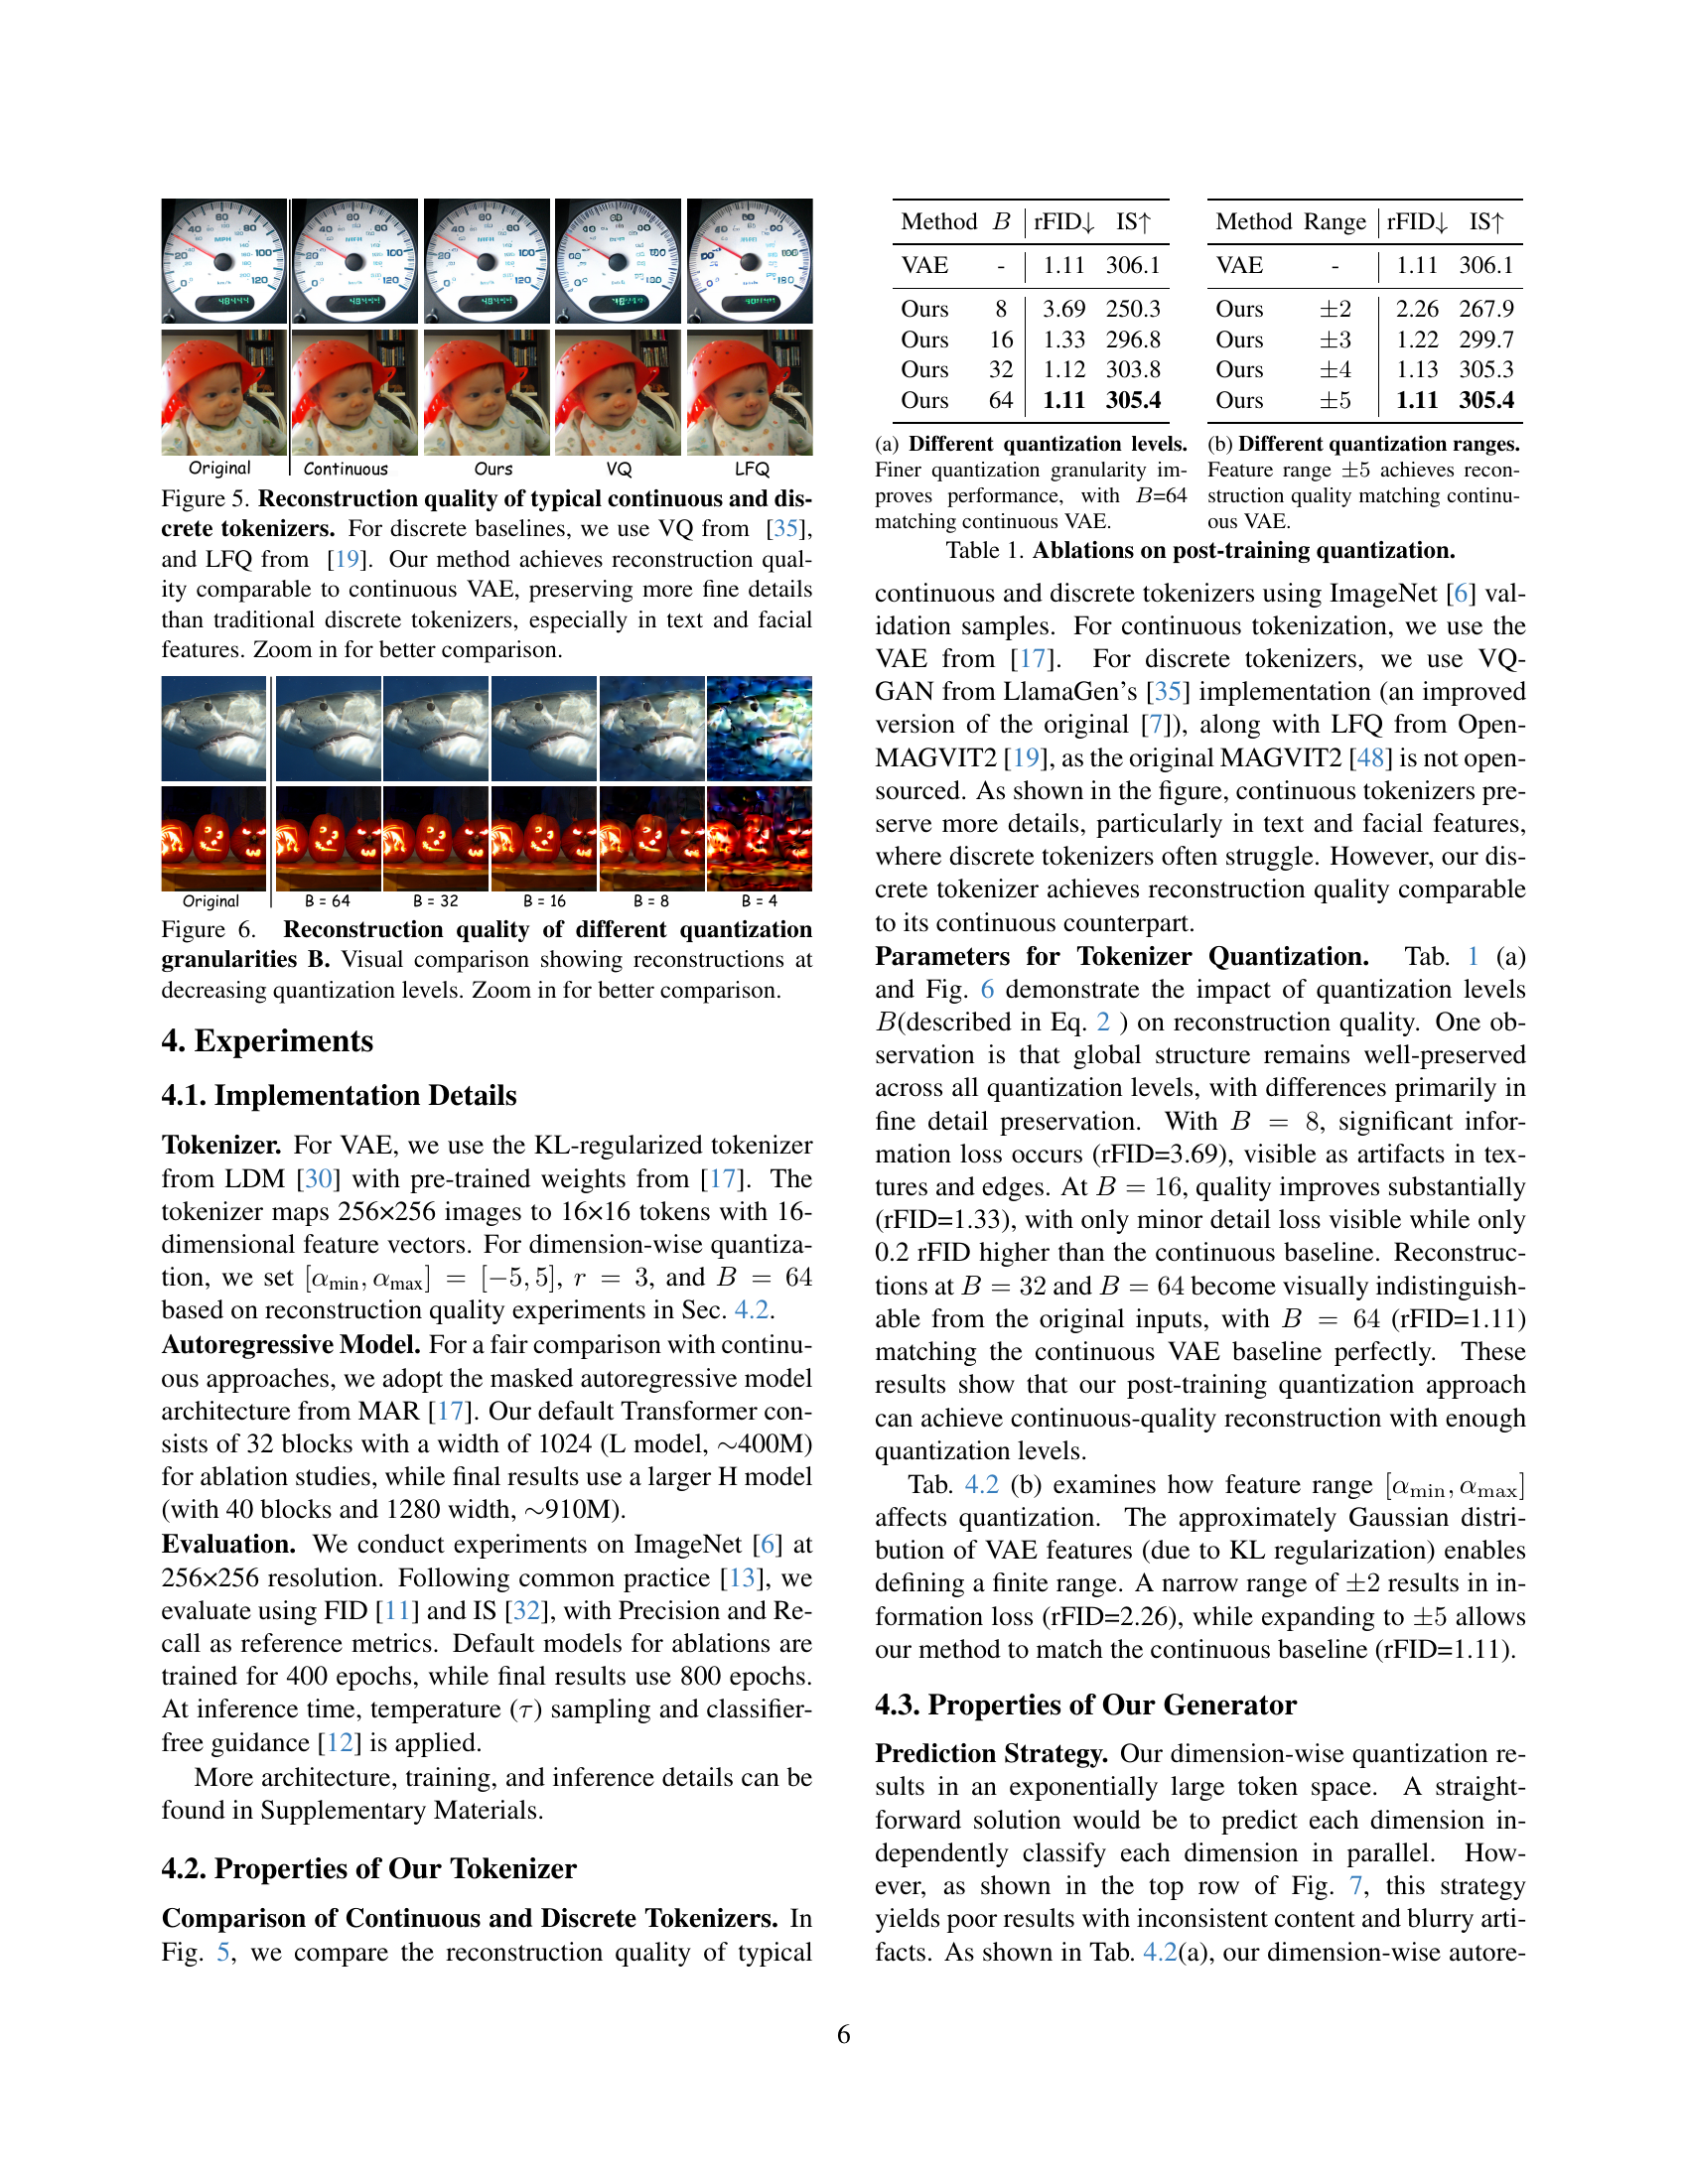
🔼 This table presents an ablation study on the impact of different quantization levels (B) on the reconstruction quality of the TokenBridge model. The reconstruction quality is measured using the Fréchet Inception Distance (FID) and Inception Score (IS). The results show that as the quantization level increases, resulting in finer granularity, the reconstruction quality improves, reaching a level comparable to the continuous Variational Autoencoder (VAE) baseline when B=64.
read the caption
(a) Different quantization levels. Finer quantization granularity improves performance, with B𝐵Bitalic_B=64 matching continuous VAE.
In-depth insights#
TokenBridge Idea#
The TokenBridge idea, as presented in this paper, is an innovative approach to bridging the gap between continuous and discrete token representations in autoregressive visual generation. The core concept involves post-training quantization of continuous tokens, which decouples discretization from the tokenizer training process. This is significant because it allows for retaining the representational power of continuous tokens while leveraging the modeling simplicity of discrete tokens. By quantizing pretrained features, TokenBridge avoids the optimization instabilities associated with training discrete tokenizers and offers a more controlled way to manage vocabulary size. This idea enables standard autoregressive modeling with cross-entropy loss to achieve comparable visual quality to continuous methods, representing a promising direction for high-quality visual generation. It effectively harnesses the strengths of both discrete and continuous paradigms.
Post-Quantization#
Post-quantization is a pivotal stage for streamlining autoregressive visual generation. It decouples discretization from the tokenizer training, enabling efficient compression. This involves transforming continuous representations into discrete tokens without retraining, leveraging dimension-wise quantization for finer control. It preserves visual fidelity and reduces computational overhead. The strategy circumvents the non-differentiability issues in quantization during training while allowing for flexible vocabulary sizes. A lightweight autoregressive mechanism predicts tokens dimension-wise, capturing inter-dependencies efficiently. Post-quantization balances representation and modeling simplicity, enhancing overall performance.
Dimension-Wise AR#
Dimension-wise autoregression presents an intriguing approach to handling high-dimensional data, especially in contexts like image or audio generation. The core idea is to decompose a complex, joint prediction problem into a series of simpler, conditional predictions along each dimension of the data. This approach offers several potential benefits. It mitigates the computational burden associated with directly modeling the entire high-dimensional space at once. Dimension-wise AR can be more statistically efficient, as it allows the model to learn dependencies between dimensions sequentially, potentially capturing intricate relationships that might be missed by methods treating all dimensions independently. This strategy implicitly introduces an order of prediction, and the choice of this order can significantly impact performance. Dimensions carrying more global or structural information might be prioritized to guide the generation process more effectively. While dimension-wise AR simplifies modeling, it’s crucial to carefully design the conditional dependencies and prediction order to effectively capture the underlying data structure.
Comparable Quality#
When evaluating the “Comparable Quality” of a generative model, several factors come into play. It’s important to consider both objective metrics (like FID and IS scores) and subjective human evaluation, as the former may not always fully capture perceptual quality. A model demonstrating “Comparable Quality” should achieve scores on par with existing state-of-the-art methods, indicating its ability to generate realistic and diverse outputs. It should preserve fine details and avoid artifacts, even when compared to continuous token approaches. Ideally, it should also strike a balance between computational cost and performance, offering comparable quality with increased efficiency or reduced complexity. Demonstrating similar or superior performance than other approaches while using a simpler training approach is also important.
Limitations#
The paper acknowledges that the performance of TokenBridge is inherently tied to the quality of the pre-trained VAE, meaning any limitations in the VAE’s representation capabilities will directly impact TokenBridge’s reconstruction and generation fidelity. While the authors emphasize the simplicity and efficiency gains from using cross-entropy loss, they do not thoroughly address potential issues stemming from this choice. Furthermore, the paper admits potential for biases inherited from the training data and misuse for creating misleading content, highlighting the need for careful deployment and mitigation strategies.
More visual insights#
More on figures

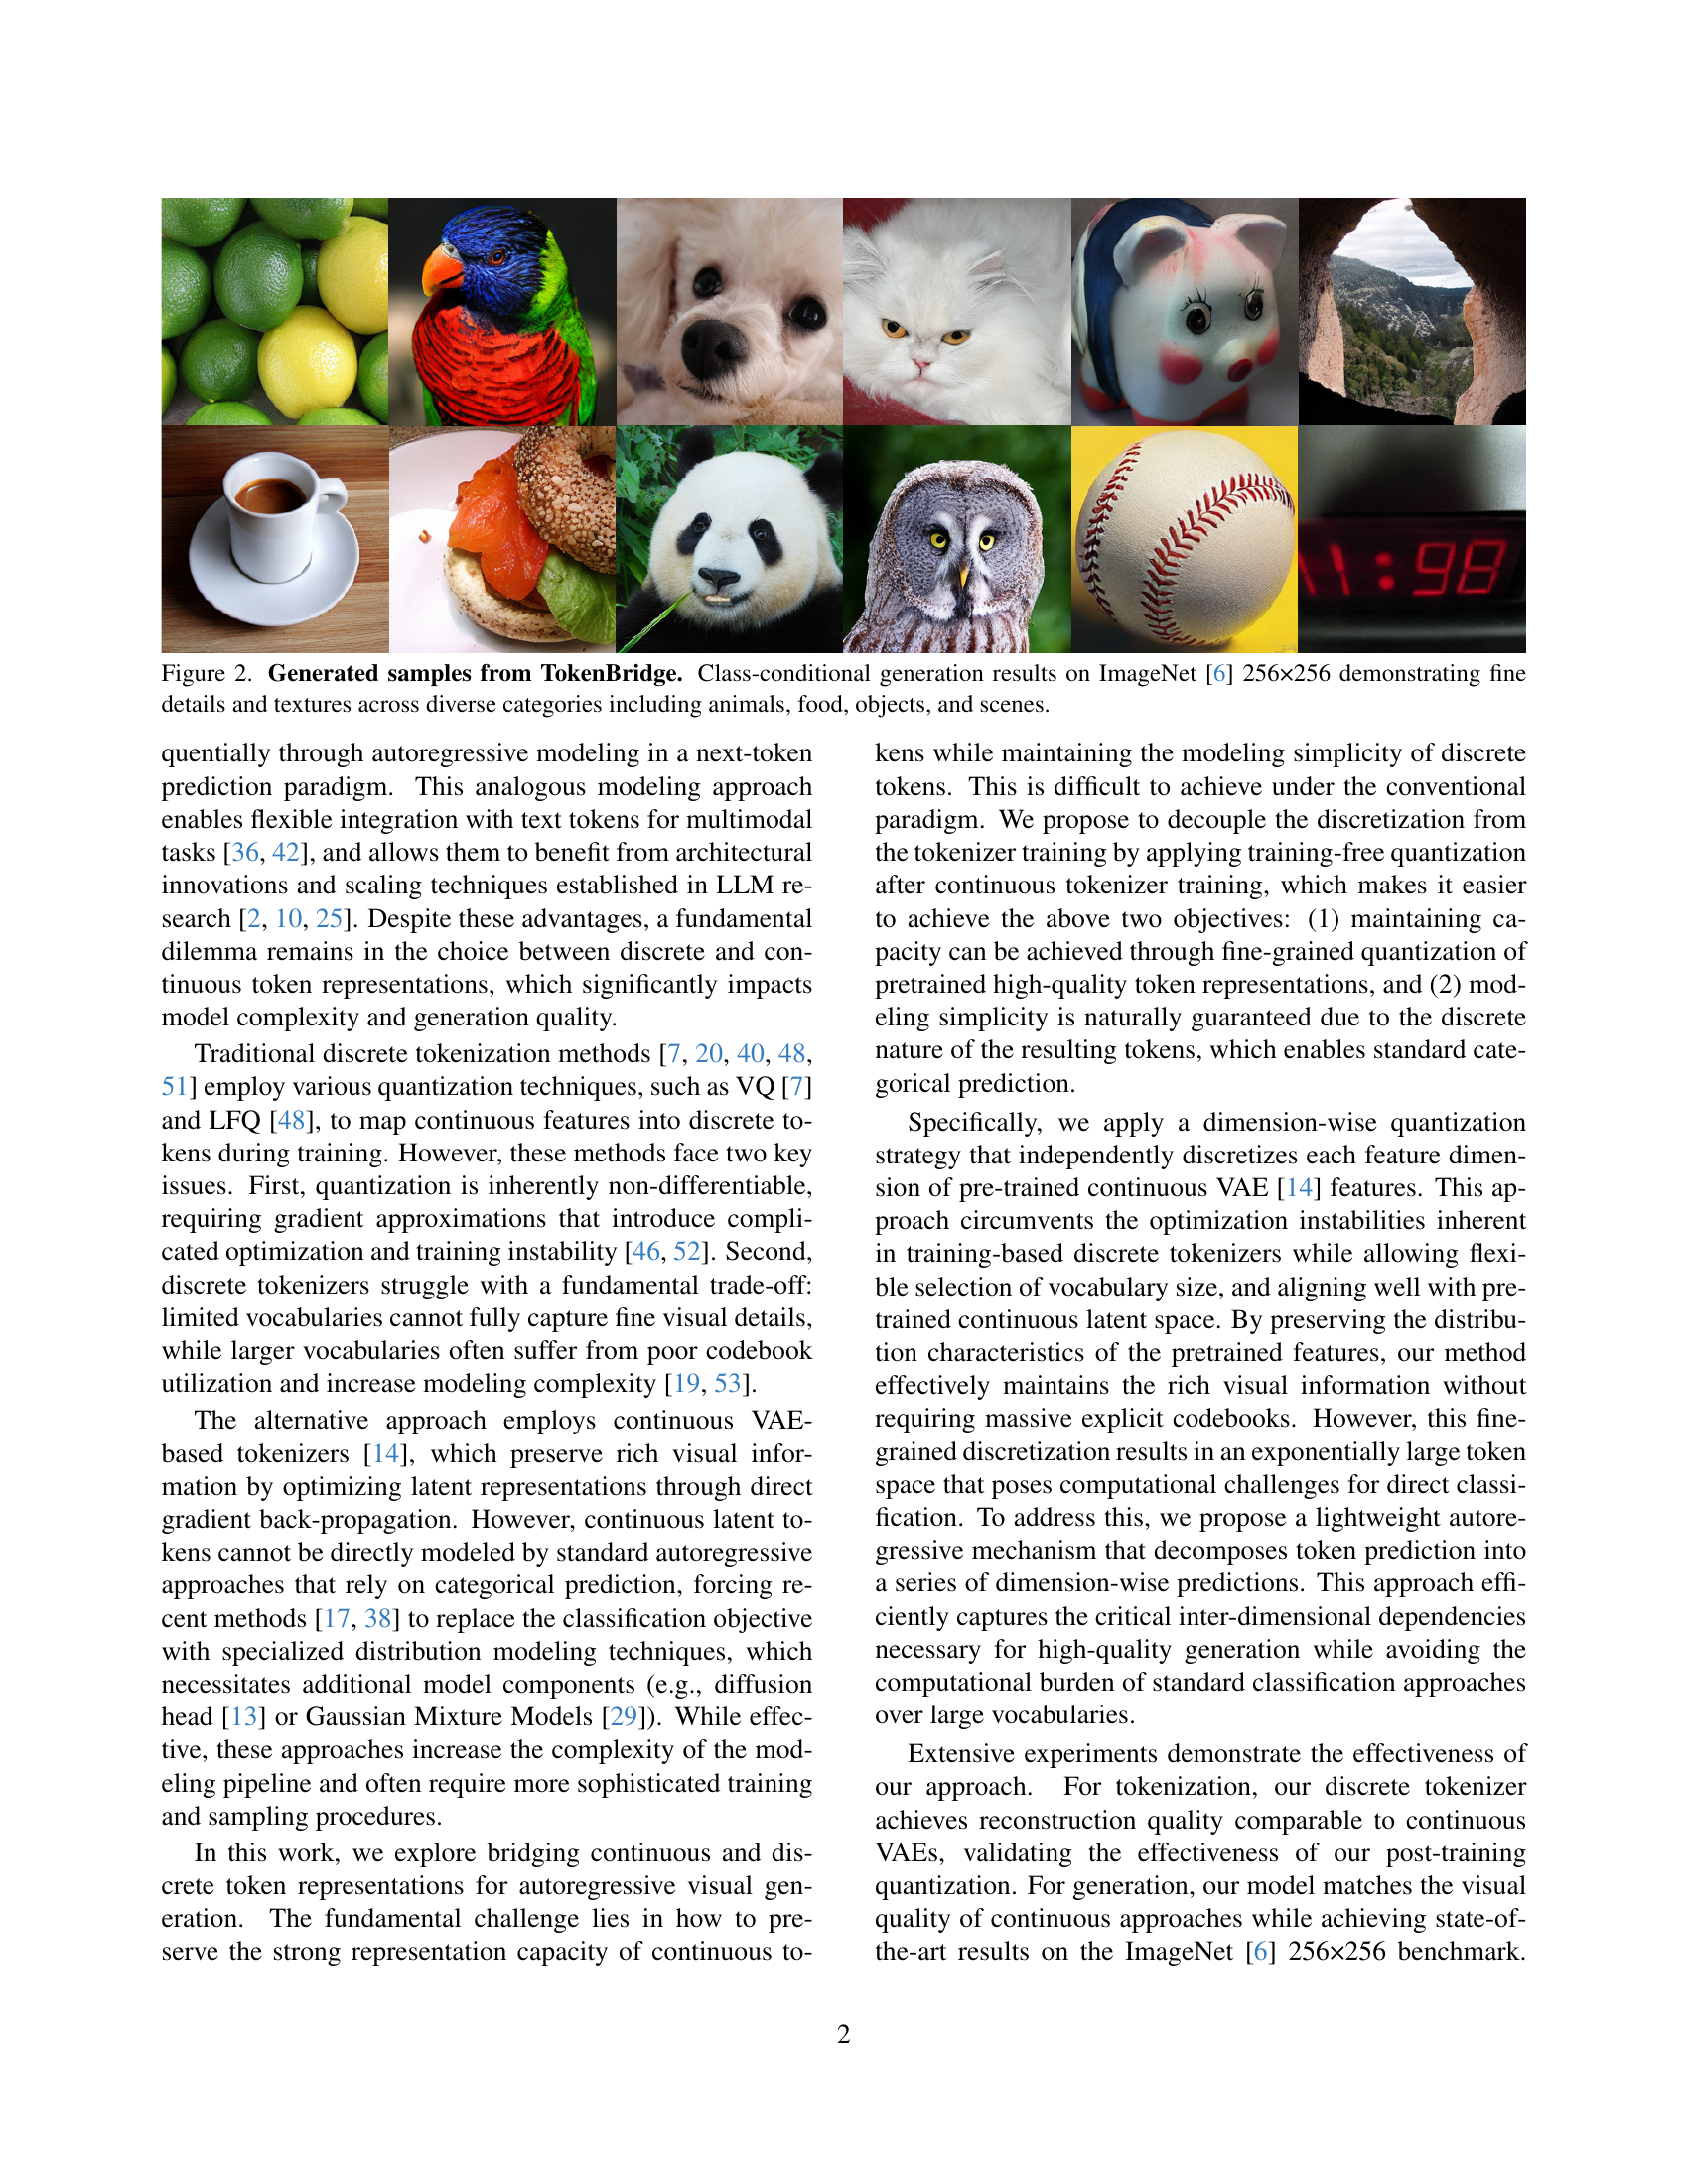
🔼 Figure 2 showcases images generated by the TokenBridge model. The images are 256x256 pixels and demonstrate the model’s ability to generate high-quality, detailed images across a wide range of categories within the ImageNet dataset. These categories include animals, various types of food, different objects, and a variety of scenes. The figure highlights the model’s capacity for generating diverse and visually rich outputs.
read the caption
Figure 2: Generated samples from TokenBridge. Class-conditional generation results on ImageNet [6] 256×256 demonstrating fine details and textures across diverse categories including animals, food, objects, and scenes.

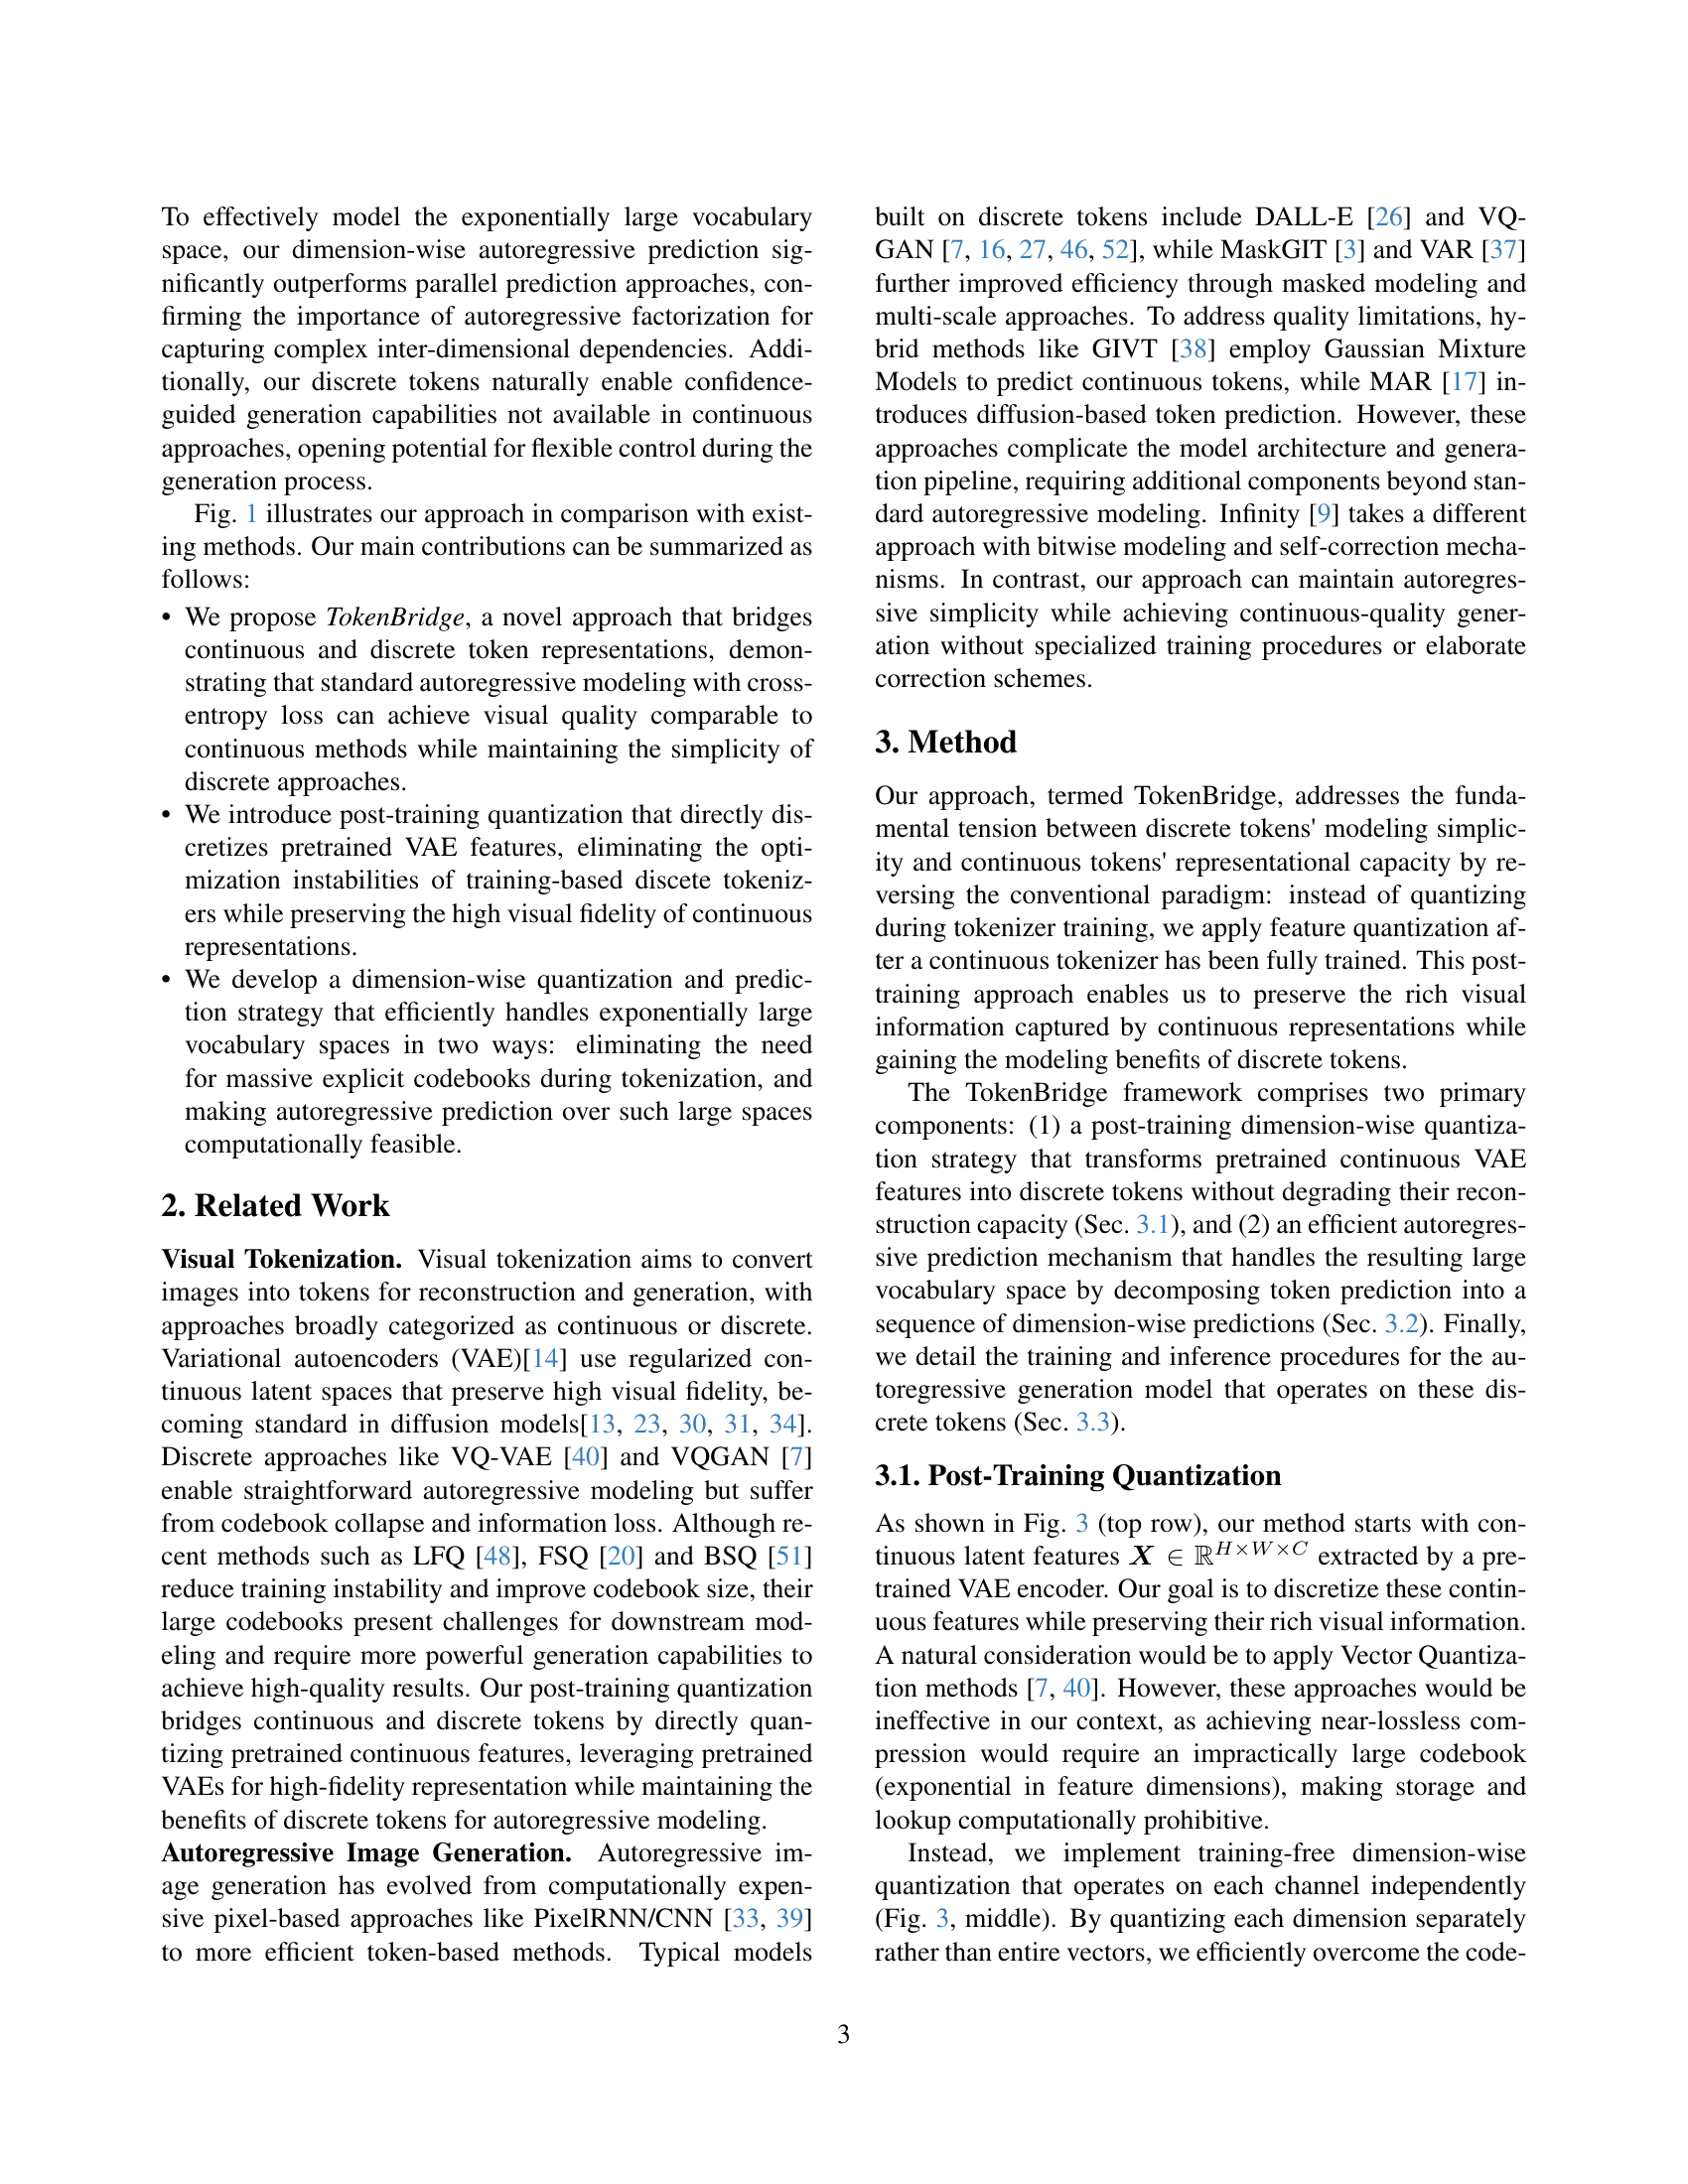
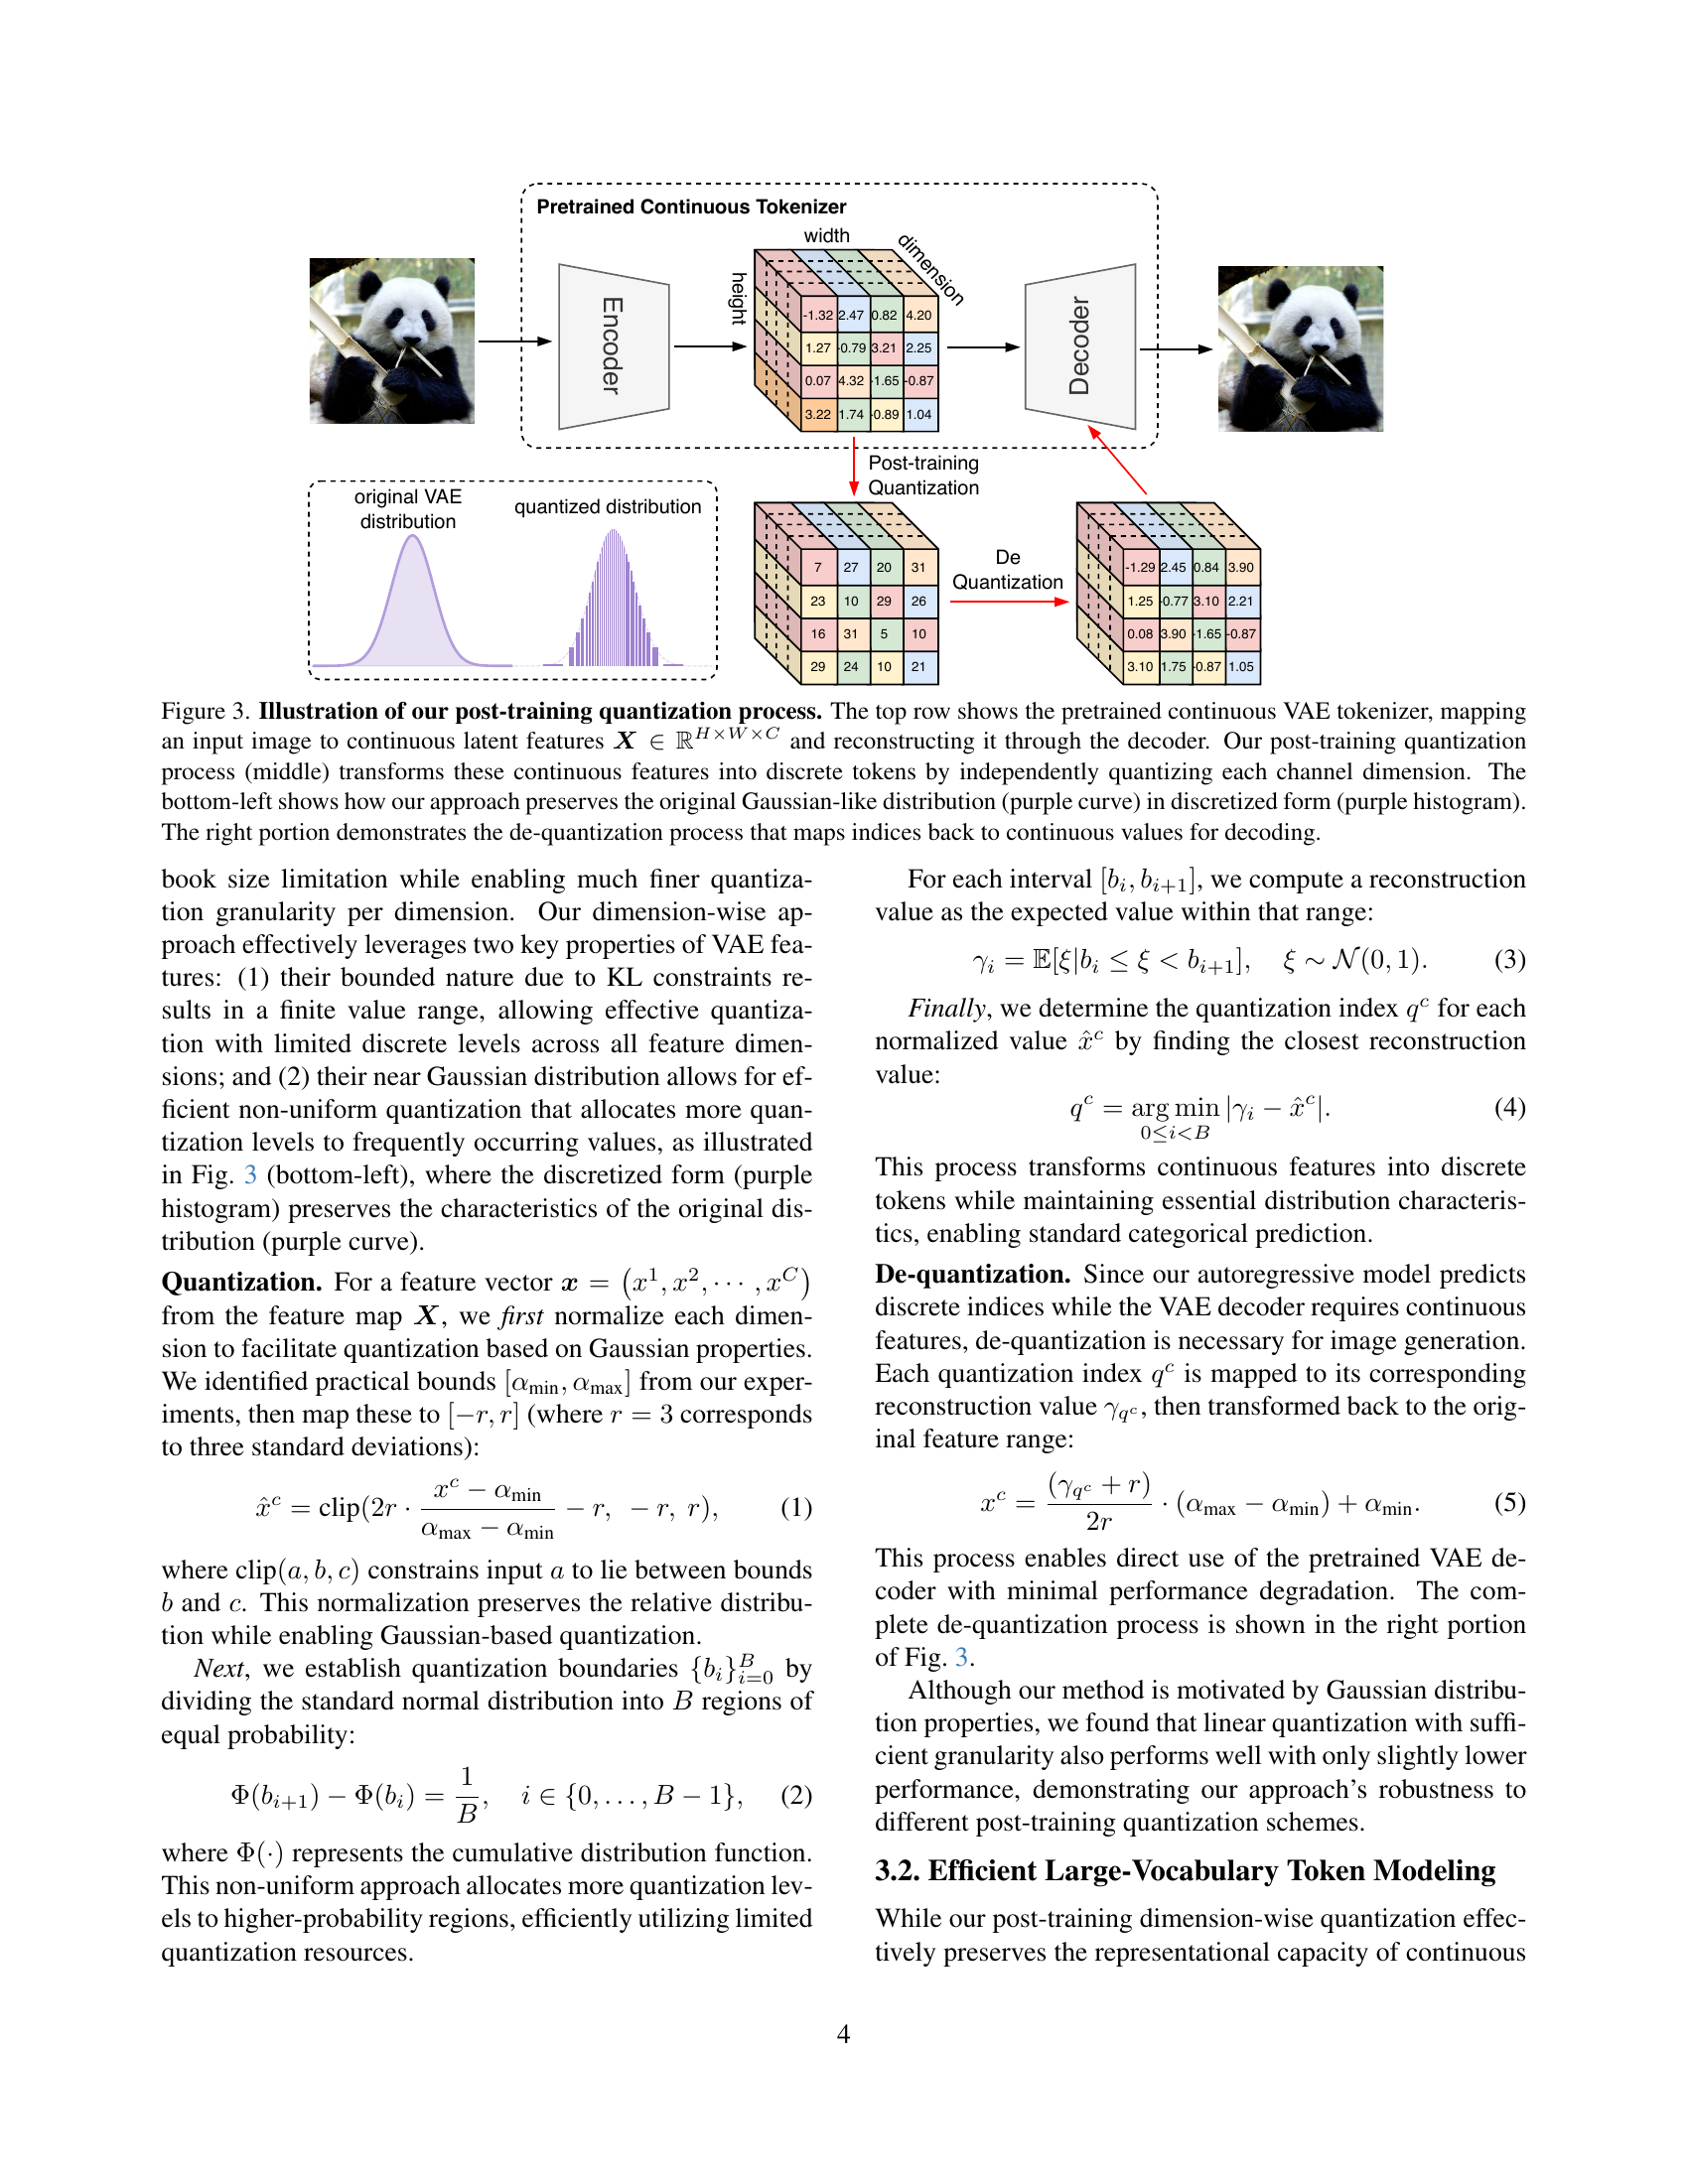
🔼 Figure 3 illustrates the TokenBridge’s post-training quantization method. The top panel shows a pretrained continuous Variational Autoencoder (VAE) tokenizer converting an input image into continuous latent features (a tensor with dimensions H x W x C). The VAE’s decoder then reconstructs the image from these features. The middle panel details the post-training quantization step, where each channel dimension of the continuous features is independently discretized into discrete tokens. The bottom-left panel compares the original Gaussian-like distribution of the continuous features with its discretized counterpart (histogram), showing how the method preserves the original distribution’s shape. Finally, the right panel explains the dequantization process, where the discrete tokens are mapped back to continuous values to allow for decoding using the pretrained VAE decoder.
read the caption
Figure 3: Illustration of our post-training quantization process. The top row shows the pretrained continuous VAE tokenizer, mapping an input image to continuous latent features 𝑿∈ℝH×W×C𝑿superscriptℝ𝐻𝑊𝐶{\bm{X}}\in\mathbb{R}^{H\times W\times C}bold_italic_X ∈ blackboard_R start_POSTSUPERSCRIPT italic_H × italic_W × italic_C end_POSTSUPERSCRIPT and reconstructing it through the decoder. Our post-training quantization process (middle) transforms these continuous features into discrete tokens by independently quantizing each channel dimension. The bottom-left shows how our approach preserves the original Gaussian-like distribution (purple curve) in discretized form (purple histogram). The right portion demonstrates the de-quantization process that maps indices back to continuous values for decoding.

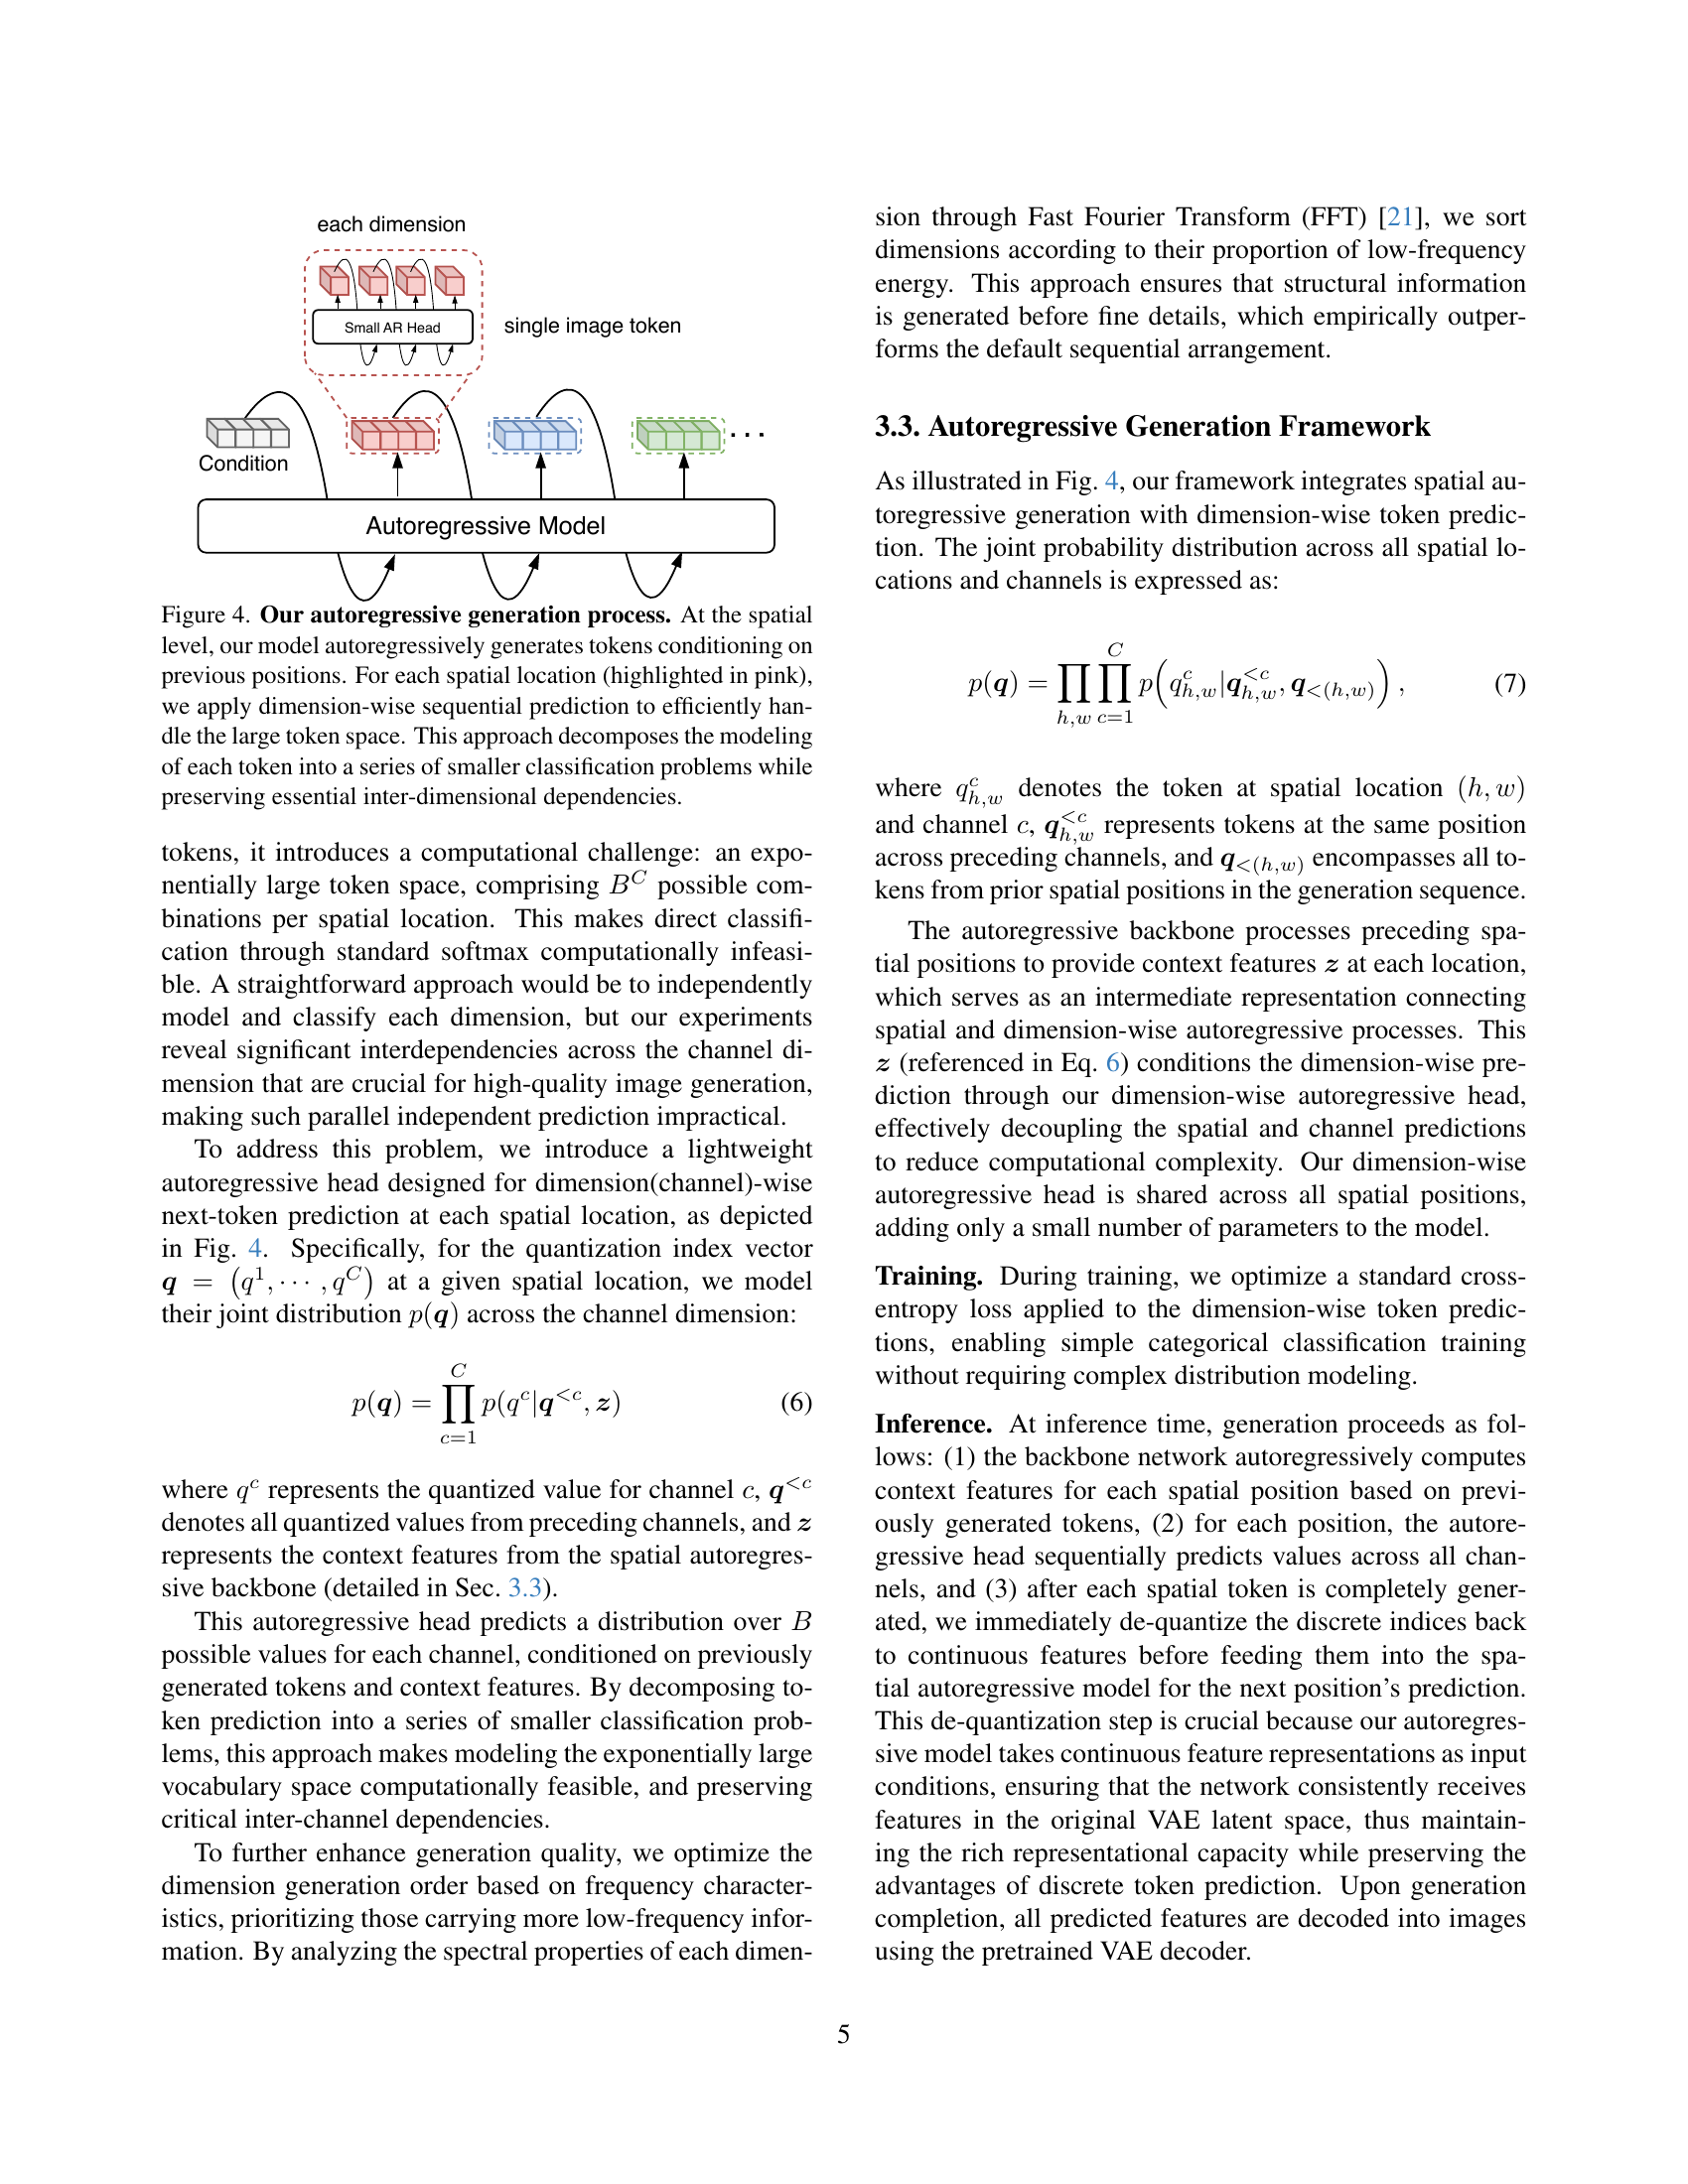
🔼 This figure illustrates the autoregressive generation process used in the TokenBridge model. The model generates image tokens sequentially, both spatially (across the image) and within each spatial location (dimension-wise). Spatially, the model predicts tokens one at a time, conditioning each prediction on previously generated tokens. Within each spatial location (shown in pink), the model uses a dimension-wise approach: it predicts individual channel values sequentially, thereby efficiently managing the exponentially large token space resulting from post-training quantization. This decomposition into smaller classification problems preserves important relationships between channels while making the model computationally feasible.
read the caption
Figure 4: Our autoregressive generation process. At the spatial level, our model autoregressively generates tokens conditioning on previous positions. For each spatial location (highlighted in pink), we apply dimension-wise sequential prediction to efficiently handle the large token space. This approach decomposes the modeling of each token into a series of smaller classification problems while preserving essential inter-dimensional dependencies.

🔼 Figure 5 presents a comparison of reconstruction quality between continuous and discrete image tokenization methods. It shows the results of reconstructing images using three different approaches: a continuous Variational Autoencoder (VAE), Vector Quantization (VQ) from [35] as a representative discrete method, and a Learned Fixed-Point Quantization (LFQ) method from [19]. A comparison with the results from the authors’ method (TokenBridge) is also included. The images visually demonstrate that TokenBridge achieves reconstruction quality comparable to the continuous VAE, but preserves significantly more fine details than the traditional VQ and LFQ discrete methods. The improvement is particularly visible in areas with fine textural details such as text and facial features.
read the caption
Figure 5: Reconstruction quality of typical continuous and discrete tokenizers. For discrete baselines, we use VQ from [35], and LFQ from [19]. Our method achieves reconstruction quality comparable to continuous VAE, preserving more fine details than traditional discrete tokenizers, especially in text and facial features. Zoom in for better comparison.

🔼 This figure visually compares the reconstruction quality achieved by TokenBridge at different quantization levels (B). It presents a series of images reconstructed from the same original images, each reconstruction using a successively lower quantization granularity. The purpose is to demonstrate how the model’s ability to recover fine details is affected as the quantization level decreases, and to show that even with a relatively coarse quantization, the model maintains good reconstruction quality. Zooming in on the images is recommended for a better evaluation of the subtle differences in detail preservation.
read the caption
Figure 6: Reconstruction quality of different quantization granularities B. Visual comparison showing reconstructions at decreasing quantization levels. Zoom in for better comparison.

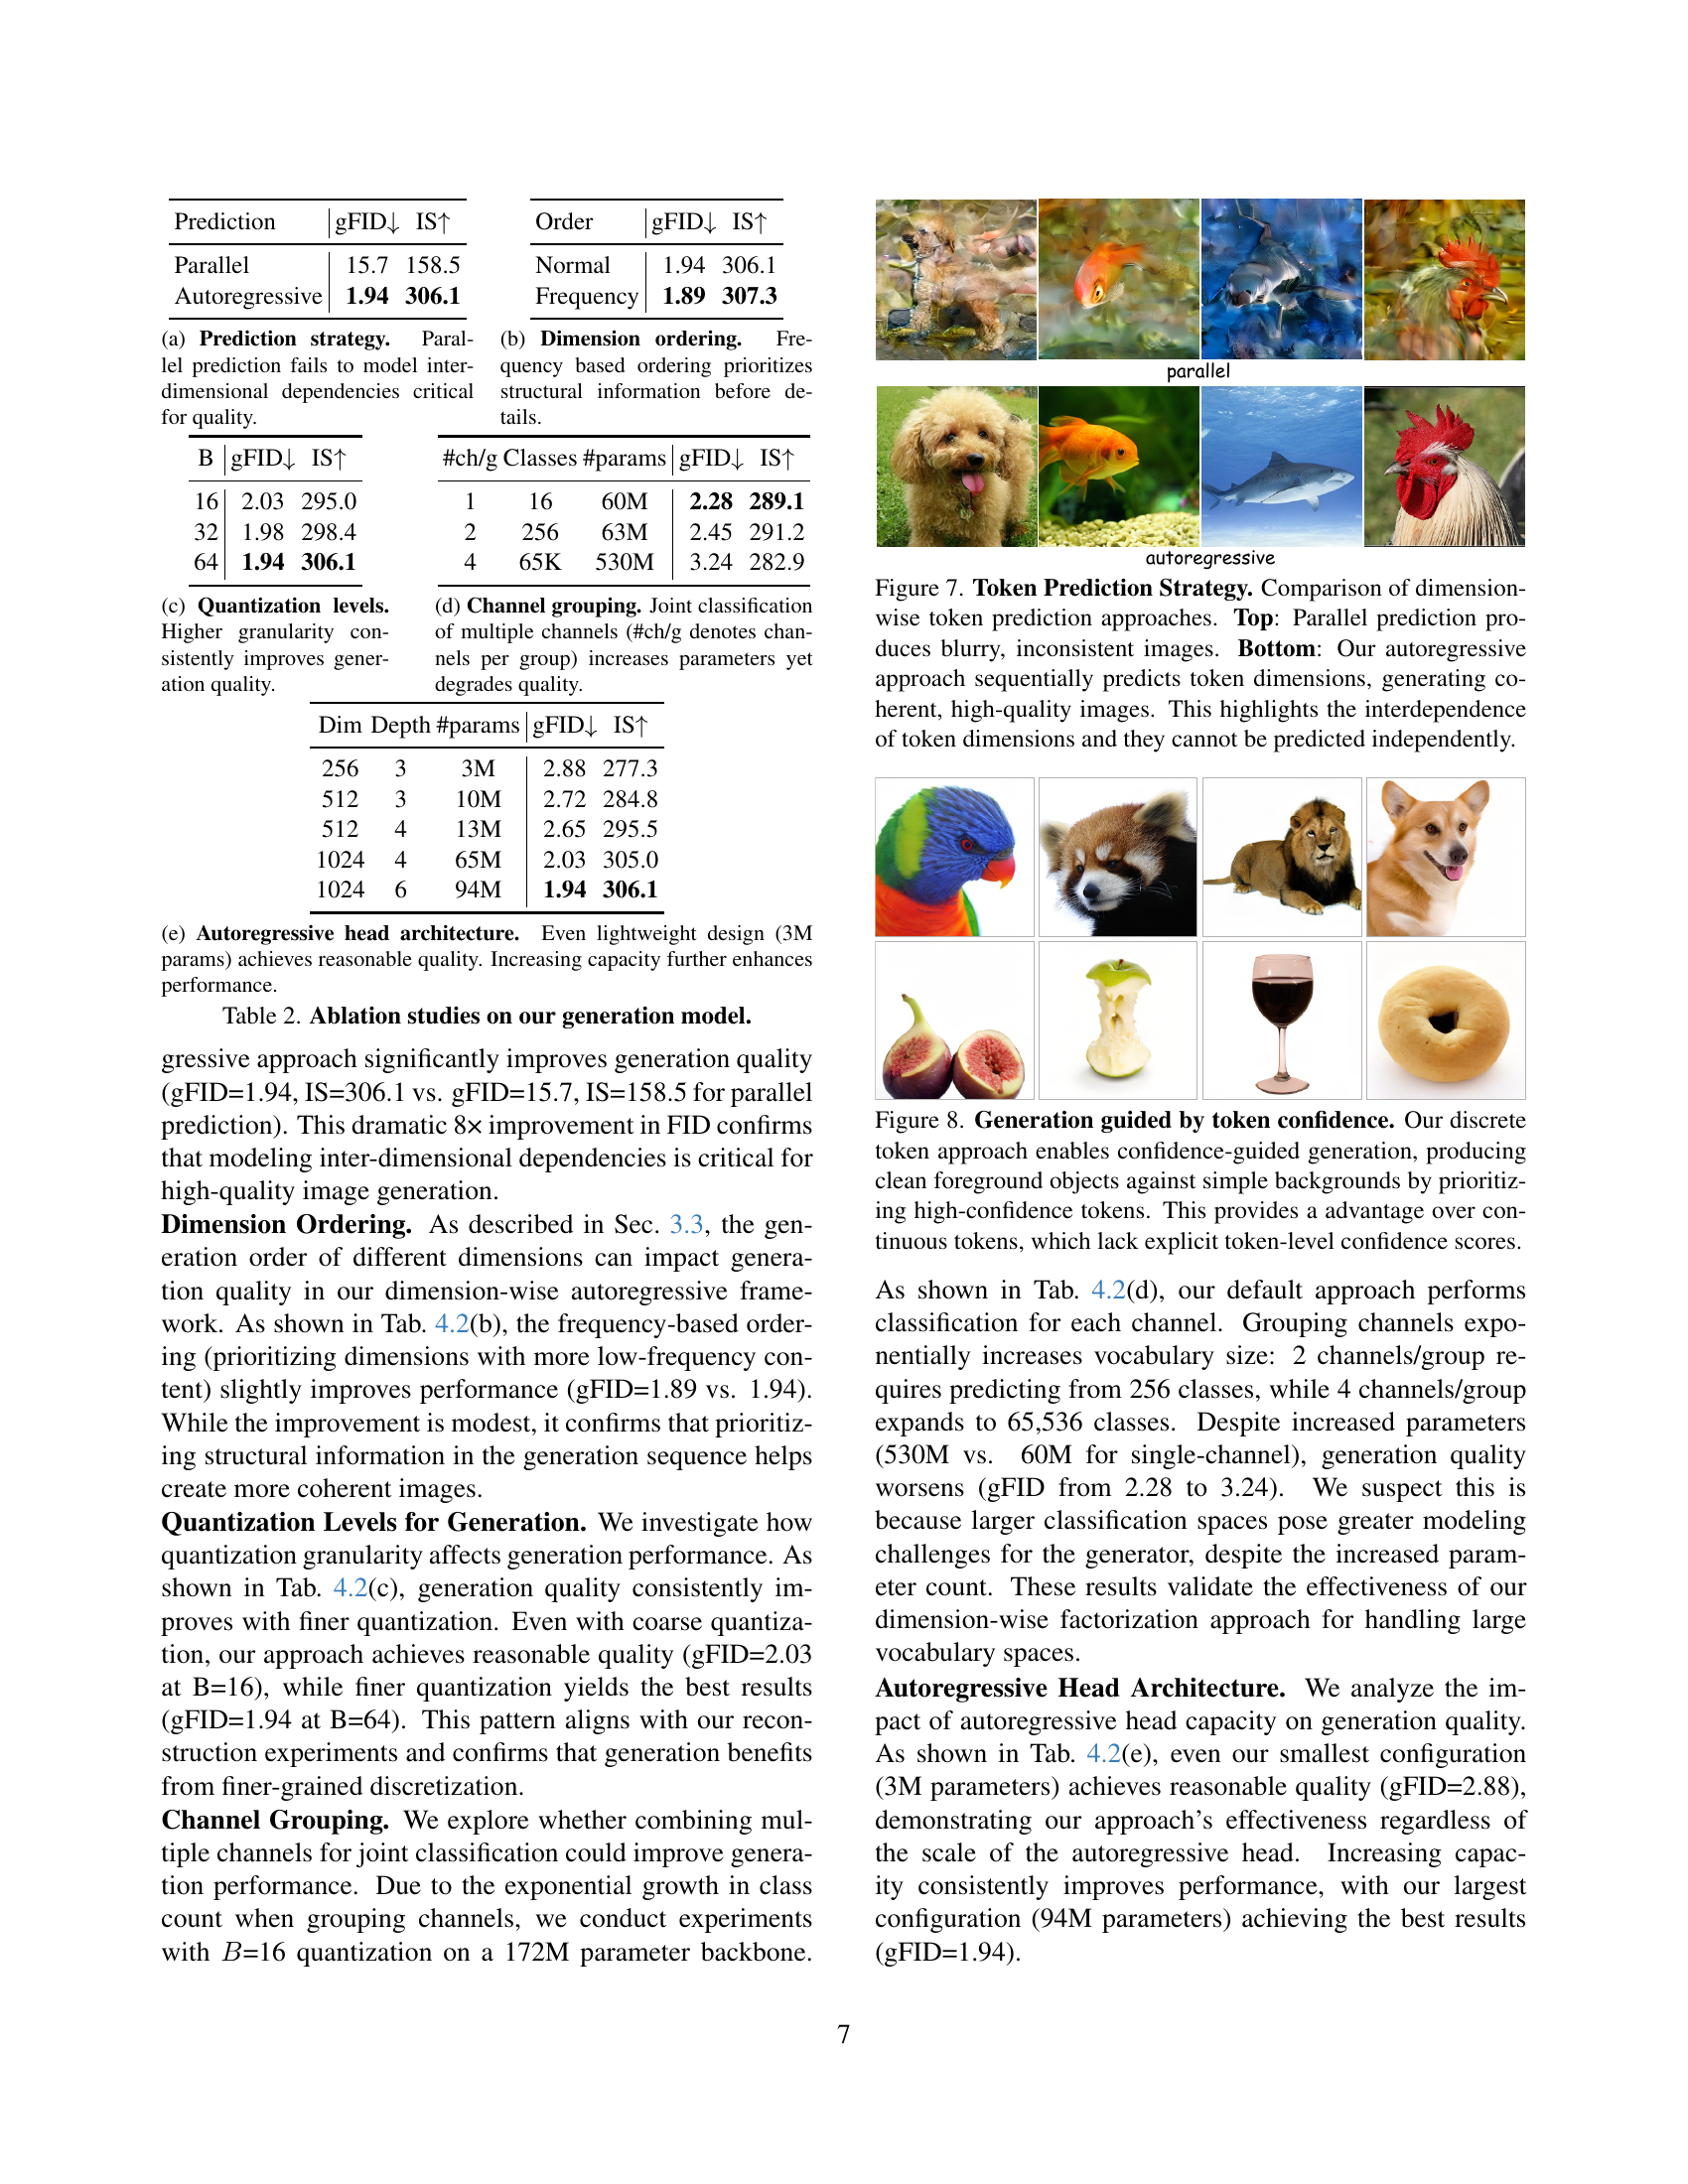
🔼 This figure compares two methods for predicting image tokens: parallel prediction and the autoregressive approach. The parallel prediction method predicts all token dimensions independently, leading to blurry and inconsistent image generation. In contrast, the autoregressive approach presented in the paper sequentially predicts each token dimension, conditioning on previously predicted dimensions. This sequential process generates much more coherent and high-quality images. The figure highlights that token dimensions are highly interdependent and cannot be accurately predicted in isolation.
read the caption
Figure 7: Token Prediction Strategy. Comparison of dimension-wise token prediction approaches. Top: Parallel prediction produces blurry, inconsistent images. Bottom: Our autoregressive approach sequentially predicts token dimensions, generating coherent, high-quality images. This highlights the interdependence of token dimensions and they cannot be predicted independently.

🔼 This figure demonstrates the advantage of using discrete tokens over continuous tokens in autoregressive image generation. By leveraging confidence scores associated with each discrete token, the model can prioritize high-confidence tokens, resulting in cleaner foreground objects against simpler backgrounds. This selective generation capability is not available with continuous tokens, which lack explicit confidence scores. The images showcase the difference in generation quality: using confidence scores leads to more focused images with clear subject matter and less noise in the background, while continuous token approaches cannot offer this level of control.
read the caption
Figure 8: Generation guided by token confidence. Our discrete token approach enables confidence-guided generation, producing clean foreground objects against simple backgrounds by prioritizing high-confidence tokens. This provides a advantage over continuous tokens, which lack explicit token-level confidence scores.

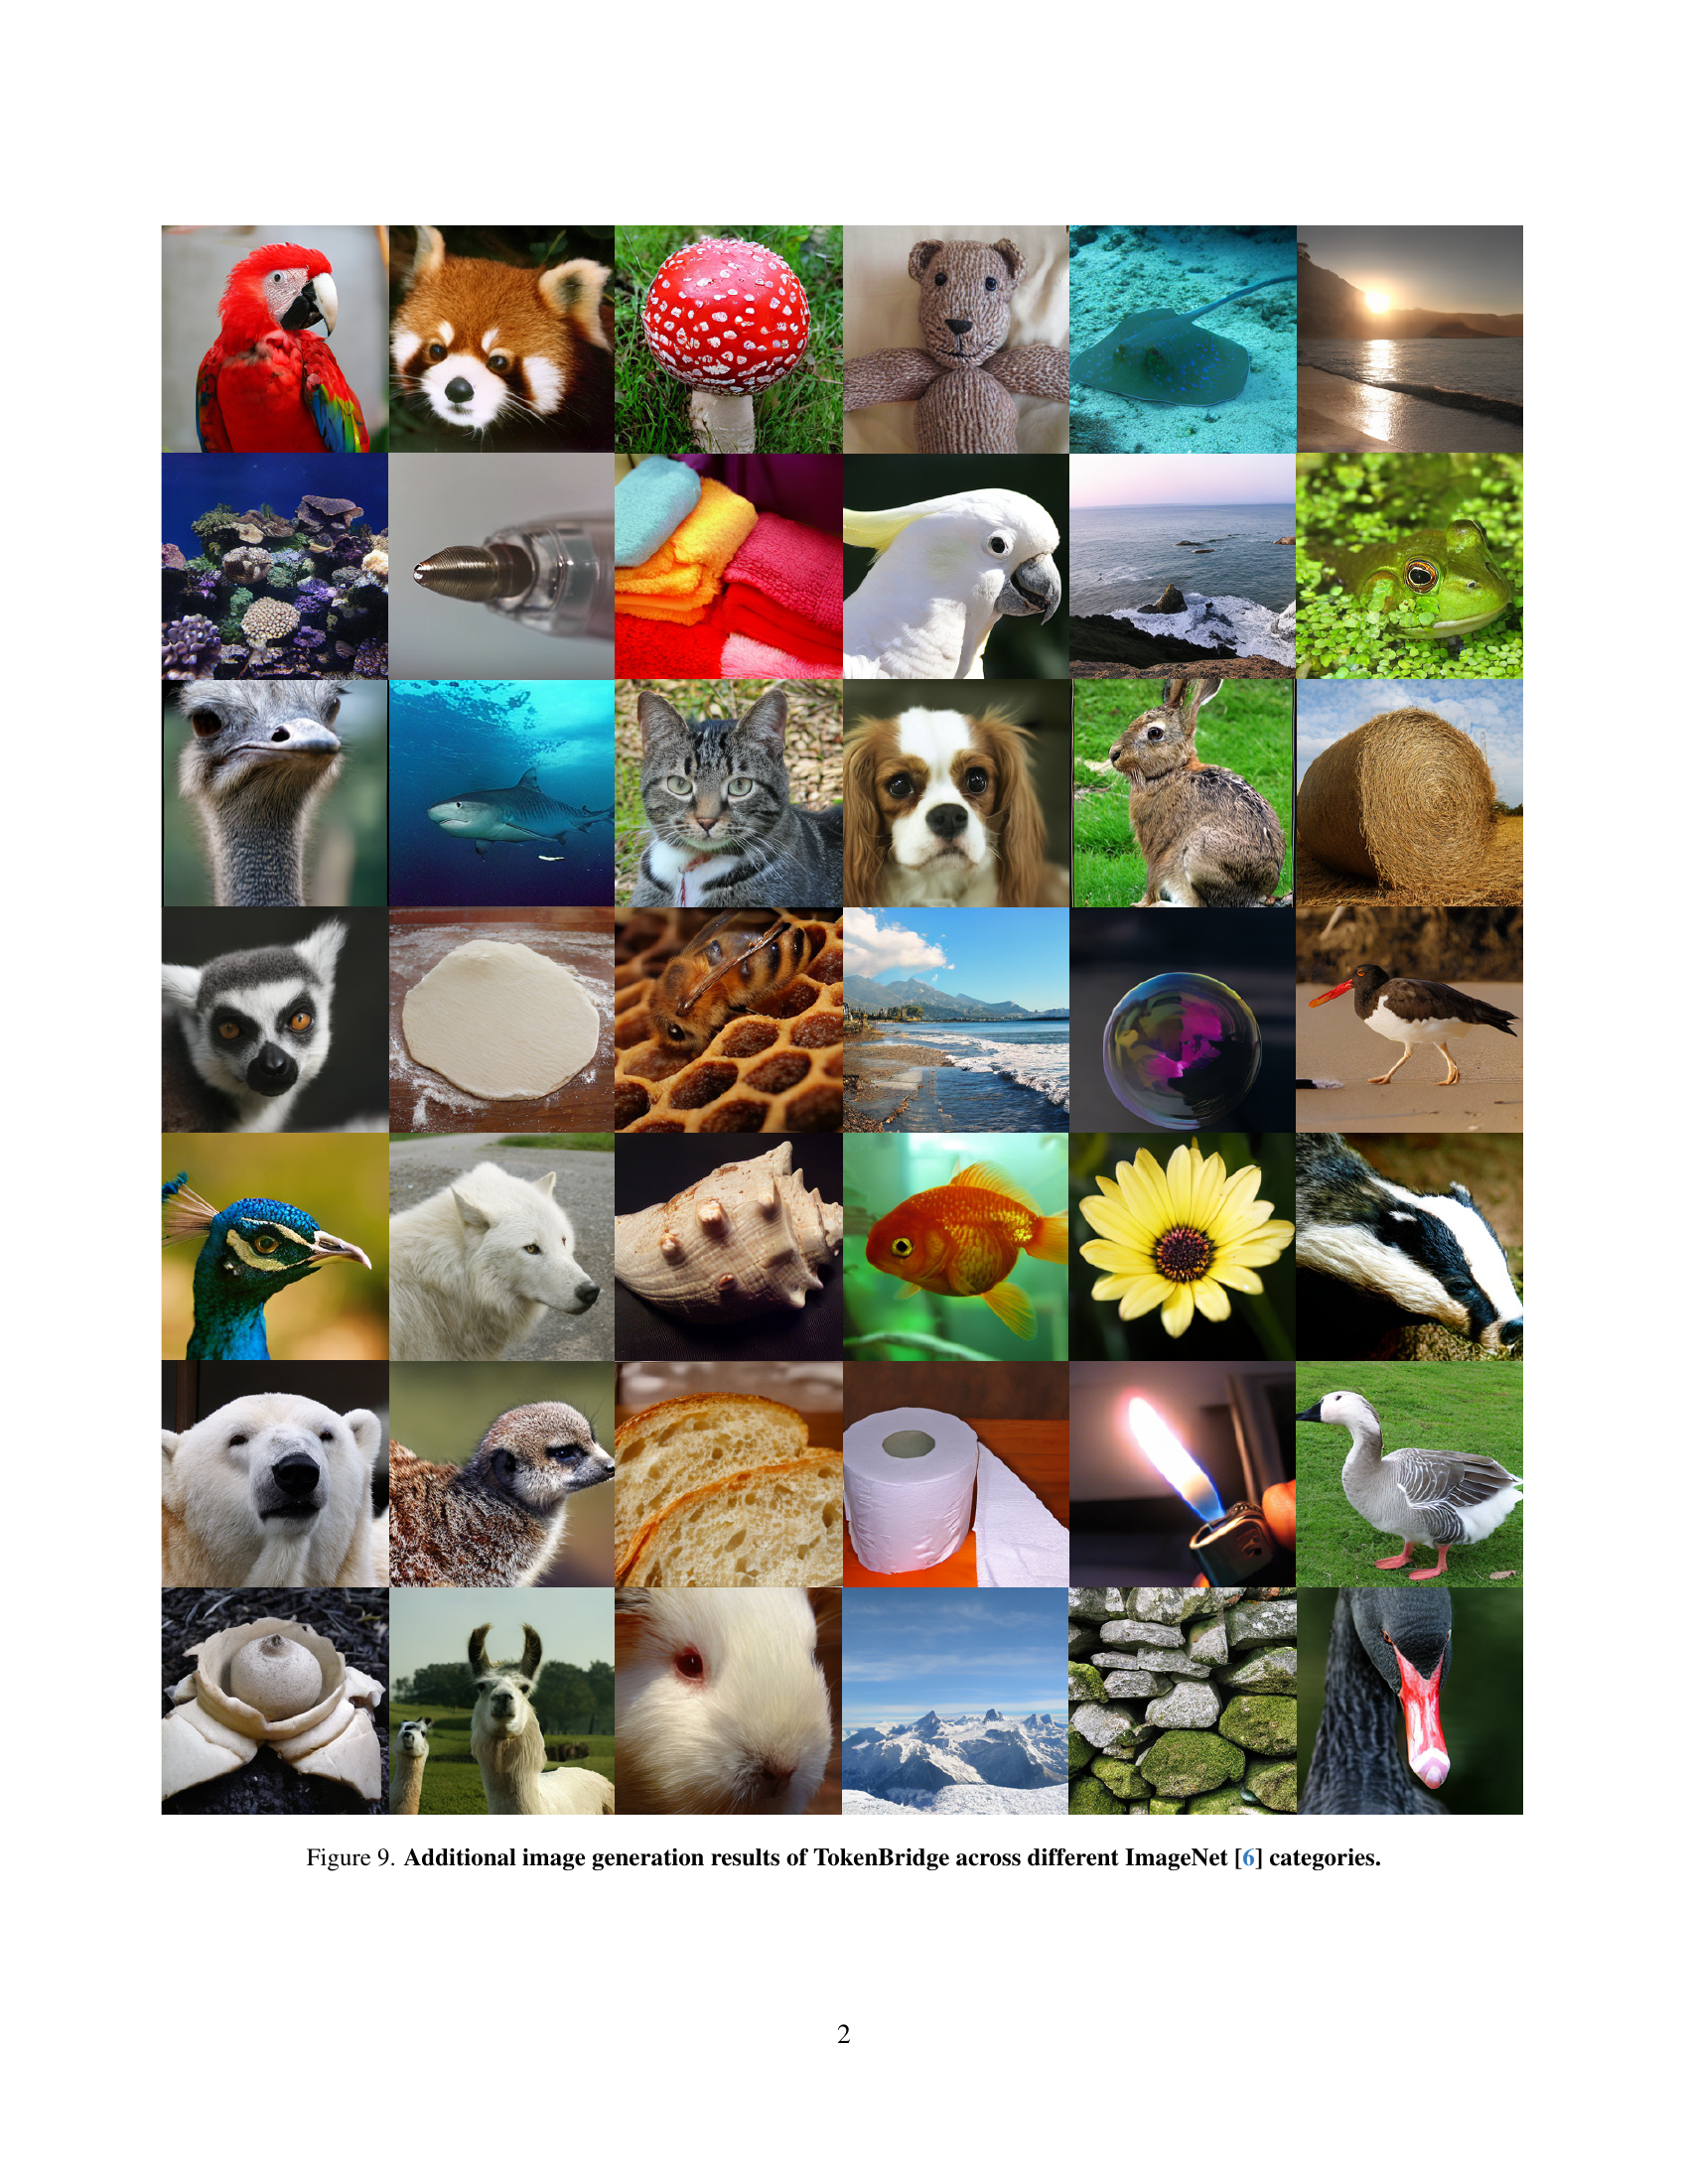
🔼 This figure showcases a diverse set of images generated by the TokenBridge model. The images represent various categories from the ImageNet dataset, demonstrating the model’s ability to generate high-quality, detailed images across a wide range of visual concepts and styles.
read the caption
Figure 9: Additional image generation results of TokenBridge across different ImageNet [6] categories.
More on tables
| Method | Range | rFID | IS |
| VAE | - | 1.11 | 306.1 |
| Ours | 2.26 | 267.9 | |
| Ours | 1.22 | 299.7 | |
| Ours | 1.13 | 305.3 | |
| Ours | 1.11 | 305.4 |
🔼 This table presents ablation study results on the impact of different quantization ranges on reconstruction quality. The experiment varied the range of values used for the post-training quantization of the continuous latent features from a VAE. The reconstruction quality is measured by FID, and the goal was to find a range that yields results comparable to a continuous VAE which does not require quantization. The results show that a quantization range of ±5 standard deviations achieves comparable reconstruction quality to the continuous VAE model, indicating the effectiveness of this quantization range.
read the caption
(b) Different quantization ranges. Feature range ±5plus-or-minus5\pm 5± 5 achieves reconstruction quality matching continuous VAE.
| Prediction | gFID | IS |
| Parallel | 15.7 | 158.5 |
| Autoregressive | 1.94 | 306.1 |
🔼 This table presents ablation study results on the post-training quantization method used in TokenBridge. It shows how different quantization levels and ranges impact the reconstruction quality, measured by FID (Fréchet Inception Distance) and IS (Inception Score). The results demonstrate the effectiveness of the proposed dimension-wise quantization strategy and its ability to achieve high reconstruction quality comparable to continuous VAEs (Variational Autoencoders) with carefully selected hyperparameters.
read the caption
Table 1: Ablations on post-training quantization.
| Order | gFID | IS |
| Normal | 1.94 | 306.1 |
| Frequency | 1.89 | 307.3 |
🔼 This table compares different prediction strategies for autoregressive visual generation. The parallel prediction approach, which independently predicts each dimension of the image token, fails to capture crucial inter-dimensional relationships, leading to lower-quality generation. In contrast, the autoregressive approach, which sequentially predicts each dimension conditioned on the preceding ones, effectively models these dependencies, significantly improving image quality.
read the caption
(a) Prediction strategy. Parallel prediction fails to model inter-dimensional dependencies critical for quality.
| B | gFID | IS |
| 16 | 2.03 | 295.0 |
| 32 | 1.98 | 298.4 |
| 64 | 1.94 | 306.1 |
🔼 This table presents ablation study results on the impact of dimension ordering during image generation. Specifically, it compares generation quality (measured by FID and IS scores) when dimensions are processed sequentially in their default order versus an order based on frequency. The frequency-based ordering prioritizes dimensions containing more low-frequency information (structural elements) before processing those with high-frequency details (textures). This strategy aims to improve the generation process by constructing a solid base before adding fine-grained details.
read the caption
(b) Dimension ordering. Frequency based ordering prioritizes structural information before details.
| #ch/g | Classes | #params | gFID | IS |
| 1 | 16 | 60M | 2.28 | 289.1 |
| 2 | 256 | 63M | 2.45 | 291.2 |
| 4 | 65K | 530M | 3.24 | 282.9 |
🔼 This table shows the impact of different quantization levels on the quality of image generation. The number of quantization levels (or granularity) directly affects the autoregressive model’s ability to capture fine details in the images it generates. As the number of quantization levels increases, the model’s capacity to represent nuanced visual information improves, leading to better generation quality. This is evident through the decrease in FID (Fréchet Inception Distance) scores, which indicate better image fidelity, and the increase in IS (Inception Score) scores, which shows higher image quality and diversity. This experiment highlights the importance of fine-grained quantization for achieving high-quality generation results with the proposed method.
read the caption
(c) Quantization levels. Higher granularity consistently improves generation quality.
| Dim | Depth | #params | gFID | IS |
| 256 | 3 | 3M | 2.88 | 277.3 |
| 512 | 3 | 10M | 2.72 | 284.8 |
| 512 | 4 | 13M | 2.65 | 295.5 |
| 1024 | 4 | 65M | 2.03 | 305.0 |
| 1024 | 6 | 94M | 1.94 | 306.1 |
🔼 This table investigates the impact of grouping multiple channels together for joint classification within the autoregressive model. It explores the trade-off between increasing model complexity (number of parameters) and the effect on generation quality (measured by FID and IS scores). The results show that while increasing the number of channels per group increases the model’s parameter count, it negatively impacts generation quality, indicating that independent, dimension-wise classification is more effective.
read the caption
(d) Channel grouping. Joint classification of multiple channels (#ch/g denotes channels per group) increases parameters yet degrades quality.
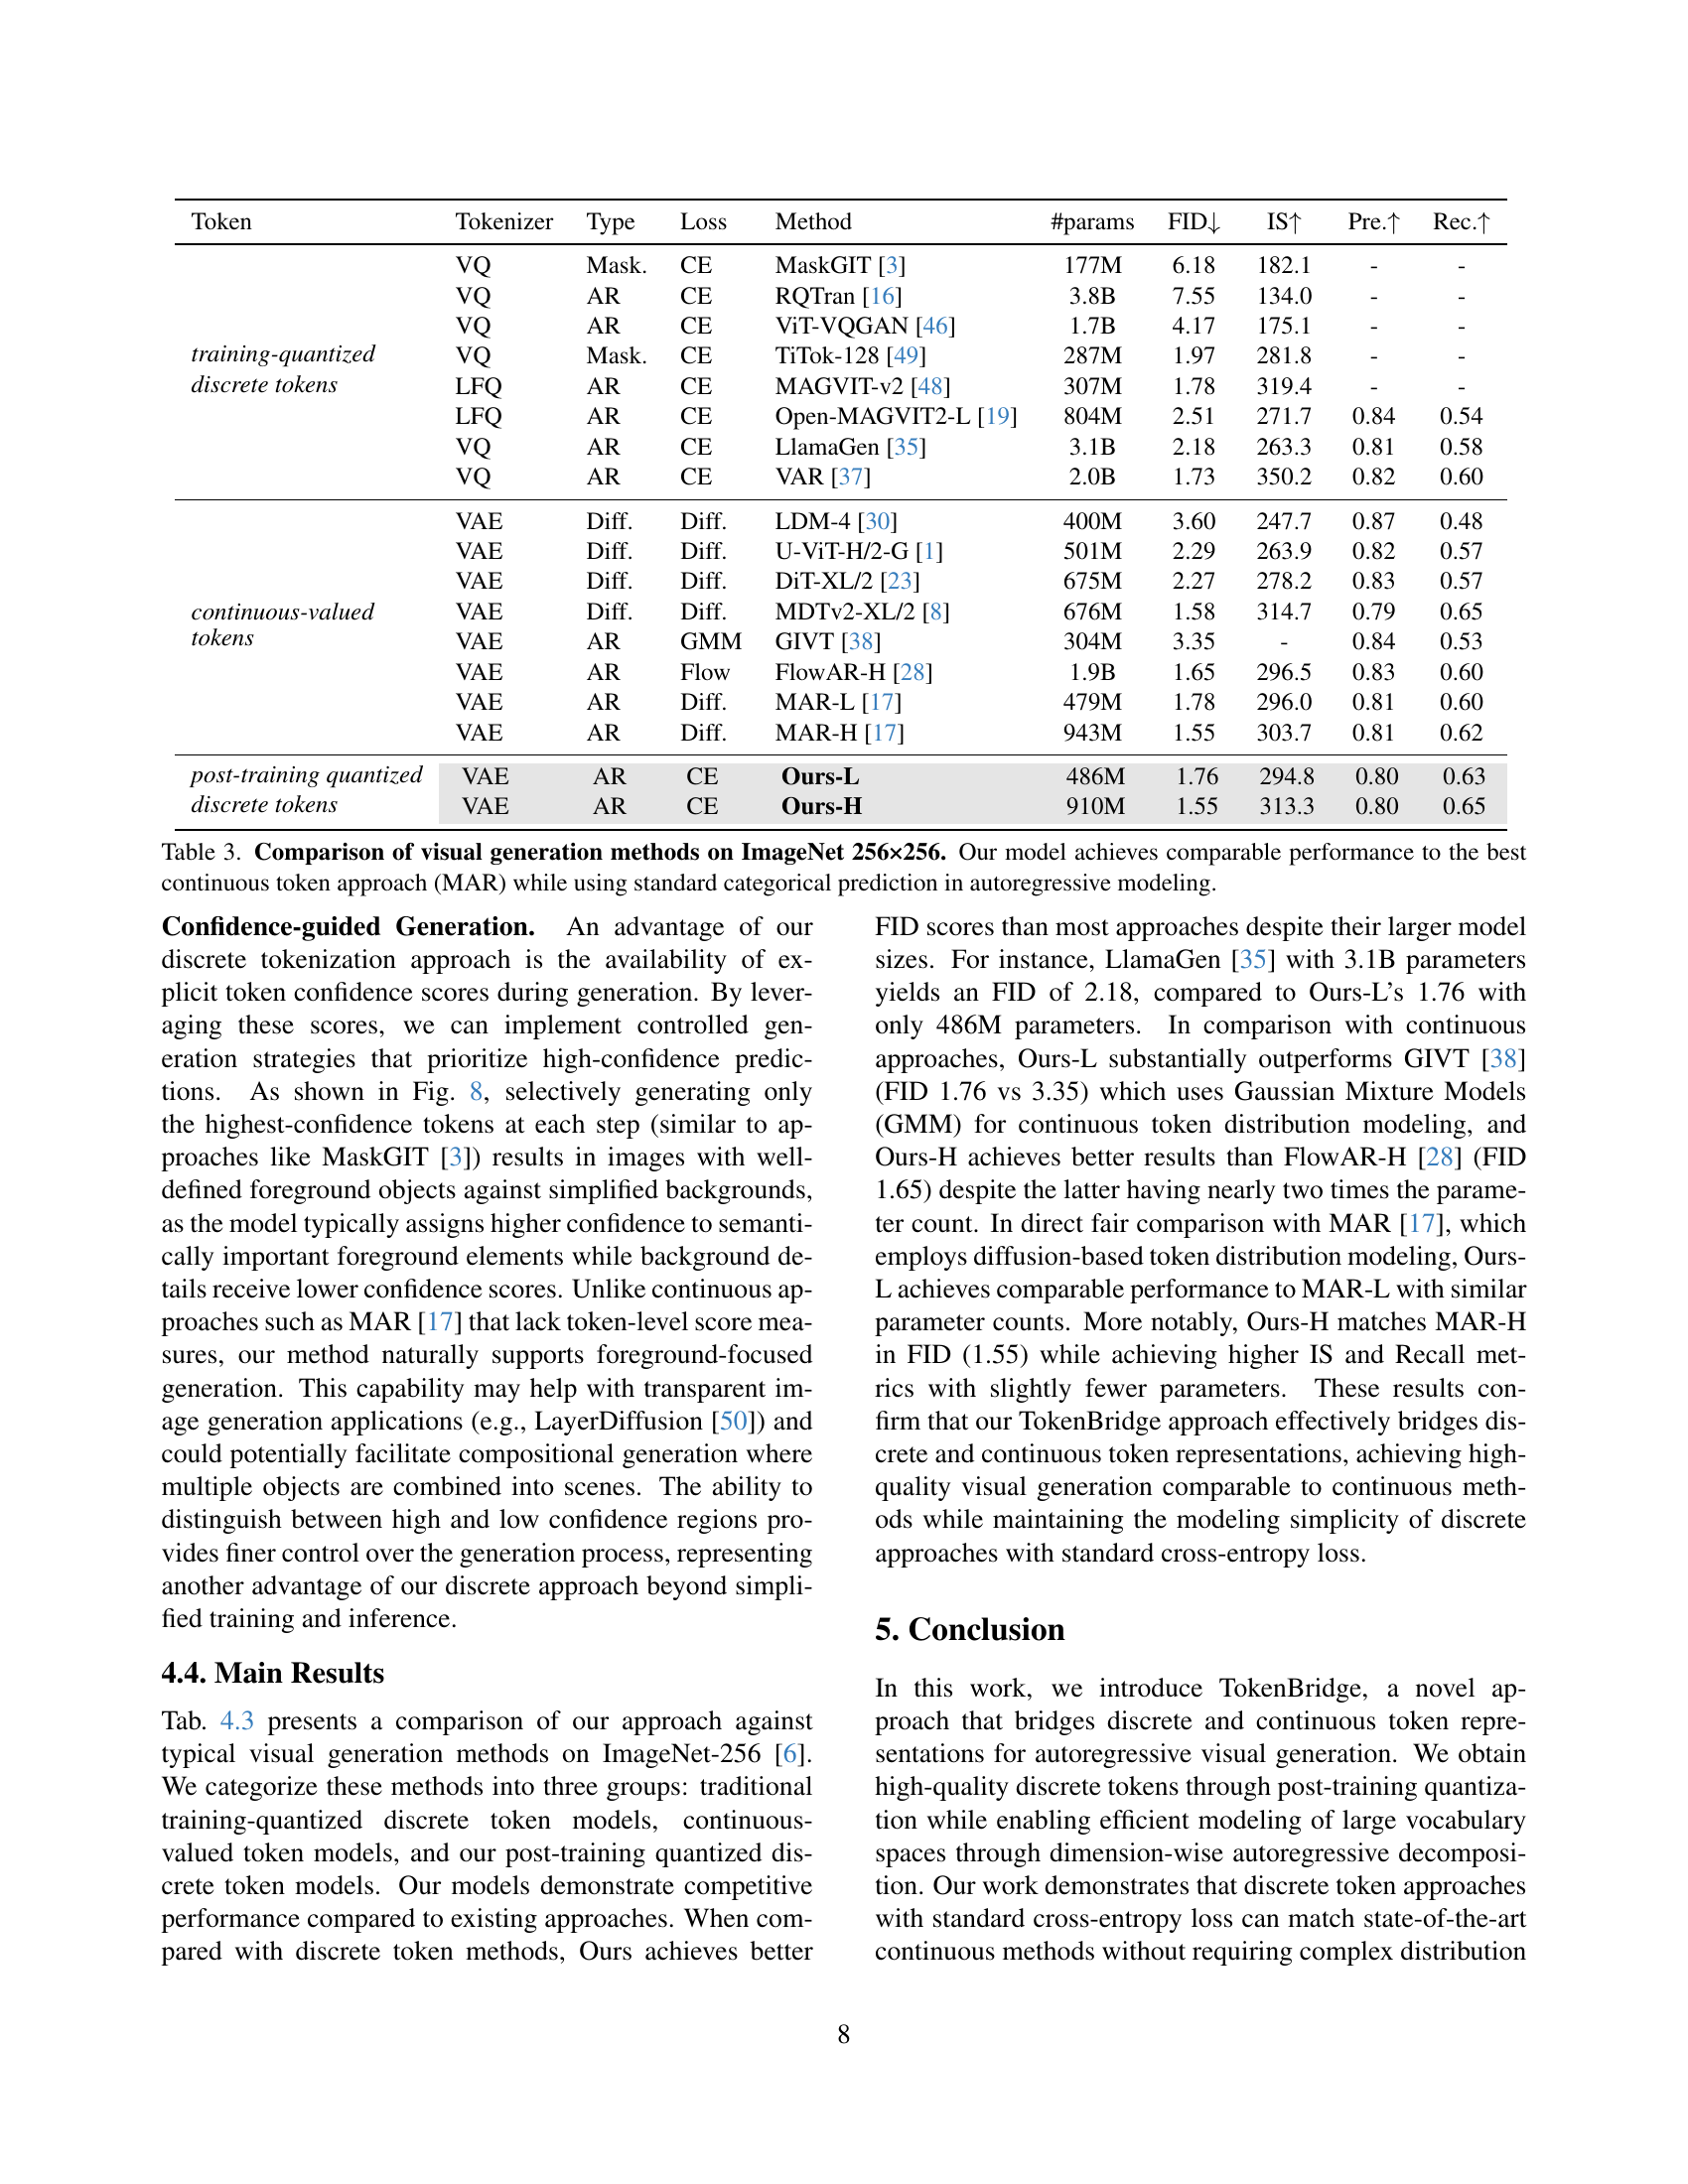
| Token | Tokenizer | Type | Loss | Method | #params | FID | IS | Pre. | Rec. |
| training-quantized discrete tokens | VQ | Mask. | CE | MaskGIT [3] | 177M | 6.18 | 182.1 | - | - |
| VQ | AR | CE | RQTran [16] | 3.8B | 7.55 | 134.0 | - | - | |
| VQ | AR | CE | ViT-VQGAN [46] | 1.7B | 4.17 | 175.1 | - | - | |
| VQ | Mask. | CE | TiTok-128 [49] | 287M | 1.97 | 281.8 | - | - | |
| LFQ | AR | CE | MAGVIT-v2 [48] | 307M | 1.78 | 319.4 | - | - | |
| LFQ | AR | CE | Open-MAGVIT2-L [19] | 804M | 2.51 | 271.7 | 0.84 | 0.54 | |
| VQ | AR | CE | LlamaGen [35] | 3.1B | 2.18 | 263.3 | 0.81 | 0.58 | |
| VQ | AR | CE | VAR [37] | 2.0B | 1.73 | 350.2 | 0.82 | 0.60 | |
| continuous-valued tokens | VAE | Diff. | Diff. | LDM-4 [30] | 400M | 3.60 | 247.7 | 0.87 | 0.48 |
| VAE | Diff. | Diff. | U-ViT-H/2-G [1] | 501M | 2.29 | 263.9 | 0.82 | 0.57 | |
| VAE | Diff. | Diff. | DiT-XL/2 [23] | 675M | 2.27 | 278.2 | 0.83 | 0.57 | |
| VAE | Diff. | Diff. | MDTv2-XL/2 [8] | 676M | 1.58 | 314.7 | 0.79 | 0.65 | |
| VAE | AR | GMM | GIVT [38] | 304M | 3.35 | - | 0.84 | 0.53 | |
| VAE | AR | Flow | FlowAR-H [28] | 1.9B | 1.65 | 296.5 | 0.83 | 0.60 | |
| VAE | AR | Diff. | MAR-L [17] | 479M | 1.78 | 296.0 | 0.81 | 0.60 | |
| VAE | AR | Diff. | MAR-H [17] | 943M | 1.55 | 303.7 | 0.81 | 0.62 | |
| post-training quantized discrete tokens | VAE | AR | CE | Ours-L | 486M | 1.76 | 294.8 | 0.80 | 0.63 |
| VAE | AR | CE | Ours-H | 910M | 1.55 | 313.3 | 0.80 | 0.65 |
🔼 This table presents ablation studies on the autoregressive head architecture used in the TokenBridge model for image generation. It shows the impact of varying the model’s depth and number of parameters on the performance, as measured by FID and IS scores. The results demonstrate that even a lightweight design with only 3 million parameters can achieve reasonable image generation quality, and that increasing model capacity further enhances performance.
read the caption
(e) Autoregressive head architecture. Even lightweight design (3M params) achieves reasonable quality. Increasing capacity further enhances performance.
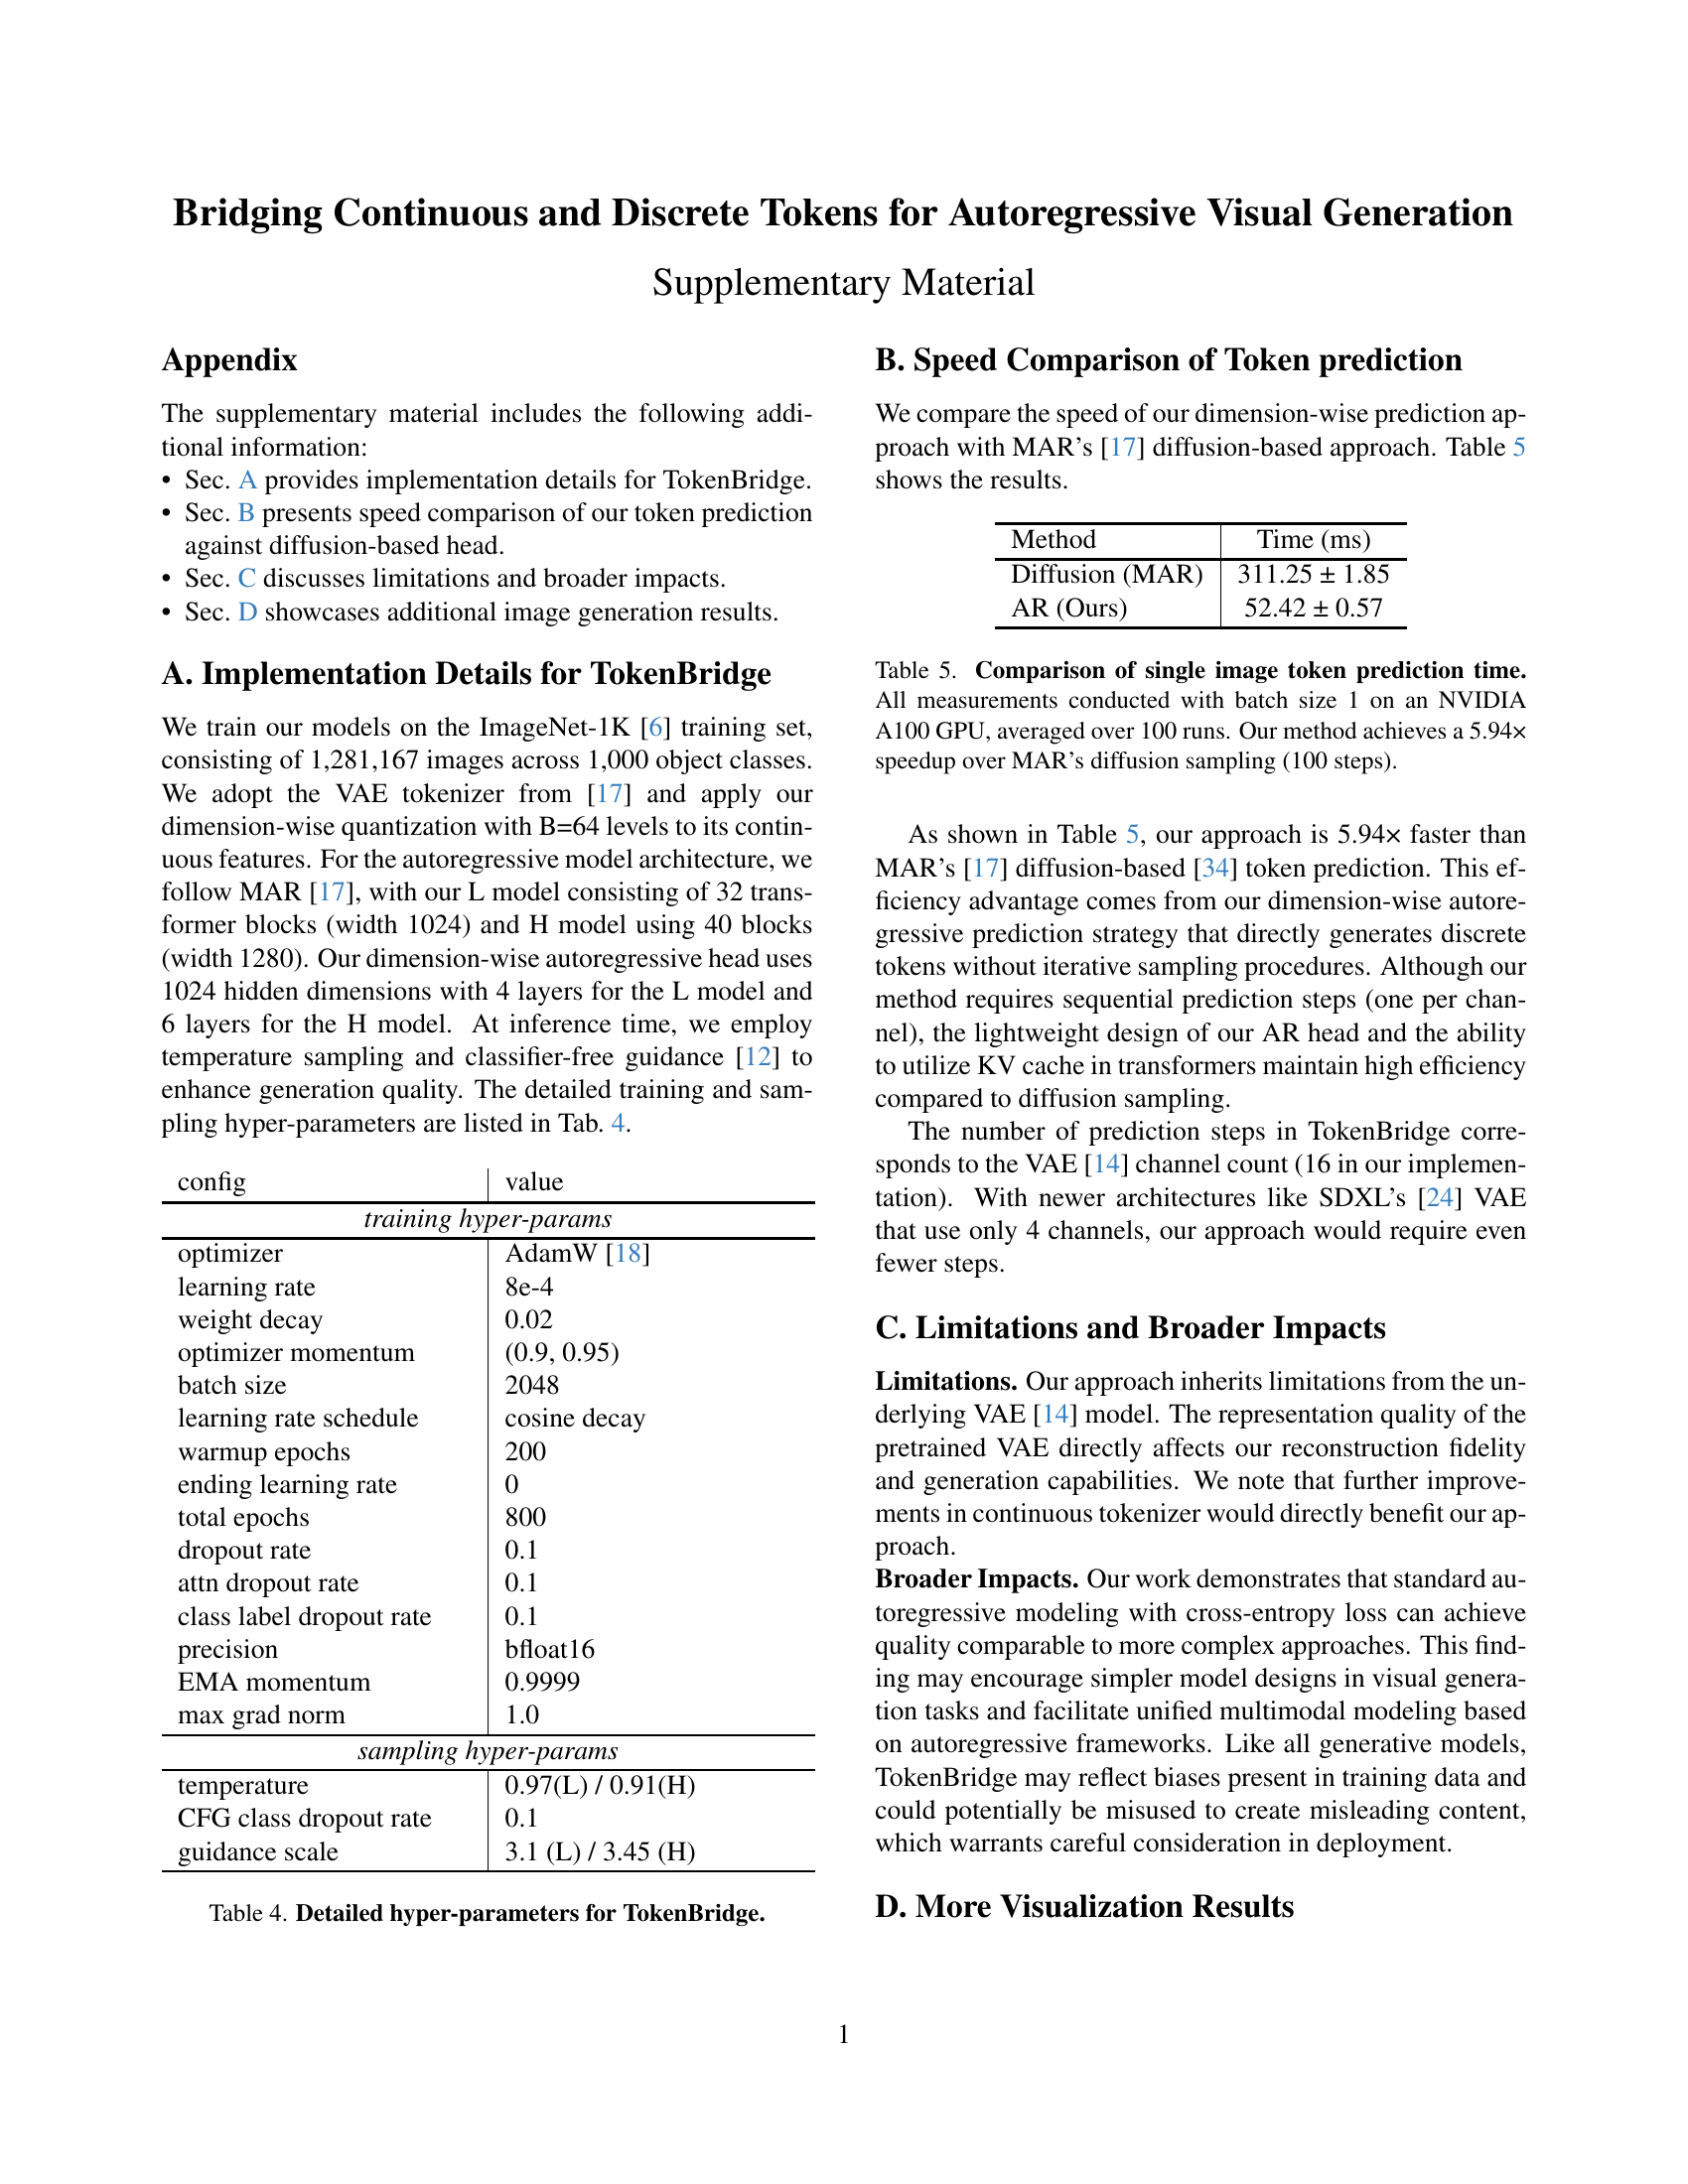
| config | value |
| training hyper-params | |
| optimizer | AdamW [18] |
| learning rate | 8e-4 |
| weight decay | 0.02 |
| optimizer momentum | (0.9, 0.95) |
| batch size | 2048 |
| learning rate schedule | cosine decay |
| warmup epochs | 200 |
| ending learning rate | 0 |
| total epochs | 800 |
| dropout rate | 0.1 |
| attn dropout rate | 0.1 |
| class label dropout rate | 0.1 |
| precision | bfloat16 |
| EMA momentum | 0.9999 |
| max grad norm | 1.0 |
| sampling hyper-params | |
| temperature | 0.97(L) / 0.91(H) |
| CFG class dropout rate | 0.1 |
| guidance scale | 3.1 (L) / 3.45 (H) |
🔼 This table presents the results of ablation studies conducted on the autoregressive generation model component of TokenBridge. It explores the impact of various design choices on the model’s performance, measured by FID and IS scores. Specifically, it investigates different prediction strategies (parallel vs. autoregressive), dimension ordering (normal vs. frequency-based), quantization levels, channel grouping within the autoregressive head, and the architecture of the autoregressive head itself (varying dimension and depth). By comparing the FID and IS scores across these different configurations, the study aims to identify the optimal design choices for maximizing generation quality.
read the caption
Table 2: Ablation studies on our generation model.
| Method | Time (ms) |
| Diffusion (MAR) | 311.25 ± 1.85 |
| AR (Ours) | 52.42 ± 0.57 |
🔼 Table 3 presents a quantitative comparison of various image generation models on the ImageNet 256x256 dataset. The models are categorized into three groups: those using traditional discrete tokens (requiring quantization during training), those using continuous tokens (often involving more complex distribution modeling), and the proposed TokenBridge method. The table evaluates these models based on standard metrics for image generation: Fréchet Inception Distance (FID), Inception Score (IS), Precision, and Recall. The results demonstrate that TokenBridge achieves performance comparable to the state-of-the-art continuous token model (MAR), despite employing standard autoregressive modeling with categorical prediction, thus highlighting the effectiveness of the proposed approach in bridging discrete and continuous token paradigms.
read the caption
Table 3: Comparison of visual generation methods on ImageNet 256×256. Our model achieves comparable performance to the best continuous token approach (MAR) while using standard categorical prediction in autoregressive modeling.
Full paper#