TL;DR#
In the field of image generation, fine-tuning methods align models with human preferences. However, the subjective nature of preferences and minority samples in datasets pose challenges. Current methods assume uniform preference labels, neglecting the diversity of opinions. The impact of this dichotomy on diffusion models has not been explored, so this paper investigates the effect. The existence of minority samples can lead to performance decline, equivalent to 52% loss in performance gains.
To address these issues, Adaptive-DPO is proposed, autonomously identifying and suppressing problematic minority samples. It leverages a metric modeling intra-annotator confidence and inter-annotator stability, distinguishing between majority and minority samples. An adaptive loss improves model learning while mitigating negative impacts. Experiments demonstrate that the method handles synthetic and real-world data, enabling effective training in image generation.
Key Takeaways#
Why does it matter?#
This paper is important for researchers in image generation because it tackles the under-explored issue of preference divergence in diffusion models. By introducing Adaptive-DPO, the research offers a robust method to handle subjective annotations, paving the way for more reliable and human-aligned image generation. It also opens new avenues for exploring preference learning.
Visual Insights#

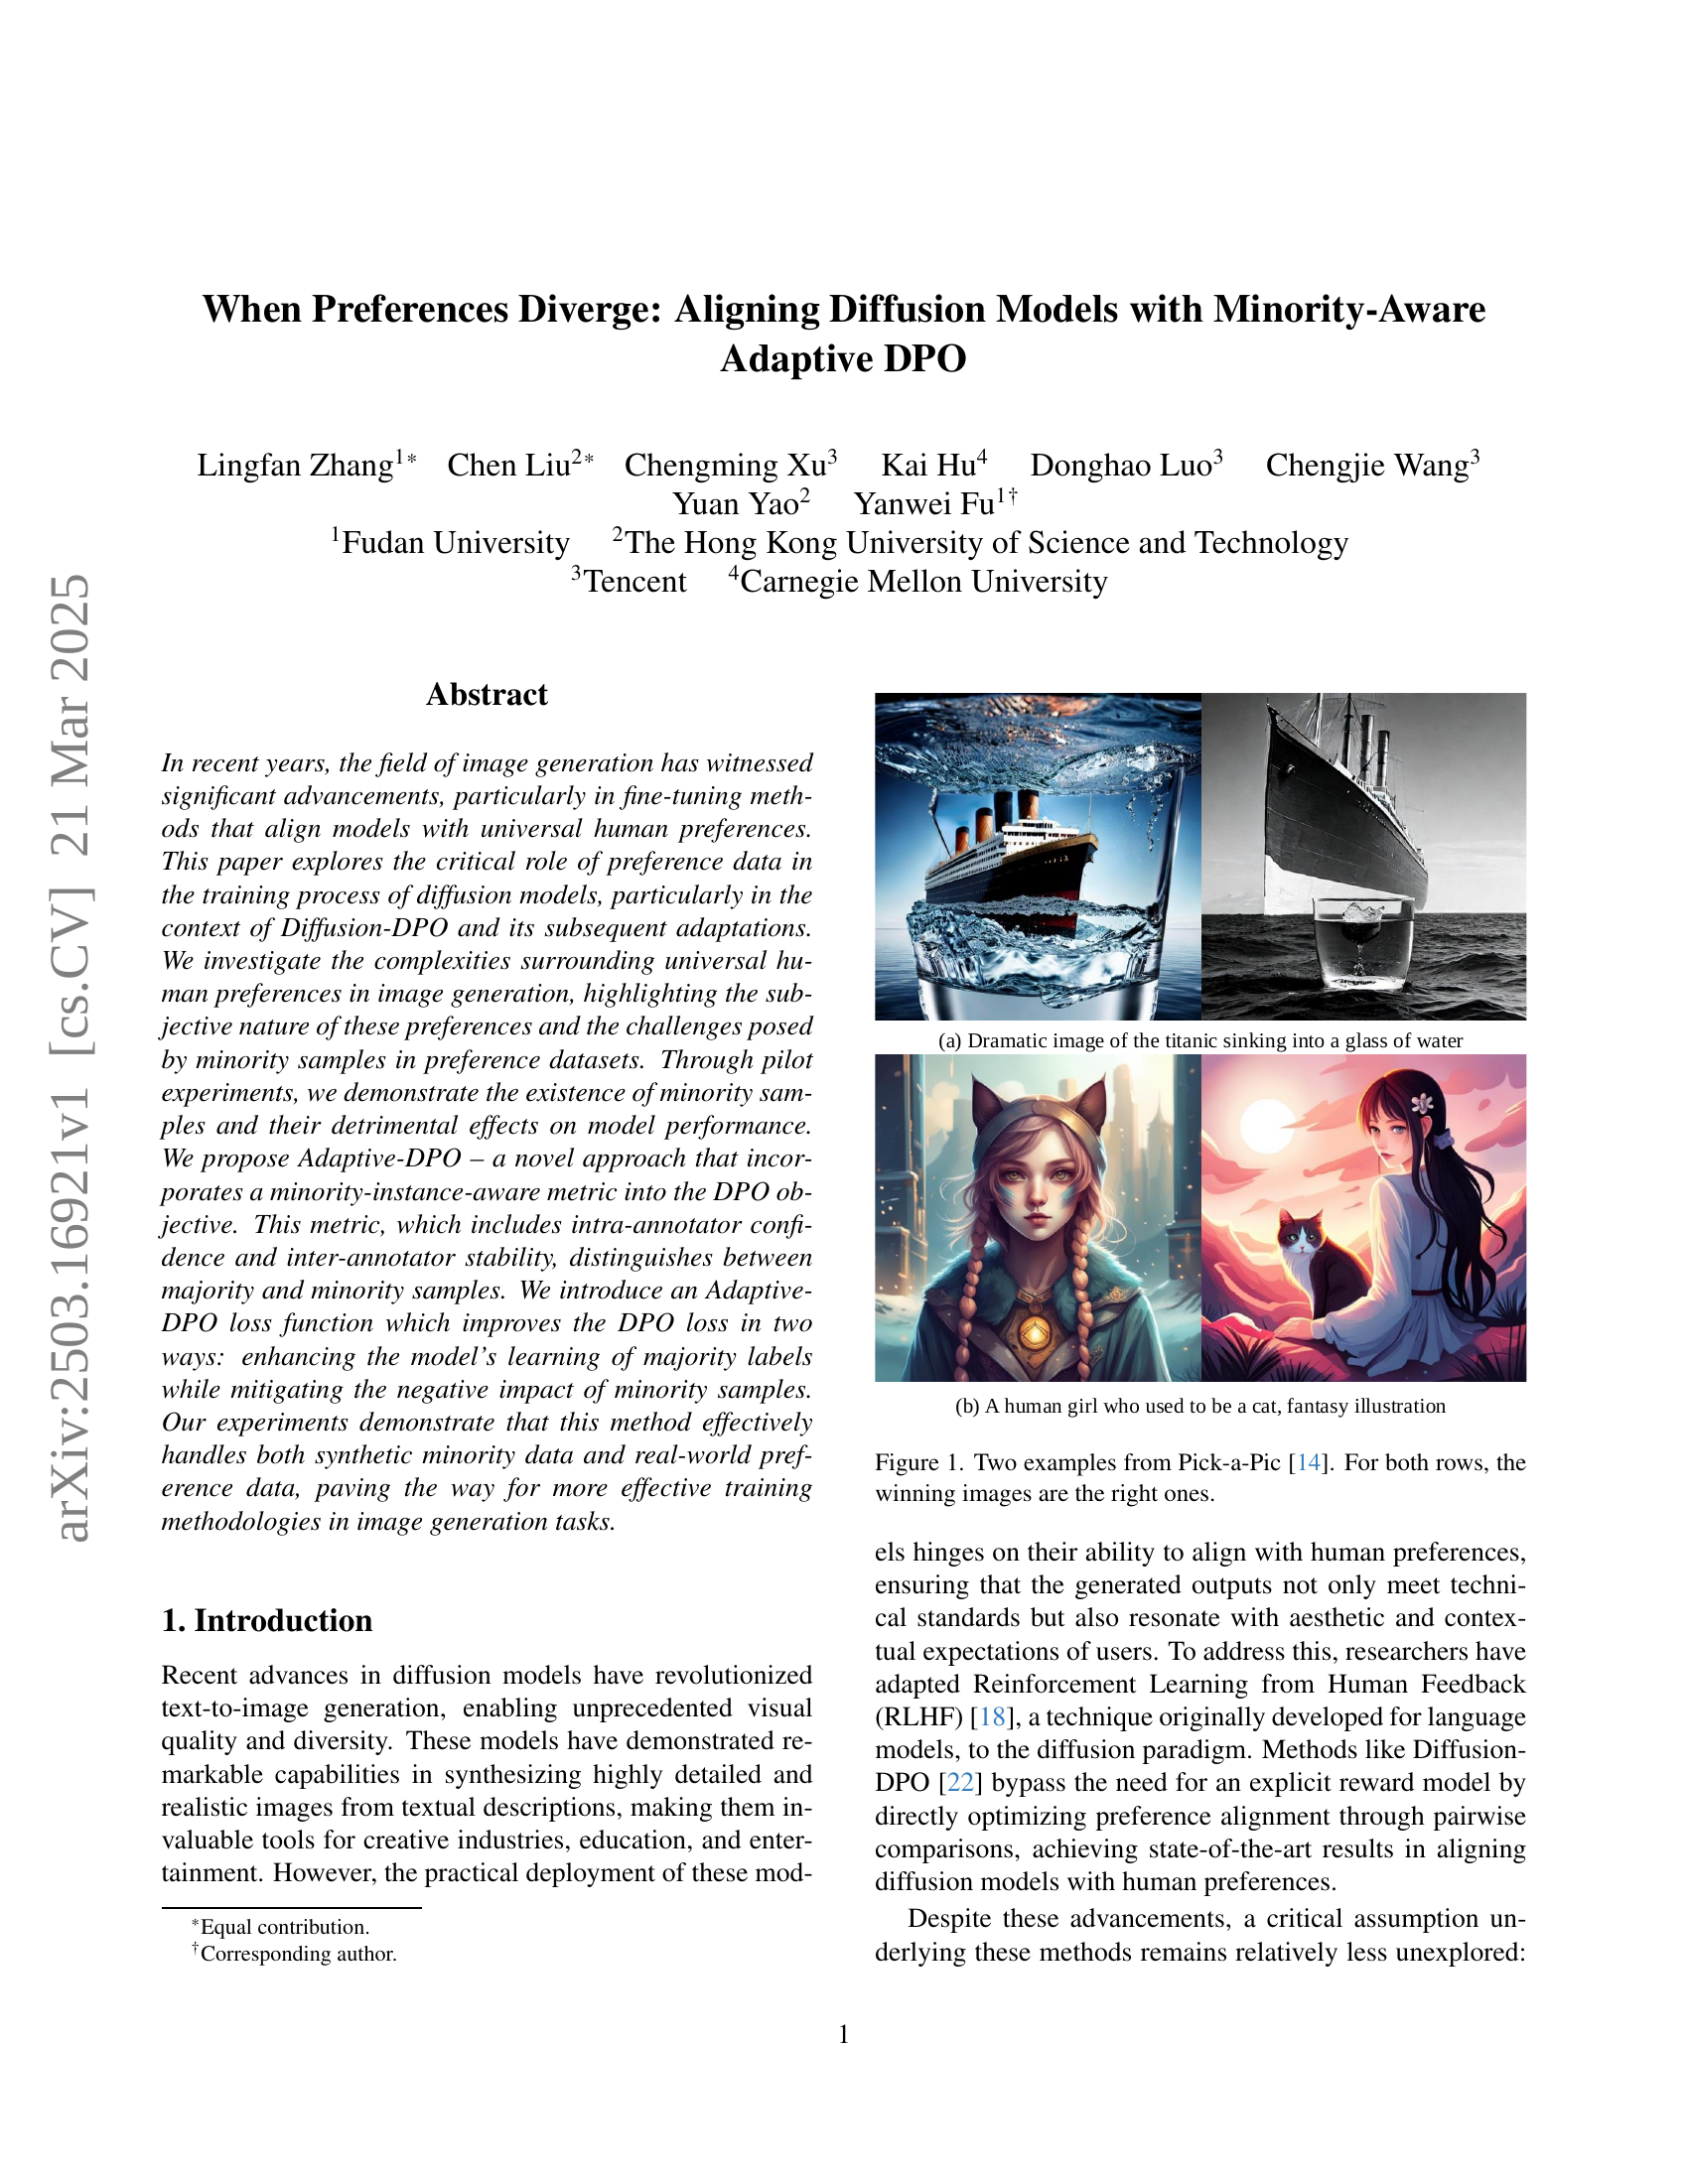
🔼 This figure shows two examples of image pairs from the Pick-a-Pic dataset [14]. Each row presents a pair of images generated in response to the same text prompt. Human annotators have selected the image on the right as the preferred image in both examples. These examples highlight the subjective nature of human preferences in image generation and how those preferences can vary. The images illustrate different artistic styles and levels of image quality, highlighting the diversity of preferences present even within a seemingly simple task like image generation.
read the caption
Figure 1: Two examples from Pick-a-Pic [14]. For both rows, the winning images are the right ones.
In-depth insights#
DPO’s Weak Point#
While DPO has emerged as a powerful technique for aligning diffusion models with human preferences, it’s crucial to acknowledge its potential weaknesses. DPO relies heavily on the quality and uniformity of the preference datasets used for training. If these datasets contain significant noise or biases, the resulting model may not accurately reflect true human preferences. Furthermore, DPO’s pairwise comparison approach can be computationally expensive, especially when dealing with large datasets or complex models. It inherently assumes that preferences are consistent and transitive. In scenarios with subjective or ambiguous preferences, this assumption may not hold. DPO might struggle to capture the nuanced and multifaceted nature of human judgment and might be vulnerable to adversarial attacks. The absence of explicit mechanism that tackle the issue of minor data and noisy data are DPO’s weak point. The robustness of DPO under various conditions warrants further investigation.
Adaptive Metric#
Adaptive metrics are crucial for nuanced evaluations, especially when dealing with complex data or subjective assessments. These metrics dynamically adjust their sensitivity based on the context or the specific characteristics of the data being analyzed. This adaptability is particularly valuable in scenarios where a one-size-fits-all approach would fail to capture the subtleties and variations present. By incorporating elements of intra-annotator confidence and inter-annotator stability, the metric gains the ability to distinguish between reliable majority opinions and potentially erroneous or subjective minority viewpoints. Such a design mitigates bias and improves the overall robustness of the analysis. Furthermore, the integration of self-driven mechanisms allows the metric to operate autonomously, reducing the need for manual intervention or external calibration. By identifying and suppressing problematic samples, adaptive metrics contribute to a more accurate and representative understanding of the underlying phenomena.
Suppressing Noise#
Suppressing noise in machine learning models, particularly diffusion models, is crucial for enhancing the quality and reliability of generated outputs. Noise can stem from various sources, including erroneous or subjective annotations in preference datasets. These inaccuracies can mislead the model, causing it to deviate from desired aesthetic and contextual expectations. Effective noise suppression techniques involve identifying and mitigating the impact of problematic data points. This can be achieved through methods like instance-specific reweighting, where noisy samples are assigned lower weights, and adaptive margins, which enhance the supervision from cleaner data. By focusing on reliable data and diminishing the influence of noise, models can achieve more consistent and higher-quality results, aligning better with human preferences and improving overall performance. The robustness of the model is maintained.
IR Metric Boost#
An “IR Metric Boost” heading suggests strategies to improve Information Retrieval metrics. This involves optimizing algorithms to rank relevant results higher, which increases the metrics like precision, recall, and F1-score. Techniques might include enhancing query understanding by adding context awareness and handling ambiguity effectively. Using techniques like pseudo relevance feedback helps the algorithm in incorporating information retrieved from initial search results. The IR system is iteratively refined through methods such as re-ranking based on document understanding and feature importance. It emphasizes the need for appropriate evaluation strategies when changes in search results rankings occurs. All these will enhance the utility and trustworthiness of the system.
Robust to Noise#
The concept of being ‘Robust to Noise’ is critical in machine learning, especially when dealing with real-world data. Noise, in this context, refers to any irrelevant or misleading information that can negatively impact model performance. A model that is robust to noise can effectively filter out or disregard these extraneous elements, leading to more accurate and reliable predictions. Techniques for achieving noise robustness often involve data preprocessing steps like outlier removal or smoothing, as well as the use of algorithms that are inherently less sensitive to noisy inputs. Regularization methods like L1 or L2 regularization can also help by preventing the model from overfitting to the noise present in the training data. Furthermore, ensemble methods, such as bagging or boosting, can improve robustness by combining predictions from multiple models, each trained on a slightly different subset of the data, effectively averaging out the impact of noise. A key challenge is to balance robustness with sensitivity to genuine signals, ensuring that the model doesn’t inadvertently ignore important patterns while filtering out noise.
More visual insights#
More on figures

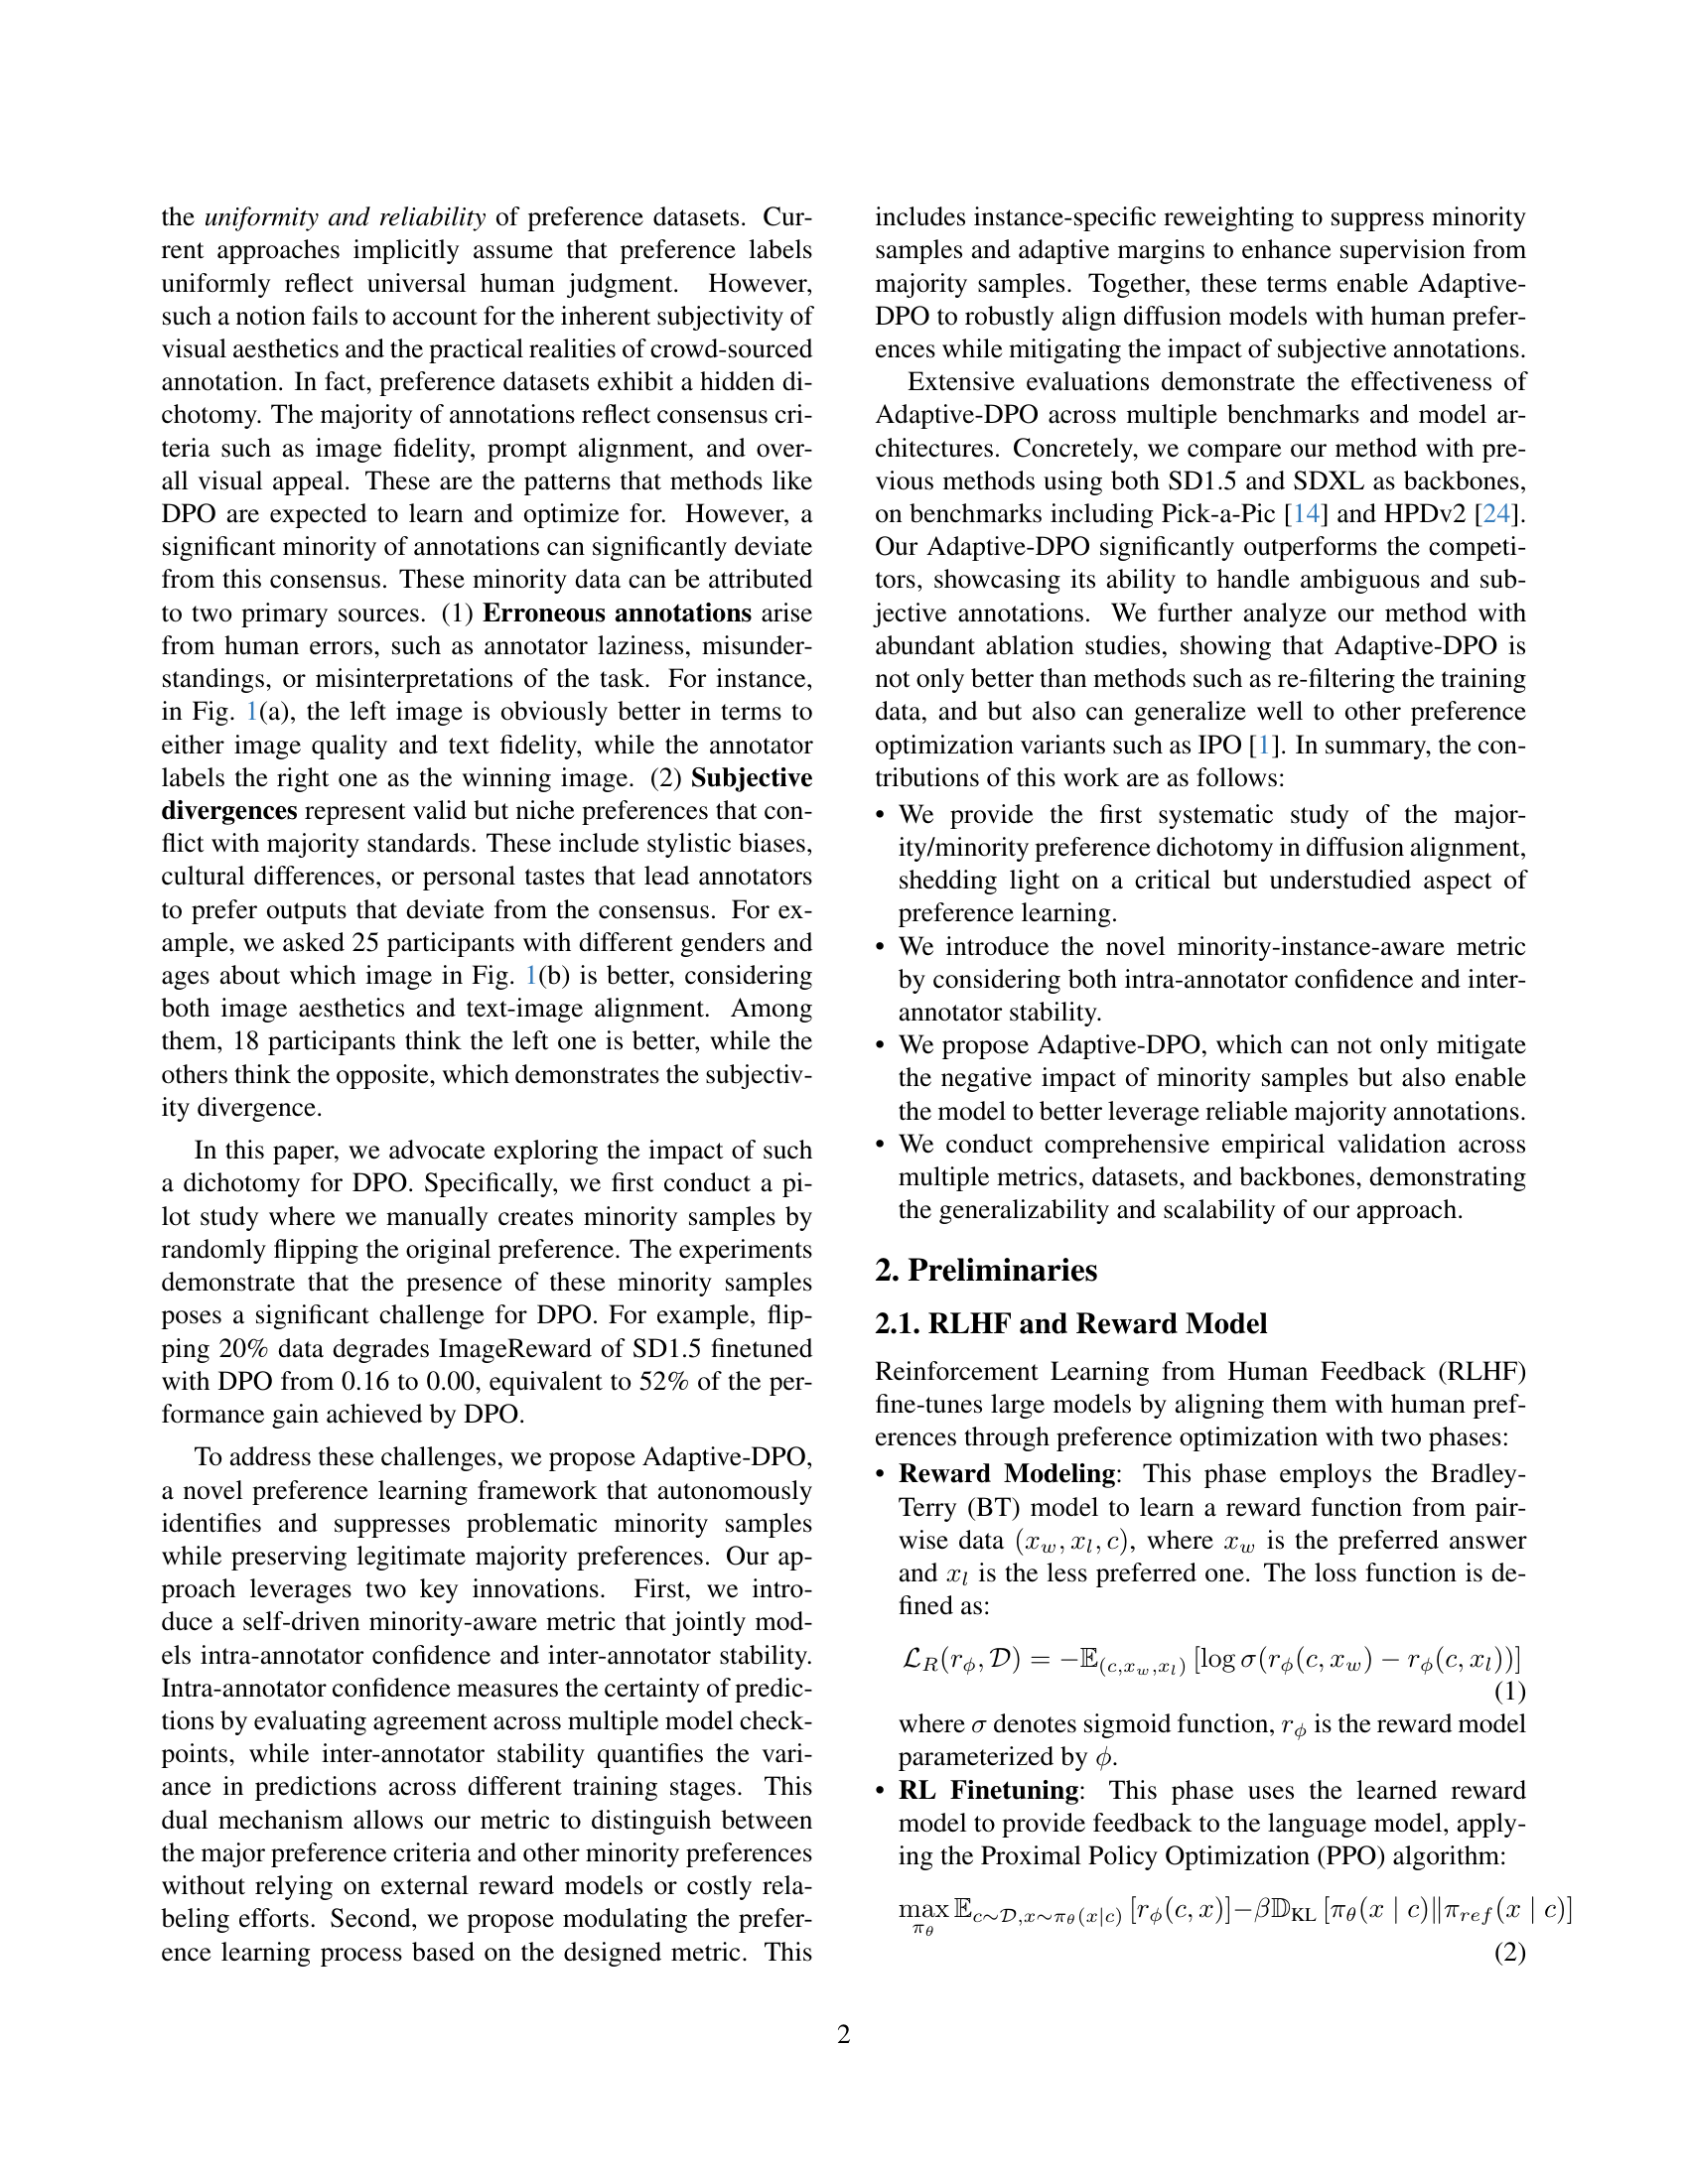
🔼 This figure shows the impact of randomly flipping preference labels (creating synthetic minority samples) on the proportion of majority and minority samples in a dataset. The x-axis represents the percentage of labels flipped (the flip ratio), and the y-axis shows the resulting proportion of minority samples. As the flip ratio increases, the proportion of minority samples increases accordingly, demonstrating a clear relationship between the amount of label flipping and the imbalance introduced into the dataset.
read the caption
Figure 2: Proportion of majority/minority at different flip ratios.

🔼 This table presents the results of Diffusion-DPO experiments conducted with varying levels of synthetic noise added to the training data. The noise was introduced by randomly flipping the preference labels (winning/losing images) in a percentage of the dataset (0%, 10%, 20%, 30%). The table shows how different metrics, including ImageReward (IR), PickScore (PS), Aesthetic Score (Aes), and HPS, are affected by the introduction of this synthetic noise. Higher scores indicate better model performance. The experiment was done on two different diffusion models: SD1.5 and SDXL.
read the caption
Table 1: DPO results with different noise level. Larger metric, better performance.

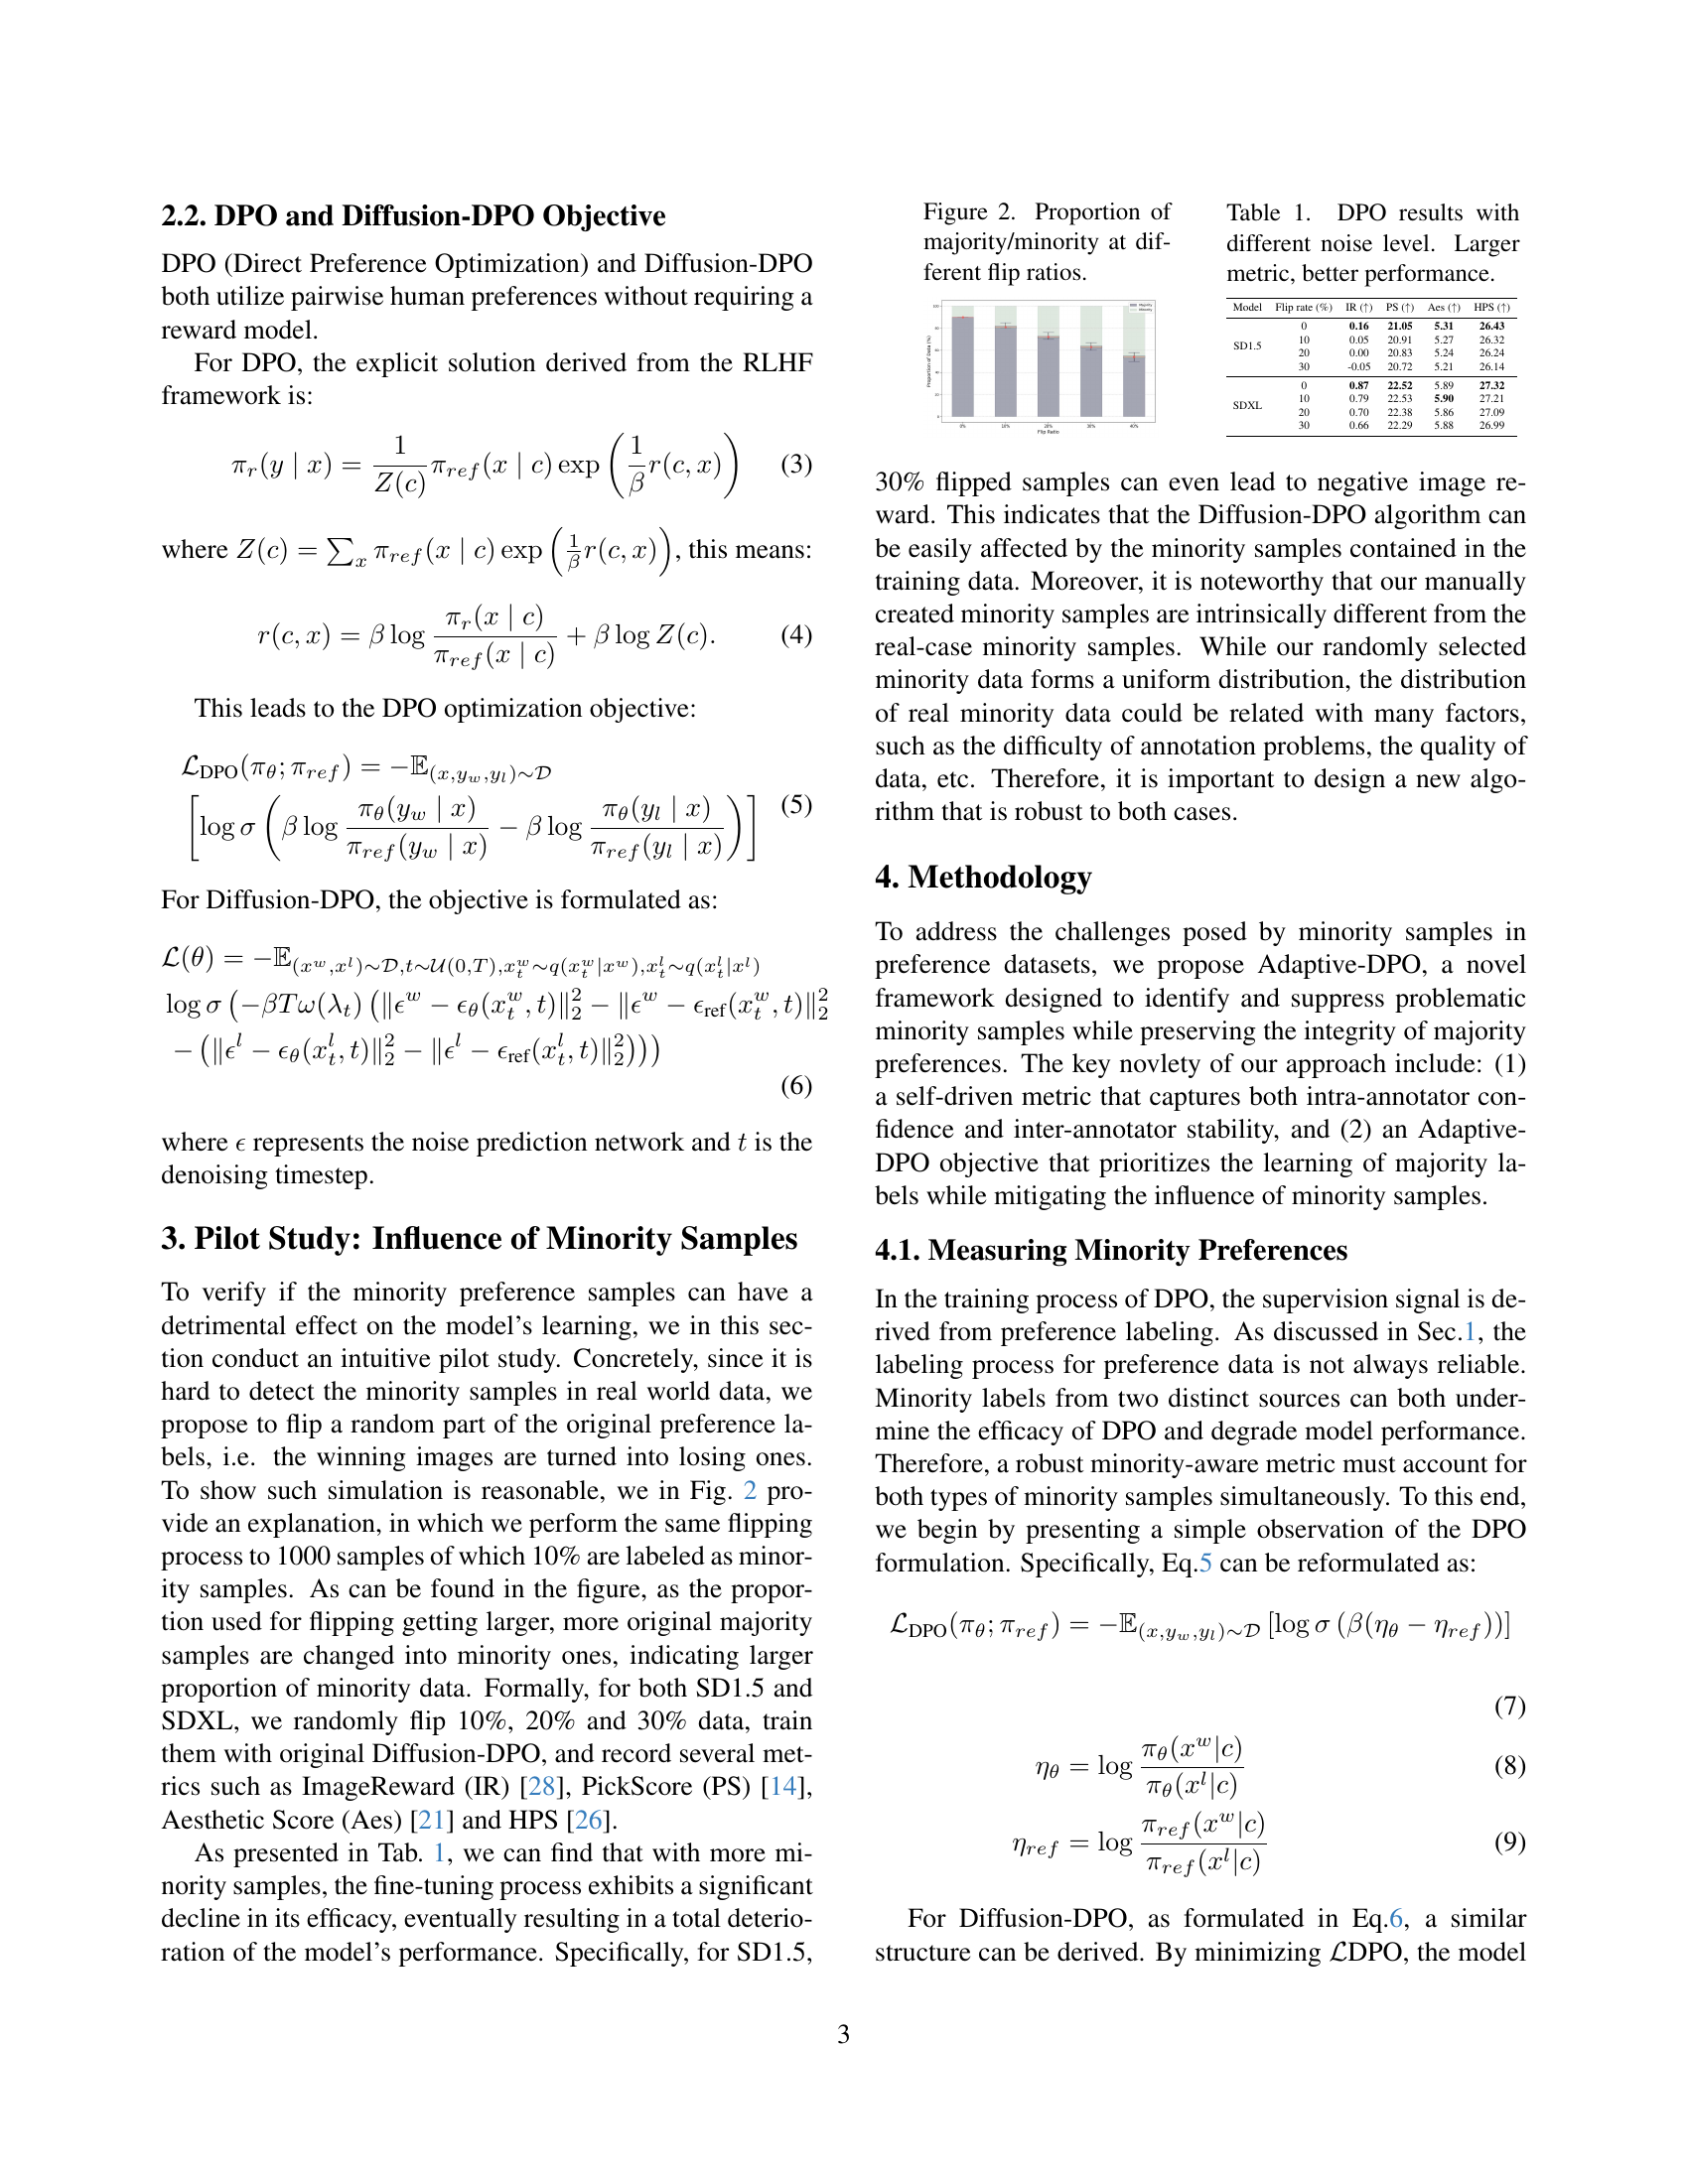
🔼 This figure demonstrates the effectiveness of the proposed minority-instance-aware metric (Eq. 13) in identifying minority samples. By randomly flipping 20% of the labels in the Pick-a-Pic v2 dataset and calculating the metric for each sample, the figure shows a strong positive correlation between the metric value and the proportion of flipped (noisy) samples. Higher metric values indicate a greater likelihood of a sample being a minority instance, confirming the metric’s ability to distinguish between majority and minority preferences.
read the caption
Figure 3: Here, we add 20% label flip to Pick-a-Pic v2 [14] and calculate the metric according to Eq. 13. The x axis denotes the interval of the metric and the y axis denote the ratio of noisy samples. We can observes a significant increase of flipped sample ratio as the increase of the metric value.

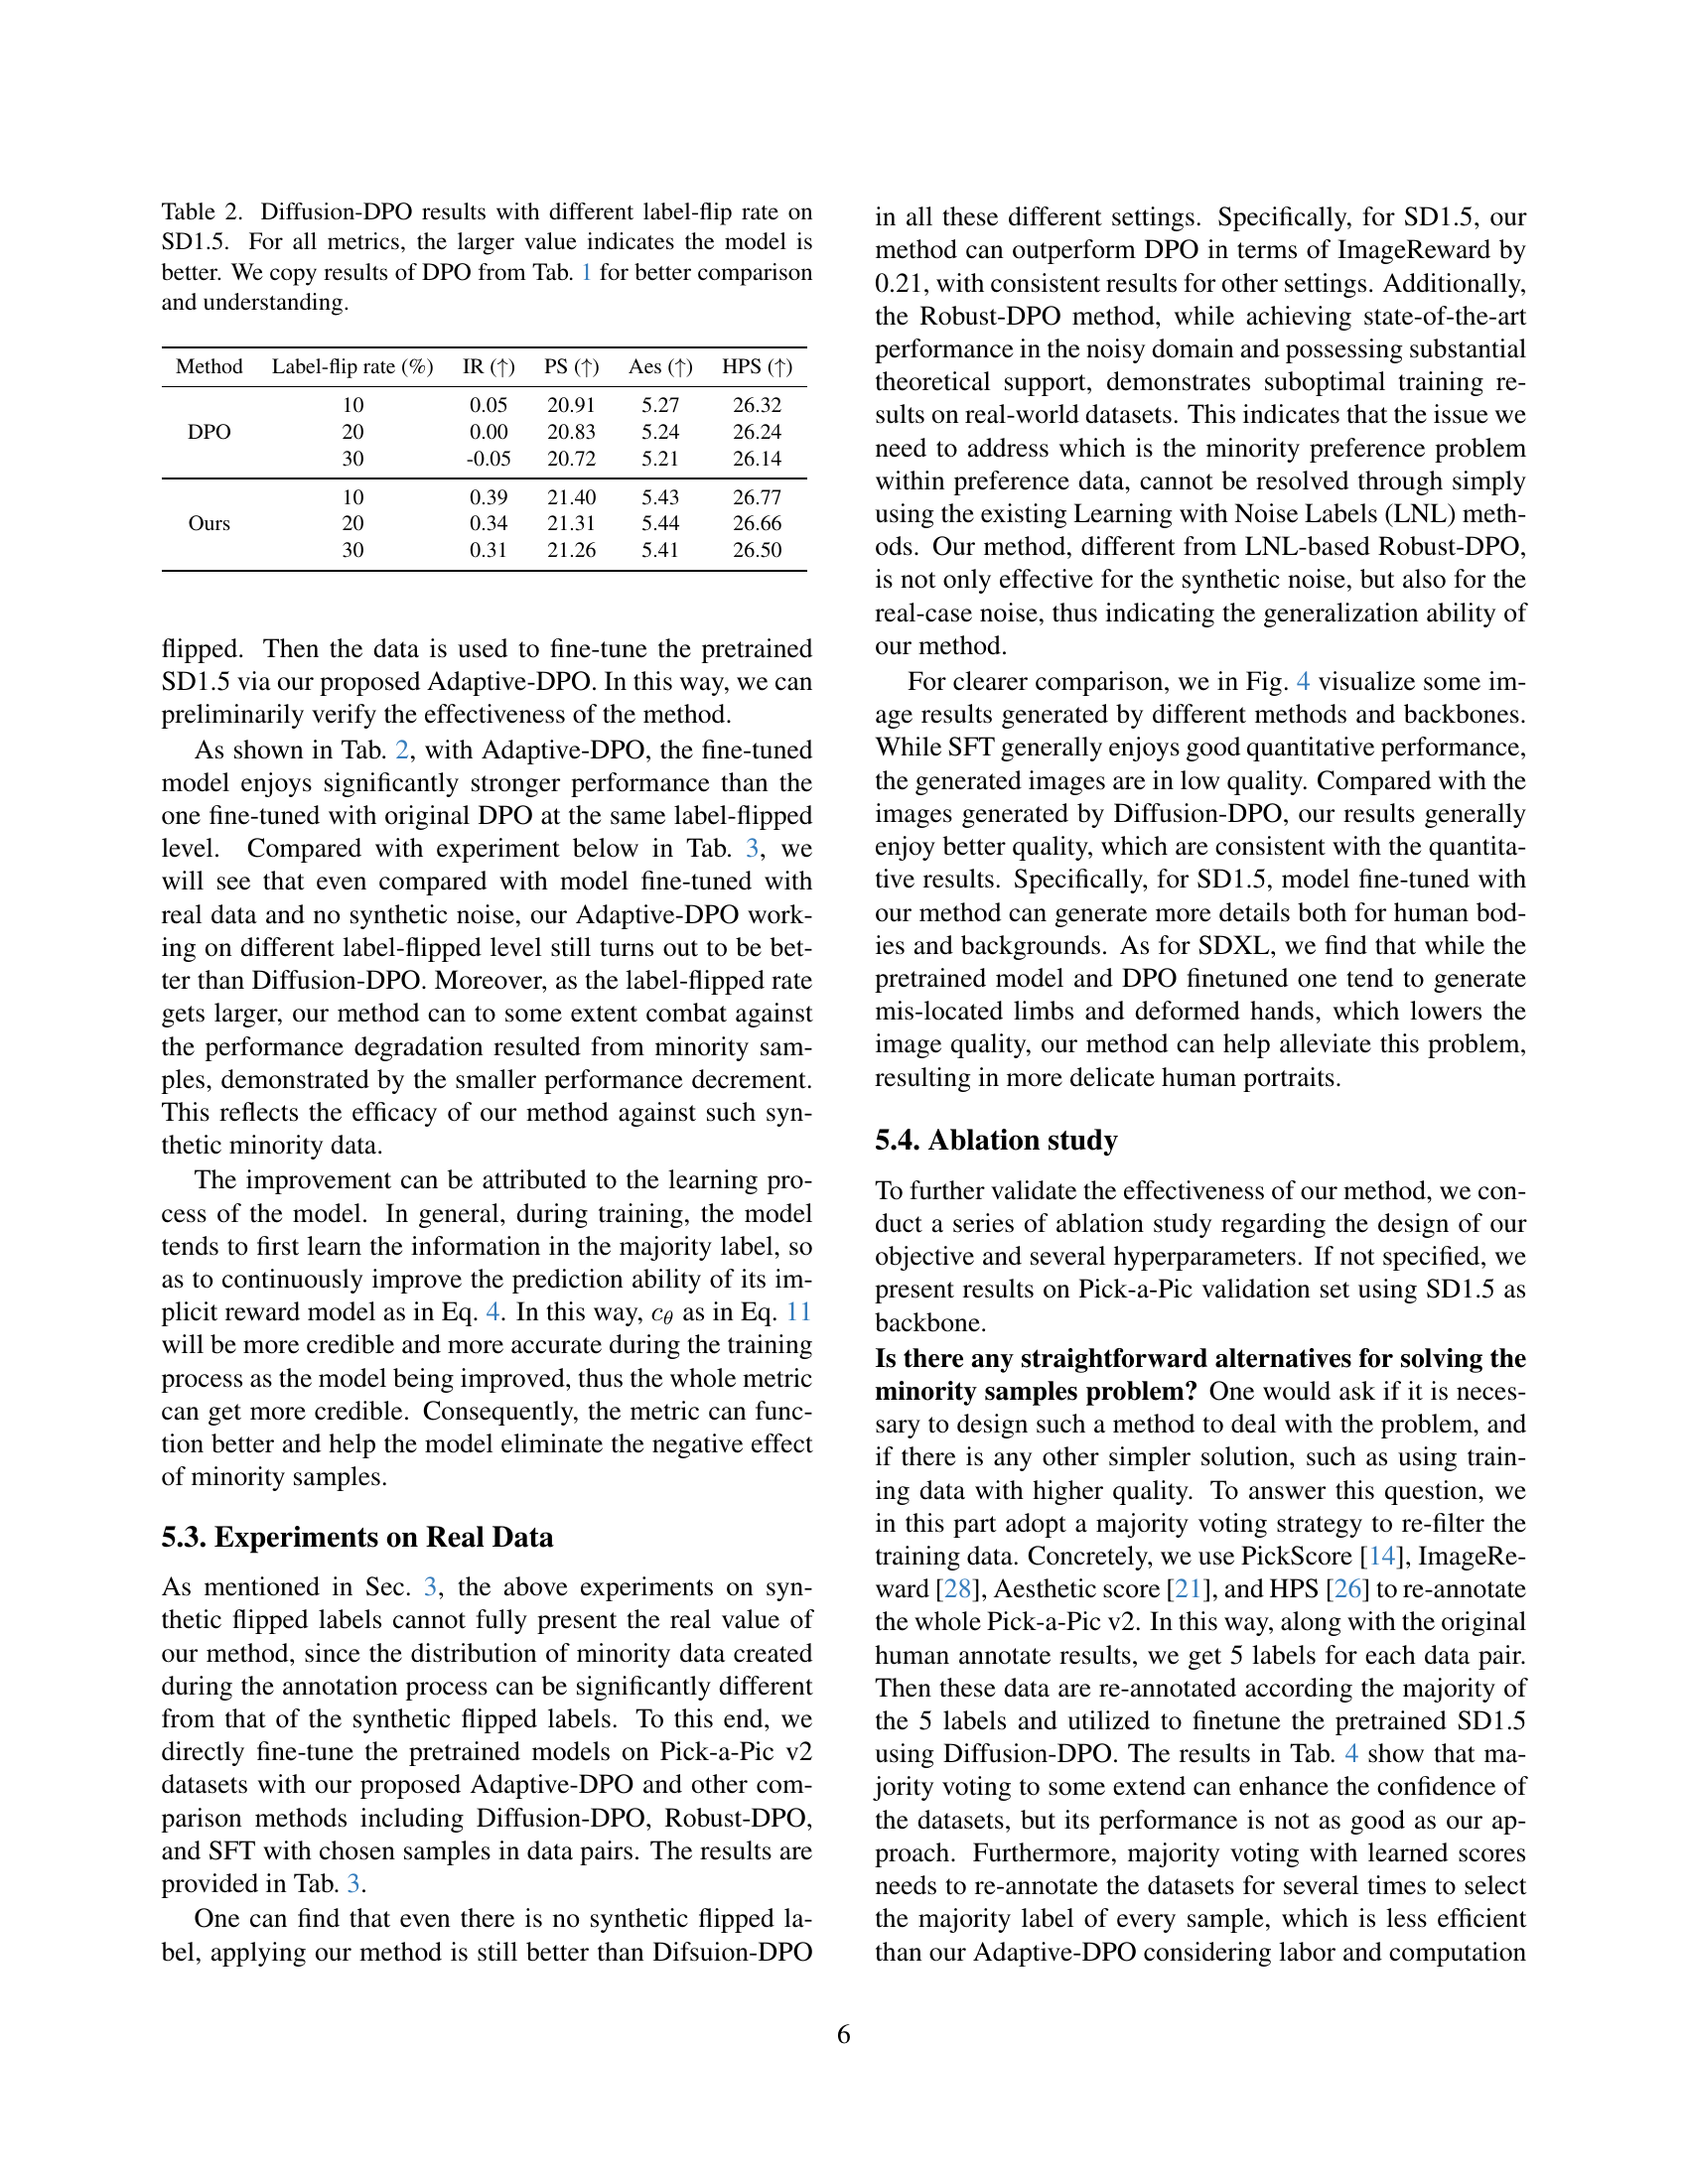
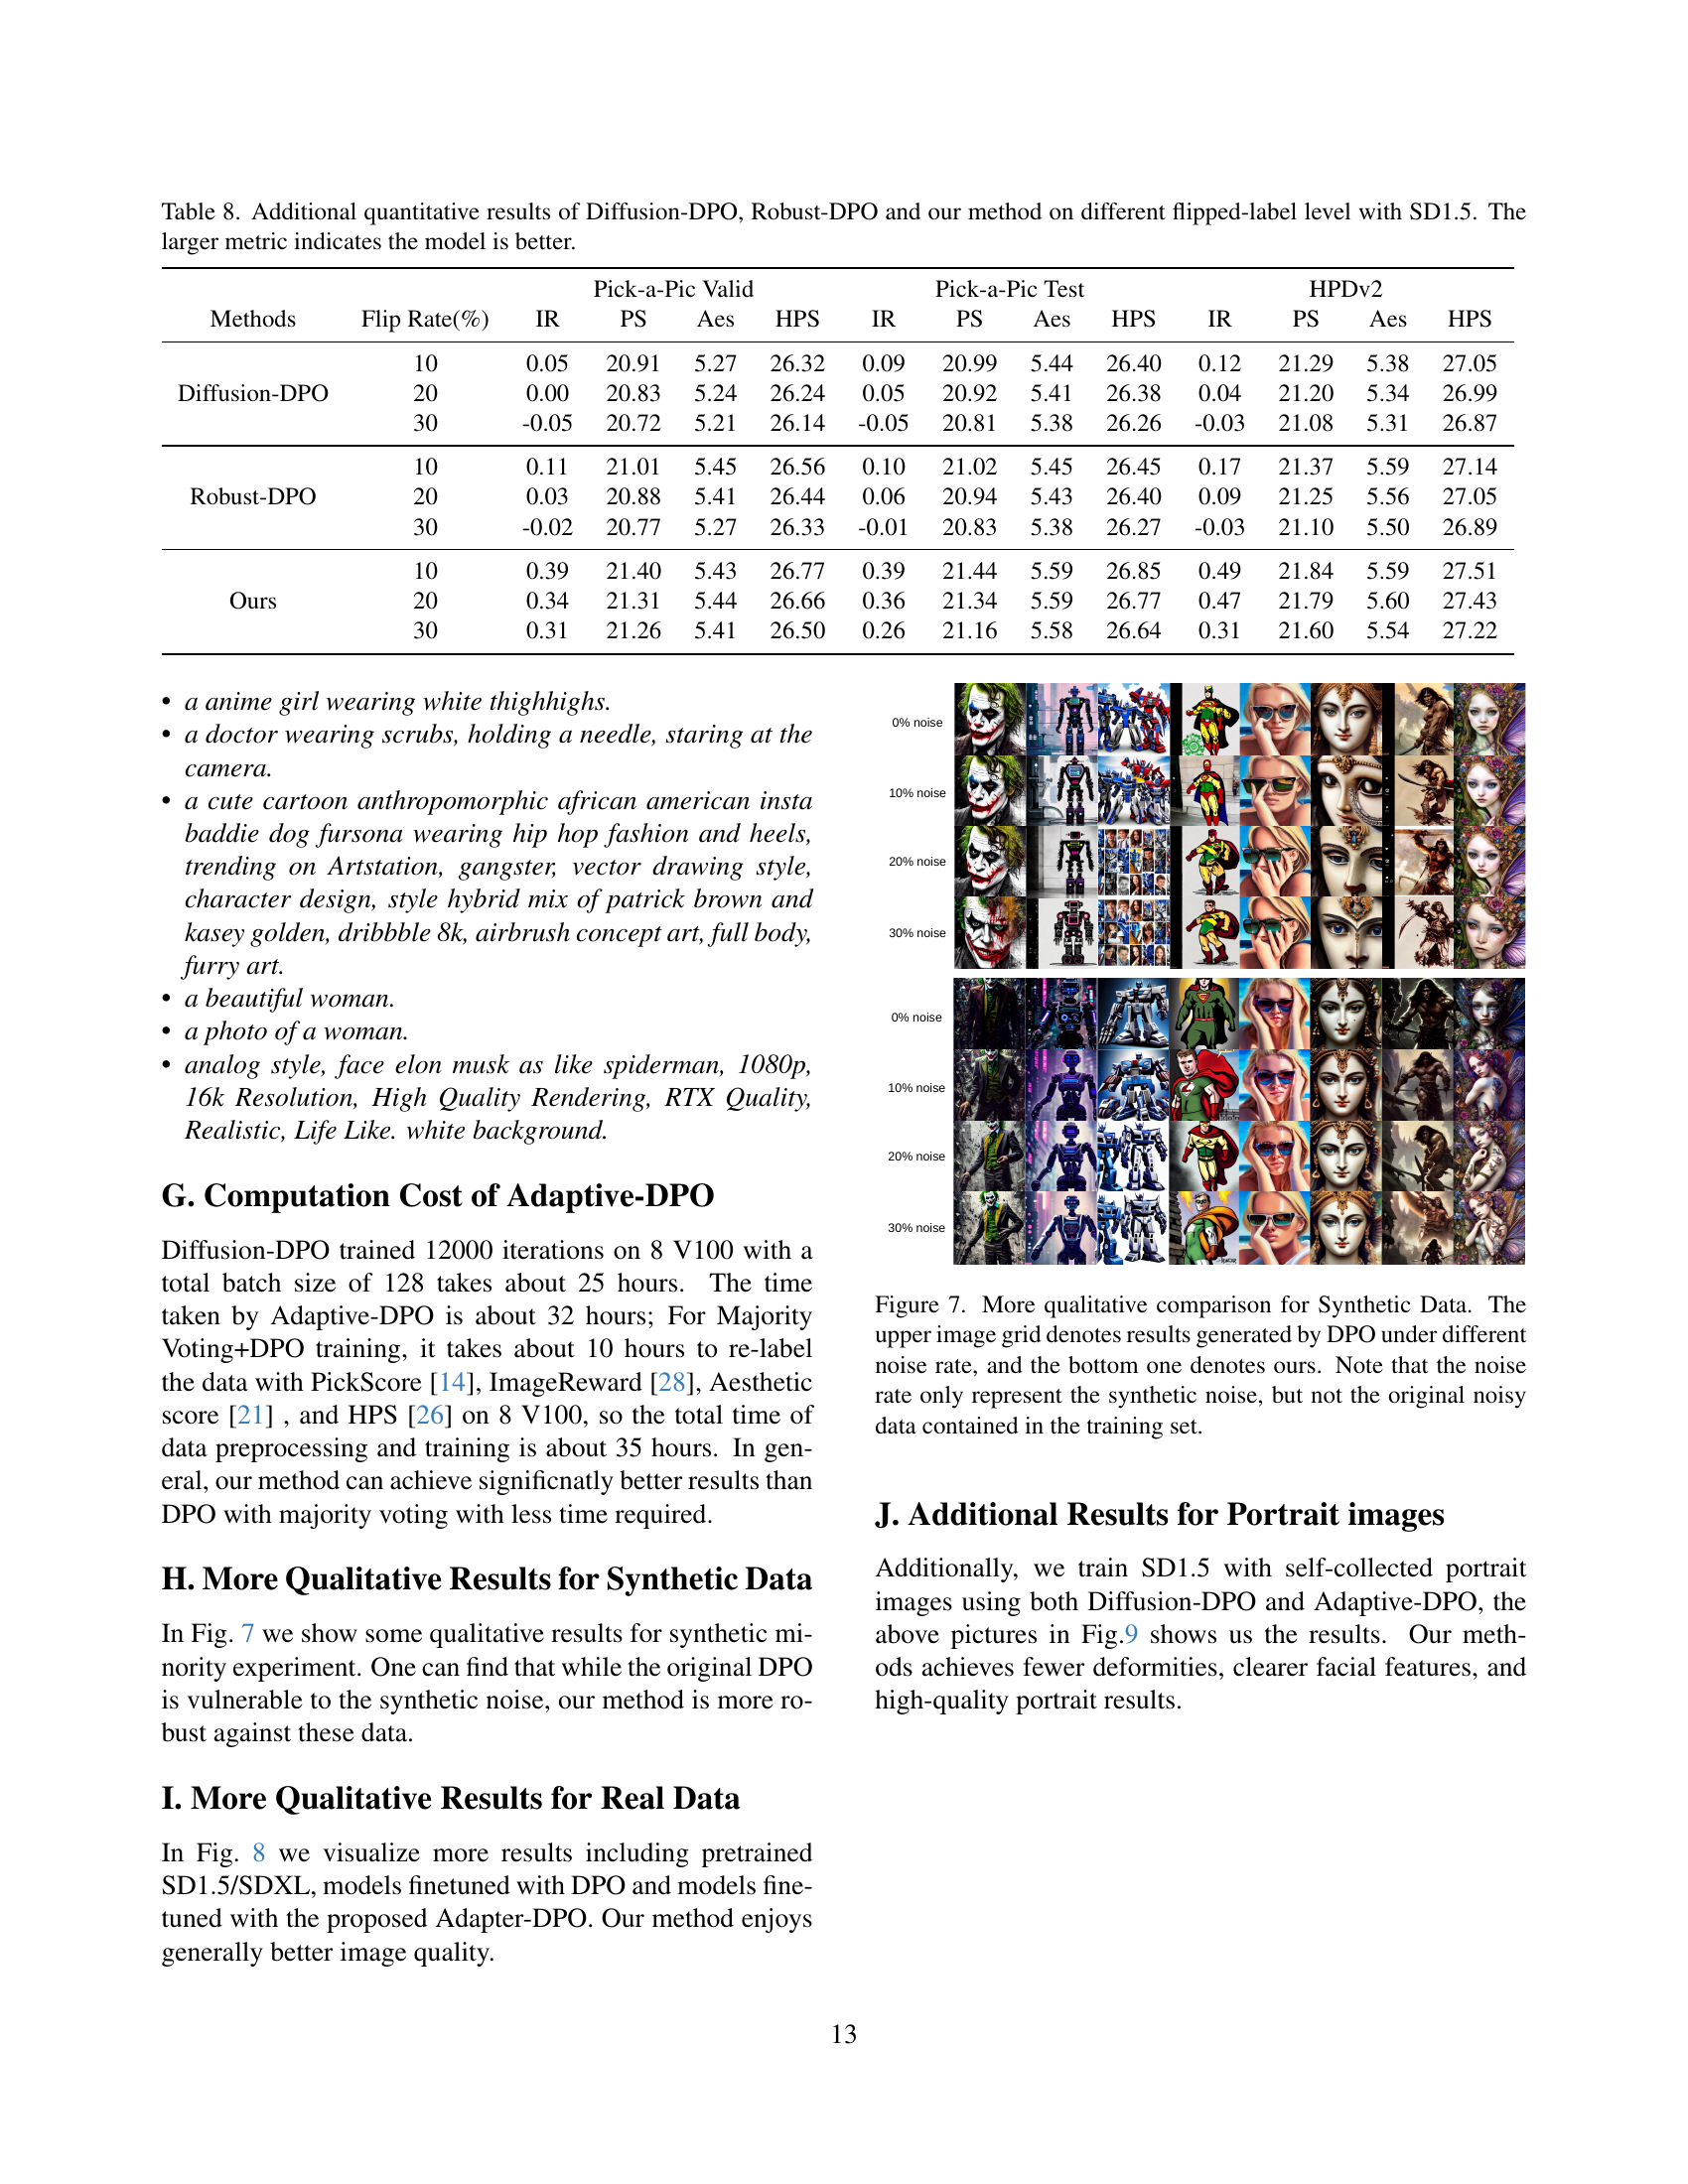
🔼 This table presents a comparison of the performance of Diffusion-DPO and the proposed Adaptive-DPO method on the SD1.5 model under varying levels of artificially introduced noise (label flipping). The noise is simulated by randomly changing a percentage of the original preference labels in the training data. The table shows the ImageReward (IR), PickScore (PS), Aesthetic Score (Aes), and HPS metrics for both methods at label flip rates of 10%, 20%, and 30%. Higher scores indicate better performance. The DPO results from Table 1 are included for easier comparison, providing a baseline against which the effectiveness of Adaptive-DPO in mitigating the negative effects of noisy labels can be assessed.
read the caption
Table 2: Diffusion-DPO results with different label-flip rate on SD1.5. For all metrics, the larger value indicates the model is better. We copy results of DPO from Tab. 1 for better comparison and understanding.

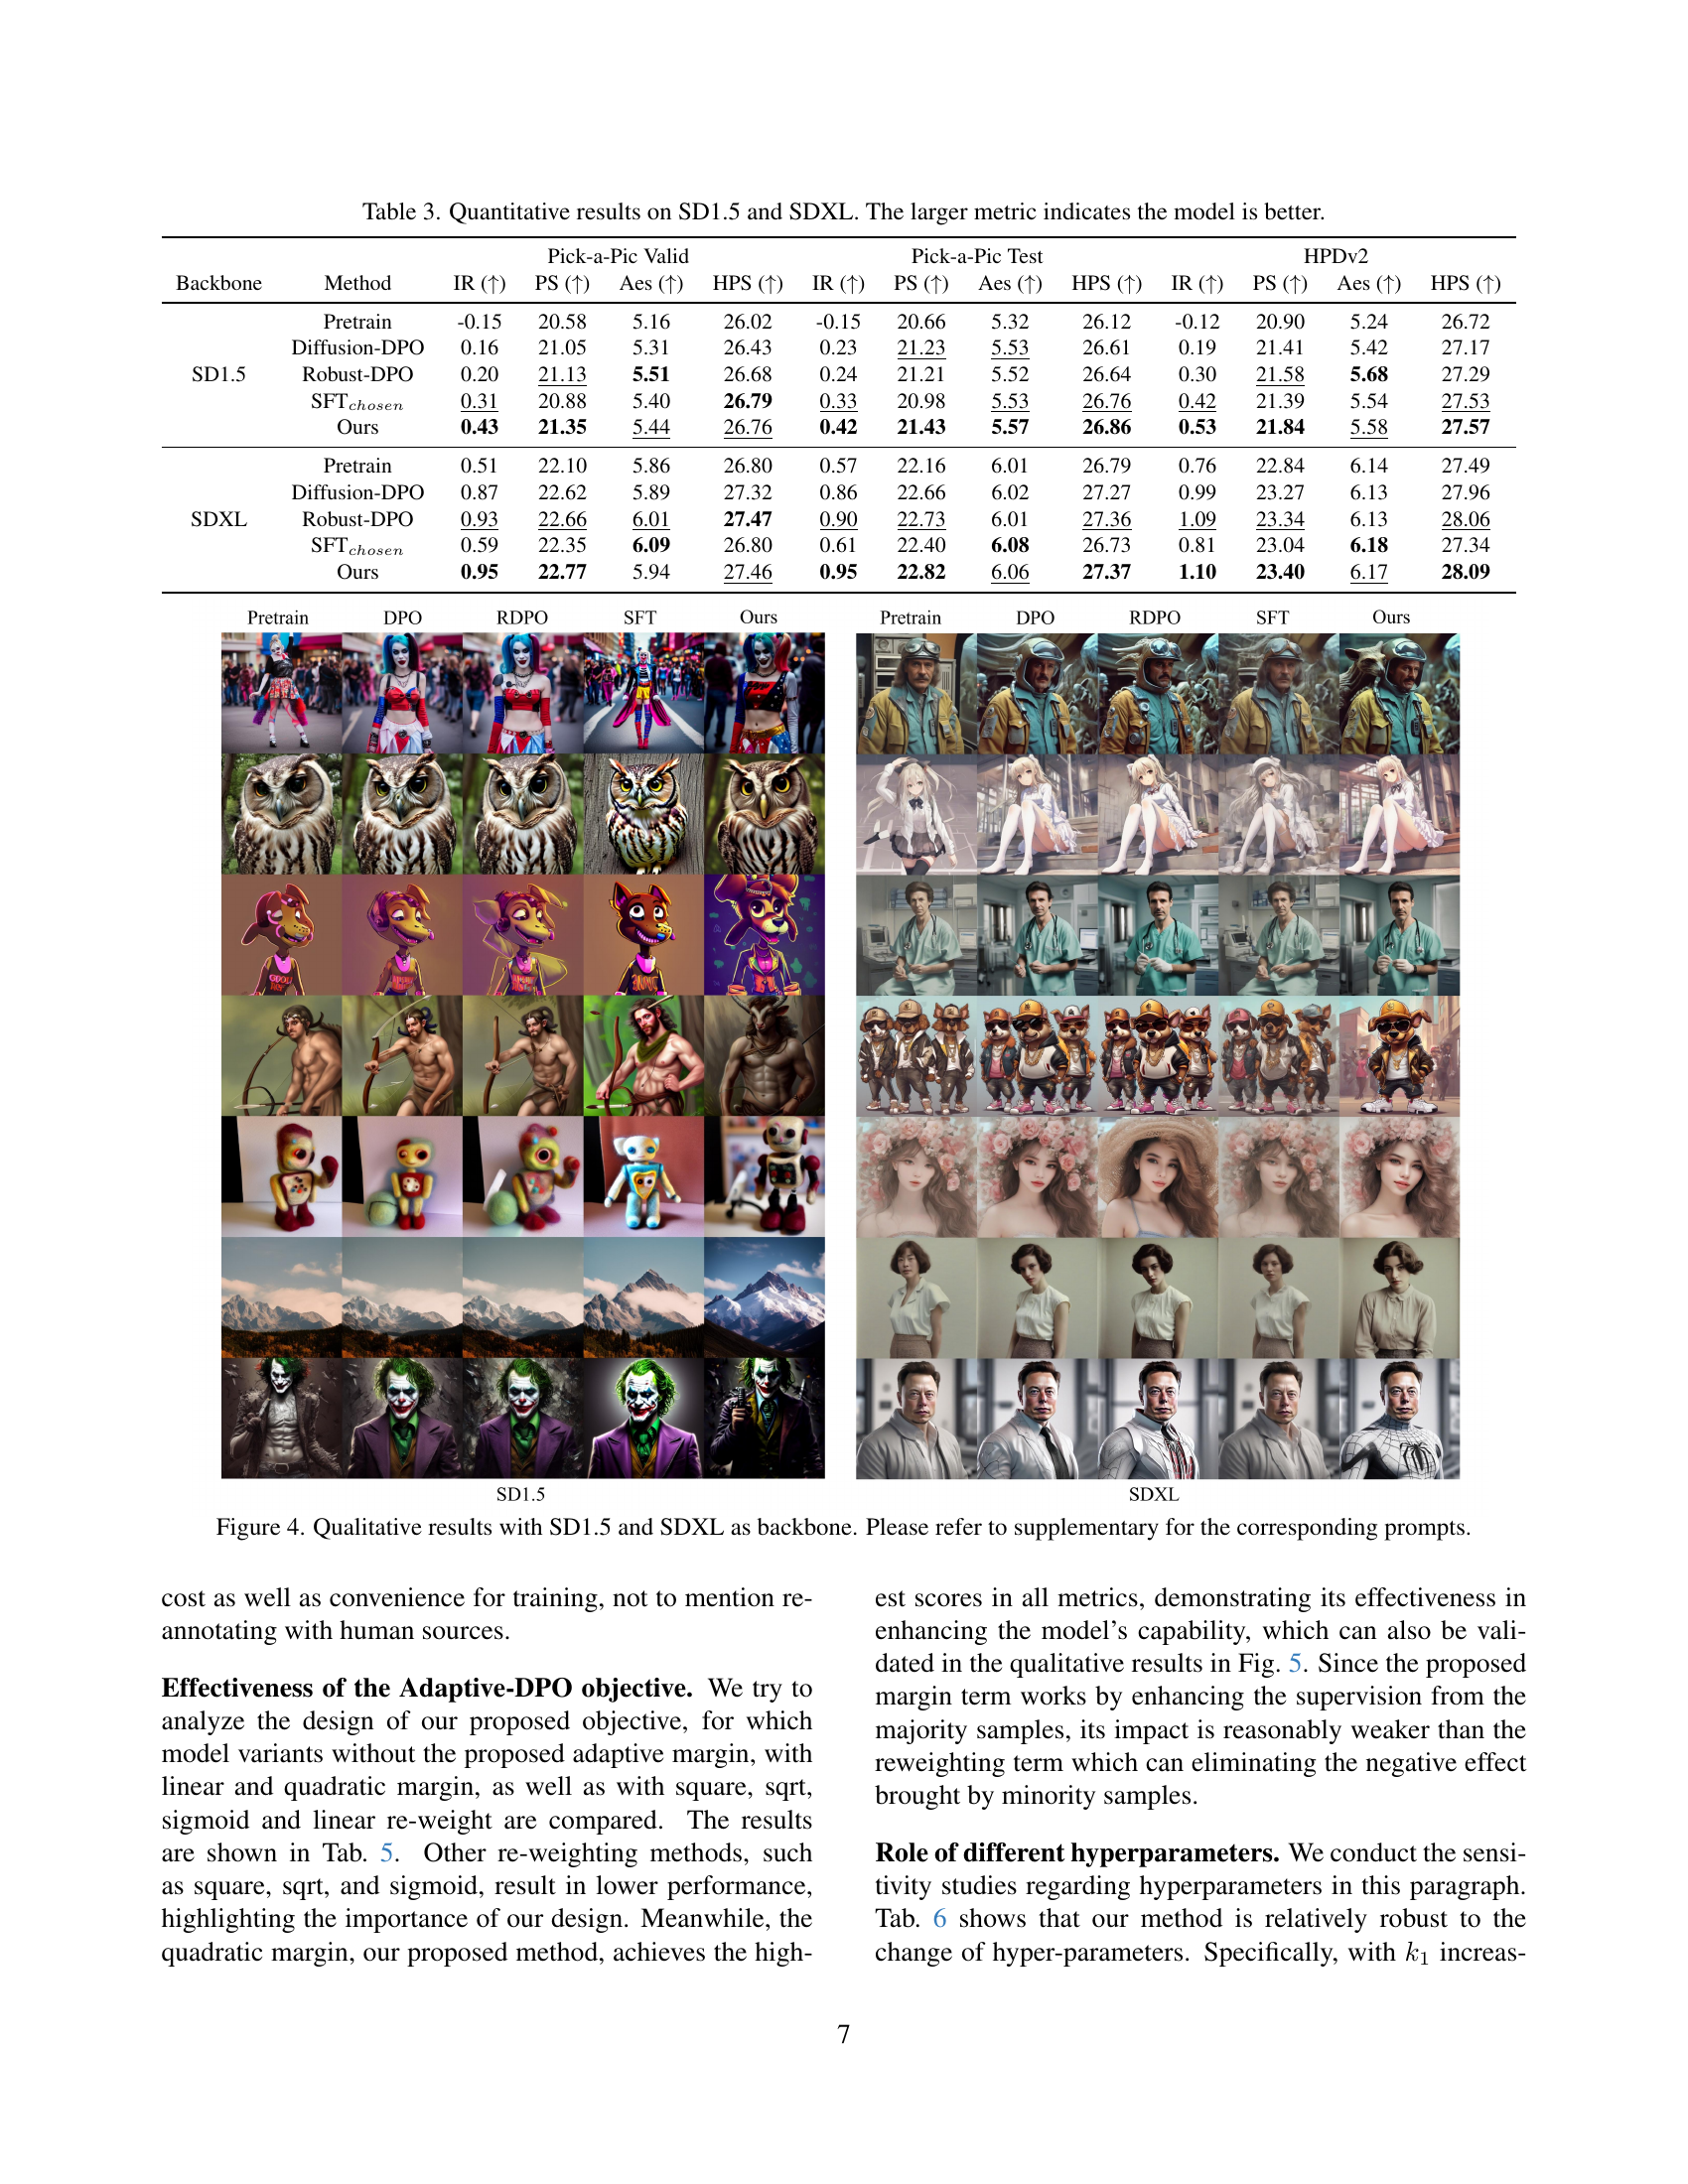
🔼 This table presents a quantitative comparison of different models (Diffusion-DPO, Robust-DPO, SFT (Supervised Fine-Tuning), and the proposed Adaptive-DPO) trained on two different diffusion model architectures, SD1.5 and SDXL. The evaluation metrics used are ImageReward (IR), PickScore (PS), Aesthetic Score (Aes), and HPS (Human Preference Score). Higher scores indicate better model performance, reflecting the model’s ability to align with human preferences in image generation. The results show the performance of each model on three datasets: Pick-a-Pic validation set, Pick-a-Pic test set, and HPDv2.
read the caption
Table 3: Quantitative results on SD1.5 and SDXL. The larger metric indicates the model is better.

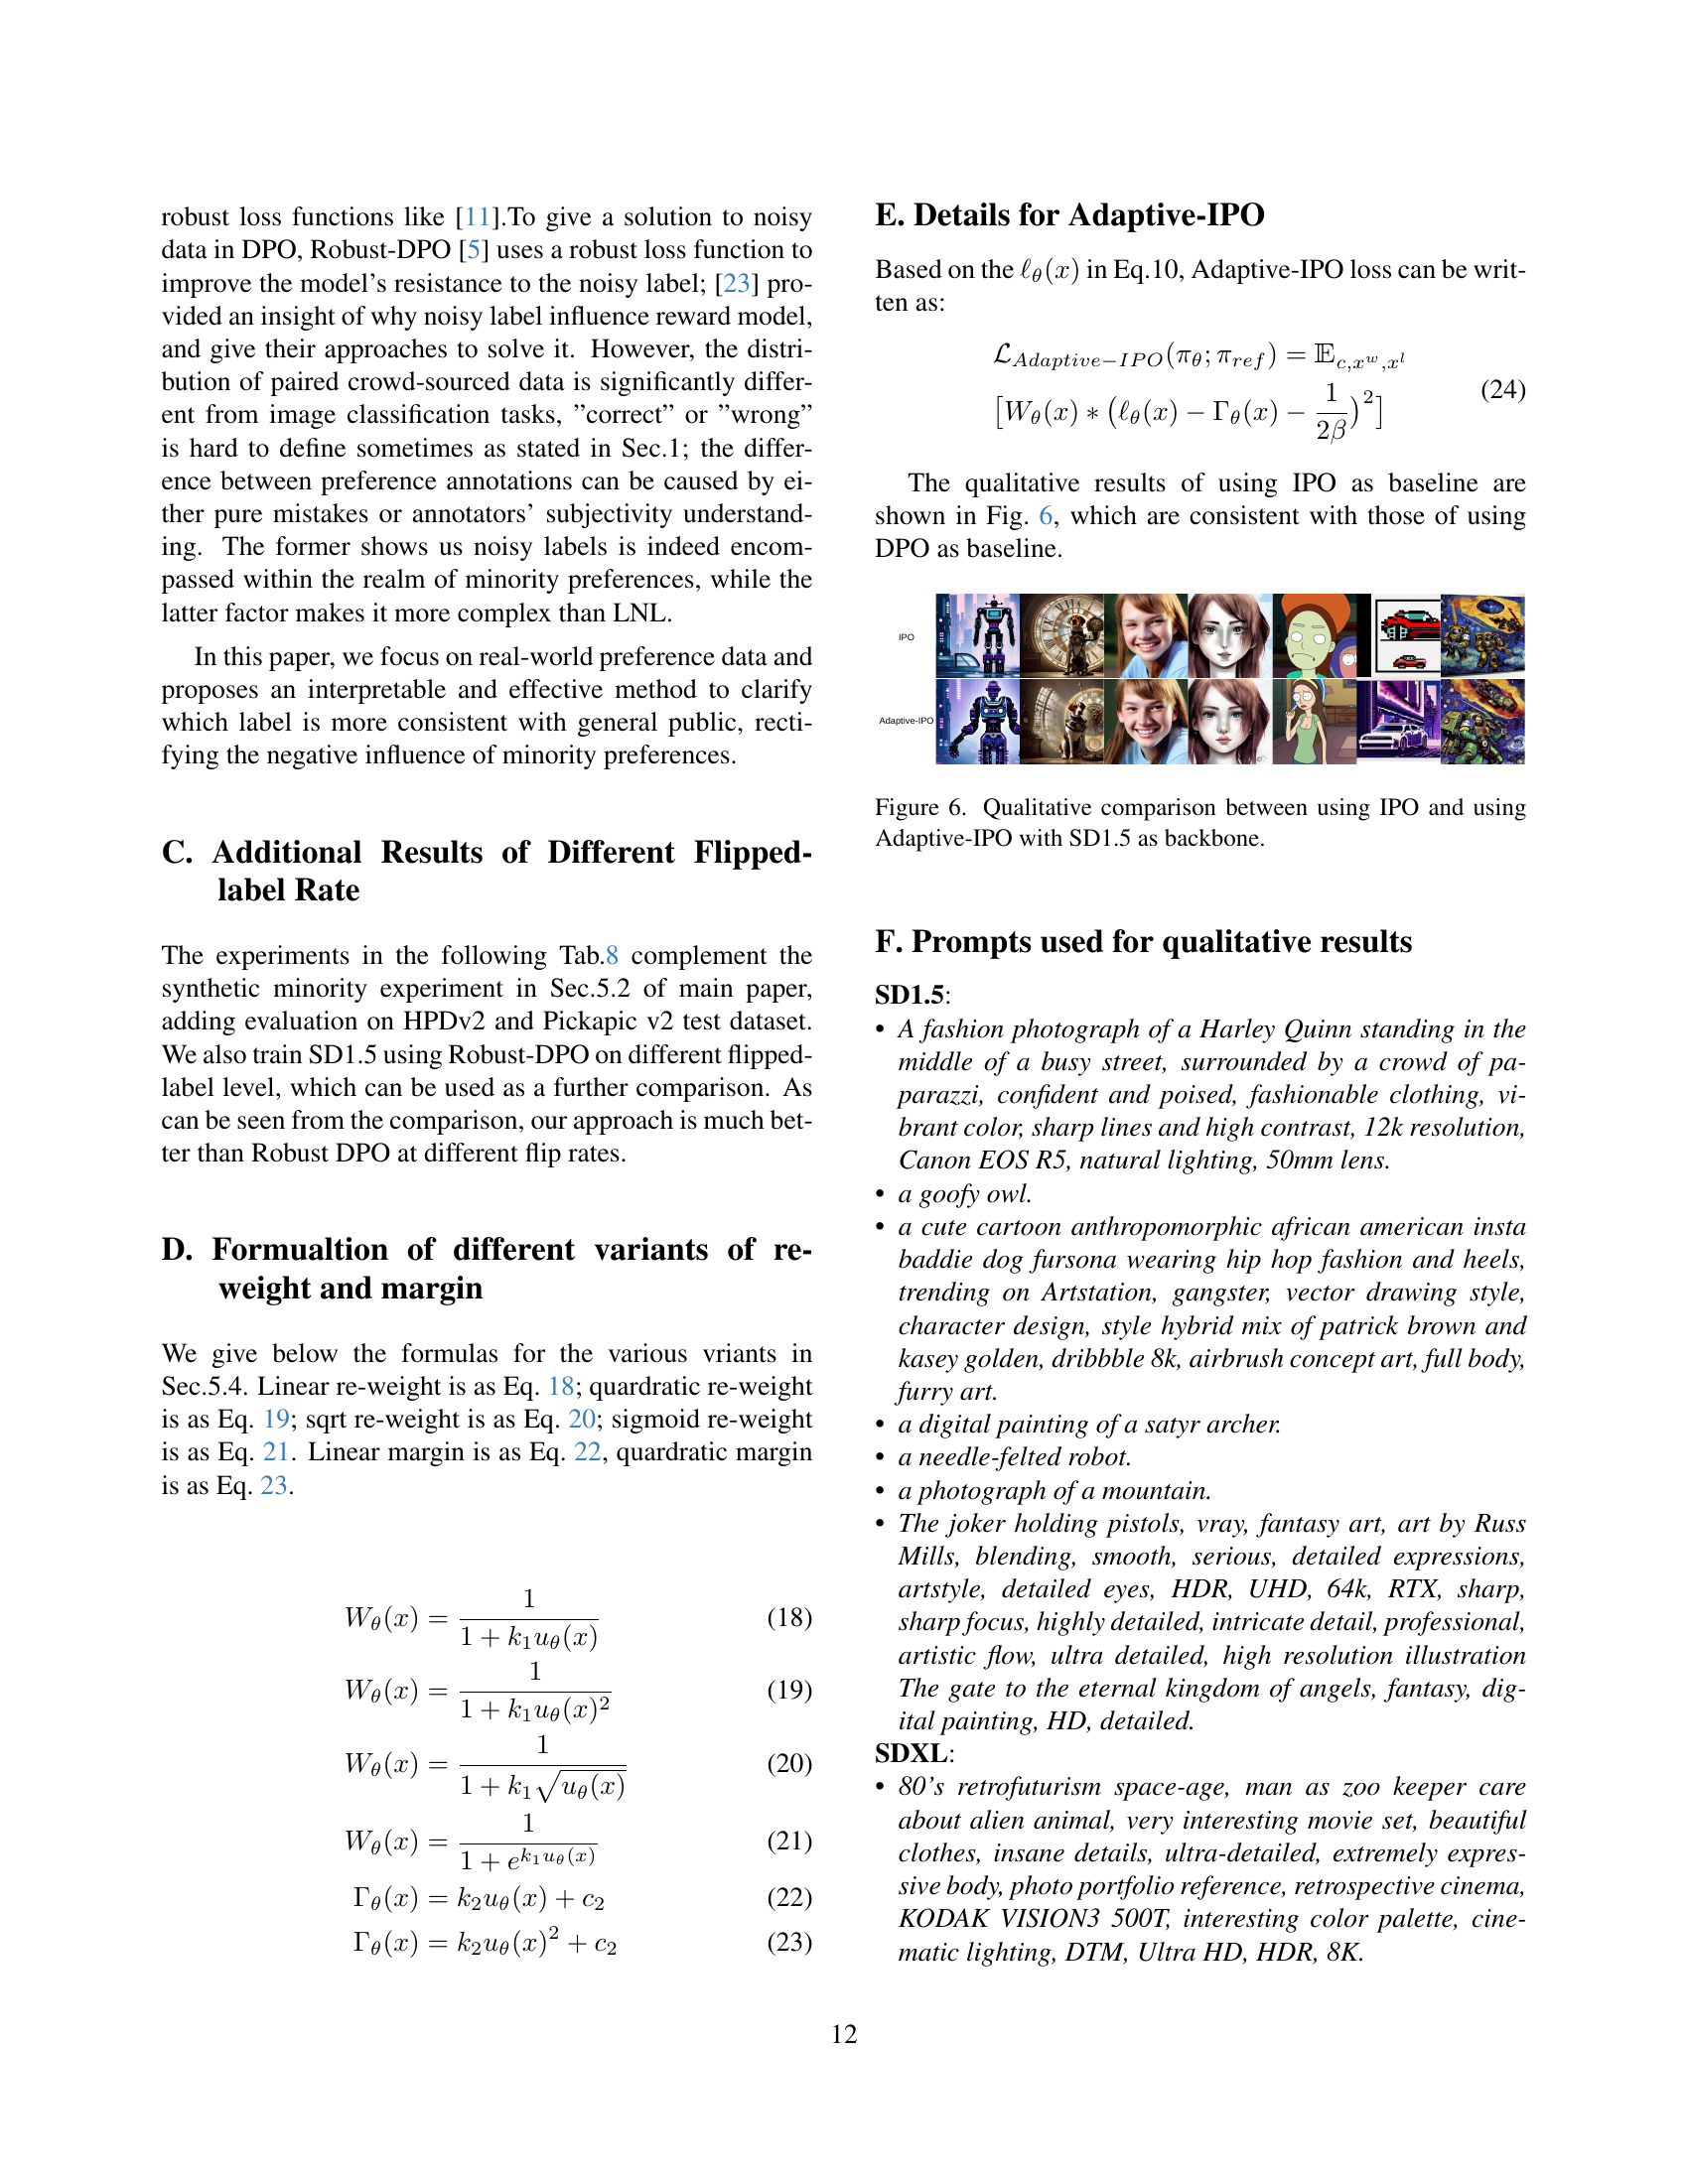
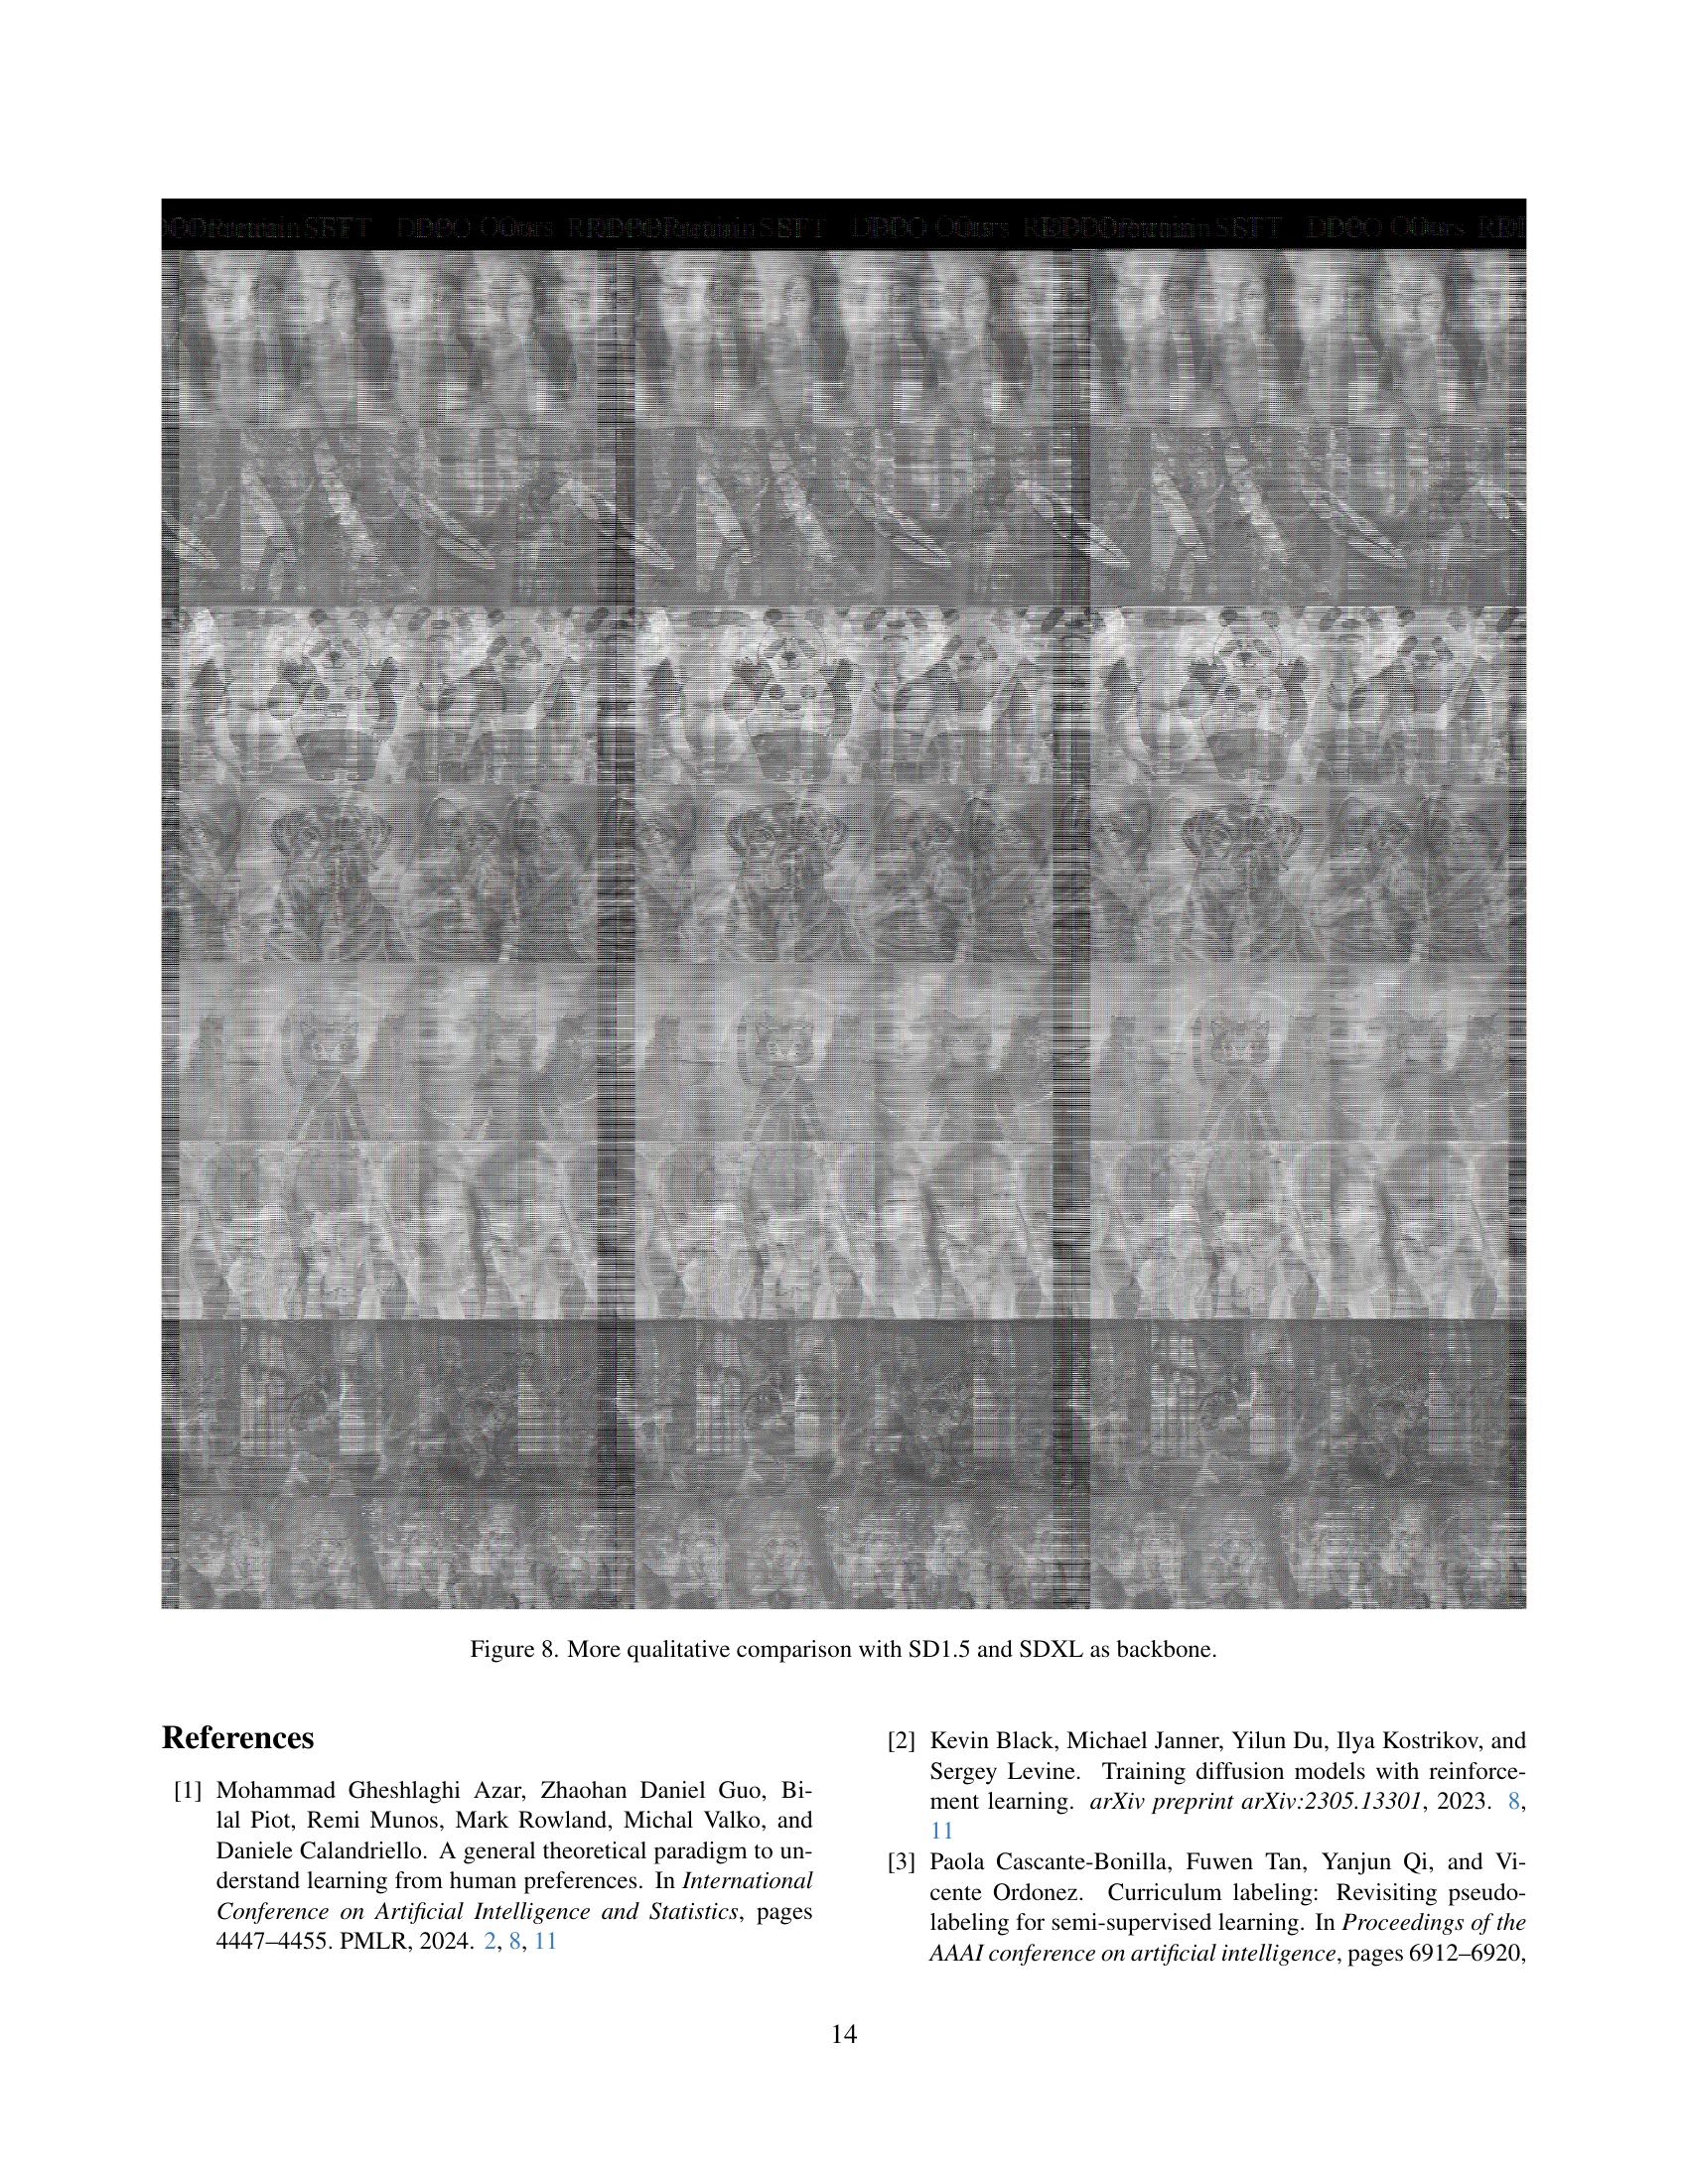
🔼 This figure showcases the qualitative results of image generation using two different diffusion models: Stable Diffusion 1.5 (SD1.5) and Stable Diffusion XL (SDXL). The images were generated using three different methods: the original Diffusion-DPO method, a Robust-DPO approach, and the novel Adaptive-DPO method proposed in the paper. The figure visually compares the image quality and detail produced by each method, demonstrating the effectiveness of the proposed Adaptive-DPO approach in generating higher quality images. Specific prompts used to generate these images can be found in the supplementary materials of the paper.
read the caption
Figure 4: Qualitative results with SD1.5 and SDXL as backbone. Please refer to supplementary for the corresponding prompts.

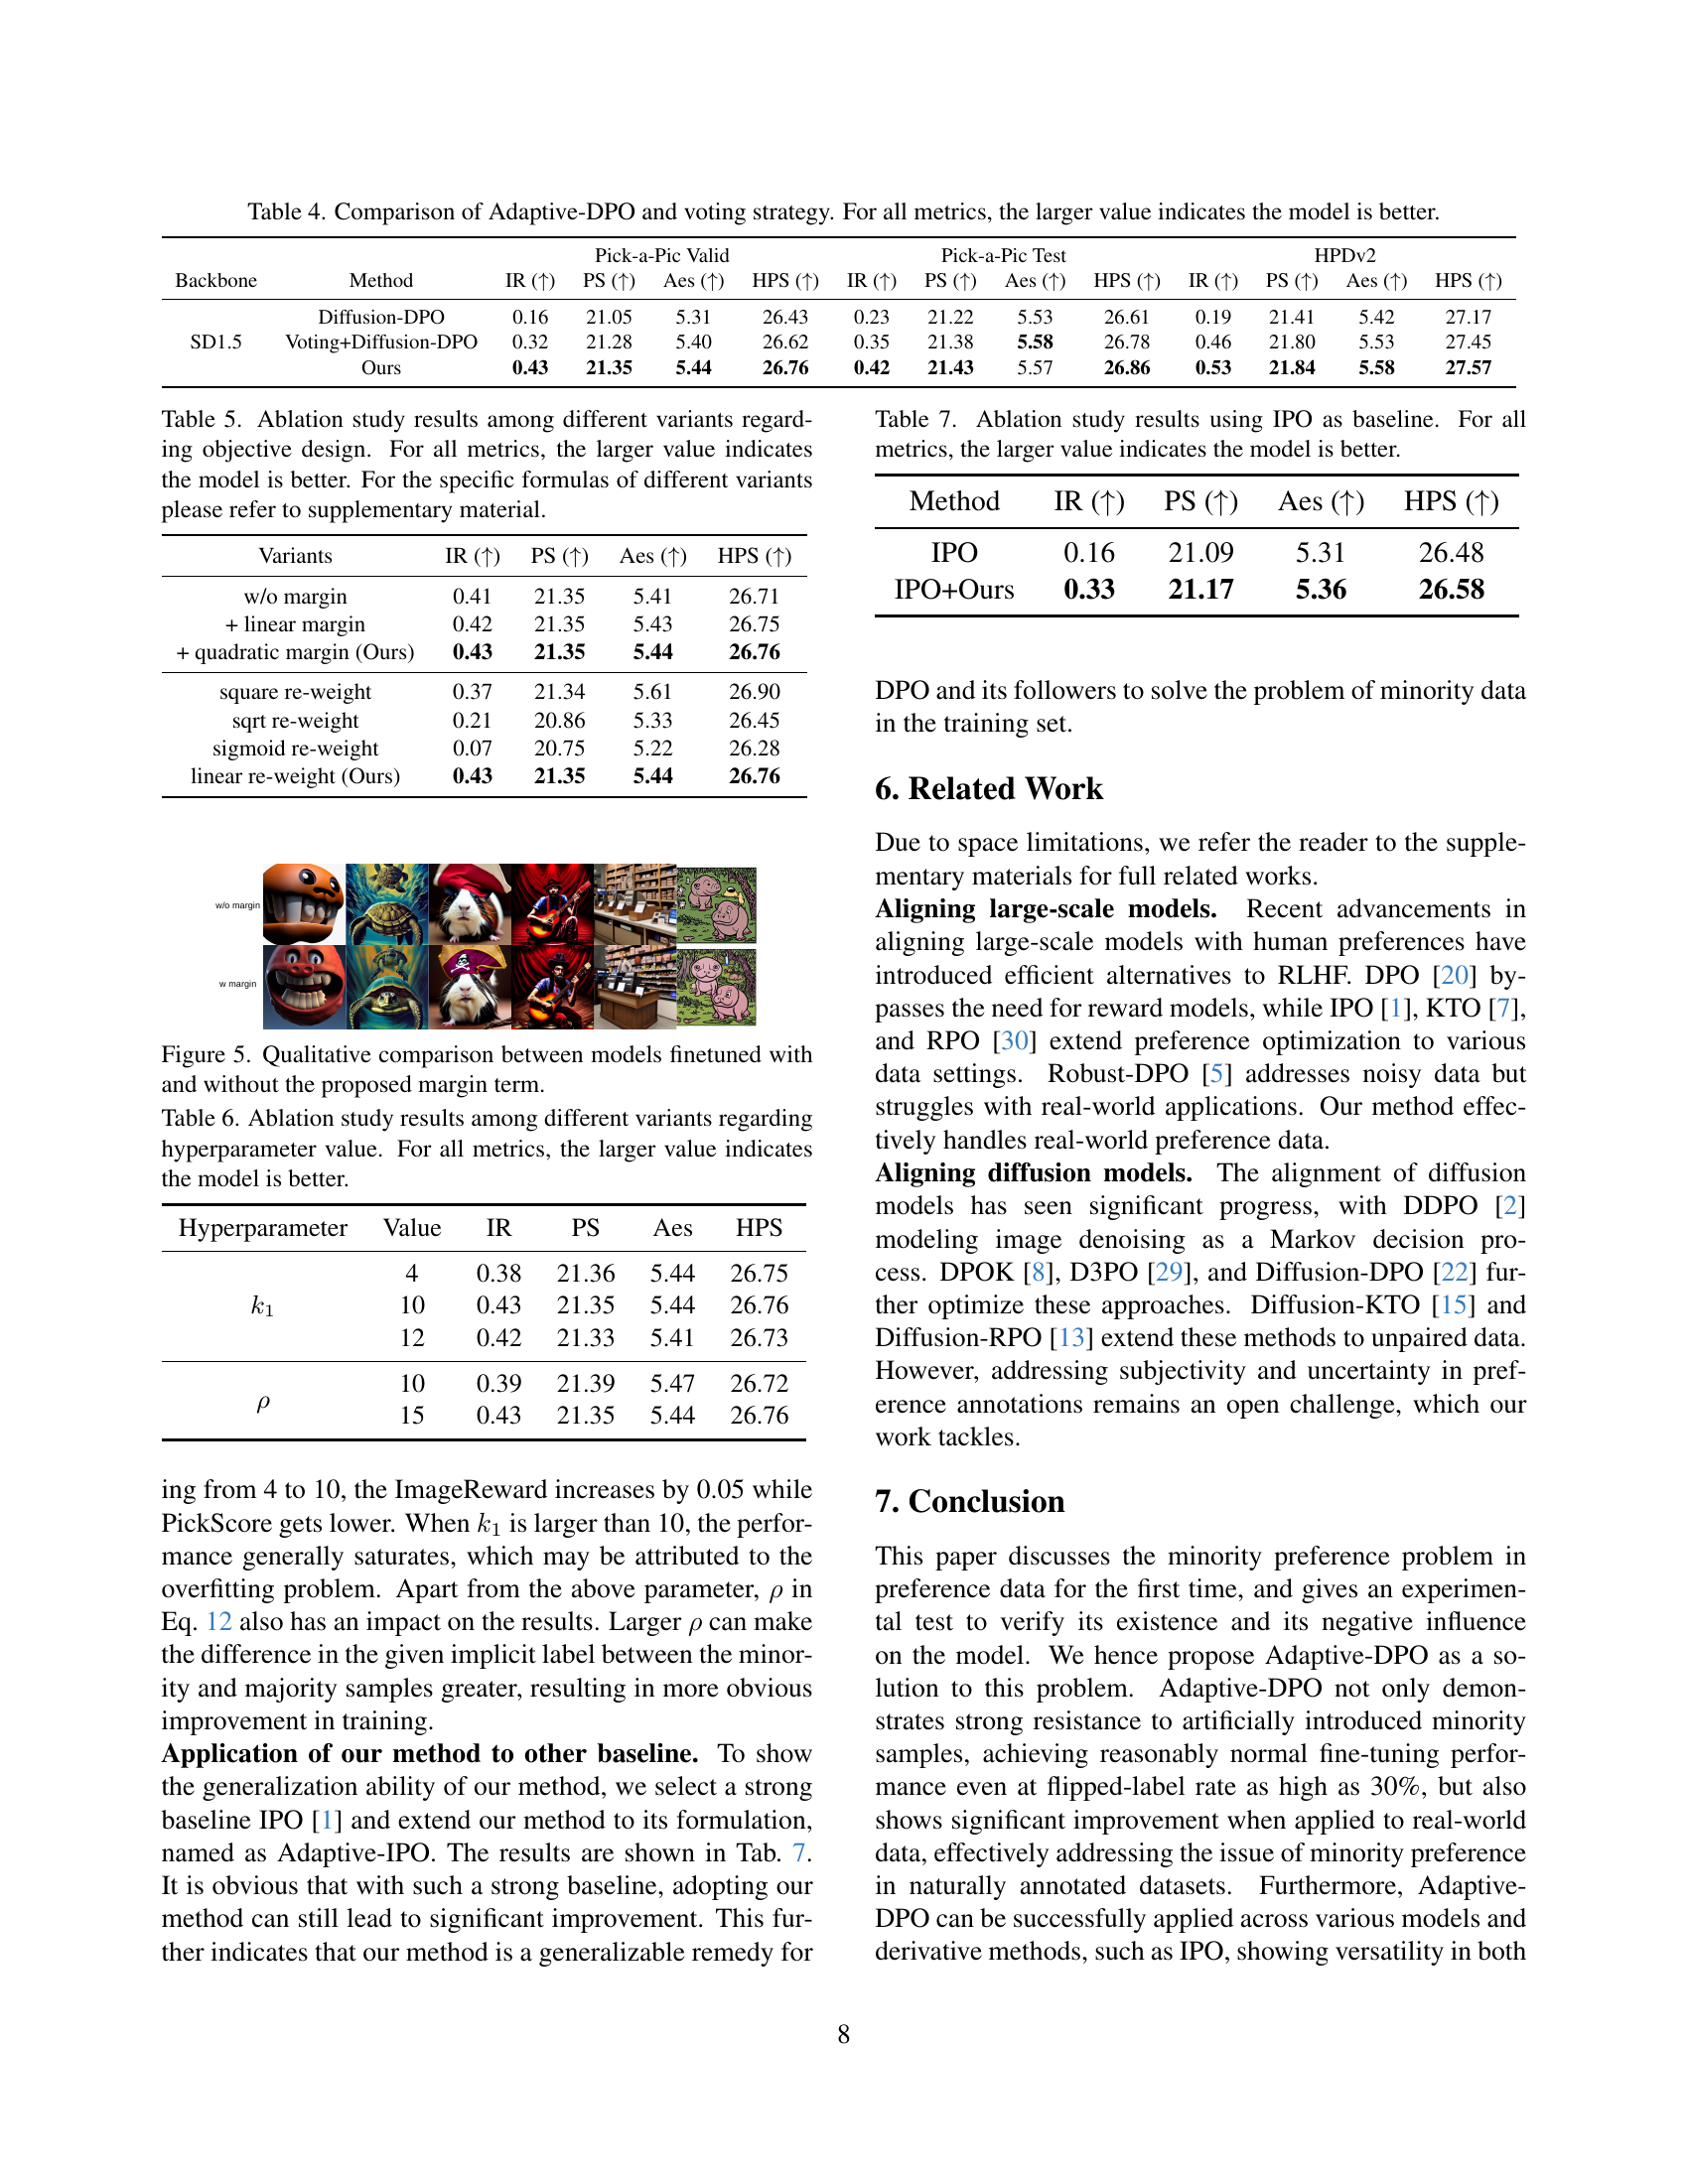
🔼 This table compares the performance of Adaptive-DPO and a majority voting strategy on three different metrics (IR, PS, Aes, and HPS) for evaluating the quality of images generated by diffusion models. The majority voting approach involves re-annotating the dataset using multiple evaluation metrics, which are then used to determine a consensus preference. This table shows that Adaptive-DPO significantly outperforms the simple majority voting strategy across all metrics. Larger values indicate better performance.
read the caption
Table 4: Comparison of Adaptive-DPO and voting strategy. For all metrics, the larger value indicates the model is better.
Full paper#