TL;DR#
Recent advancements in Large Language Models (LLMs) showcase sophisticated behaviors like self-verification using Reinforcement Learning (RL). This paper explores whether such reasoning capabilities can be integrated into Large Vision-Language Models (LVLMs) to enhance their multimodal reasoning on challenging tasks. The method uses supervised fine-tuning (SFT) on training data and RL to generalize.
The authors introduce OpenVLThinker, an LVLM, that iteratively leverages SFT and RL for self-improvement. They distill reasoning from text-based models by generating reasoning steps from high-quality image captions. Iterative RL training enhances reasoning skills. This approach improves performance on benchmarks like MathVista, demonstrating its potential for robust vision-language reasoning.
Key Takeaways#
Why does it matter?#
This research introduces a novel iterative self-improvement framework that enhances reasoning in LVLMs. It offers new methods for improving multi-modal reasoning, paving the way for more advanced AI systems capable of tackling complex tasks. The approach of combining SFT and RL could inspire new research directions.
Visual Insights#

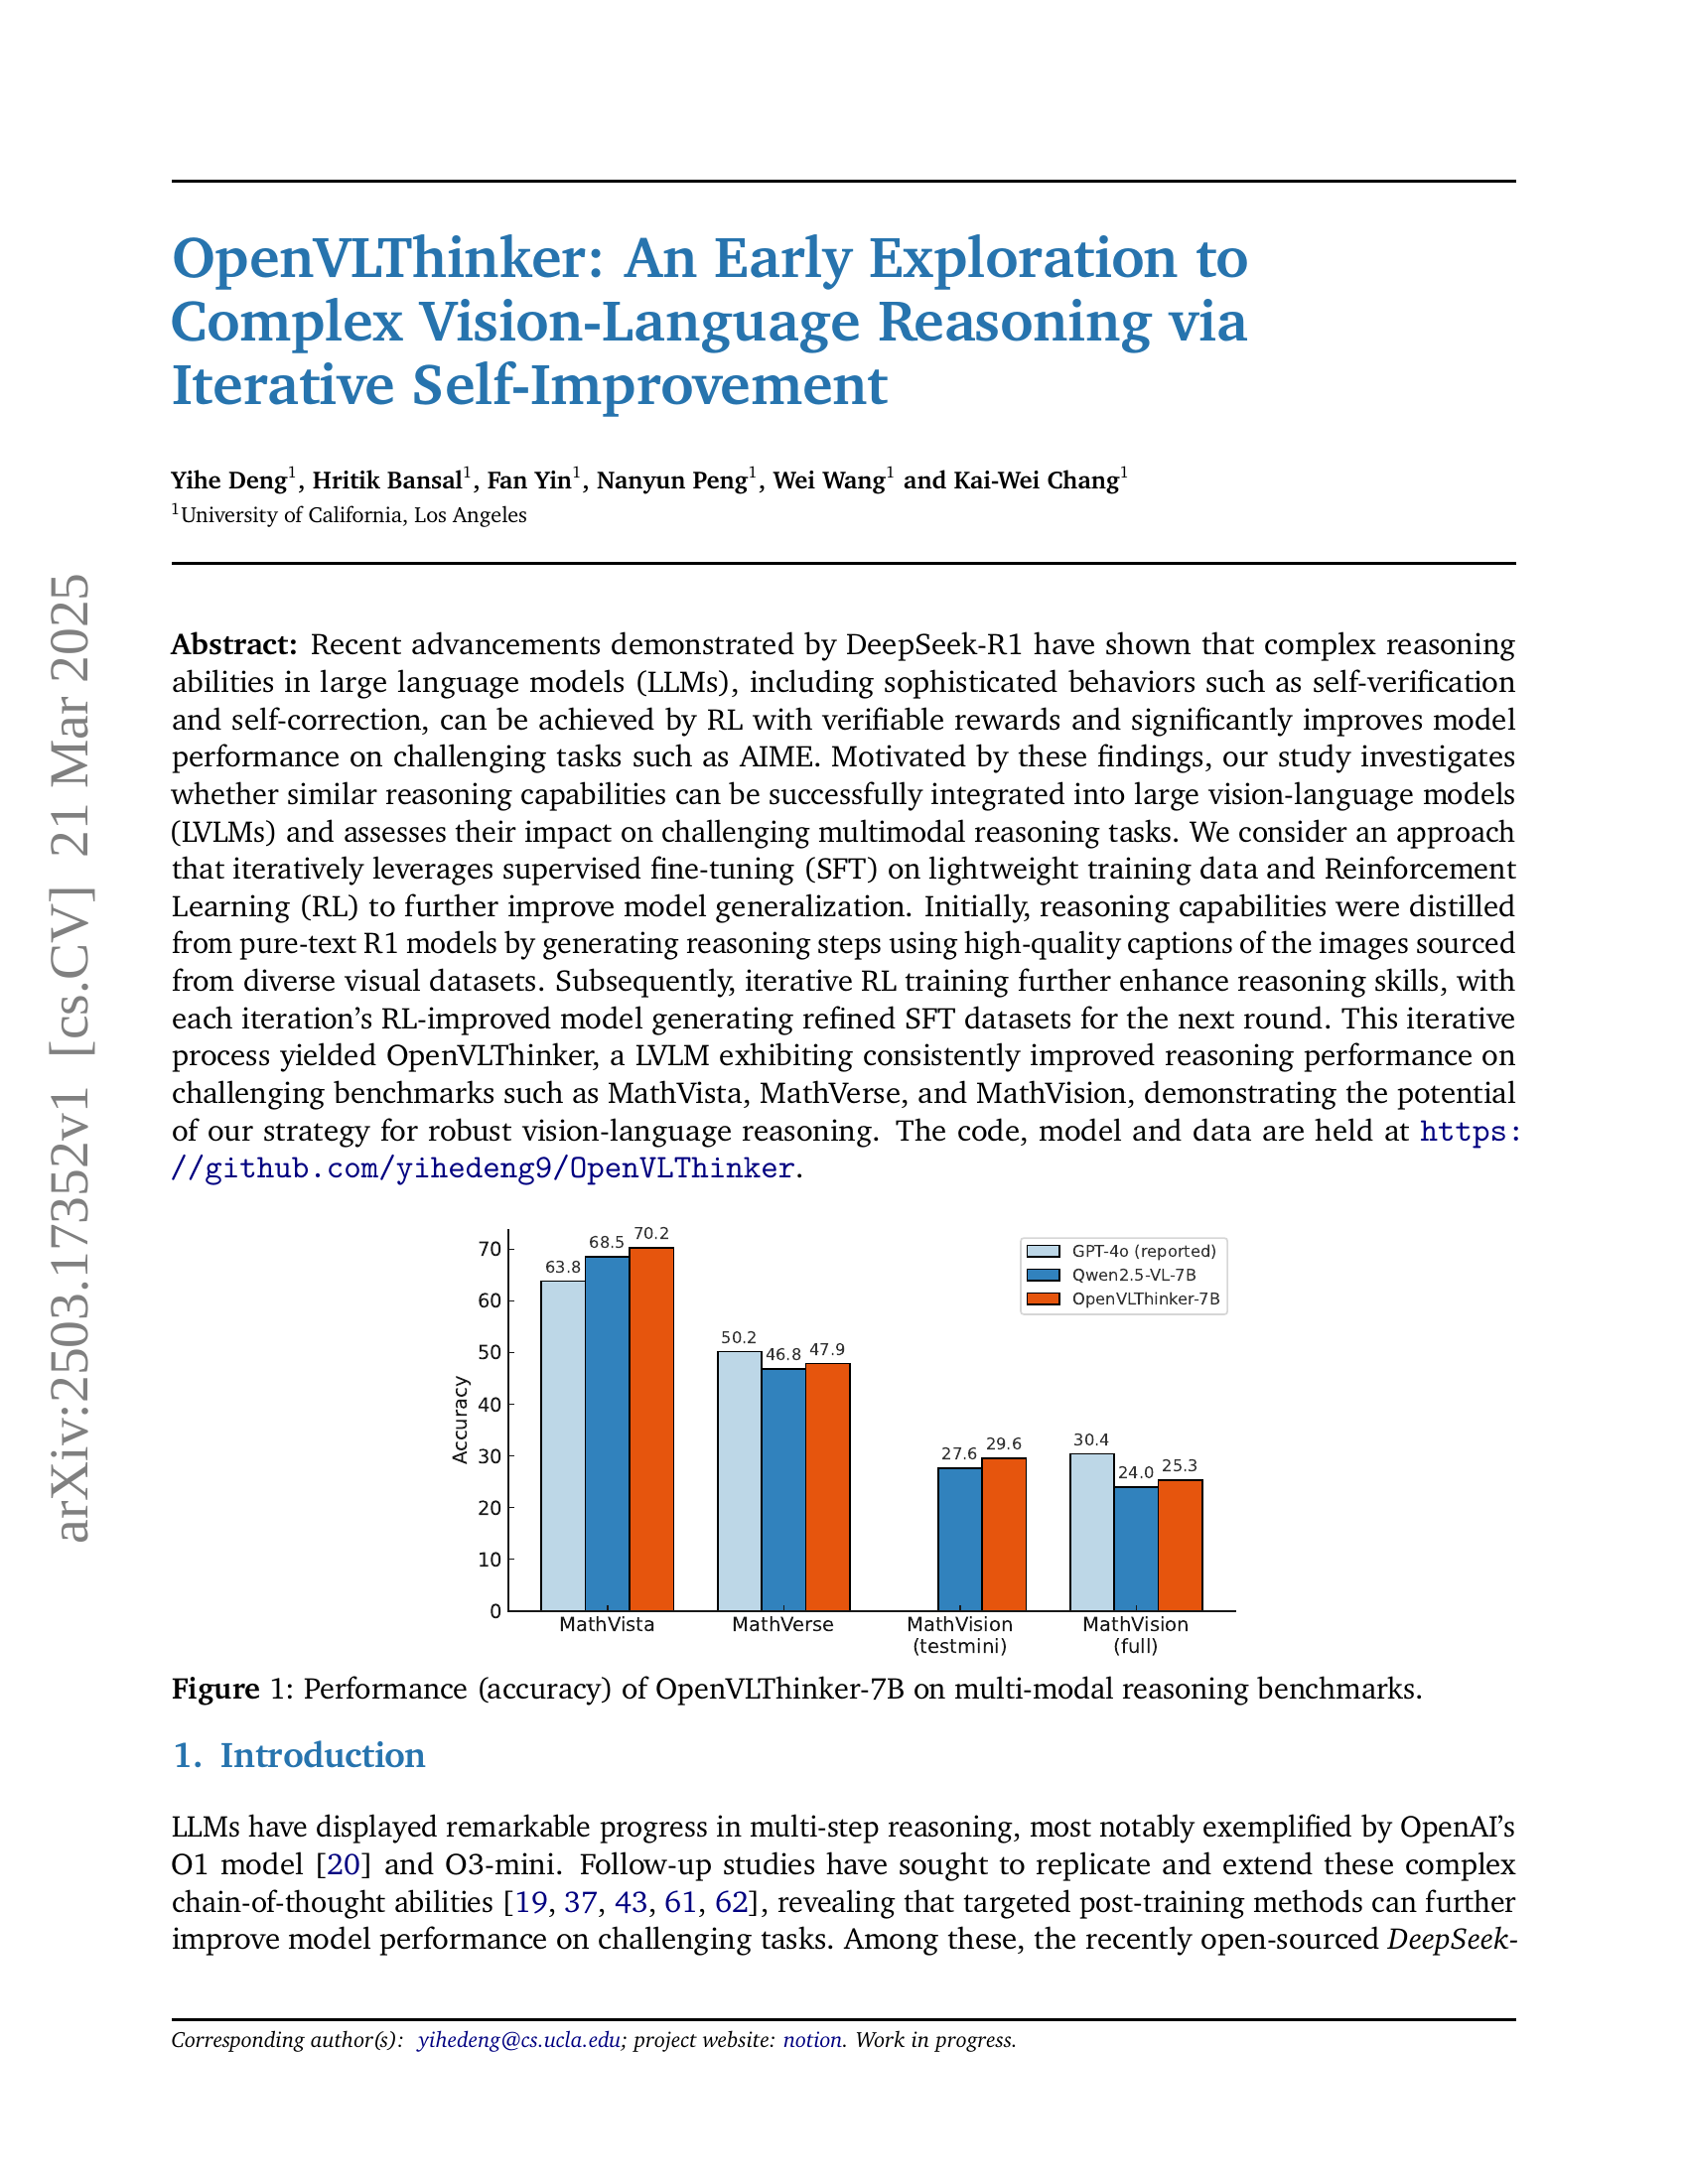
🔼 This bar chart displays the accuracy of the OpenVLThinker-7B model on three multi-modal reasoning benchmarks: MathVista, MathVerse, and MathVision. The accuracy is presented as a percentage, and separate bars are shown for OpenVLThinker-7B, Qwen2.5-VL-7B, and GPT-4 (reported). The chart visually compares the performance of OpenVLThinker-7B against existing models on these challenging tasks, highlighting its relative strengths.
read the caption
Figure 1: Performance (accuracy) of OpenVLThinker-7B on multi-modal reasoning benchmarks.
| Benchmark | GPT-4o (reported) | Qwen2.5-VL-7B | OpenVLThinker-7B |
| MathVista | 63.8 | 68.5 | 70.2 |
| MathVerse | 50.2 | 46.8 | 47.9 |
| MathVision (testmini) | - | 27.6 | 29.6 |
| MathVision (full) | 30.4 | 24.0 | 25.3 |
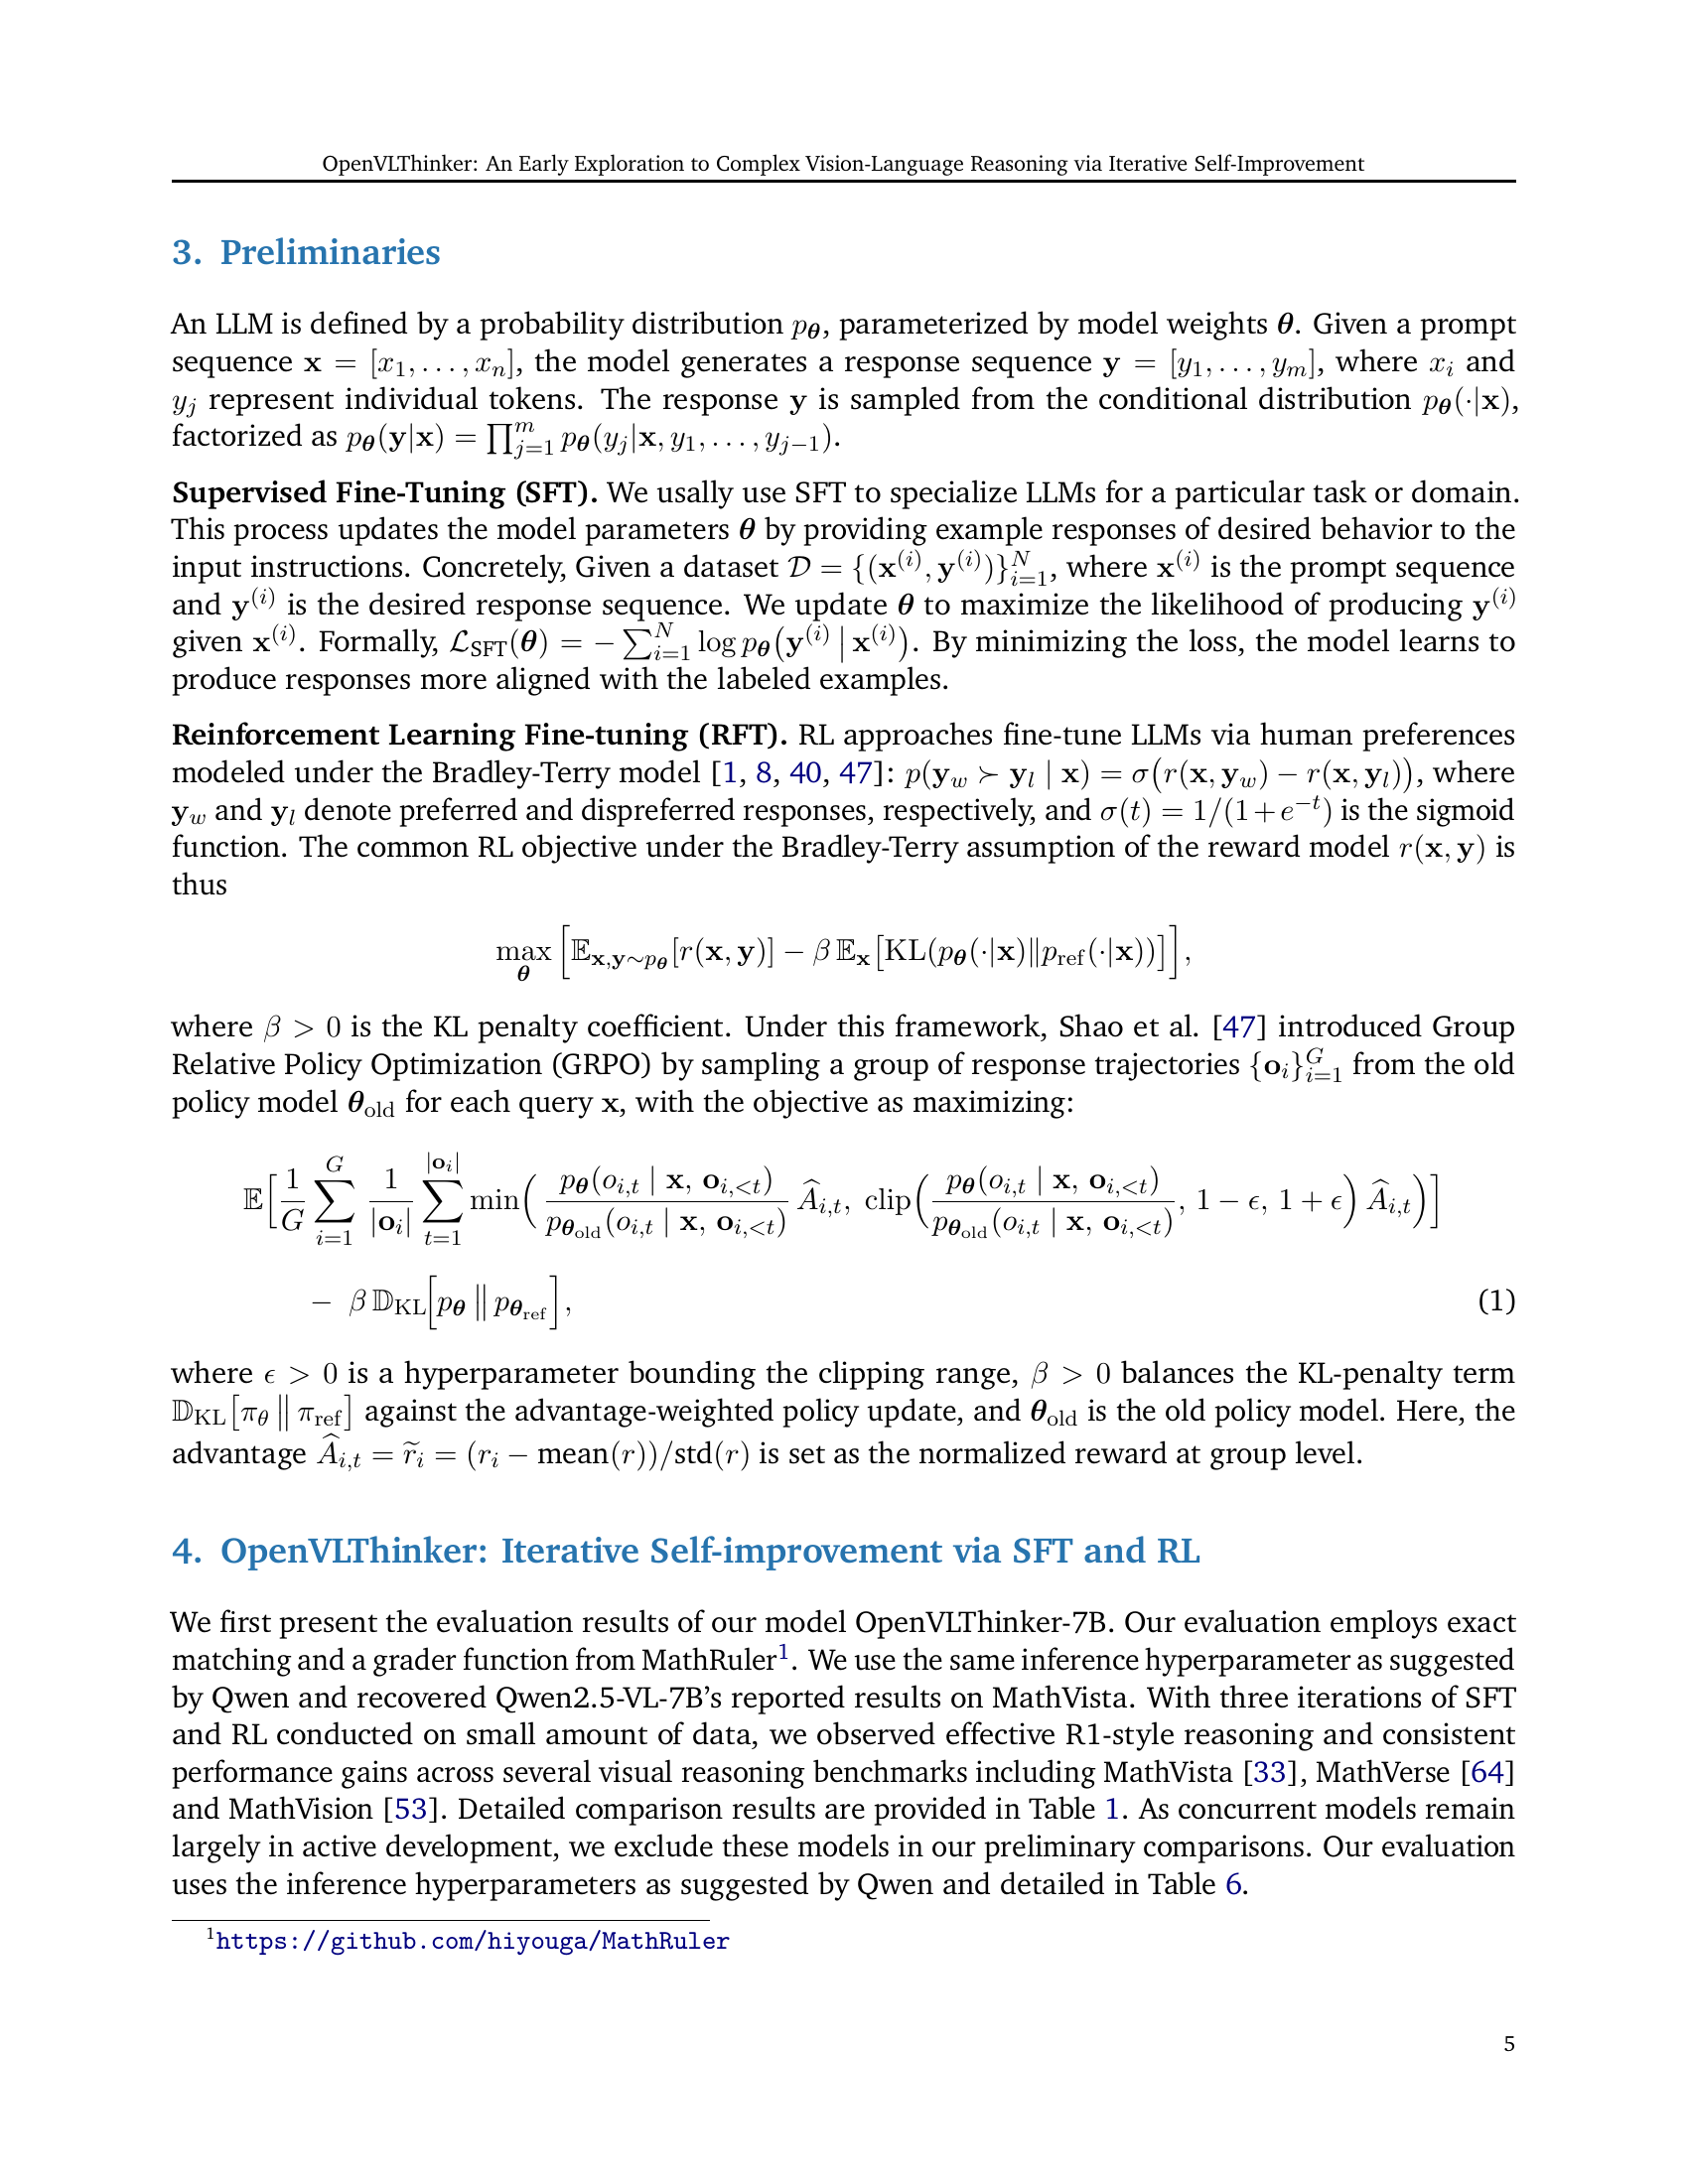
🔼 Table 1 presents a comparison of the accuracy scores achieved by different large language models (LLMs) on three complex visual reasoning benchmarks: MathVista, MathVerse, and MathVision. The models compared are OpenVLThinker-7B (the model introduced in this paper), Qwen2.5-VL-7B (a baseline model), and GPT-4 (a state-of-the-art model used as a reference point). The table shows that OpenVLThinker-7B significantly outperforms the Qwen2.5-VL-7B baseline and achieves performance comparable to or exceeding that of GPT-4 on all three benchmarks, demonstrating the effectiveness of the iterative self-improvement approach used to train OpenVLThinker-7B.
read the caption
Table 1: Evaluation results across multi-modal reasoning benchmarks including MathVista, MathVerse and MathVision. We include the reported performance of GPT-4o as a reference. OpenVLThinker-7B consistently and effectively improves upon the performance of Qwen2.5-VL-7B, surpassing or matching the performance of GPT-4o.
In-depth insights#
Iterative LVLMs#
The concept of iterative LVLMs (Large Vision-Language Models) represents a promising avenue for enhancing the reasoning and problem-solving capabilities of these models. Iterative refinement allows the model to progressively improve its understanding of complex visual and textual information. In this approach, the LVLM generates an initial response, which is then analyzed and refined in subsequent iterations. This iterative process can involve techniques such as self-correction, where the model identifies and rectifies its own errors, or external feedback, where human experts or automated systems provide guidance. One key benefit of iterative LVLMs is their ability to handle ambiguous or incomplete information. By repeatedly analyzing and refining its response, the model can gradually resolve uncertainties and arrive at a more accurate and nuanced understanding. Iteration may involve both the visual and language aspects of the model, and these might require independent refinement. Additionally, the computational cost of iterative processing needs to be carefully managed to ensure efficiency. Careful design of the refinement process is also crucial to prevent the model from becoming stuck in local optima or overfitting to specific examples. Ultimately, the goal is to create LVLMs that can effectively handle complex, real-world tasks that require a deep understanding of both visual and textual information. Iterative methods offer a powerful means of achieving this goal, by enabling models to progressively refine their understanding and reasoning abilities.
SFT & RL synergy#
The synergy between Supervised Fine-Tuning (SFT) and Reinforcement Learning (RL) presents a compelling paradigm for advancing vision-language models. SFT provides a crucial structured foundation, enabling models to learn reasoning patterns from curated datasets, effectively constraining the search space for RL. In essence, it acts as a warm-start mechanism, predisposing the model towards desirable behaviors. Consequently, RL refines and optimizes these foundational skills. It facilitates the exploration of nuanced reasoning strategies and enhances generalization through interaction with an environment, often defined by reward signals aligned with task objectives. The iterative application of SFT and RL forms a virtuous cycle, where RL-improved models generate higher-quality SFT datasets, thereby accelerating learning and stabilizing performance. This synergy bypasses the reliance on explicit reward engineering, as SFT primes the model, and the RL component is used to navigate the model towards robust reasoning. Therefore, SFT & RL synergy improves model performance, boosts confidence, and reduces the need for format rewards.
R1 Distillation#
R1 Distillation, inspired by DeepSeek-R1’s success, aims to imbue vision-language models (LVLMs) with advanced reasoning. The process typically involves using a powerful, text-based R1 model to generate reasoning chains for visually-grounded tasks. These chains, paired with corresponding images and questions, form a training dataset. LVLMs are then fine-tuned on this data to distill the R1 model’s reasoning prowess into the visual domain. This is achieved using lightweight training data and Reinforcement Learning(RL) to improve generalization. High-quality captions of images sourced from diverse visual datasets are used, and reasoning steps are generated using pure-text R1 models. Iterative RL training further enhances reasoning skills, and each iteration’s RL-improved model generating refined SFT datasets for the next round. The process consistently improves reasoning performance on challenging benchmarks. The code, model and data are open source.
CoT Limitations#
Chain-of-Thought (CoT) prompting, while powerful, faces limitations. Generating diverse and relevant reasoning paths is challenging; models often get stuck in repetitive or irrelevant chains. Also, CoT’s reliance on large models and extensive training data makes it resource-intensive. Transferring CoT capabilities to vision-language models poses difficulties due to added complexity, such as needing a lot of resources. The generated reasoning could have some information loss because of the translation into text. Lastly, CoT’s potential for “hallucinations” or making up facts within the reasoning process requires careful verification mechanisms, and maintaining reasoning consistency is also a big task.
Reasoning gains#
Reasoning gains in multimodal models are a crucial area of exploration, as they determine the model’s ability to effectively integrate and process information from both visual and textual sources. Improved reasoning capabilities can lead to more accurate and nuanced understanding of complex scenarios, enabling the model to perform tasks such as visual question answering, image captioning, and commonsense reasoning with greater proficiency. Approaches to enhance reasoning gains include distilling knowledge from powerful language models, employing iterative training methods like self-improvement via RL, and carefully curating datasets that emphasize logical inference and contextual understanding. Analyzing the specific mechanisms by which these gains are achieved, such as improvements in attention mechanisms, knowledge representation, or inference algorithms, is essential for guiding future research and development in the field. Furthermore, evaluating the transferability of reasoning skills across different tasks and domains is critical for building robust and generalizable multimodal systems.
More visual insights#
More on figures

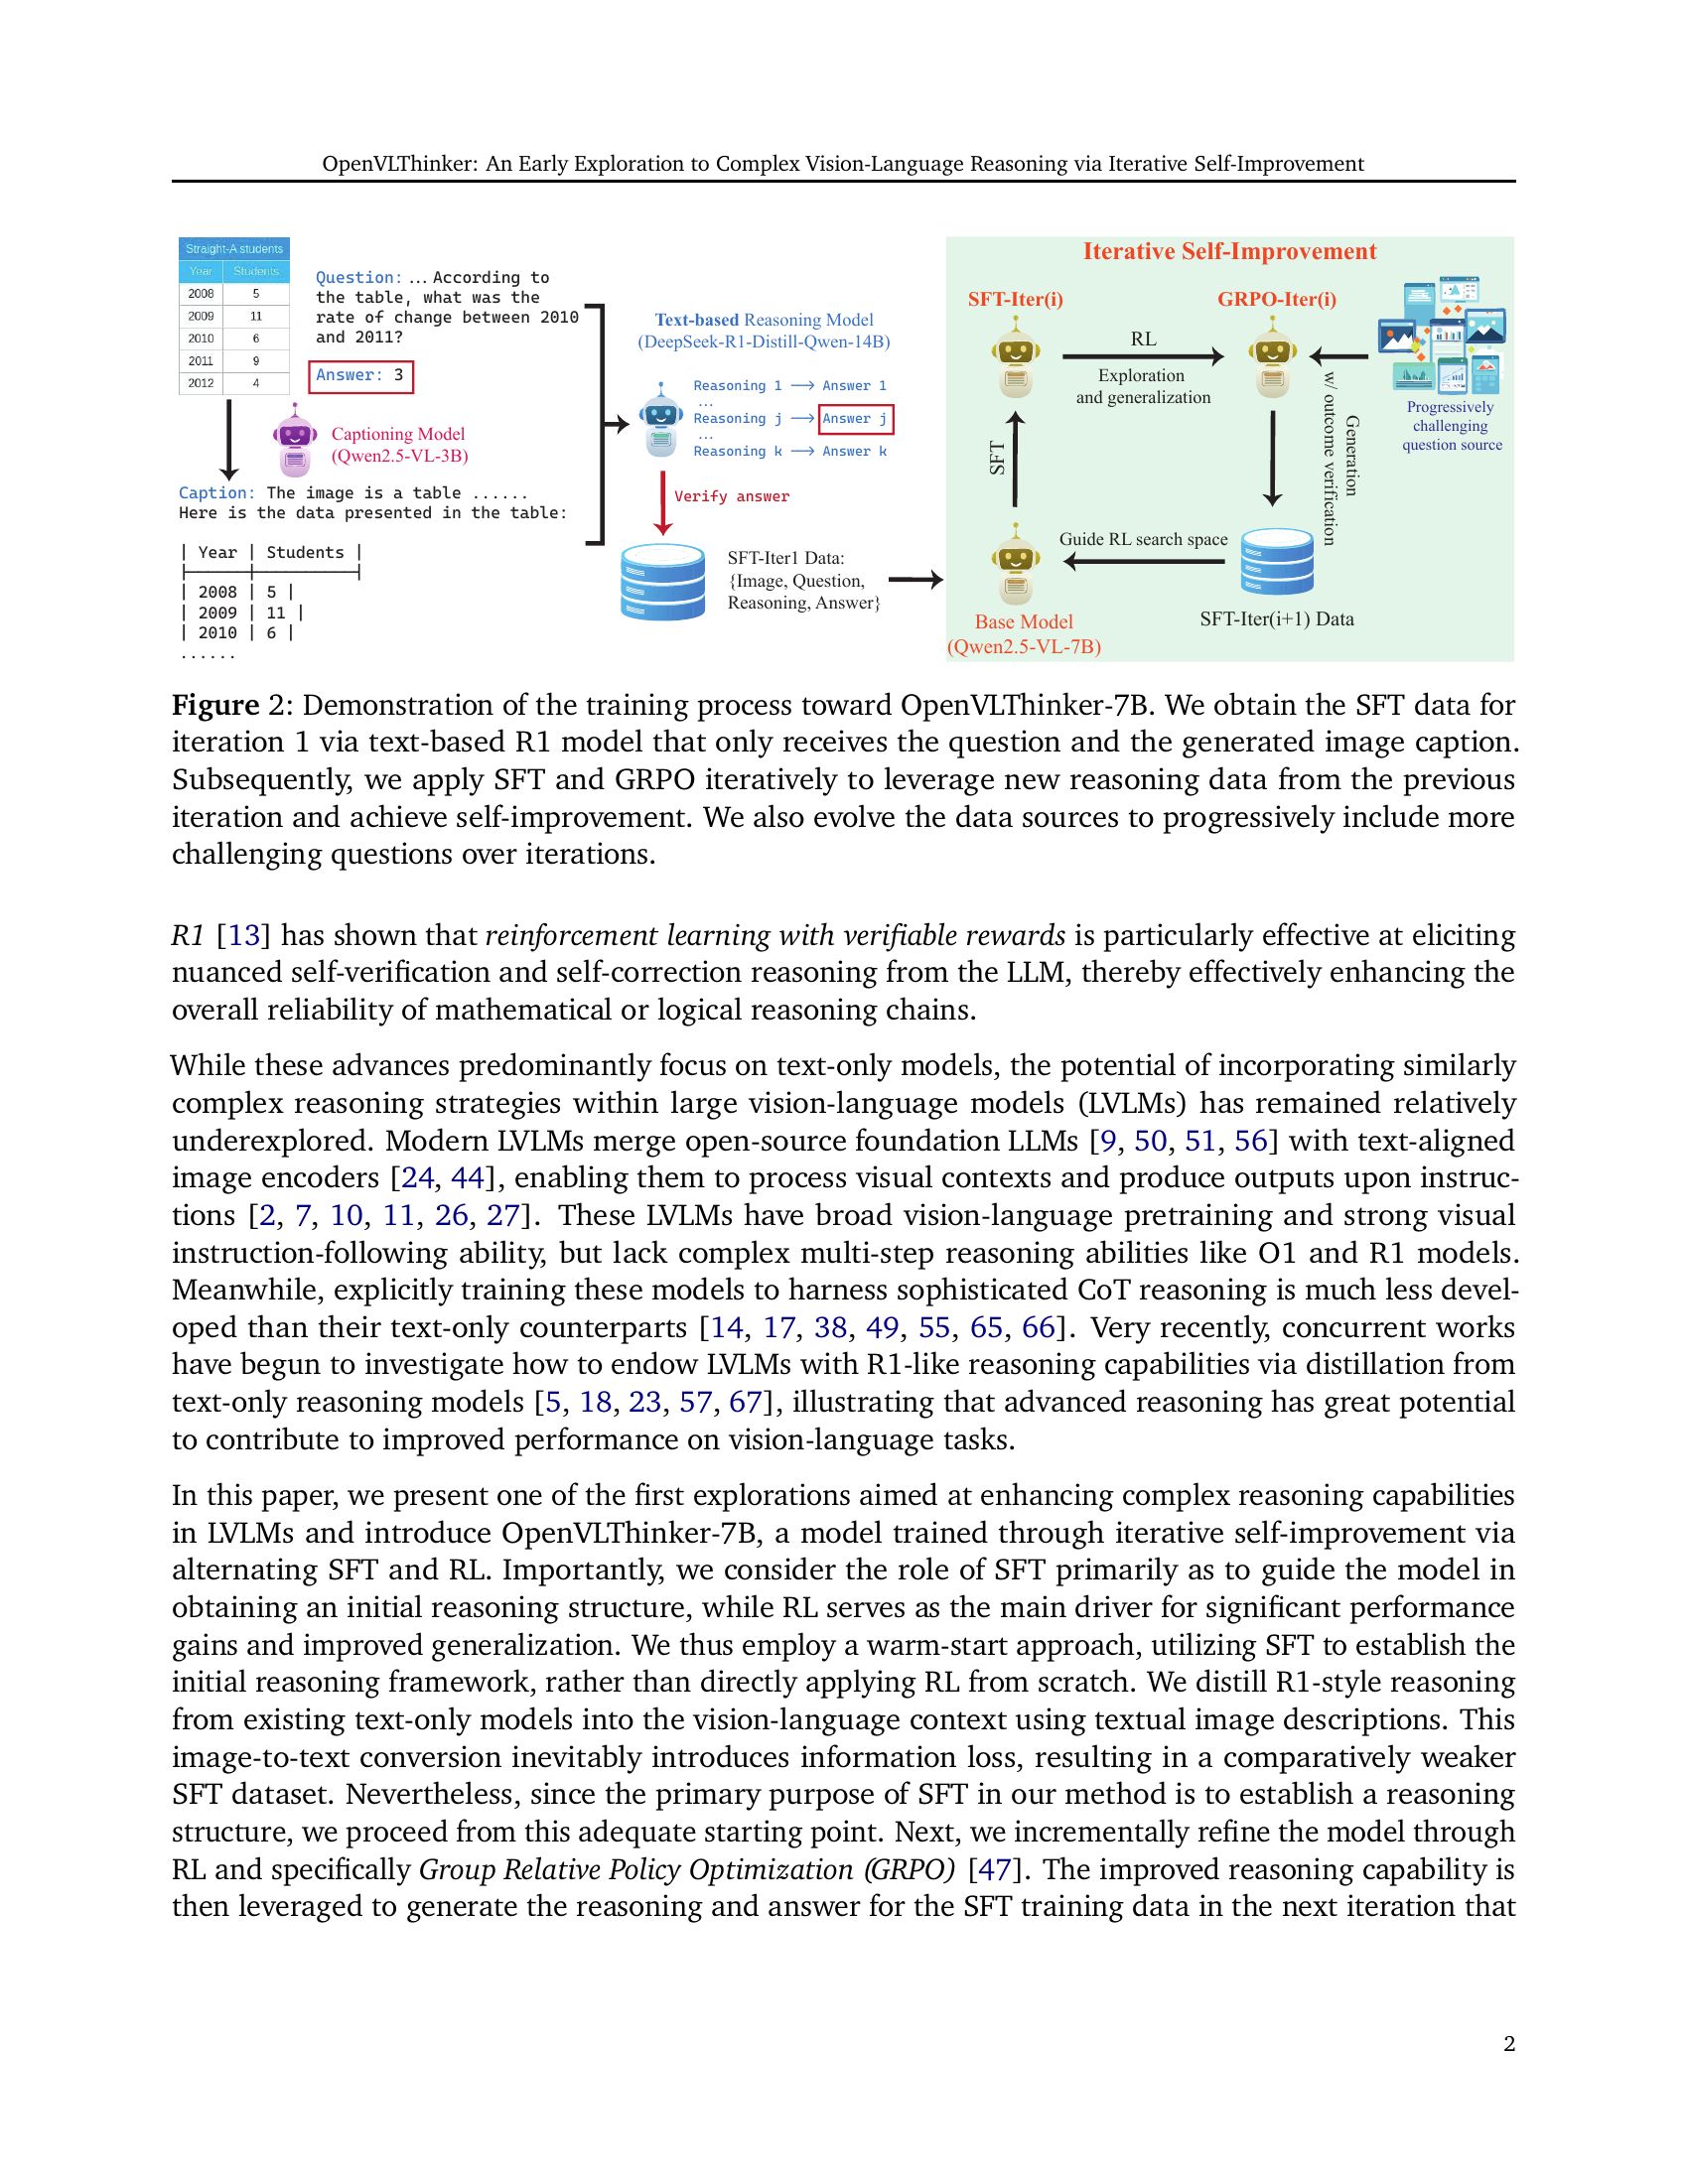
🔼 This figure illustrates the iterative training process for OpenVLThinker-7B, a vision-language model. The process starts with a base model and a text-based reasoning model (DeepSeek-R1). An image is input, and a captioning model generates a caption. The caption and the original question are then fed to the DeepSeek-R1 model, which produces reasoning steps and an answer. This data (image, question, reasoning, answer) constitutes the initial Supervised Fine-Tuning (SFT) dataset. Iteratively, the model is fine-tuned using this SFT dataset and then further improved with reinforcement learning (GRPO). The improved model from each iteration then generates refined SFT data for the next round. This iterative approach, combining SFT and GRPO, results in improved reasoning ability, along with progressively more challenging questions to further enhance the model’s capabilities.
read the caption
Figure 2: Demonstration of the training process toward OpenVLThinker-7B. We obtain the SFT data for iteration 1 via text-based R1 model that only receives the question and the generated image caption. Subsequently, we apply SFT and GRPO iteratively to leverage new reasoning data from the previous iteration and achieve self-improvement. We also evolve the data sources to progressively include more challenging questions over iterations.

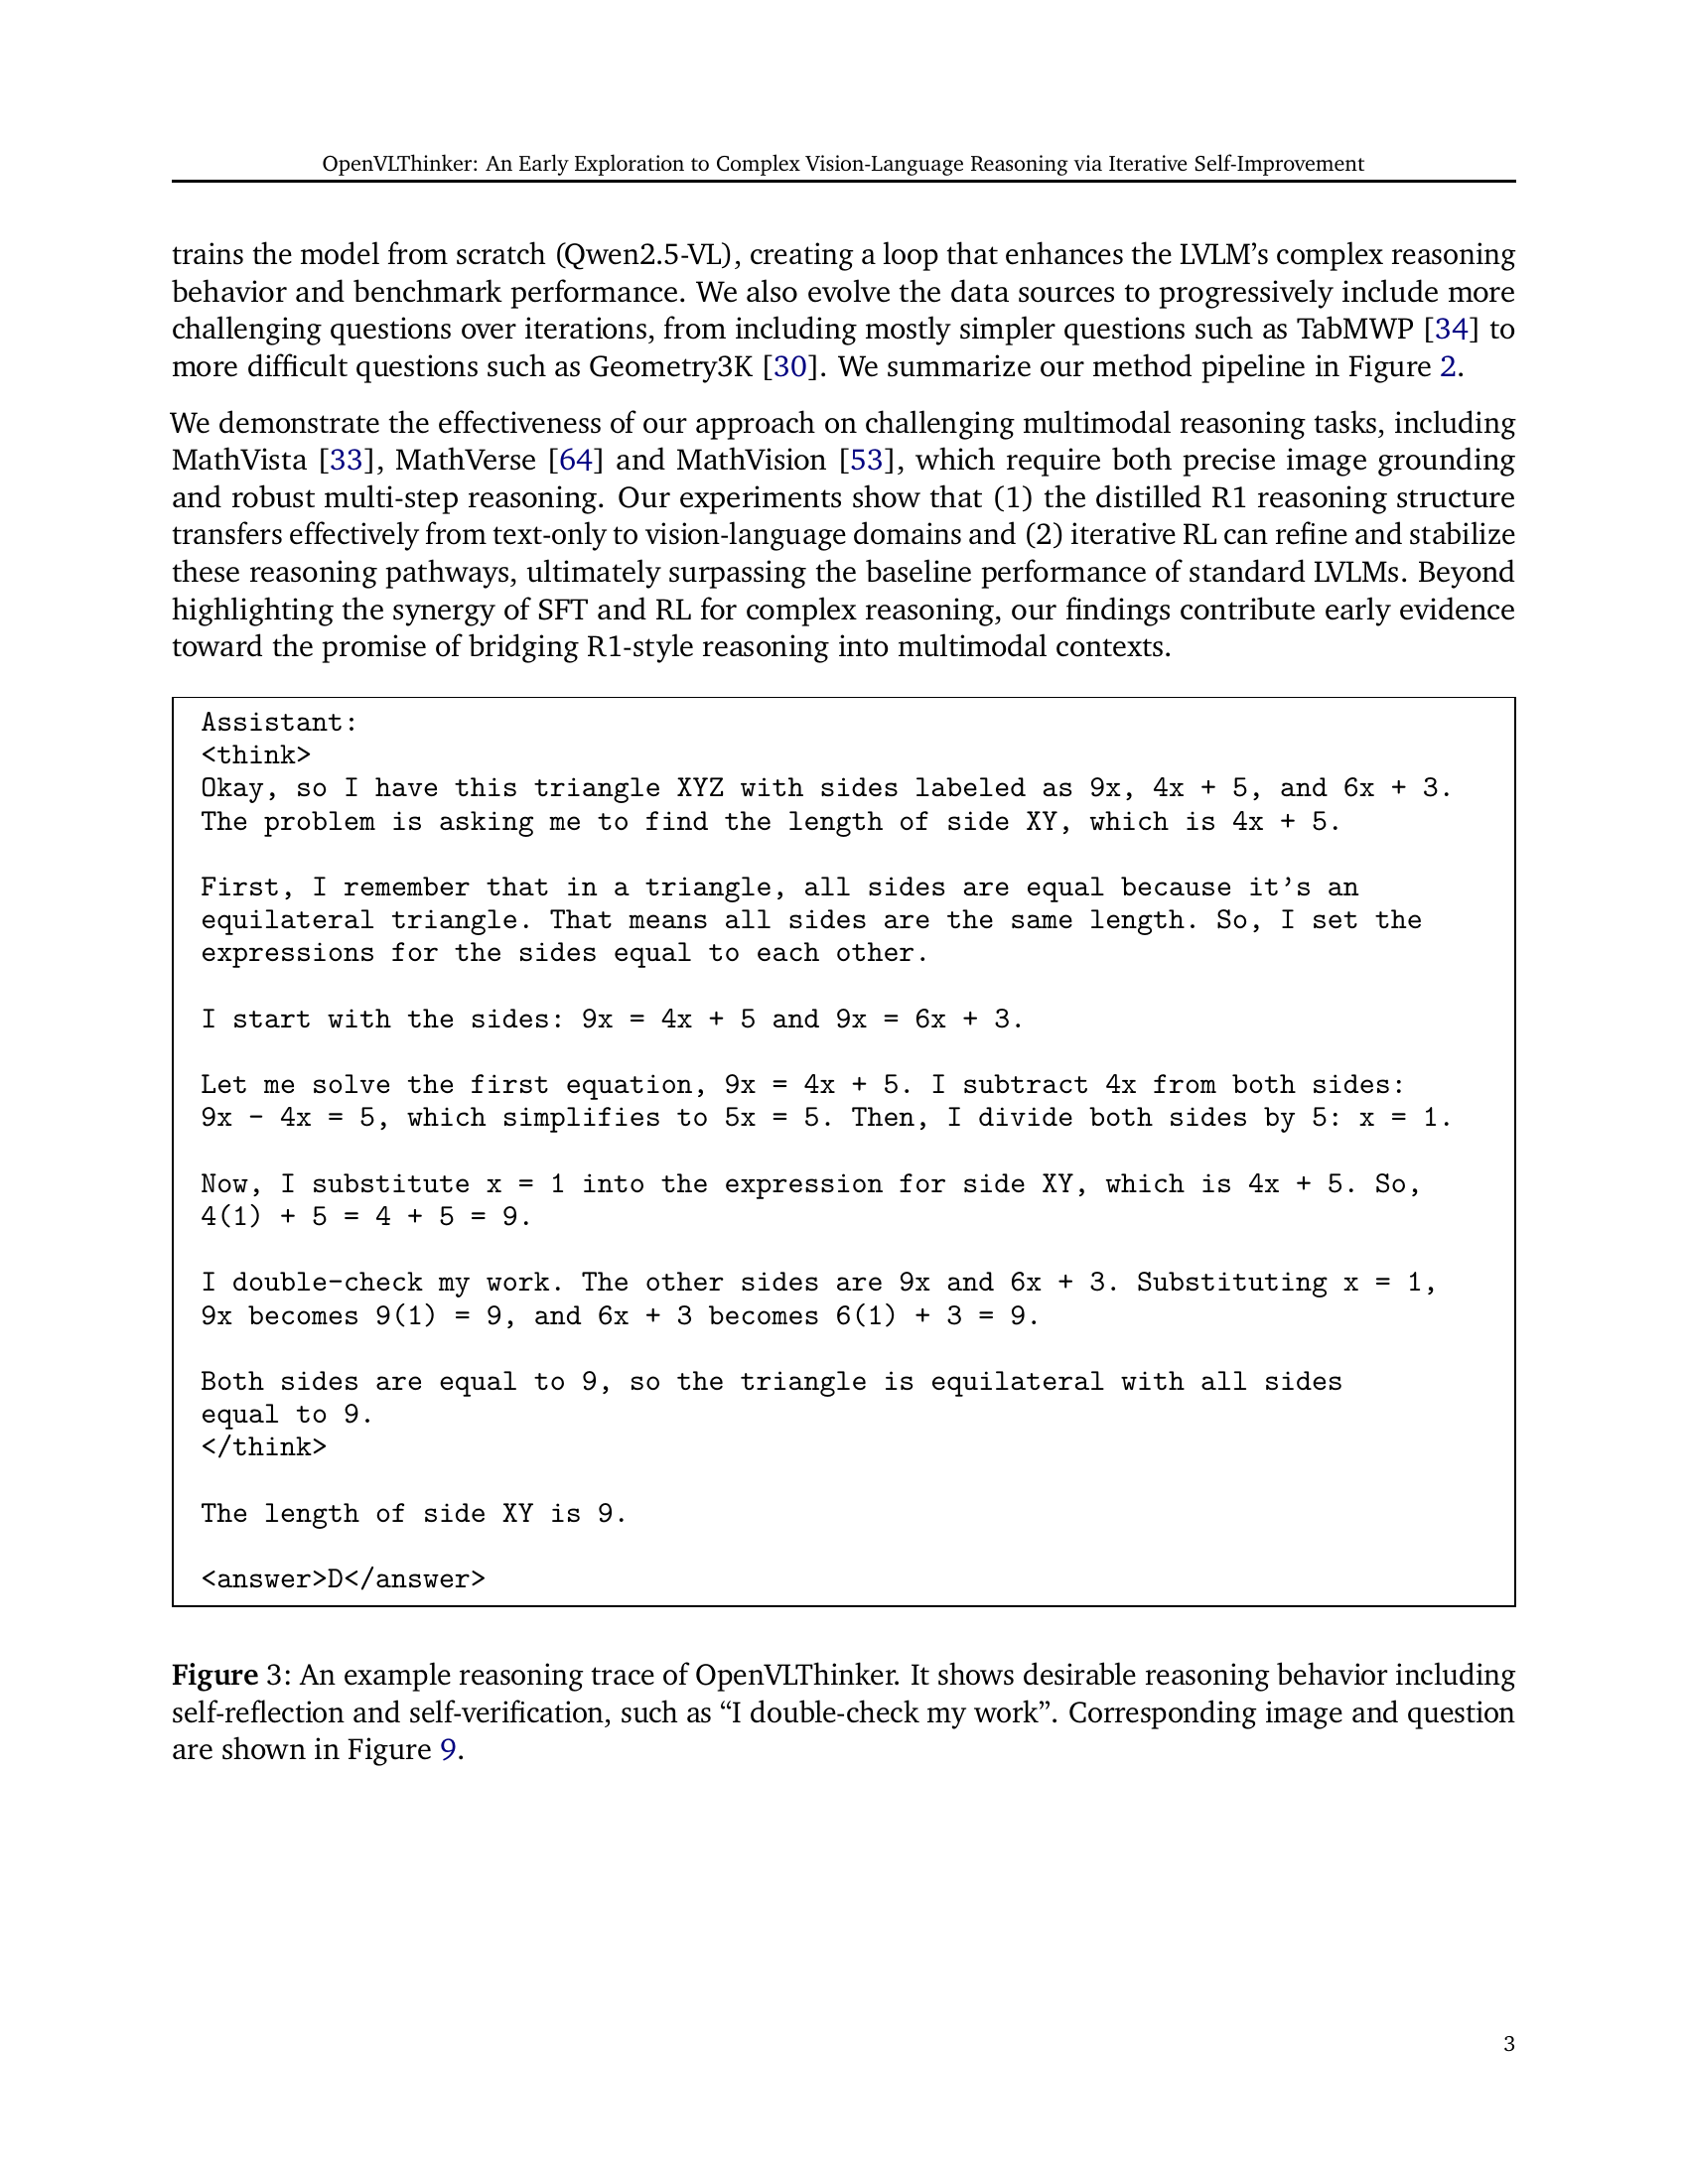
🔼 This figure displays an example of OpenVLThinker’s reasoning process. The model is presented with a question about an image (the image and question are shown in Figure 9). The model demonstrates a chain of thought, showing its step-by-step reasoning. Notably, the model also exhibits self-reflection, verifying its work and correcting itself when necessary. This example illustrates the model’s ability to perform complex reasoning tasks and its capacity for self-correction and verification.
read the caption
Figure 3: An example reasoning trace of OpenVLThinker. It shows desirable reasoning behavior including self-reflection and self-verification, such as “I double-check my work”. Corresponding image and question are shown in Figure 9.

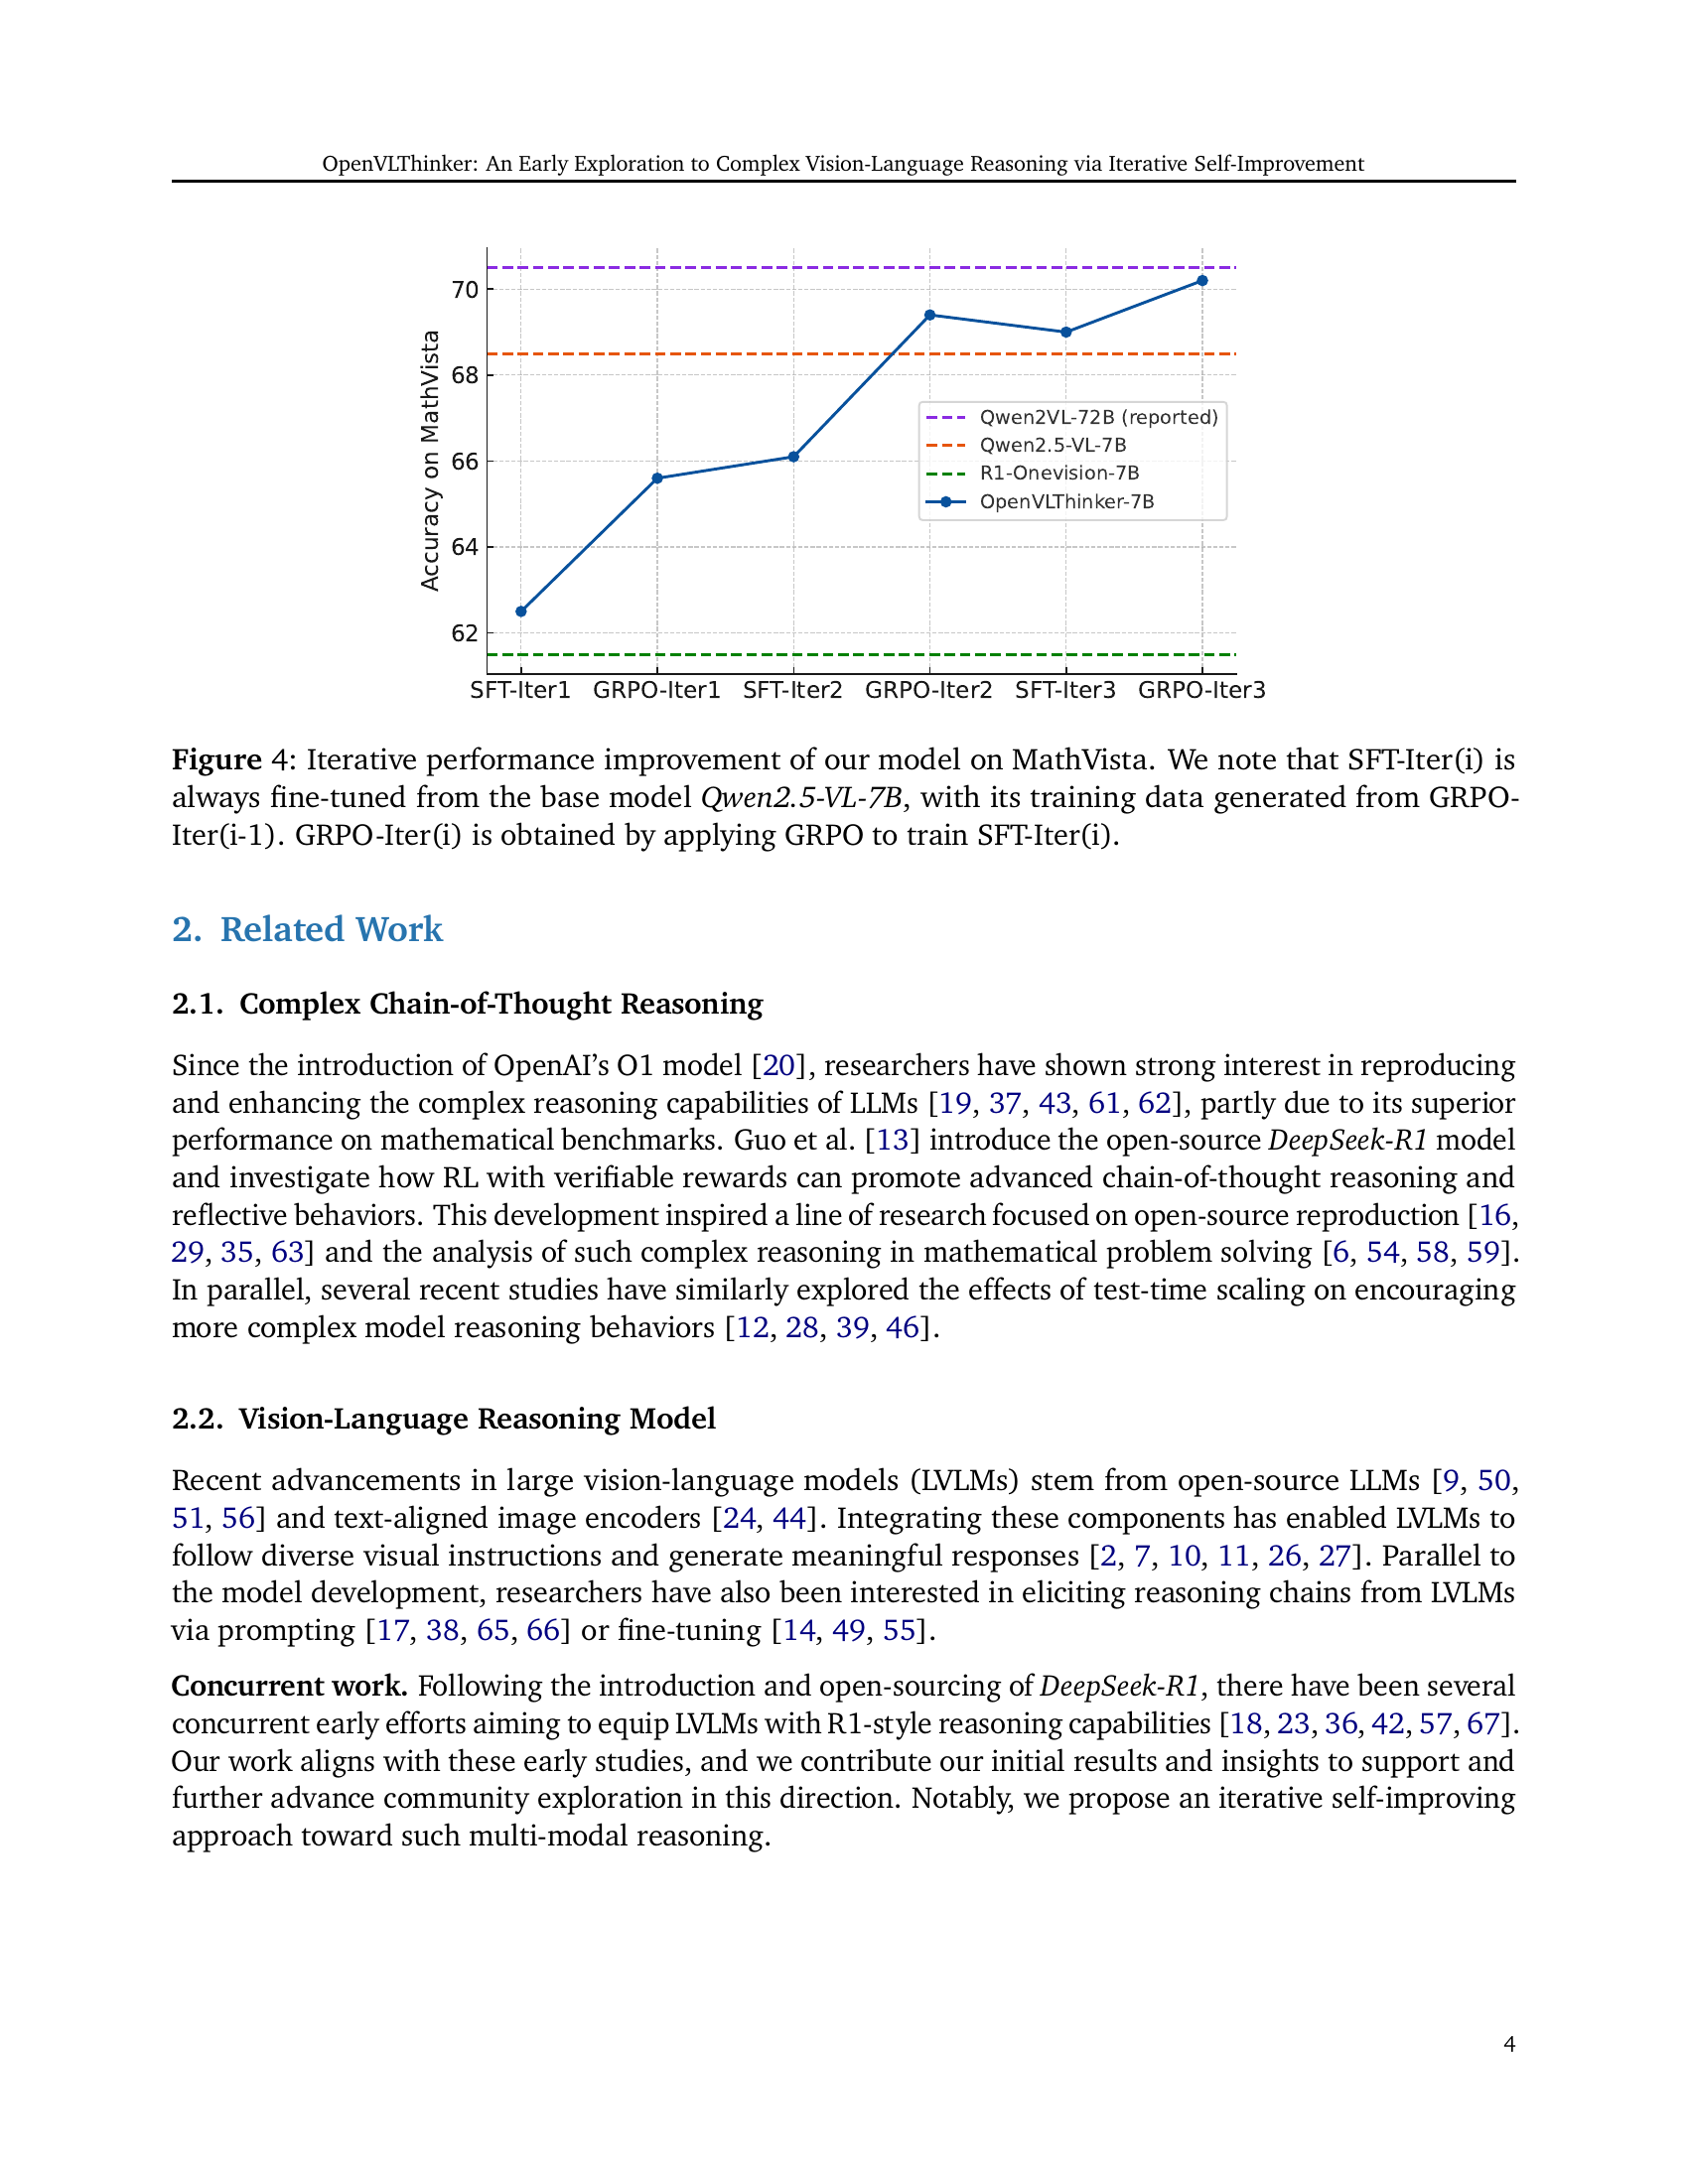
🔼 This figure displays the iterative performance improvement of the OpenVLThinker model on the MathVista benchmark. The process involves alternating between supervised fine-tuning (SFT) and Group Relative Policy Optimization (GRPO) reinforcement learning. Each SFT iteration (SFT-Iter(i)) fine-tunes the base Qwen2.5-VL-7B model using data generated by the previous GRPO iteration (GRPO-Iter(i-1)). Each GRPO iteration trains the model from the previous SFT iteration. This iterative approach demonstrates consistent performance gains over multiple rounds.
read the caption
Figure 4: Iterative performance improvement of our model on MathVista. We note that SFT-Iter(i) is always fine-tuned from the base model Qwen2.5-VL-7B, with its training data generated from GRPO-Iter(i-1). GRPO-Iter(i) is obtained by applying GRPO to train SFT-Iter(i).

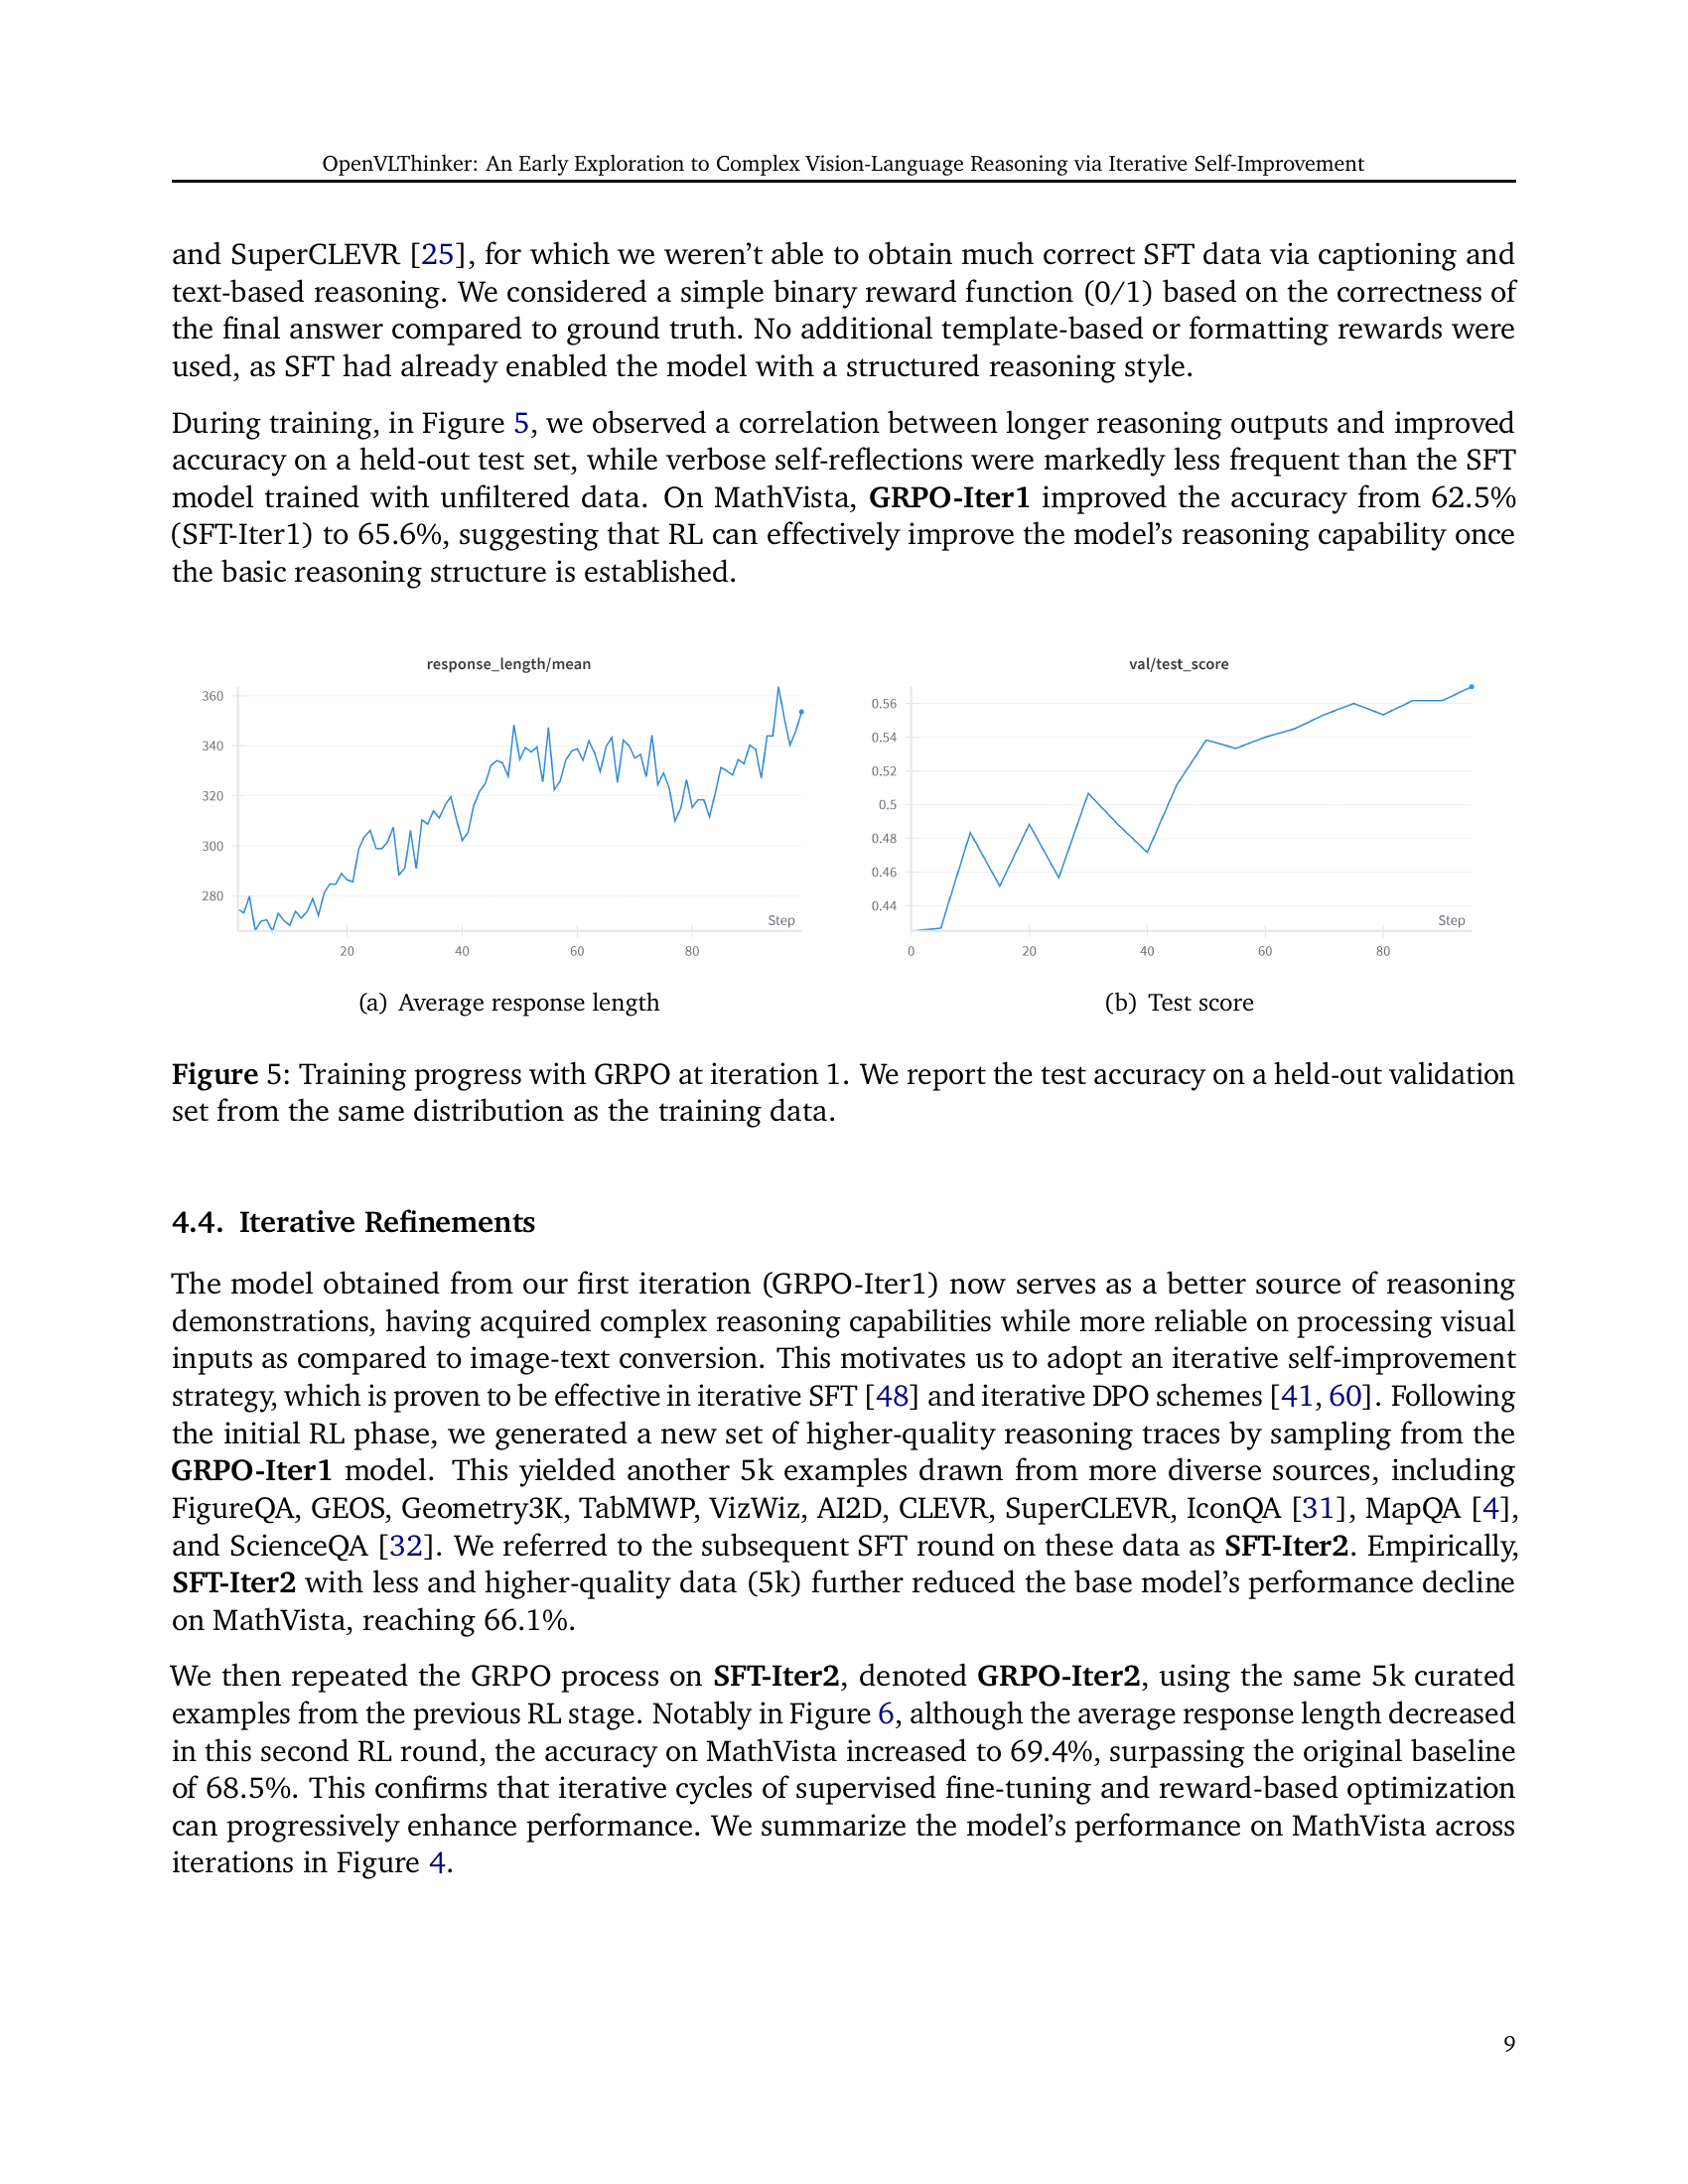
🔼 The figure shows two line graphs, (a) and (b), illustrating the training progress of the model using GRPO at iteration 1. Graph (a) displays the average response length over training steps, while graph (b) shows the test accuracy on a held-out validation set. Both graphs indicate the model’s performance improvement during training, with the test accuracy rising alongside an increase in average response length.
read the caption
(a) Average response length

🔼 This figure shows the test accuracy during the training process of the GRPO (Group Relative Policy Optimization) at iteration 1. The x-axis represents the training step, and the y-axis shows the test accuracy on a held-out validation set. The graph illustrates the model’s performance improvement over training steps. The accuracy is observed on a held-out validation set from the same distribution as the training data.
read the caption
(b) Test score

🔼 This figure displays the training progress of the model using Group Relative Policy Optimization (GRPO) during the first iteration. The left subplot shows the average response length generated by the model over training steps. The right subplot shows the test accuracy on a held-out validation dataset, which has the same distribution as the training dataset. The figure demonstrates how the model’s performance and response length evolve during the training process.
read the caption
Figure 5: Training progress with GRPO at iteration 1. We report the test accuracy on a held-out validation set from the same distribution as the training data.

🔼 The figure shows two subplots. Subplot (a) presents a line graph illustrating the average response length during the training process of the GRPO (Group Relative Policy Optimization) at iteration 1. The x-axis represents the training step, while the y-axis indicates the average response length. The graph shows fluctuations in the average response length over the training steps. Subplot (b) displays a line graph depicting the test accuracy on a held-out validation set during the same GRPO training process at iteration 1. The x-axis represents the training step, and the y-axis shows the test accuracy. This subplot demonstrates the test accuracy’s behavior over the course of training. Together, the two subplots provide insight into the relationship between response length and model performance during GRPO training.
read the caption
(a) Average response length

🔼 The figure shows the test accuracy during the training process of the model using GRPO at iteration 1. The x-axis represents the training step, and the y-axis represents the test accuracy on a held-out validation set. The accuracy gradually improves over the training steps, indicating that the GRPO optimization process is effective in improving the model’s performance. The graph demonstrates that as the average length of model responses increases during the GRPO optimization process, the test accuracy also increases.
read the caption
(b) Test score
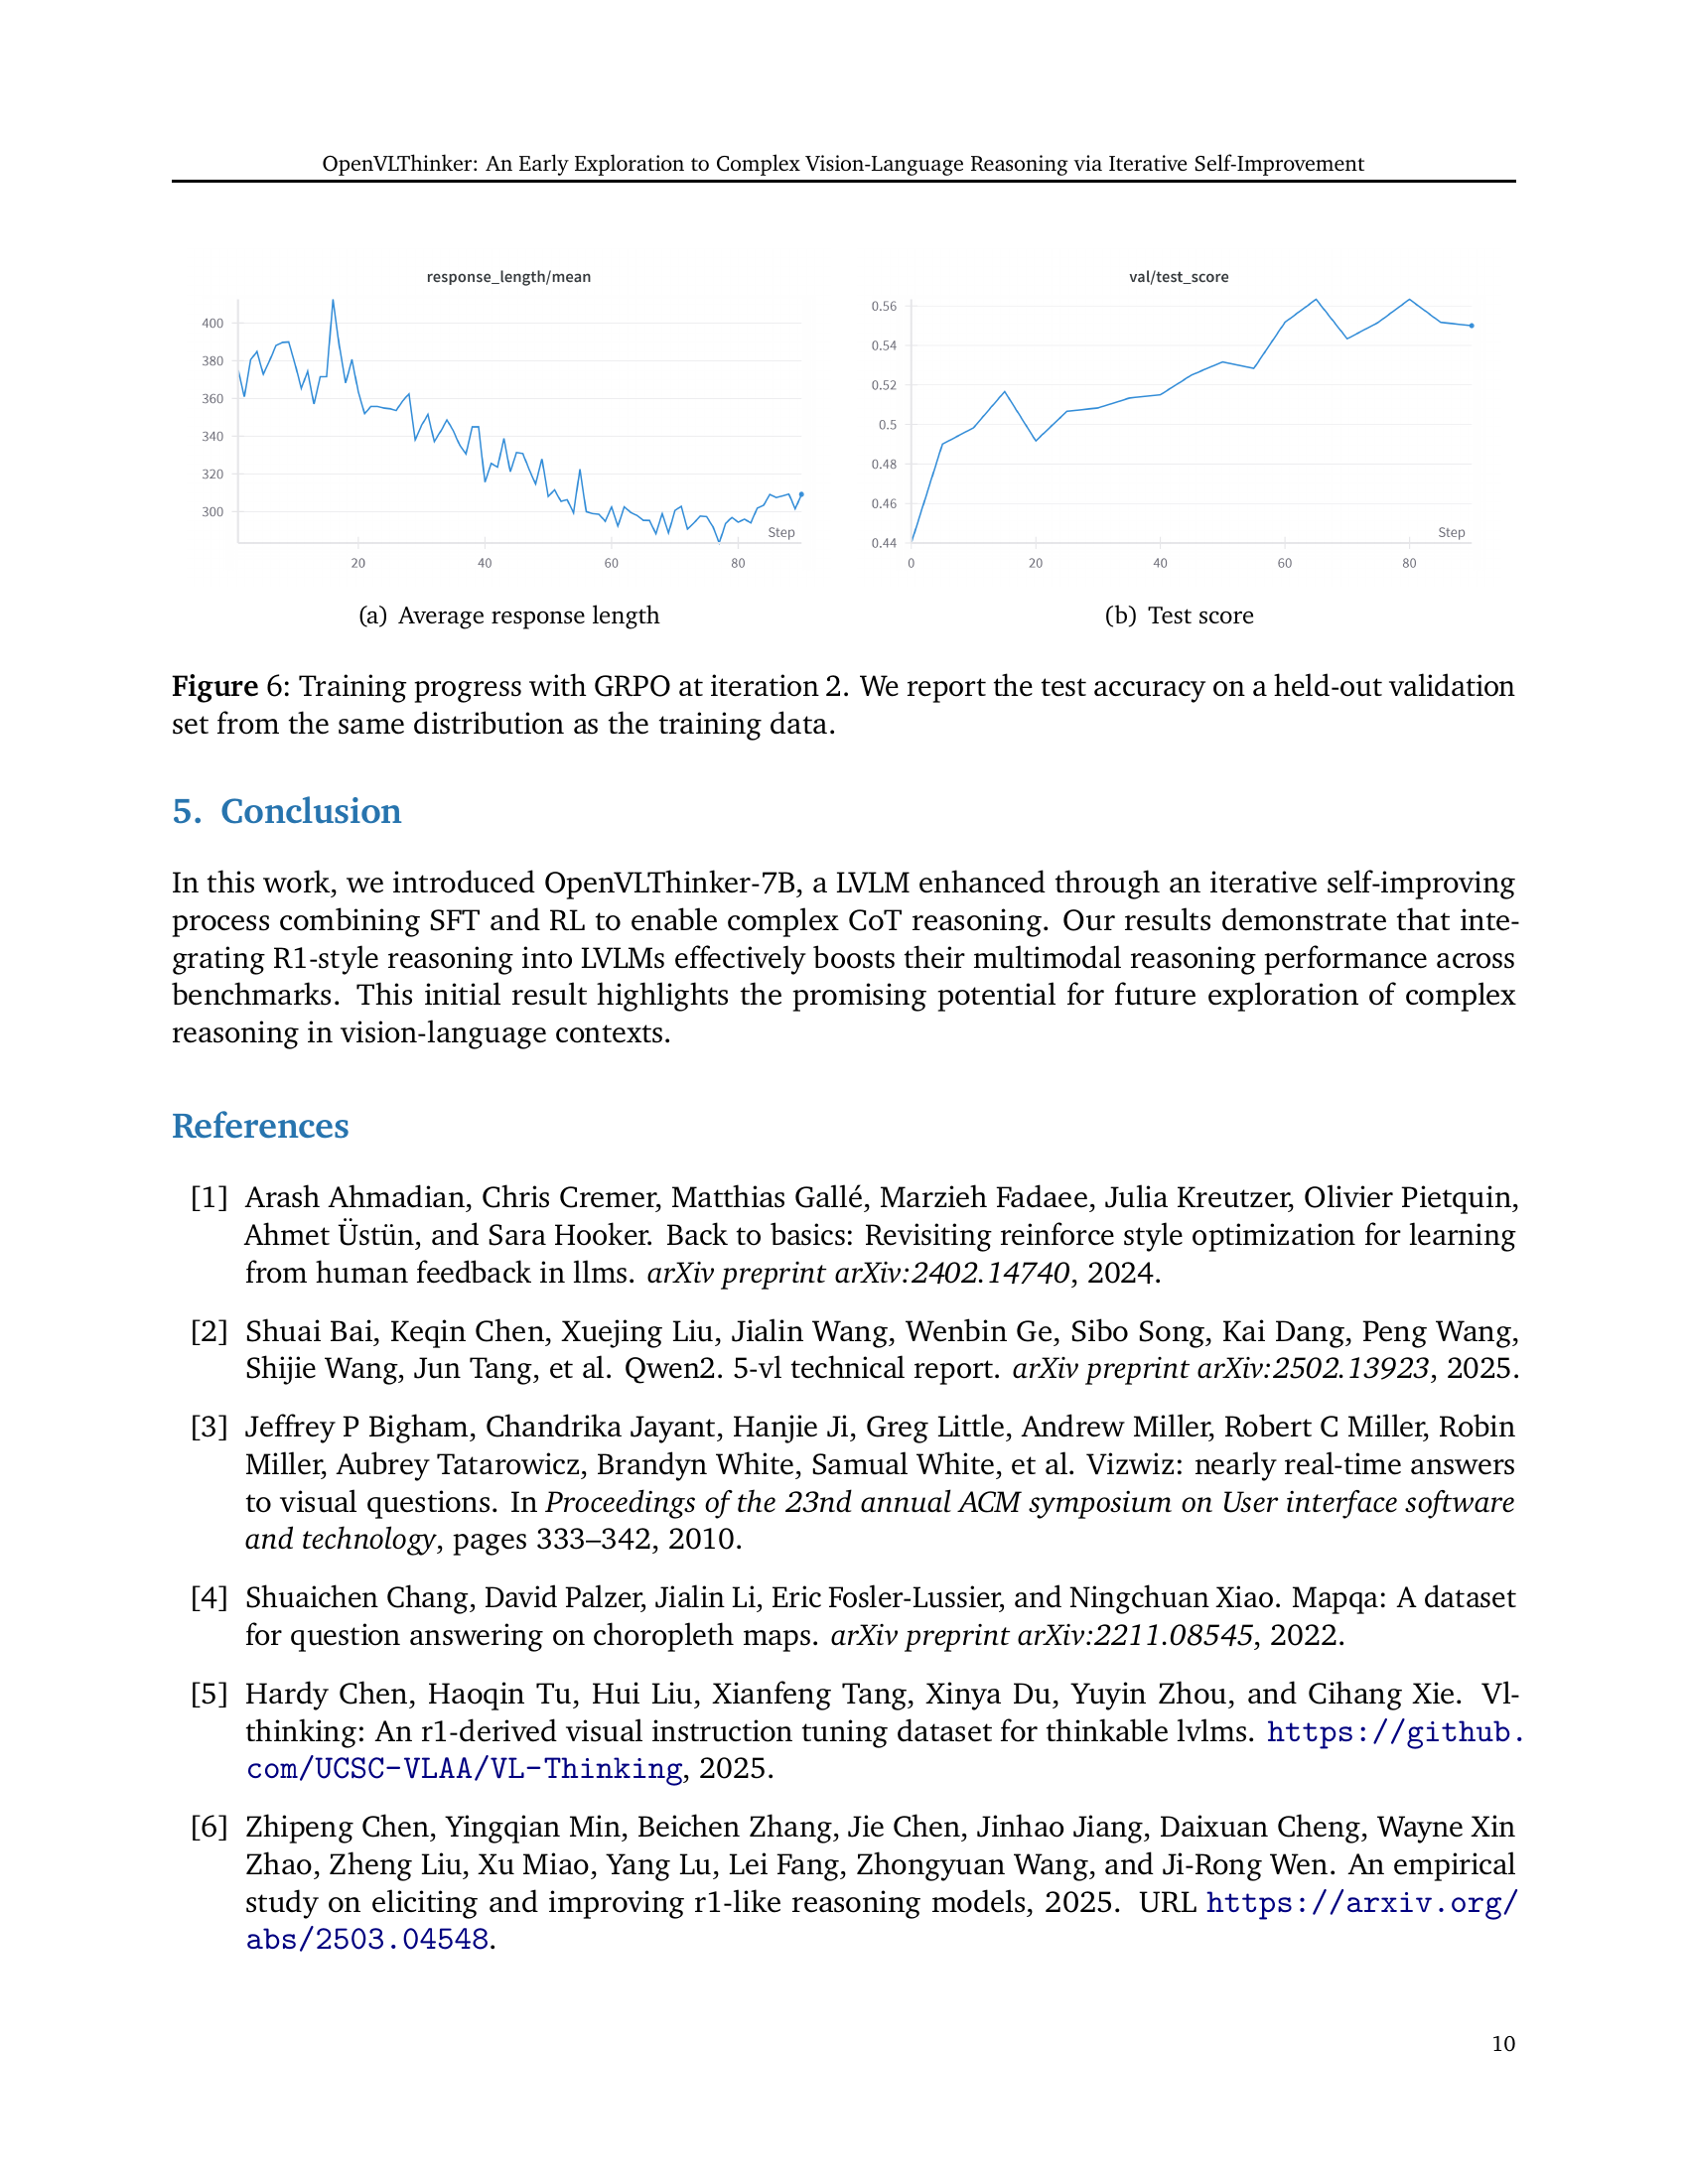
🔼 This figure displays the training progress of the model using Group Relative Policy Optimization (GRPO) at iteration 2. The left subplot shows the average response length throughout the training process, indicating the length of the model’s reasoning steps. The right subplot presents the test accuracy, measured on a held-out validation set that mirrors the distribution of the training data, allowing for a robust evaluation of the model’s generalization capabilities. The trendlines illustrate the interplay between the length of the reasoning process and the overall model accuracy, revealing the effectiveness of the GRPO training strategy.
read the caption
Figure 6: Training progress with GRPO at iteration 2. We report the test accuracy on a held-out validation set from the same distribution as the training data.

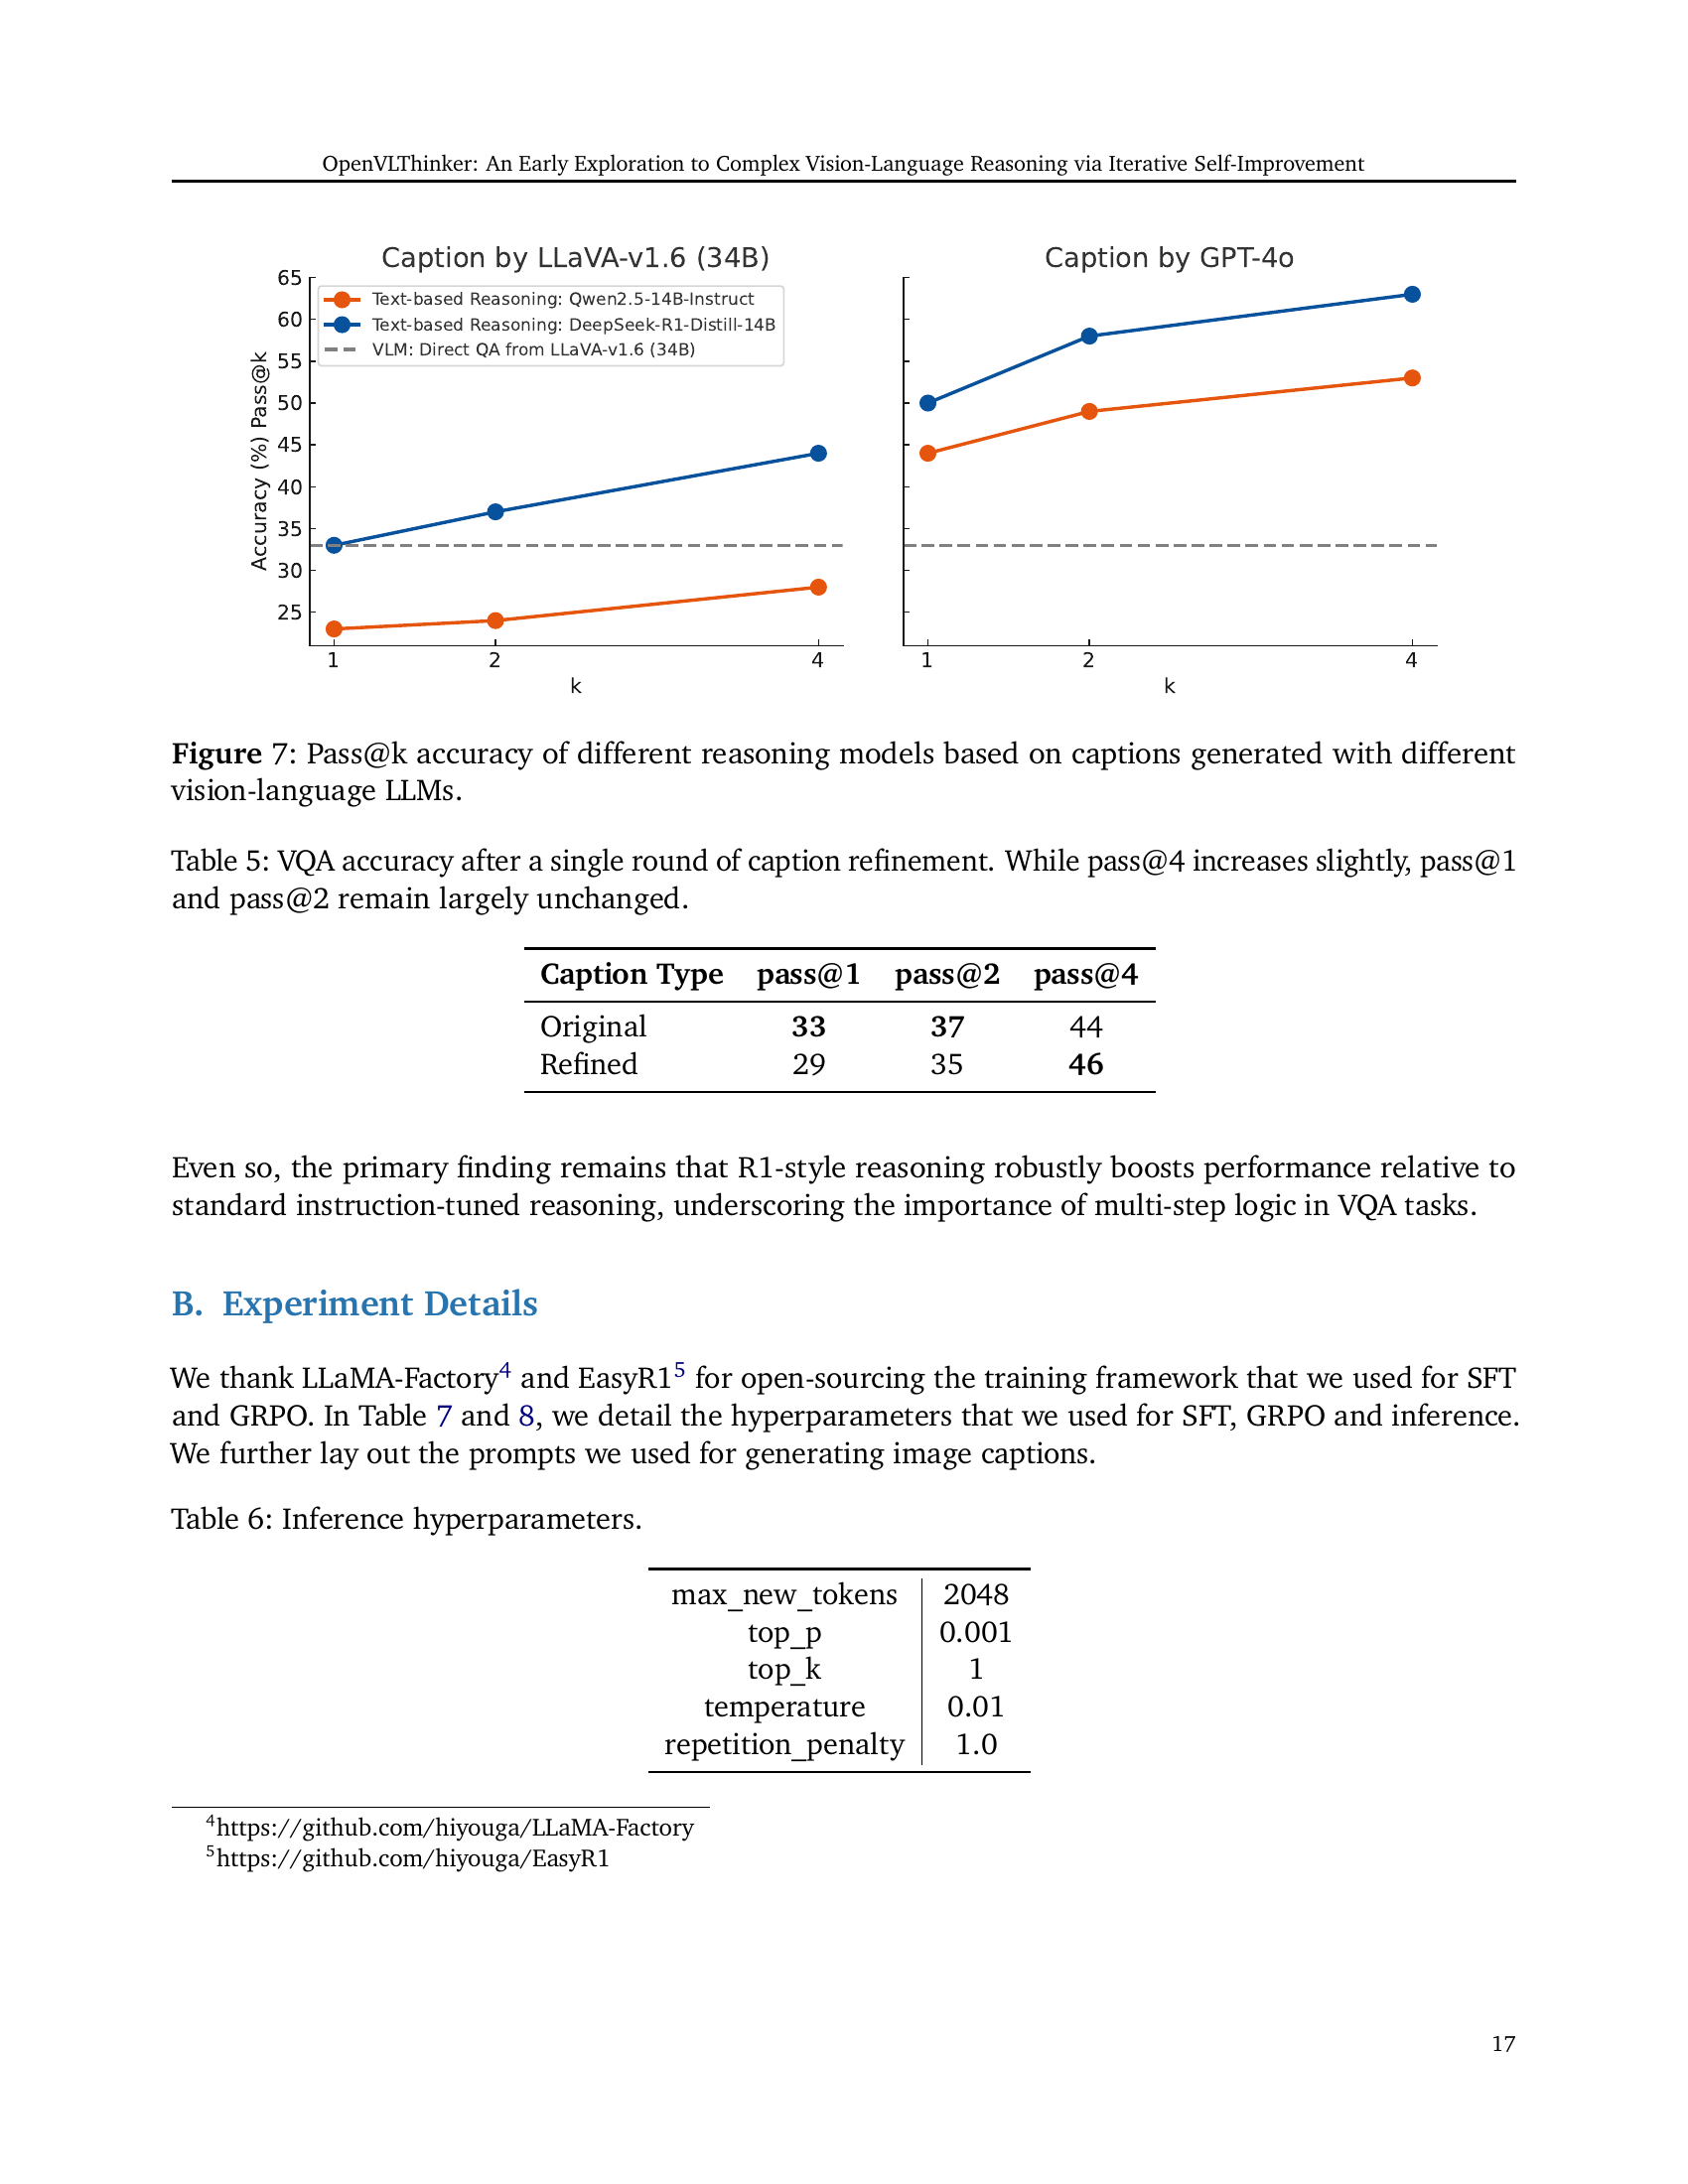
🔼 This figure displays the performance (Pass@k accuracy) of different reasoning models on a visual question answering (VQA) task. The performance is evaluated based on captions generated by two different vision-language large language models (LLMs): LLaVA-v1.6-34B and GPT-40. The x-axis represents the number of reasoning paths sampled (k), while the y-axis shows the accuracy. Different colored lines represent different reasoning models, comparing standard models against those incorporating R1-style reasoning. The results illustrate the impact of caption quality from different vision-language models on the effectiveness of various reasoning approaches in a VQA context.
read the caption
Figure 7: Pass@k accuracy of different reasoning models based on captions generated with different vision-language LLMs.

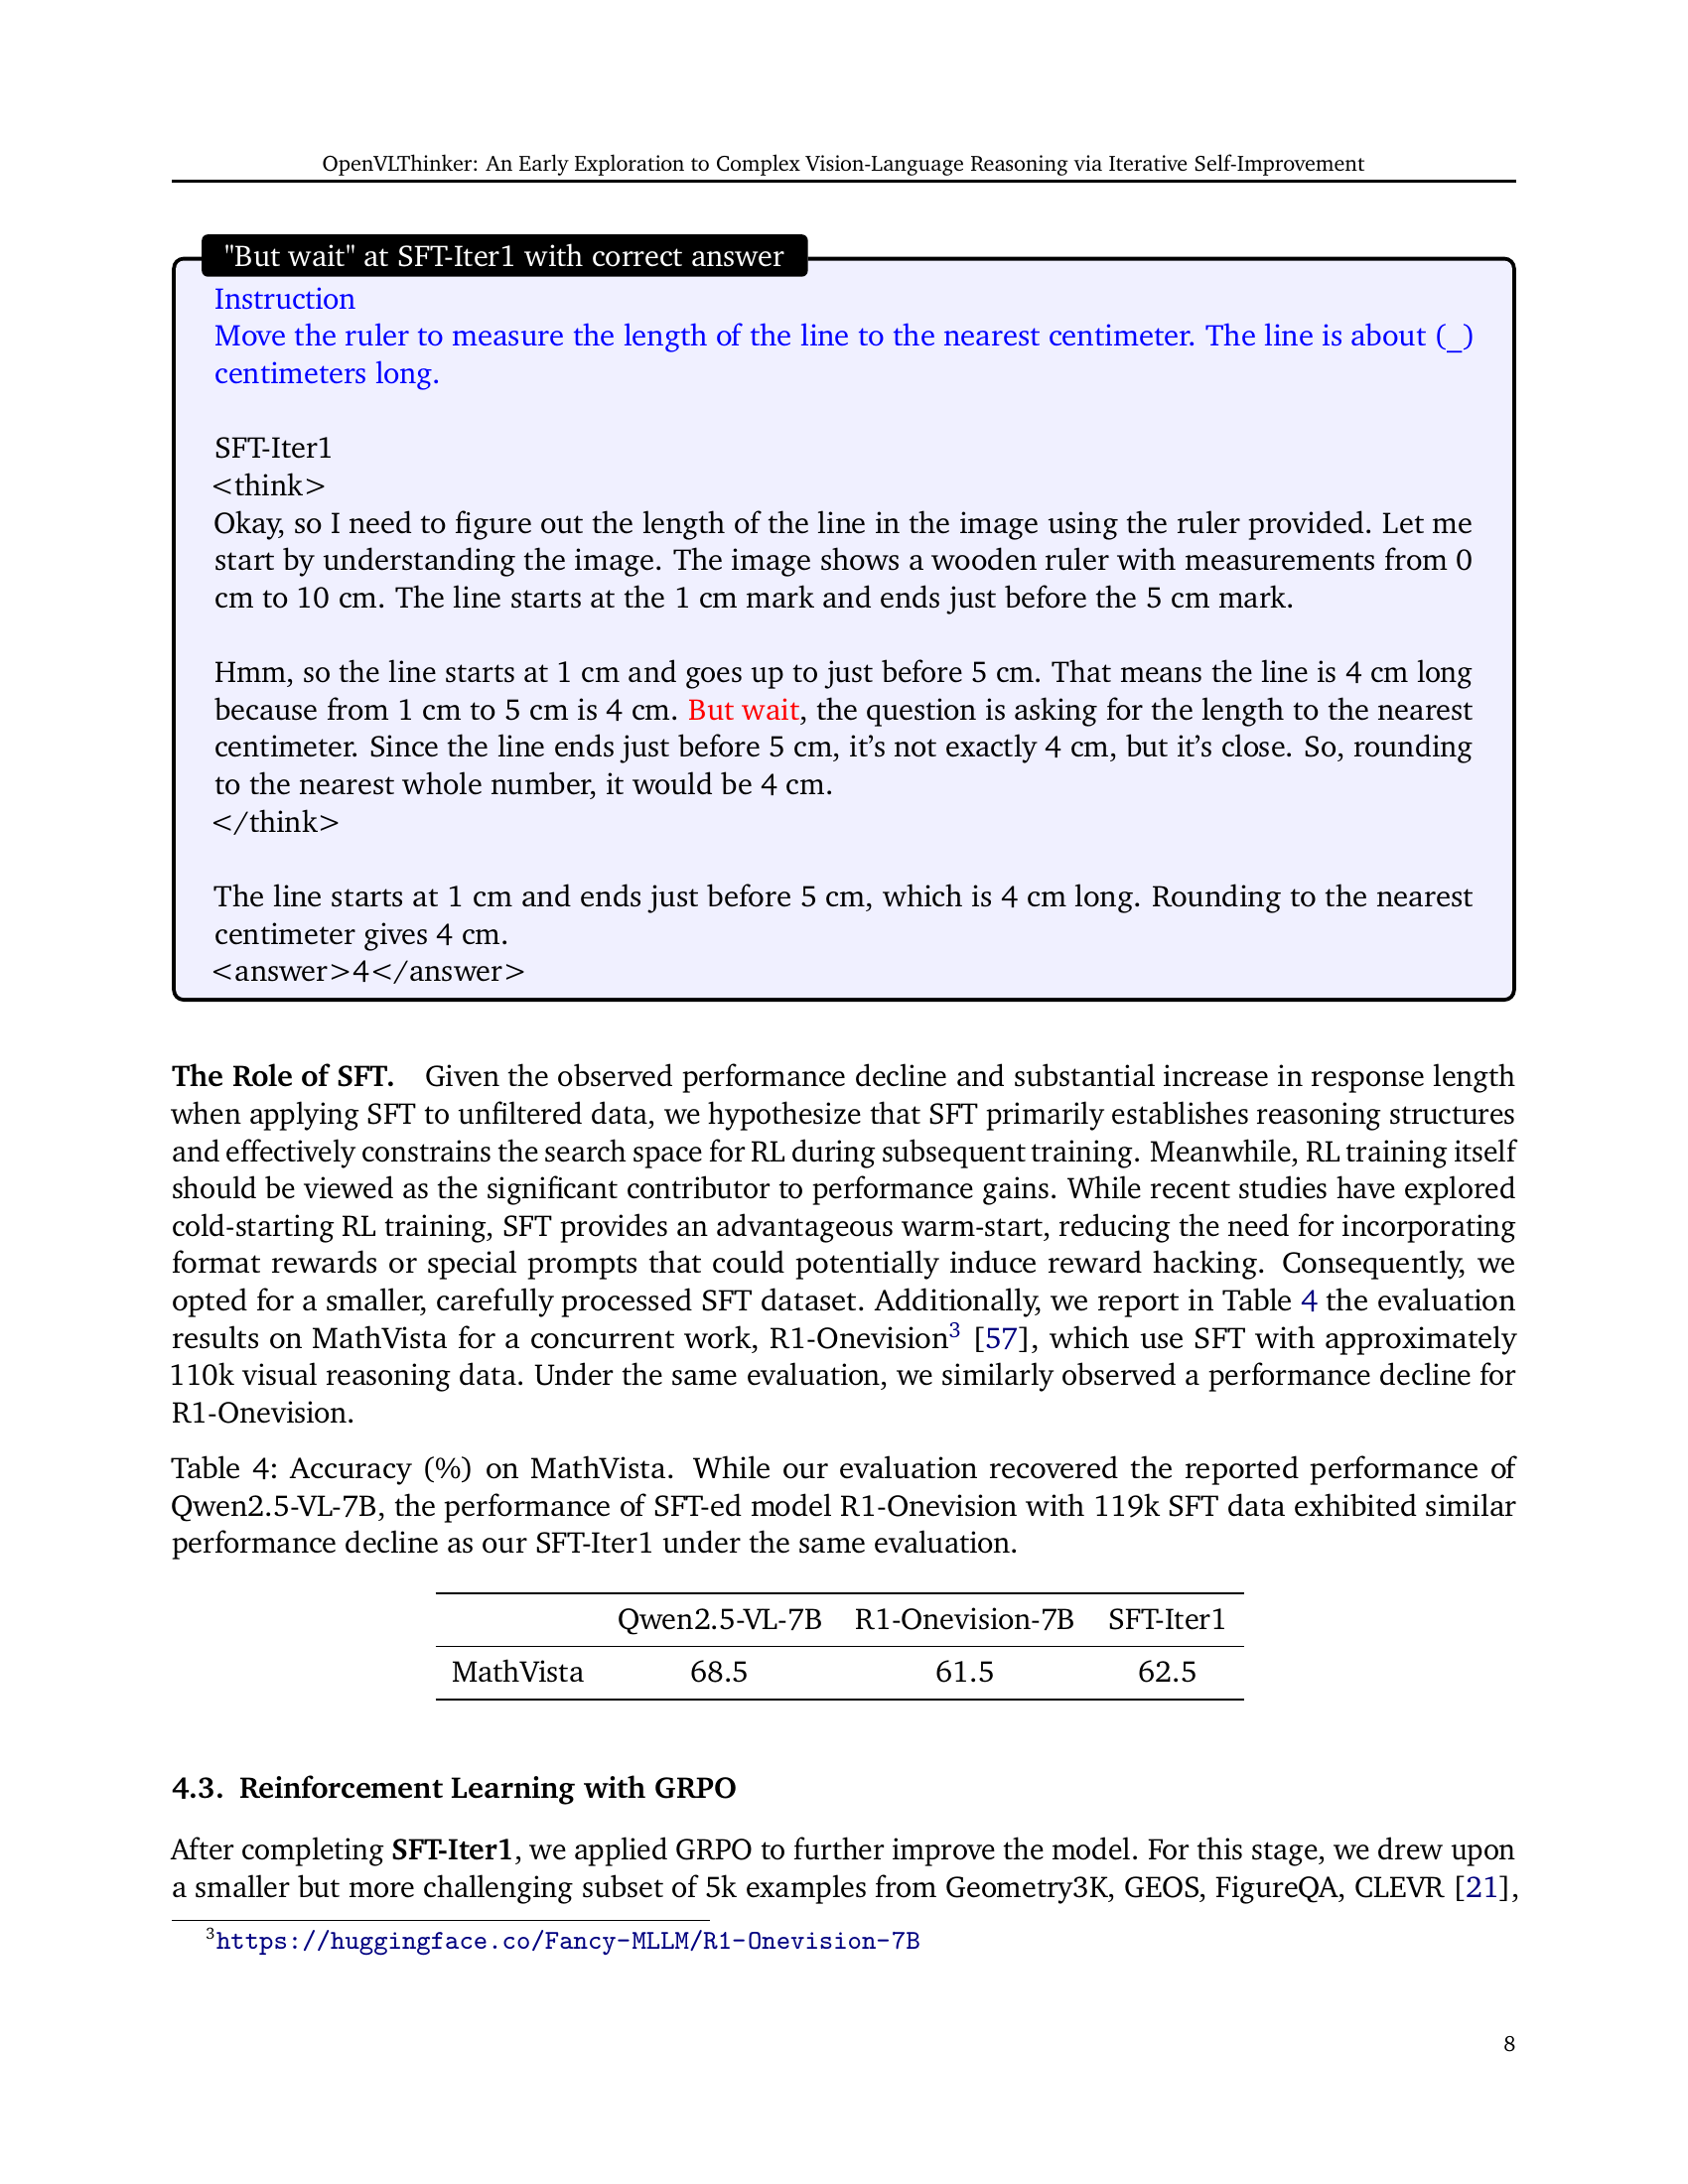
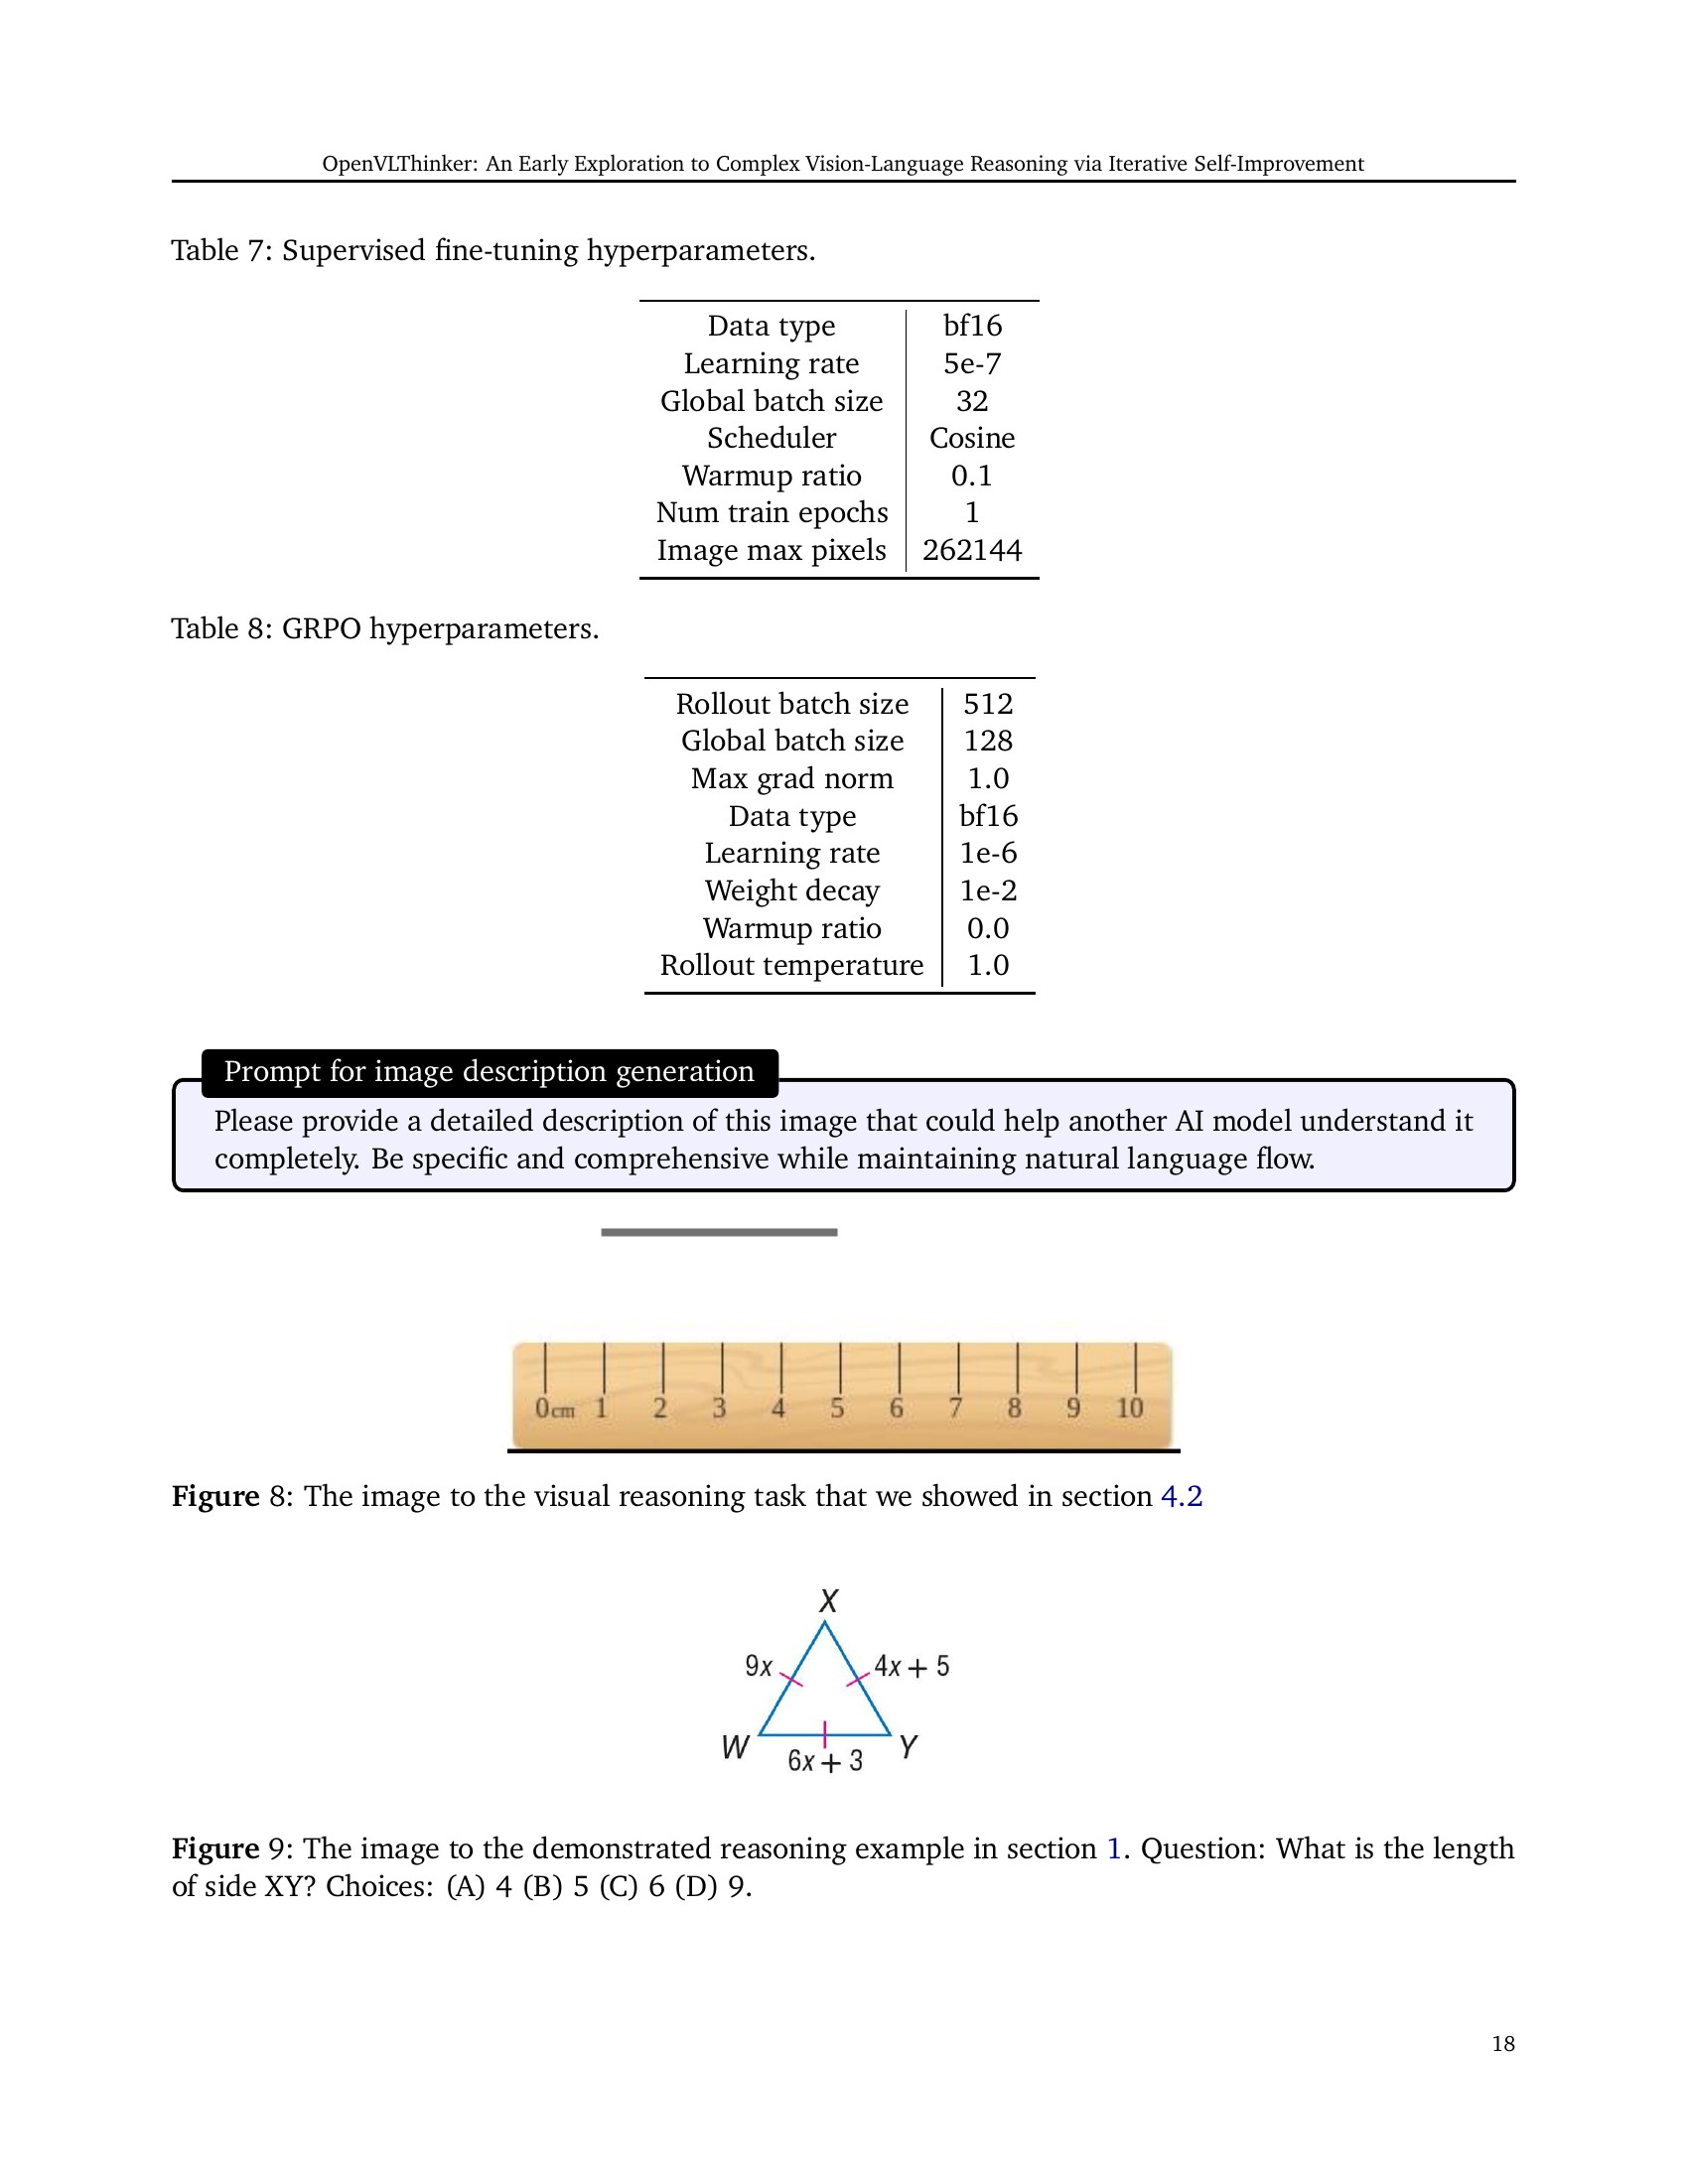
🔼 Figure 8 shows the image used in a visual reasoning task presented in Section 4.2 of the paper. The image contains a simple line segment drawn on a ruler. The task for the model is to determine the length of the line, demonstrating the model’s ability to understand simple measurements using visual information.
read the caption
Figure 8: The image to the visual reasoning task that we showed in section 4.2
More on tables
| Method | Data Sources | Data Amount |
| SFT-Iter1 | FigureQA, GEOS, Geometry3K, TabMWP, VizWiz, and AI2D | 25k |
| GRPO-Iter1 | Geometry3K, GEOS, FigureQA, CLEVR, and SuperCLEVR | 5k |
| SFT-Iter2 | FigureQA, GEOS, Geometry3K, TabMWP, VizWiz, AI2D, CLEVR, SuperCLEVR, IconQA, MapQA, and ScienceQA | 5k |
| GRPO-Iter2 | Geometry3K, GEOS, FigureQA, CLEVR, and SuperCLEVR | 5k |
| SFT-Iter3 | FigureQA, GEOS, Geometry3K, TabMWP, VizWiz, AI2D, CLEVR, SuperCLEVR, IconQA, MapQA, and ScienceQA | 5k |
| GRPO-Iter3 | Geometry3K (larger proportion), GEOS, FigureQA, CLEVR, and SuperCLEVR (larger proportion) | 5k |
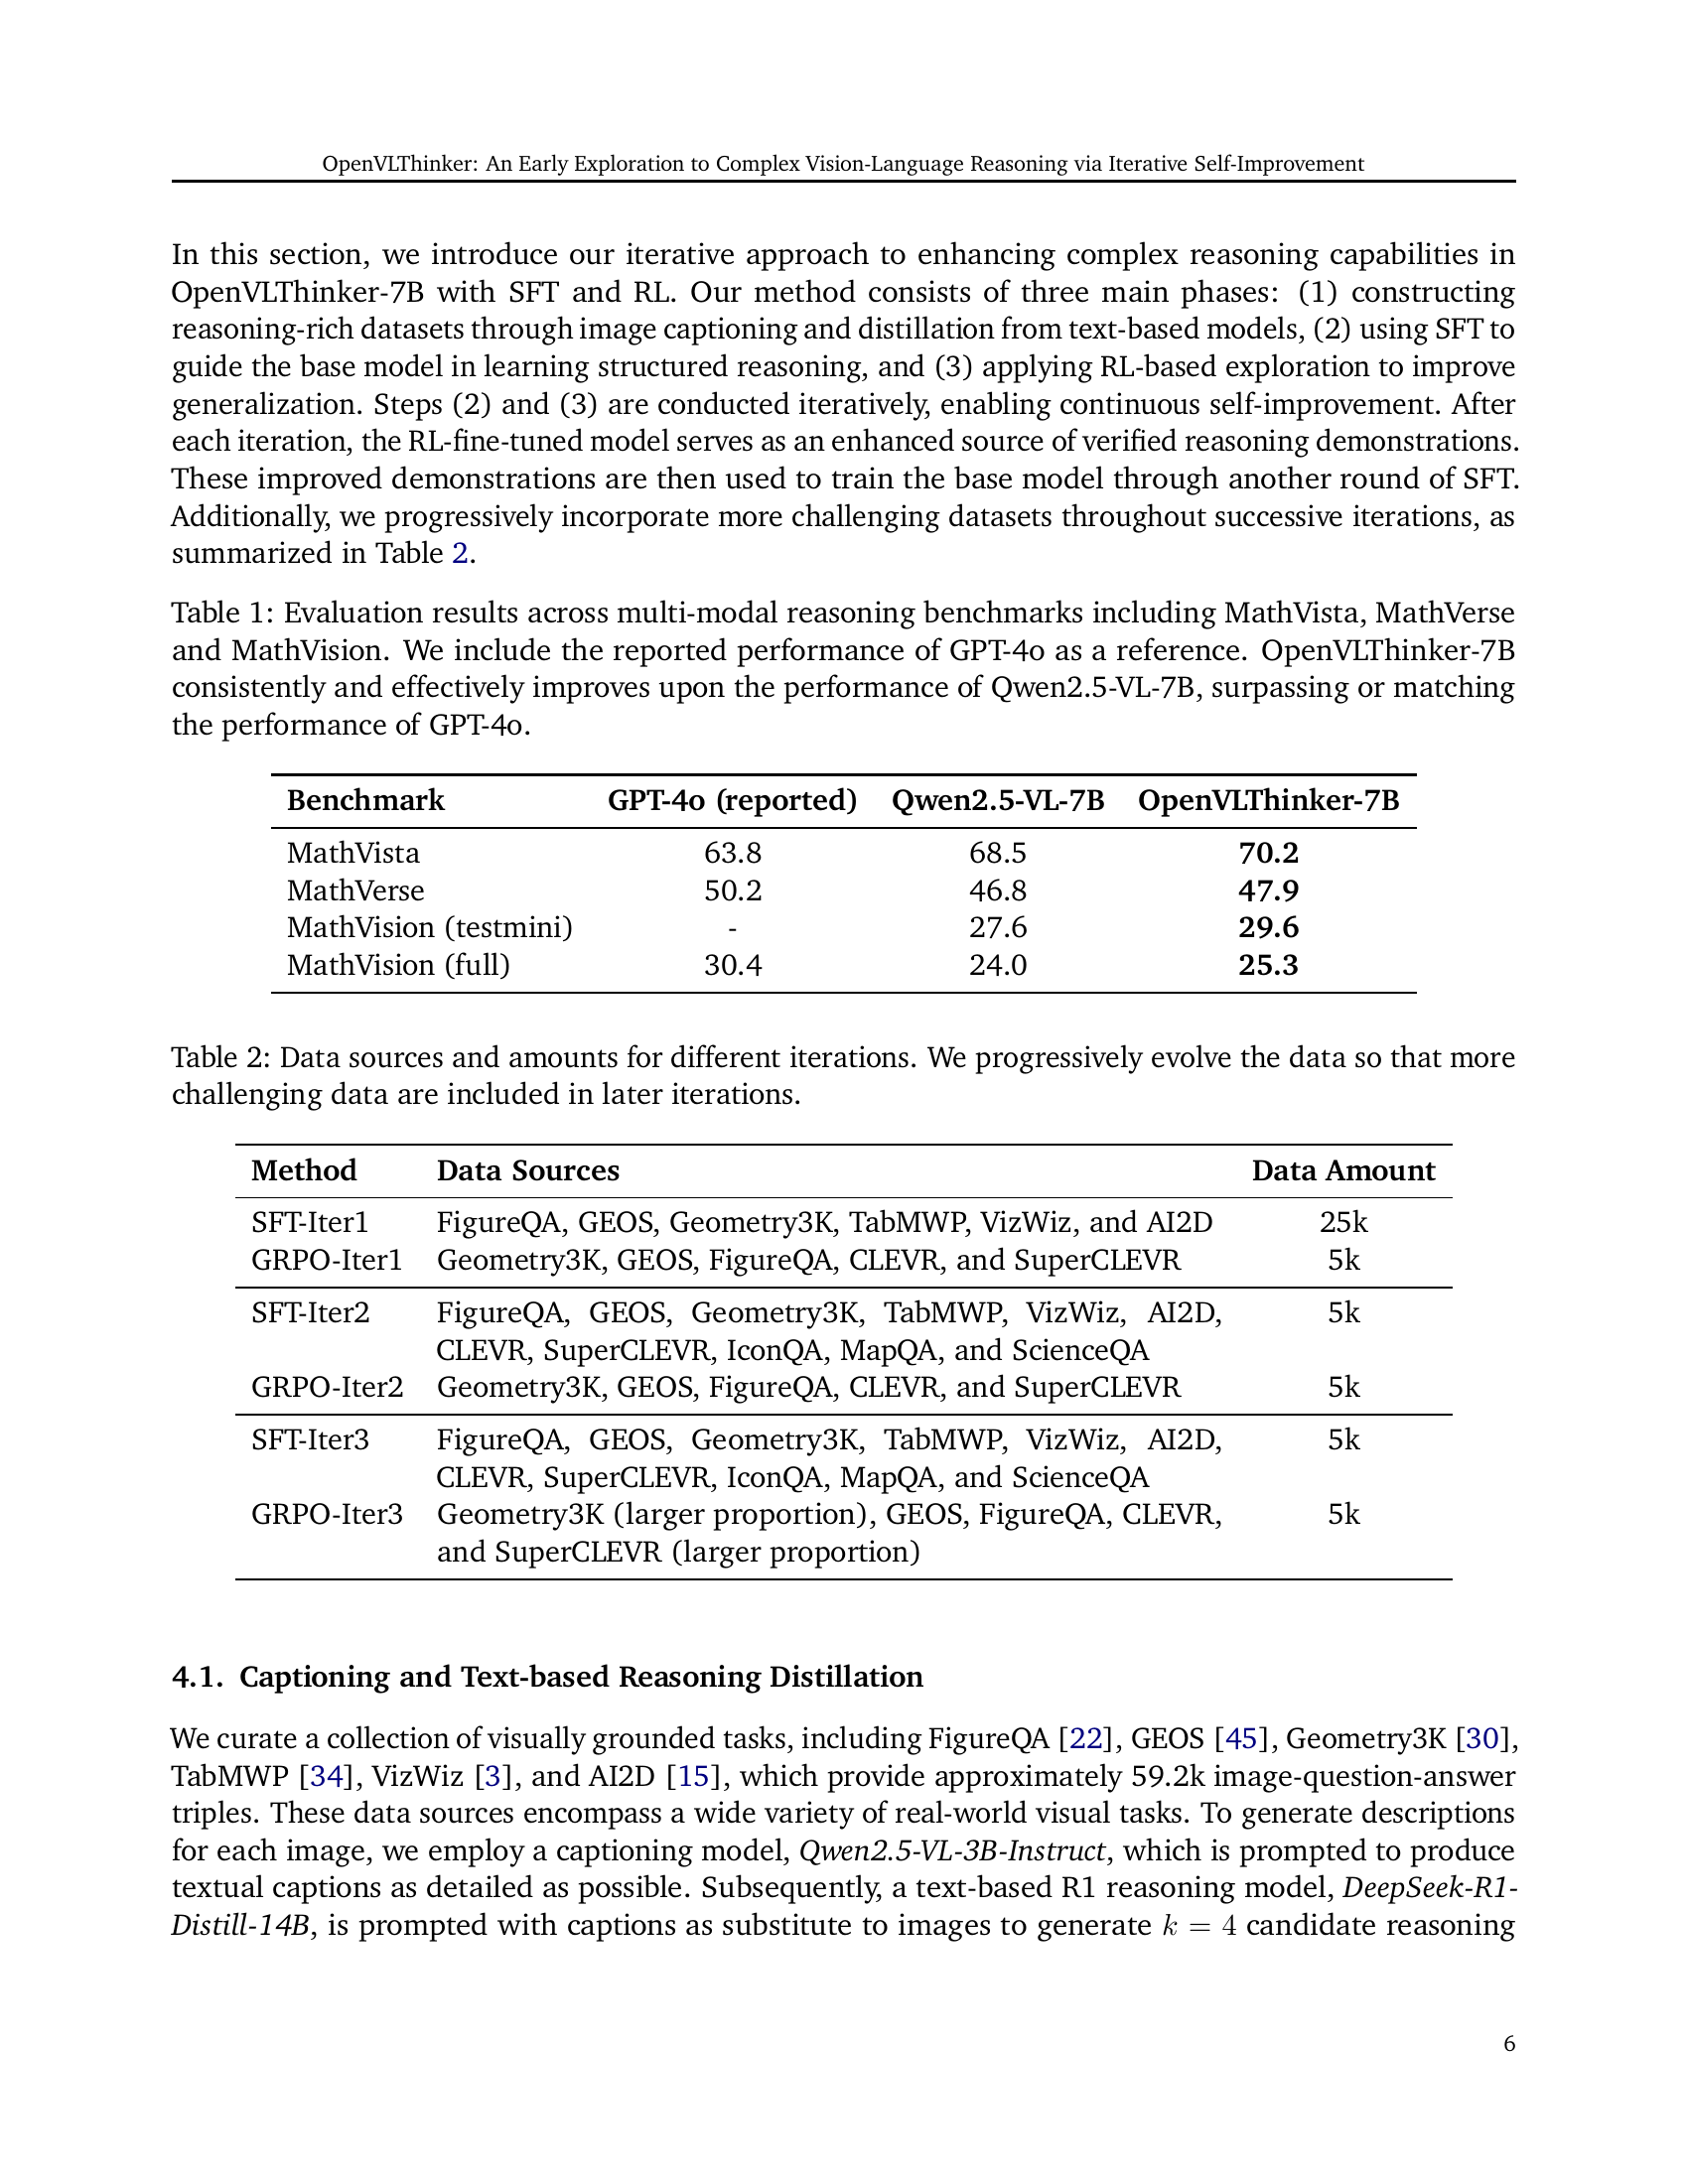
🔼 This table details the data used to train the OpenVLThinker model across three iterative rounds of supervised fine-tuning (SFT) and reinforcement learning (RL). Each iteration builds upon the previous one, with the model’s improved reasoning capabilities from the RL phase used to generate refined training data for the next SFT phase. The table shows the datasets included in each iteration, illustrating a progressive increase in the difficulty of the reasoning tasks. The amount of data used in each SFT and RL iteration is also specified. This iterative process enables the model to learn more complex reasoning skills over time.
read the caption
Table 2: Data sources and amounts for different iterations. We progressively evolve the data so that more challenging data are included in later iterations.
| Model Variant | Accuracy (%) |
| Qwen2.5-VL-7B (baseline) | 68.5 |
| Vanilla SFT data (unfiltered) | 48.4 |
| Filtered by length (500 words) | 55.0 |
| Removed reflections (SFT-Iter1) | 62.5 |
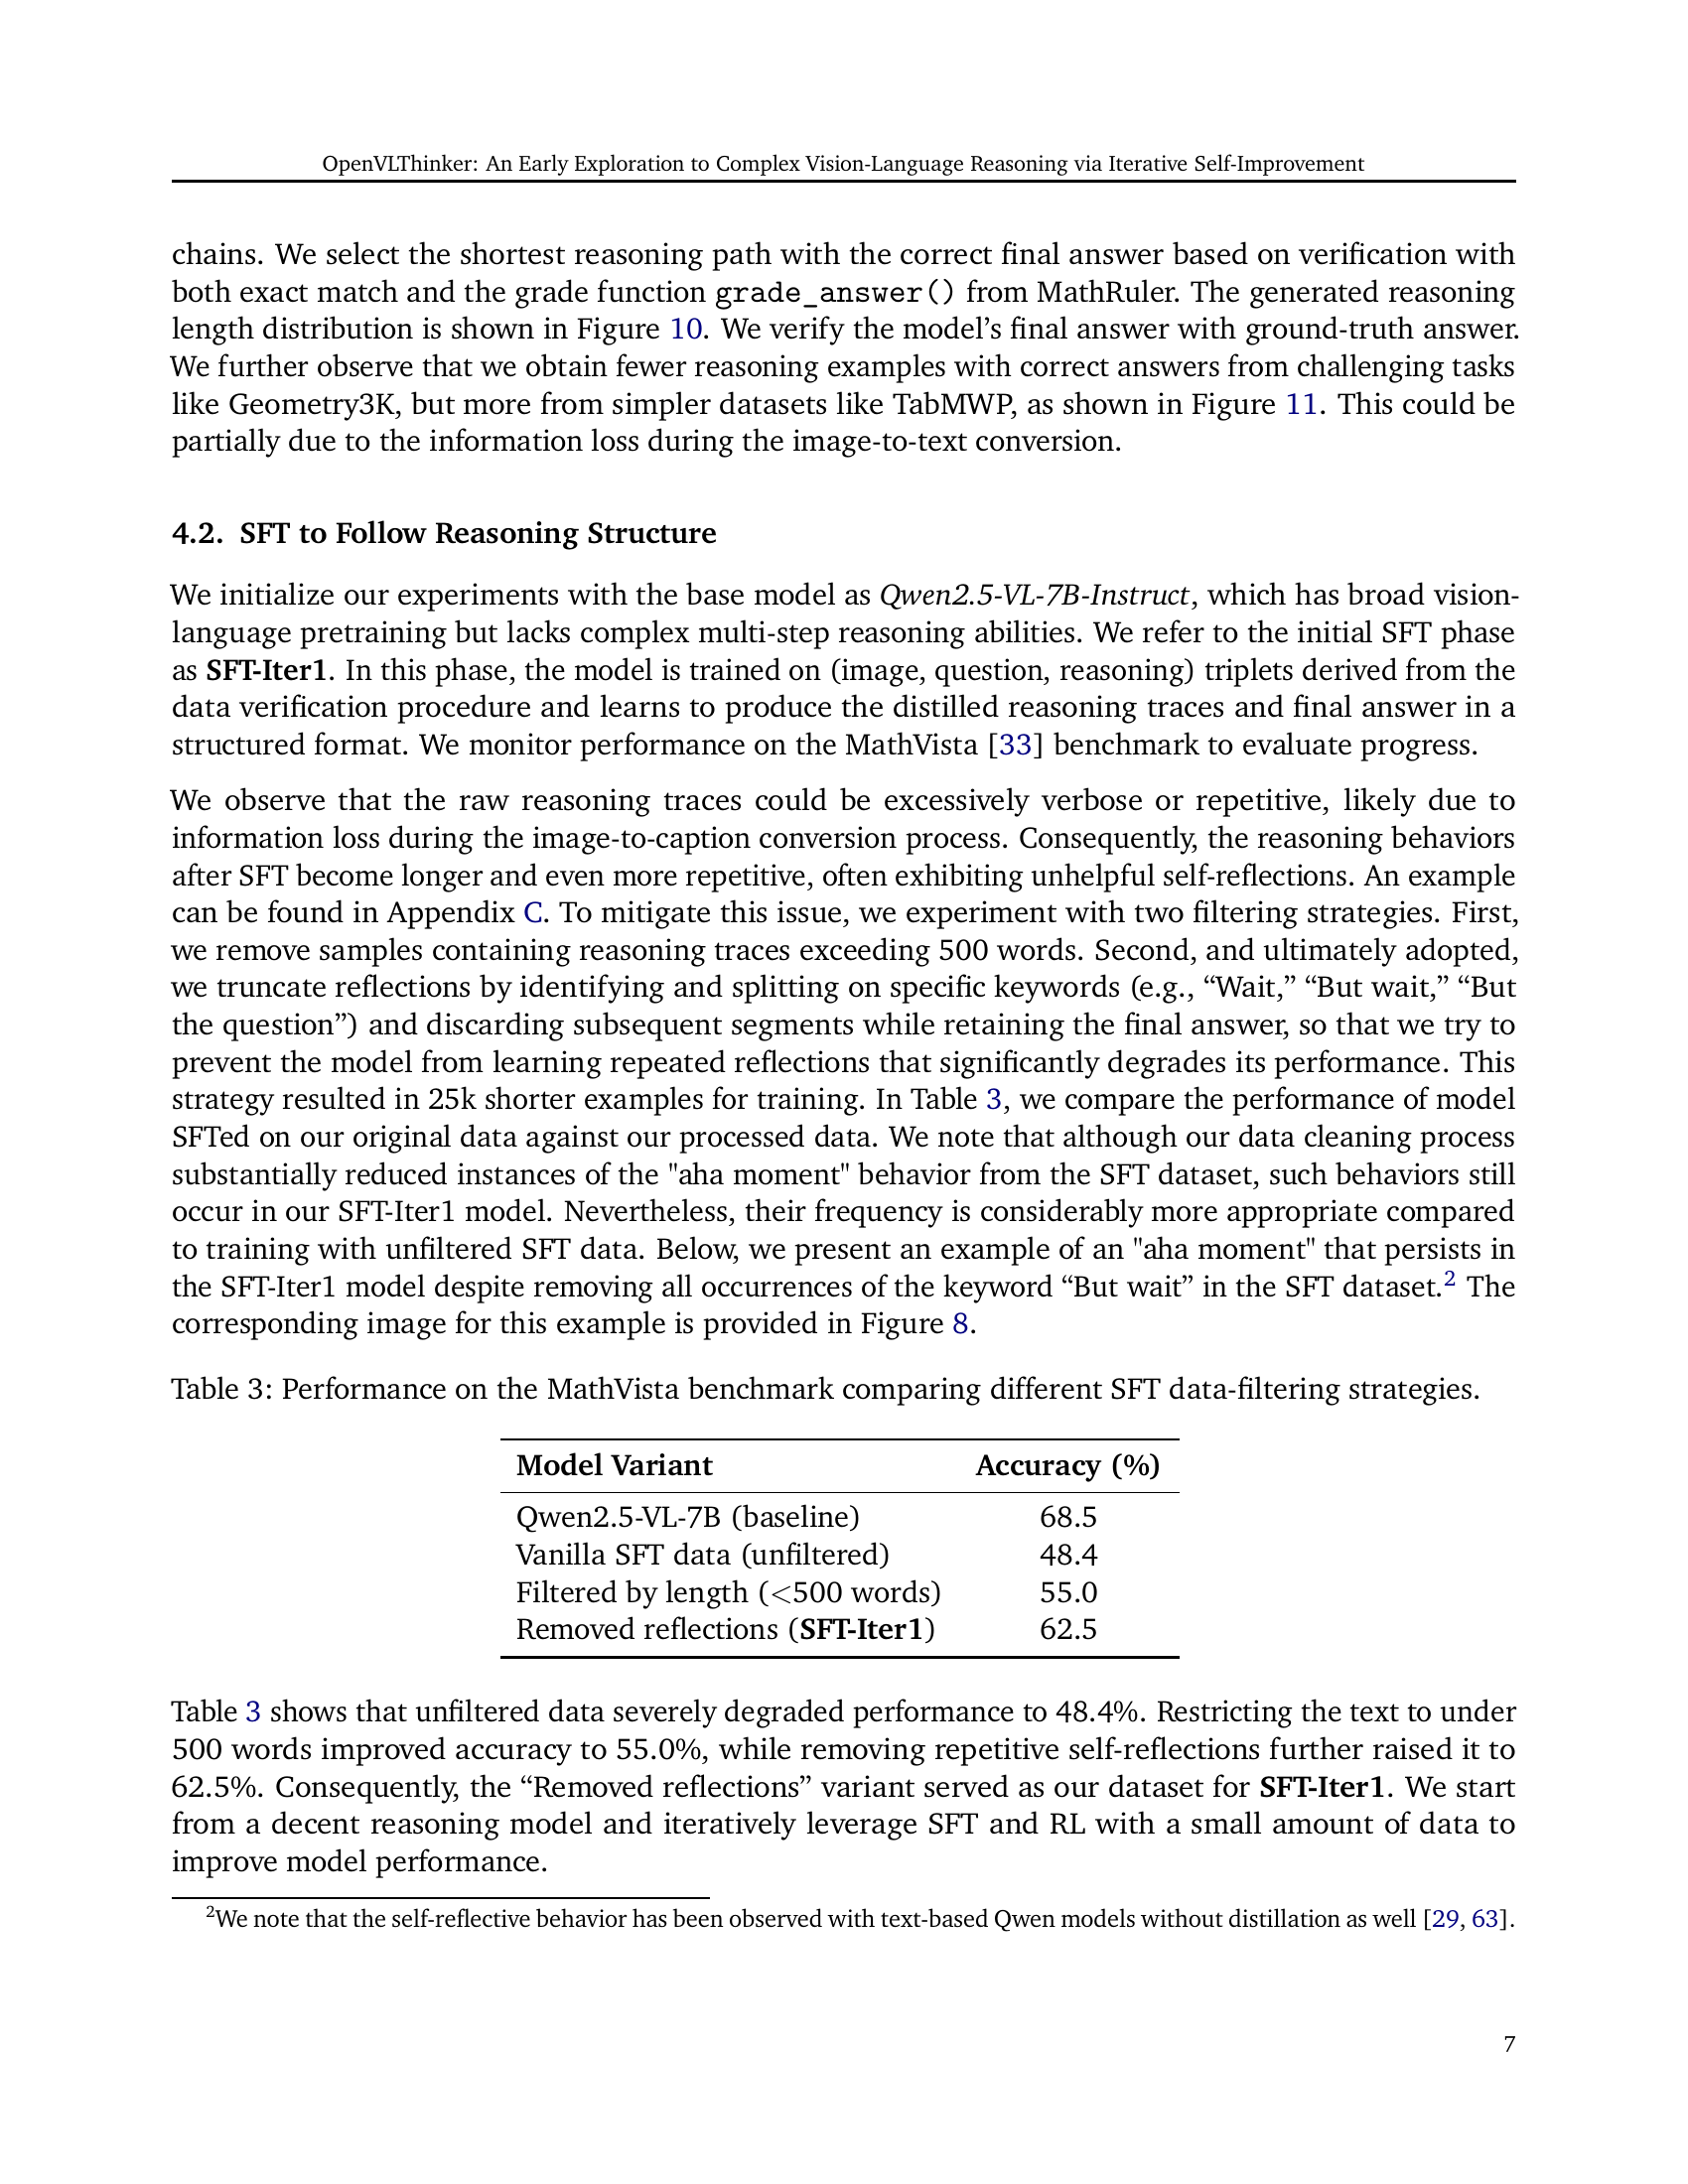
🔼 This table presents the performance comparison of different data filtering strategies used during supervised fine-tuning (SFT) on the MathVista benchmark. It shows how different preprocessing techniques applied to the training data impact the model’s accuracy. Specifically, it contrasts the results obtained using unfiltered data, data filtered by length (under 500 words), and data with reflections removed. This allows for an analysis of how data cleaning affects the model’s ability to learn effective reasoning strategies.
read the caption
Table 3: Performance on the MathVista benchmark comparing different SFT data-filtering strategies.
| Qwen2.5-VL-7B | R1-Onevision-7B | SFT-Iter1 | |
| MathVista | 68.5 | 61.5 | 62.5 |
🔼 Table 4 presents a comparison of the accuracy achieved on the MathVista benchmark by different models. The baseline is Qwen2.5-VL-7B, whose reported performance was replicated in this study. The table also includes the performance of R1-Onevision, another model which was fine-tuned using supervised fine-tuning (SFT) with a substantially larger dataset (119k examples) compared to the current study. The key finding is that both the current study’s SFT-Iter1 model and R1-Onevision exhibit a performance decrease compared to the baseline, suggesting that simply applying SFT with a large dataset may not guarantee improved performance on this benchmark.
read the caption
Table 4: Accuracy (%) on MathVista. While our evaluation recovered the reported performance of Qwen2.5-VL-7B, the performance of SFT-ed model R1-Onevision with 119k SFT data exhibited similar performance decline as our SFT-Iter1 under the same evaluation.
| Caption Type | pass@1 | pass@2 | pass@4 |
| Original | 33 | 37 | 44 |
| Refined | 29 | 35 | 46 |
🔼 This table presents the results of a single-round caption refinement experiment on Visual Question Answering (VQA) tasks. It shows the impact of refining captions on the model’s ability to correctly answer questions, measuring accuracy at different thresholds (pass@1, pass@2, pass@4). The results indicate only a minor improvement in accuracy at the highest threshold (pass@4), while accuracy remains largely unchanged at lower thresholds. This suggests that a single round of caption refinement is insufficient to produce significant gains in VQA performance.
read the caption
Table 5: VQA accuracy after a single round of caption refinement. While pass@4 increases slightly, pass@1 and pass@2 remain largely unchanged.
| max_new_tokens | 2048 |
| top_p | 0.001 |
| top_k | 1 |
| temperature | 0.01 |
| repetition_penalty | 1.0 |
🔼 This table lists the hyperparameters used during the inference phase of the OpenVLThinker model. It includes values for parameters such as
max_new_tokens, controlling the maximum number of tokens generated;top_pandtop_k, which govern token selection probabilities;temperature, influencing randomness in generation; andrepetition_penalty, preventing repetitive outputs.read the caption
Table 6: Inference hyperparameters.
| Data type | bf16 |
| Learning rate | 5e-7 |
| Global batch size | 32 |
| Scheduler | Cosine |
| Warmup ratio | 0.1 |
| Num train epochs | 1 |
| Image max pixels | 262144 |
🔼 Table 7 details the hyperparameters used during the supervised fine-tuning phase of the OpenVLThinker model training. It lists the data type used (bf16), the learning rate, the global and rollout batch sizes, the scheduler type (Cosine), the warmup ratio, the number of training epochs, and the maximum number of image pixels.
read the caption
Table 7: Supervised fine-tuning hyperparameters.
| Rollout batch size | 512 |
| Global batch size | 128 |
| Max grad norm | 1.0 |
| Data type | bf16 |
| Learning rate | 1e-6 |
| Weight decay | 1e-2 |
| Warmup ratio | 0.0 |
| Rollout temperature | 1.0 |
🔼 Table 8 presents the hyperparameters used in the Group Relative Policy Optimization (GRPO) algorithm, a reinforcement learning method employed in the study. These hyperparameters control various aspects of the GRPO training process, including the batch sizes for both rollout and gradient calculations, the maximum gradient norm to prevent exploding gradients, the learning rate and weight decay for optimization, and the rollout temperature that affects the randomness of action selection during the rollout phase.
read the caption
Table 8: GRPO hyperparameters.
Full paper#