TL;DR#
Large Language Models (LLMs) are facing the challenge of solving mathematical problems. Current approaches focus on refining correct training data, overlooking the valuable insights within error data. This omission limits LLMs’ reflective reasoning ability. Moreover, existing methods for leveraging error data often involve complex mechanisms like Monte Carlo Tree Search, adding to the computational overhead and complexity.
To solve the problems above, LEMMA is proposed, a novel method to systematically enhance LLMs’ reasoning. It involves constructing and learning from error-corrective trajectories using two complementary mechanisms, Fix & Continue, and Fresh & Restart Trajectories. Experiments show LEMMA achieves state-of-the-art performance in benchmarks like GSM8K and MATH. LEMMA also reduces the occurrence of representative error types consistently.
Key Takeaways#
Why does it matter?#
This paper is important because it addresses the critical issue of error correction in LLMs, a key area for improving their reliability. It aligns with the trend of enhancing reasoning through learning from mistakes and opens new avenues for researchers by demonstrating a structured approach to error analysis and correction, which can be applied to other complex tasks.
Visual Insights#

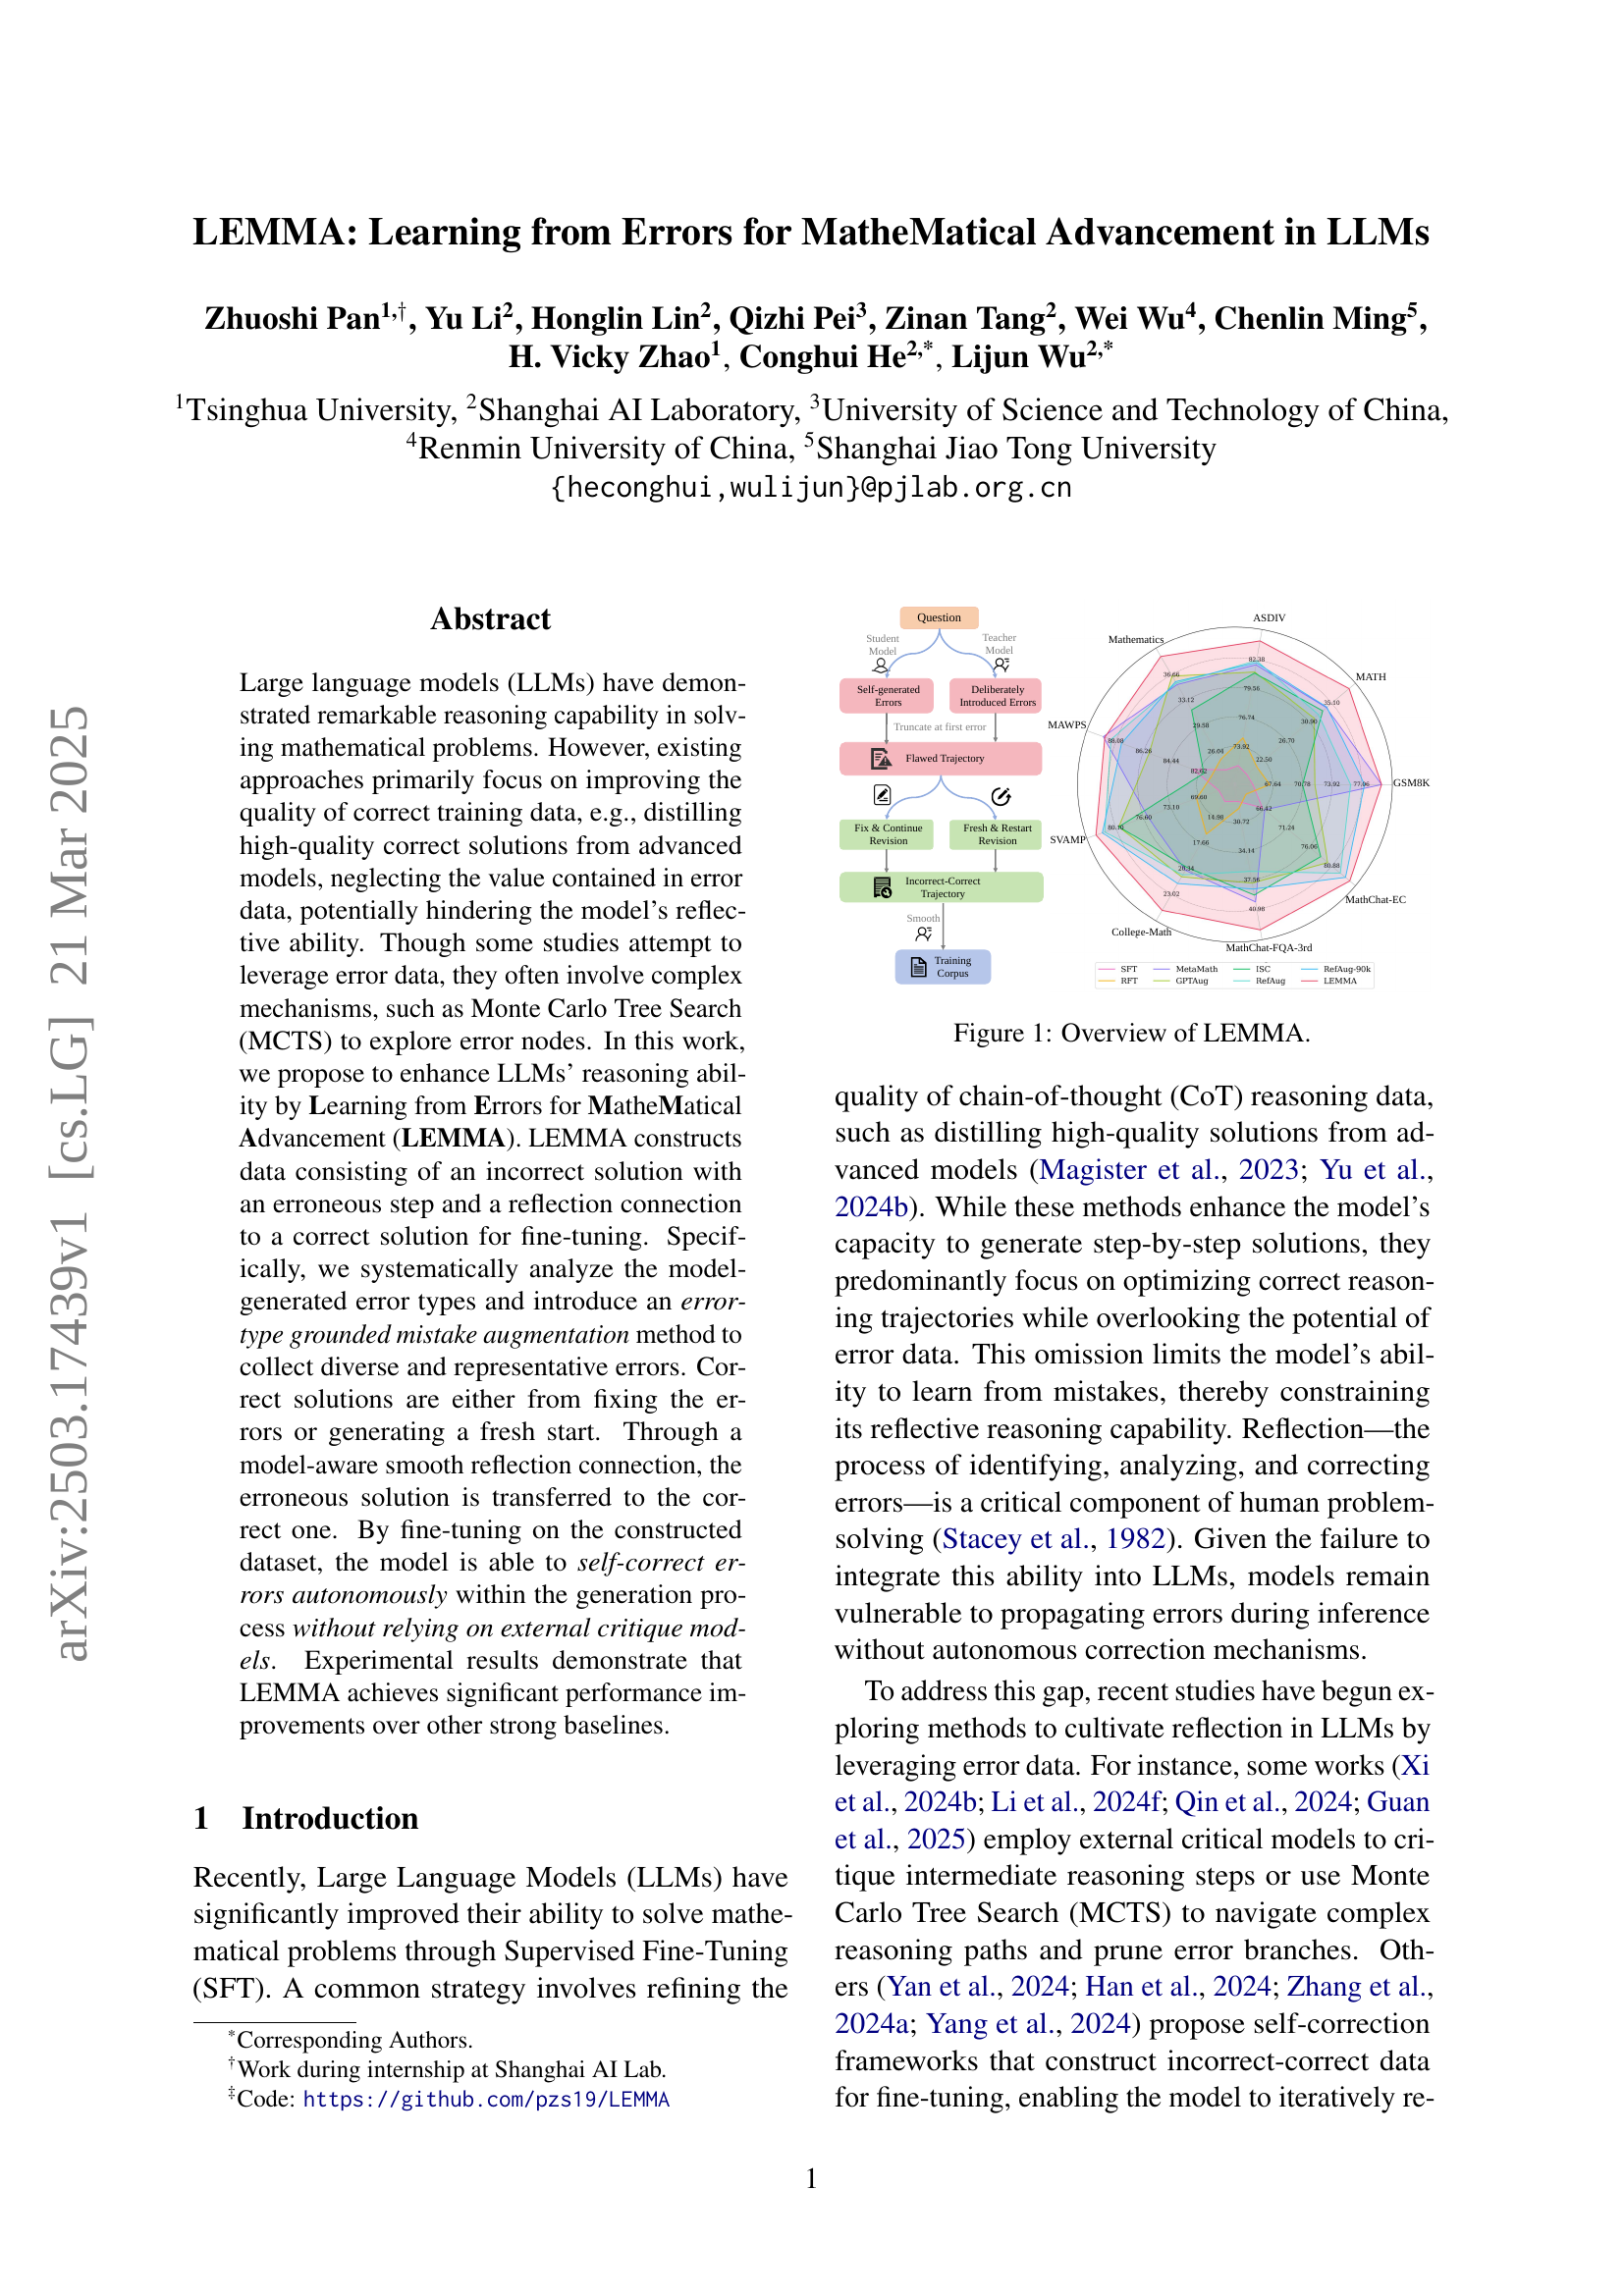
🔼 The figure illustrates the LEMMA framework, which enhances LLMs’ mathematical reasoning abilities by learning from errors. It shows how LEMMA constructs a dataset of incorrect solutions paired with their corresponding corrections. These pairs consist of an incorrect solution with an erroneous step and a reflection connecting it to the correct solution. The process involves systematically analyzing model-generated errors, augmenting errors using a model-aware approach, and then creating paired correct solutions either by directly fixing the errors or starting anew. The resulting data is used to fine-tune the LLM, enabling it to self-correct errors autonomously during inference.
read the caption
Figure 1: Overview of LEMMA.
| Error Type | Definition |
|---|---|
| Calculation Error (CA) | Error appears during the calculation process. |
| Counting Error (CO) | Error occurs during the counting process. |
| Formula Confusion Error (FC) | Error appears when applying formula in inappropriate scenario. |
| Question Misinterpretation Error(QM) | Error appears because the question is misunderstood, such as ignoring specific constraints in the question. |
| Missing Step (MS) | Error entails an incomplete generation of reasoning process, lacking a necessary step. |
| Confusing Concept Error (CC) | Error occurs because two similar but actually different concepts are mistakenly confused. |
| Nonsensical Output (NO) | Inconceivable, illogical, or question-irrelevant output. |
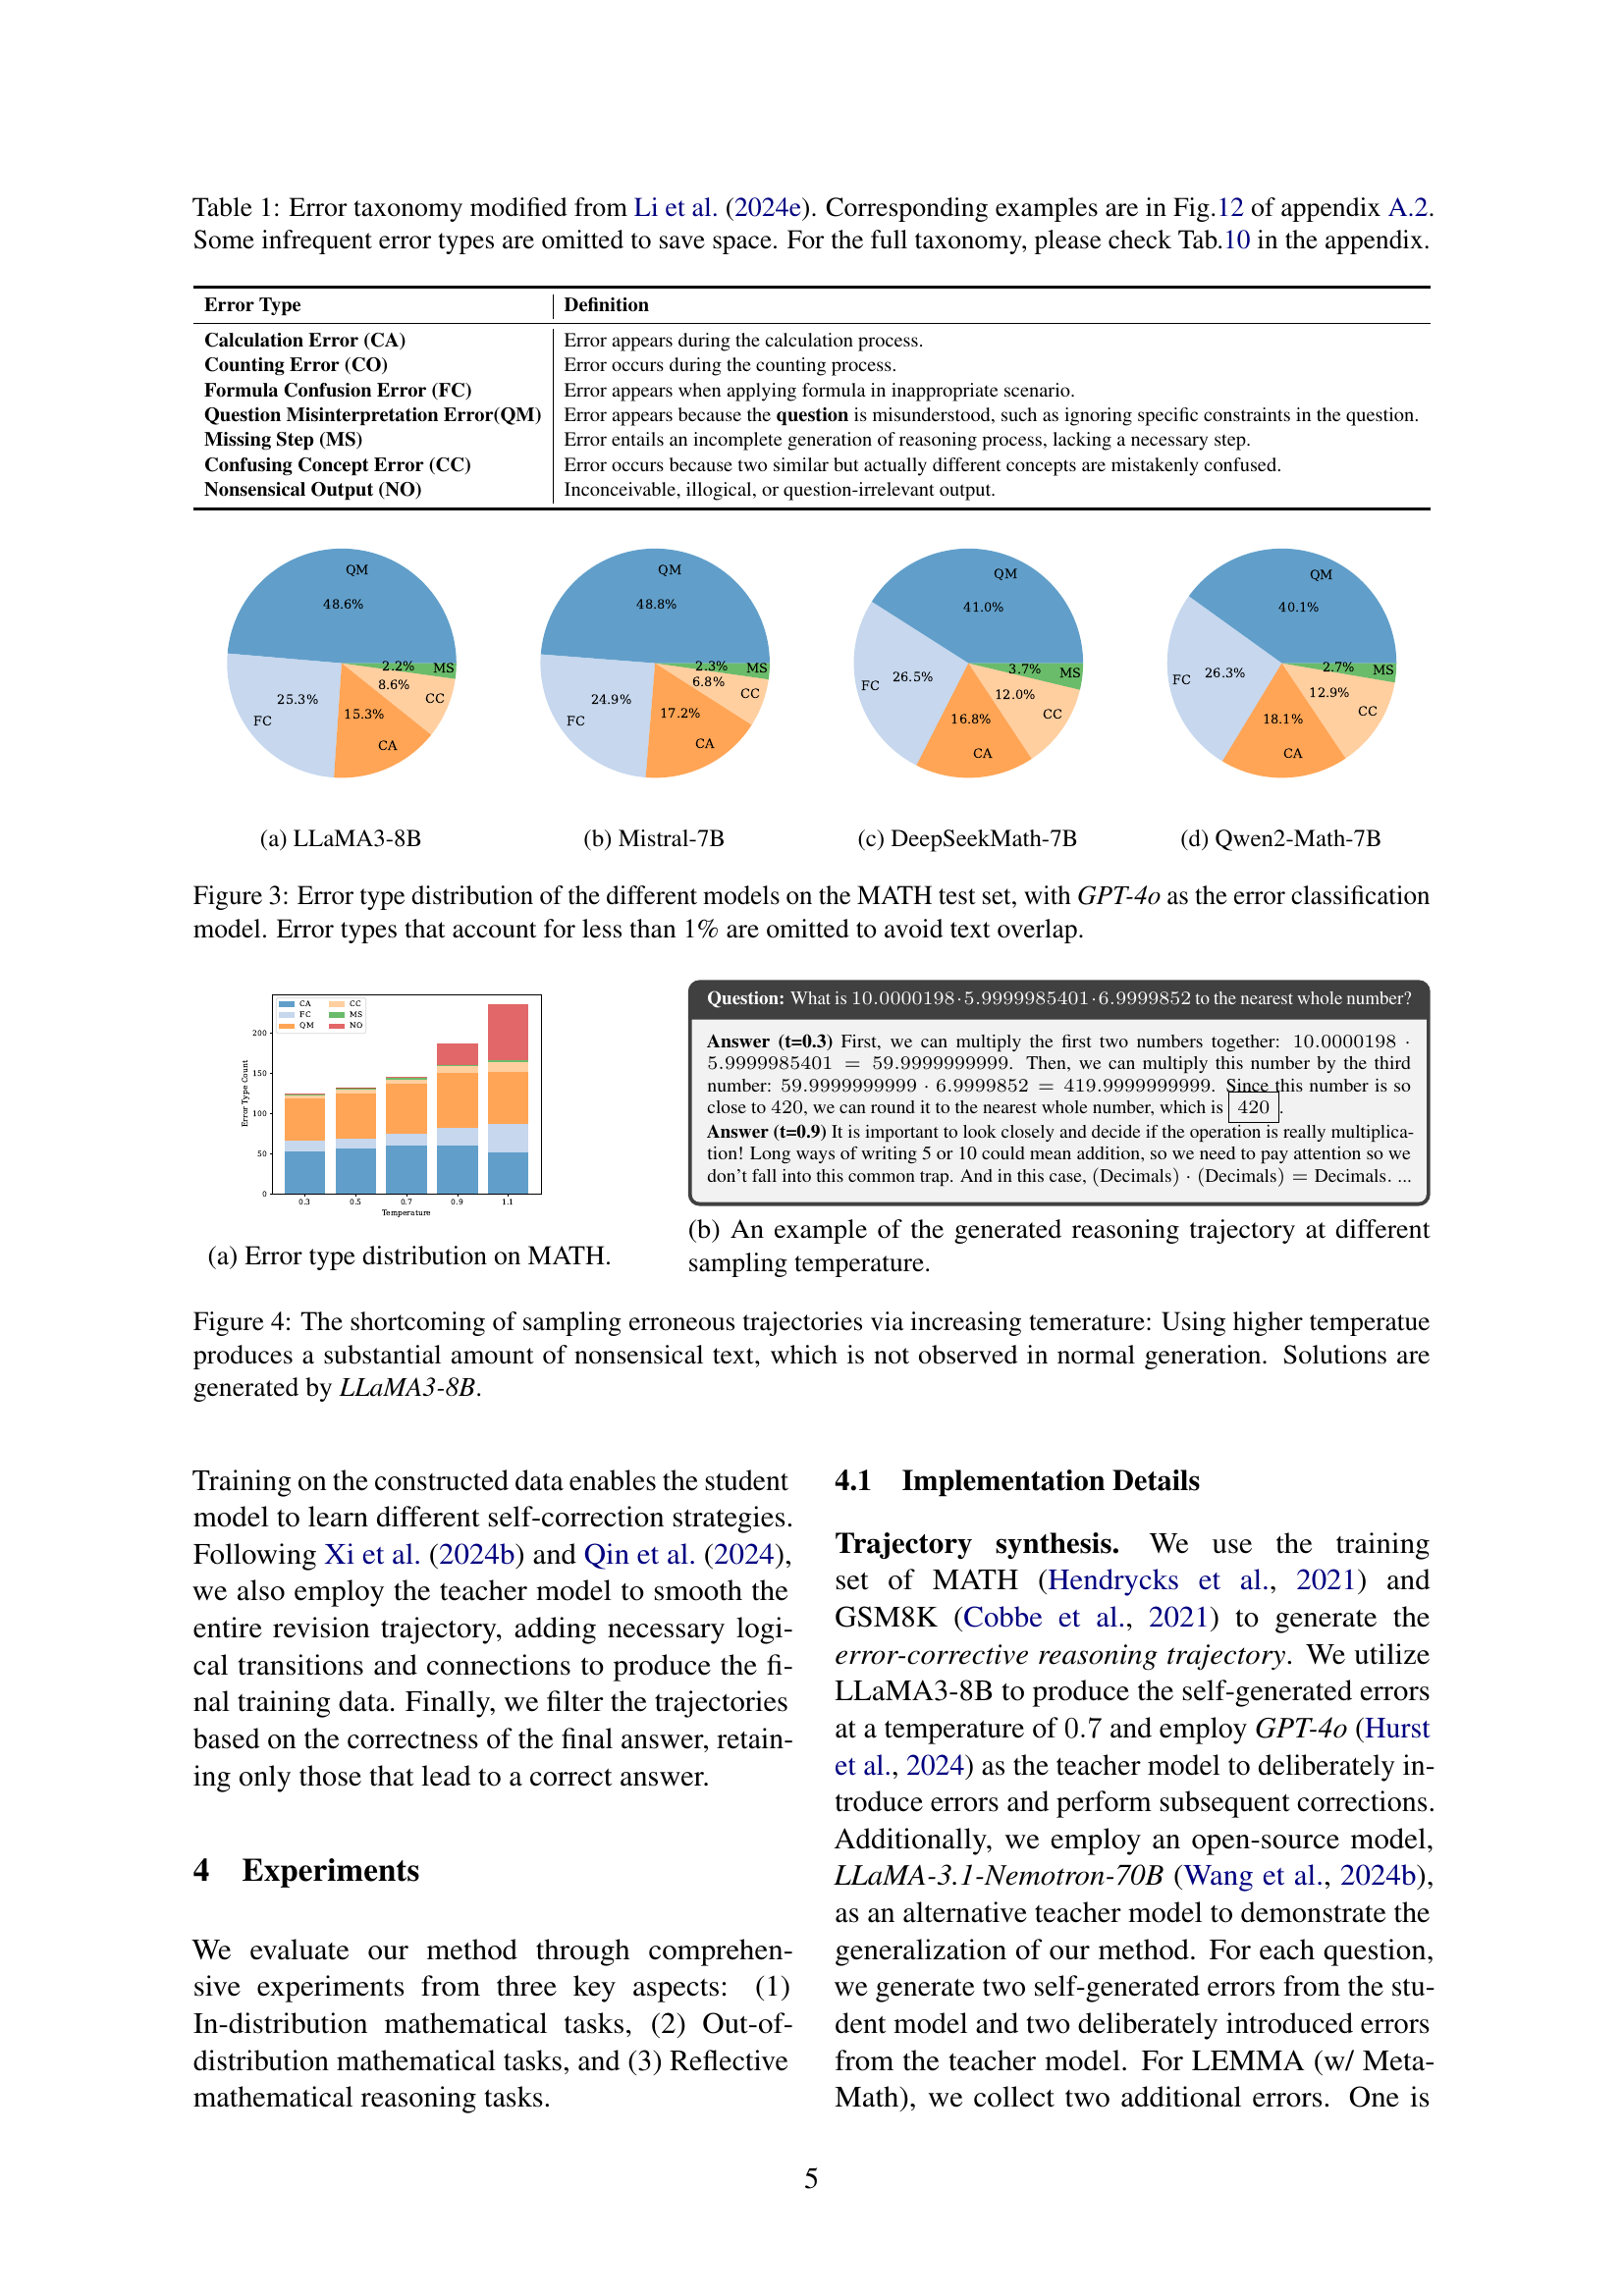
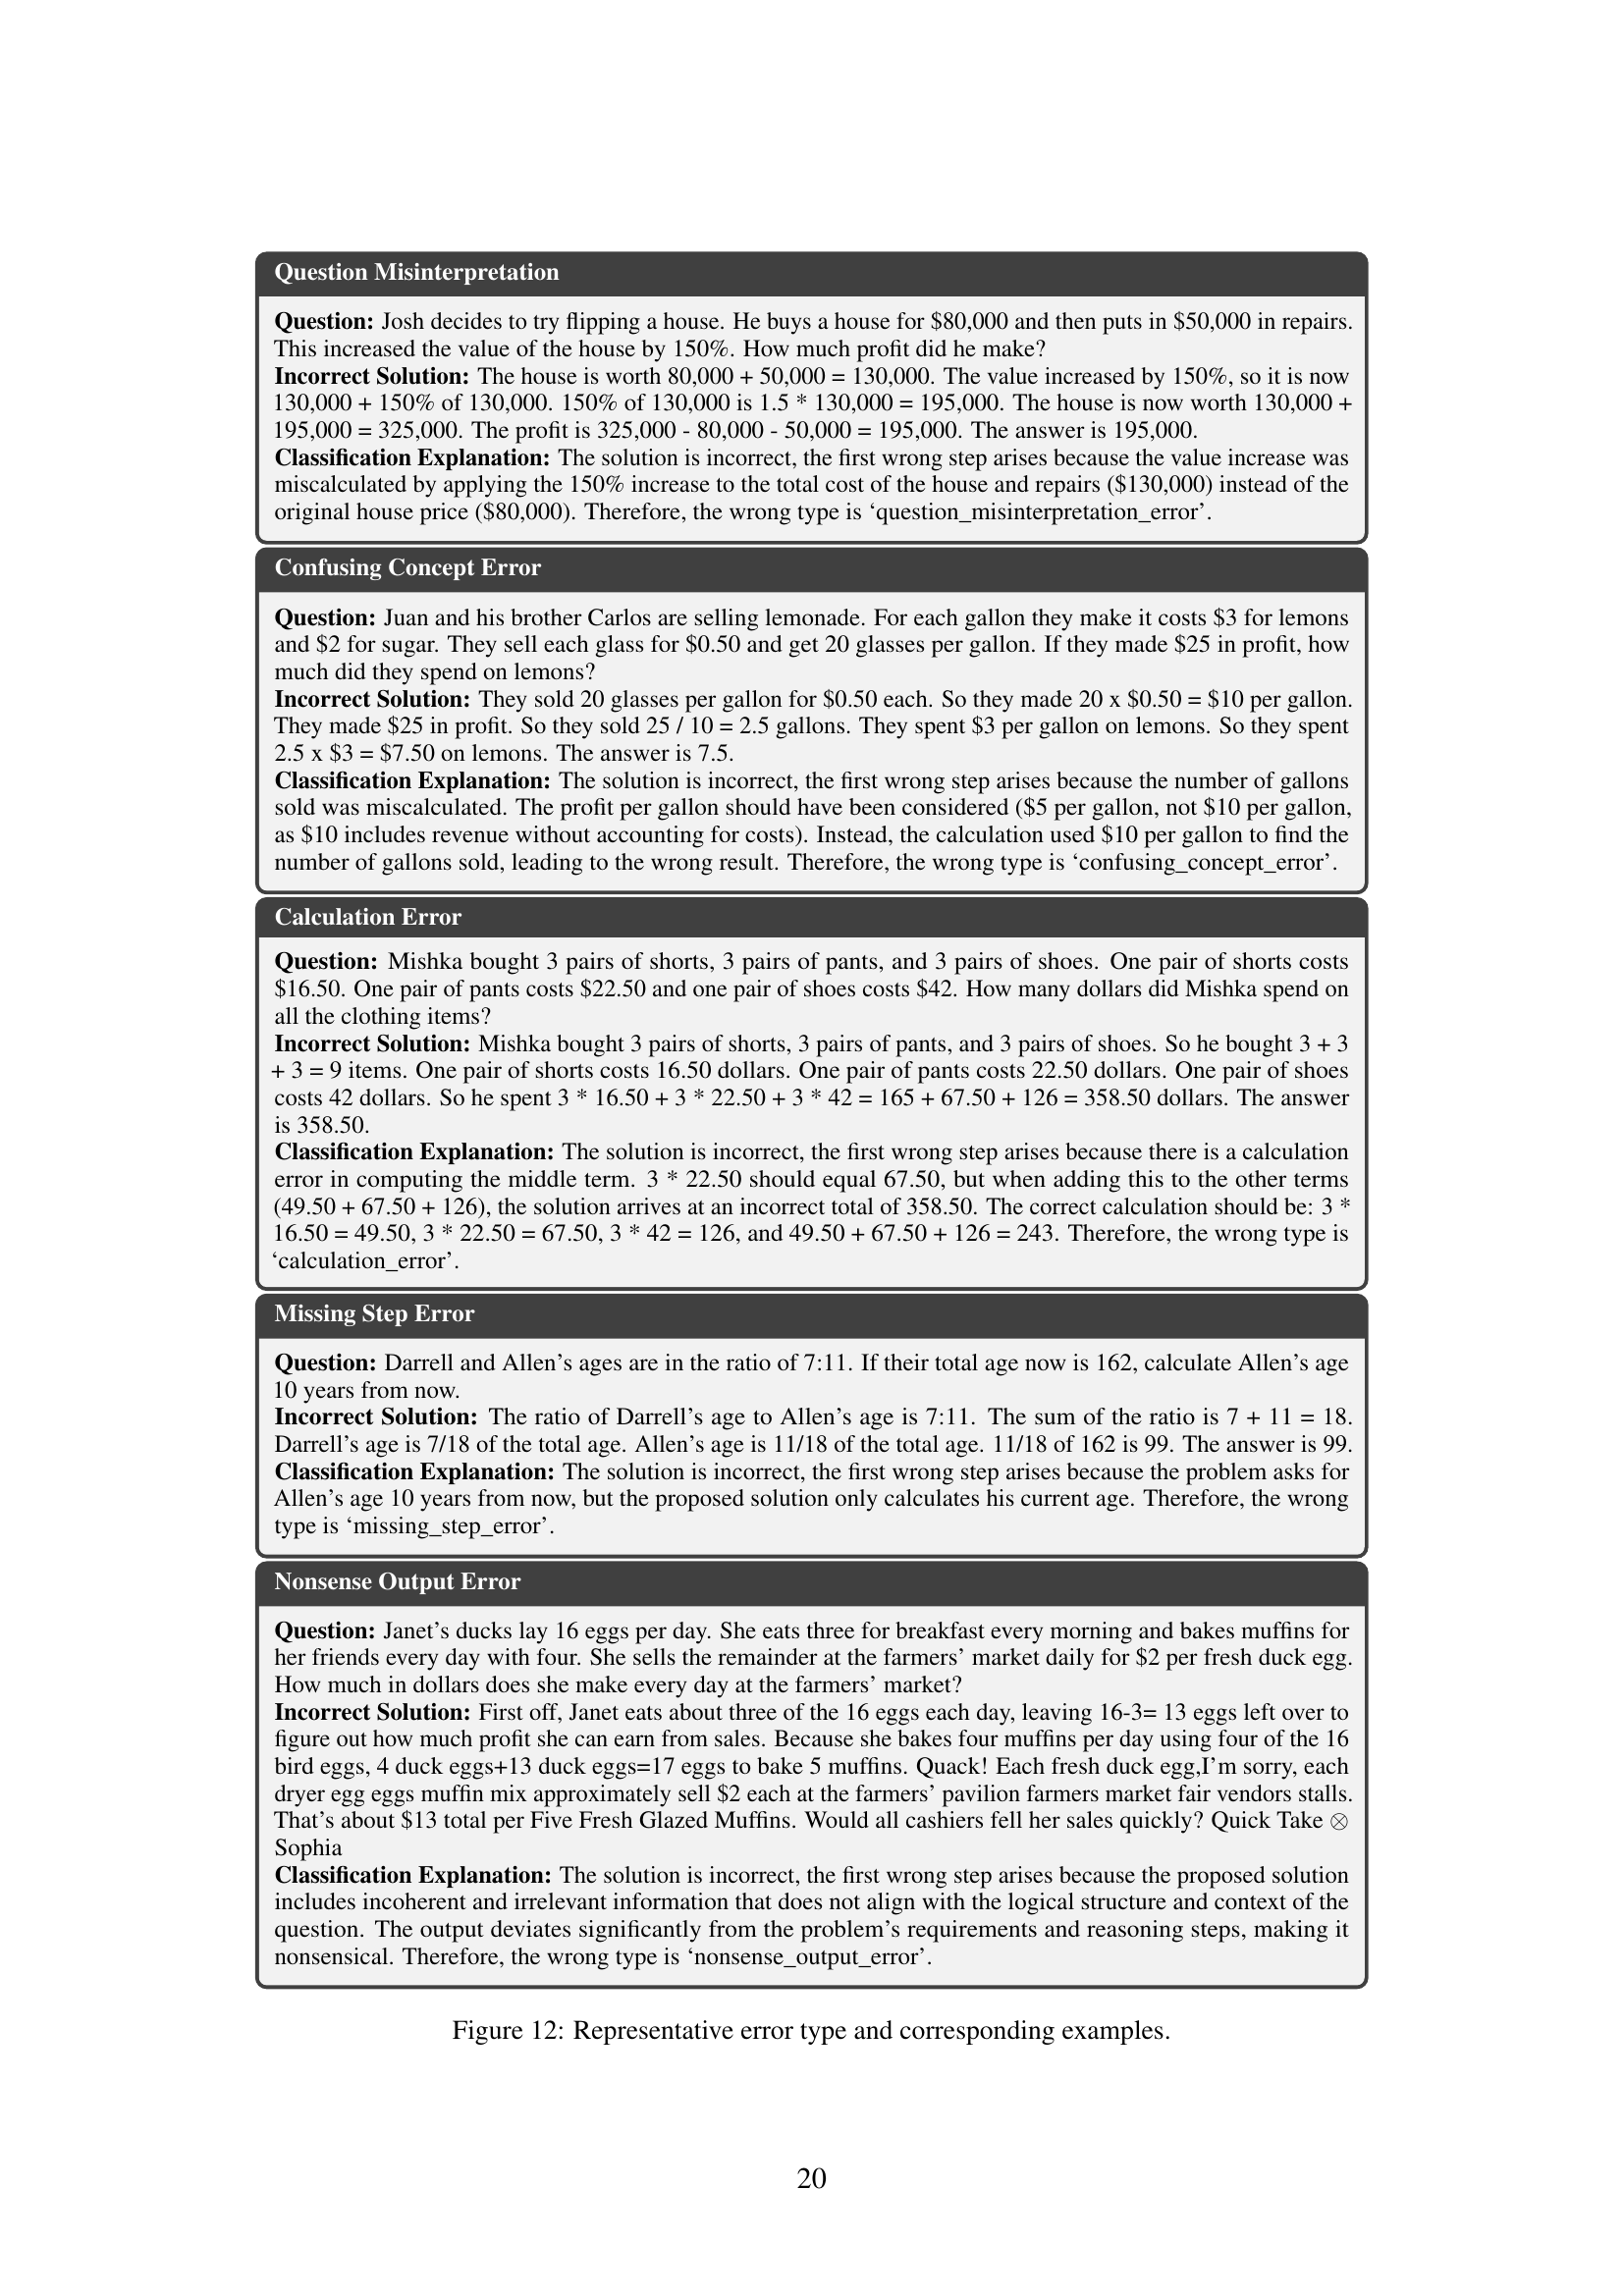
🔼 This table presents a taxonomy of error types commonly made by large language models (LLMs) when solving mathematical problems. The taxonomy is adapted from Li et al. (2024e) and categorizes errors into several main types, such as calculation errors, counting errors, formula confusion errors, question misinterpretation errors, missing steps, confusing concept errors, and nonsensical outputs. For each error type, a brief description is provided. The table also notes that some infrequent error types have been omitted for brevity, and directs readers to Appendix A.2 (Figure 12) for illustrative examples and Appendix A (Table 10) for the complete taxonomy.
read the caption
Table 1: Error taxonomy modified from Li et al. (2024e). Corresponding examples are in Fig.12 of appendix A.2. Some infrequent error types are omitted to save space. For the full taxonomy, please check Tab.10 in the appendix.
In-depth insights#
Error-Aware LLMs#
While “Error-Aware LLMs” isn’t a direct heading, the core idea revolves around improving reasoning by explicitly addressing and learning from errors. The paper champions a move beyond solely optimizing for correct data, which neglects the rich information contained in mistakes. The current SOTA methods focus on improving the quality of CoT reasoning data by distilling high-quality solutions from advanced models, overlooking potential value within error data. Error data holds significant potential for fostering reflective reasoning. A key argument is that LLMs often propagate errors during inference due to a lack of autonomous correction. Recent research acknowledges this gap and proposes methods to integrate error data, such as employing external critique models or MCTS. However, the paper contends that these approaches can be computationally expensive or rely on overly simplistic correction strategies. A more effective solution involves building error-corrective trajectories that teach the model to identify, analyze, and rectify errors autonomously. The ability to reflect – identifying, analyzing, and rectifying errors – is a critical component of human problem-solving. Thus, to truly advance LLMs, we must enable them to learn from both successes and failures through error-aware training paradigms.
Type-Grounded Aug#
Type-grounded augmentation seems to be a powerful strategy for enhancing LLMs by leveraging error analysis. By systematically categorizing errors, the model identifies areas for improvement, such as question misinterpretation or calculation mistakes. The error-type grounded augmentation strategy then targets these specific weak points, guiding the model to generate diverse and representative errors. This helps mitigate the issues of both computational overhead from techniques like MCTS and the inefficiency of naive self-correction methods. By strategically introducing errors mirroring those the student model itself is prone to, and using a teacher model to generate representative errors, a more balanced dataset is generated which assists in mitigating error accumulation issues. The targeted augmentation based on the observed error distributions leads to more effective fine-tuning and, therefore, improved reflective reasoning, reducing the reliance on external critique models for autonomous error correction.
Smooth Transfer#
The concept of a ‘smooth transfer’ likely alludes to seamlessly transitioning between incorrect and correct reasoning paths in LLMs. This is crucial for enabling effective self-correction. It suggests a method that avoids abrupt shifts, potentially by leveraging model-aware reflection links and annotations. A smooth transfer mechanism could facilitate learning by ensuring coherent training examples, minimizing the risk of introducing inconsistencies that would hinder the model’s learning process. This ensures that error correction is not just a fix but a part of a learning trajectory. By guiding models through error-corrective transitions, a smooth transfer mechanism can enhance mathematical reasoning.
Reduces Errors#
The paper’s focus on “Reduces Errors” is a crucial aspect of enhancing Large Language Models (LLMs) for mathematical reasoning. The innovative framework strategically constructs self-correction data by categorizing error types and employing mistake augmentation. This directly combats the limitations of existing methods that primarily focus on improving correct training data while neglecting the value of learning from mistakes. By fine-tuning LLMs with error-corrective trajectories (Fix & Continue and Fresh & Restart), the model becomes capable of autonomously detecting and correcting errors during generation. This targeted approach to error reduction leads to more robust and reliable mathematical reasoning capabilities, representing a significant advancement over methods relying on external critique models or inefficient self-correction techniques. LEMMA’s ability to consistently reduce the occurrence of common error types validates the systematic analysis and structured learning as a powerful means for advancing LLMs.
Teacher Choice#
Teacher choice plays a crucial role in this research. The selection of teachers, whether models or humans, to guide LLMs in self-correction signifies a deliberate strategy. A superior teacher model like GPT-4o would enhance error identification and correction, while open-source options allow community involvement and research reproducibility. The effectiveness of LEMMA isn’t solely based on teacher quality, it highlights the systematic error introduction and correction strategy. Therefore, LEMMA’s success isn’t solely attributable to the teacher model but its intrinsic mechanism. If a weaker teacher is used, the performance would potentially decrease due to the student-model interactions and complexity.
More visual insights#
More on figures

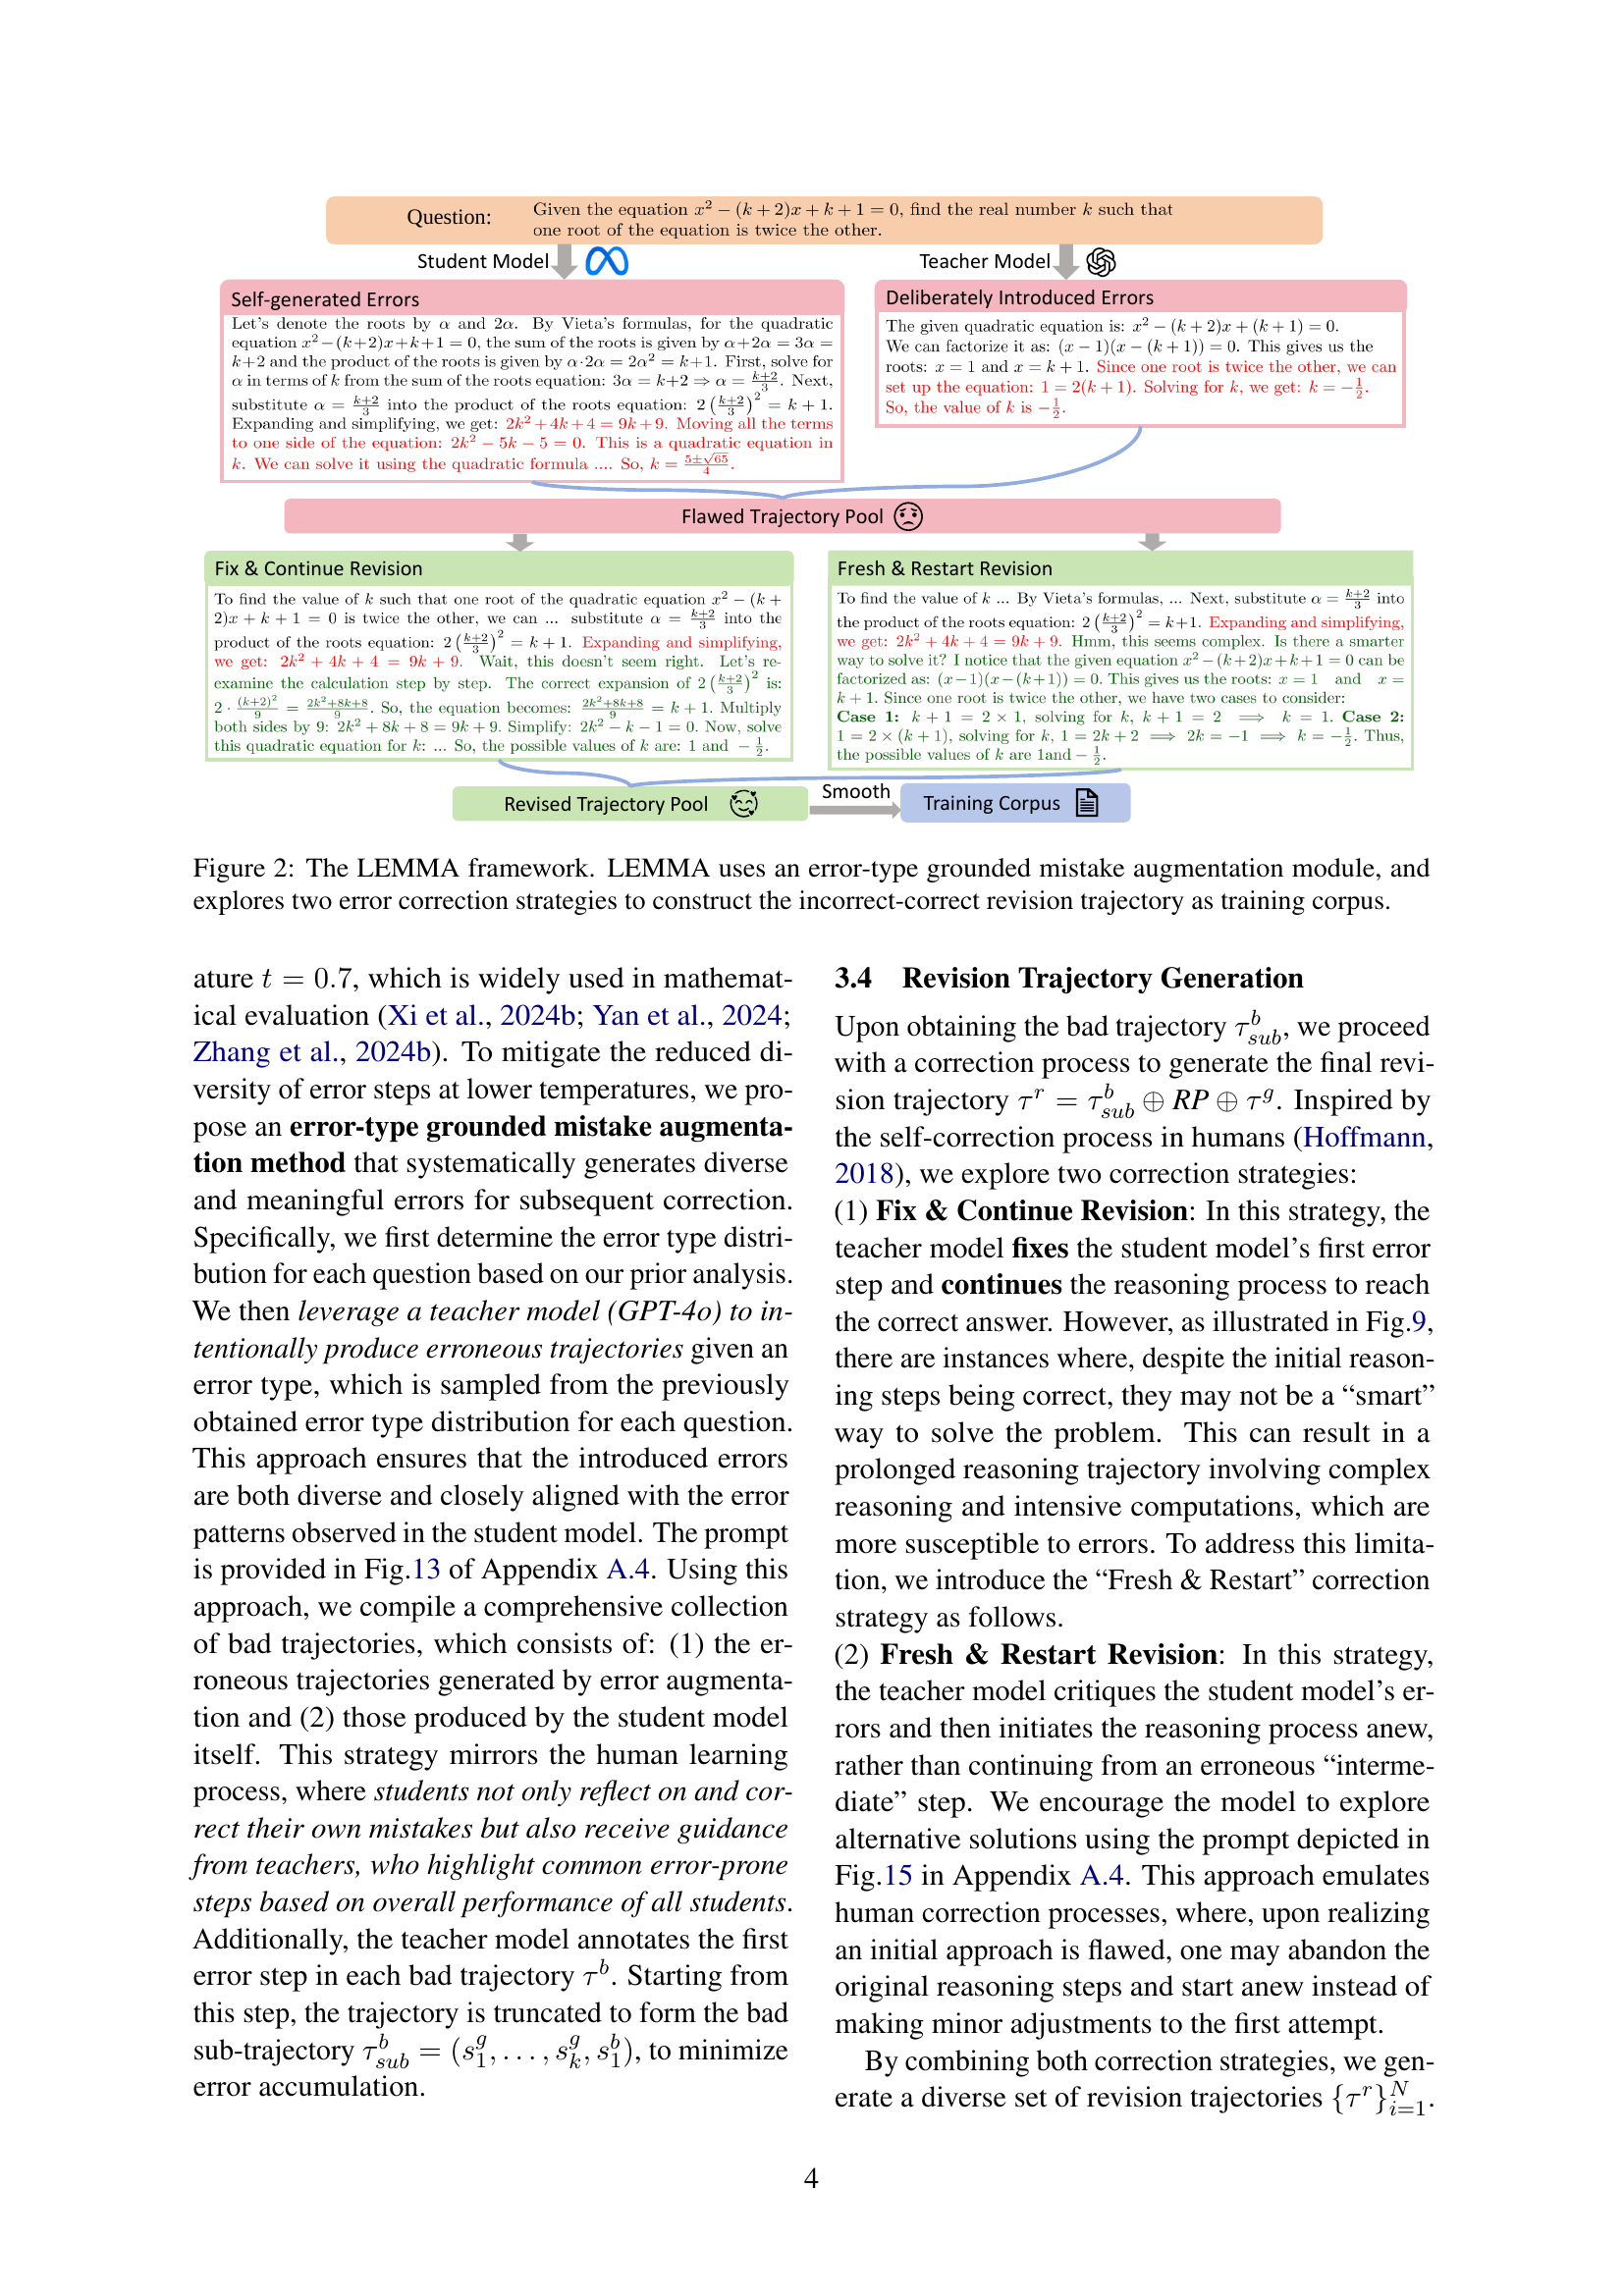
🔼 The LEMMA framework is shown in Figure 2. It consists of three main components: 1) an error-type grounded mistake augmentation module that generates diverse and representative errors for a variety of mathematical reasoning problems; 2) two error correction strategies, ‘Fix & Continue’ and ‘Fresh & Restart’, which correct the errors through different approaches; and 3) a training corpus of paired incorrect and correct solutions that are seamlessly connected through model-aware reflection links. These links, annotations that explain the error’s origin and justify its correction, provide coherence to the training data, ultimately improving LLMs’ ability to reflect on and self-correct their mathematical reasoning processes.
read the caption
Figure 2: The LEMMA framework. LEMMA uses an error-type grounded mistake augmentation module, and explores two error correction strategies to construct the incorrect-correct revision trajectory as training corpus.

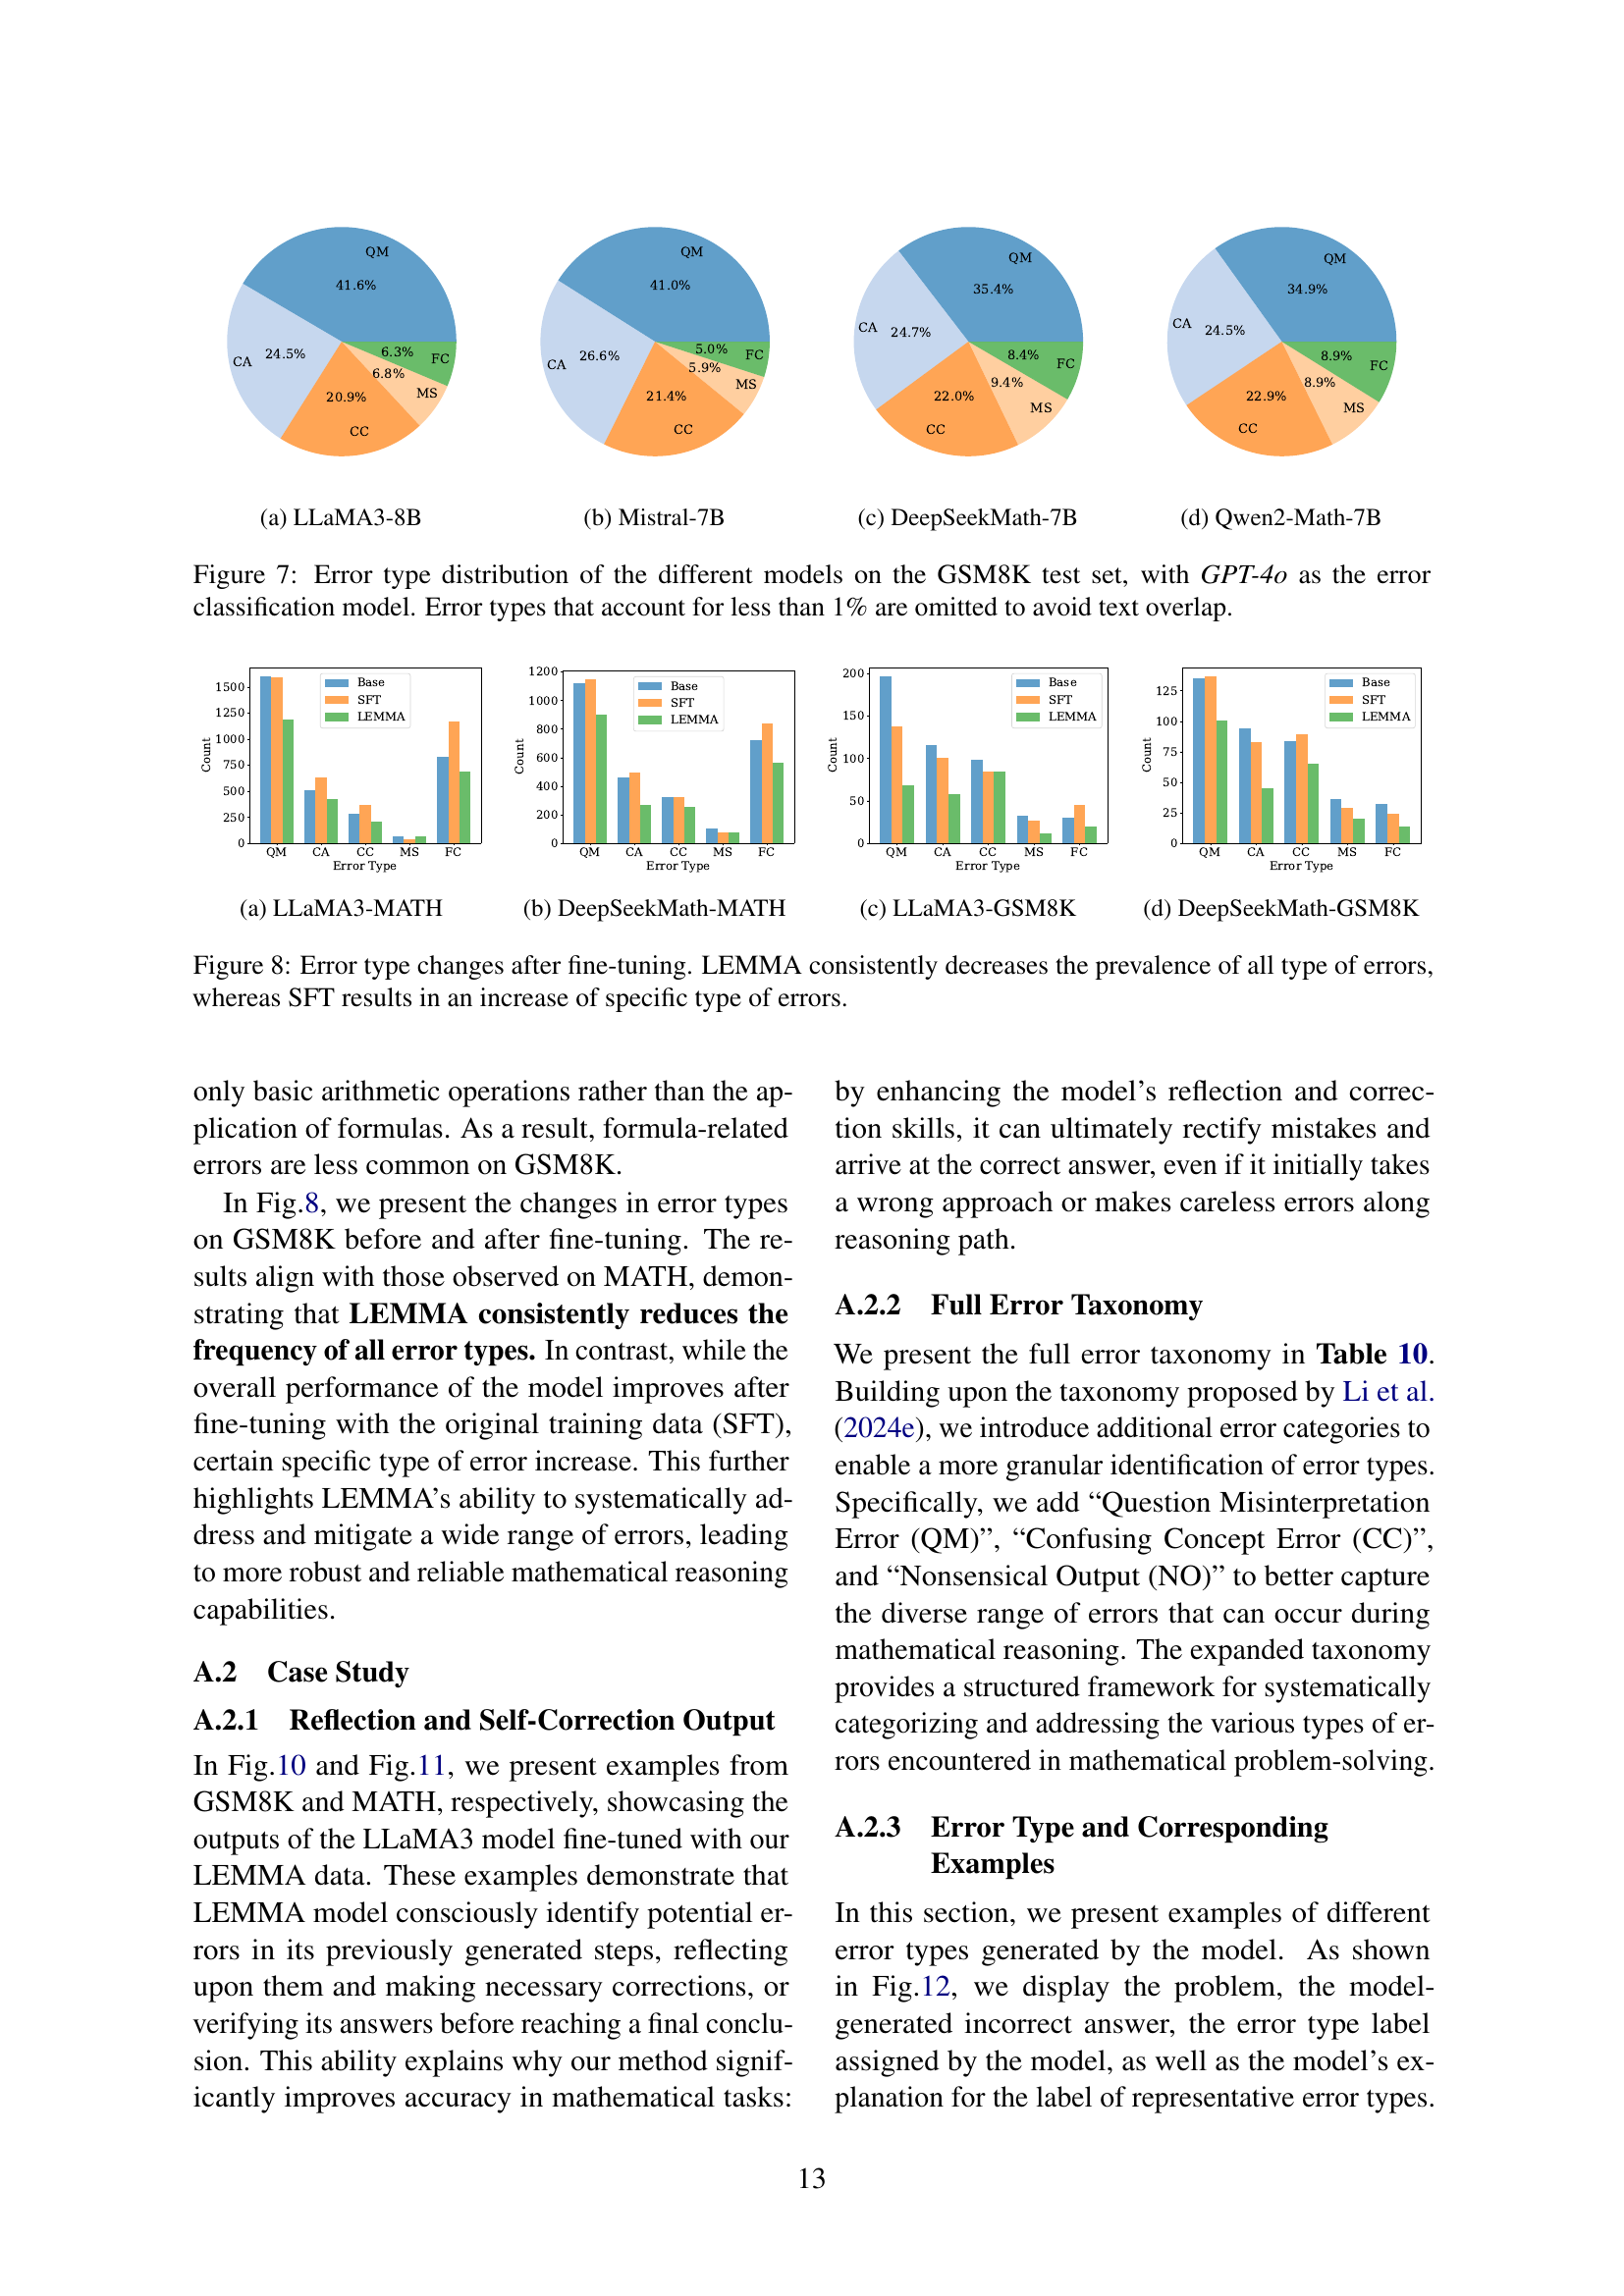
🔼 The figure shows the distribution of different error types in the LLaMA3-8B model. The chart visually represents the percentage of each error category (like Calculation Error, Question Misinterpretation Error, etc.) found in the model’s mathematical reasoning outputs. This allows for a comparison of the relative frequency of different error types within the model’s responses.
read the caption
(a) LLaMA3-8B

🔼 This figure shows the distribution of error types for the Mistral-7B model when solving mathematical problems. The chart visually represents the percentage of each error type in a dataset of model-generated solutions. The different error types (such as Question Misinterpretation (QM), Calculation Error (CA), etc.) are displayed as segments within a circle, with the size of each segment corresponding to its relative frequency. This provides a visual breakdown of the most common types of mistakes made by this model, offering insights into its strengths and weaknesses in mathematical reasoning.
read the caption
(b) Mistral-7B

🔼 This figure shows the distribution of different error types made by the DeepSeekMath-7B model on the MATH dataset. The error types are categorized using a taxonomy established in the paper, including categories like Question Misinterpretation, Formula Confusion, Calculation Errors, and others. The chart visually represents the proportion of each error type within the model’s output, offering insights into the model’s strengths and weaknesses in mathematical reasoning. This allows for targeted improvements and focused data augmentation strategies.
read the caption
(c) DeepSeekMath-7B

🔼 This figure shows the distribution of different error types made by the Qwen2-Math-7B model when solving mathematical problems. The figure displays the percentage of each error type relative to the total number of errors. Error types include Question Misinterpretation, Formula Confusion, Calculation Errors, Missing Steps, Confusing Concepts, and Nonsensical Output. This visualization helps to understand the common mistakes made by this specific language model, which is useful for developing techniques to improve its performance and to design targeted training data.
read the caption
(d) Qwen2-Math-7B

🔼 This figure presents a comparison of error types across four different large language models (LLMs) when solving mathematical problems from the MATH dataset. The error types are categorized into six main groups (Question Misinterpretation, Formula Confusion, Calculation, Counting, Missing Steps, and Confusing Concepts) using GPT-4 as a classifier. The bar chart visually shows the proportion of each error type for each LLM, providing insights into the relative strengths and weaknesses of the models in different aspects of mathematical reasoning. Error types with less than 1% prevalence are excluded for clarity.
read the caption
Figure 3: Error type distribution of the different models on the MATH test set, with GPT-4o as the error classification model. Error types that account for less than 1% are omitted to avoid text overlap.
🔼 This figure shows the distribution of different error types made by language models when solving mathematical problems in the MATH dataset. The error types are categorized and their frequencies are displayed. This helps to understand the types of mistakes the models are most prone to make, informing the design of strategies to improve their mathematical reasoning capabilities. The x-axis represents the different error types while the y-axis represents the count of errors.
read the caption
Figure 3: (a) Error type distribution on MATH.

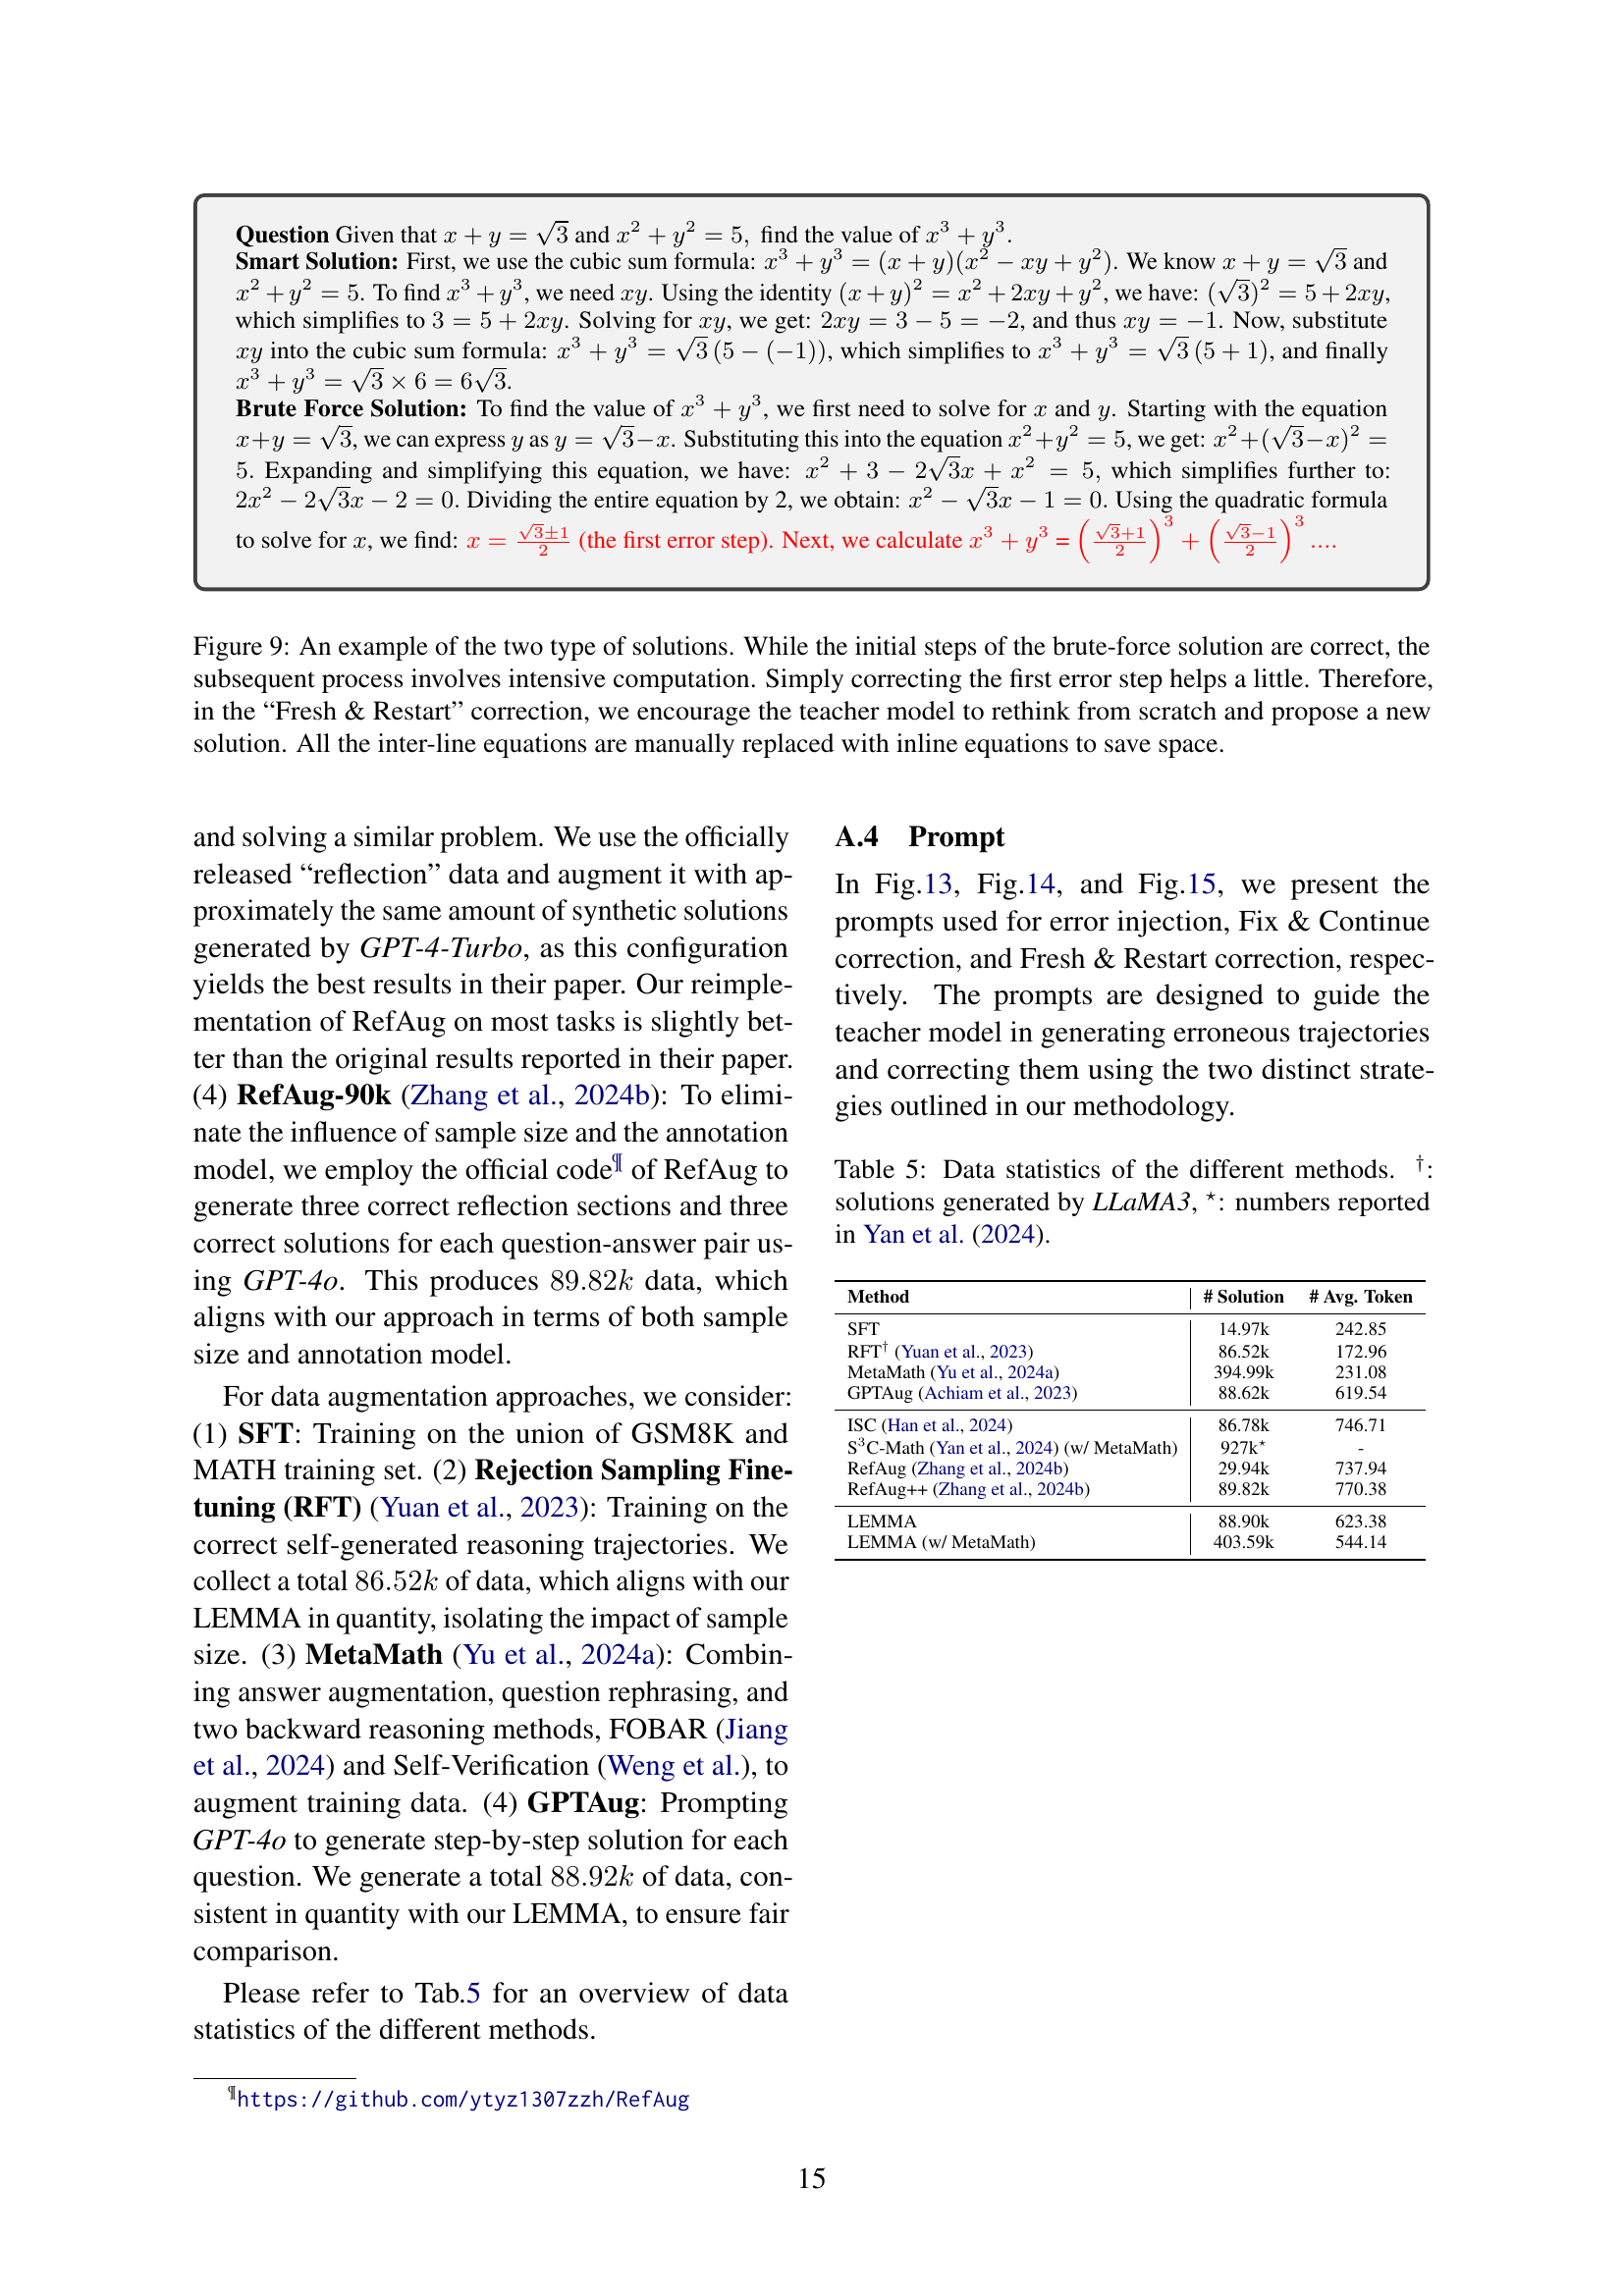
🔼 This figure demonstrates the negative impact of using higher sampling temperatures to generate erroneous reasoning trajectories for training LLMs. Increasing the temperature significantly increases the number of nonsensical or incoherent responses, making them unsuitable for training. The figure compares examples generated at lower versus higher temperatures, highlighting the substantial difference in the quality of generated text. These results emphasize the importance of using alternative methods to create training data containing meaningful errors.
read the caption
Figure 4: The shortcoming of sampling erroneous trajectories via increasing temerature: Using higher temperatue produces a substantial amount of nonsensical text, which is not observed in normal generation. Solutions are generated by LLaMA3-8B.

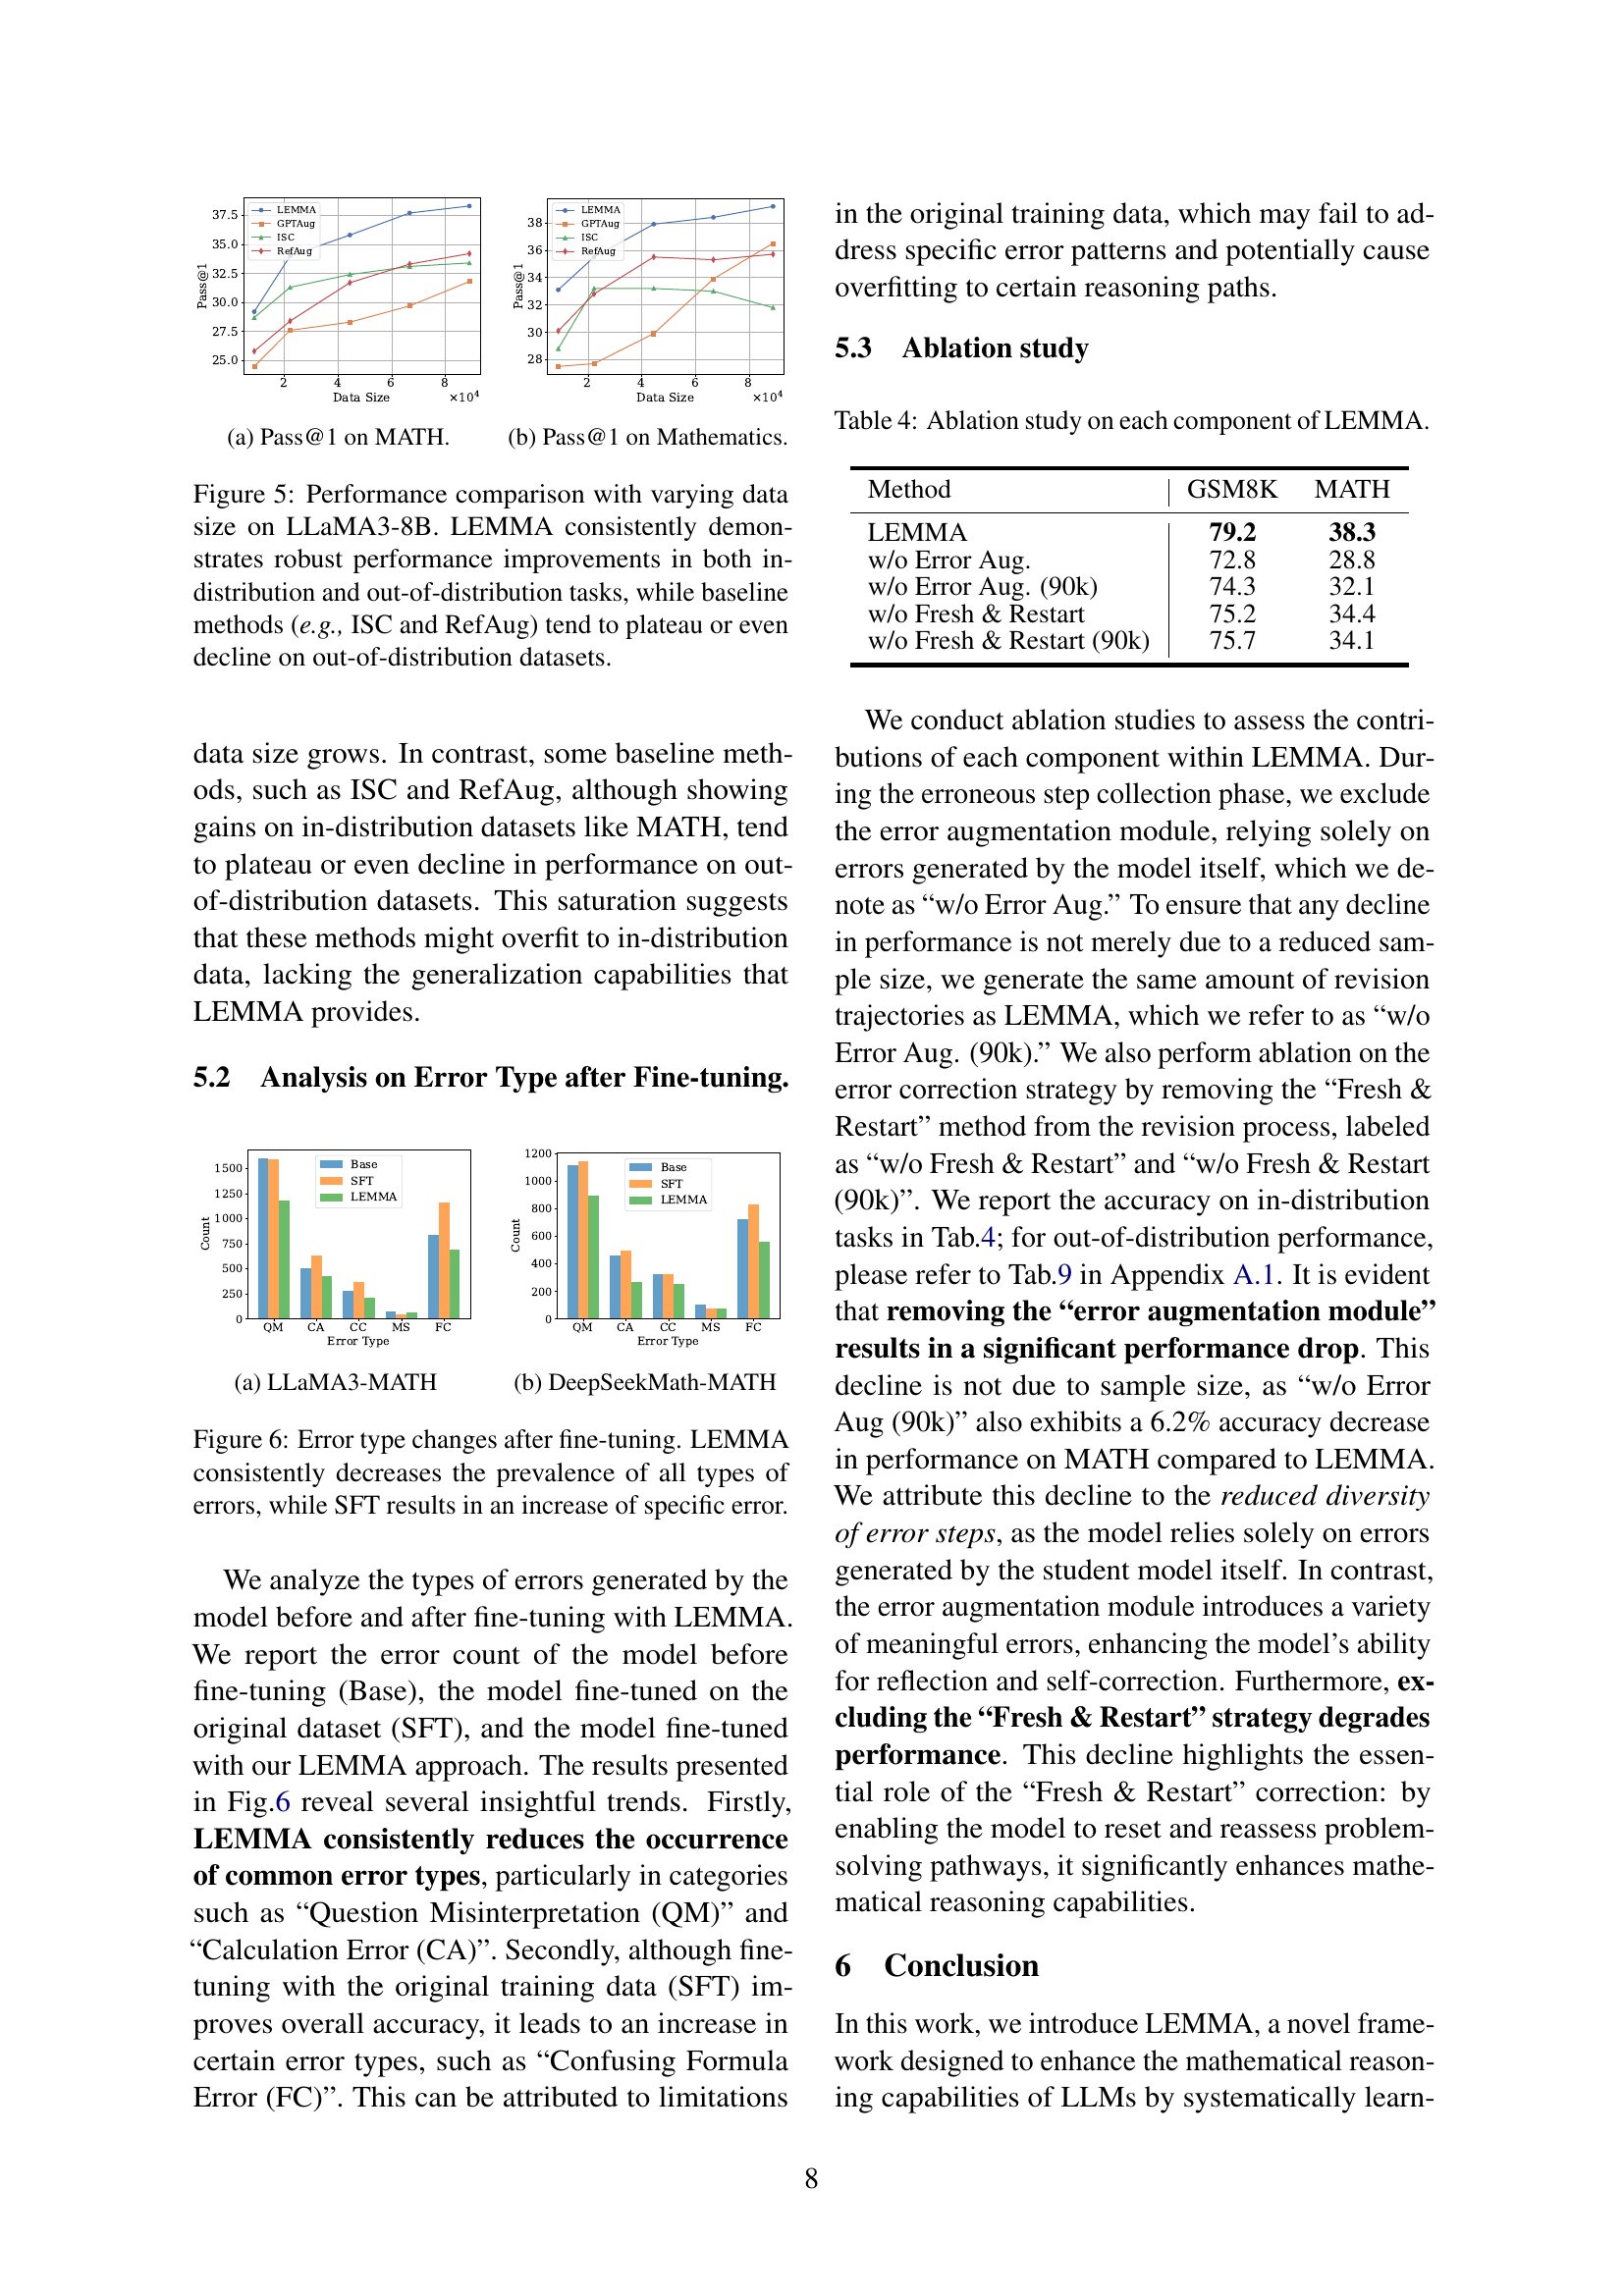
🔼 The figure shows a graph plotting the Pass@1 metric on the MATH dataset against different data sizes. The x-axis represents the size of the training data in multiples of 10,000, and the y-axis shows the Pass@1 score, which is a metric used to evaluate model performance. The graph compares the performance of several different methods including LEMMA, SFT, RefAug, RefAug-90k, and ISC. The graph demonstrates LEMMA’s consistent performance and improvement as the data size increases, while other methods may plateau or even show a decrease in performance.
read the caption
(a) Pass@1 on MATH.

🔼 The figure shows a graph plotting the Pass@1 accuracy on the Mathematics dataset against the size of training data. This illustrates how the model’s performance improves as the amount of training data increases. It is part of an experimental evaluation to show the effects of different training data sizes on model accuracy.
read the caption
(b) Pass@1 on Mathematics.

🔼 This figure displays the performance of LEMMA and several baseline methods on in-distribution and out-of-distribution datasets at different training data sizes. The results clearly indicate that LEMMA’s performance shows consistent improvement as the training data size increases, maintaining a significant lead over the baseline methods. Conversely, several of the baseline methods show performance plateaus or even declines in accuracy on the out-of-distribution datasets, highlighting LEMMA’s superior generalization capabilities.
read the caption
Figure 5: Performance comparison with varying data size on LLaMA3-8B. LEMMA consistently demonstrates robust performance improvements in both in-distribution and out-of-distribution tasks, while baseline methods (e.g., ISC and RefAug) tend to plateau or even decline on out-of-distribution datasets.

🔼 This figure shows the distribution of different error types made by the LLaMA3 model on the MATH dataset. The chart visually represents the frequency of various error categories, such as Calculation Errors (CA), Question Misinterpretation Errors (QM), Formula Confusion Errors (FC), Missing Steps (MS), and others. It provides a quantitative overview of the model’s performance shortcomings, highlighting the areas where the model most frequently makes mistakes during mathematical problem-solving.
read the caption
(a) LLaMA3-MATH

🔼 Figure 3(b) shows the distribution of different error types in the MATH dataset, specifically for the DeepSeekMath-7B model. The figure is a bar chart visualizing the frequency of each error type as categorized in Table 1 of the paper. The error categories include Question Misinterpretation, Formula Confusion, Calculation, Missing Step, and Confusing Concept errors. This data highlights the types of mistakes that the DeepSeekMath model frequently makes while solving mathematical problems, providing insights into the model’s weaknesses.
read the caption
(b) DeepSeekMath-MATH

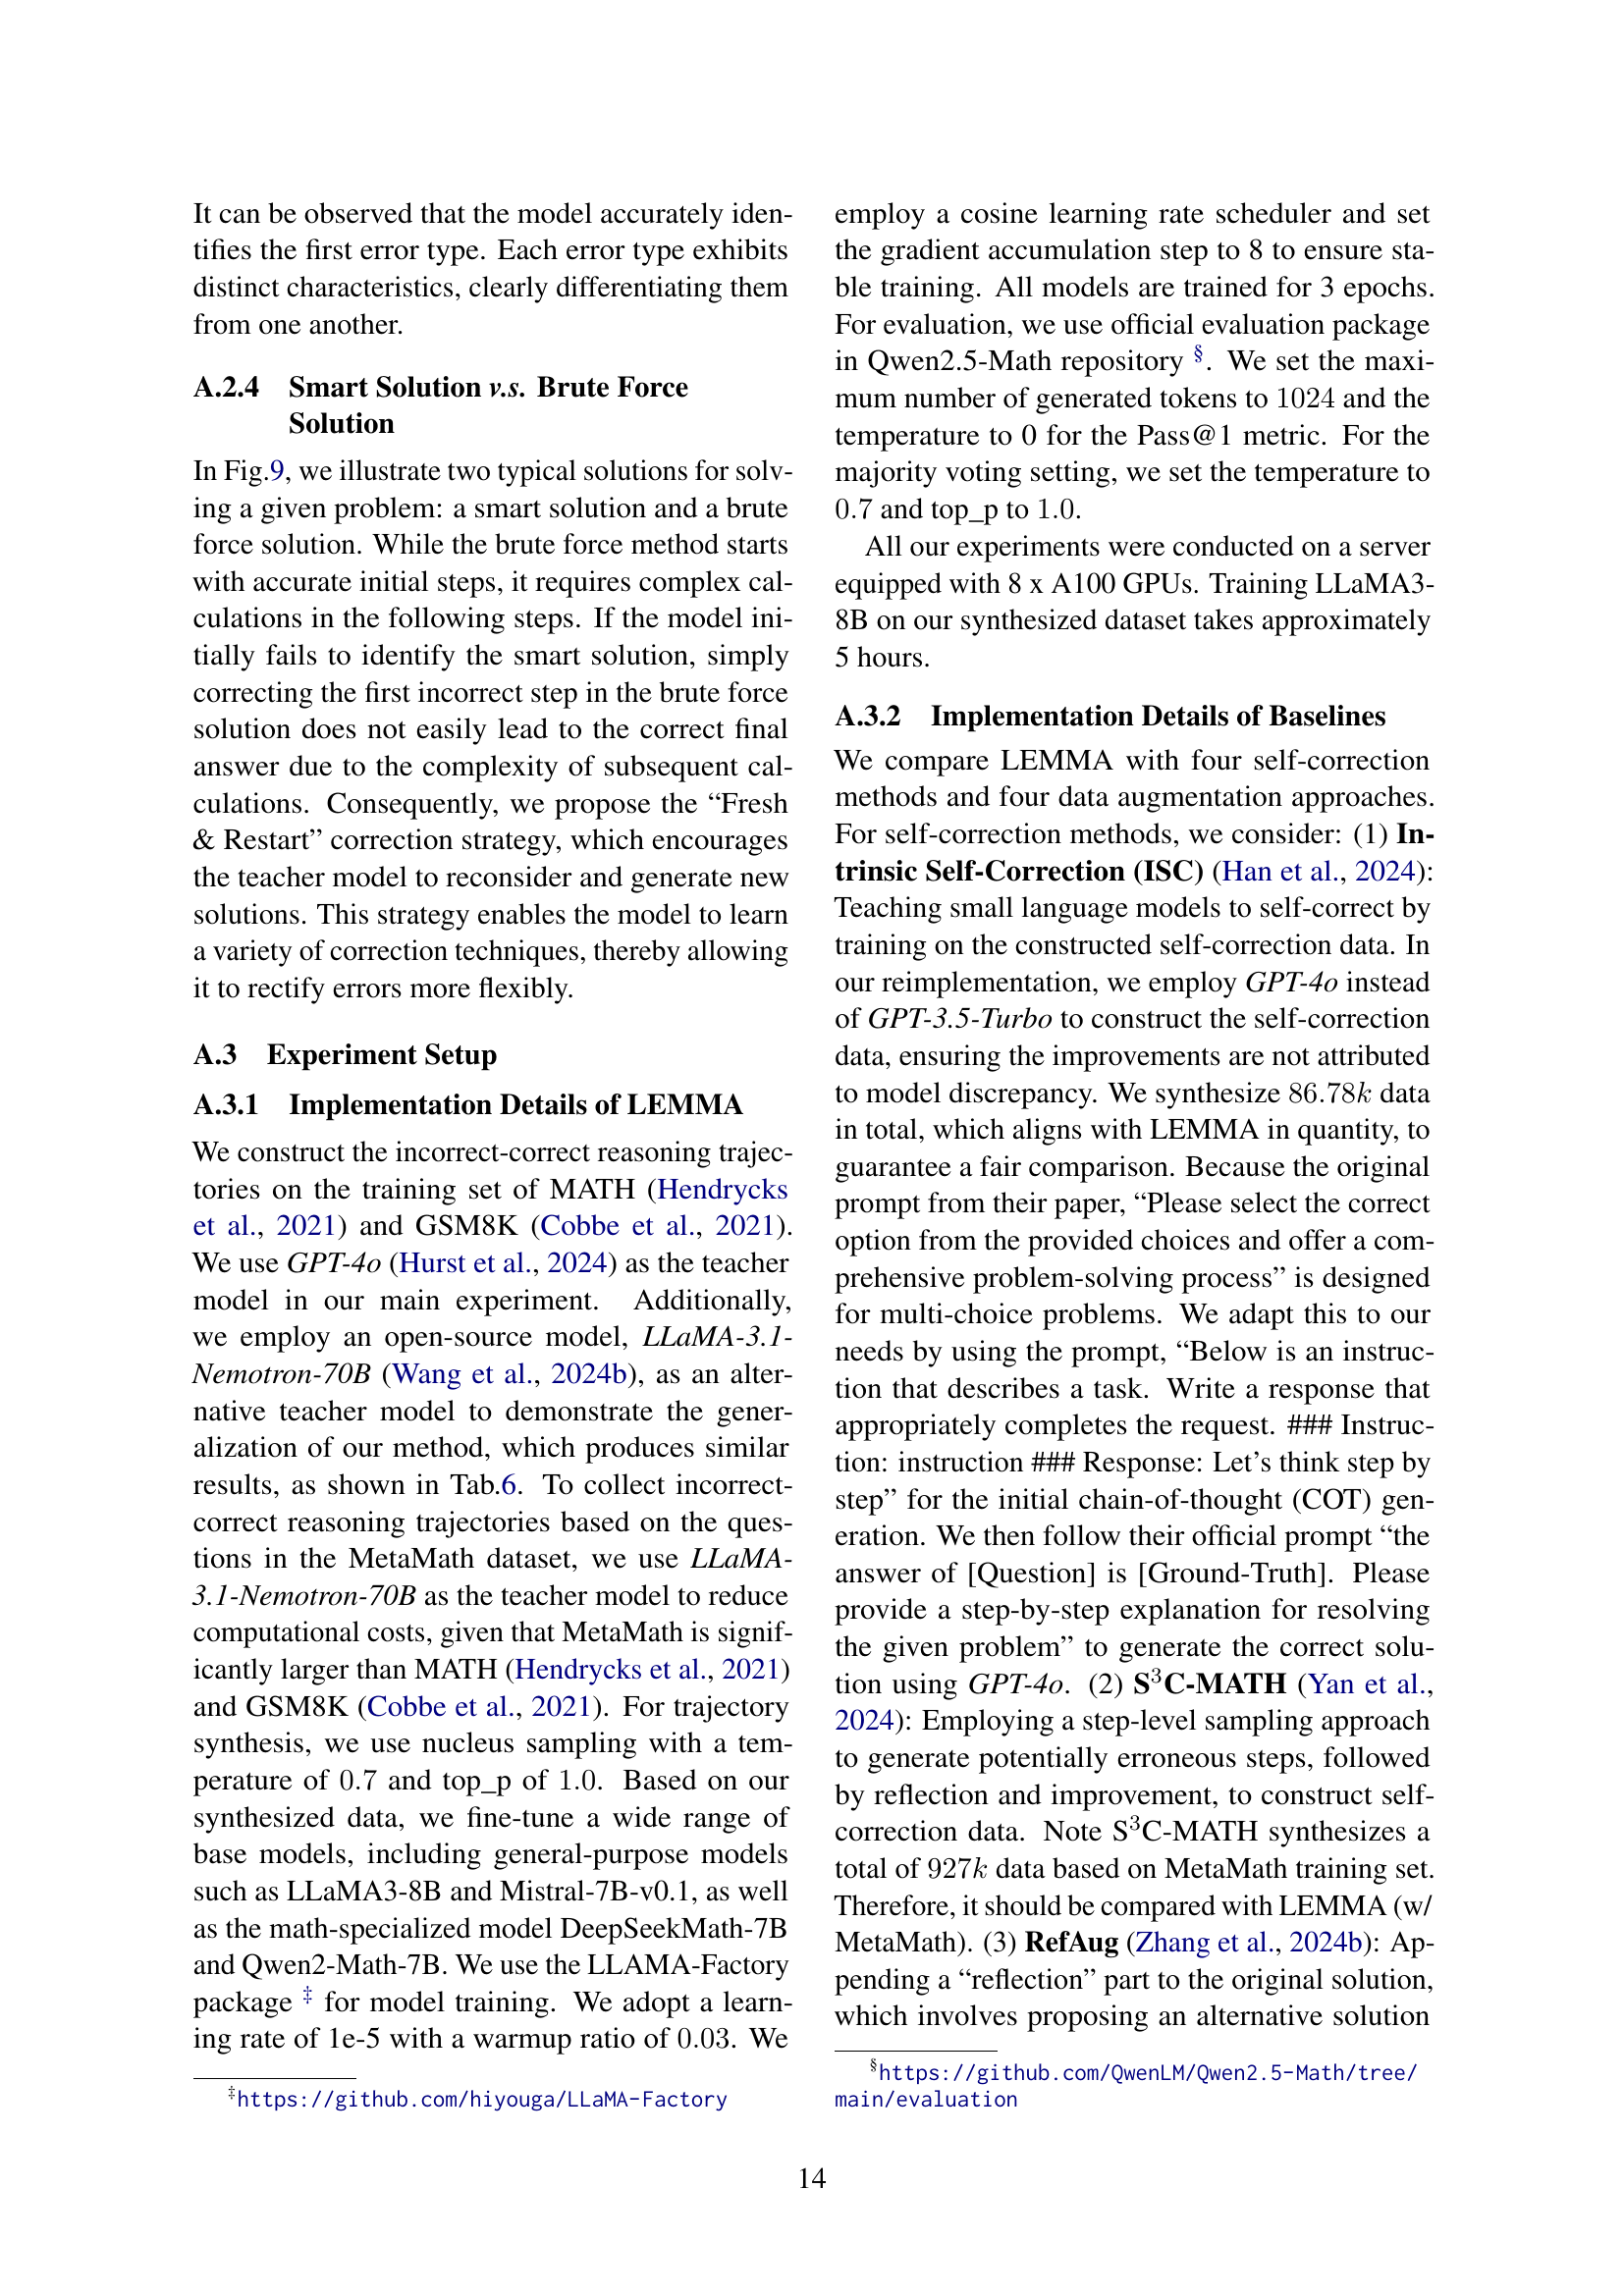
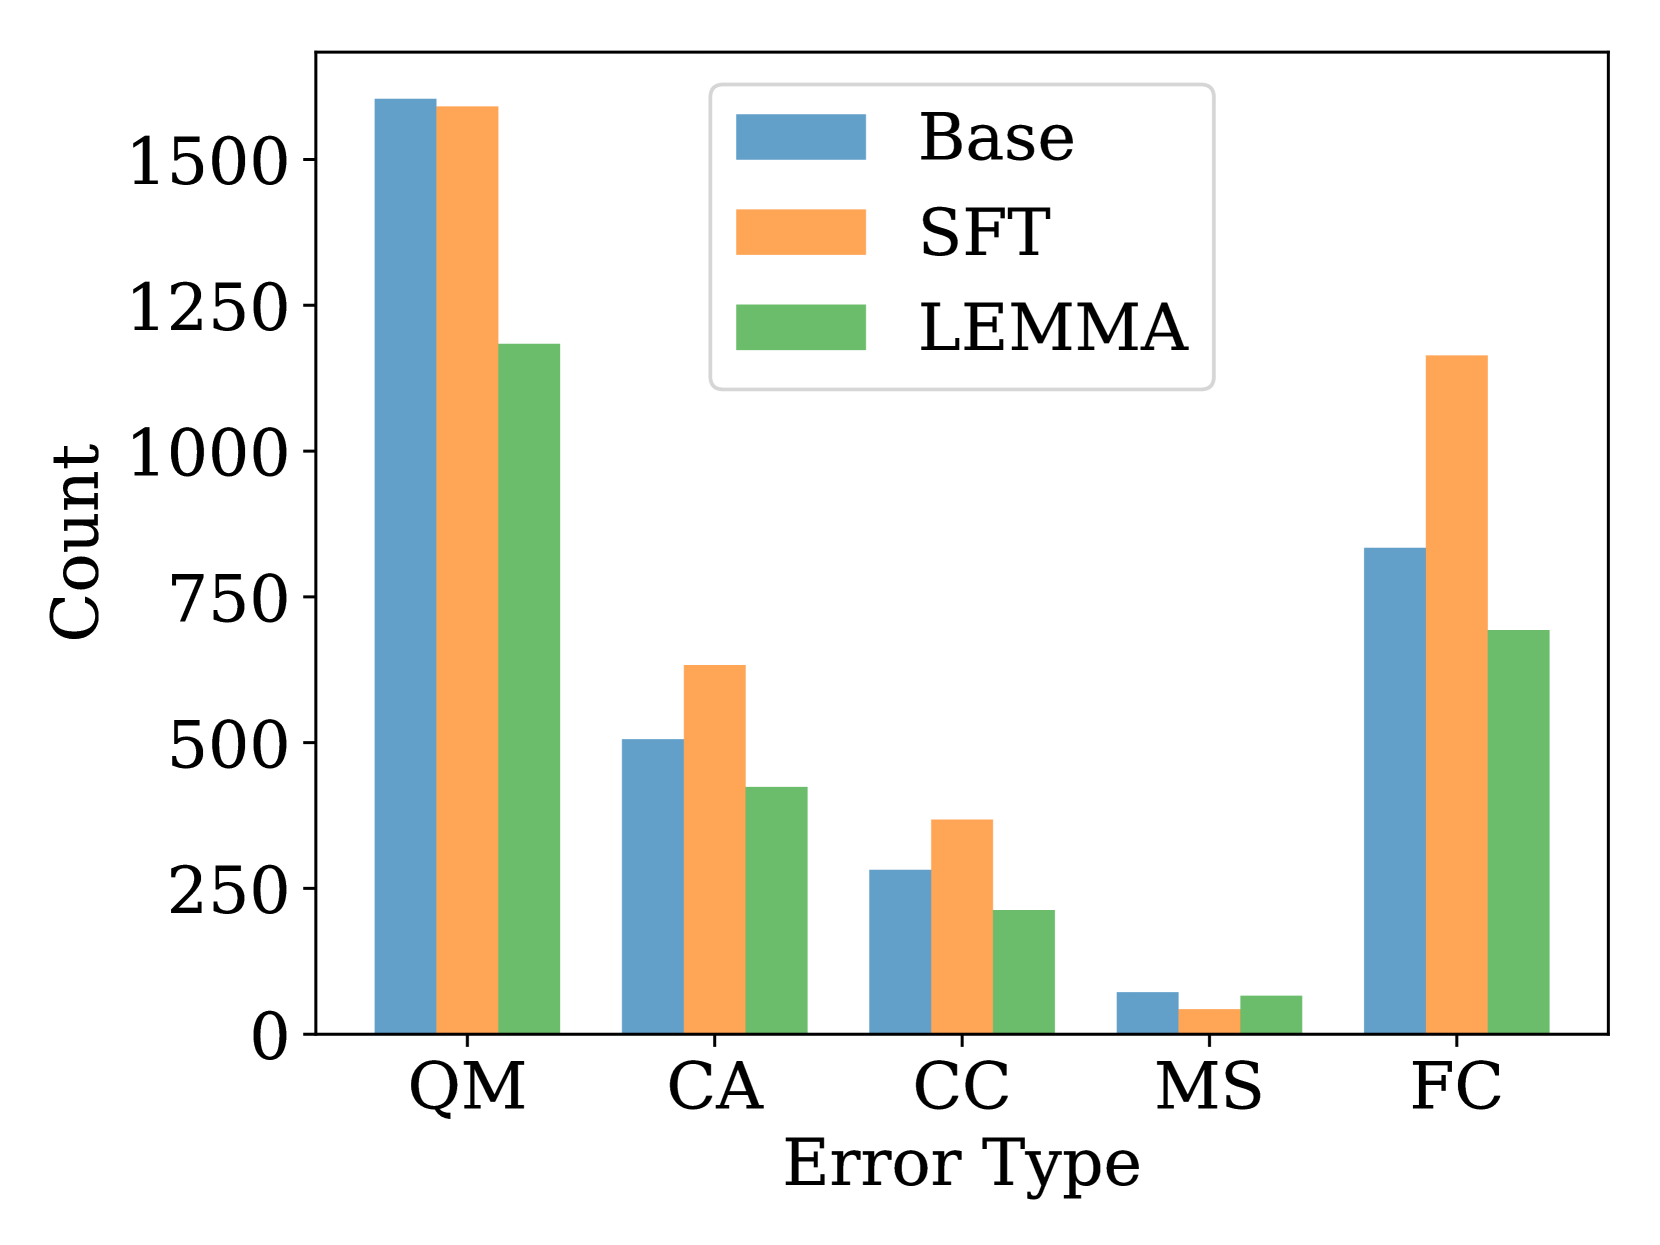
🔼 This figure displays the distribution of different error types before and after fine-tuning using two methods: LEMMA and standard Supervised Fine-Tuning (SFT). It shows that before fine-tuning, various error types are present at different rates. After fine-tuning with LEMMA, the frequency of all error types is consistently reduced. In contrast, SFT improves overall accuracy, but leads to an increase in certain specific error types. This illustrates that LEMMA’s structured approach to learning from errors effectively mitigates various errors, while SFT may cause an increase in specific error types despite improving overall accuracy. The graphs use bar charts to visually compare the error type distributions in the before, SFT, and LEMMA scenarios for two different datasets.
read the caption
Figure 6: Error type changes after fine-tuning. LEMMA consistently decreases the prevalence of all types of errors, while SFT results in an increase of specific error.

🔼 This figure shows the distribution of different error types in model-generated solutions for the LLaMA3-8B model. It displays a breakdown of the percentage of errors attributed to different categories, providing insights into the types of mistakes the model is most prone to making. This is a key finding used in the error analysis section of the paper to understand model-generated errors.
read the caption
(a) LLaMA3-8B

🔼 Figure 3 presents a breakdown of error types identified in various LLMs while solving mathematical problems. Panel (b) specifically shows the distribution of these error types within the Mistral-7B language model. It visually represents the percentage of each error category (such as Question Misinterpretation, Formula Confusion, Calculation Error, etc.) that the Mistral-7B model made. This allows for a comparison of error types across different models, helping to understand the strengths and weaknesses of each model in mathematical reasoning.
read the caption
(b) Mistral-7B
More on tables
| Model | # Samples | In-Distribution | Out-Of-Distribution | Avg. | |||||
| GSM8K | MATH | ASDIV | Mathematics | MAWPS | SVAMP | College-Math | |||
| LLaMA3-8B | |||||||||
| SFT | 14.97k | 65.5 | 19.3 | 72.1 | 23.5 | 83.0 | 67.1 | 13.3 | 49.1 |
| RFT | 86.52k | 67.3 | 21.1 | 74.8 | 24.9 | 81.8 | 69.9 | 16.7 | 50.9 |
| MetaMath | 394.99k | 79.2 | 34.1 | 81.9 | 35.3 | 88.9 | 76.1 | 20.5 | 59.4 |
| GPTAug | 88.62k | 72.1 | 31.8 | 81.2 | 36.5 | 85.9 | 79.7 | 21.2 | 58.3 |
| ISC | 86.78k | 70.8 | 33.4 | 81.1 | 31.8 | 82.3 | 79.7 | 20.2 | 57.0 |
| S3C-Math† (w/ MetaMath) | 927k | 82.9 | 33.1 | - | - | - | 81.8 | - | - |
| RefAug | 29.94k | 75.9 | 32.6 | 82.3 | 35.5 | 88.4 | 81.5 | 21.0 | 59.6 |
| RefAug-90k | 89.92k | 77.4 | 34.2 | 82.1 | 35.7 | 87.7 | 81.8 | 21.9 | 60.1 |
| LEMMA | 88.90k | 79.2 | 38.3 | 84.2 | 39.2 | 88.8 | 82.6 | 24.7 | 62.4 |
| LEMMA (w/ MetaMath) | 403.59k | 86.4 | 42.3 | 87.1 | 45.8 | 89.5 | 82.8 | 24.3 | 65.5 |
| DeepSeekMath-7B | |||||||||
| SFT | 14.97k | 68.1 | 35.2 | 80.9 | 39.6 | 88.1 | 68.1 | 28.8 | 58.4 |
| RFT | 86.52k | 73.3 | 39.3 | 85.2 | 46.2 | 89.3 | 70.9 | 31.7 | 62.3 |
| MetaMath | 394.99k | 79.4 | 42.0 | 87.8 | 49.0 | 90.2 | 79.4 | 31.6 | 65.6 |
| GPTAug | 88.62k | 77.8 | 45.5 | 88.7 | 52.6 | 89.6 | 71.0 | 31.0 | 65.2 |
| ISC | 86.78k | 66.3 | 36.8 | 82.2 | 43.1 | 89.3 | 71.2 | 32.0 | 60.1 |
| S3C-Math† (w/ MetaMath) | 927k | 82.5 | 41.4 | - | - | - | 82.2 | - | - |
| RefAug | 29.94k | 75.5 | 39.5 | 81.2 | 56.9 | 82.1 | 72.8 | 30.4 | 62.6 |
| RefAug-90k | 89.92k | 76.7 | 42.5 | 82.4 | 57.5 | 83.1 | 74.1 | 30.6 | 63.8 |
| LEMMA | 88.90k | 80.4 | 50.6 | 89.8 | 61.6 | 90.9 | 81.6 | 35.6 | 70.1 |
| LEMMA (w/ MetaMath) | 403.59k | 83.0 | 51.7 | 90.4 | 65.8 | 91.9 | 82.1 | 35.2 | 71.4 |
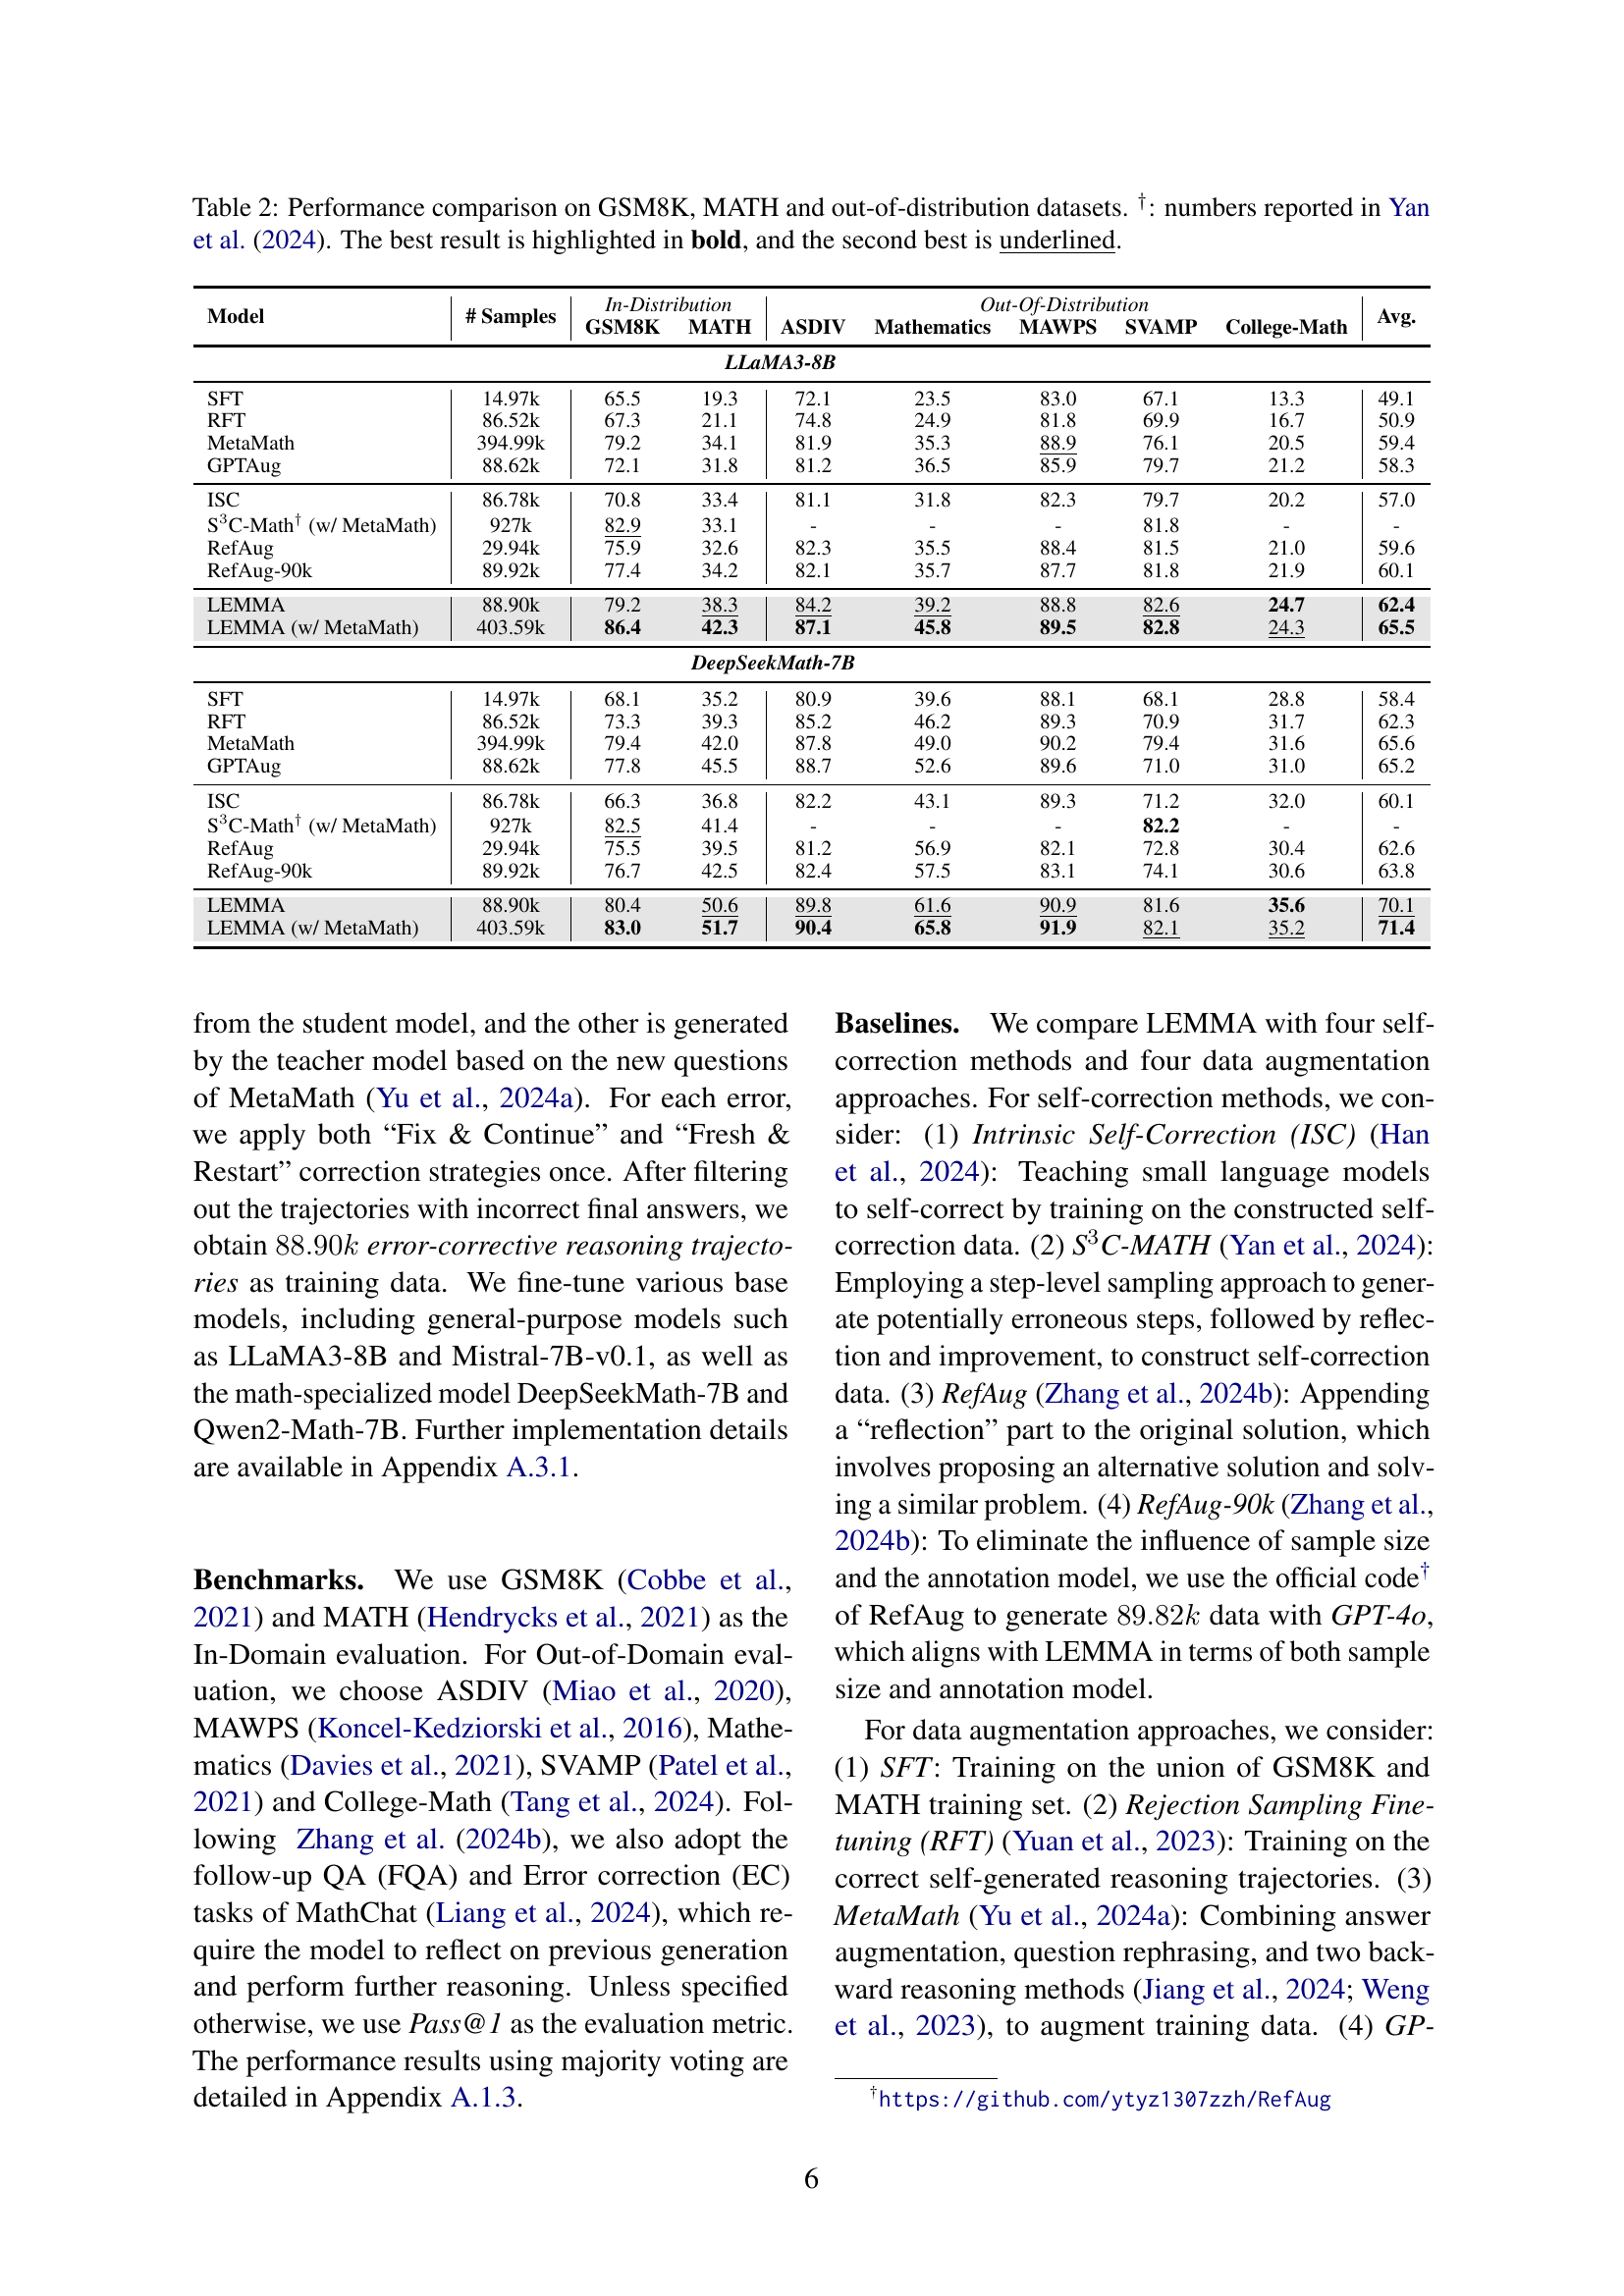
🔼 This table presents a performance comparison of various large language models (LLMs) on a range of mathematical reasoning tasks. It compares the accuracy of different models on three in-distribution datasets (GSM8K, MATH, and ASDIV) and five out-of-distribution datasets (Mathematics, MAWPS, SVAMP, and College-Math). The results are shown in terms of average accuracy across all datasets. The table also includes the number of training samples used for each model. Note that some numbers are taken from another research paper (Yan et al., 2024), as indicated by a dagger symbol. The best performing model for each dataset is shown in bold, while the second-best performing model is underlined.
read the caption
Table 2: Performance comparison on GSM8K, MATH and out-of-distribution datasets. †: numbers reported in Yan et al. (2024). The best result is highlighted in bold, and the second best is underlined.
| Method | MathChat-FQA | MathChat-EC | ||
|---|---|---|---|---|
| 1st | 2nd | 3rd | ||
| SFT | 63.2 | 37.2 | 28.3 | 66.1 |
| RFT | 64.0 | 40.8 | 29.1 | 62.6 |
| MetaMath | 80.3 | 49.4 | 40.1 | 66.6 |
| GPTAug | 78.8 | 45.6 | 37.9 | 80.0 |
| ISC | 78.4 | 46.8 | 39.3 | 78.5 |
| RefAug | 69.3 | 45.0 | 36.5 | 82.7 |
| RefAug-90k | 71.7 | 47.0 | 38.6 | 83.8 |
| LEMMA | 83.4 | 49.4 | 43.4 | 84.7 |
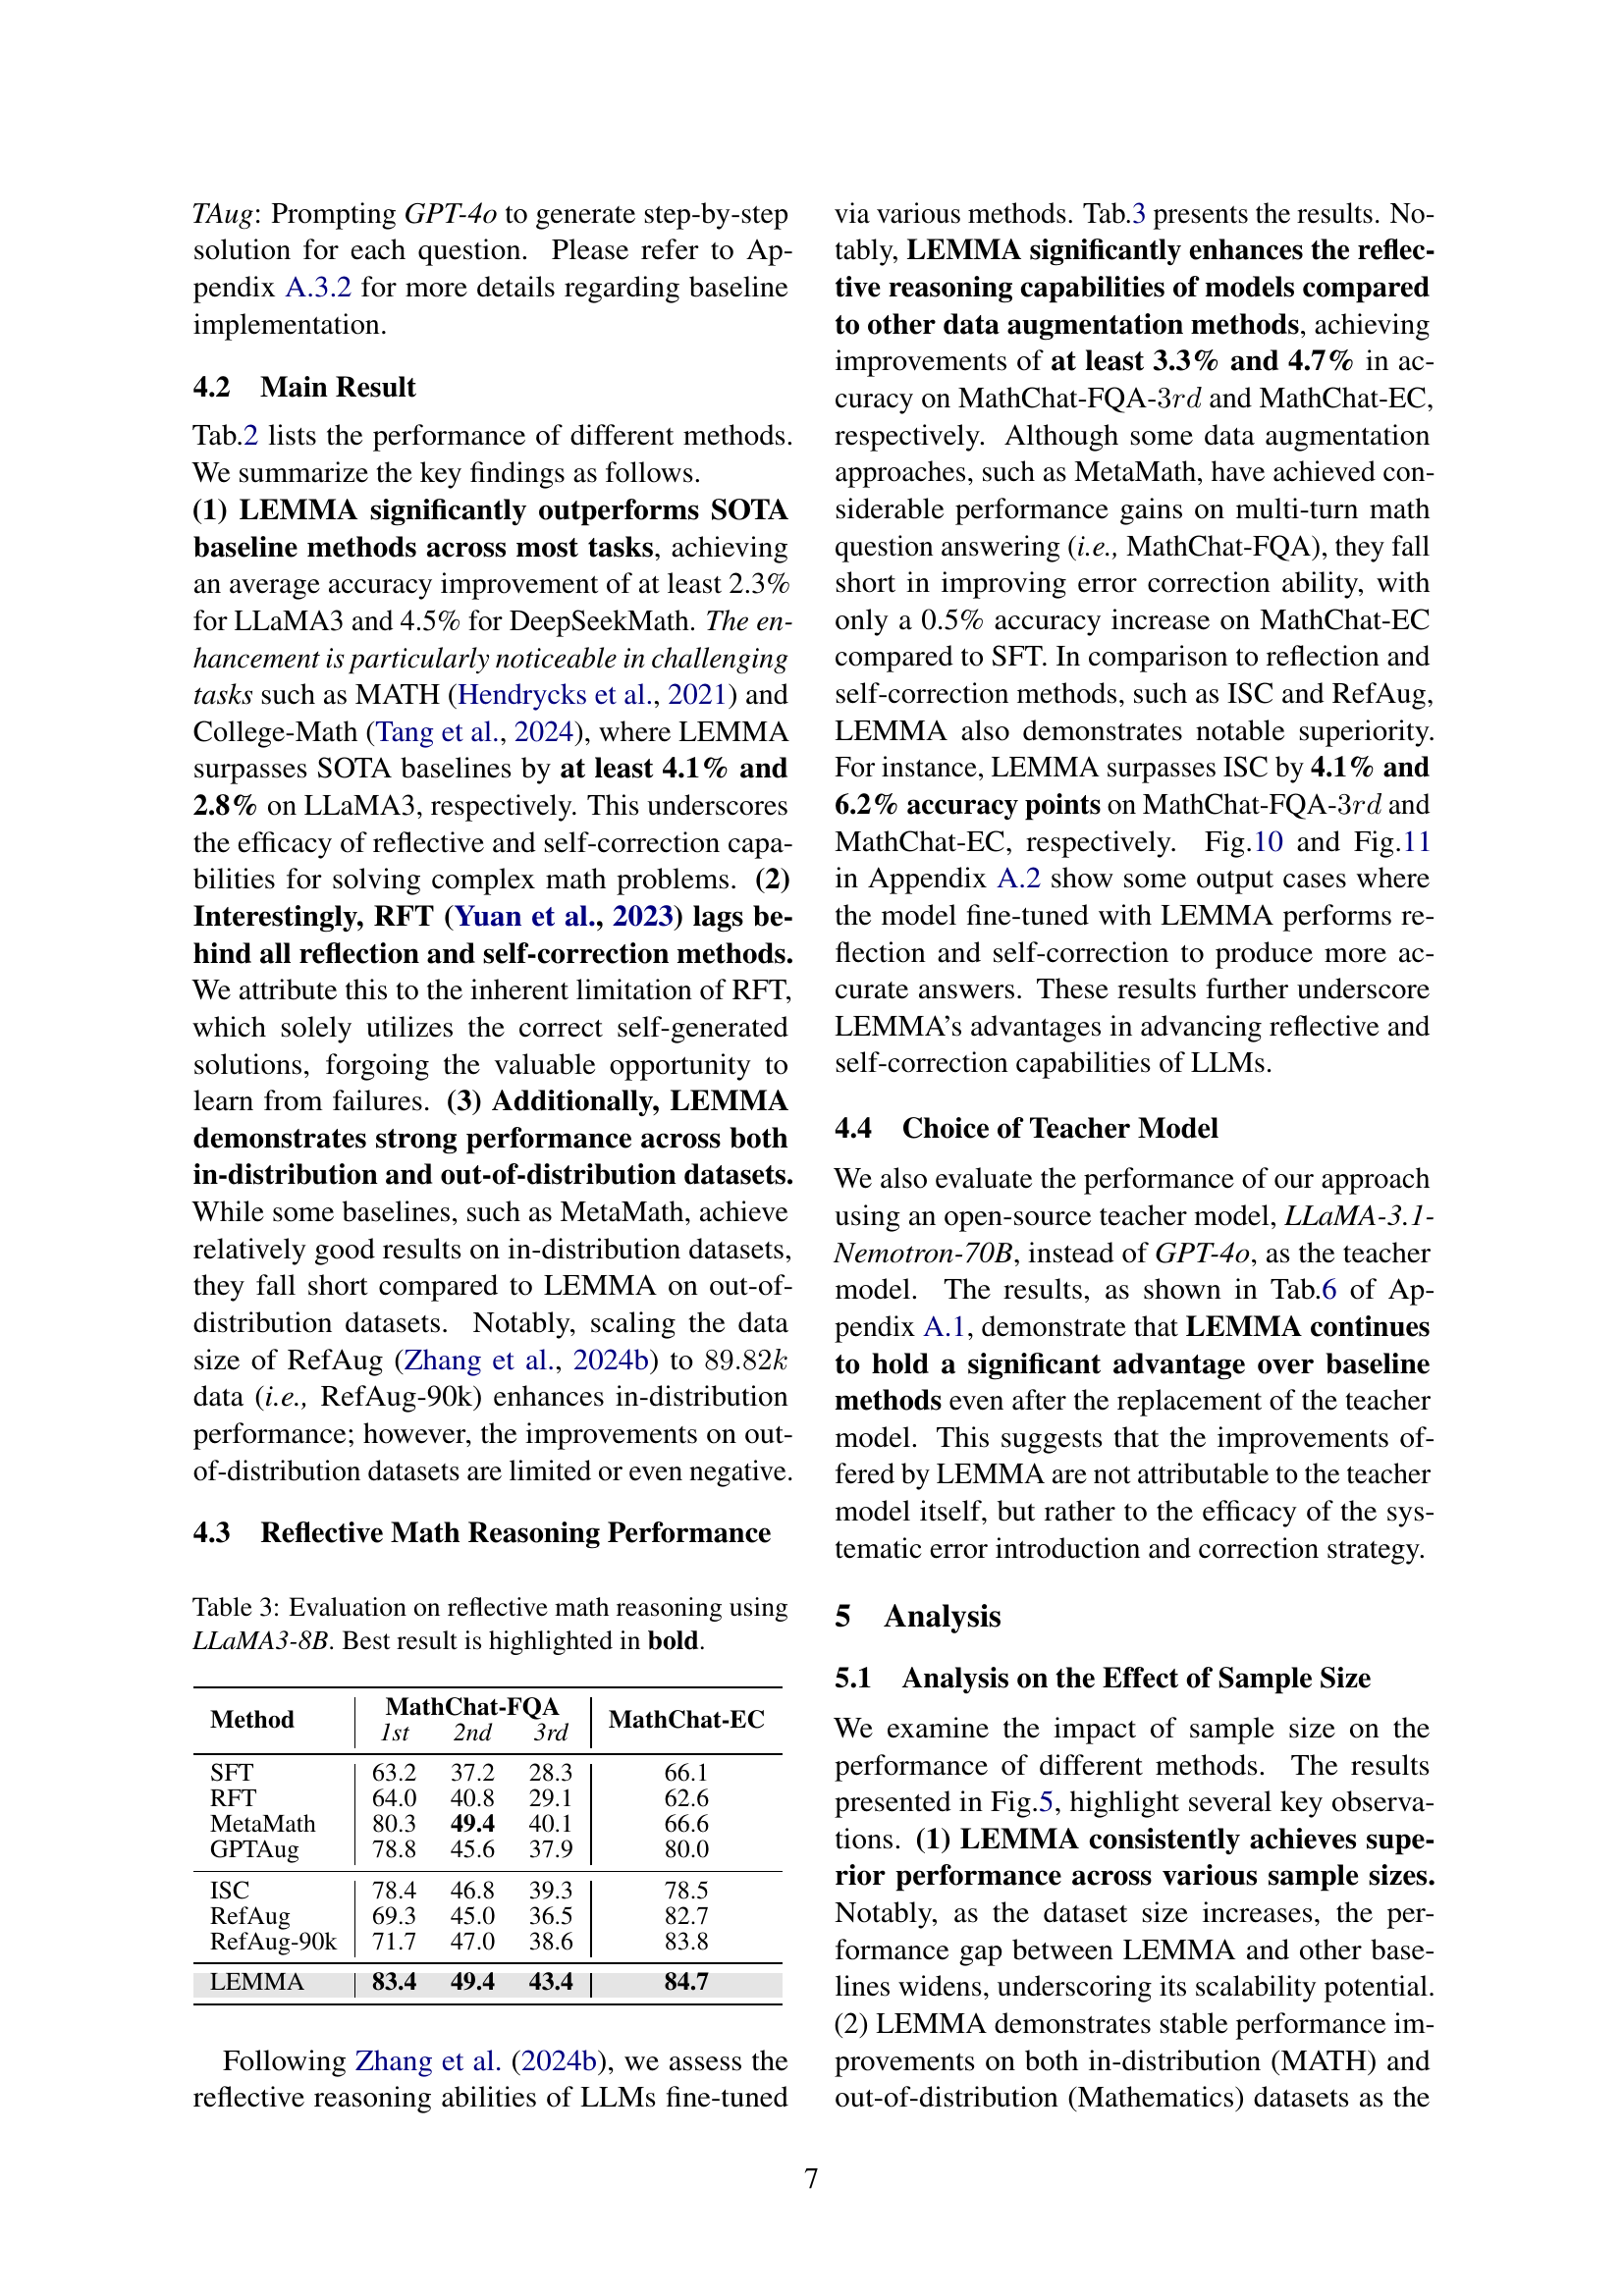
🔼 This table presents the performance of different LLMs on reflective mathematical reasoning tasks using the LLaMA3-8B model. The tasks evaluate the models’ ability to not only solve math problems but also to identify and correct their own errors during the problem-solving process. The table shows the accuracy of various models on three subtasks of MathChat (MathChat-FQA, MathChat-FQA-3rd, and MathChat-EC), demonstrating the effectiveness of different methods in fostering reflective mathematical reasoning capabilities in LLMs.
read the caption
Table 3: Evaluation on reflective math reasoning using LLaMA3-8B. Best result is highlighted in bold.
| Method | GSM8K | MATH |
|---|---|---|
| LEMMA | 79.2 | 38.3 |
| w/o Error Aug. | 72.8 | 28.8 |
| w/o Error Aug. (90k) | 74.3 | 32.1 |
| w/o Fresh & Restart | 75.2 | 34.4 |
| w/o Fresh & Restart (90k) | 75.7 | 34.1 |
🔼 This table presents the results of an ablation study conducted to evaluate the individual contributions of different components within the LEMMA framework. It shows the performance of LEMMA models when specific components, such as the error augmentation module or the Fresh & Restart correction strategy, are removed. This analysis helps to understand the impact of each component on the overall performance and identify the key elements responsible for LEMMA’s success in improving the mathematical reasoning capabilities of LLMs.
read the caption
Table 4: Ablation study on each component of LEMMA.
| Method | # Solution | # Avg. Token |
|---|---|---|
| SFT | 14.97k | 242.85 |
| RFT† Yuan et al. (2023) | 86.52k | 172.96 |
| MetaMath Yu et al. (2024a) | 394.99k | 231.08 |
| GPTAug Achiam et al. (2023) | 88.62k | 619.54 |
| ISC Han et al. (2024) | 86.78k | 746.71 |
| S3C-Math Yan et al. (2024) (w/ MetaMath) | 927k⋆ | - |
| RefAug Zhang et al. (2024b) | 29.94k | 737.94 |
| RefAug++ Zhang et al. (2024b) | 89.82k | 770.38 |
| LEMMA | 88.90k | 623.38 |
| LEMMA (w/ MetaMath) | 403.59k | 544.14 |
🔼 This table presents a statistical overview of the datasets used in the paper’s experiments. It compares different methods for generating and augmenting training data for mathematical reasoning models. The table shows the number of solutions generated by each method, along with the average number of tokens per solution. It is important to note that the solutions generated by LLaMA3 are explicitly indicated, and the numbers reported in Yan et al. (2024) are also marked.
read the caption
Table 5: Data statistics of the different methods. †: solutions generated by LLaMA3, ⋆: numbers reported in Yan et al. (2024).
| Model | In-Distribution | Out-Of-Distribution | Avg. | |||||
|---|---|---|---|---|---|---|---|---|
| GSM8K | MATH | ASDIV | Mathematics | MAWPS | SVAMP | College-Math | ||
| LLaMA-3-8B | ||||||||
| GPTAug | 72.1 | 31.8 | 81.2 | 36.5 | 85.9 | 79.7 | 21.2 | 58.3 |
| LEMMA (GPT-4o) | 79.2 | 38.3 | 84.2 | 39.2 | 88.8 | 82.6 | 24.7 | 62.4 |
| LEMMA (LLaMA3) | 77.3 | 36.4 | 84.1 | 37.9 | 87.7 | 82.7 | 23.1 | 61.3 |
| DeepSeekMath-7B | ||||||||
| GPTAug | 77.8 | 45.5 | 88.7 | 52.6 | 89.6 | 71.0 | 31.0 | 65.2 |
| LEMMA (GPT-4o) | 80.4 | 50.6 | 89.8 | 61.6 | 90.9 | 81.6 | 35.6 | 70.1 |
| LEMMA (LLaMA3) | 78.4 | 48.8 | 88.8 | 60.7 | 88.0 | 76.1 | 34.7 | 67.9 |
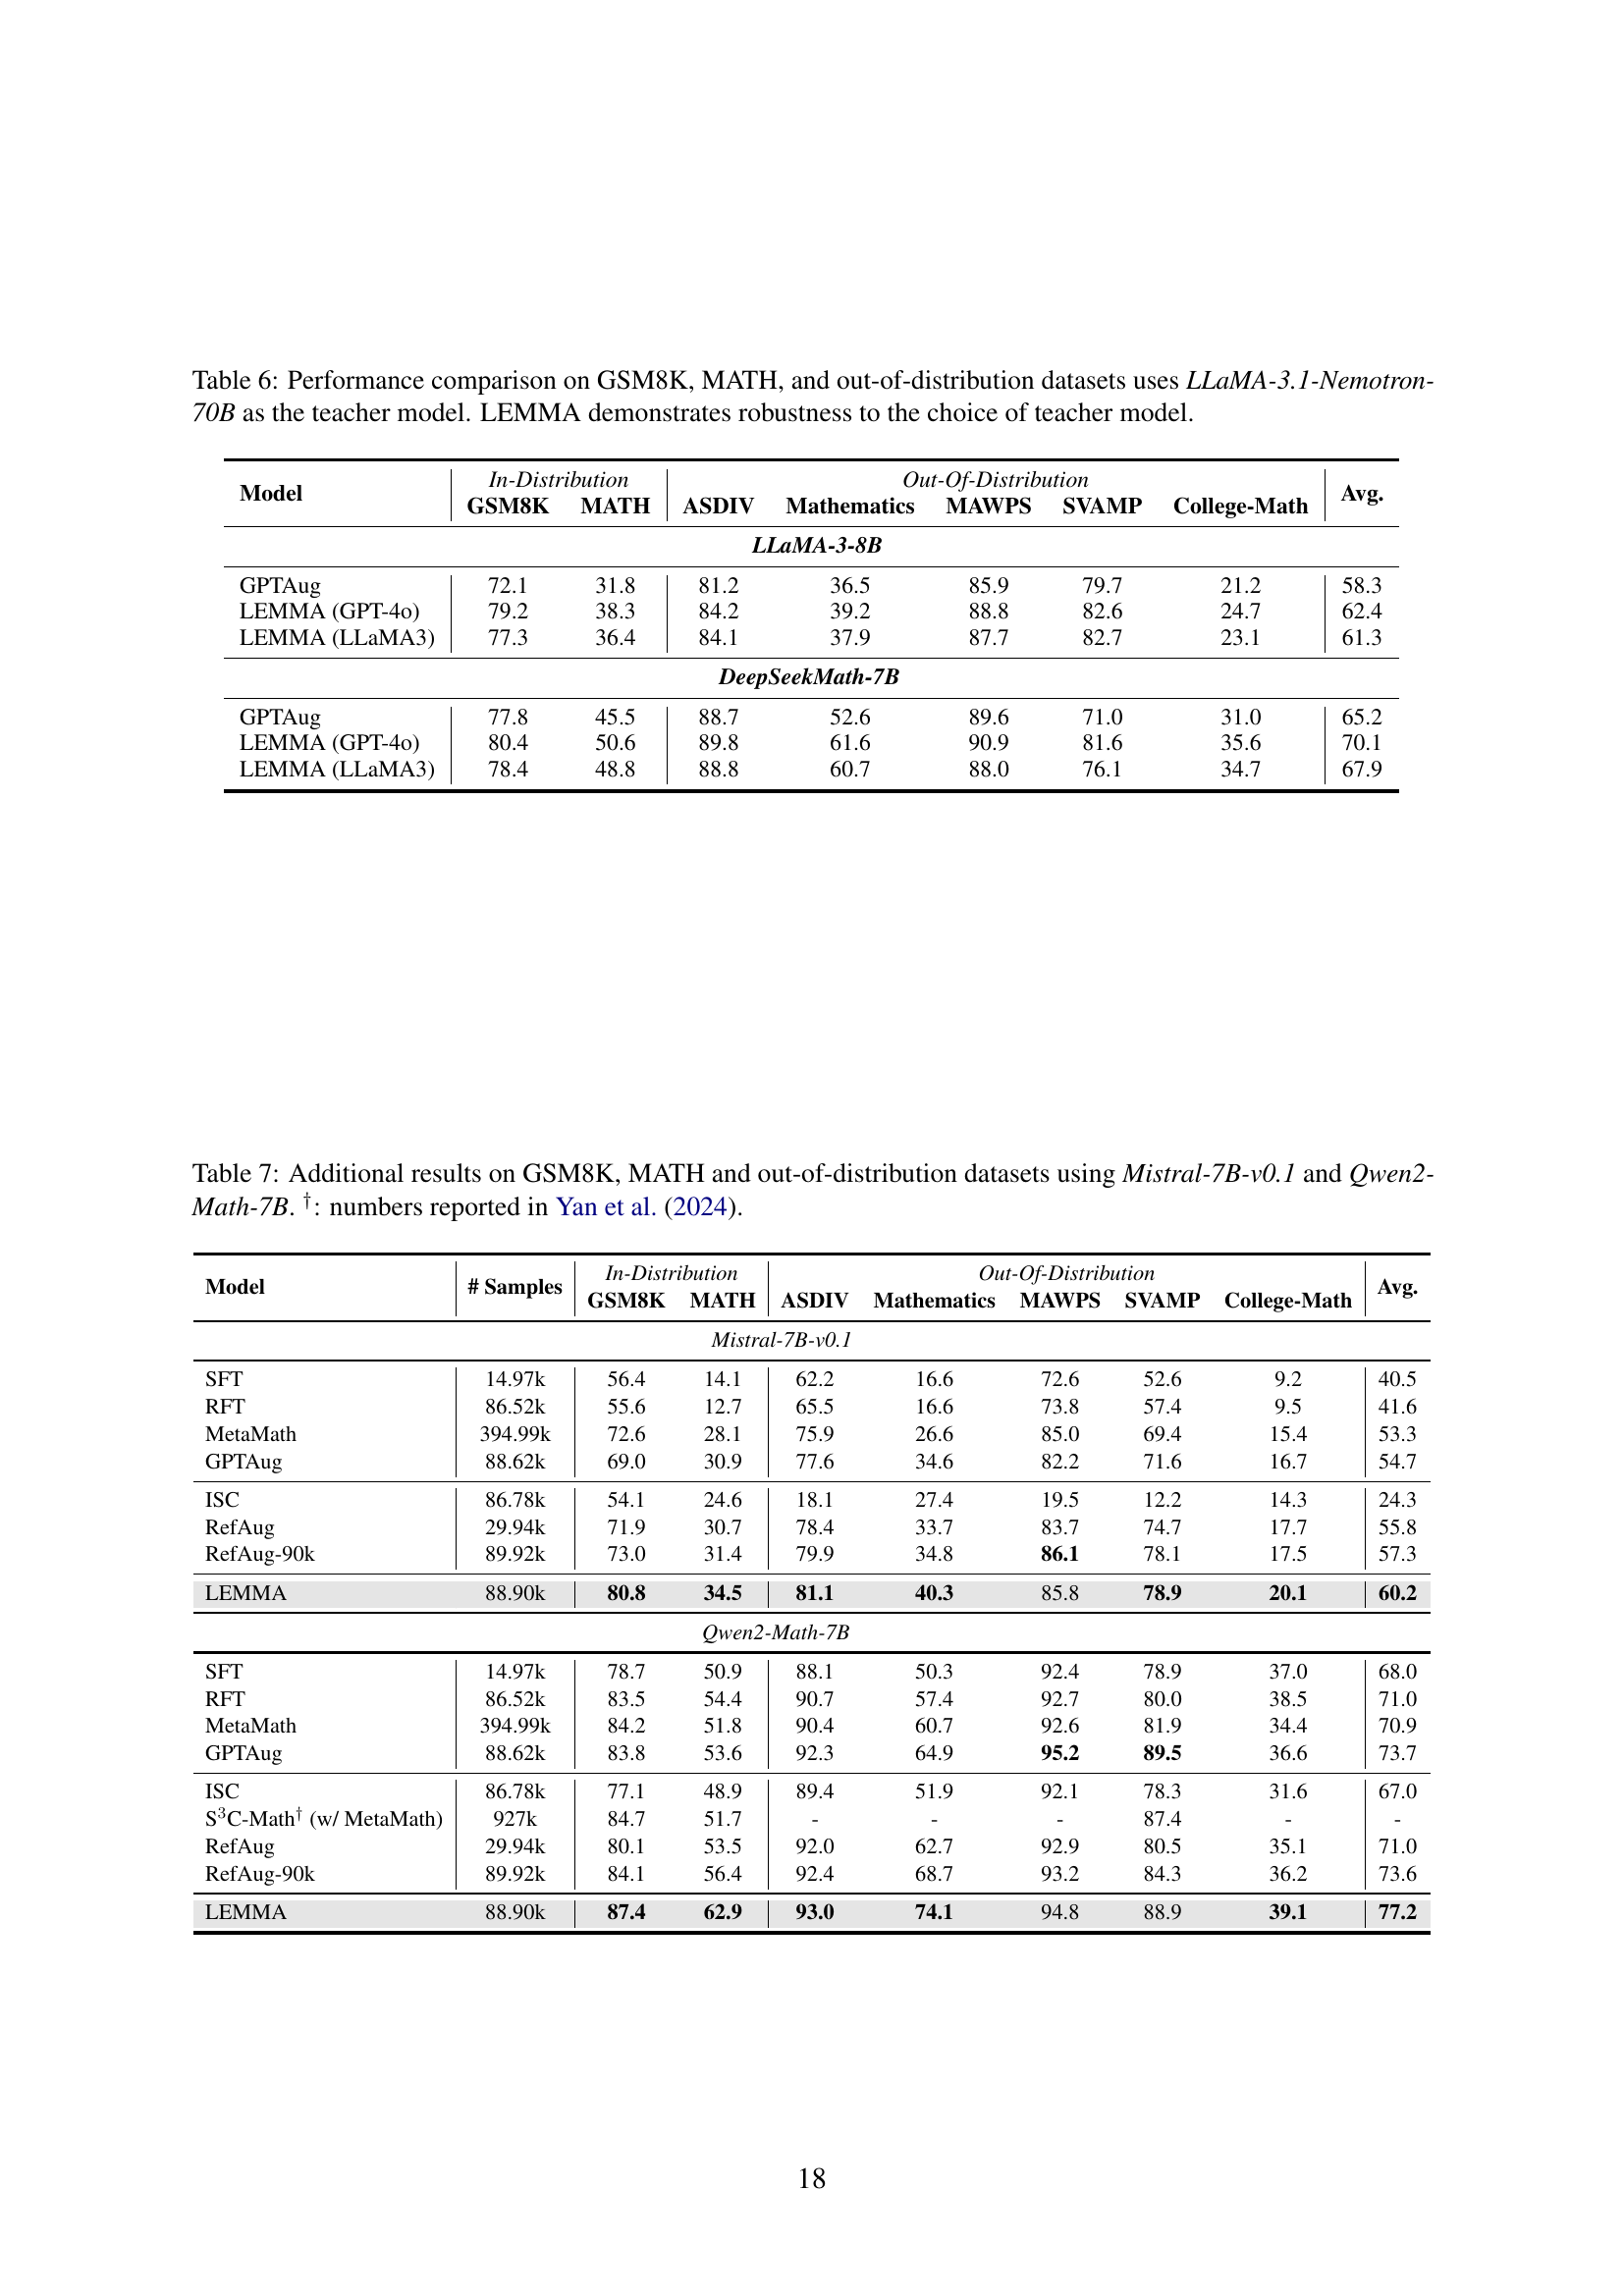
🔼 This table compares the performance of different LLMs on various mathematical reasoning benchmarks, including GSM8K and MATH, as well as several out-of-distribution datasets. The models are evaluated using two different methods: standard supervised fine-tuning (SFT) and the proposed LEMMA method. The key finding is that LEMMA’s performance is robust even when using a different teacher model (LLaMA-3.1-Nemotron-70B instead of GPT-4), demonstrating its effectiveness regardless of the specific teacher model used.
read the caption
Table 6: Performance comparison on GSM8K, MATH, and out-of-distribution datasets uses LLaMA-3.1-Nemotron-70B as the teacher model. LEMMA demonstrates robustness to the choice of teacher model.
| Model | # Samples | In-Distribution | Out-Of-Distribution | Avg. | |||||
| GSM8K | MATH | ASDIV | Mathematics | MAWPS | SVAMP | College-Math | |||
| Mistral-7B-v0.1 | |||||||||
| SFT | 14.97k | 56.4 | 14.1 | 62.2 | 16.6 | 72.6 | 52.6 | 9.2 | 40.5 |
| RFT | 86.52k | 55.6 | 12.7 | 65.5 | 16.6 | 73.8 | 57.4 | 9.5 | 41.6 |
| MetaMath | 394.99k | 72.6 | 28.1 | 75.9 | 26.6 | 85.0 | 69.4 | 15.4 | 53.3 |
| GPTAug | 88.62k | 69.0 | 30.9 | 77.6 | 34.6 | 82.2 | 71.6 | 16.7 | 54.7 |
| ISC | 86.78k | 54.1 | 24.6 | 18.1 | 27.4 | 19.5 | 12.2 | 14.3 | 24.3 |
| RefAug | 29.94k | 71.9 | 30.7 | 78.4 | 33.7 | 83.7 | 74.7 | 17.7 | 55.8 |
| RefAug-90k | 89.92k | 73.0 | 31.4 | 79.9 | 34.8 | 86.1 | 78.1 | 17.5 | 57.3 |
| LEMMA | 88.90k | 80.8 | 34.5 | 81.1 | 40.3 | 85.8 | 78.9 | 20.1 | 60.2 |
| Qwen2-Math-7B | |||||||||
| SFT | 14.97k | 78.7 | 50.9 | 88.1 | 50.3 | 92.4 | 78.9 | 37.0 | 68.0 |
| RFT | 86.52k | 83.5 | 54.4 | 90.7 | 57.4 | 92.7 | 80.0 | 38.5 | 71.0 |
| MetaMath | 394.99k | 84.2 | 51.8 | 90.4 | 60.7 | 92.6 | 81.9 | 34.4 | 70.9 |
| GPTAug | 88.62k | 83.8 | 53.6 | 92.3 | 64.9 | 95.2 | 89.5 | 36.6 | 73.7 |
| ISC | 86.78k | 77.1 | 48.9 | 89.4 | 51.9 | 92.1 | 78.3 | 31.6 | 67.0 |
| S3C-Math† (w/ MetaMath) | 927k | 84.7 | 51.7 | - | - | - | 87.4 | - | - |
| RefAug | 29.94k | 80.1 | 53.5 | 92.0 | 62.7 | 92.9 | 80.5 | 35.1 | 71.0 |
| RefAug-90k | 89.92k | 84.1 | 56.4 | 92.4 | 68.7 | 93.2 | 84.3 | 36.2 | 73.6 |
| LEMMA | 88.90k | 87.4 | 62.9 | 93.0 | 74.1 | 94.8 | 88.9 | 39.1 | 77.2 |
🔼 Table 7 presents the performance comparison results on various mathematical reasoning benchmarks, including GSM8K and MATH, as well as several out-of-distribution datasets. The models evaluated are fine-tuned using the LEMMA approach, and the results are compared against several baseline methods. The table specifically shows results obtained using the Mistral-7B-v0.1 and Qwen2-Math-7B language models. Results from a previous study by Yan et al. (2024) are also included for comparison purposes.
read the caption
Table 7: Additional results on GSM8K, MATH and out-of-distribution datasets using Mistral-7B-v0.1 and Qwen2-Math-7B. †: numbers reported in Yan et al. (2024).
| Model | # Samples | GSM8K | MATH | ASDIV | Mathematics | College-Math | |||||
|---|---|---|---|---|---|---|---|---|---|---|---|
| Pass@1 | Maj@32 | Pass@1 | Maj@32 | Pass@1 | Maj@32 | Pass@1 | Maj@32 | Pass@1 | Maj@32 | ||
| LLaMA3-8B | |||||||||||
| SFT | 14.97k | 65.5 | 80.3 | 19.3 | 30.8 | 72.1 | 82.3 | 23.5 | 35.0 | 13.3 | 20.2 |
| RFT | 86.52k | 67.3 | 79.3 | 21.1 | 29.4 | 74.8 | 84.5 | 24.9 | 37.2 | 16.7 | 22.3 |
| MetaMath | 394.99k | 79.2 | 85.7 | 34.1 | 42.2 | 81.9 | 87.9 | 35.3 | 47.3 | 20.5 | 25.1 |
| GPTAug | 88.62k | 72.1 | 81.1 | 31.8 | 38.8 | 81.2 | 90.4 | 36.5 | 47.5 | 21.2 | 25.0 |
| ISC | 86.78k | 70.8 | 85.5 | 33.4 | 48.4 | 81.1 | 87.4 | 31.8 | 47.8 | 20.2 | 27.4 |
| S3C-Math† (w/ MetaMath) | 927k | 82.9 | 87.3 | 33.1 | 41.6 | - | - | - | - | - | - |
| RefAug | 29.94k | 75.9 | 83.5 | 32.6 | 42.7 | 82.3 | 90.0 | 35.5 | 46.6 | 21.0 | 25.8 |
| RefAug-90k | 89.92k | 77.4 | 85.3 | 34.2 | 41.8 | 82.1 | 90.3 | 35.7 | 49.3 | 21.9 | 25.6 |
| LEMMA | 88.90k | 79.2 | 90.3 | 38.3 | 53.1 | 84.2 | 90.1 | 39.2 | 53.3 | 24.7 | 32.1 |
| DeepSeekMath-7B | |||||||||||
| SFT | 14.97k | 68.1 | 81.7 | 35.2 | 48.6 | 80.9 | 90.0 | 39.6 | 55.1 | 28.8 | 32.6 |
| RFT | 86.52k | 73.3 | 84.5 | 39.3 | 50.7 | 85.2 | 91.6 | 46.2 | 62.9 | 31.7 | 38.4 |
| MetaMath | 394.99k | 79.4 | 84.8 | 42.0 | 52.5 | 87.8 | 93.1 | 49.0 | 64.2 | 31.6 | 37.4 |
| GPTAug | 88.62k | 77.8 | 87.2 | 45.5 | 55.2 | 88.7 | 93.7 | 52.6 | 75.6 | 31.0 | 35.1 |
| ISC | 86.78k | 66.3 | 82.5 | 36.8 | 51.4 | 82.2 | 91.4 | 43.1 | 61.6 | 32.0 | 38.1 |
| S3C-Math† (w/ MetaMath) | 927k | 82.5 | 88.2 | 41.4 | 52.1 | - | - | - | - | - | - |
| RefAug | 29.94k | 75.5 | 86.5 | 39.5 | 49.5 | 81.2 | 94.1 | 56.9 | 70.1 | 30.4 | 31.4 |
| RefAug-90k | 89.92k | 76.7 | 86.7 | 42.5 | 50.6 | 82.4 | 94.3 | 57.5 | 73.1 | 30.6 | 31.9 |
| LEMMA | 88.90k | 80.4 | 89.2 | 50.6 | 63.6 | 89.8 | 93.1 | 61.6 | 77.4 | 35.6 | 36.8 |
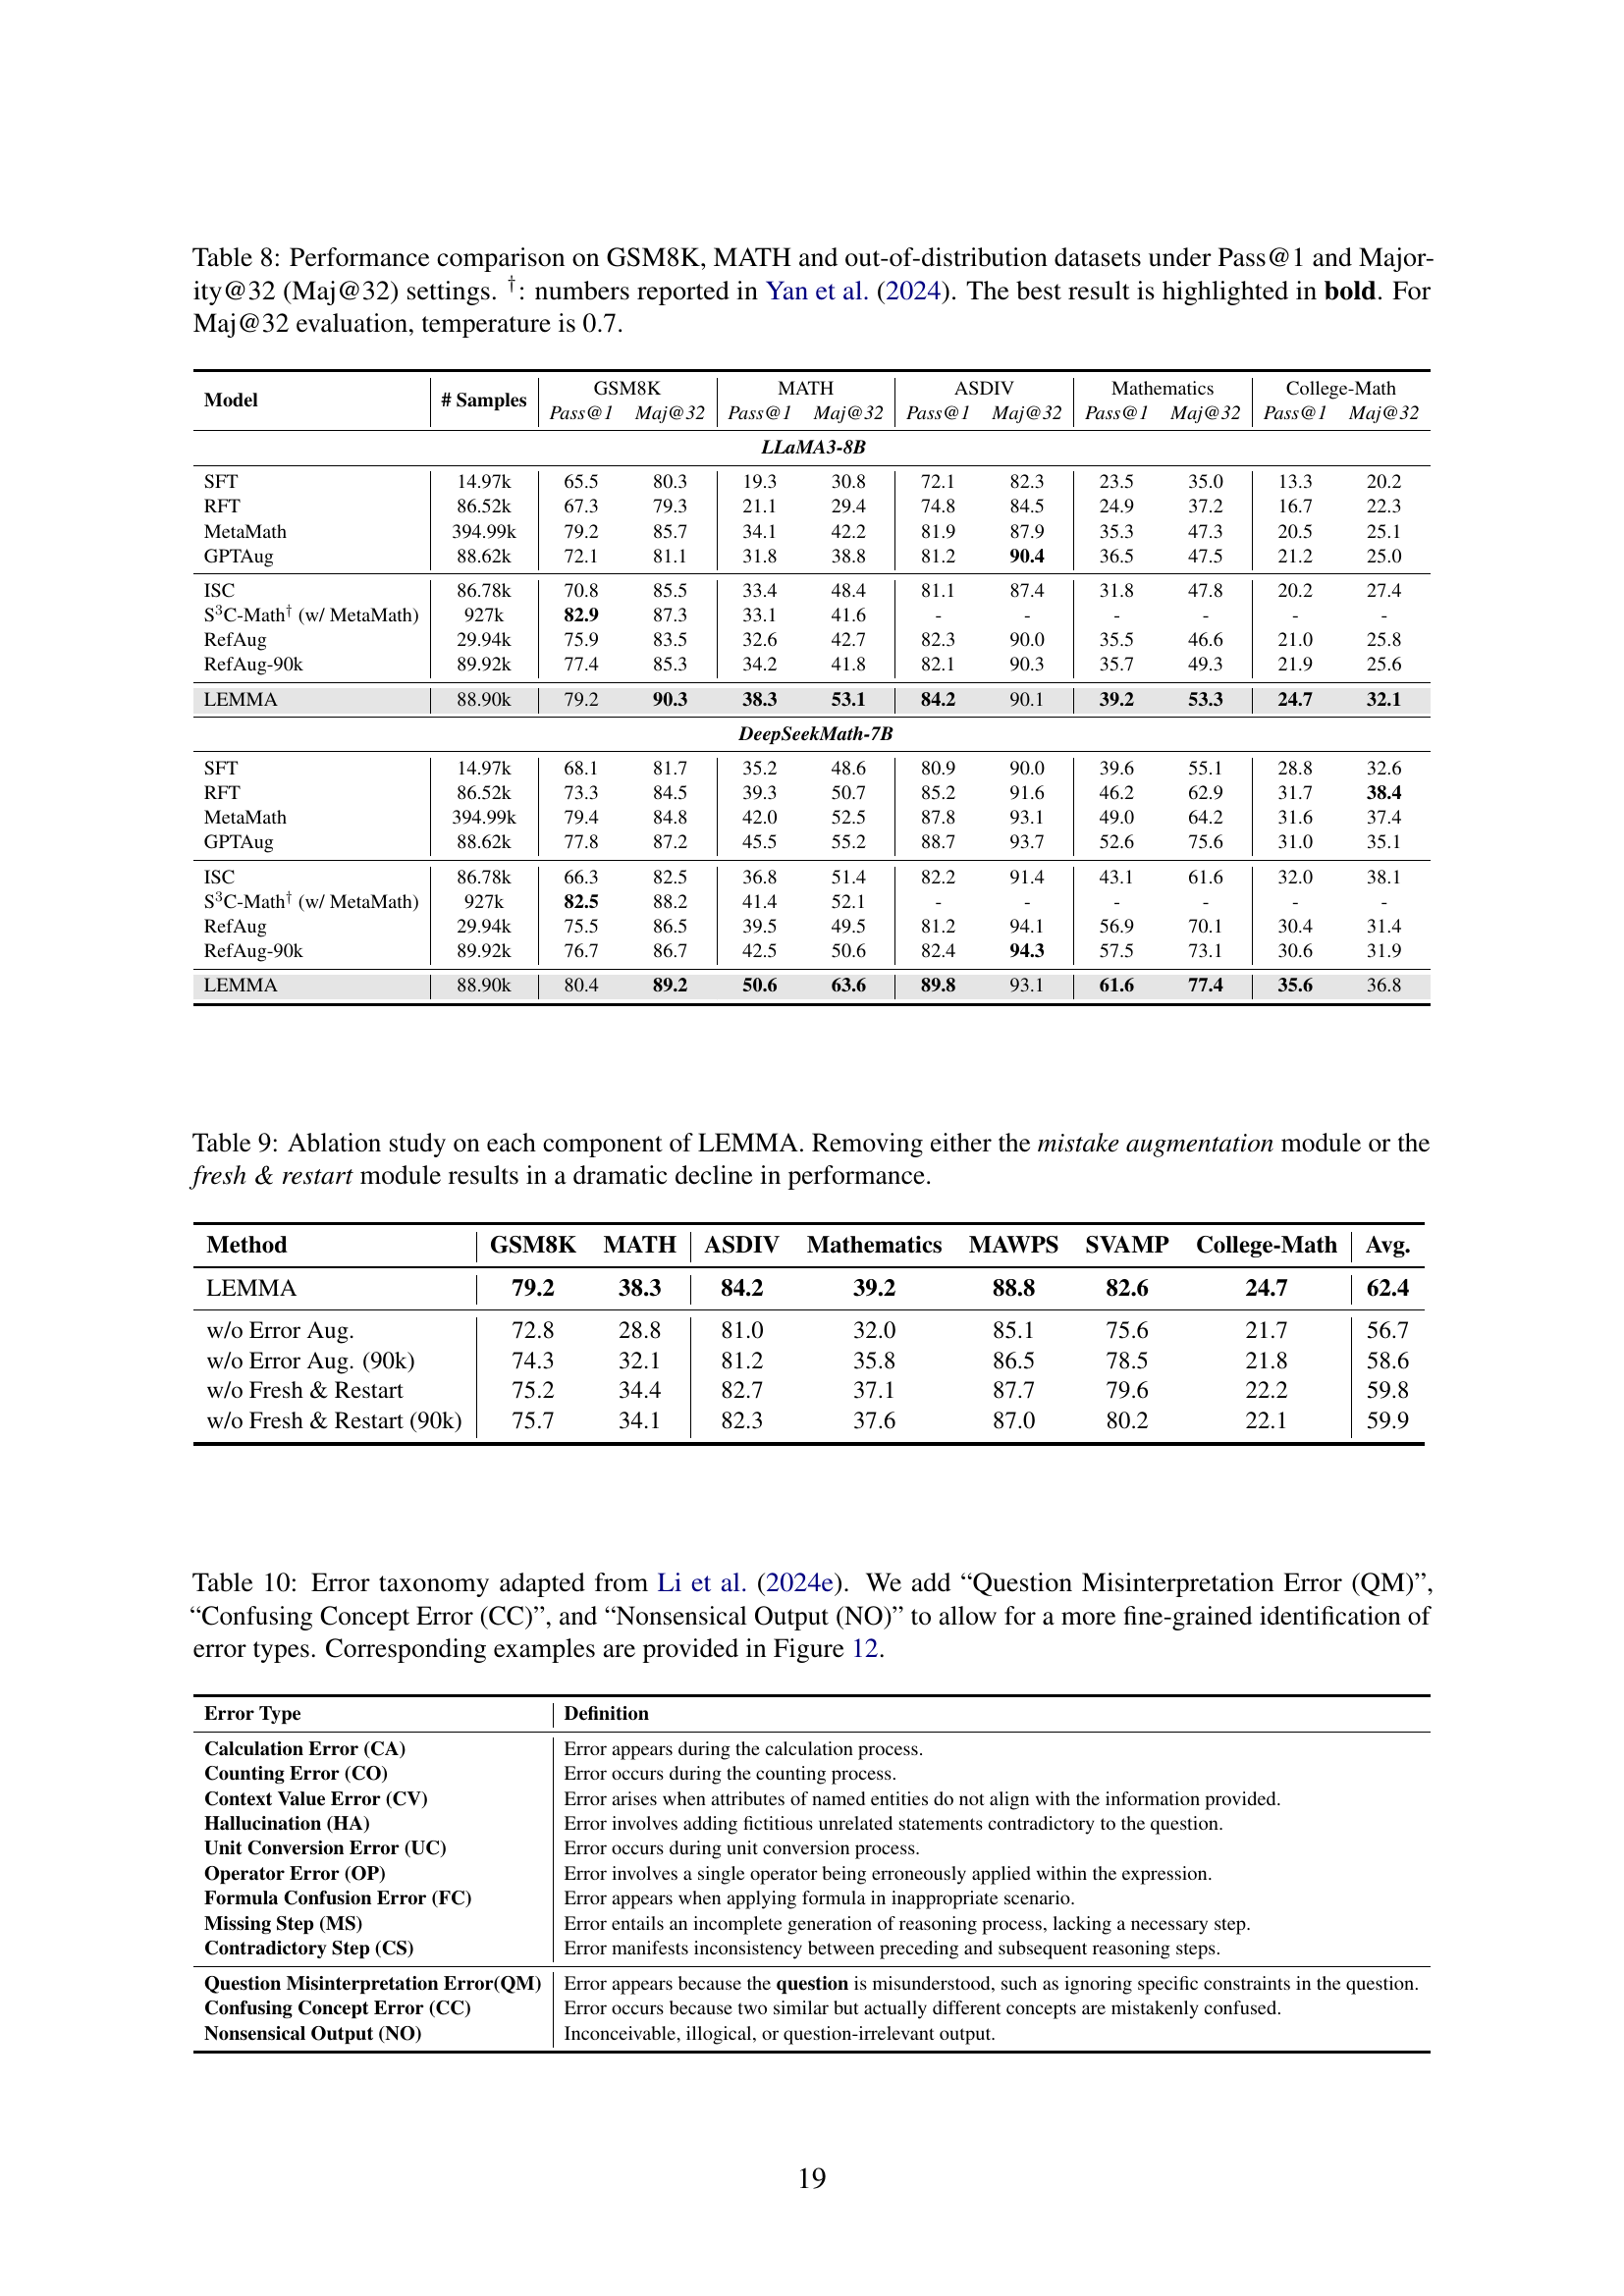
🔼 This table compares the performance of various methods on solving mathematical reasoning problems, using two evaluation metrics: Pass@1 (the percentage of correct answers in the first attempt) and Majority@32 (the percentage of correct answers after considering the top 32 answers). The datasets used include GSM8K, MATH, and several out-of-distribution datasets. The results show the accuracy of each method on each dataset and metric, allowing for a comparison of their effectiveness. Results from a previous study by Yan et al. (2024) are included for comparison.
read the caption
Table 8: Performance comparison on GSM8K, MATH and out-of-distribution datasets under Pass@1 and Majority@32 (Maj@32) settings. †: numbers reported in Yan et al. (2024). The best result is highlighted in bold. For Maj@32 evaluation, temperature is 0.7.
| Method | GSM8K | MATH | ASDIV | Mathematics | MAWPS | SVAMP | College-Math | Avg. |
|---|---|---|---|---|---|---|---|---|
| LEMMA | 79.2 | 38.3 | 84.2 | 39.2 | 88.8 | 82.6 | 24.7 | 62.4 |
| w/o Error Aug. | 72.8 | 28.8 | 81.0 | 32.0 | 85.1 | 75.6 | 21.7 | 56.7 |
| w/o Error Aug. (90k) | 74.3 | 32.1 | 81.2 | 35.8 | 86.5 | 78.5 | 21.8 | 58.6 |
| w/o Fresh & Restart | 75.2 | 34.4 | 82.7 | 37.1 | 87.7 | 79.6 | 22.2 | 59.8 |
| w/o Fresh & Restart (90k) | 75.7 | 34.1 | 82.3 | 37.6 | 87.0 | 80.2 | 22.1 | 59.9 |
🔼 This ablation study analyzes the impact of removing key components from the LEMMA framework on its performance. Specifically, it evaluates the model’s performance when either the error augmentation module (which introduces diverse errors for training) or the ‘fresh & restart’ correction strategy (which allows the model to generate a completely new solution from scratch after detecting an error) are removed. The results show a significant decrease in performance when either component is excluded, highlighting their critical roles in LEMMA’s effectiveness.
read the caption
Table 9: Ablation study on each component of LEMMA. Removing either the mistake augmentation module or the fresh & restart module results in a dramatic decline in performance.
| Error Type | Definition |
|---|---|
| Calculation Error (CA) | Error appears during the calculation process. |
| Counting Error (CO) | Error occurs during the counting process. |
| Context Value Error (CV) | Error arises when attributes of named entities do not align with the information provided. |
| Hallucination (HA) | Error involves adding fictitious unrelated statements contradictory to the question. |
| Unit Conversion Error (UC) | Error occurs during unit conversion process. |
| Operator Error (OP) | Error involves a single operator being erroneously applied within the expression. |
| Formula Confusion Error (FC) | Error appears when applying formula in inappropriate scenario. |
| Missing Step (MS) | Error entails an incomplete generation of reasoning process, lacking a necessary step. |
| Contradictory Step (CS) | Error manifests inconsistency between preceding and subsequent reasoning steps. |
| Question Misinterpretation Error(QM) | Error appears because the question is misunderstood, such as ignoring specific constraints in the question. |
| Confusing Concept Error (CC) | Error occurs because two similar but actually different concepts are mistakenly confused. |
| Nonsensical Output (NO) | Inconceivable, illogical, or question-irrelevant output. |
🔼 This table presents a taxonomy of error types encountered in mathematical reasoning by large language models (LLMs). It expands on a previous taxonomy by Li et al. (2024e) to include more fine-grained categories. Specifically, it adds ‘Question Misinterpretation Error,’ ‘Confusing Concept Error,’ and ‘Nonsensical Output’ to better classify the diverse range of errors observed in LLM responses. Figure 12 in the paper provides examples of each error type to illustrate the taxonomy.
read the caption
Table 10: Error taxonomy adapted from Li et al. (2024e). We add “Question Misinterpretation Error (QM)”, “Confusing Concept Error (CC)”, and “Nonsensical Output (NO)” to allow for a more fine-grained identification of error types. Corresponding examples are provided in Figure 12.
Full paper#