TL;DR#
Large Vision-Language Models(LVLMs) use preference optimization, derived from language, but need high-quality human-annotated preference data and robust reward models, making it costly. Thus, the paper explores whether an R1-like reinforcement learning method can enhance LVLM capabilities with curated vision-language instruction data.
Vision-R1, a vision-guided R1-like reinforcement learning algorithm for LVLMs, rewards models with definitive vision feedback. It uses curated instruction data, removing the need for reward models and preference datasets. Vision-R1 achieves performance gains on models across scenarios, and improves Qwen2.5-VL by 50% while maintaining generalization.
Key Takeaways#
Why does it matter?#
This paper introduces Vision-R1, which advances vision-language models by automating alignment with visual feedback. It offers a new approach to improve object localization. This can benefit researchers by enhancing model performance, reducing reliance on human-annotated data, and exploring vision-guided reinforcement learning in the field of AI.
Visual Insights#

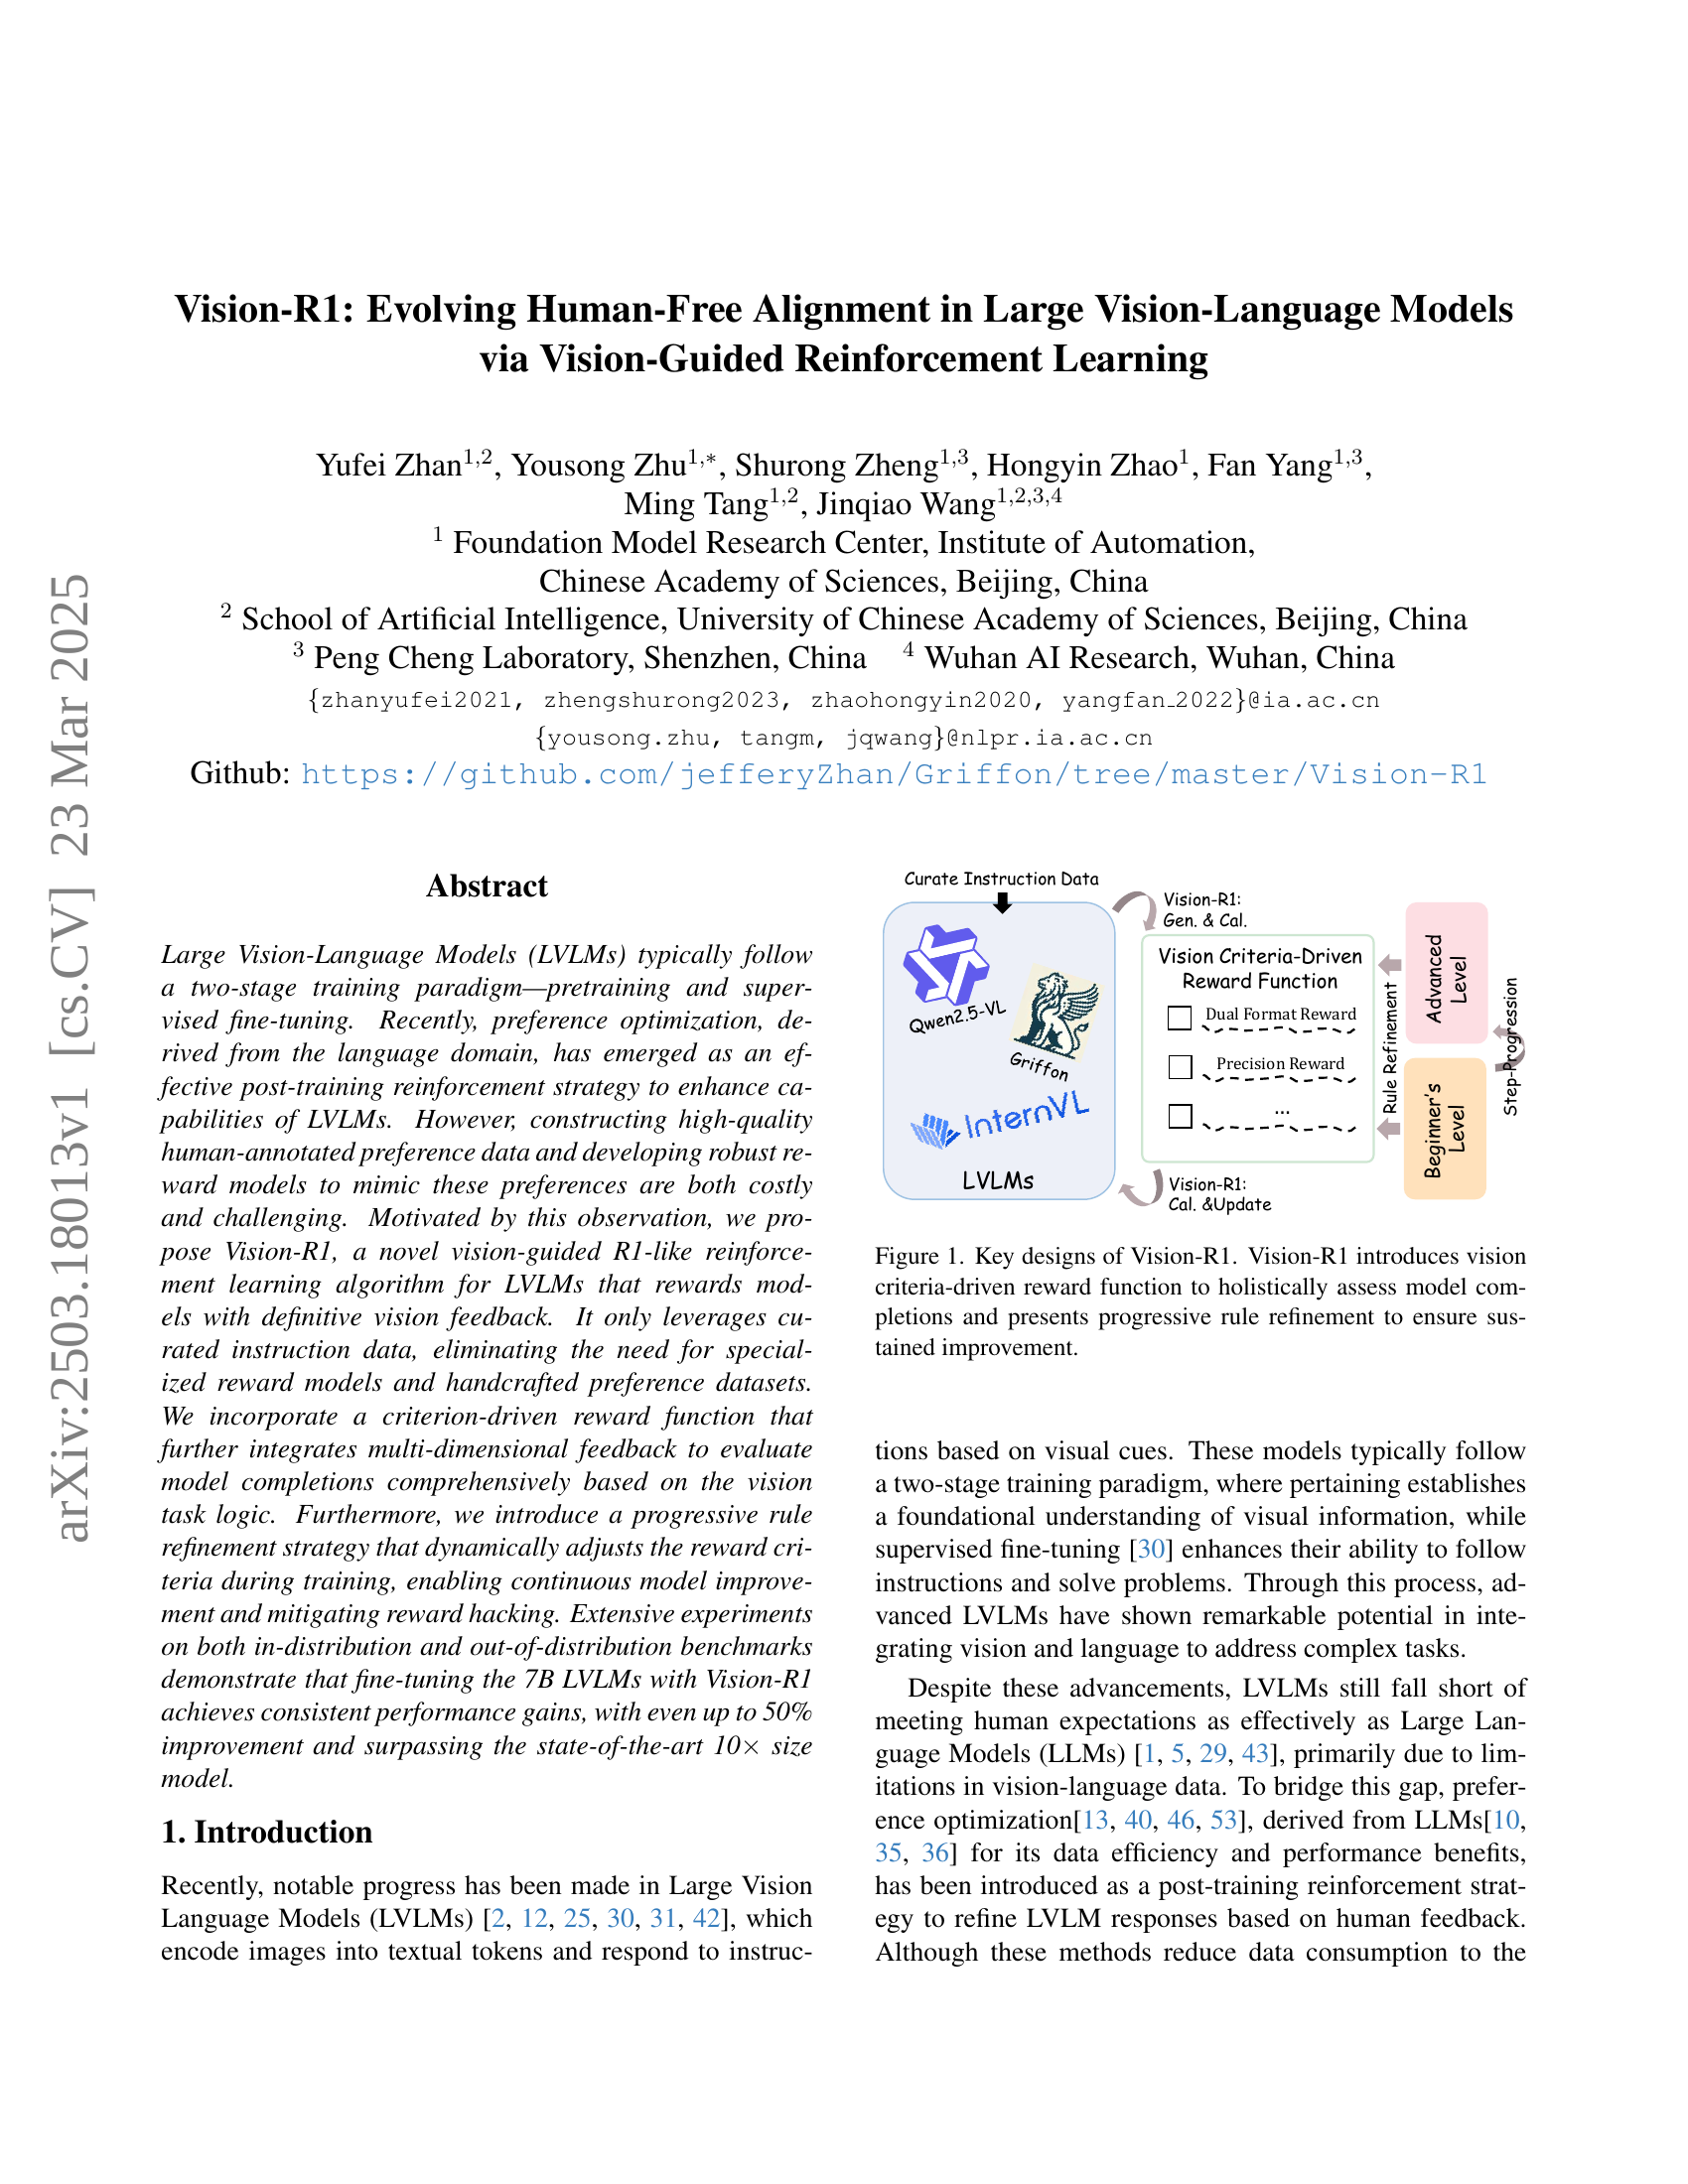
🔼 Vision-R1 is a reinforcement learning algorithm for Large Vision-Language Models (LVLMs). It uses a novel vision-guided reward function that evaluates model outputs based on visual feedback, eliminating the need for human-annotated preference data. The algorithm incorporates a progressive rule refinement strategy, dynamically adjusting reward criteria during training to ensure continuous model improvement and mitigate reward hacking. The figure illustrates the key components of Vision-R1: the curated instruction data, the vision criteria-driven reward function (incorporating precision and dual-format rewards), and the progressive rule refinement process. The LVLMs (e.g., Qwen2.5-VL and InternVL) are shown interacting with the Vision-R1 system.
read the caption
Figure 1: Key designs of Vision-R1. Vision-R1 introduces vision criteria-driven reward function to holistically assess model completions and presents progressive rule refinement to ensure sustained improvement.
| Type | Model | Res. | MSCOCO Val2017 | ODINW-13 | |||||
| Pistols | Pothole | Thermal | |||||||
| Specialists | Faster RCNN-FPN [37] | 1022 | 58.6 | 40.9 | 37.9 | - | - | - | - |
| DAB-DETR [32] | 1333 | 60.3 | 39.8 | 38.0 | - | - | - | - | |
| DETR [6] | 1333 | 62.4 | 44.2 | 42.0 | - | - | - | - | |
| Pix2Seq [9] | 1333 | 61.0 | 45.6 | 43.0 | - | - | - | - | |
| GroundingDINO [33] | 1333 | - | - | 46.7 | - | - | - | 55.0 | |
| Generalist | Griffon-13B [51] | 448 | 40.6 | 25.1 | 24.8 | - | - | - | - |
| Griffon v2 [52] | 1022 | 54.3 | 41.2 | 38.5 | - | - | - | - | |
| Lumen [20] | 448 | 53.2 | 35.8 | 35.3 | - | - | - | - | |
| InternVL2.5-8B [11] | Dynamic | 11.9 | 19.4 | 12.1 | 29.2 | 1.1 | 3.8 | 20.2 | |
| InternVL2.5-78B [11] | Dynamic | - | - | - | - | - | - | 31.7 | |
| Qwen2.5-VL-72B [3] | Dynamic | - | - | - | - | - | - | 43.1 | |
| Gemini 1.5 Pro [41] | - | - | - | - | - | - | - | 36.7 | |
| Griffon-G-7B [50] | 1022 | 57.4 | 42.8 | 40.2 | 59.3 | 11.7 | 49.2 | 43.8 | |
| + SFT | 57.4 | 43.3 | 40.5 | 52.8 | 10.9 | 49.5 | 45.3 | ||
| + Vision-R1 | 59.3 | 45.0 | 42.0 (+1.8) | 56.3 | 17.2 | 55.9 | 46.3 (+2.5) | ||
| Qwen2.5-VL-7B [3] | Dynamic | 27.3 | 18.0 | 17.7 | 48.5 | 7.4 | 38.0 | 37.0† | |
| + SFT | 36.1 | 24.3 | 23.6 | 49.6 | 9.1 | 46.9 | 35.0 | ||
| + Vision-R1 | 40.0 | 27.8 | 26.6 (+8.9) | 55.2 | 13.3 | 50.6 | 46.0 (+9.0) | ||
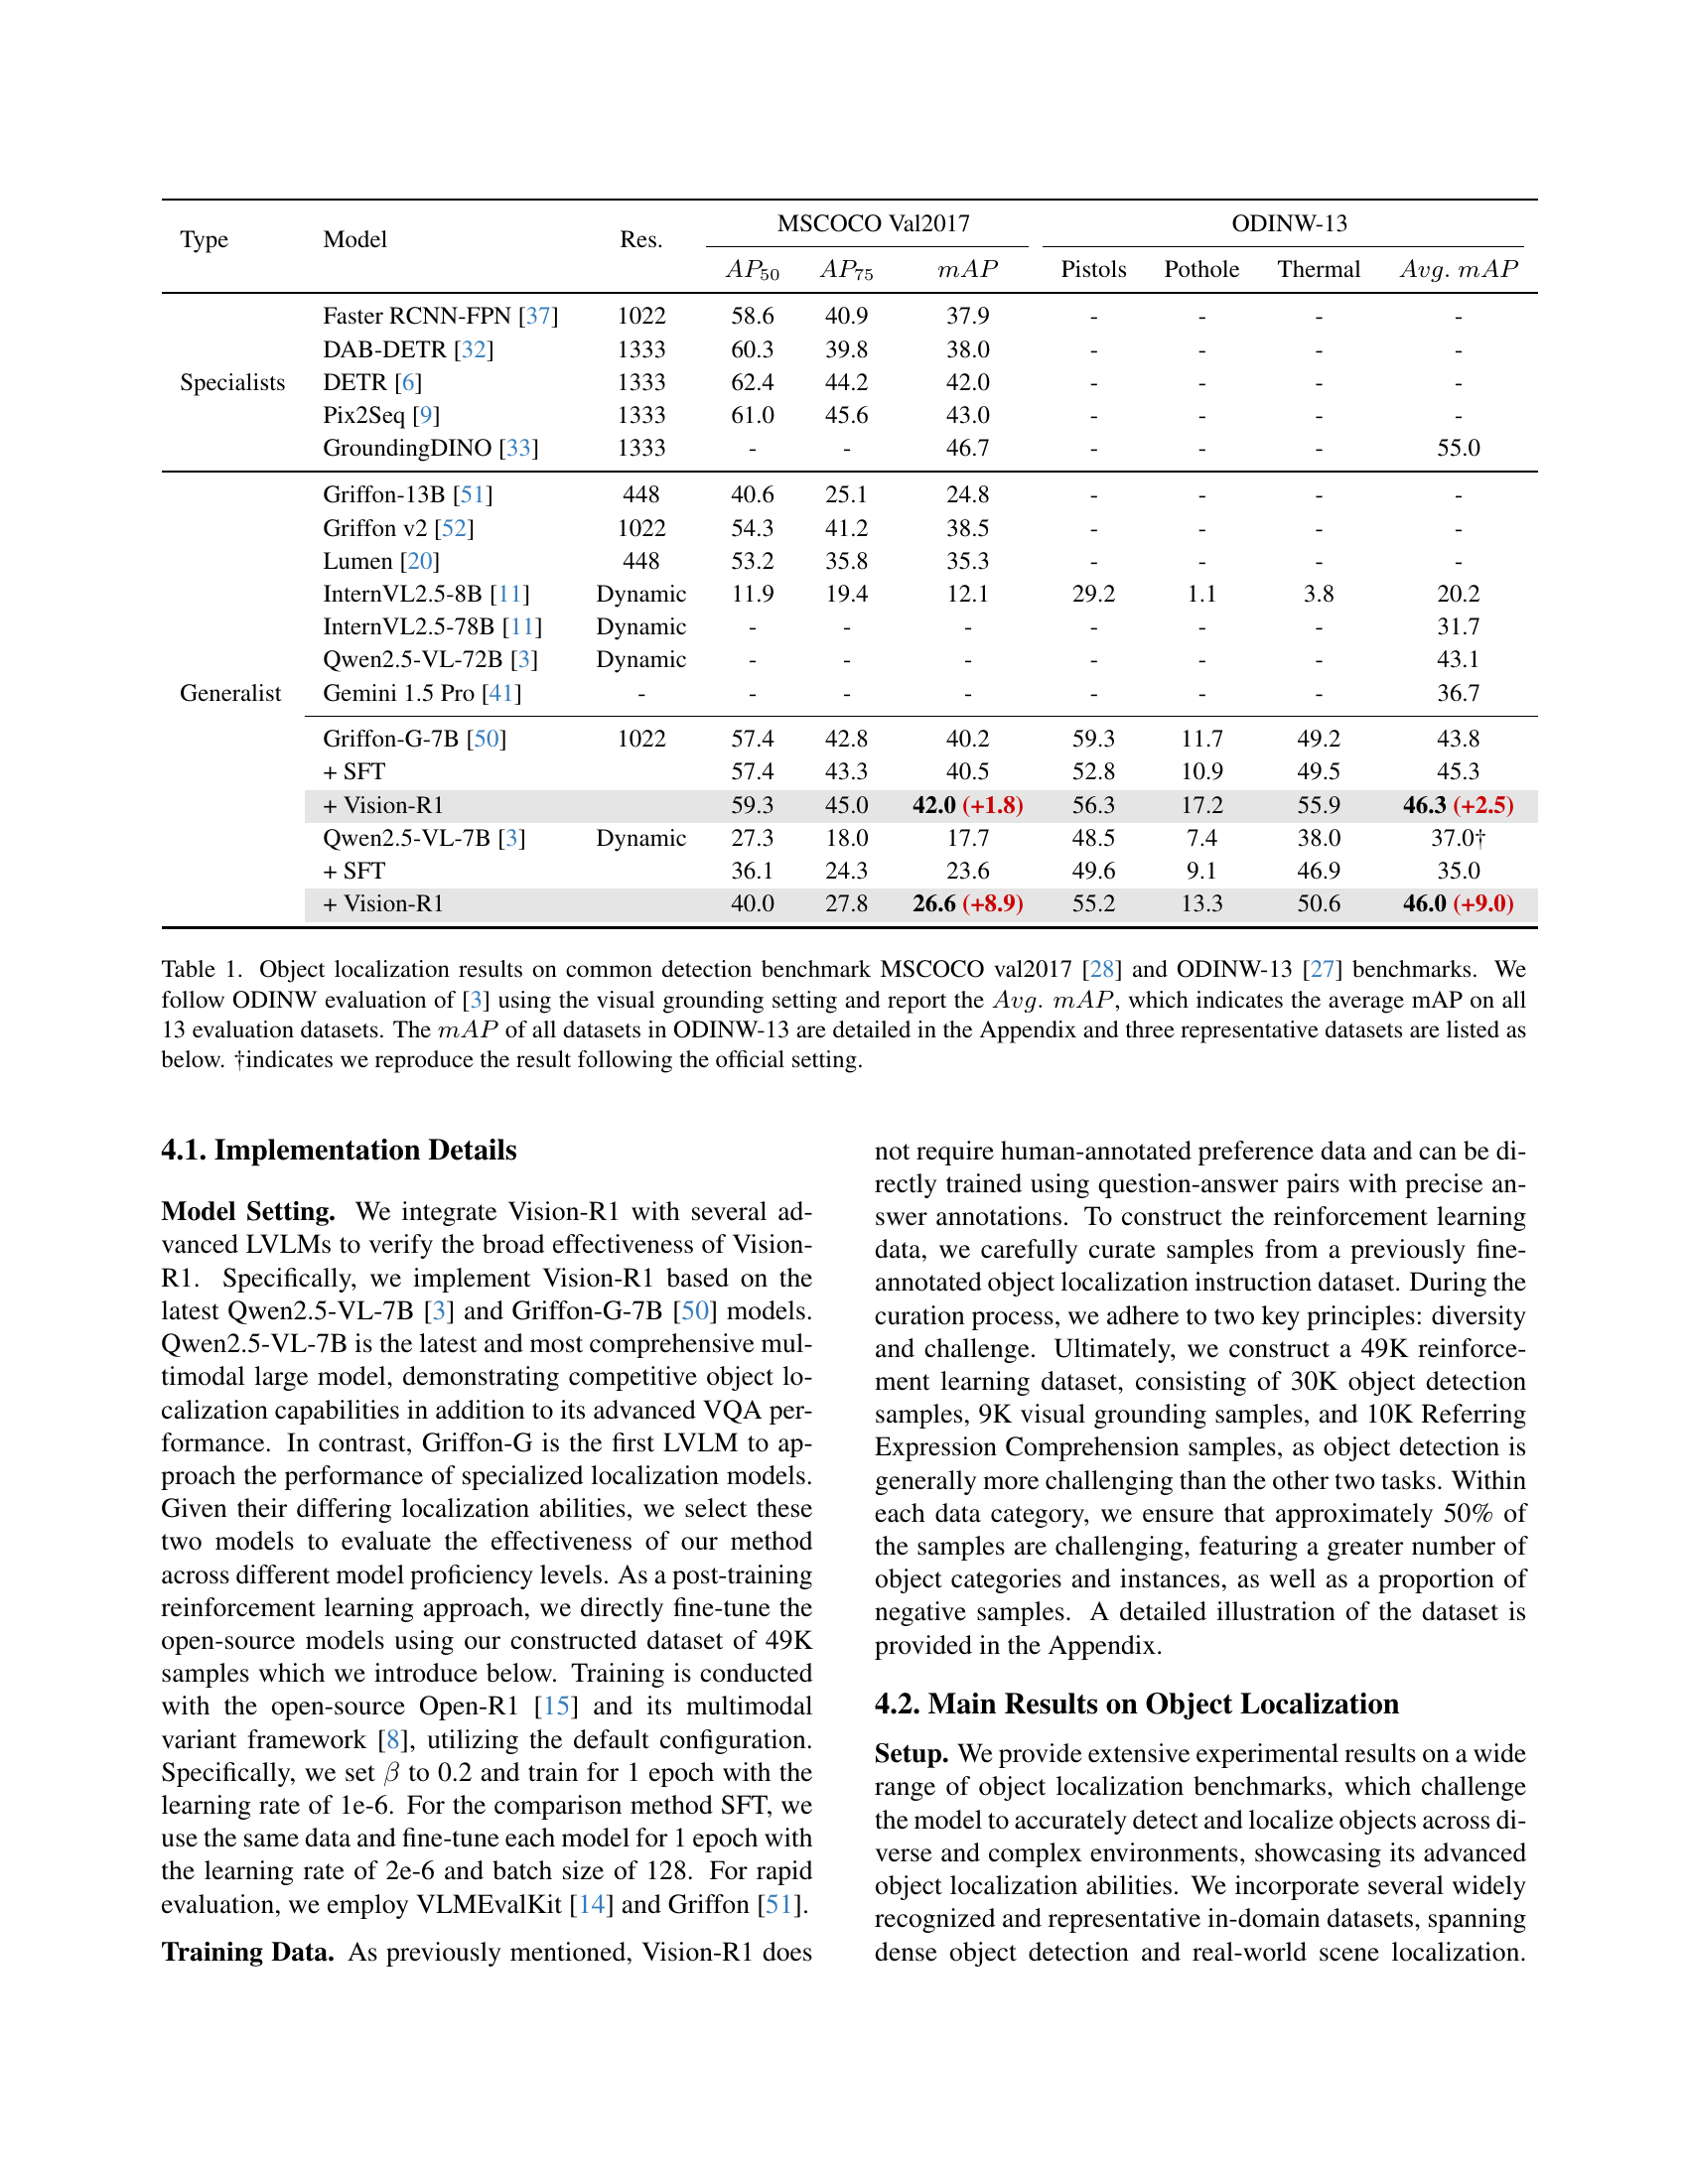
🔼 Table 1 presents a comparison of object localization performance across various models on the MS COCO val2017 and ODINW-13 benchmark datasets. The results are evaluated using the visual grounding setting from Qwen2.5-VL [3], reporting the average mean Average Precision (mAP) across all 13 ODINW-13 datasets. The table includes results for both specialists (models designed specifically for object detection) and generalist (vision-language models) models. It shows the performance of models before fine-tuning (SFT), after supervised fine-tuning (SFT), and after fine-tuning using the proposed Vision-R1 method. Results for three representative datasets from ODINW-13 are shown, with detailed results for all 13 datasets available in the Appendix. The symbol † denotes results reproduced using the official experimental settings.
read the caption
Table 1: Object localization results on common detection benchmark MSCOCO val2017 [28] and ODINW-13 [27] benchmarks. We follow ODINW evaluation of [3] using the visual grounding setting and report the Avg.mAPformulae-sequence𝐴𝑣𝑔𝑚𝐴𝑃Avg.\;mAPitalic_A italic_v italic_g . italic_m italic_A italic_P, which indicates the average mAP on all 13 evaluation datasets. The mAP𝑚𝐴𝑃mAPitalic_m italic_A italic_P of all datasets in ODINW-13 are detailed in the Appendix and three representative datasets are listed as below. †indicates we reproduce the result following the official setting.
In-depth insights#
Vision-Guided RL#
Vision-guided Reinforcement Learning (RL) leverages visual information to train agents, enabling them to interact with environments in a more nuanced way. It has the potential to enhance RL in scenarios where visual perception is crucial for decision-making. By incorporating visual cues into the reward function or state representation, agents can learn to perform tasks more effectively and adapt to dynamic environments. Challenges include the computational cost of processing visual data and the need for robust visual representations that are invariant to changes in lighting, viewpoint, and occlusion. However, recent advancements in computer vision and deep learning have made vision-guided RL more feasible and accessible. Vision-guided RL can be used to improve existing RL tasks, which can include self-driving or robotic manipulation.
Human-Free Tuning#
Human-free tuning represents a compelling direction in AI, particularly for large vision-language models (LVLMs), addressing the high costs and challenges associated with human annotation. The conventional approach relies on labor-intensive processes to create preference datasets and train reward models, which can be both expensive and subjective. Moving towards automated methods could offer several advantages. Firstly, it drastically reduces the cost and time involved in data collection. Secondly, it eliminates the potential biases introduced by human annotators, leading to more objective and consistent model training. Thirdly, automated methods can scale more efficiently, allowing for continuous model improvement without the limitations imposed by human resources. However, challenges remain in designing robust, vision-guided reinforcement learning algorithms that accurately mimic human preferences without explicit human feedback, mitigate reward hacking, and ensure sustained improvement. Ultimately, human-free tuning holds the promise of democratizing AI development, making it more accessible and scalable while maintaining or even improving model performance and reliability.
Criterion Rewards#
While the paper doesn’t explicitly use the heading ‘Criterion Rewards,’ the core of Vision-R1 revolves around defining and applying such criteria. The success hinges on crafting robust, task-relevant criteria that guide the reinforcement learning process. Simply relying on generic metrics may lead to reward hacking or fail to capture the nuances of vision-language understanding. Further, Vision-R1’s innovation lies in its vision-guided approach to criterion design, leveraging visual feedback to provide objective standards for reward calculation, rather than relying solely on subjective human preferences. This is a key departure from traditional RLHF methods. The use of progressive rule refinement is another important element, where the reward criteria themselves are dynamically adjusted during training. This strategy enables continuous model improvement and mitigates reward hacking. The paper carefully defines multi-dimensional reward signals, such as Precision Rewards, Recall Rewards and Dual Format Rewards to evaluate the model responses to object localization tasks. These reward functions helps to model the model to develop a deeper understanding of the task characteristics and generate accurate responses.
Progressive Rules#
Progressive rule refinement is a compelling strategy for continuous model improvement, drawing inspiration from curriculum learning and human learning processes. It involves dynamically adjusting reward calculation criteria during training. Differentiation increases the contrast between predictions and rewards by penalizing low recall/IoU and rewarding high recall/IoU. Staged progression utilizes easier standards initially, gradually increasing difficulty to prevent reward hacking. Such staged training helps maintain optimization in the long term.
Enhanced LVLMs#
While the term “Enhanced LVLMs” isn’t explicitly present, the paper explores advancements in Large Vision-Language Models (LVLMs). The authors highlight the typical two-stage training paradigm (pre-training and supervised fine-tuning) and propose a novel approach, Vision-R1, to improve LVLM capabilities. A core issue addressed is the high cost and challenge of creating high-quality, human-annotated preference data for training reward models. Vision-R1 circumvents this by using vision-guided reinforcement learning, leveraging curated instruction data and a criterion-driven reward function to evaluate model completions based on visual task logic. The paper also introduces a progressive rule refinement strategy that dynamically adjusts reward criteria during training to mitigate reward hacking and ensure continuous model improvement. The goal is to bridge the gap between LVLM performance and human expectations by refining responses based on visual feedback, ultimately aiming for more robust and generalized object localization and reasoning.
More visual insights#
More on figures

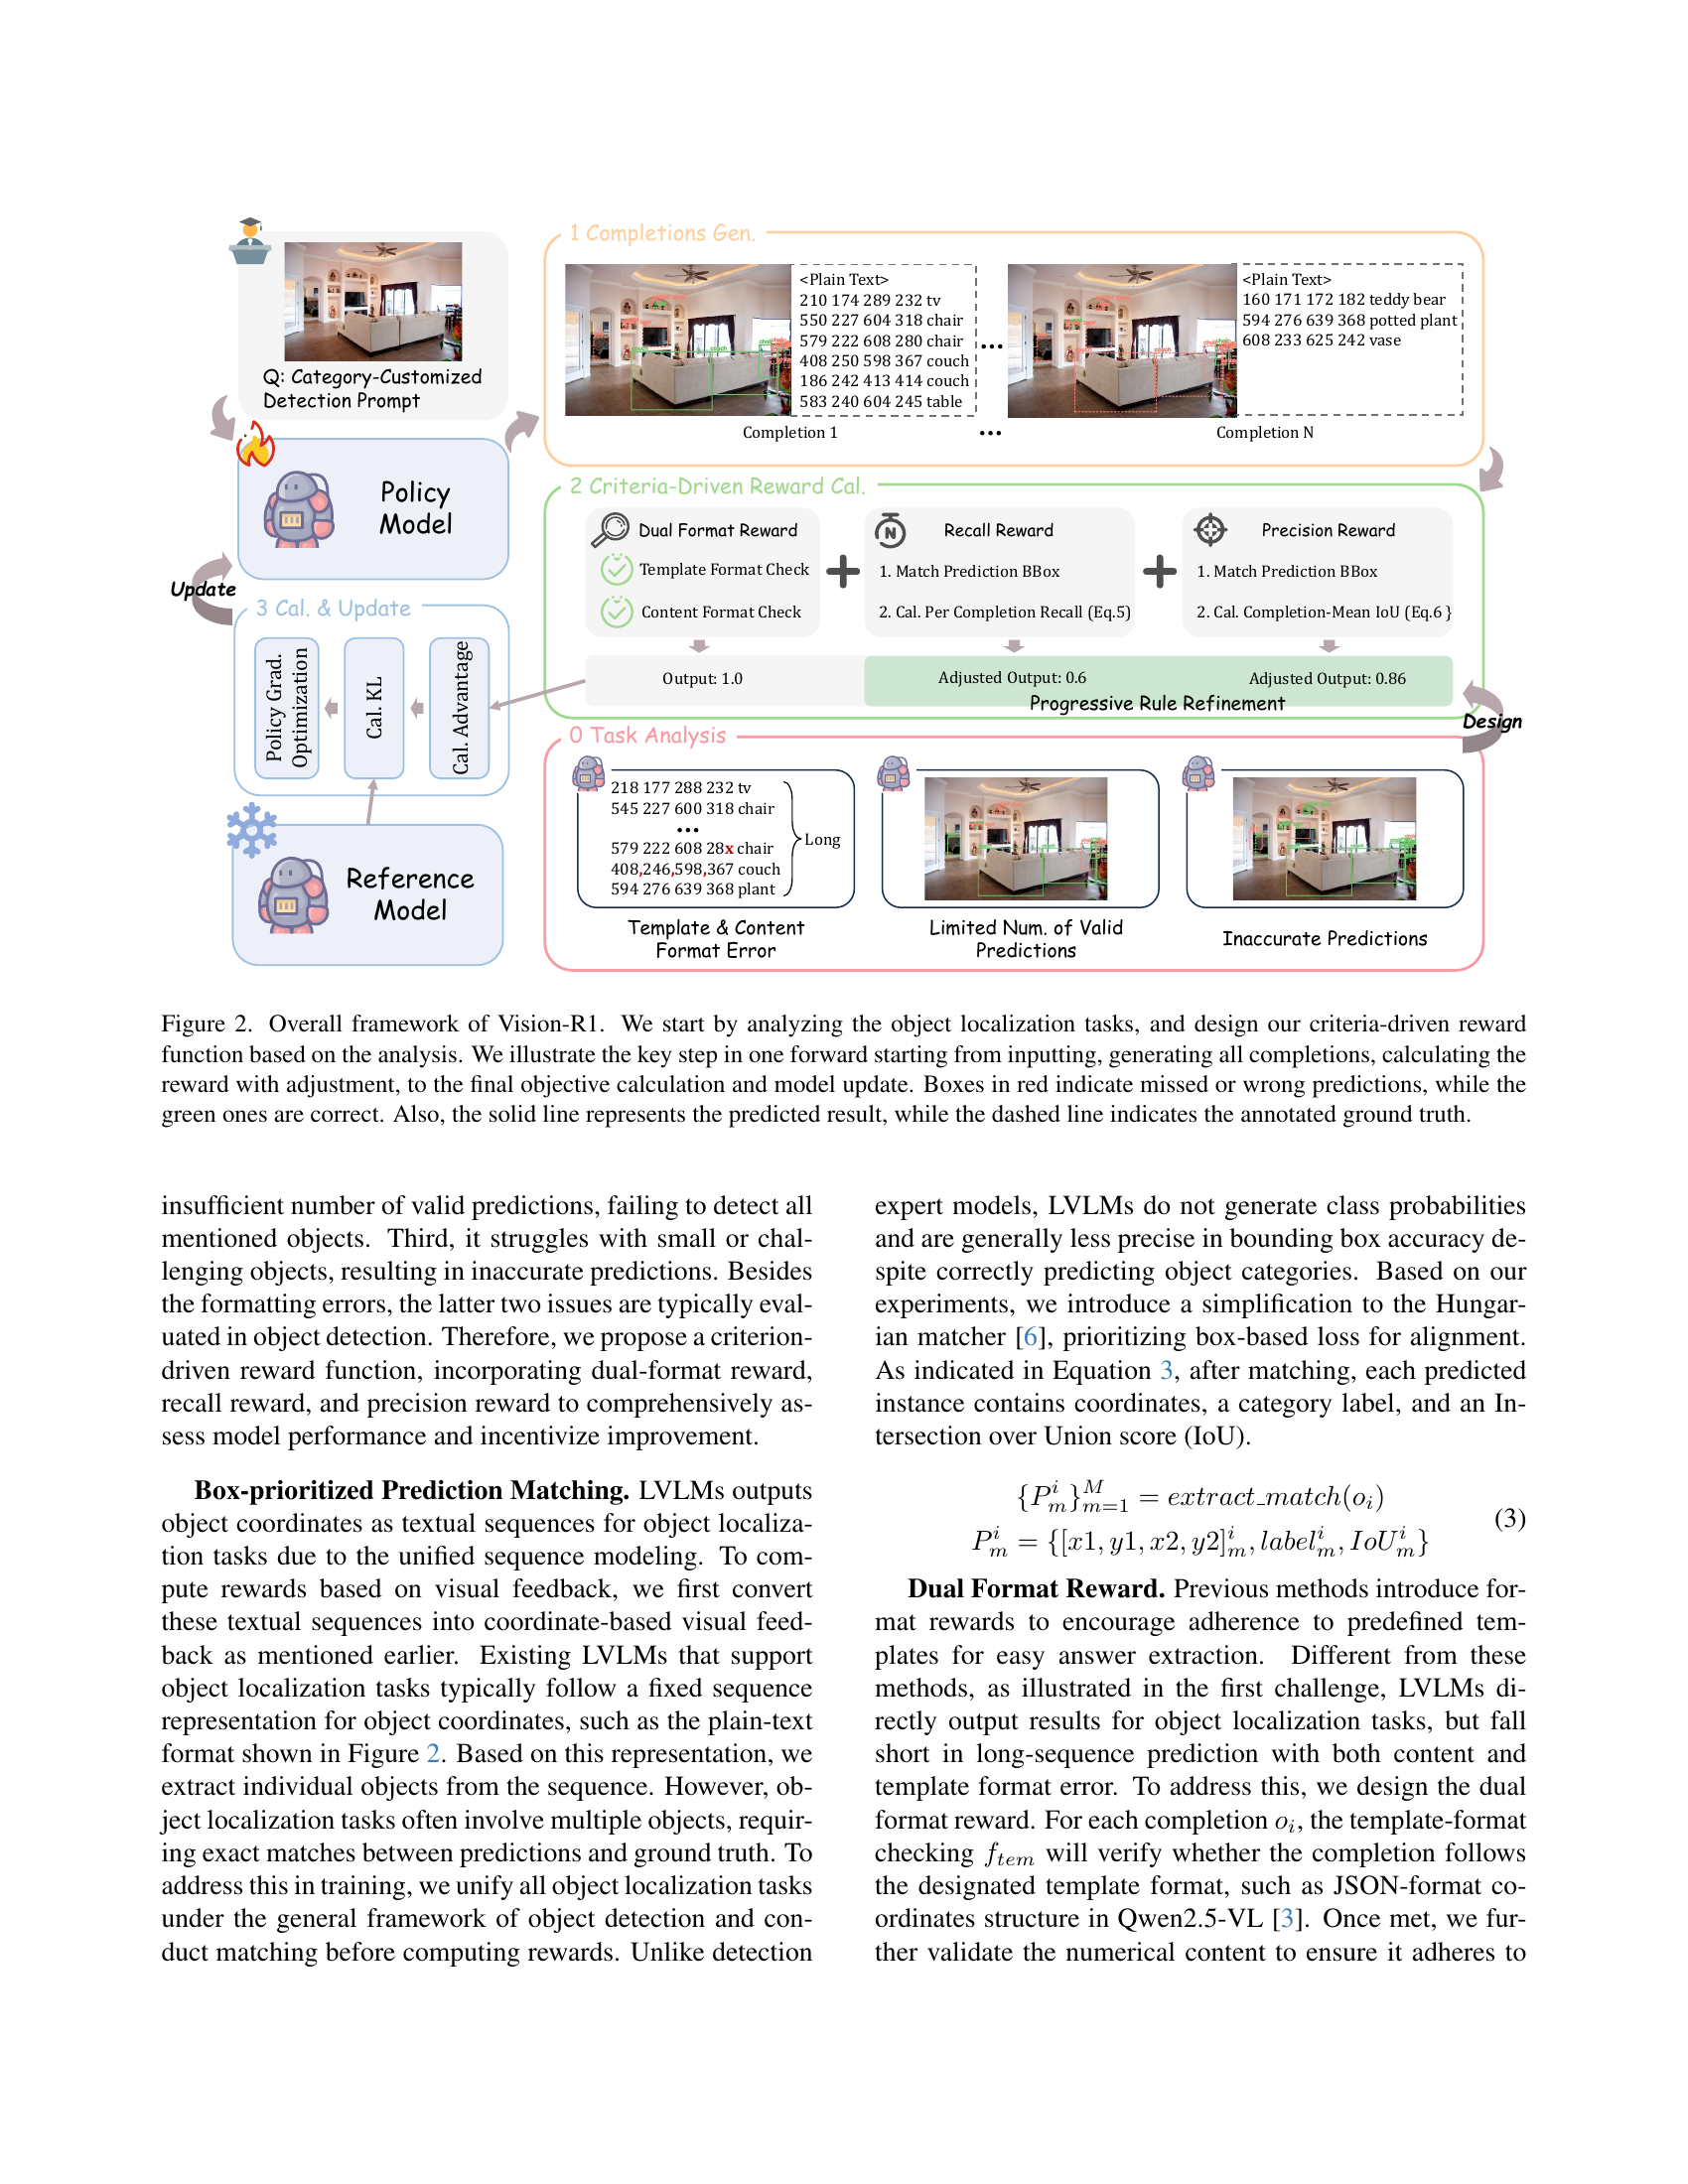
🔼 This figure illustrates the Vision-R1 framework, a reinforcement learning algorithm for Large Vision-Language Models (LVLMs). It details the process of generating multiple completions for an object localization task, evaluating those completions using a criteria-driven reward function, and updating the model based on the results. The reward function incorporates multiple factors, including a check for correct formatting and multi-dimensional feedback on the quality and precision of the model’s predictions. Color-coded bounding boxes highlight the correctness of predictions; green indicates a correct prediction, while red signifies an incorrect or missed prediction. Solid lines denote predicted results, whereas dashed lines represent the ground truth annotations.
read the caption
Figure 2: Overall framework of Vision-R1. We start by analyzing the object localization tasks, and design our criteria-driven reward function based on the analysis. We illustrate the key step in one forward starting from inputting, generating all completions, calculating the reward with adjustment, to the final objective calculation and model update. Boxes in red indicate missed or wrong predictions, while the green ones are correct. Also, the solid line represents the predicted result, while the dashed line indicates the annotated ground truth.

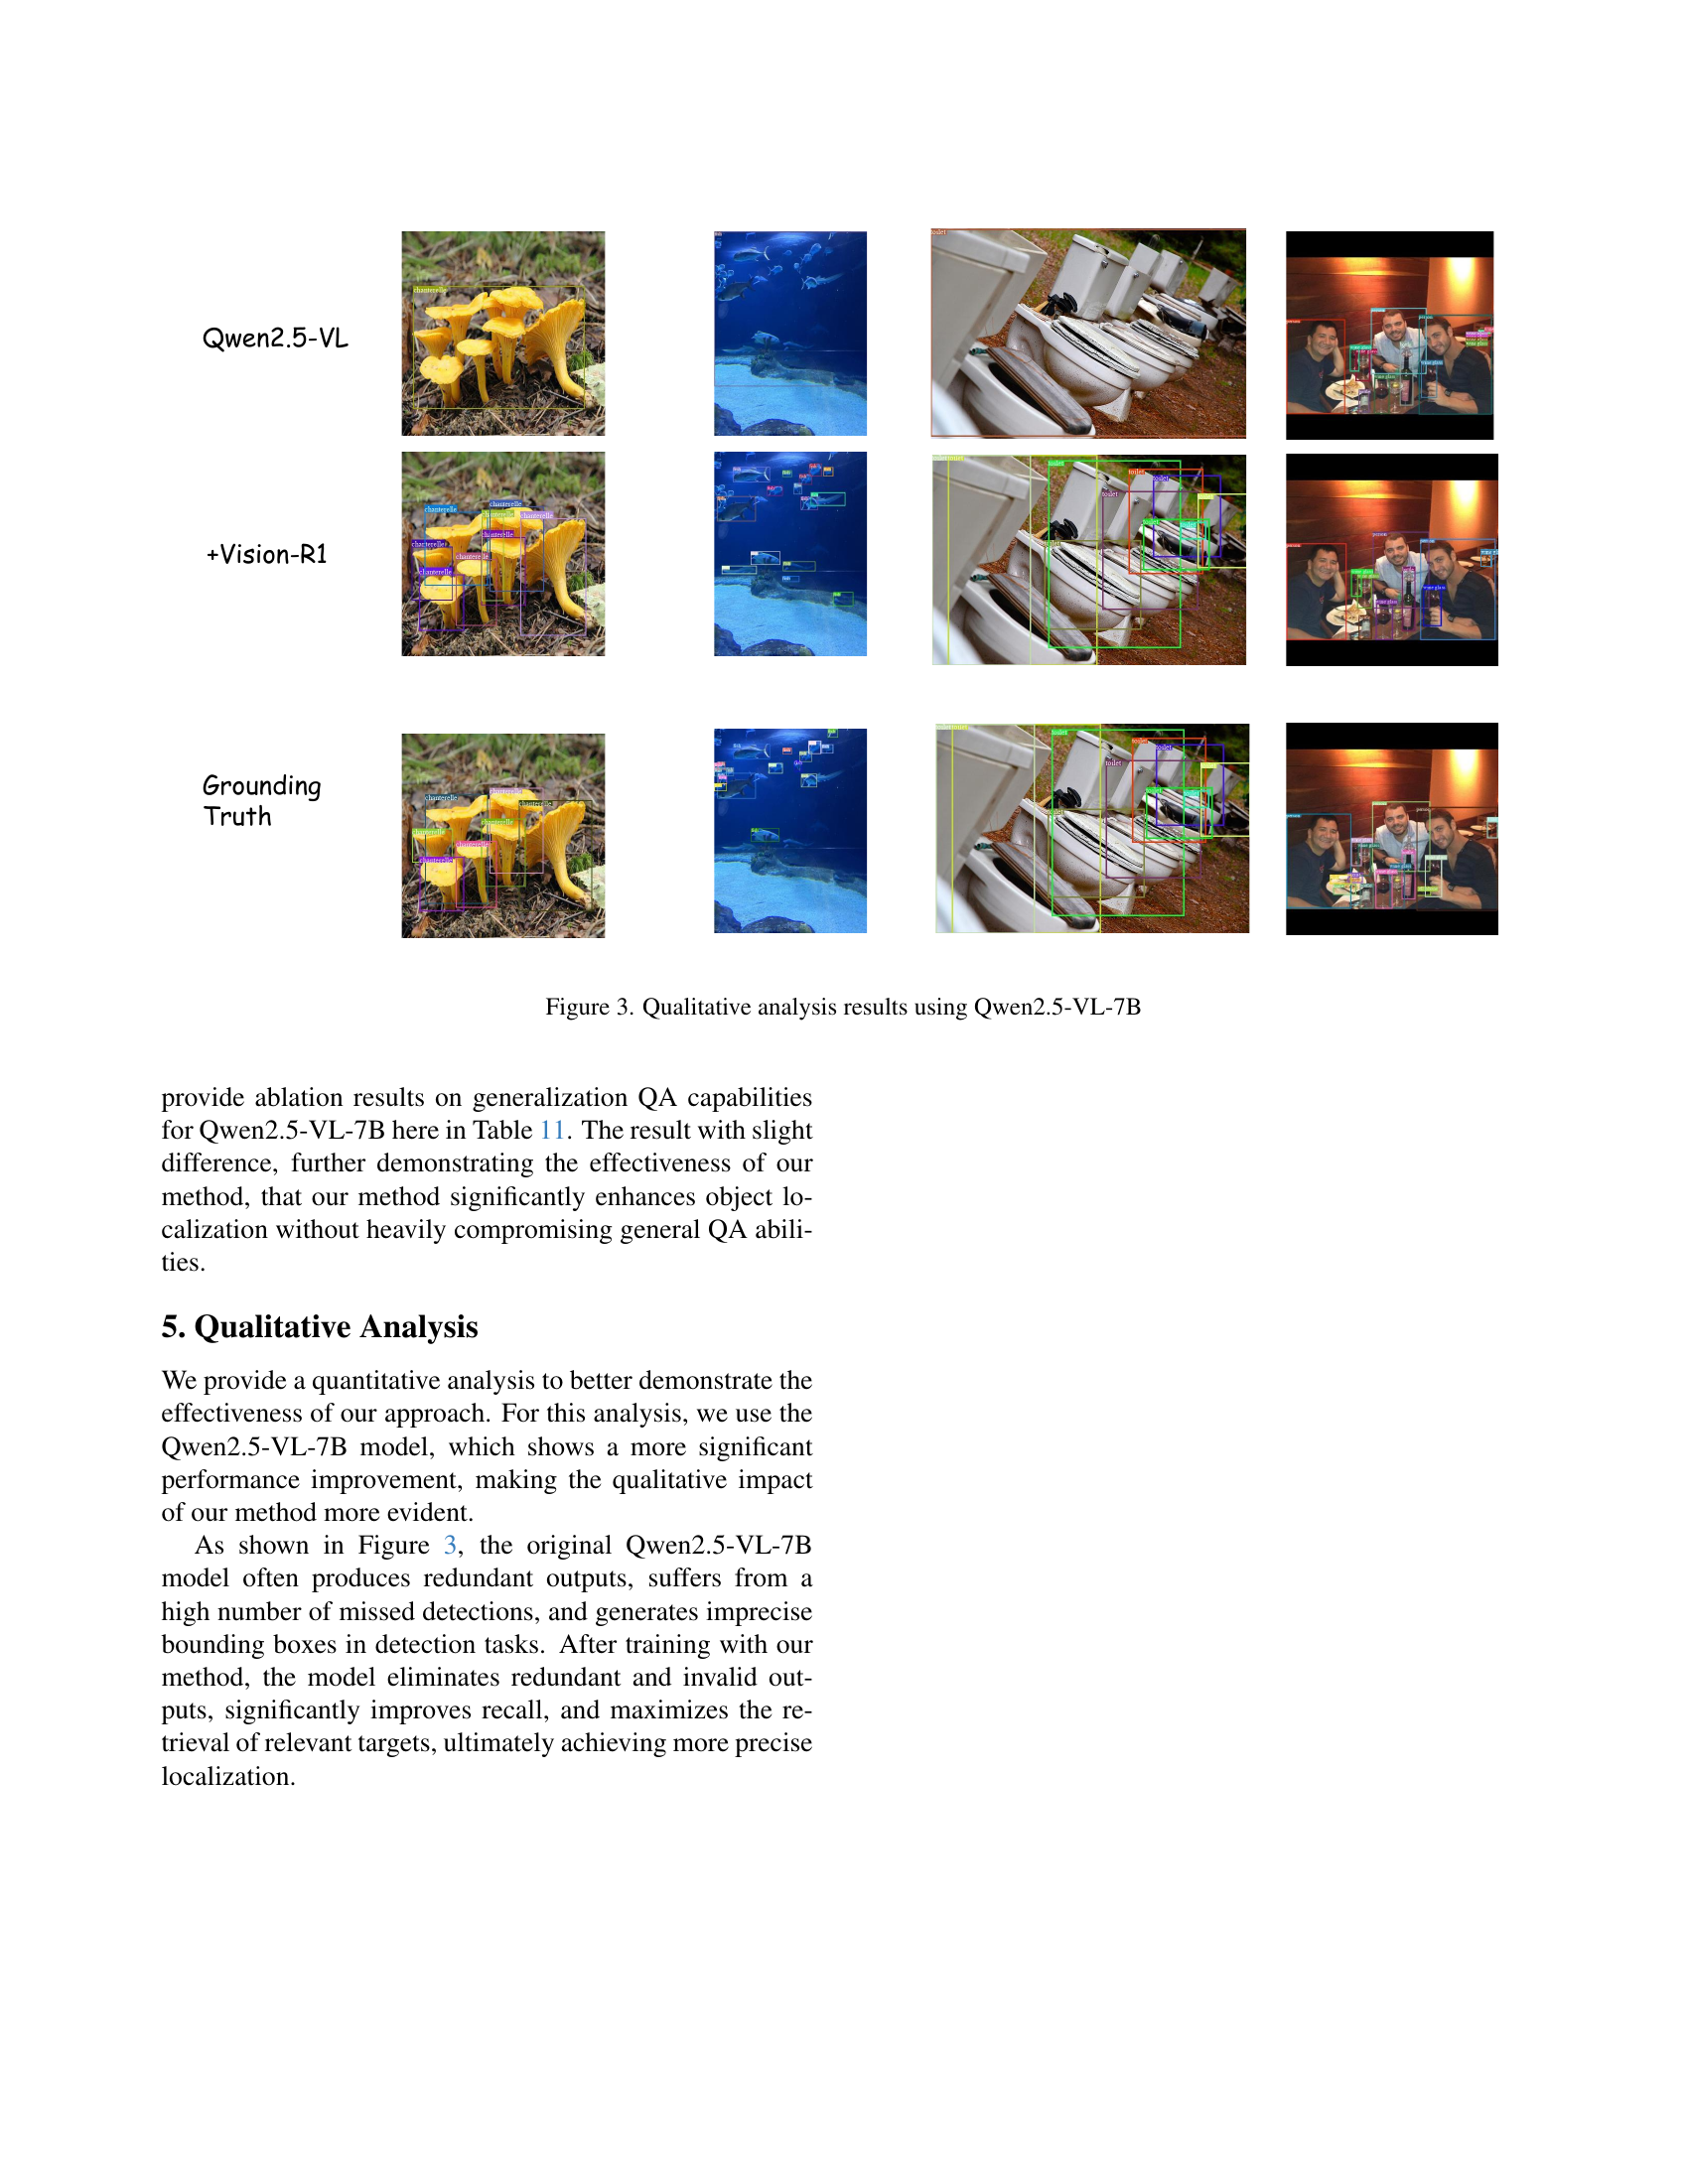
🔼 This figure presents a qualitative comparison of object localization results between the original Qwen2.5-VL-7B model and the model fine-tuned with Vision-R1. It visually demonstrates the improvements achieved by Vision-R1, highlighting how it reduces redundant and incorrect predictions, improves the recall by correctly identifying more objects, and leads to more accurate bounding boxes around the detected objects. The figure showcases several example images with their corresponding predictions from both models, allowing for a direct visual comparison of the quality and accuracy of object localization.
read the caption
Figure 3: Qualitative analysis results using Qwen2.5-VL-7B
More on tables
| Method | boggleBoards | MountainDewCommercial | ThermalCheetah | Vector | Avg. |
| GroundingDINO [33] | 0.8 | 18.2 | 12.9 | - | - |
| InternVL2.5-8B [11] | 0.1 | 0.0 | 0.7 | 6.7 | 1.9 |
| Griffon-G-7B [50] | 3.4 | 28.1 | 8.9 | 8.2 | 12.2 |
| + SFT | 2.3 | 13.7 | 9.4 | 24.0 | 12.4 |
| + Vision-R1 | 3.9 | 41.5 | 7.8 | 24.1 | 19.3 (+7.1) |
| Qwen2.5-VL-7B [3] | 4.5 | 3.8 | 7.8 | 51.3 | 16.9 |
| + SFT | 8.4 | 6.5 | 8.3 | 48.3 | 17.9 |
| + Vision-R1 | 8.2 | 13.7 | 9.9 | 54.8 | 21.7 (+4.8) |
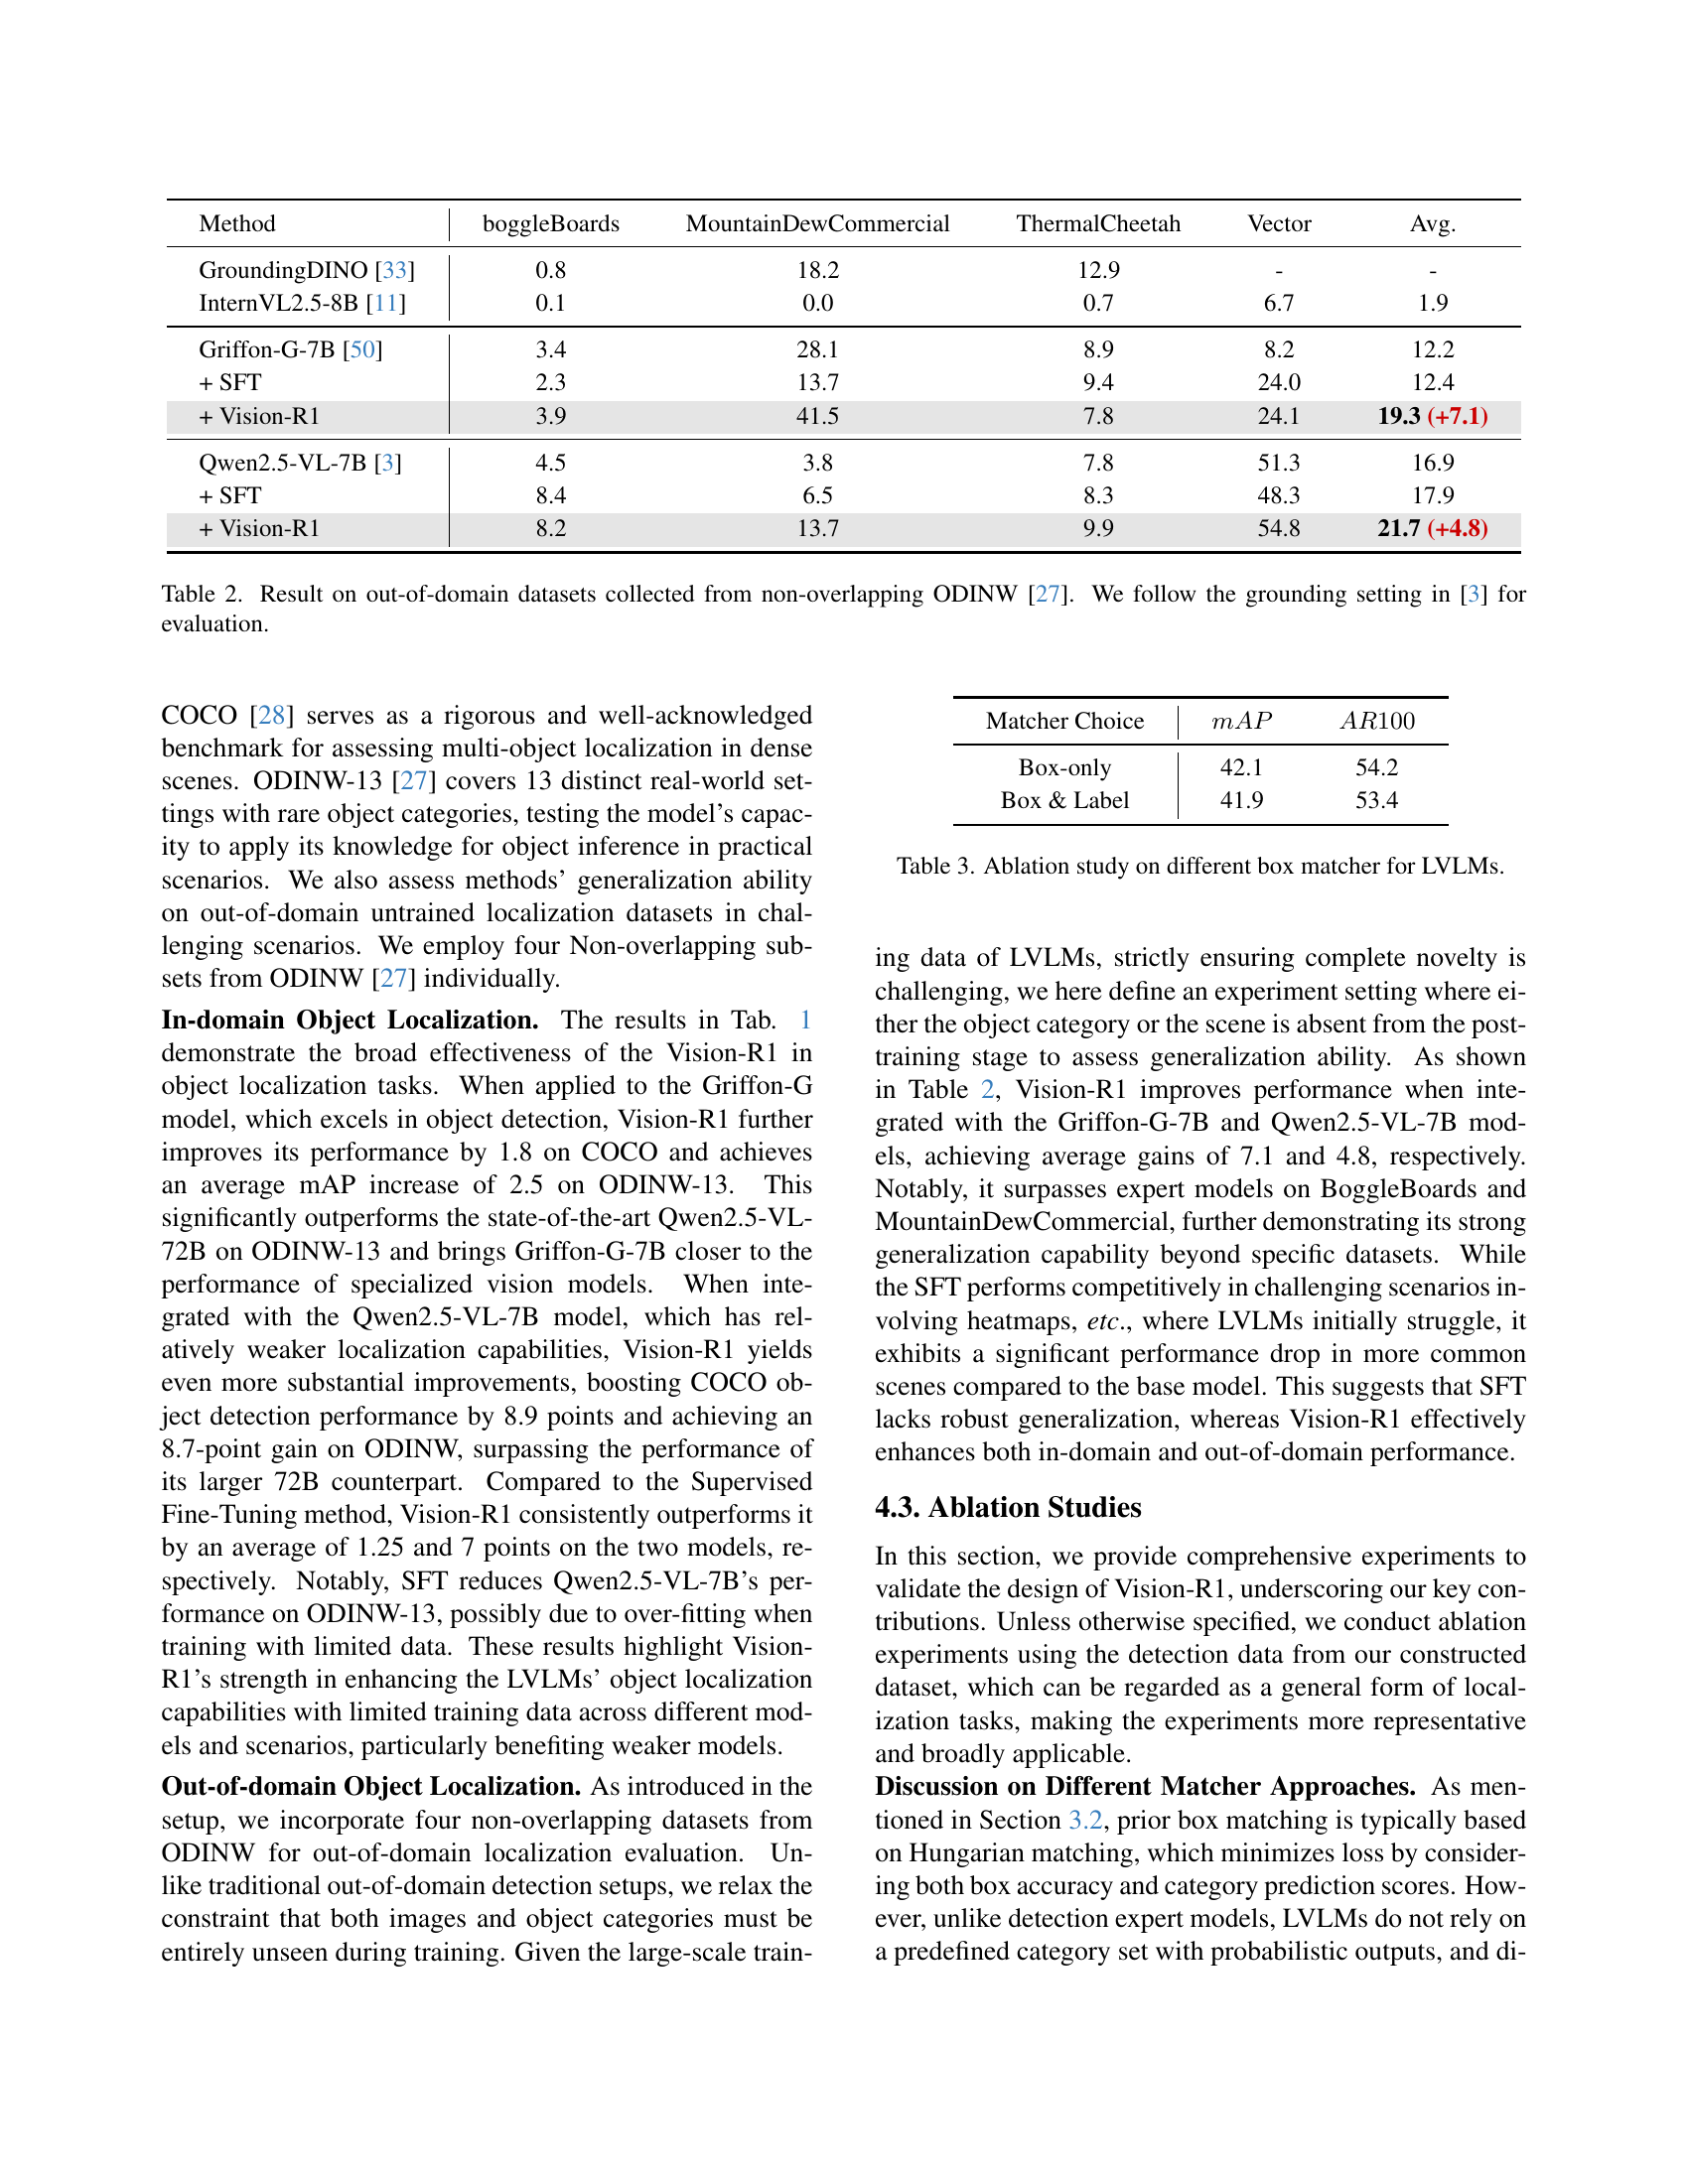
🔼 Table 2 presents the results of out-of-domain object localization experiments. The datasets used, ‘boggleBoards’, ‘MountainDewCommercial’, ‘ThermalCheetah’, and ‘Vector’, are all drawn from the ODINW benchmark [27], but are non-overlapping with the in-domain training data. The evaluation metric used is Average Precision (AP) which is computed by following the grounding setting defined in reference [3]. The table compares different models, including the baseline model and models fine-tuned using both supervised fine-tuning (SFT) and Vision-R1. This allows for a direct comparison of the effectiveness of Vision-R1 in improving the models’ ability to generalize to unseen data.
read the caption
Table 2: Result on out-of-domain datasets collected from non-overlapping ODINW [27]. We follow the grounding setting in [3] for evaluation.
| Matcher Choice | ||
| Box-only | 42.1 | 54.2 |
| Box & Label | 41.9 | 53.4 |
🔼 This table presents an ablation study comparing different box matching methods used in the Vision-R1 model for Large Vision-Language Models (LVLMs). It investigates the impact of the choice of box matching technique on the model’s overall performance in object localization tasks. The study likely contrasts different matching algorithms (e.g., Hungarian matching, box-only matching, or a combined box and label matching), showing their respective effects on metrics such as mean Average Precision (mAP) and Average Recall (AR). This helps determine which matching strategy optimizes the Vision-R1 model’s ability to accurately locate and classify objects within images.
read the caption
Table 3: Ablation study on different box matcher for LVLMs.
| precision | recall | ||||
| Baseline | 40.2 | 57.4 | 42.8 | 52.2 | |
| ✓ | 41.5 | 55.6 | 45.1 | 49.6 | |
| ✓ | ✓ | 42.1 | 58.7 | 45.3 | 54.2 |
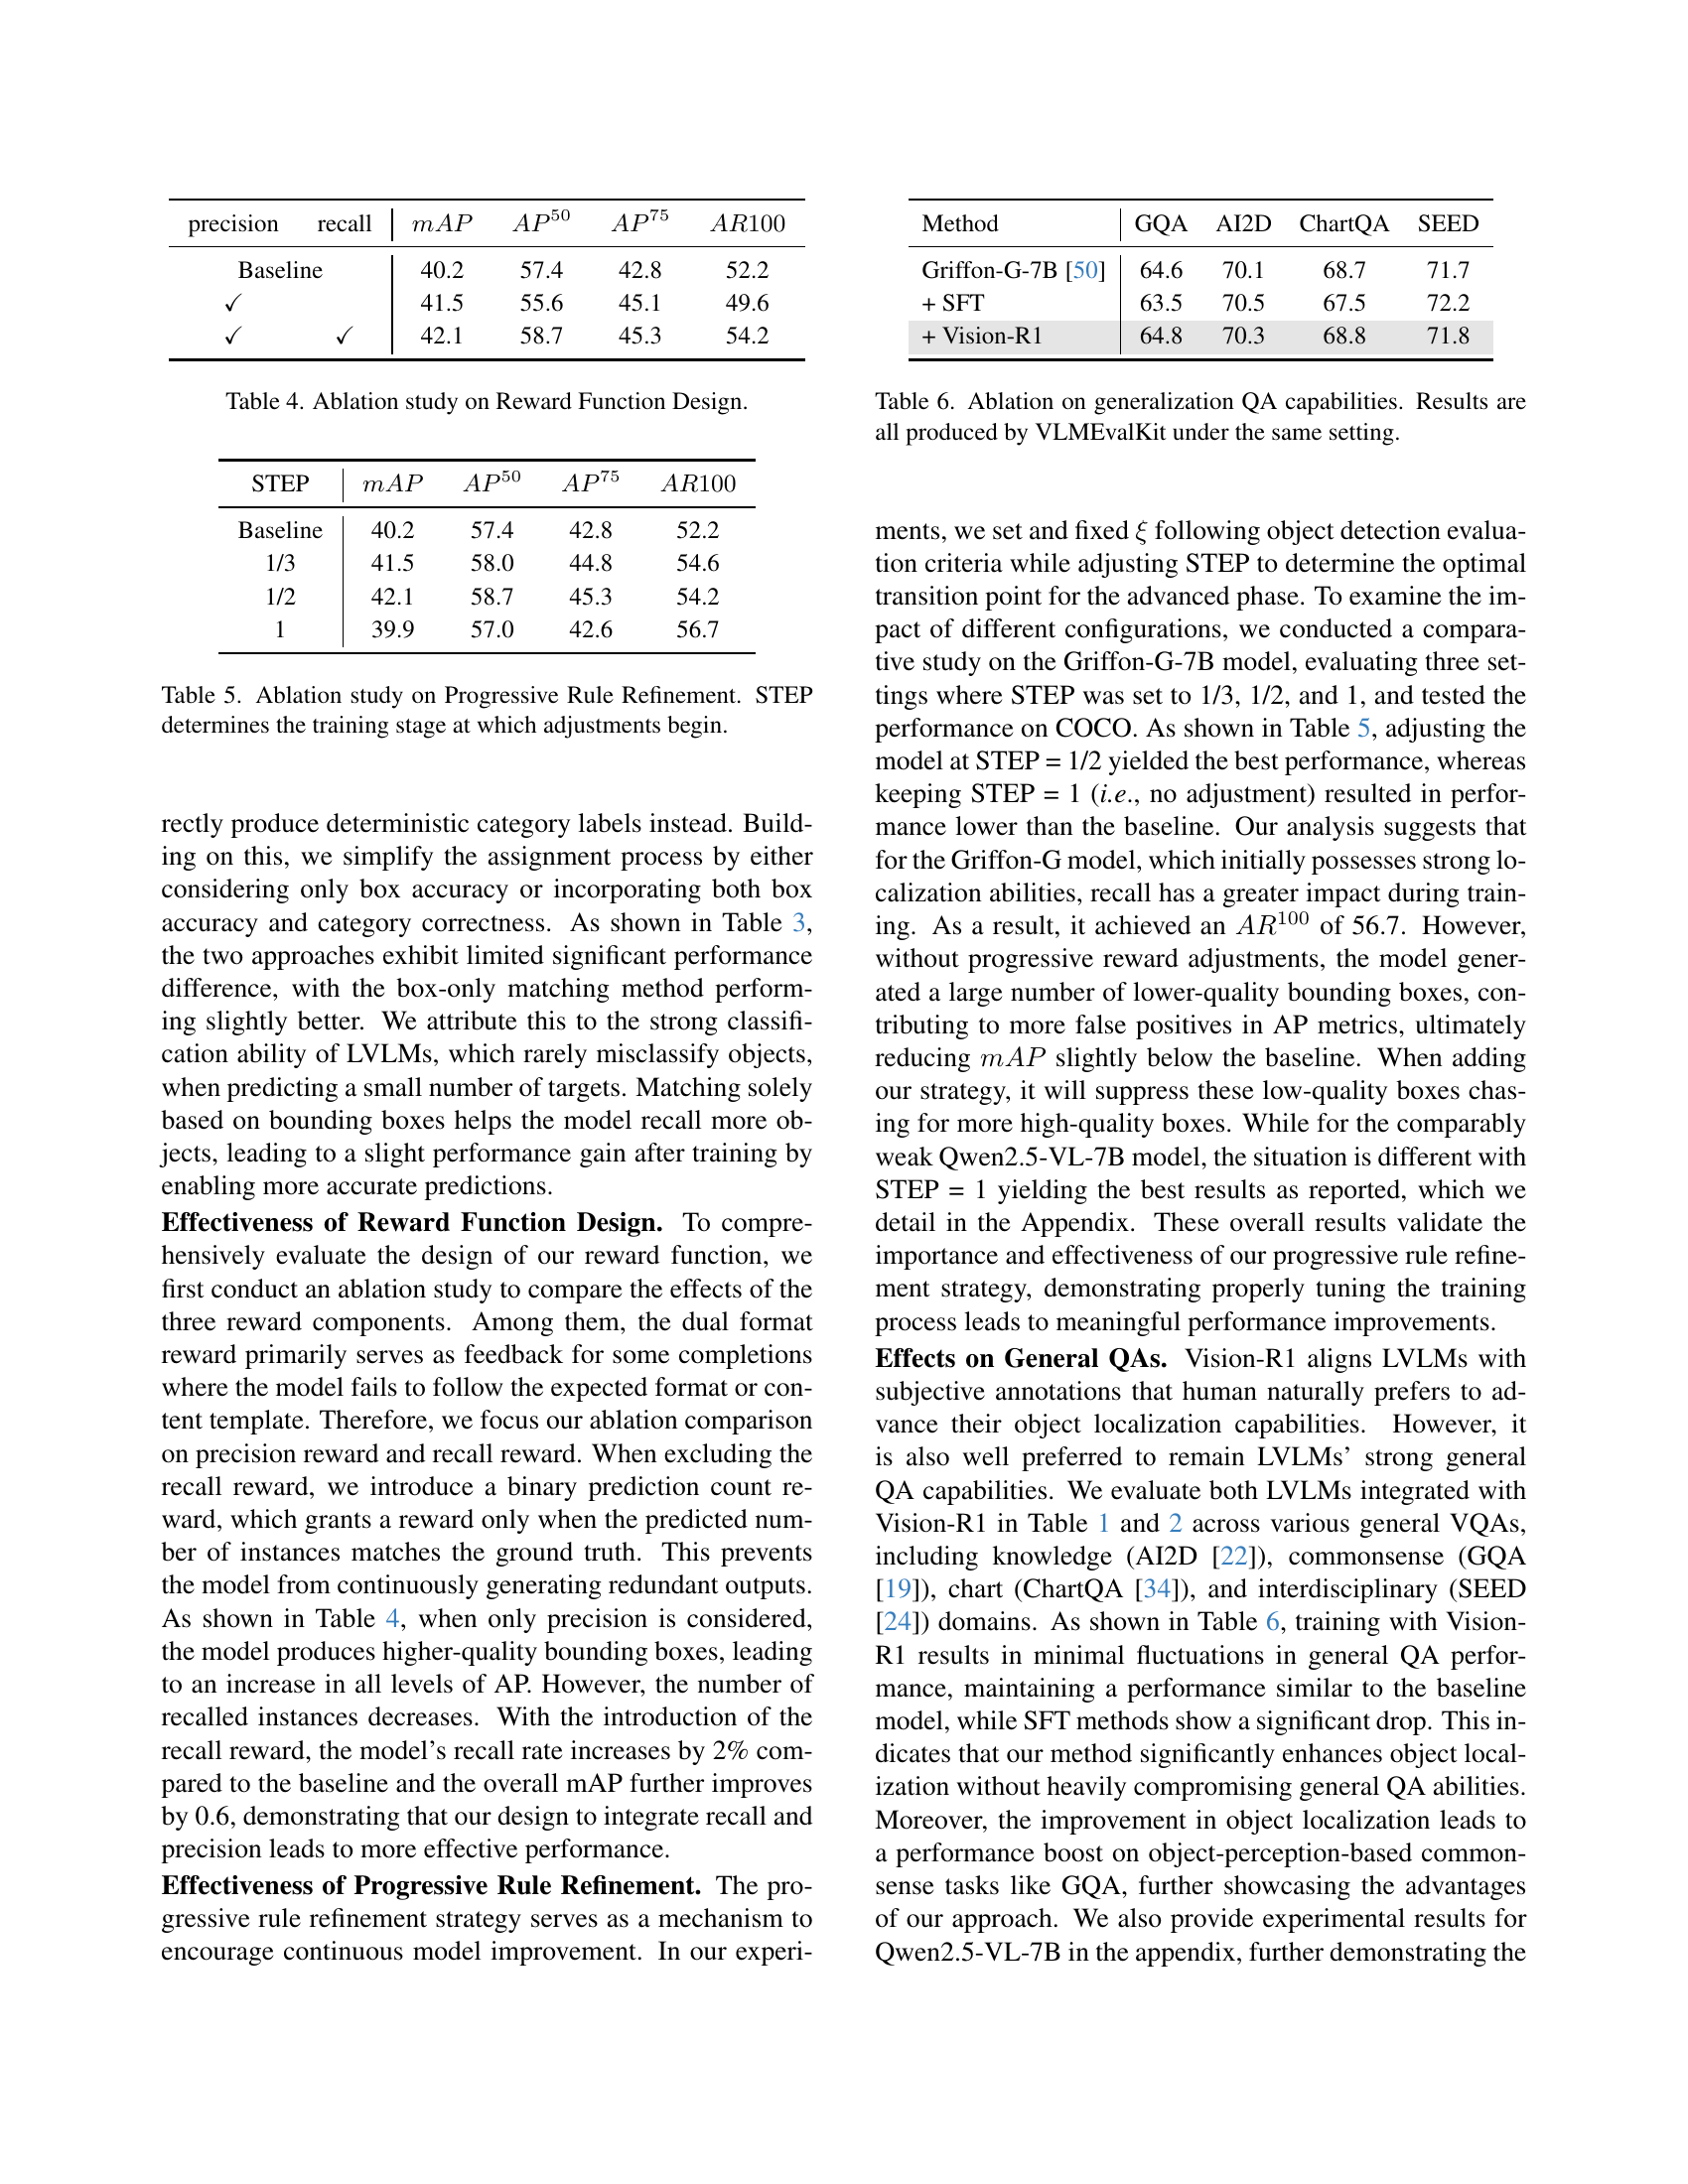
🔼 This table presents the results of an ablation study investigating the impact of different reward function components on the model’s performance. It shows how removing or modifying parts of the reward function (specifically, the recall and precision rewards) affects the overall performance metrics such as precision, recall, mean Average Precision (mAP), average precision at 50% IoU (AP50), average precision at 75% IoU (AP75), and average recall at 100 (AR100). The baseline model is compared against versions with altered reward functions to isolate the contribution of each component to the overall performance.
read the caption
Table 4: Ablation study on Reward Function Design.
| STEP | ||||
| Baseline | 40.2 | 57.4 | 42.8 | 52.2 |
| 1/3 | 41.5 | 58.0 | 44.8 | 54.6 |
| 1/2 | 42.1 | 58.7 | 45.3 | 54.2 |
| 1 | 39.9 | 57.0 | 42.6 | 56.7 |
🔼 This table presents the results of an ablation study on the Progressive Rule Refinement strategy used in the Vision-R1 model. The study investigates how varying the training stage at which reward calculation criteria adjustments begin impacts the model’s performance. Different starting points for these adjustments (STEP) are tested, showing how the timing of the refinement affects the model’s ability to achieve high precision and recall in object localization tasks. The impact on various performance metrics (MAP, AP50, AP75, AR100) is shown for each setting.
read the caption
Table 5: Ablation study on Progressive Rule Refinement. STEP determines the training stage at which adjustments begin.
| Method | GQA | AI2D | ChartQA | SEED |
| Griffon-G-7B [50] | 64.6 | 70.1 | 68.7 | 71.7 |
| + SFT | 63.5 | 70.5 | 67.5 | 72.2 |
| + Vision-R1 | 64.8 | 70.3 | 68.8 | 71.8 |
🔼 This table presents the results of an ablation study assessing the impact of Vision-R1 on the generalization capabilities of large vision-language models (LVLMs) in question answering (QA) tasks. It compares the performance of Griffon-G-7B and Qwen2.5-VL-7B models before and after fine-tuning with Vision-R1 and standard supervised fine-tuning (SFT). The evaluation uses the VLMEvalKit toolkit across four diverse QA benchmarks: GQA (general question answering), AI2D (diagram understanding), ChartQA (chart question answering), and SEED (interdisciplinary QA). This allows for assessment of the effect of Vision-R1 on various aspects of language understanding and reasoning in the context of image understanding. The metrics used are likely accuracy-based for each QA subset.
read the caption
Table 6: Ablation on generalization QA capabilities. Results are all produced by VLMEvalKit under the same setting.
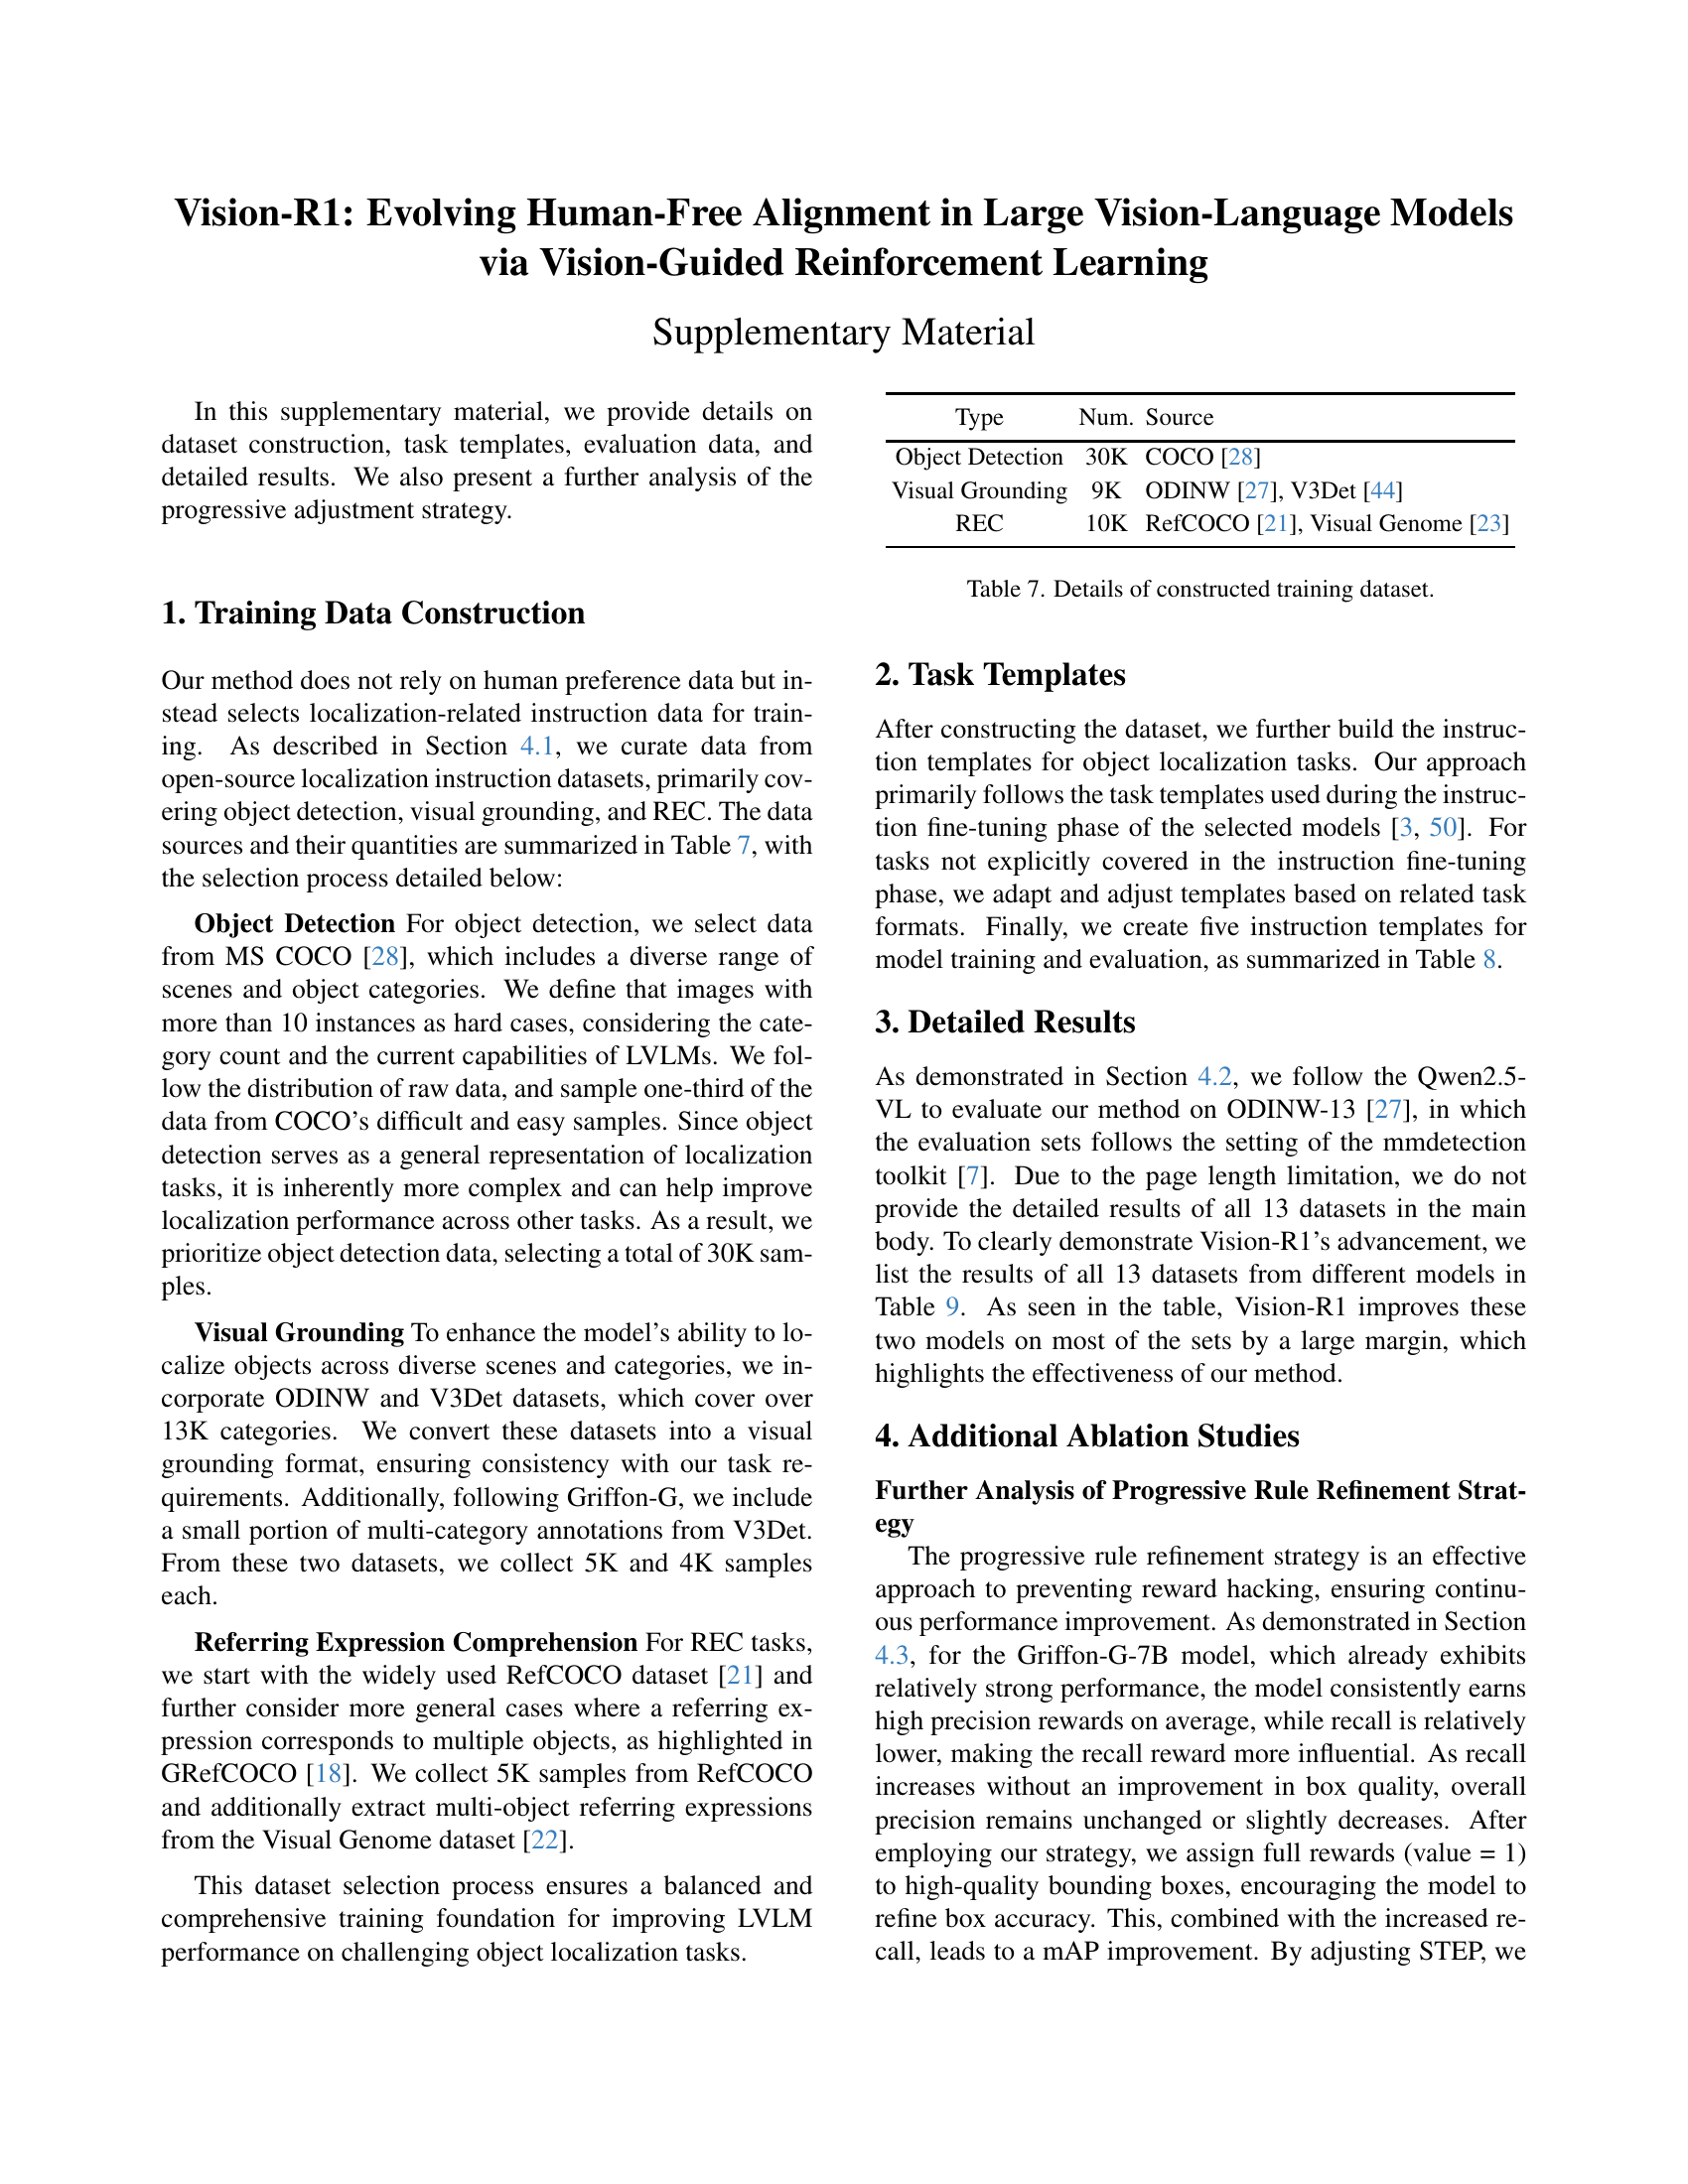
| Type | Num. | Source |
| Object Detection | 30K | COCO [28] |
| Visual Grounding | 9K | ODINW [27], V3Det [44] |
| REC | 10K | RefCOCO [21], Visual Genome [23] |
🔼 This table details the composition of the training dataset used for the Vision-R1 model. It breaks down the number of samples used for each task type: Object Detection (primarily from MS COCO), Visual Grounding (from ODINW and V3Det), and Referring Expression Comprehension (from RefCOCO and Visual Genome). The dataset is designed to be diverse and challenging, containing various scenarios and object categories to improve the model’s generalization capabilities.
read the caption
Table 7: Details of constructed training dataset.
| Model | Task | Template | ||
| Griffon-G | Object Detection |
| ||
| Visual Grounding |
| |||
| REC |
| |||
| Qwen2.5-VL | Object Detection |
| ||
|
|
🔼 This table lists the instruction templates used for training and evaluating different large vision-language models (LVLMs) on various object localization tasks. It shows the specific instructions given to each model (Griffon-G and Qwen2.5-VL) for object detection, visual grounding, and referring expression comprehension tasks. The templates detail the expected format of the model’s output, including coordinate systems and category labels, illustrating how the task instructions were tailored to each model and task type for consistent and comparable results.
read the caption
Table 8: Training and evaluation templates for each model and task.
| Examine the image for any objects from the category set. Report the coordinates of each |
| detected object. The category set includes {category list}. |
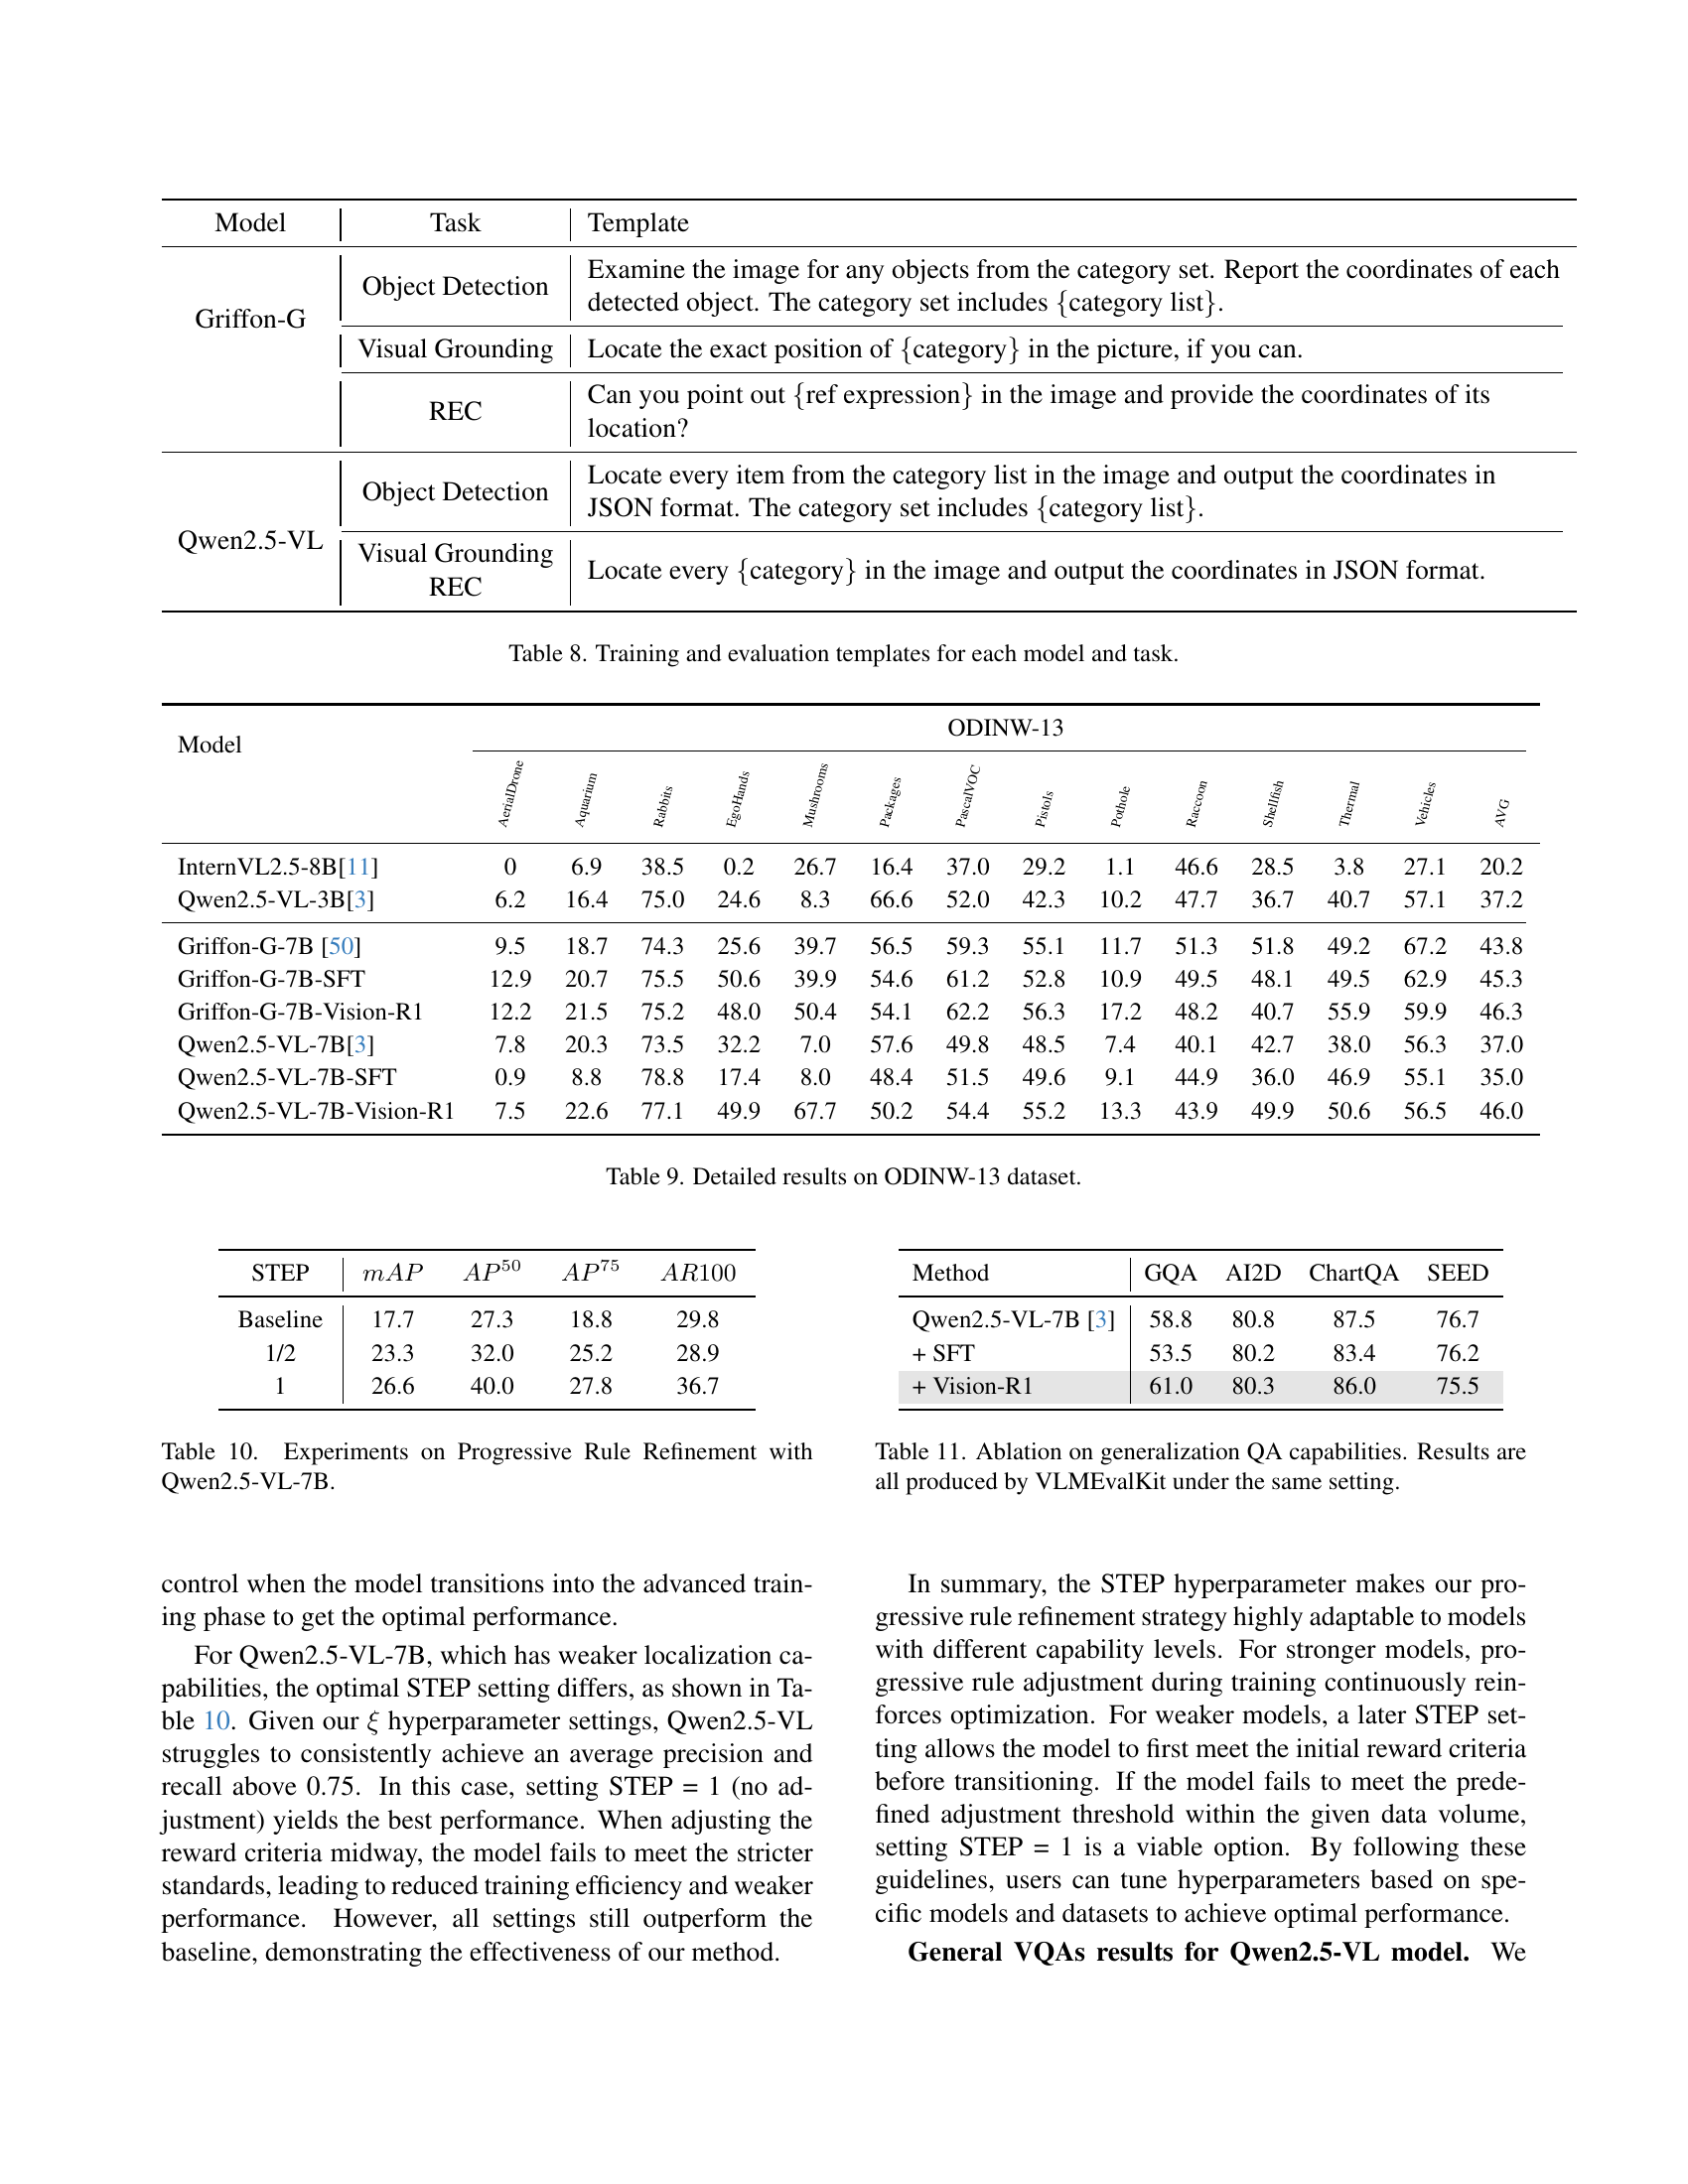
🔼 This table presents a detailed breakdown of the performance of different large vision-language models (LVLMs) on the ODINW-13 benchmark dataset. It compares the performance of various models, including InternVL-2.5-8B, Qwen2.5-VL-7B, Griffon-G-7B, and their fine-tuned versions using supervised fine-tuning (SFT) and the Vision-R1 method. The results are presented in terms of mean average precision (mAP) across various metrics (AP50, AP75, etc.) for each model on all 13 datasets within the ODINW-13 benchmark. This allows for a comprehensive comparison of the effectiveness of Vision-R1 in enhancing the object localization capabilities of different LVLMs.
read the caption
Table 9: Detailed results on ODINW-13 dataset.
| Locate the exact position of {category} in the picture, if you can. |
🔼 This table presents the ablation study results on the progressive rule refinement strategy using the Qwen2.5-VL-7B model. It shows how different settings of the STEP parameter (which determines when the training process transitions to the advanced phase with stricter reward criteria) affect the model’s performance on the object localization task. The results are measured using the metrics mean average precision (MAP), average precision at 50% IoU (AP50), average precision at 75% IoU (AP75), and average recall at 100 (AR100). The baseline represents the model’s performance without progressive rule refinement.
read the caption
Table 10: Experiments on Progressive Rule Refinement with Qwen2.5-VL-7B.
| Can you point out {ref expression} in the image and provide the coordinates of its |
| location? |
🔼 This table presents the results of an ablation study assessing the impact of Vision-R1 on the generalization capabilities of large vision-language models (LVLMs) in question answering (QA) tasks. It compares the performance of two models, Griffon-G-7B and Qwen2.5-VL-7B, across four different general-purpose QA benchmarks: GQA (general question answering), AI2D (diagrammatic reasoning), ChartQA (chart-based QA), and SEED (scientific, engineering, economics, and data-related QA). The table shows the performance of each model before and after fine-tuning with both supervised fine-tuning (SFT) and Vision-R1. This allows for a direct comparison of the effectiveness of Vision-R1 in improving the general QA performance of the models while also evaluating how it compares to the more traditional approach of SFT. All results were obtained using the VLMEvalKit evaluation toolkit to ensure consistent evaluation across all experiments.
read the caption
Table 11: Ablation on generalization QA capabilities. Results are all produced by VLMEvalKit under the same setting.
Full paper#