TL;DR#
Large Language Models(LLMs) excel in many areas, but do they truly understand different cultures, or do they just reflect the cultural biases present in their training data? This paper explores whether LLMs can solve math problems when those problems are adapted to different cultural contexts. The researchers question whether LLMs can perform math reasoning when presented with math word problems that are adapted in different cultures. They changed cultural elements in problems and assessed how well LLMs could solve them. This paper finds that cultural context greatly impacts LLMs’ math abilities.
To tackle this question, researchers created six synthetic cultural datasets based on the GSM8K benchmark, a standard test for LLMs’ math skills. While keeping the math the same, they altered cultural details such as names, foods, and places to reflect different regions. Then, they tested 14 LLMs on these datasets to see how well they performed.The results showed that LLMs struggle when math problems include unfamiliar cultural references, even when the underlying math is unchanged. Smaller models had even more trouble than larger ones. Interestingly, exposure to relevant cultural contexts can improve mathematical reasoning.
Key Takeaways#
Why does it matter?#
This paper reveals LLMs’ cultural biases in math reasoning, highlighting the need for diverse training data and culturally nuanced evaluation. It prompts future research into fairer, more robust AI across cultures.
Visual Insights#

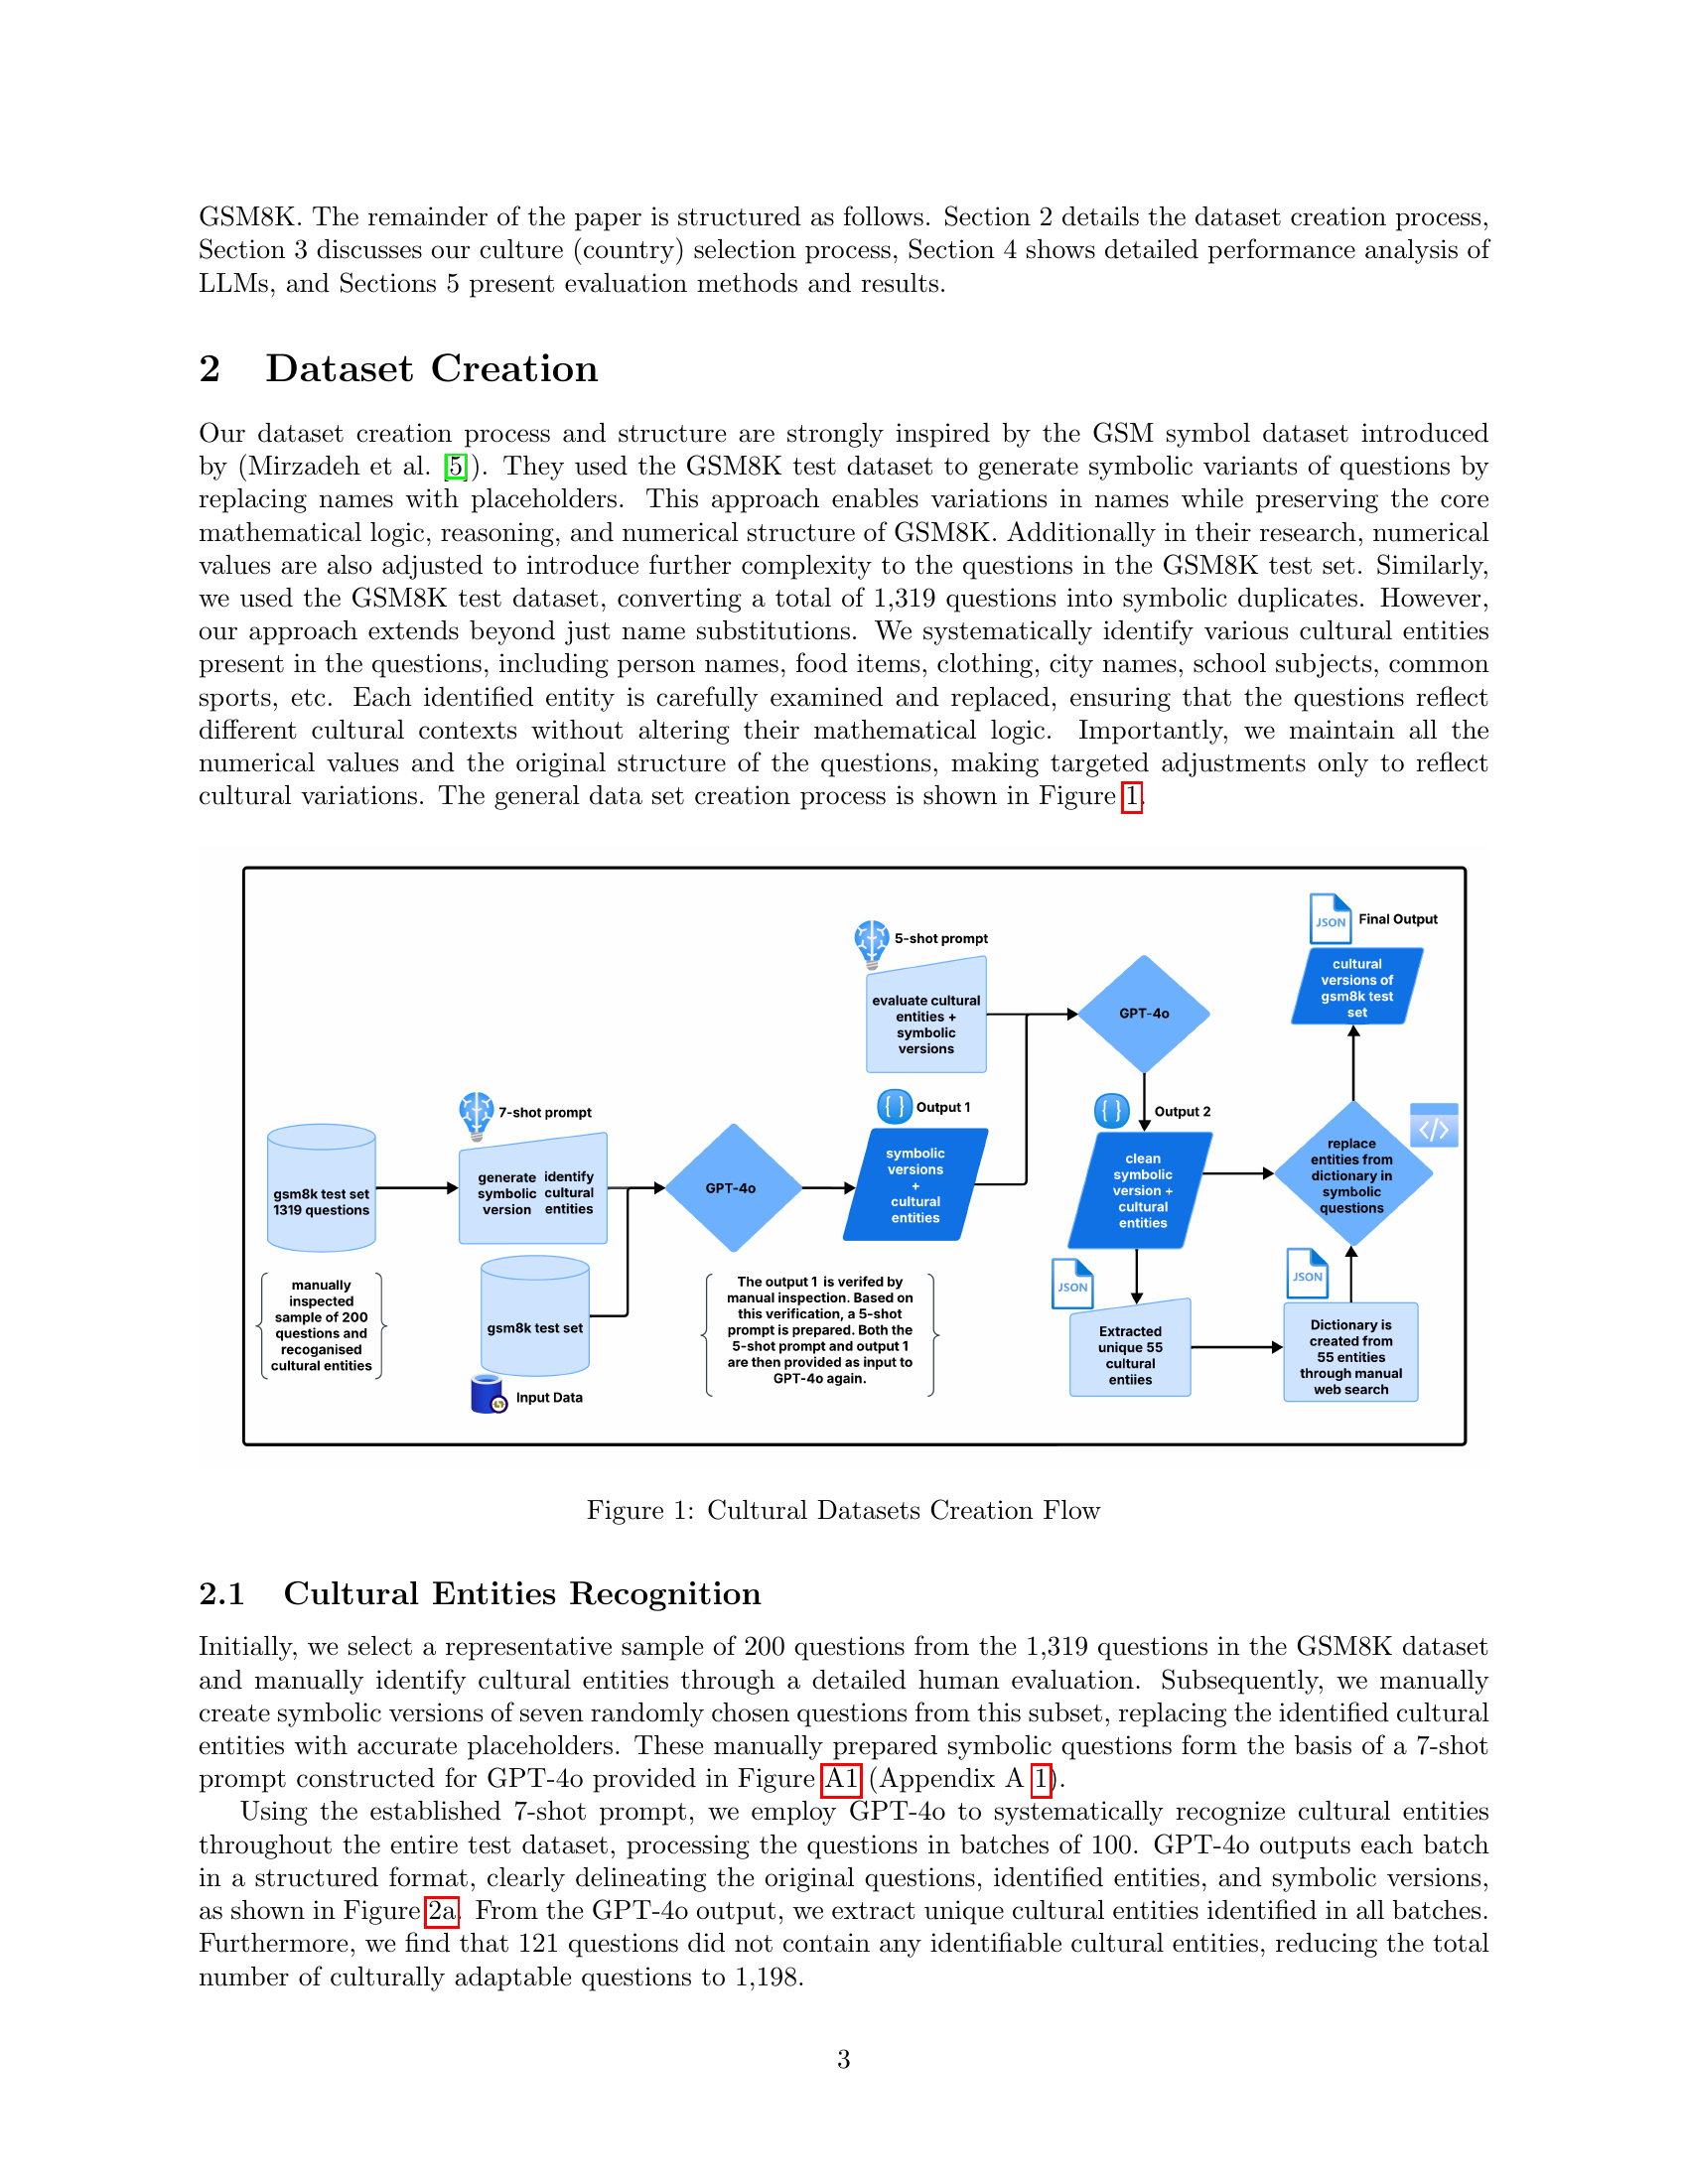
🔼 This figure illustrates the process of creating culturally adapted datasets from the GSM8K dataset. It starts with the 1319 questions from GSM8K, a sample of which are manually inspected to identify cultural entities. These entities are then used to create symbolic versions of the questions using GPT-40. A dictionary of cultural entities is built through web searches, which are used to replace placeholders in the symbolic questions to create culturally adapted versions. The process involves multiple iterations of refinement and manual inspection to ensure accuracy and consistency.
read the caption
Figure 1: Cultural Datasets Creation Flow
| No | Country | Continent | Dataset |
|---|---|---|---|
| 1 | Pakistan | Asia | PakGSM8K |
| 2 | Moldova | Europe | MolGSM8K |
| 3 | Somalia | Africa | SomGSM8K |
| 4 | Haiti | North America | HaiGSM8K |
| 5 | Suriname | South America | SurGSM8K |
| 6 | Solomon islands | Oceania | SolIGSM8K |
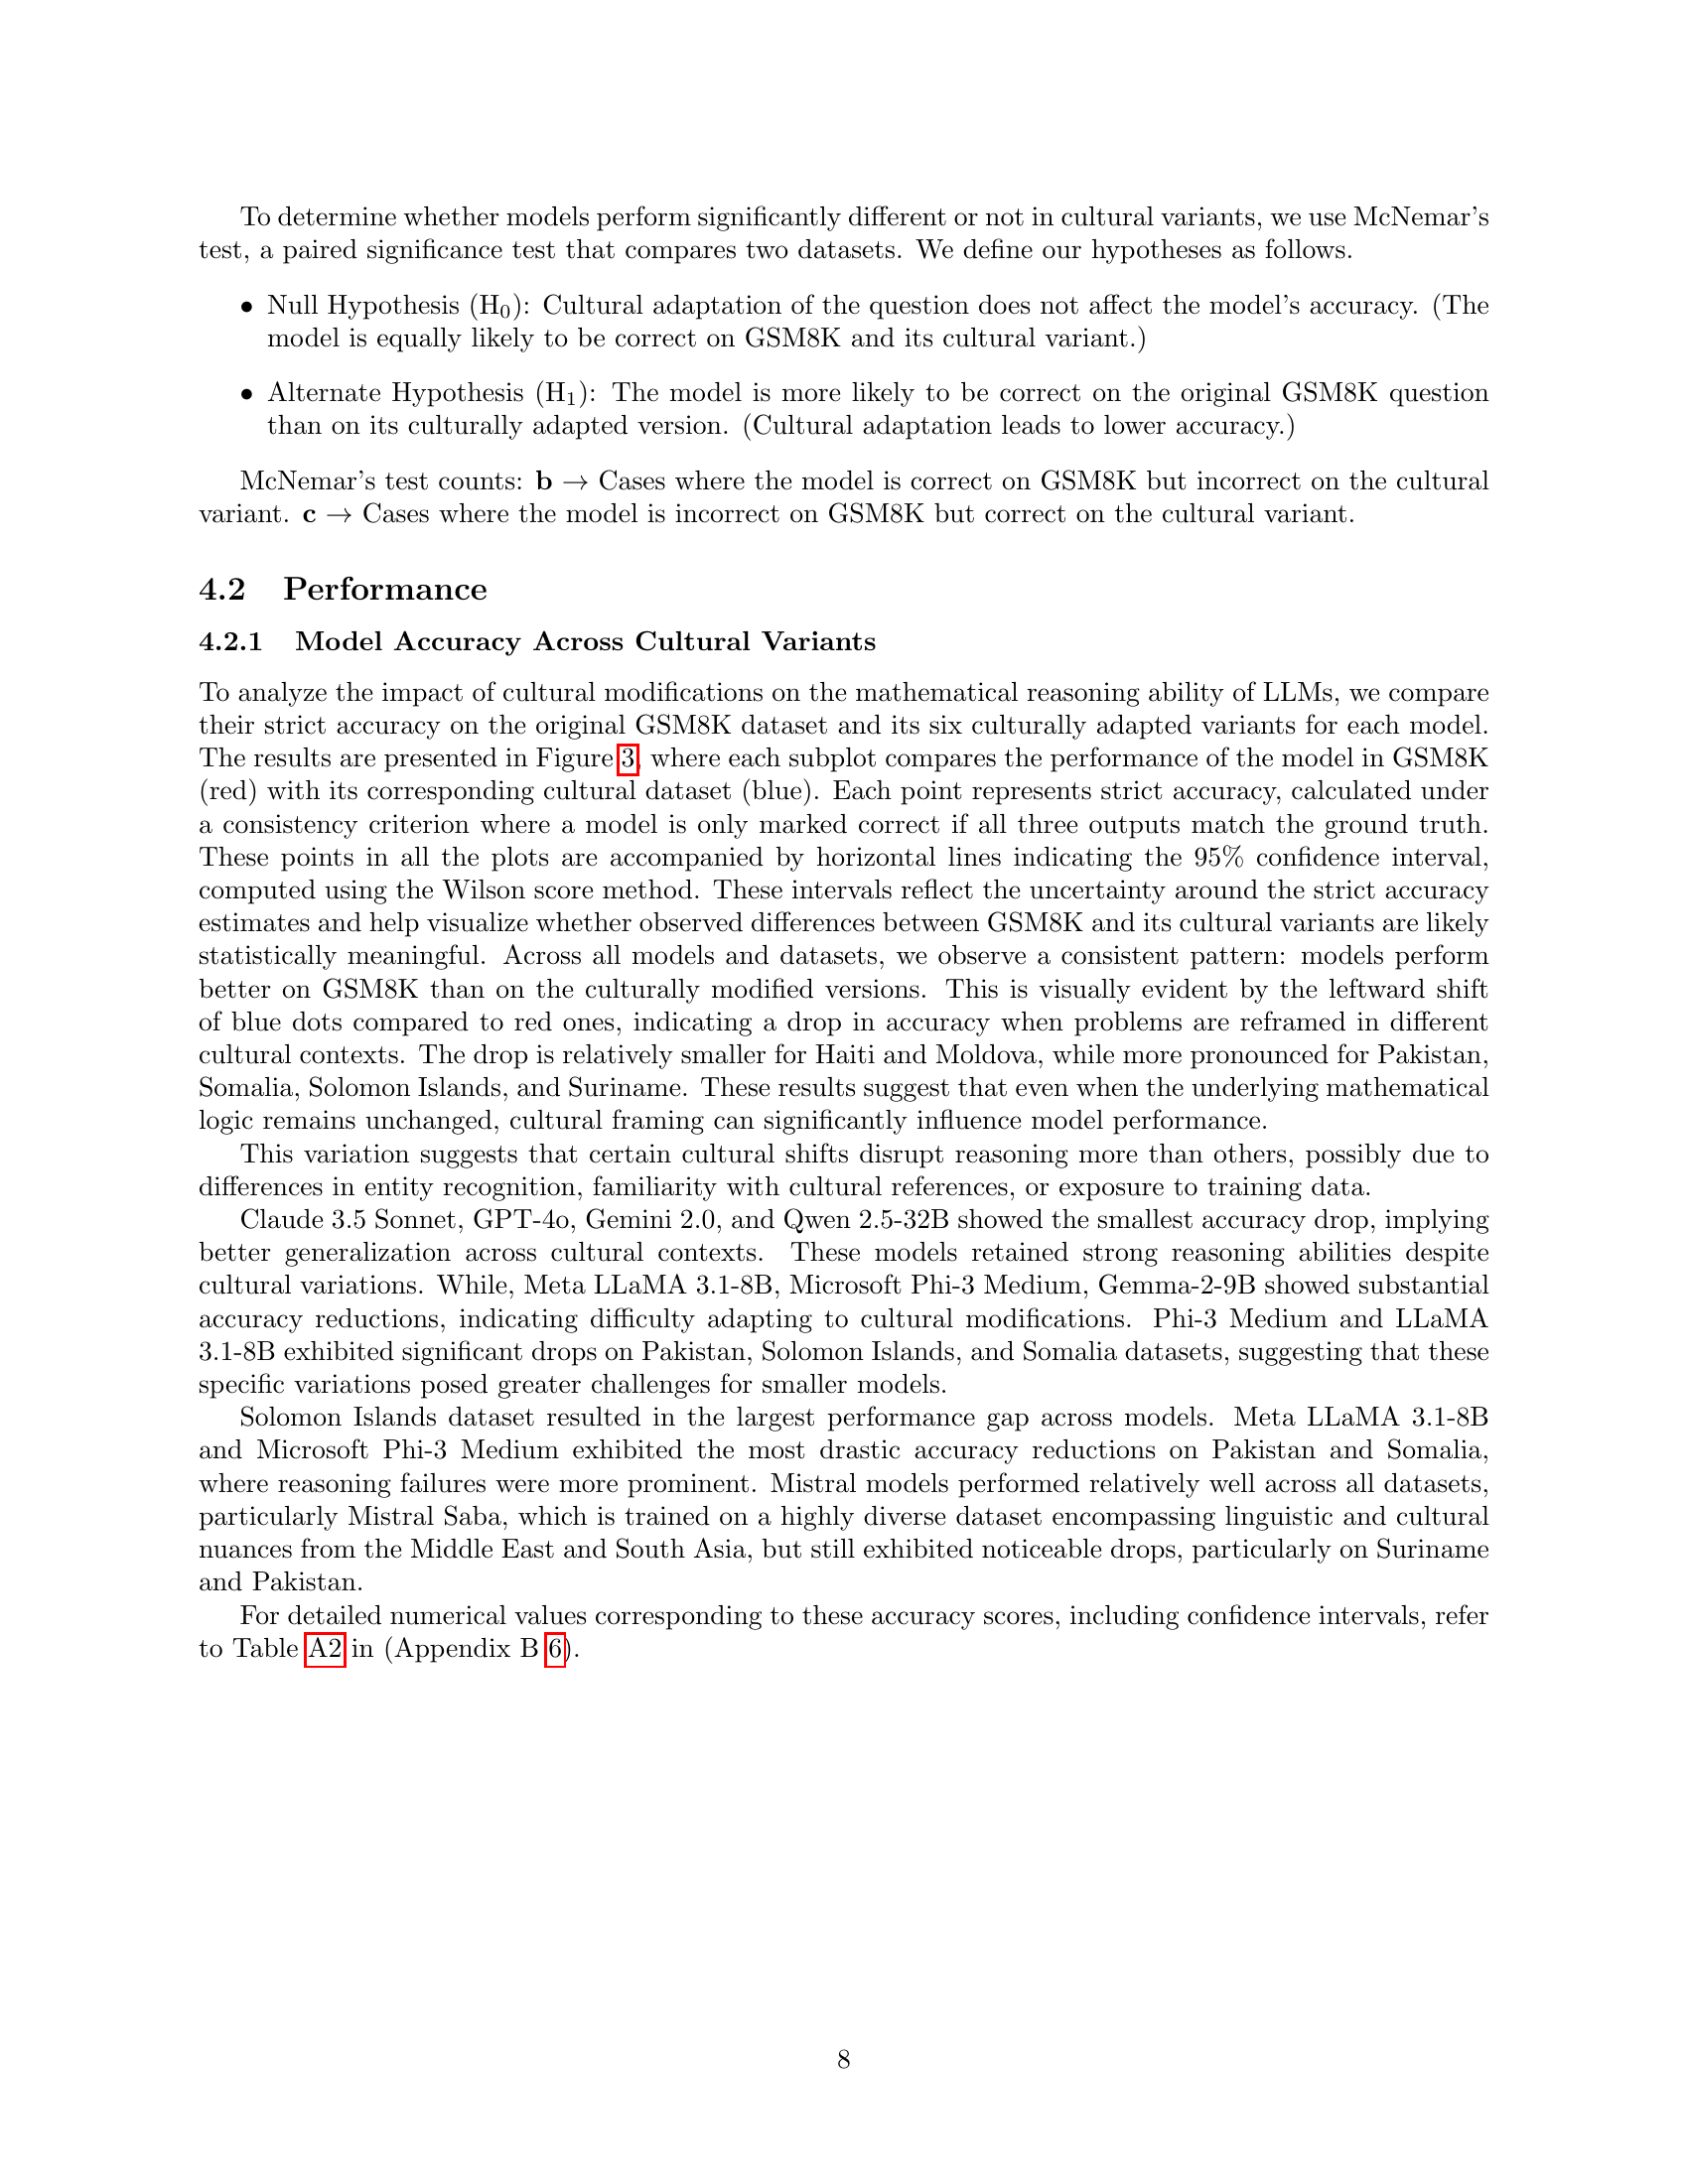
🔼 This table presents the six countries and corresponding datasets used in the study. Each dataset is a culturally adapted version of the GSM8K dataset, reflecting the cultural context of a specific country. The countries were selected to represent diverse geographical regions and levels of socioeconomic development, ensuring a wide range of cultural contexts in the evaluation.
read the caption
Table 1: Countries and Datasets
In-depth insights#
Cultural Reasoning#
Cultural reasoning in Large Language Models (LLMs) is challenged by biases in training data, leading to difficulties when processing culturally adapted math problems. The study reveals that LLMs struggle with math problems when cultural references change, even while mathematical structures remain constant. Smaller models exhibit greater performance drops, underscoring limitations in generalizing mathematical skills. Interestingly, cultural familiarity can enhance reasoning, even in models without explicit math training. Cultural context significantly influences math reasoning in LLMs, creating a need for more diverse training data to improve real-world application robustness. Tokenization variances across cultures and the influence of training on problem-solving approaches show intricacies. LLMs can introduce incorrect cultural assumptions, underlining the importance of accounting for cultural context when evaluating mathematical reasoning in LLMs.
Synthetic Datasets#
While the research paper does not explicitly delve into a section called ‘Synthetic Datasets,’ the methodology inherently relies on synthetic data generation to augment or adapt existing benchmarks like GSM8K. The creation of culturally diverse datasets from GSM8K is a form of synthetic data generation, preserving mathematical structure while modifying cultural elements. This approach raises important considerations: the quality and diversity of the synthetic data are crucial for reliable evaluation. If the generated cultural contexts are not sufficiently representative or diverse, the assessment of LLMs’ cultural understanding might be skewed. Also, there is a potential for introducing unintended biases during the synthesis process, where the models used for adapting the data might inadvertently reflect their own limitations or biases.
Tokenization Bias#
Tokenization bias in LLMs arises because the models’ vocabularies and subword tokenization algorithms are shaped by their training data, often skewed towards dominant languages and cultures. Consequently, less represented languages or specialized domains may be tokenized into more subwords, increasing input length and computational cost. This can degrade performance because longer sequences introduce more opportunities for error and dilute contextual understanding. Bias can also lead to inconsistent representations where semantically similar concepts are tokenized differently based on their cultural origin. Mitigating this requires careful vocabulary design, cross-lingual training, and bias correction strategies to ensure fair and efficient processing across diverse inputs.
McNemar Analysis#
McNemar’s test is employed to statistically validate the observed performance differences. It assesses whether Large language Models (LLMs) responses on culturally adapted math problems deviate significantly from those on the original GSM8K dataset, using p-values and b/c counts. This analysis aids in determining if performance variances are genuinely linked to cultural context or merely arise from random chance, indicating model sensitivity. A statistically significant result points to a cultural effect impacting accuracy, influencing the reliability of LLMs across diverse scenarios.
Reasoning Failure#
The paper highlights reasoning failures in LLMs when faced with culturally adapted math problems. The failures are not merely arithmetic errors, but stem from contextual misunderstandings. Currency handling is problematic; models struggle with less familiar units, often misinterpreting decimals based on cultural norms. Family structures also pose challenges, as models trained on Western norms struggle with non-Western familial relationships, leading to inaccurate calculations. A crucial point is entity interpretation; unfamiliar cultural terms trigger incorrect assumptions, showcasing reliance on learned patterns over genuine understanding. This underscores that cultural context significantly influences reasoning, even with unchanged underlying mathematical logic.
More visual insights#
More on figures

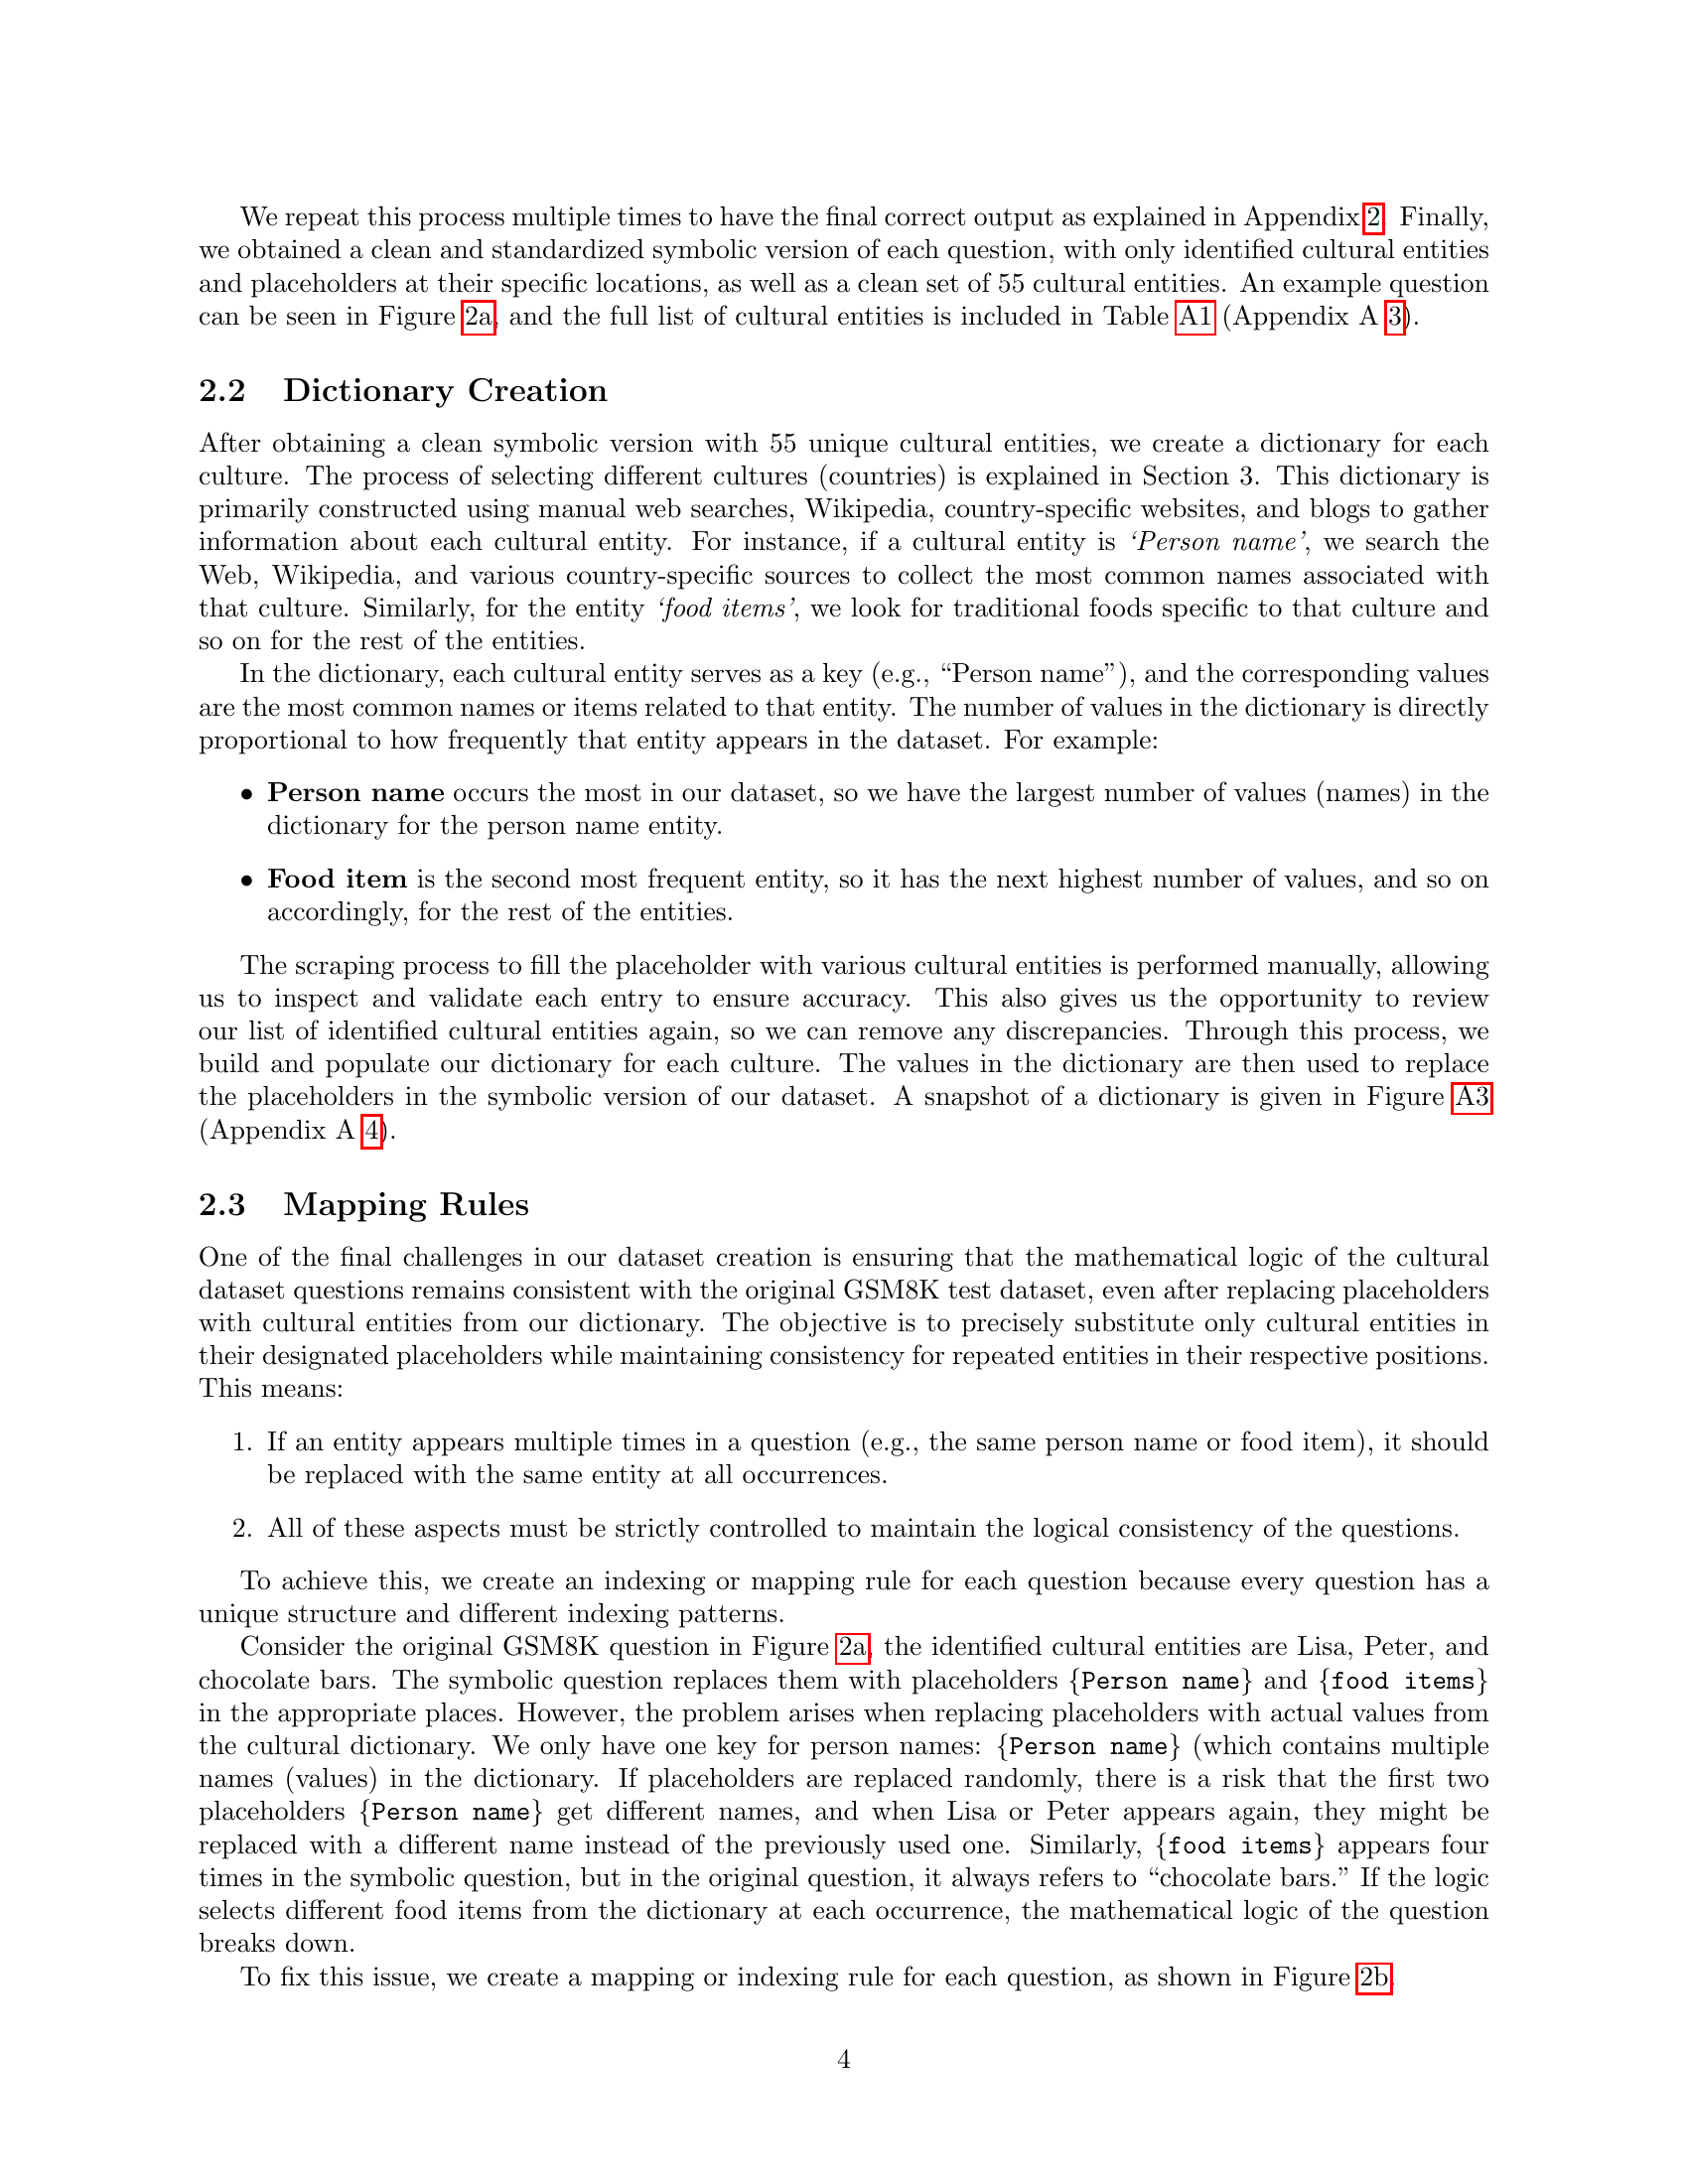
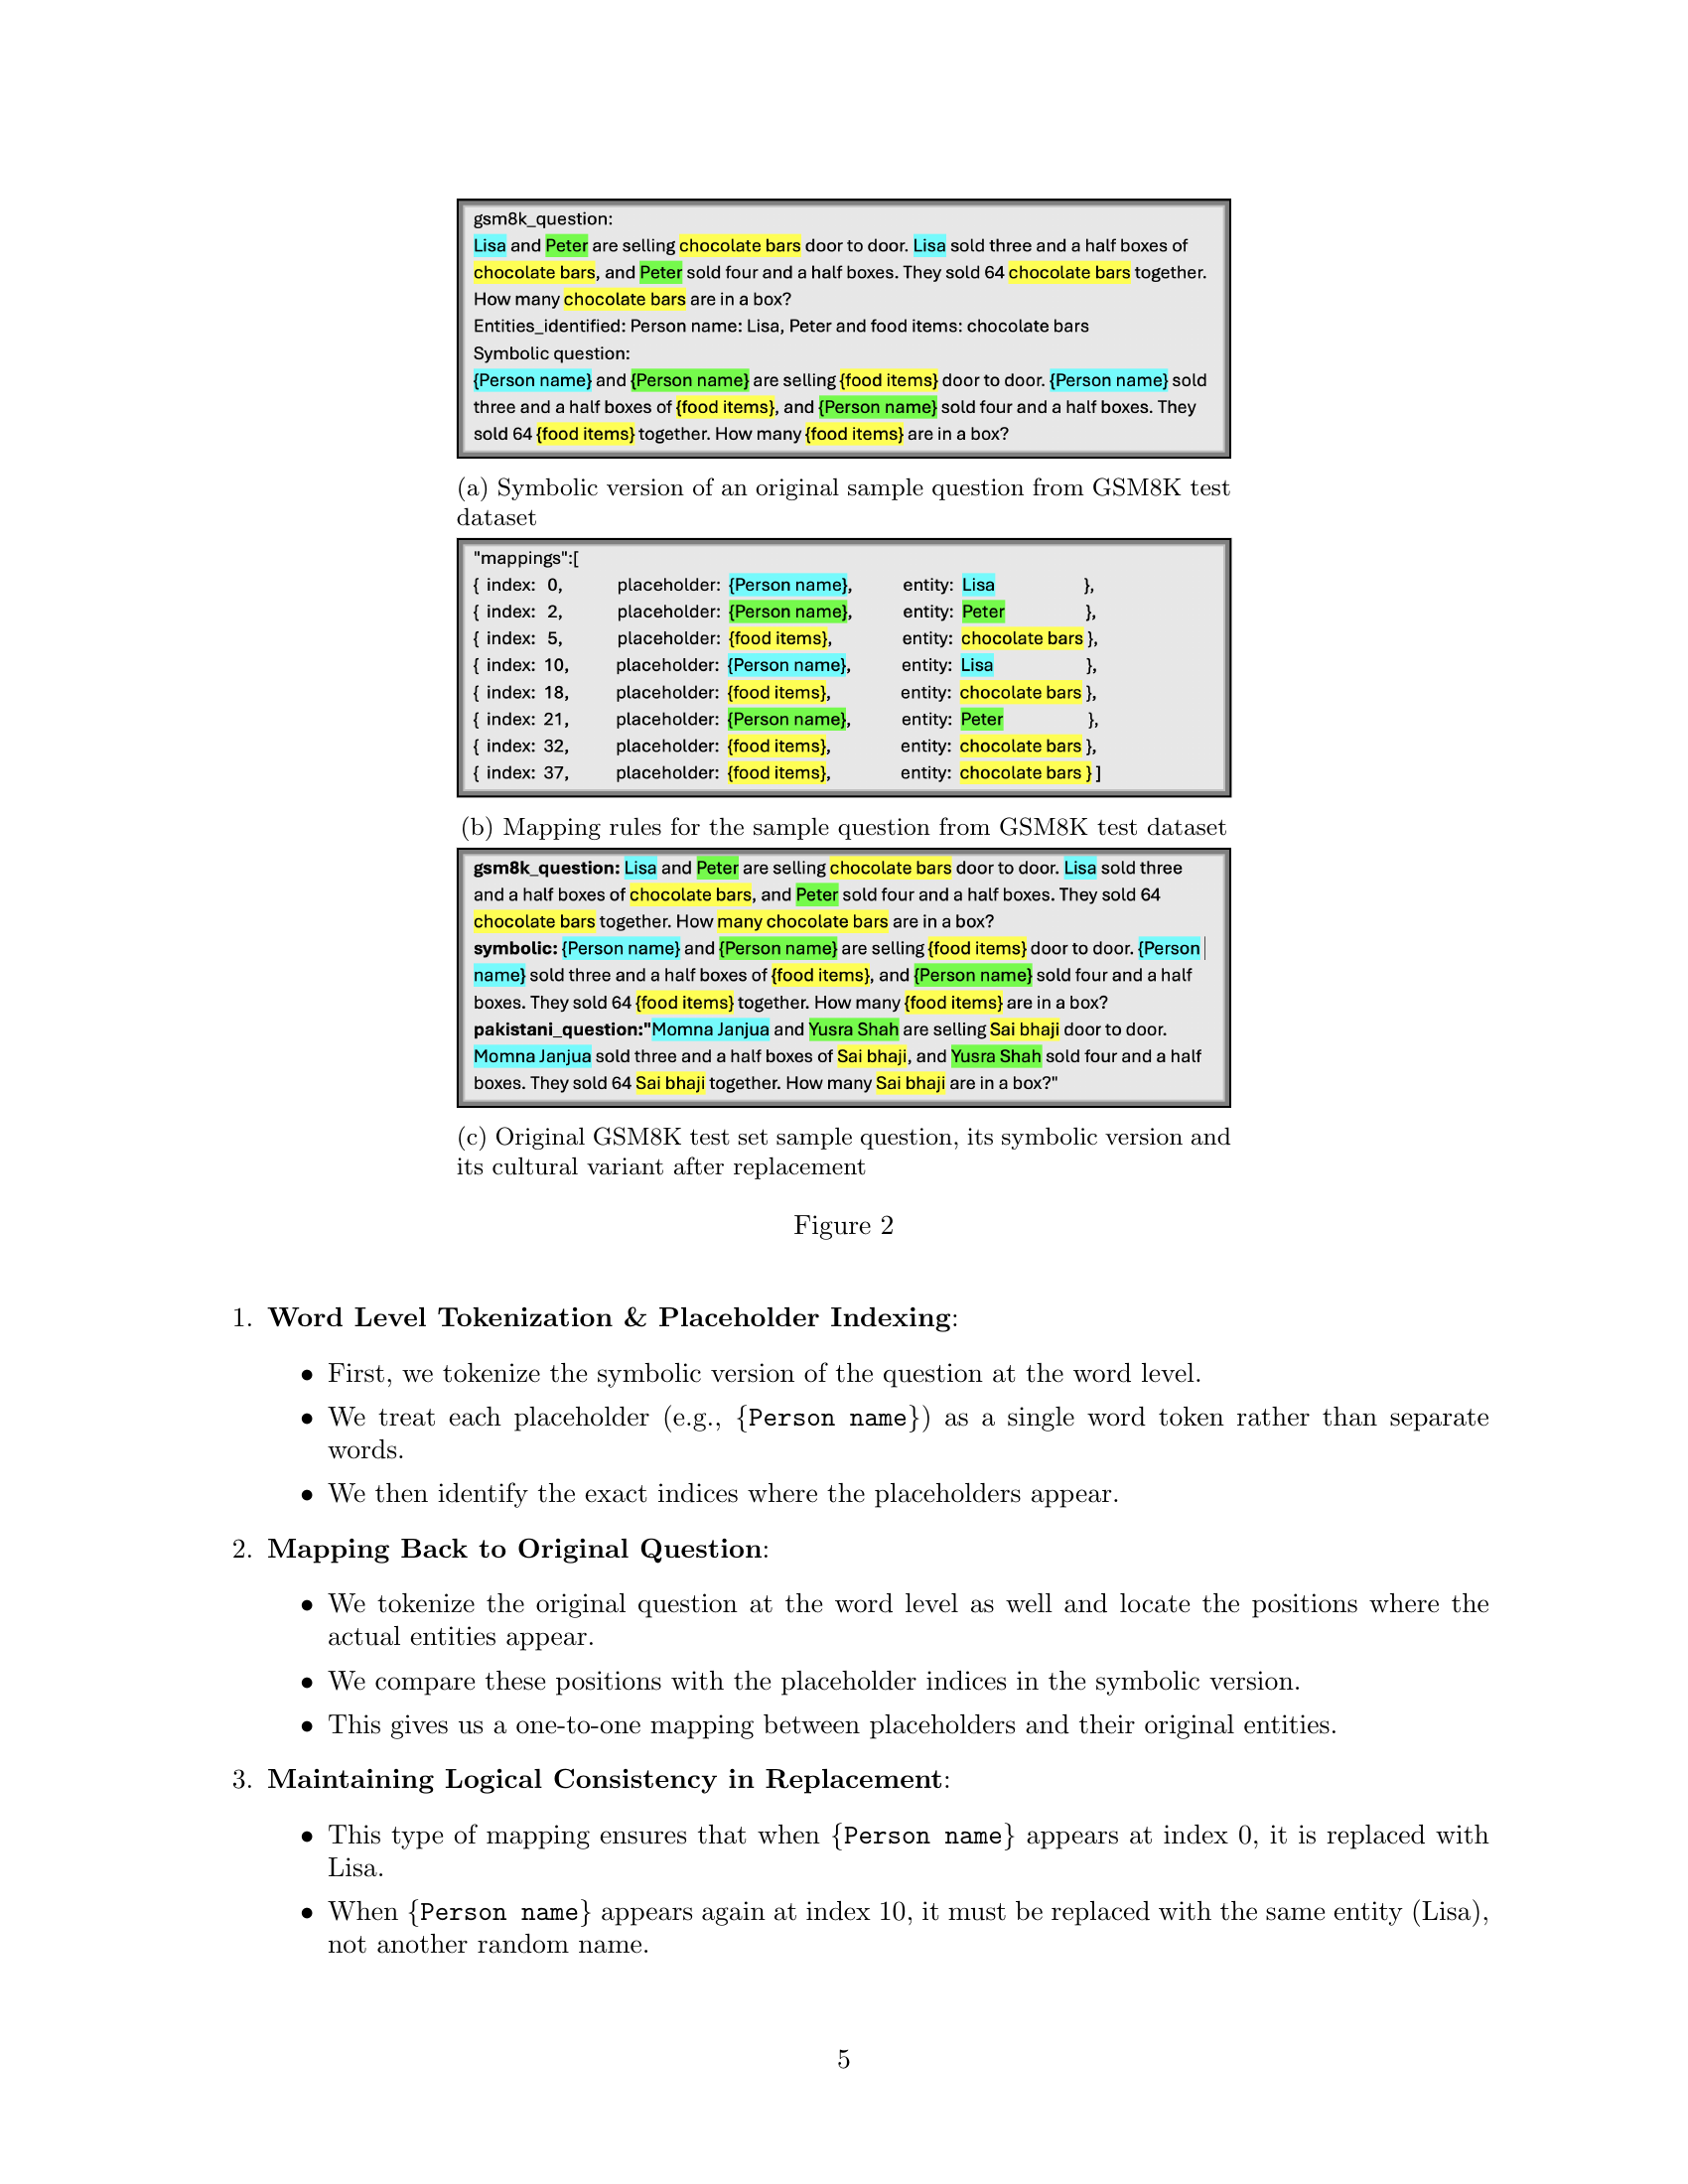
🔼 This figure shows a sample question from the GSM8K dataset after its cultural entities have been replaced with placeholders. The original question contained culturally specific elements like names and items. The symbolic version retains the mathematical structure but replaces these entities with generic placeholders, such as {Person Name} and {Food Item}, allowing for easier cultural adaptation in subsequent steps of the dataset creation process.
read the caption
(a) Symbolic version of an original sample question from GSM8K test dataset

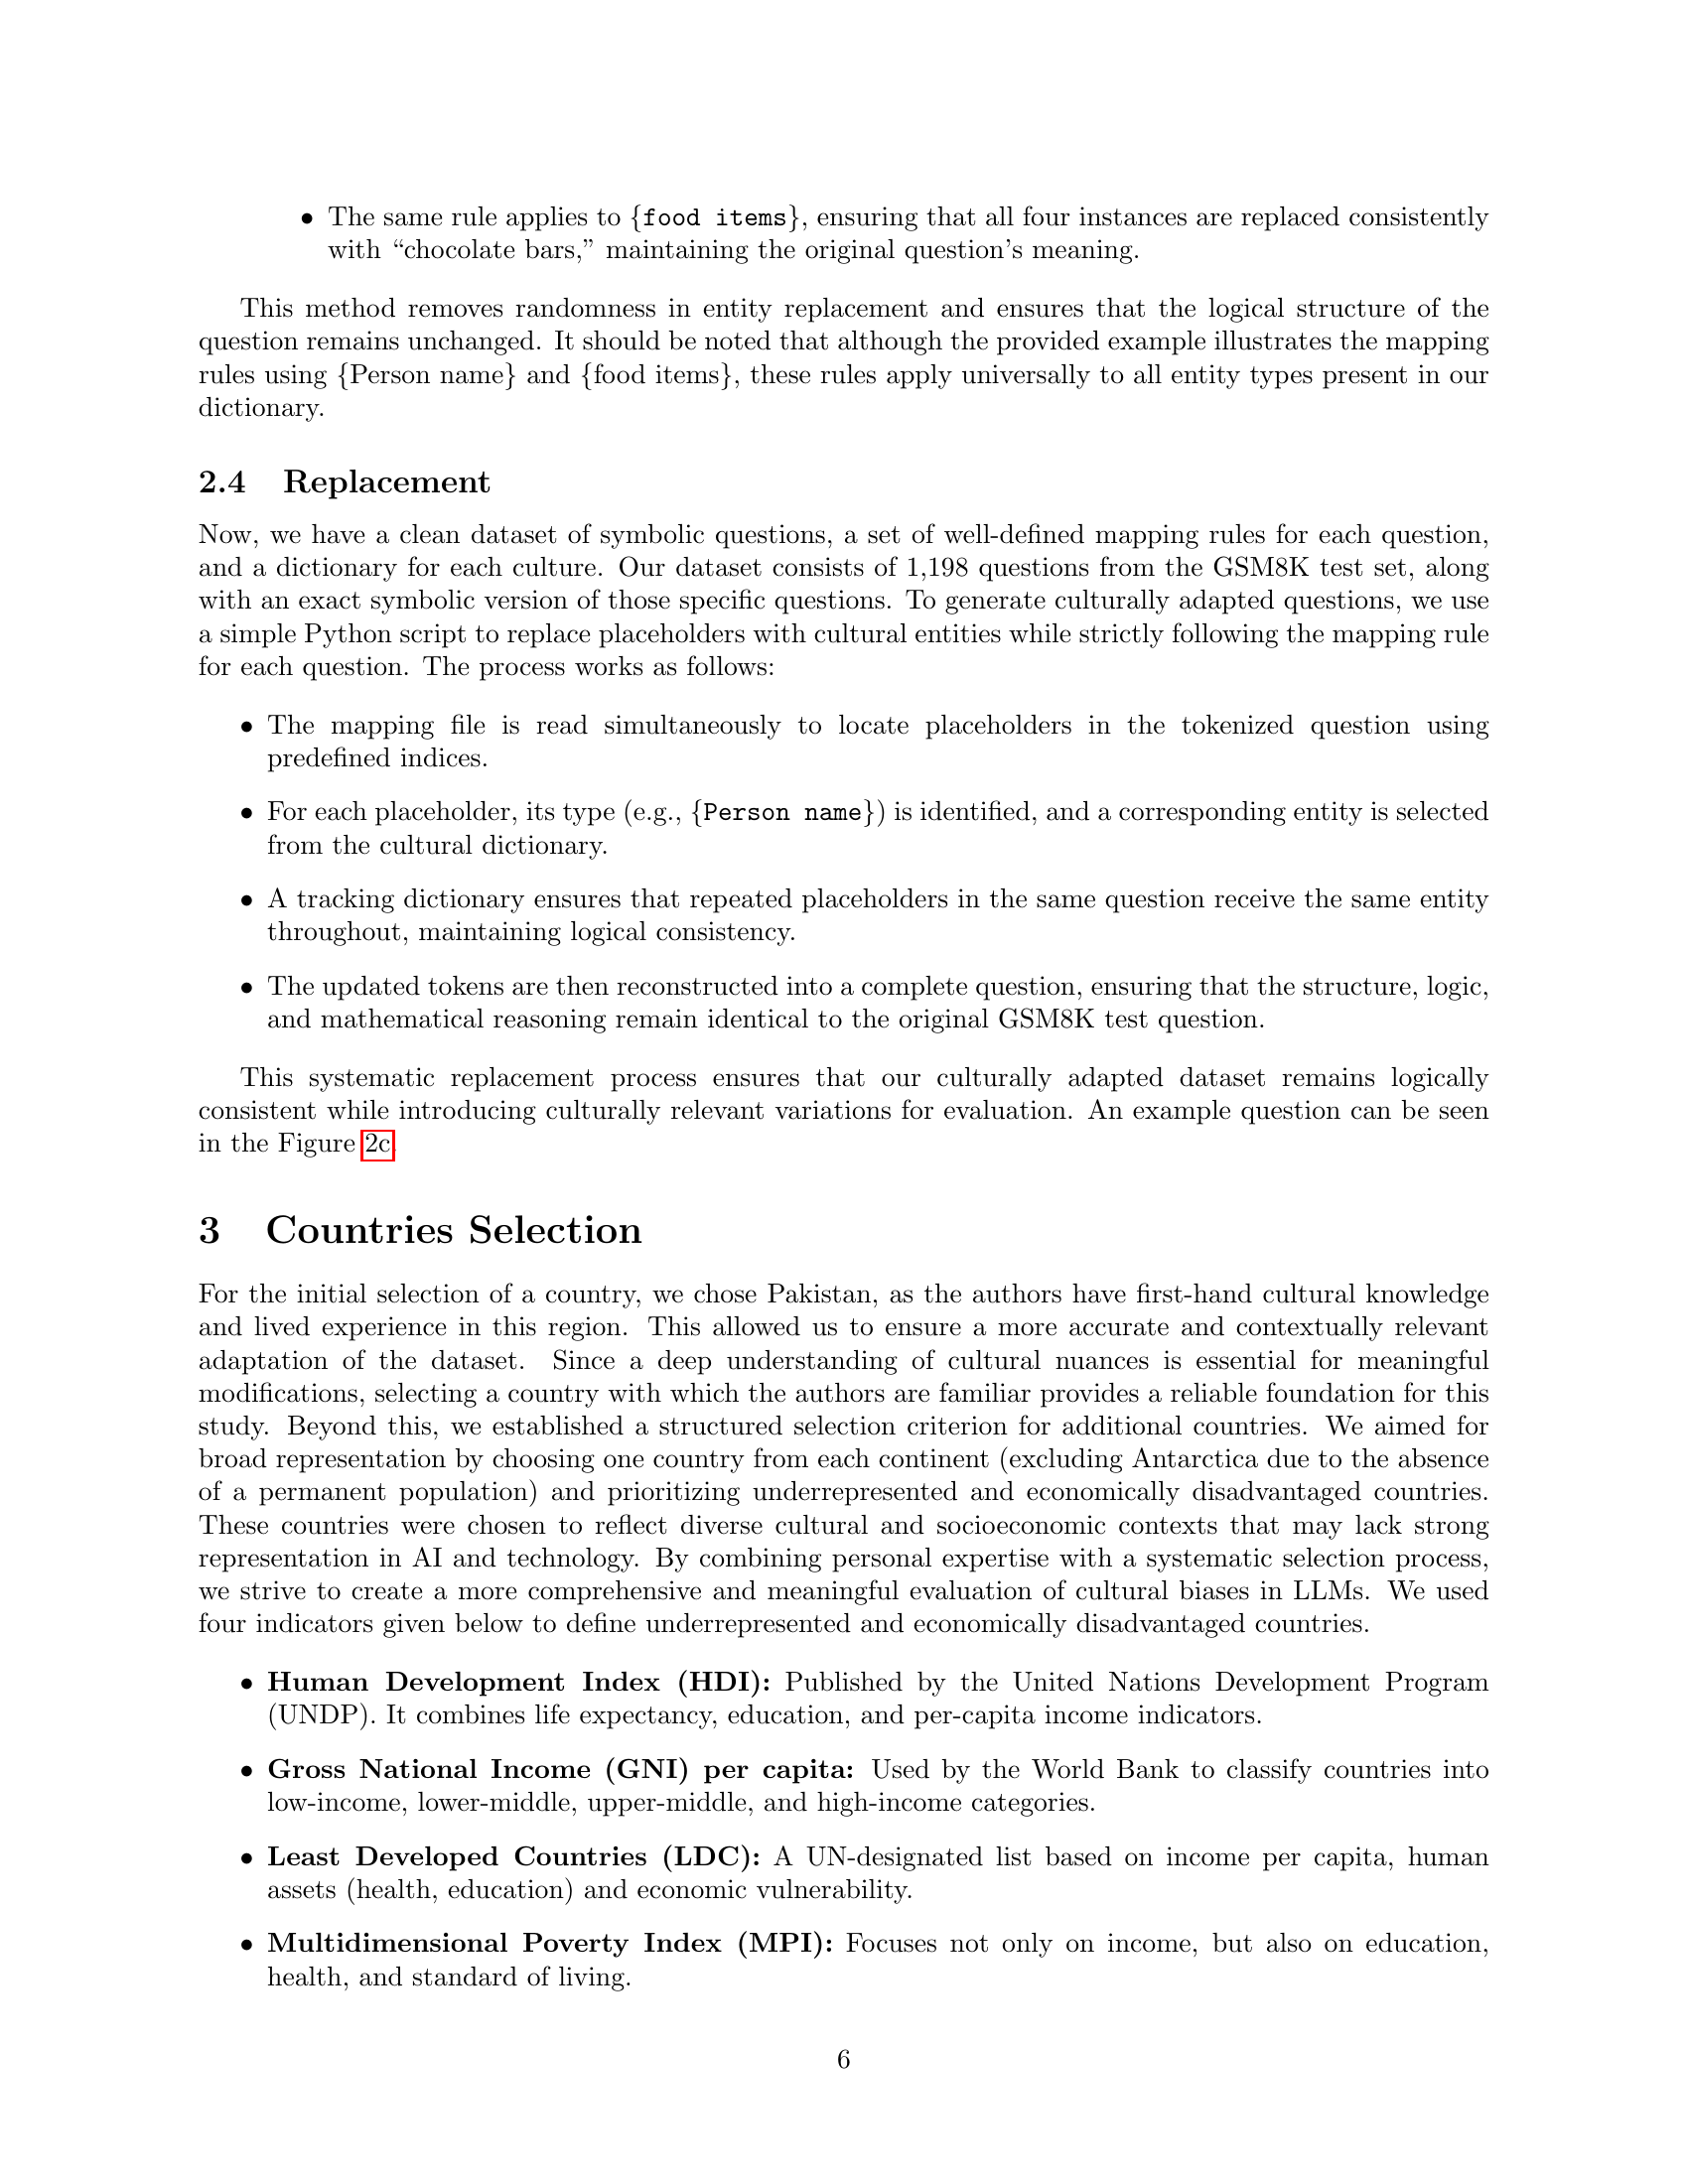
🔼 This figure shows the mapping rules used to ensure that when placeholders representing cultural entities (e.g., person names, food items) are replaced with actual entities from a cultural dictionary, the logical consistency of the question is maintained. The mapping ensures that if a specific placeholder appears multiple times within a question, it is always replaced by the same entity. This addresses the challenge of maintaining the original mathematical logic when swapping out culturally-specific terms.
read the caption
(b) Mapping rules for the sample question from GSM8K test dataset

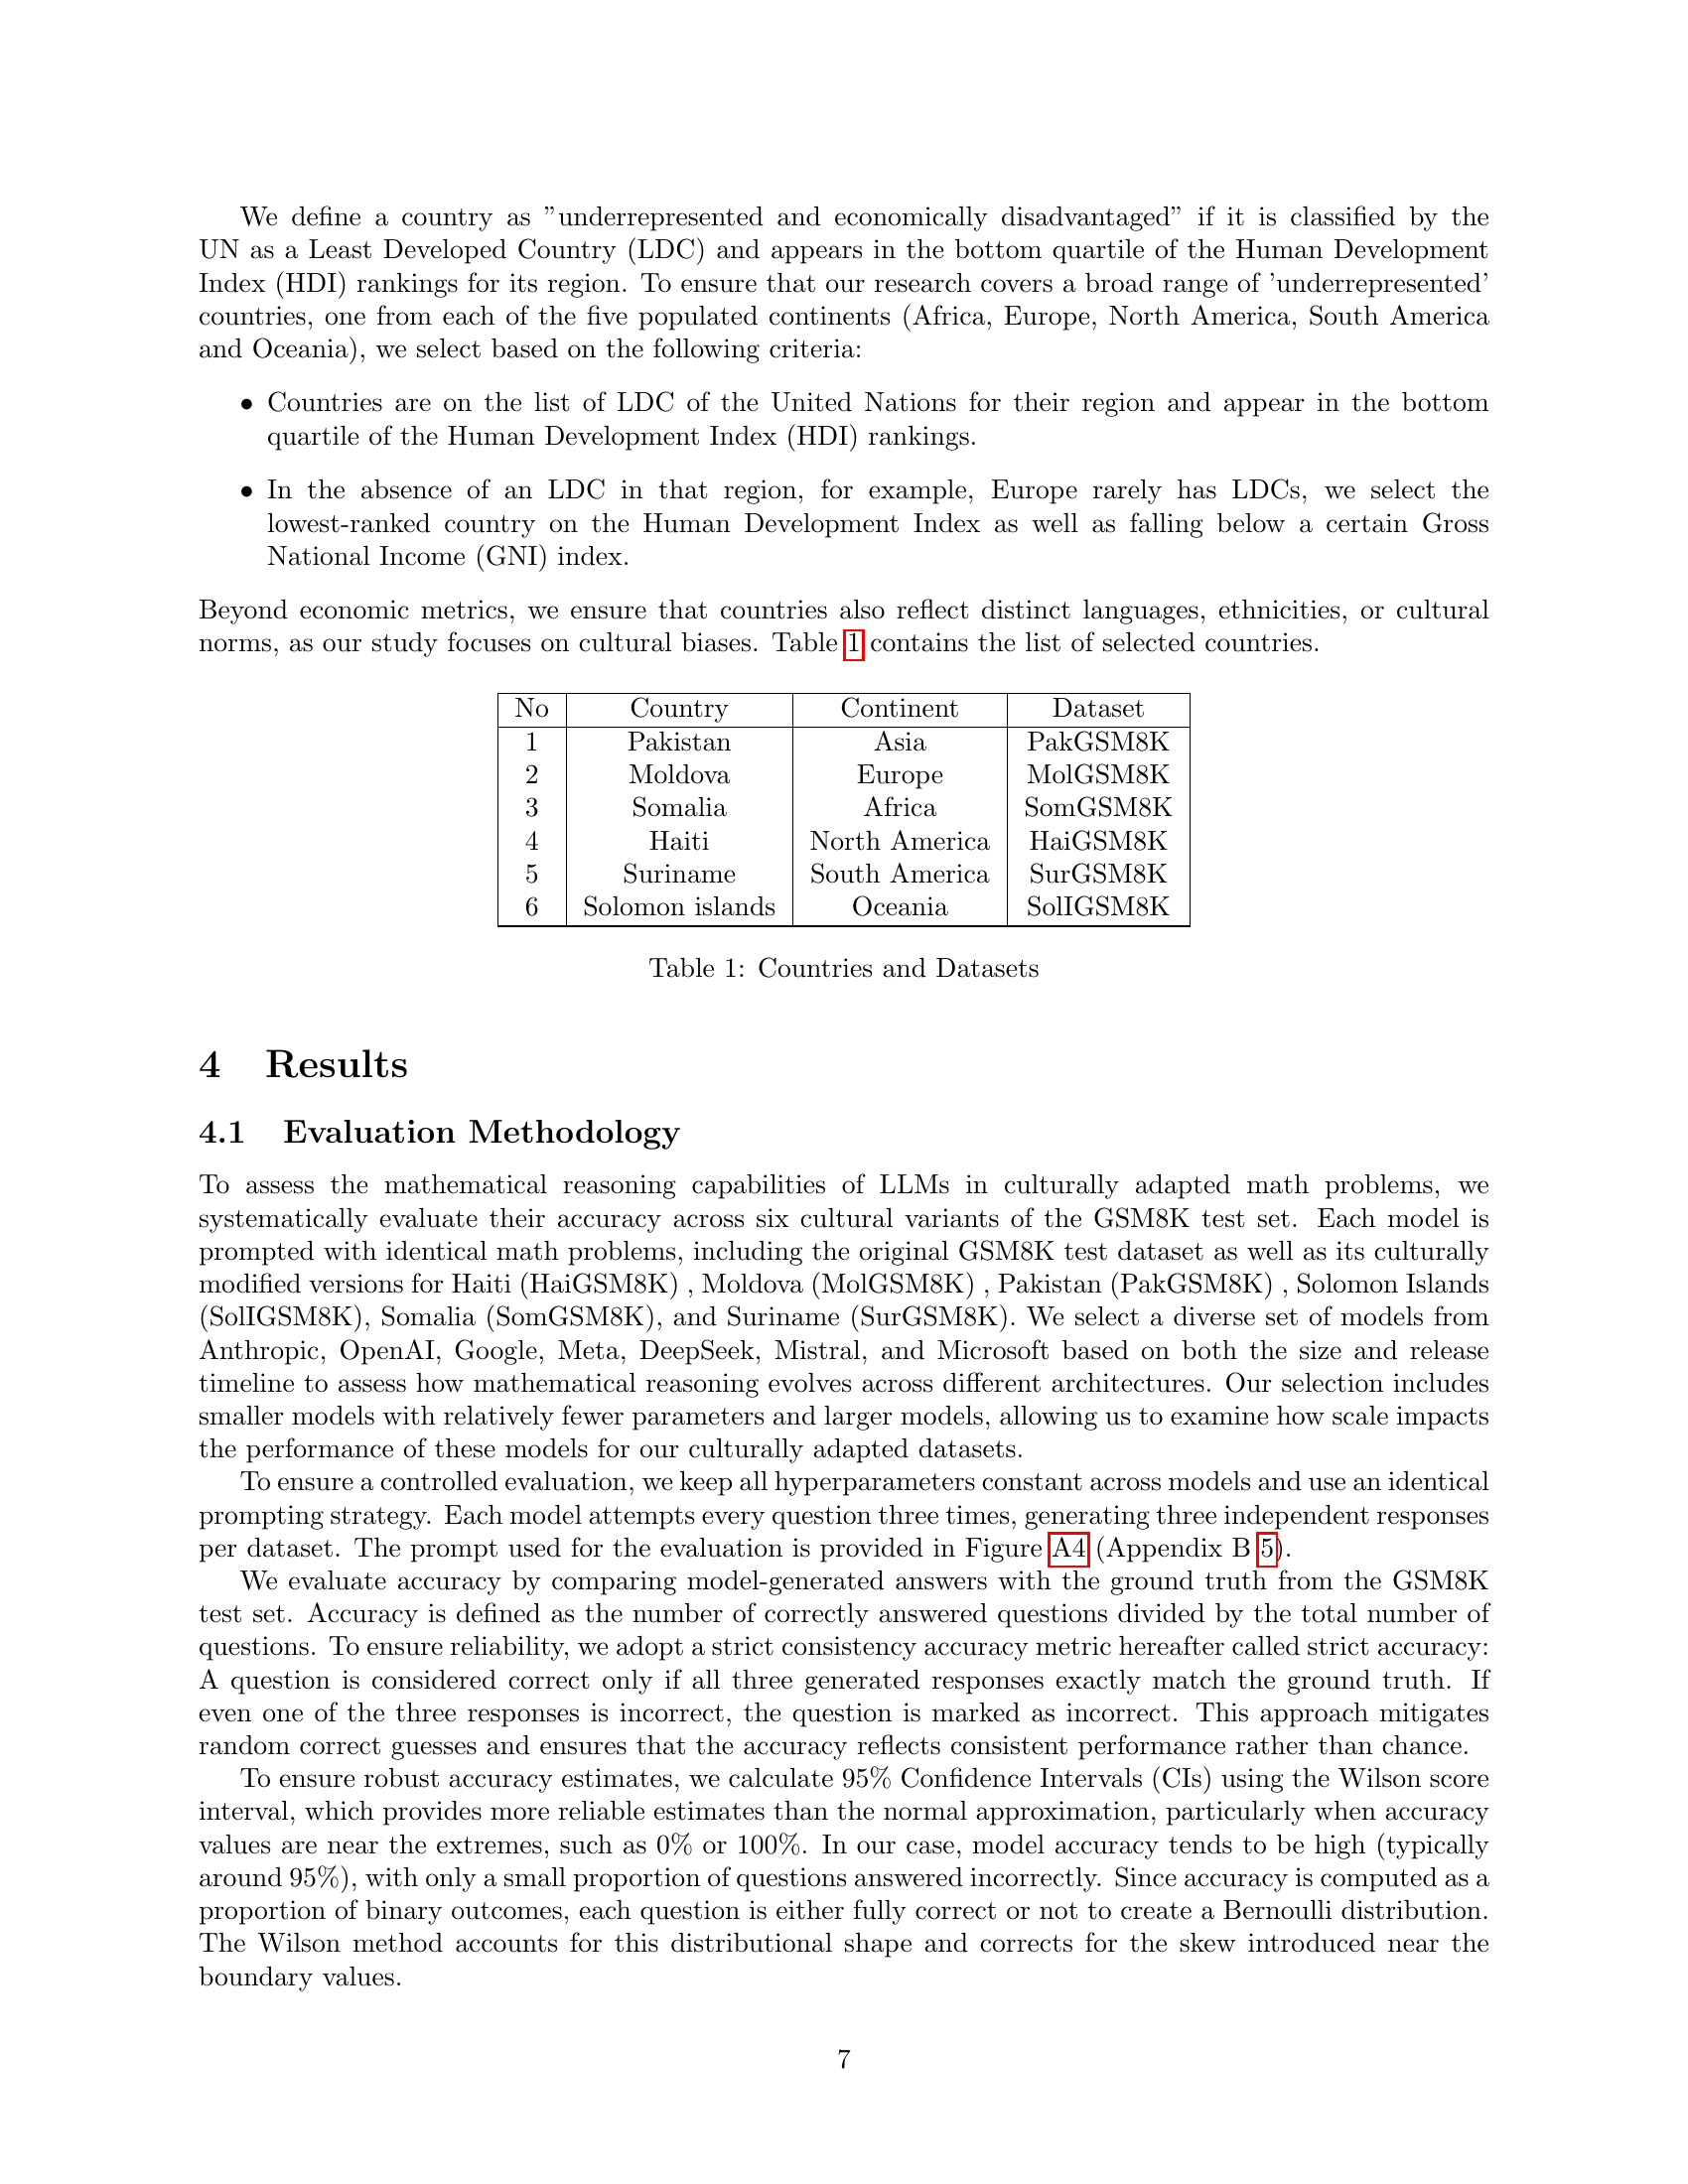
🔼 The figure shows three versions of the same question: the original question from the GSM8K dataset, its symbolic version (with placeholders replacing culturally specific entities), and a culturally adapted version (where the placeholders have been replaced with entities relevant to a specific culture). This illustrates the process of creating culturally adapted datasets from the original GSM8K dataset.
read the caption
(c) Original GSM8K test set sample question, its symbolic version and its cultural variant after replacement

🔼 This figure illustrates the process of creating culturally adapted datasets from the GSM8K dataset. It shows a flowchart of the dataset creation process, starting with the original GSM8K questions, followed by the manual identification of cultural entities using a 7-shot prompt in GPT-40, and leading to the creation of dictionaries for different cultures, and finally the generation of six culturally adapted datasets from the original GSM8K dataset using a mapping rule.
read the caption
Figure 2:

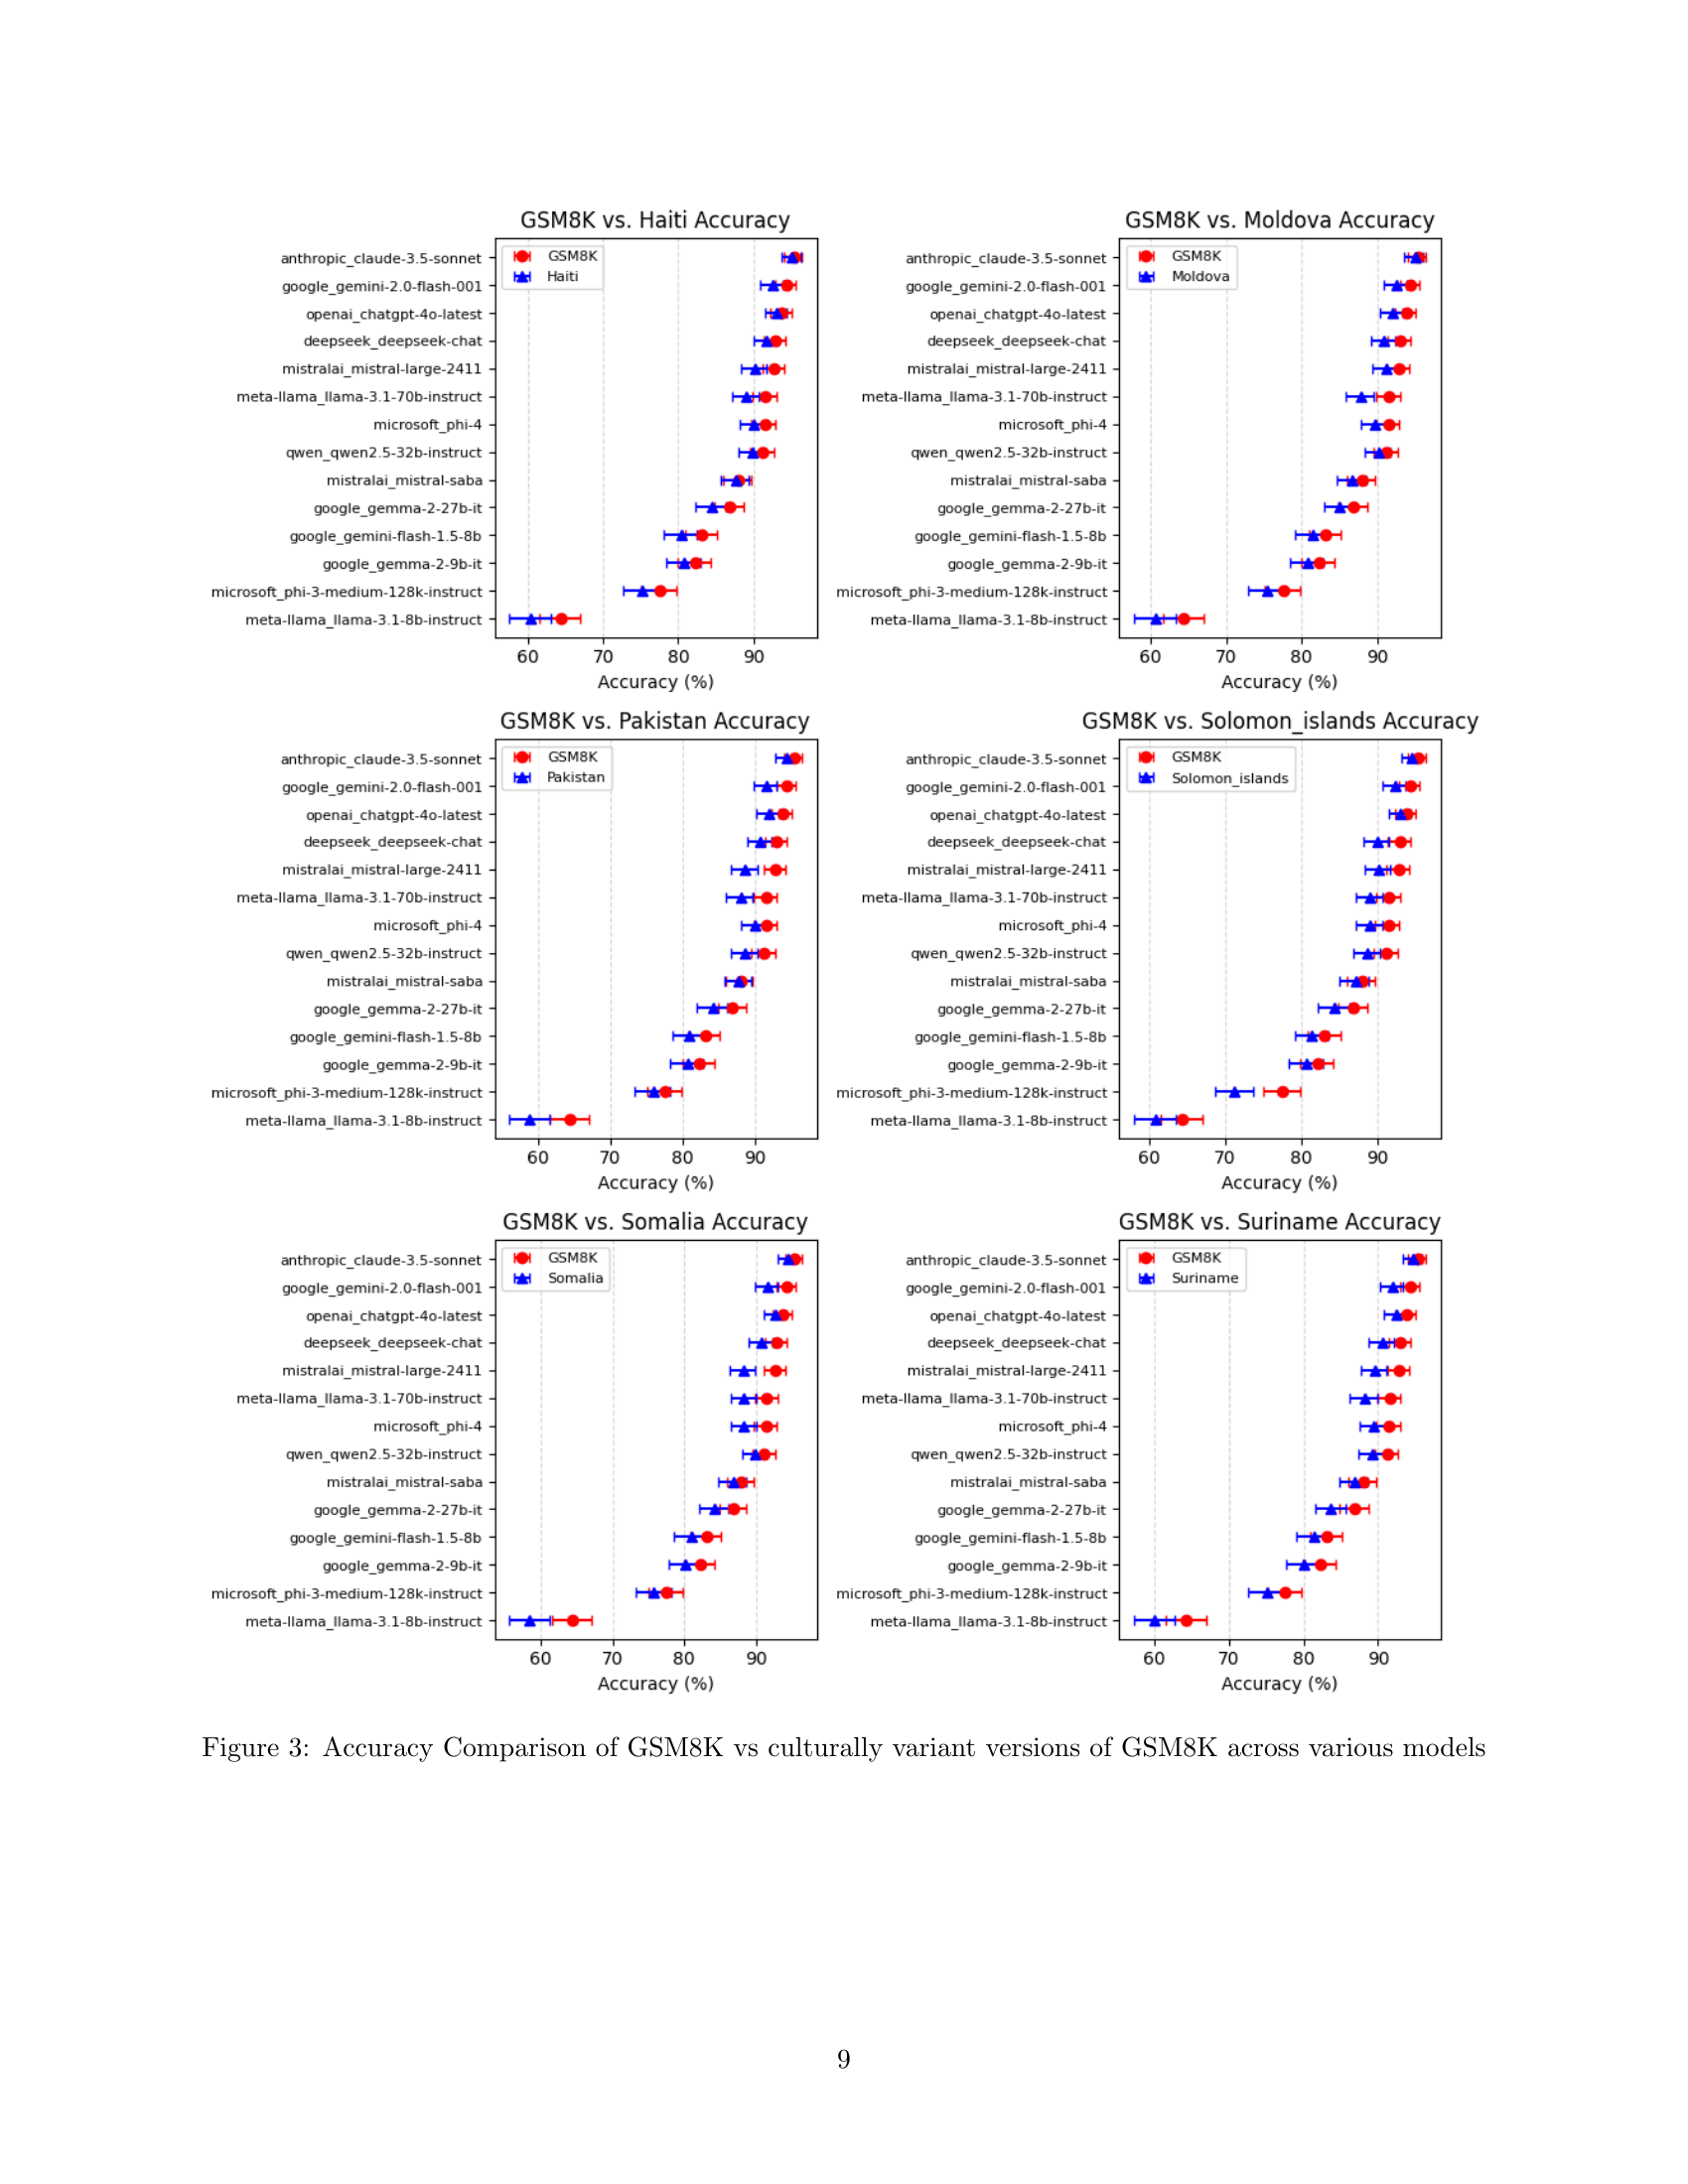
🔼 This figure presents a comparison of the accuracy of various Large Language Models (LLMs) when answering questions from the original GSM8K mathematics dataset and six culturally adapted versions of the same dataset. Each cultural adaptation modifies elements such as names, locations, and foods to reflect the cultural context of a specific continent. The figure shows the accuracy for each model on the original GSM8K dataset and each of its six cultural variants, allowing for a visual comparison of how well the models generalize to different cultural contexts. Error bars represent confidence intervals.
read the caption
Figure 3: Accuracy Comparison of GSM8K vs culturally variant versions of GSM8K across various models

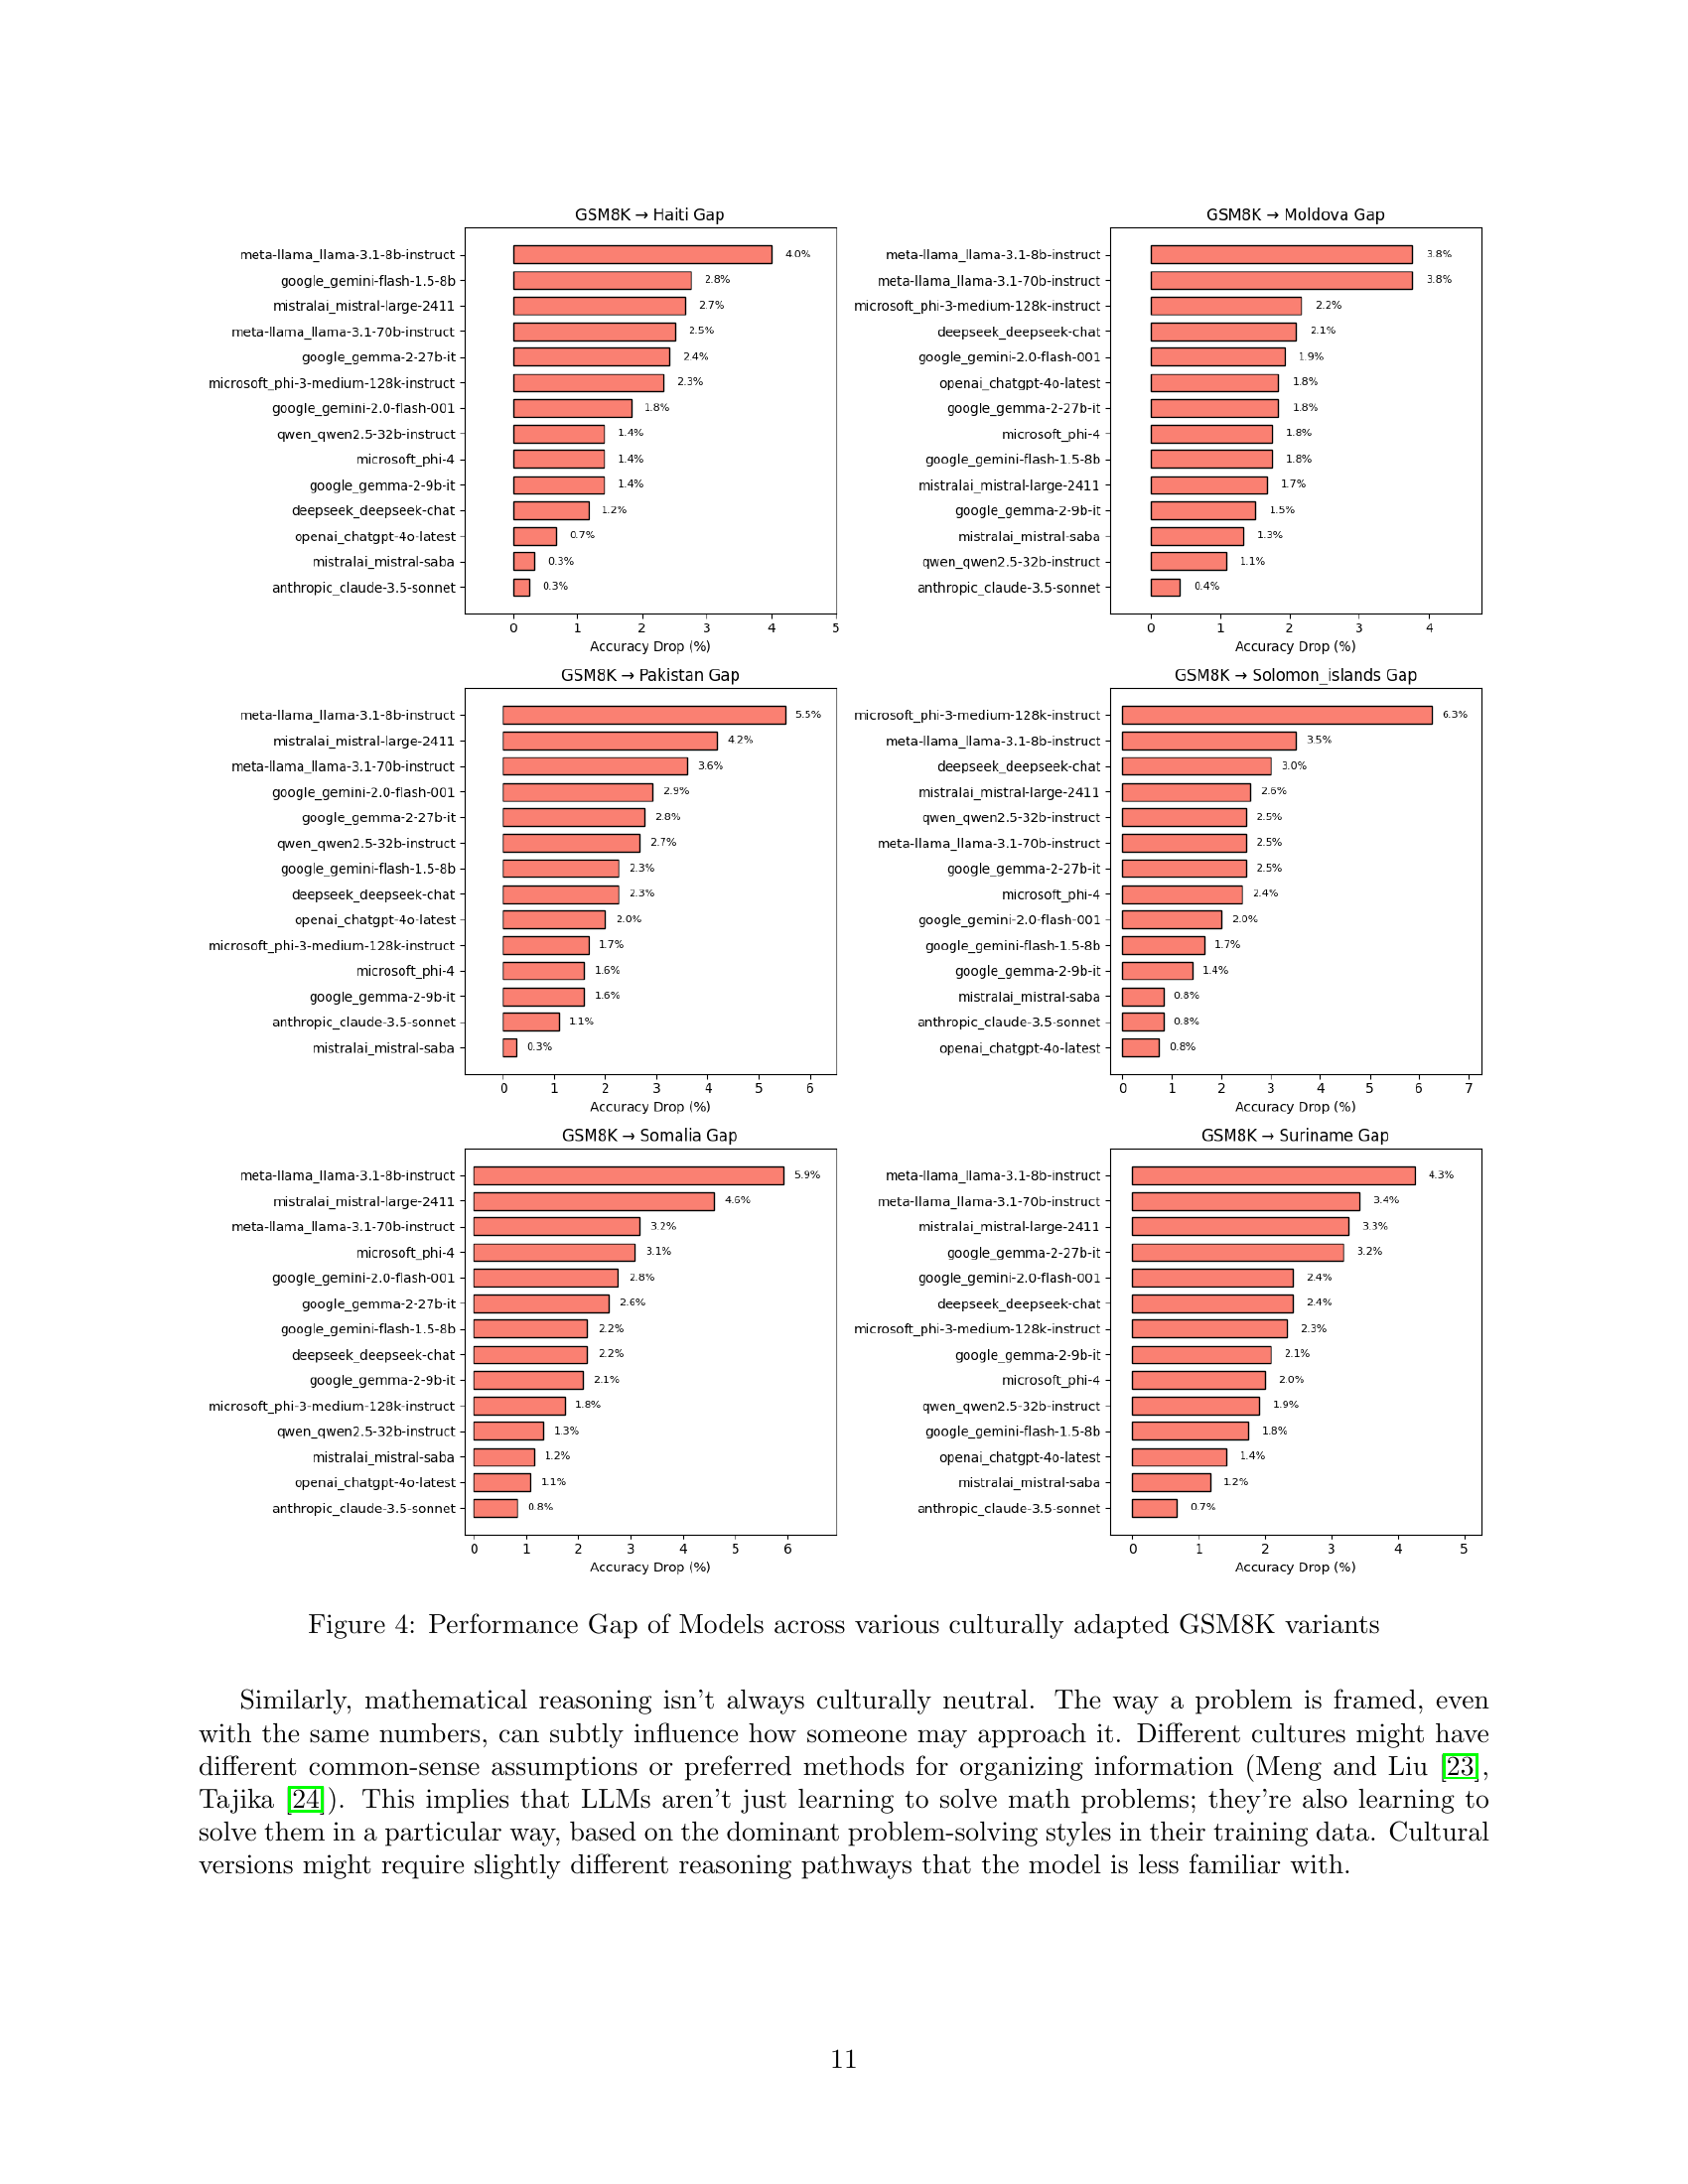
🔼 This figure presents a bar chart comparing the performance gap of various LLMs across different culturally adapted versions of the GSM8K dataset. The performance gap is calculated as the difference in accuracy between the original GSM8K dataset and its culturally adapted counterparts for each model. The chart visually represents how much each model’s accuracy decreases when faced with culturally adapted questions. This allows for a comparison of the models’ robustness and sensitivity to cultural variations in mathematical problem-solving.
read the caption
Figure 4: Performance Gap of Models across various culturally adapted GSM8K variants

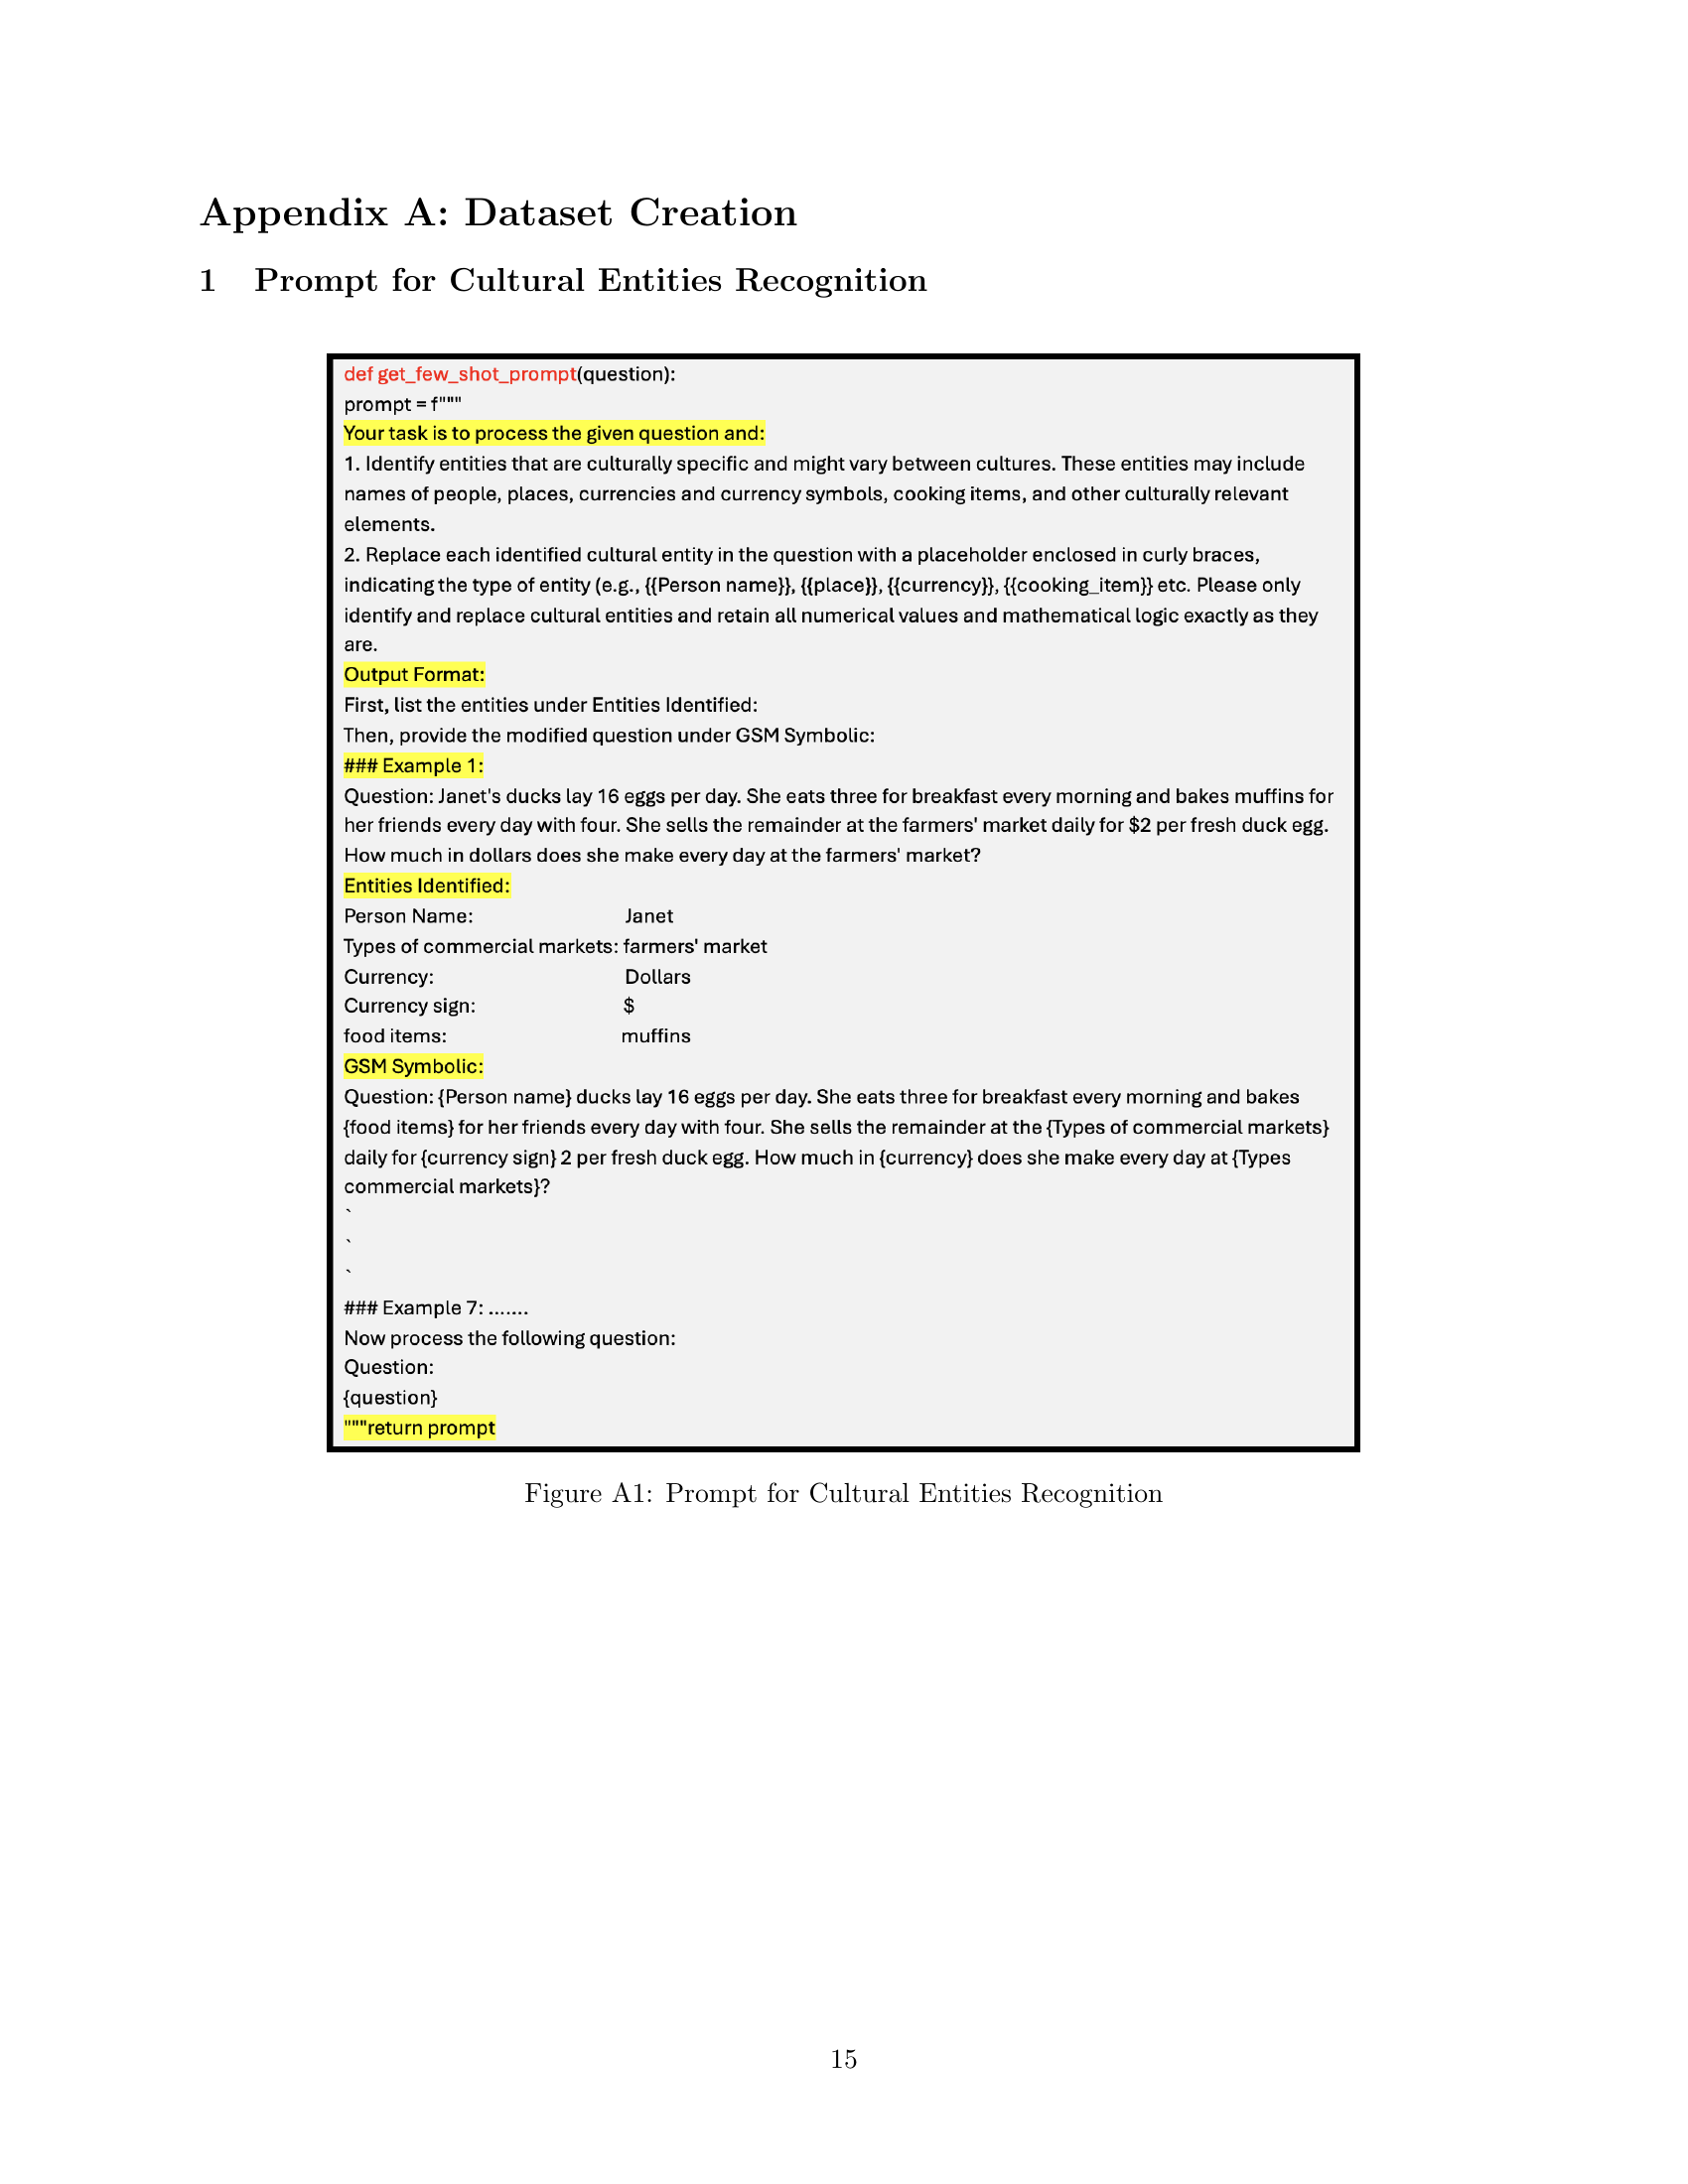
🔼 This figure shows the prompt used for the cultural entities recognition task. The prompt instructs the model to identify and replace culturally specific entities in a given question with placeholders while preserving the numerical values and mathematical logic. It provides two examples to illustrate the expected output format, which includes listing the entities and providing the modified question with placeholders.
read the caption
Figure A1: Prompt for Cultural Entities Recognition

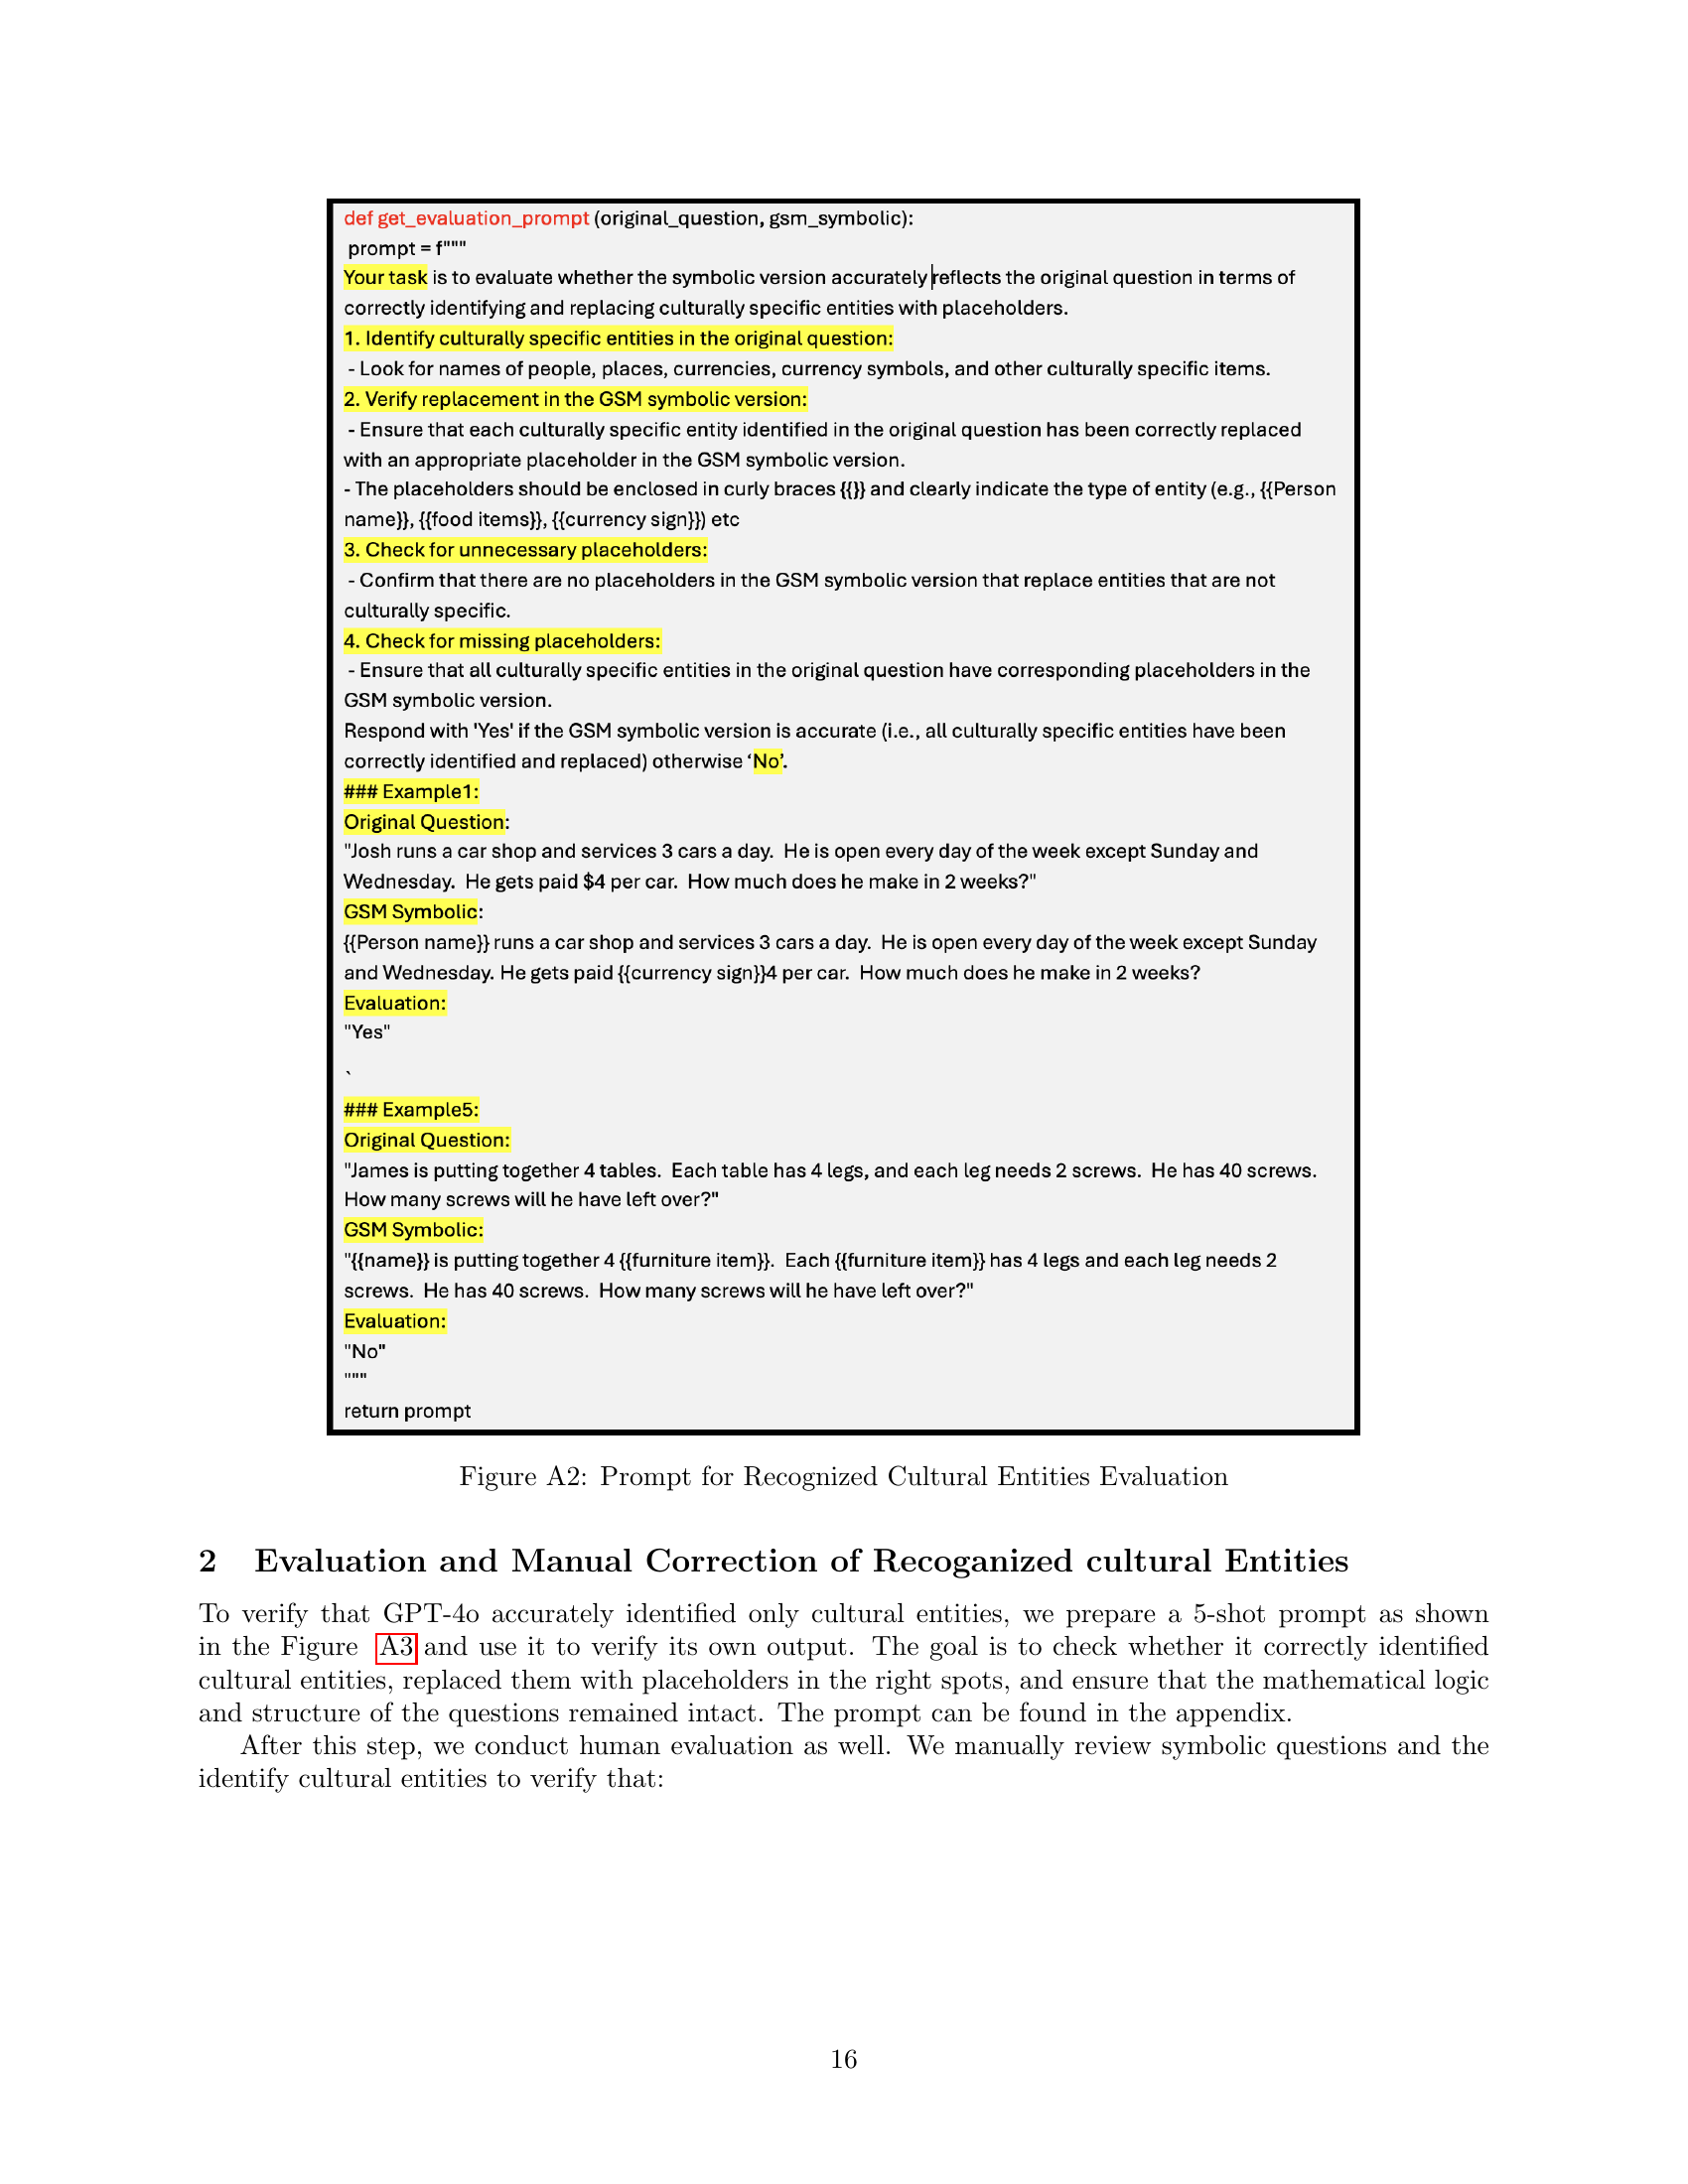
🔼 This figure displays the prompt used to evaluate whether GPT-40 correctly identified and replaced culturally specific entities with placeholders. The prompt provides examples of correctly and incorrectly identified entities to guide the evaluation. The evaluator determines if the GPT-40 output accurately reflects the original question by checking for correctly identified and replaced cultural entities and ensuring that no unnecessary or missing placeholders exist.
read the caption
Figure A2: Prompt for Recognized Cultural Entities Evaluation

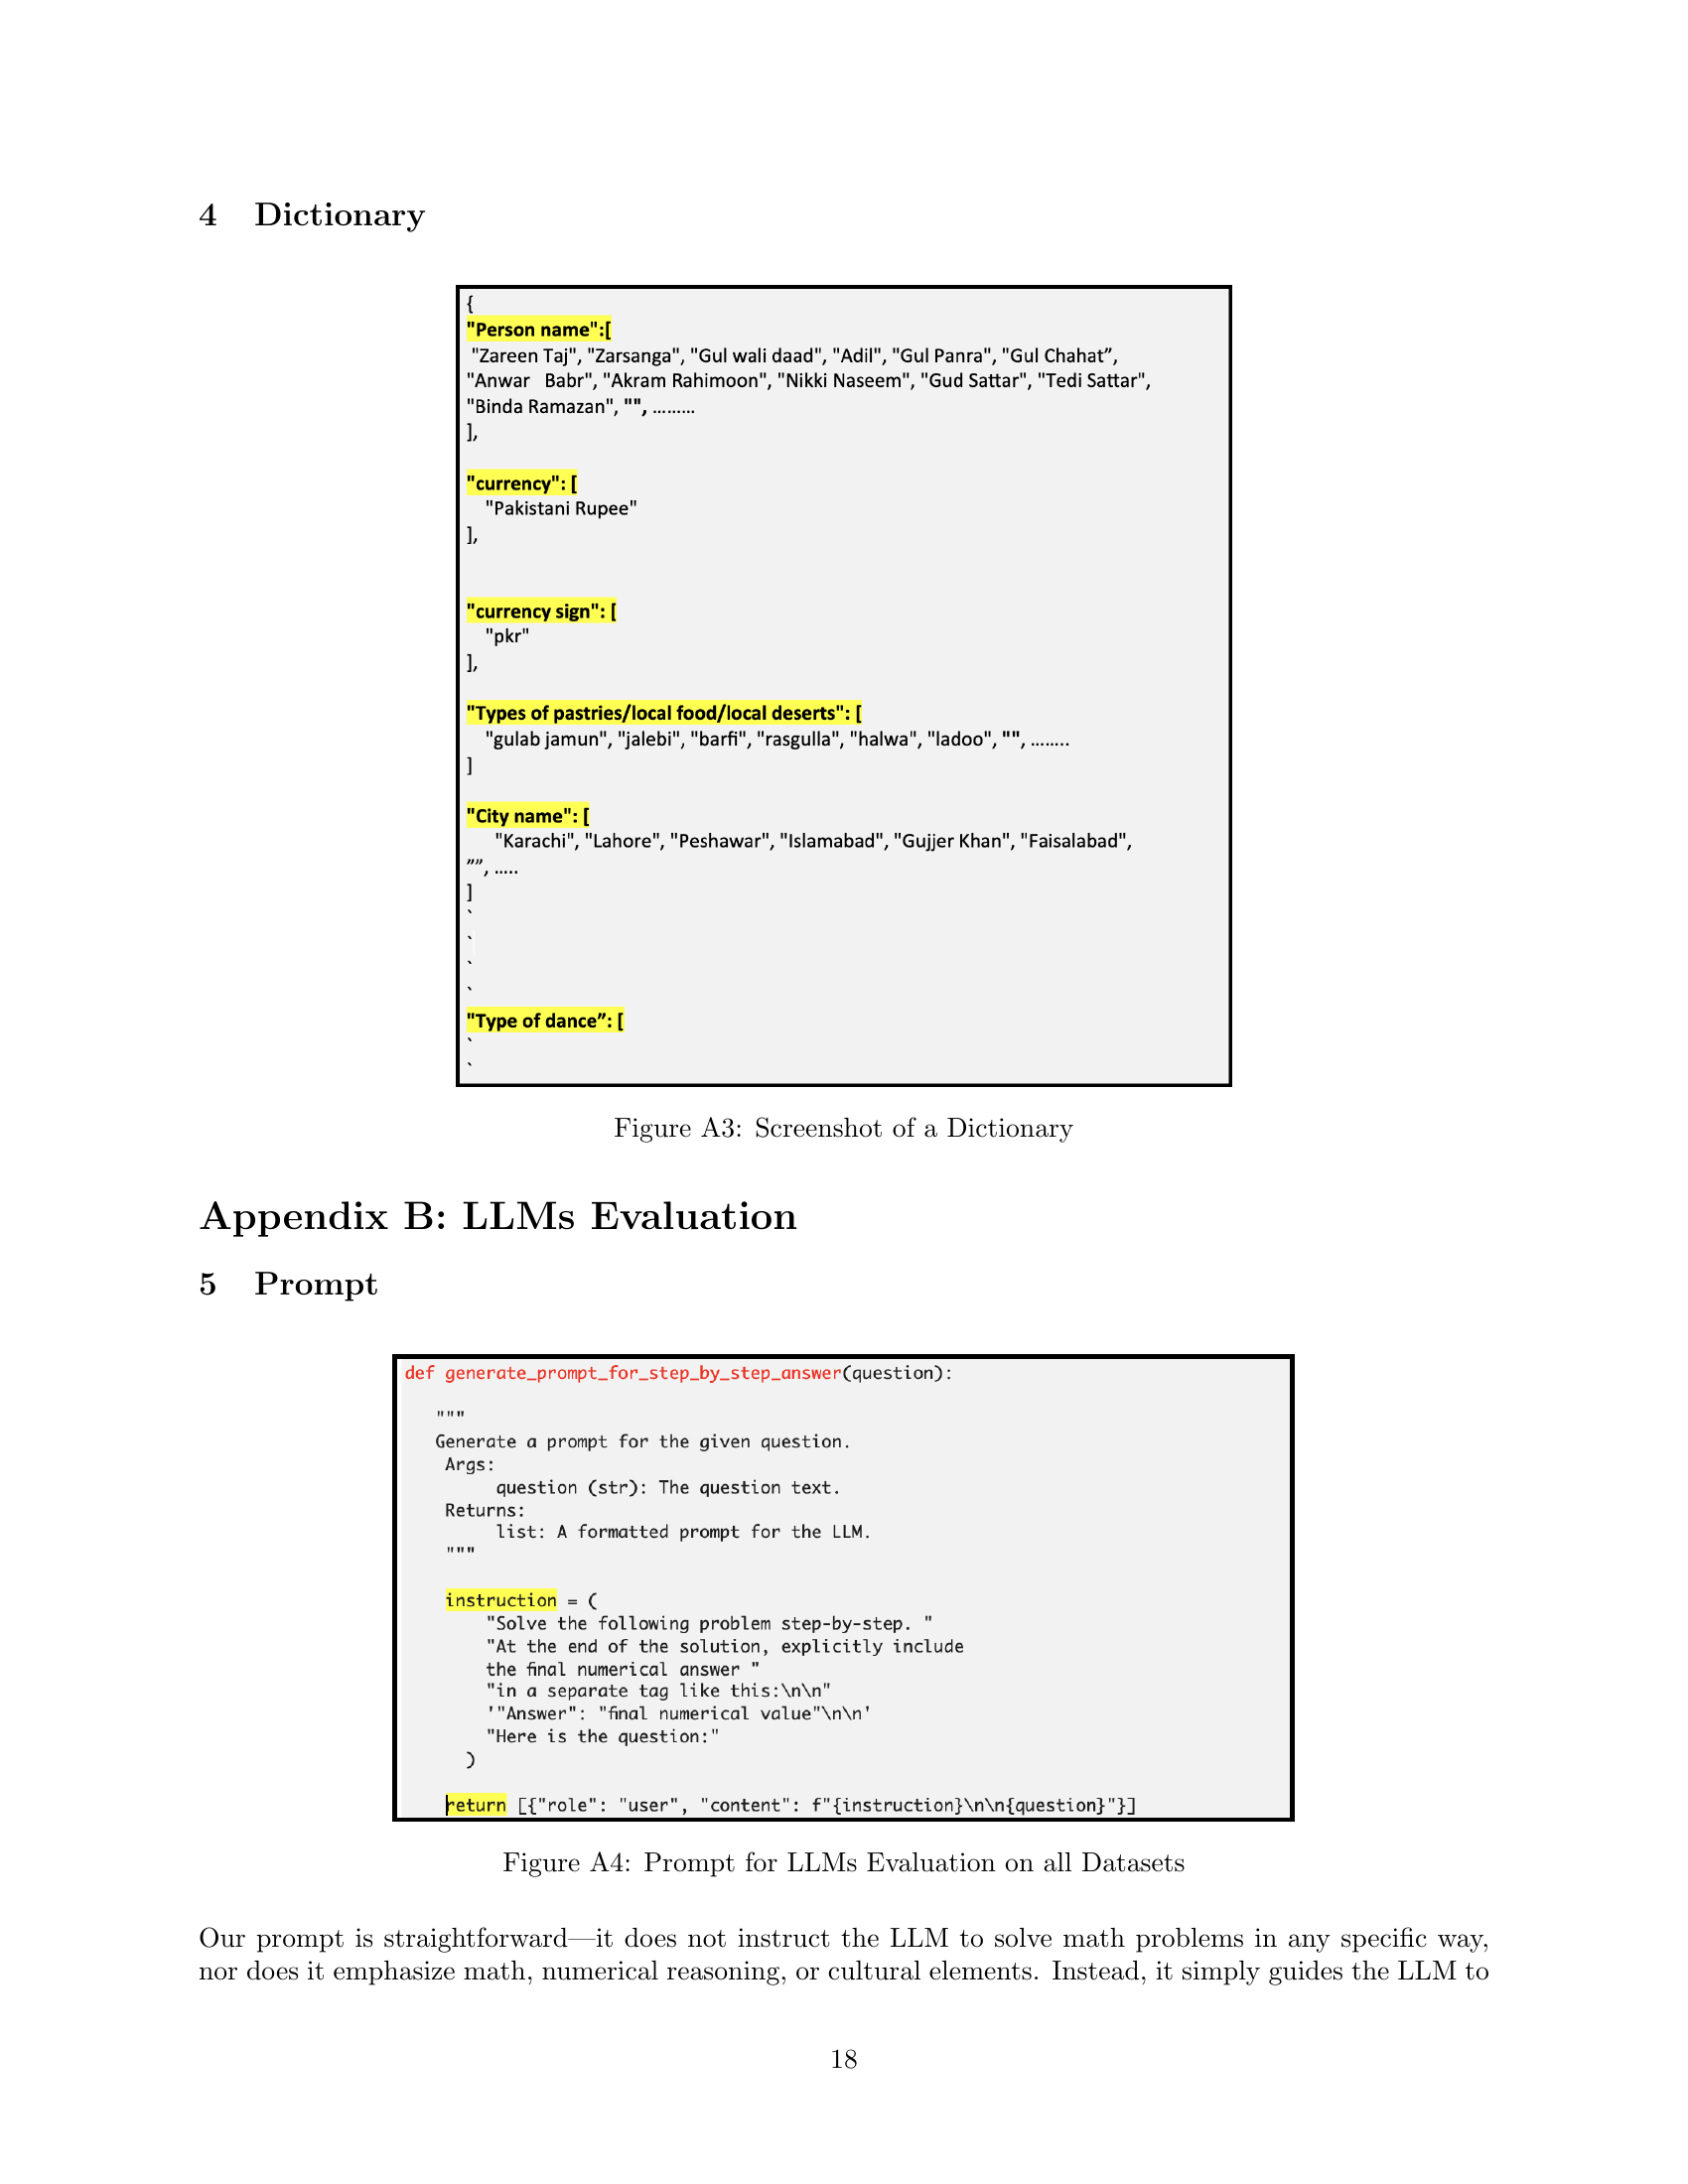
🔼 Figure A3 is a screenshot showing a snippet of the dictionary created for the cultural adaptation of the GSM8K dataset. The dictionary maps cultural entities (e.g., person names, food items, currencies) to their corresponding values specific to a given culture. This is a crucial component of the dataset creation process, ensuring that the substituted entities are relevant and contextually appropriate for the target culture.
read the caption
Figure A3: Screenshot of a Dictionary

🔼 This figure displays the prompt used for evaluating LLMs’ performance on all datasets in the study. The prompt instructs the LLMs to solve math problems step-by-step and to explicitly state the final numerical answer in a separate tag. This standardized prompt ensures consistency across all models and datasets, allowing for a fair comparison of their performance on both the original GSM8K dataset and its culturally adapted variants. The consistent format helps to isolate the impact of cultural adaptation on the LLM’s reasoning process, minimizing the influence of variations in prompt phrasing or instruction style.
read the caption
Figure A4: Prompt for LLMs Evaluation on all Datasets

🔼 This figure displays how the OpenAI tokenizer handles tokenization differently for an original English question from the GSM8K dataset and its culturally adapted Moldovan version. The only change made between the two questions is the replacement of names with culturally relevant names (Amalia, Megan, and Dior are replaced with Aleksandr, Nicolae, and Albert). Despite this minor change, the tokenization process yields a different number of tokens and characters. This difference highlights how subtle cultural adaptations can alter the model’s interpretation of the text, potentially influencing the overall reasoning process.
read the caption
Figure A5: Difference in Tokenization

🔼 Figure A6 showcases GPT-4’s reasoning process when solving a volume calculation problem, comparing its performance on two versions: the original GSM8K question and a culturally-adapted HaiGSM8K variant. The original GSM8K problem involves calculating the cost of filling a pool given its dimensions and the cost per cubic foot in US dollars. The HaiGSM8K version is identical in structure but uses Haitian Gourdes (HTG) instead of dollars. The figure highlights how GPT-4 correctly solves the GSM8K problem but makes an error in the HaiGSM8K version due to inconsistent interpretation of the decimal place value in the Haitian Gourde currency, showcasing the model’s sensitivity to cultural context and numerical representation differences.
read the caption
Figure A6: GPT-4o Reasoning

🔼 Figure A7 showcases GPT-4’s reasoning process for solving a culturally adapted math word problem from the HaiGSM8K dataset (Solomon Islands). It contrasts the model’s responses to the original GSM8K problem and its culturally adapted counterpart. The original problem involves calculating the cost of a trip involving plane tickets and hotel stays. In the adapted version, the cultural context is changed, replacing the ‘wife’ with ‘father-in-law’ and using the Solomon Islands currency (SBD). The figure highlights how the model’s approach and result change due to the cultural adaptation. Noteworthy is the difference in the hotel price calculation, demonstrating how cultural context influences the model’s understanding of the problem and impacts its final answer.
read the caption
Figure A7: GPT-4o Reasoning
More on tables
| Person name | currency |
| Types of pastries/local deserts | currency sign |
| City name | Types of commercial establishments |
| Types of houses | Types of dance |
| Types of goods merchant purchase | Types of common jobs |
| food items | clothing items |
| Common type of sport | Common brand name |
| cooking item | Types of events |
| Types of beverages | Common clothing items |
| Types of books | Types of vehicles |
| Types of places | animal |
| Recreation activity | Types of family events |
| types of shows | Village names |
| School subject | cultural event |
| Types of games | Types of flowers |
| family member | recreation places |
| Types of musical compositions | profession |
| Types of classes | holiday |
| company names | Types of teacher |
| restaurant name | cultural landmark |
| Mythical character | online shopping platforms |
| Types of entertainment places | cultural dance style |
| Government body | Types of scents |
| Cultural songs | school name |
| common places | Types of tea |
| appliances | newspaper names |
| religious place | Language |
| school subject |
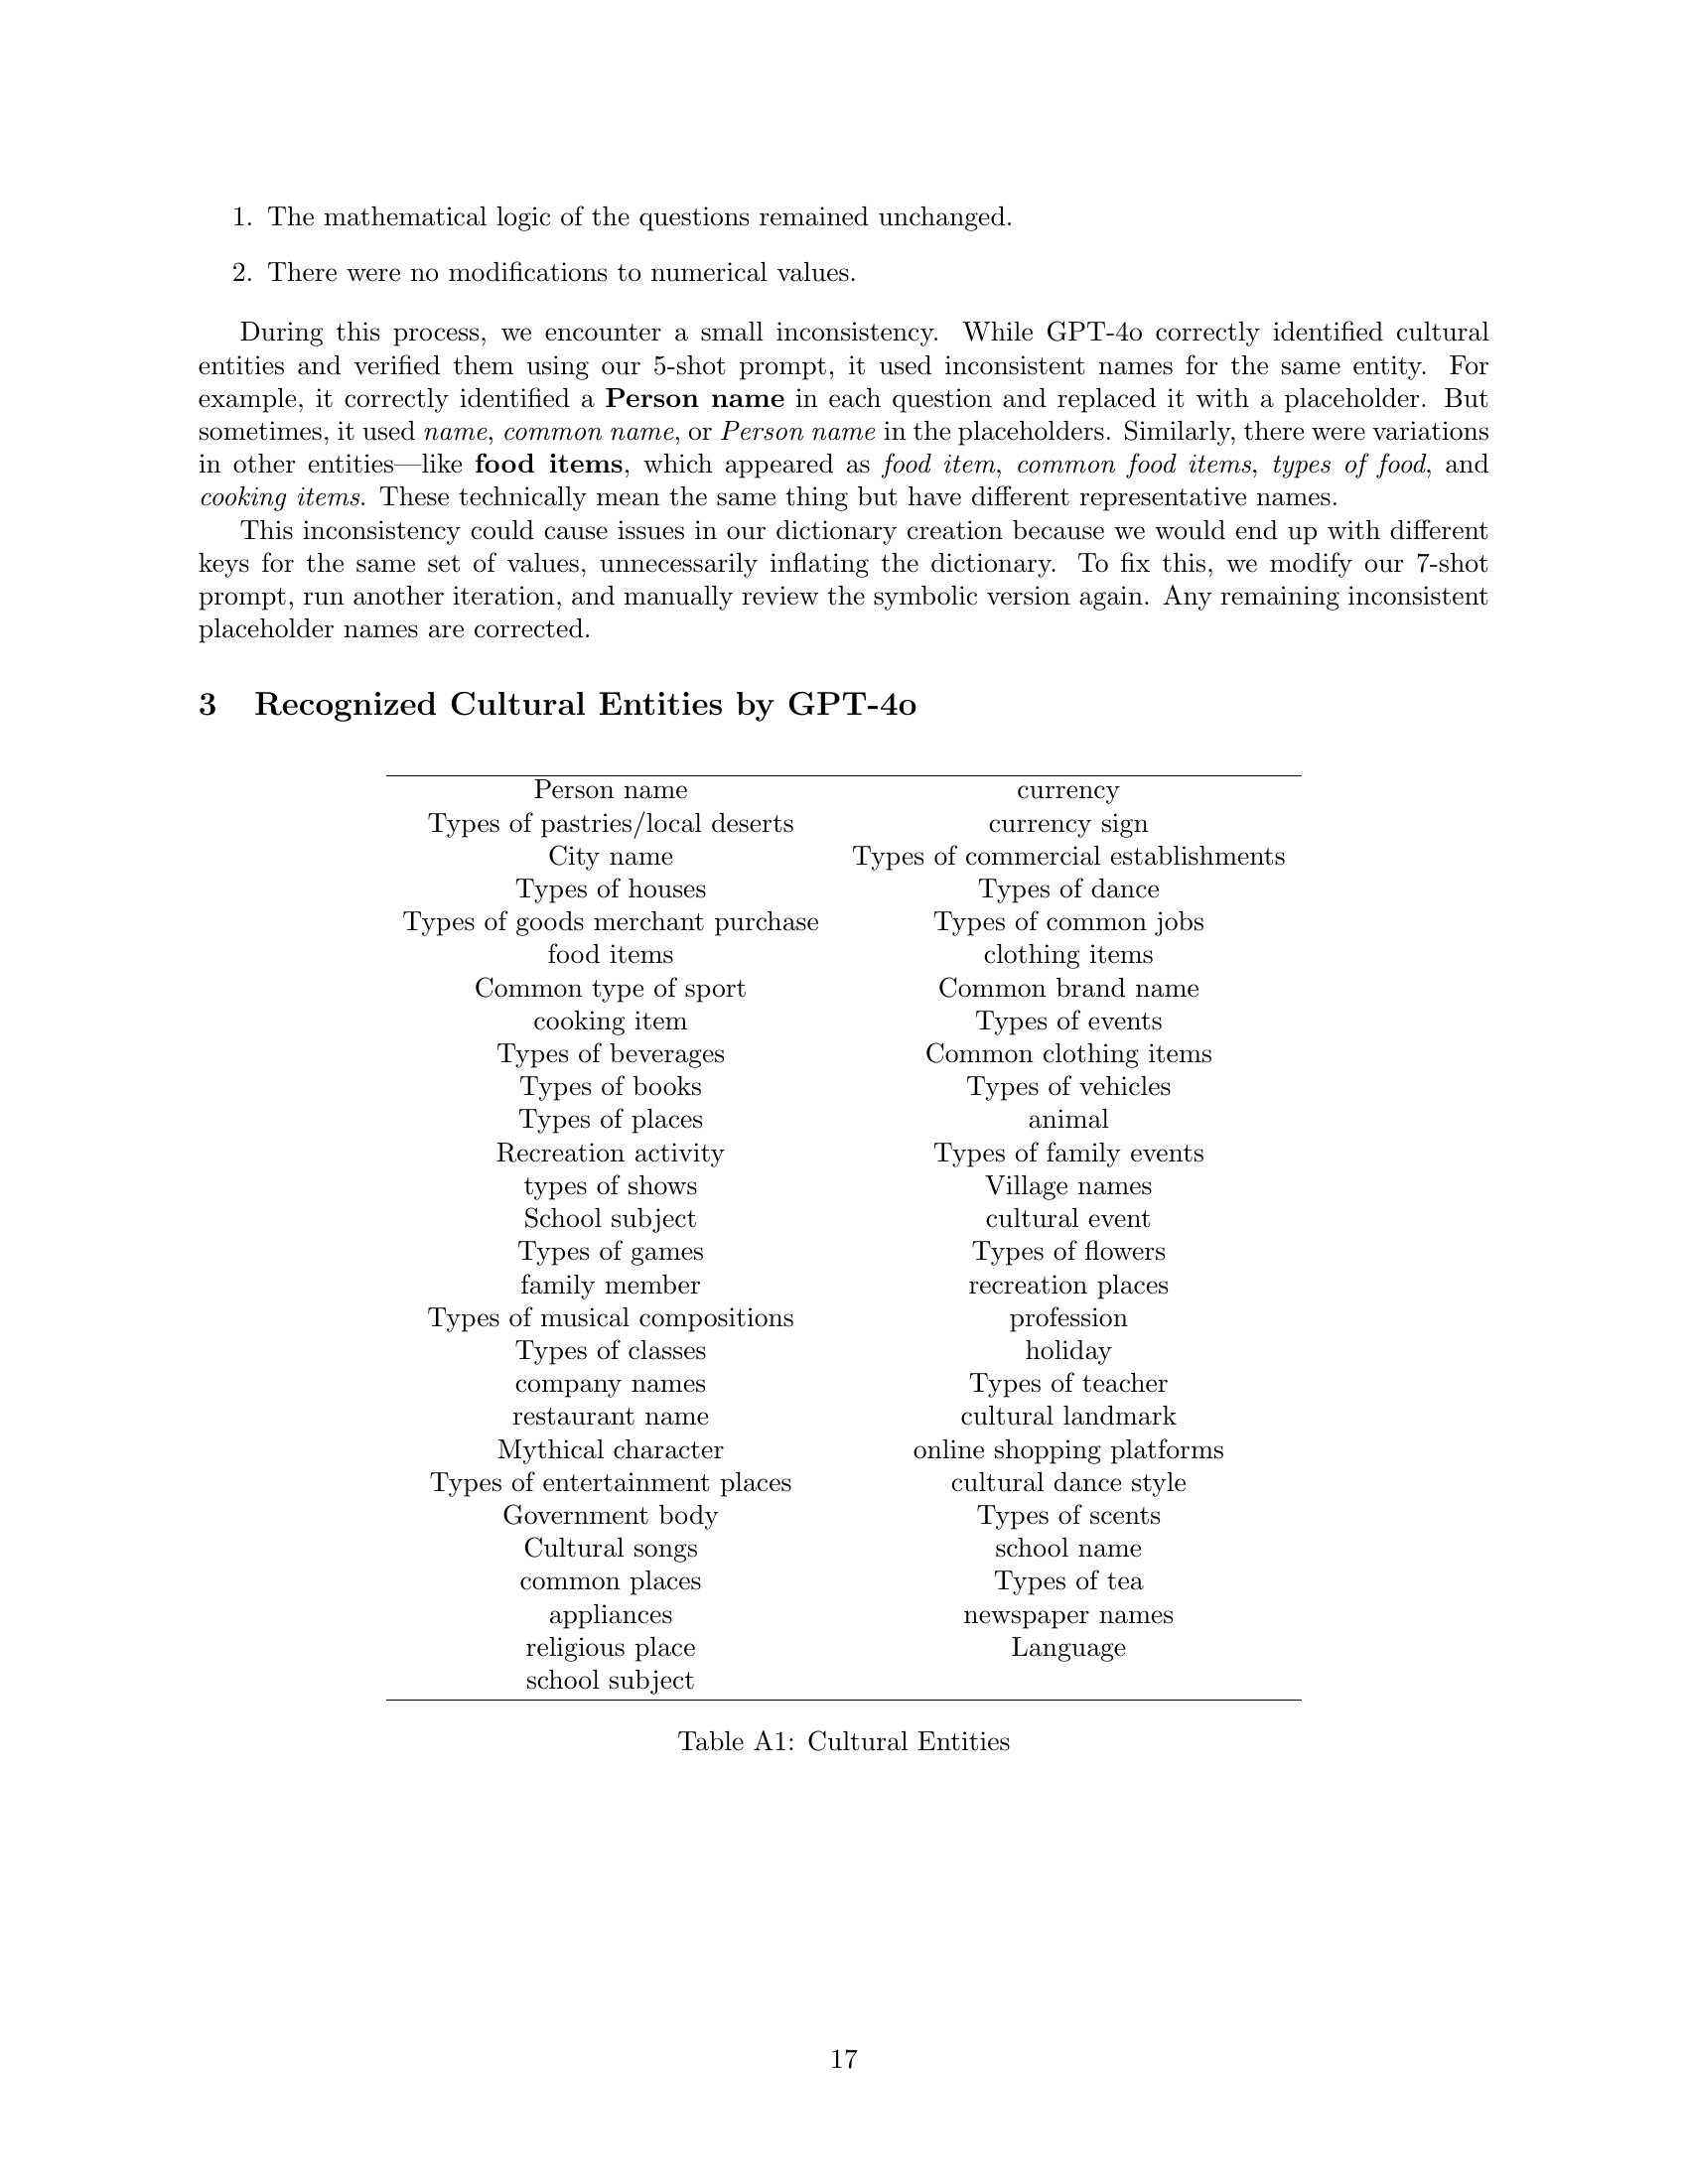
🔼 This table lists the cultural entities identified by GPT-40 during the dataset creation process. These entities represent various cultural elements that were systematically replaced with placeholders in the GSM8K dataset questions to create culturally diverse variations for evaluating LLMs’ mathematical reasoning abilities. The categories include person names, types of food, places, currency, jobs, and many more, reflecting a wide range of cultural aspects.
read the caption
Table A1: Cultural Entities
| Model | G8K | Hti | Mld | Pak | Sol | Som | Sur |
|---|---|---|---|---|---|---|---|
| C3.5 | 0.95 | 0.95 | 0.94 | 0.94 | 0.94 | 0.94 | 0.94 |
| (0.94-0.96) | (0.93-0.96) | (0.93-0.96) | (0.92-0.95) | (0.93-0.95) | (0.93-0.95) | (0.93-0.95) | |
| DSeek | 0.92 | 0.91 | 0.90 | 0.90 | 0.89 | 0.90 | 0.90 |
| (0.91-0.94) | (0.90-0.93) | (0.89-0.92) | (0.88-0.92) | (0.88-0.91) | (0.89-0.92) | (0.88-0.92) | |
| G2.0 | 0.94 | 0.92 | 0.92 | 0.91 | 0.92 | 0.91 | 0.91 |
| (0.92-0.95) | (0.90-0.93) | (0.90-0.93) | (0.89-0.92) | (0.90-0.93) | (0.89-0.93) | (0.90-0.93) | |
| G1.5 | 0.83 | 0.80 | 0.81 | 0.80 | 0.81 | 0.80 | 0.81 |
| (0.80-0.85) | (0.78-0.82) | (0.79-0.83) | (0.78-0.83) | (0.79-0.83) | (0.78-0.83) | (0.79-0.83) | |
| G27B | 0.86 | 0.84 | 0.85 | 0.84 | 0.84 | 0.84 | 0.83 |
| (0.84-0.88) | (0.82-0.86) | (0.82-0.86) | (0.81-0.86) | (0.82-0.86) | (0.82-0.86) | (0.81-0.85) | |
| G9B | 0.82 | 0.80 | 0.80 | 0.80 | 0.80 | 0.80 | 0.80 |
| (0.79-0.84) | (0.78-0.82) | (0.78-0.82) | (0.78-0.82) | (0.78-0.82) | (0.77-0.82) | (0.77-0.82) | |
| L70B | 0.91 | 0.89 | 0.87 | 0.87 | 0.89 | 0.88 | 0.88 |
| (0.89-0.93) | (0.87-0.90) | (0.85-0.89) | (0.86-0.89) | (0.87-0.90) | (0.86-0.90) | (0.86-0.89) | |
| L8B | 0.64 | 0.60 | 0.60 | 0.58 | 0.60 | 0.58 | 0.60 |
| (0.61-0.67) | (0.57-0.63) | (0.57-0.63) | (0.56-0.61) | (0.58-0.63) | (0.55-0.61) | (0.57-0.62) | |
| P3M | 0.77 | 0.75 | 0.75 | 0.75 | 0.71 | 0.75 | 0.75 |
| (0.75-0.79) | (0.72-0.77) | (0.72-0.77) | (0.73-0.78) | (0.68-0.73) | (0.73-0.78) | (0.72-0.77) | |
| P4 | 0.91 | 0.90 | 0.89 | 0.89 | 0.89 | 0.88 | 0.89 |
| (0.89-0.92) | (0.88-0.91) | (0.87-0.91) | (0.88-0.91) | (0.87-0.90) | (0.86-0.90) | (0.87-0.91) | |
| M2411 | 0.92 | 0.90 | 0.91 | 0.88 | 0.90 | 0.88 | 0.89 |
| (0.91-0.94) | (0.88-0.91) | (0.89-0.92) | (0.86-0.90) | (0.88-0.91) | (0.86-0.89) | (0.87-0.91) | |
| MSaba | 0.87 | 0.87 | 0.86 | 0.87 | 0.87 | 0.86 | 0.86 |
| (0.86-0.89) | (0.85-0.89) | (0.84-0.88) | (0.85-0.89) | (0.85-0.88) | (0.84-0.88) | (0.84-0.88) | |
| G4o | 0.93 | 0.93 | 0.91 | 0.91 | 0.93 | 0.92 | 0.92 |
| (0.92-0.95) | (0.91-0.94) | (0.90-0.93) | (0.90-0.93) | (0.91-0.94) | (0.91-0.94) | (0.90-0.93) | |
| Q32B | 0.91 | 0.89 | 0.90 | 0.88 | 0.88 | 0.89 | 0.89 |
| (0.89-0.92) | (0.87-0.91) | (0.88-0.91) | (0.86-0.90) | (0.86-0.90) | (0.88-0.91) | (0.87-0.90) |
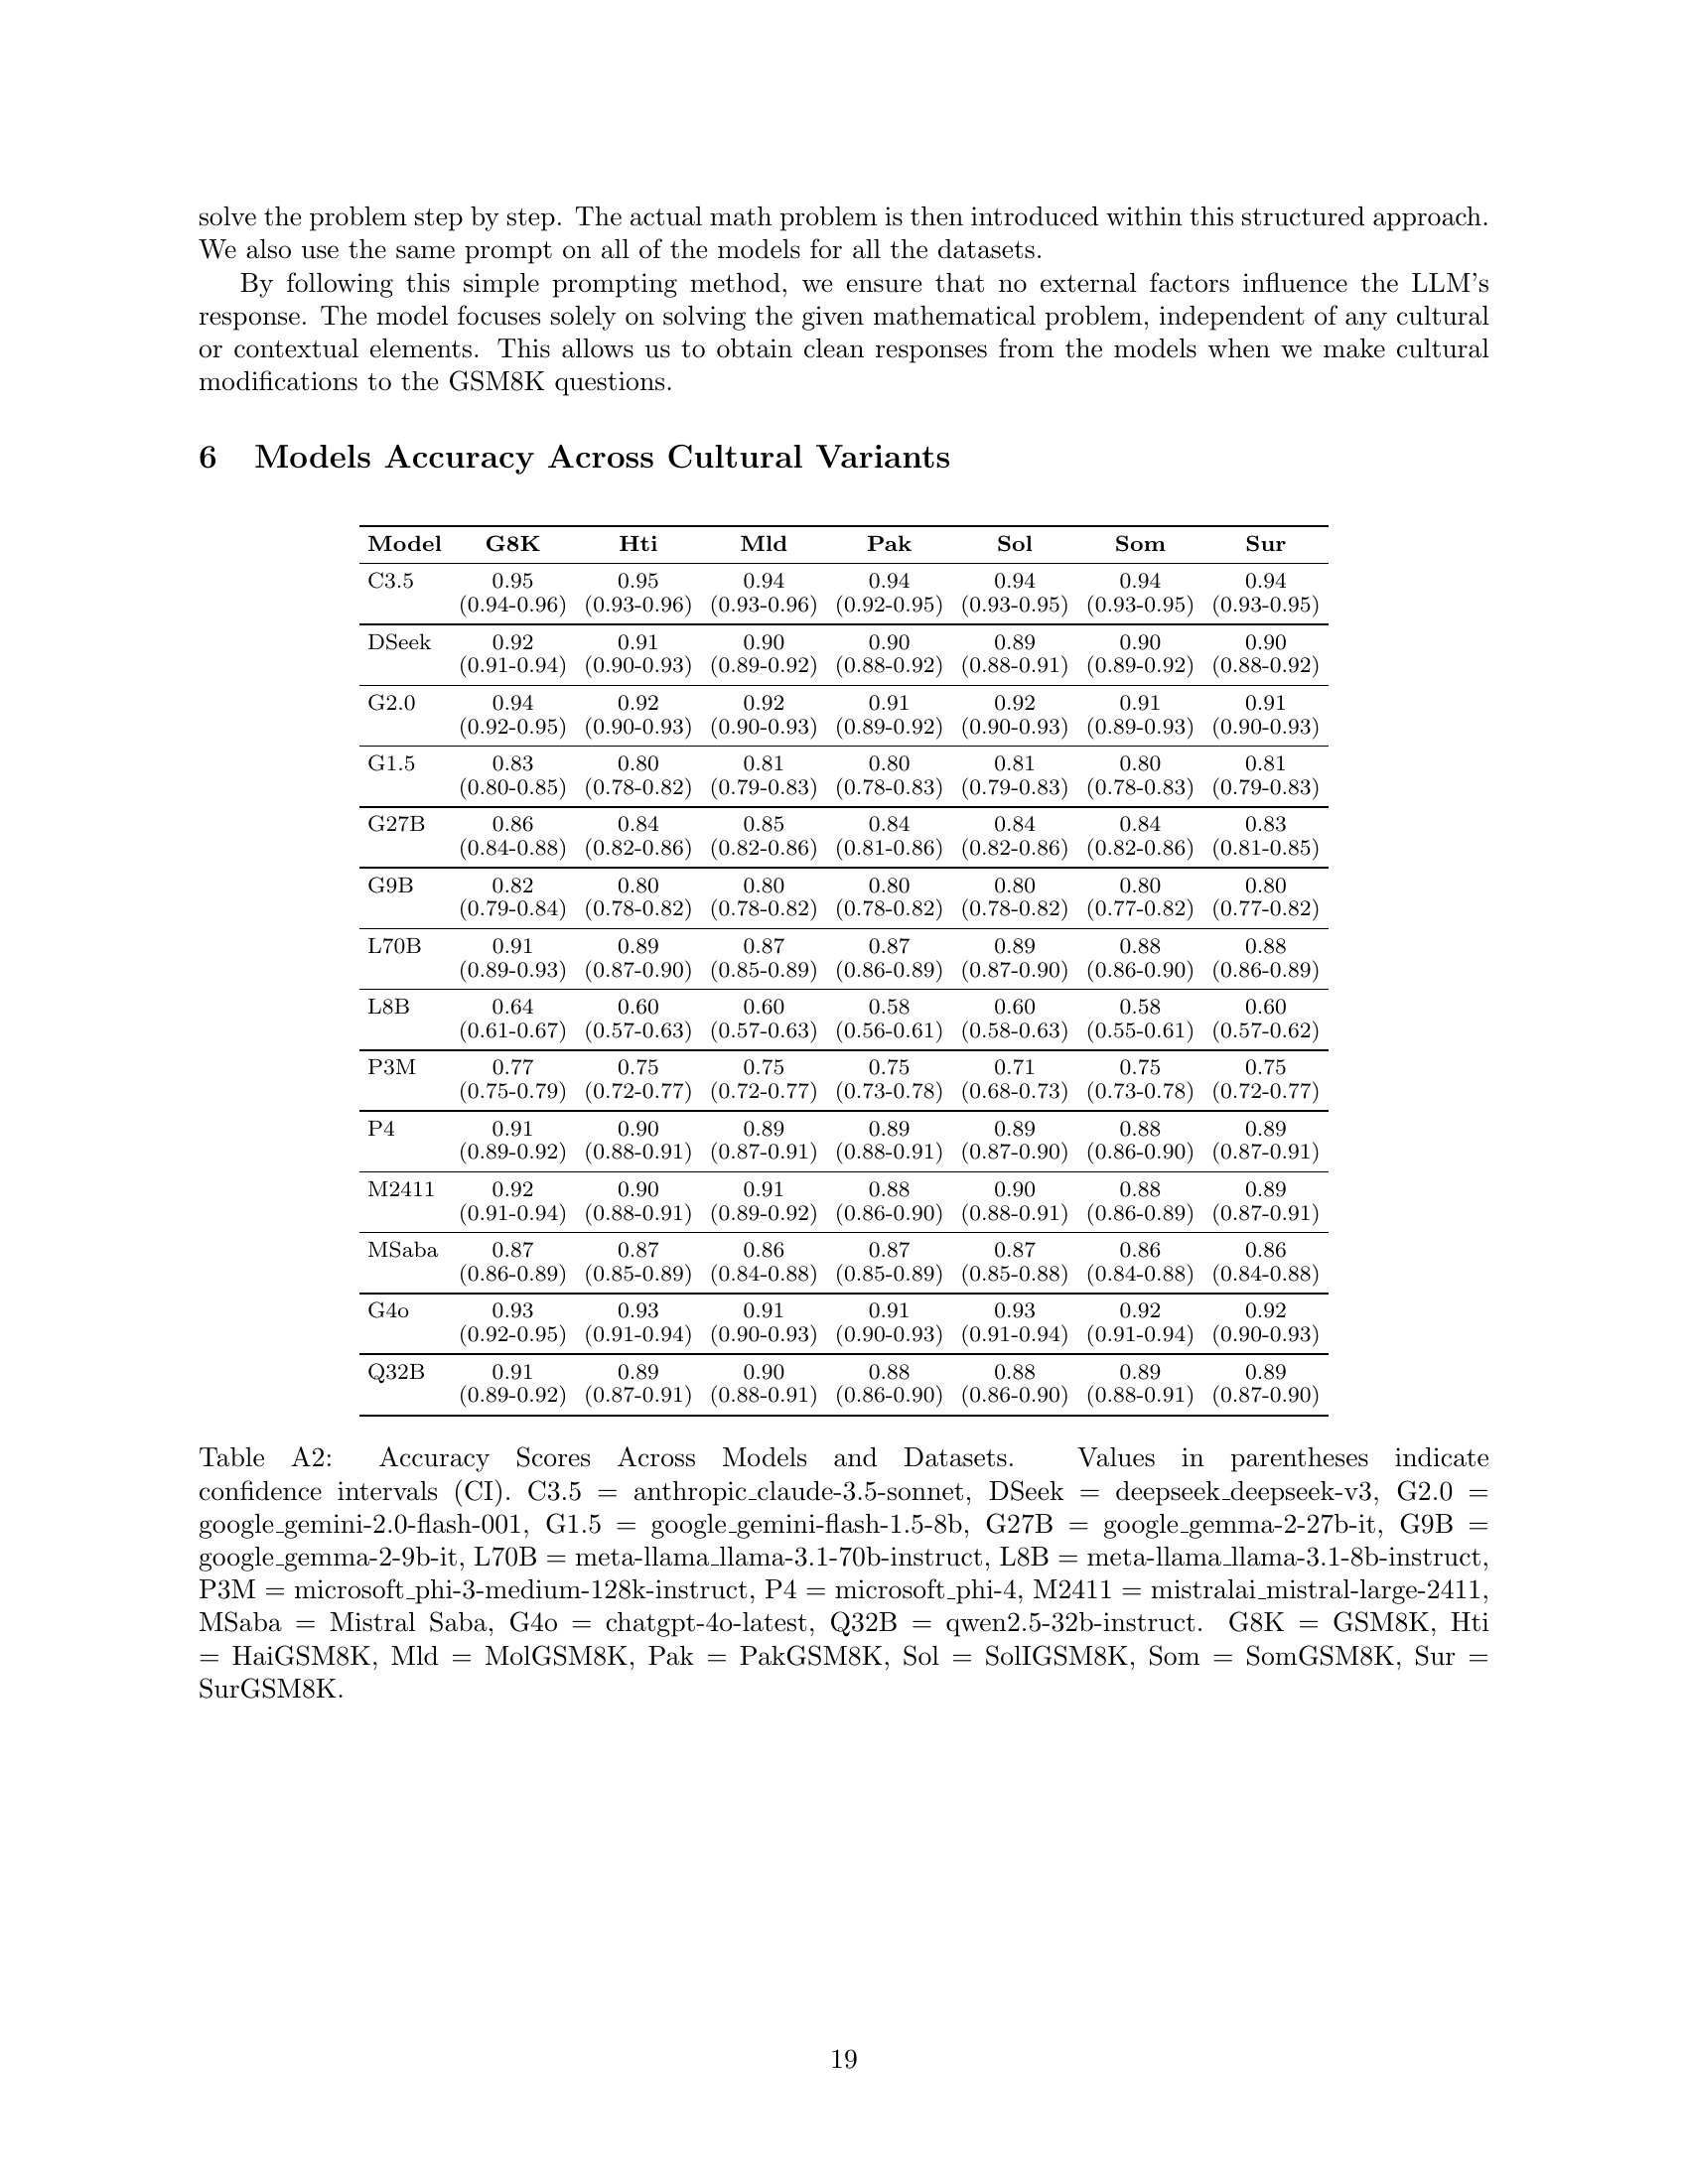
🔼 This table presents the accuracy scores of fourteen different large language models (LLMs) across seven datasets. The seven datasets consist of one original benchmark dataset (GSM8K) and six culturally adapted versions of that dataset, one for each of six selected continents (Haiti, Moldova, Pakistan, Solomon Islands, Somalia, and Suriname). The accuracy scores represent the percentage of correctly answered questions by each LLM for each dataset, considering only answers that are consistently correct across three attempts per question. The confidence intervals (CIs) provide a measure of uncertainty around the accuracy scores. The abbreviations used for LLMs and datasets are explained in the caption. This allows for the comparison of LLM performance in standard mathematical reasoning tasks versus tasks that require adapting to different cultural contexts.
read the caption
Table A2: Accuracy Scores Across Models and Datasets. Values in parentheses indicate confidence intervals (CI). C3.5 = anthropic_claude-3.5-sonnet, DSeek = deepseek_deepseek-v3, G2.0 = google_gemini-2.0-flash-001, G1.5 = google_gemini-flash-1.5-8b, G27B = google_gemma-2-27b-it, G9B = google_gemma-2-9b-it, L70B = meta-llama_llama-3.1-70b-instruct, L8B = meta-llama_llama-3.1-8b-instruct, P3M = microsoft_phi-3-medium-128k-instruct, P4 = microsoft_phi-4, M2411 = mistralai_mistral-large-2411, MSaba = Mistral Saba, G4o = chatgpt-4o-latest, Q32B = qwen2.5-32b-instruct. G8K = GSM8K, Hti = HaiGSM8K, Mld = MolGSM8K, Pak = PakGSM8K, Sol = SolIGSM8K, Som = SomGSM8K, Sur = SurGSM8K.
| Model | Hti Gap | Mld Gap | Pak Gap | Sol Gap | Som Gap | Sur Gap |
|---|---|---|---|---|---|---|
| Claude 3.5 | 0.0025 | 0.0042 | 0.0109 | 0.0083 | 0.0083 | 0.0067 |
| DeepSeek | 0.0117 | 0.0209 | 0.0225 | 0.0301 | 0.0217 | 0.0242 |
| Gemini 2.0 | 0.0184 | 0.0192 | 0.0292 | 0.0200 | 0.0275 | 0.0242 |
| Gemini 1.5 | 0.0275 | 0.0175 | 0.0225 | 0.0167 | 0.0217 | 0.0175 |
| Gemma 27B | 0.0242 | 0.0184 | 0.0275 | 0.0250 | 0.0259 | 0.0317 |
| Gemma 9B | 0.0142 | 0.0150 | 0.0159 | 0.0142 | 0.0209 | 0.0209 |
| LLaMA 70B | 0.0250 | 0.0376 | 0.0359 | 0.0250 | 0.0317 | 0.0342 |
| LLaMA 8B | 0.0401 | 0.0376 | 0.0551 | 0.0351 | 0.0593 | 0.0426 |
| Phi-3 Medium | 0.0234 | 0.0217 | 0.0167 | 0.0626 | 0.0175 | 0.0234 |
| Phi-4 | 0.0142 | 0.0175 | 0.0159 | 0.0242 | 0.0309 | 0.0200 |
| Mistral Large | 0.0267 | 0.0167 | 0.0417 | 0.0259 | 0.0459 | 0.0326 |
| Mistral Saba | 0.0033 | 0.0134 | 0.0025 | 0.0083 | 0.0117 | 0.0117 |
| ChatGPT-4o | 0.0067 | 0.0184 | 0.0200 | 0.0075 | 0.0109 | 0.0142 |
| Qwen 32B | 0.0142 | 0.0109 | 0.0267 | 0.0250 | 0.0134 | 0.0192 |
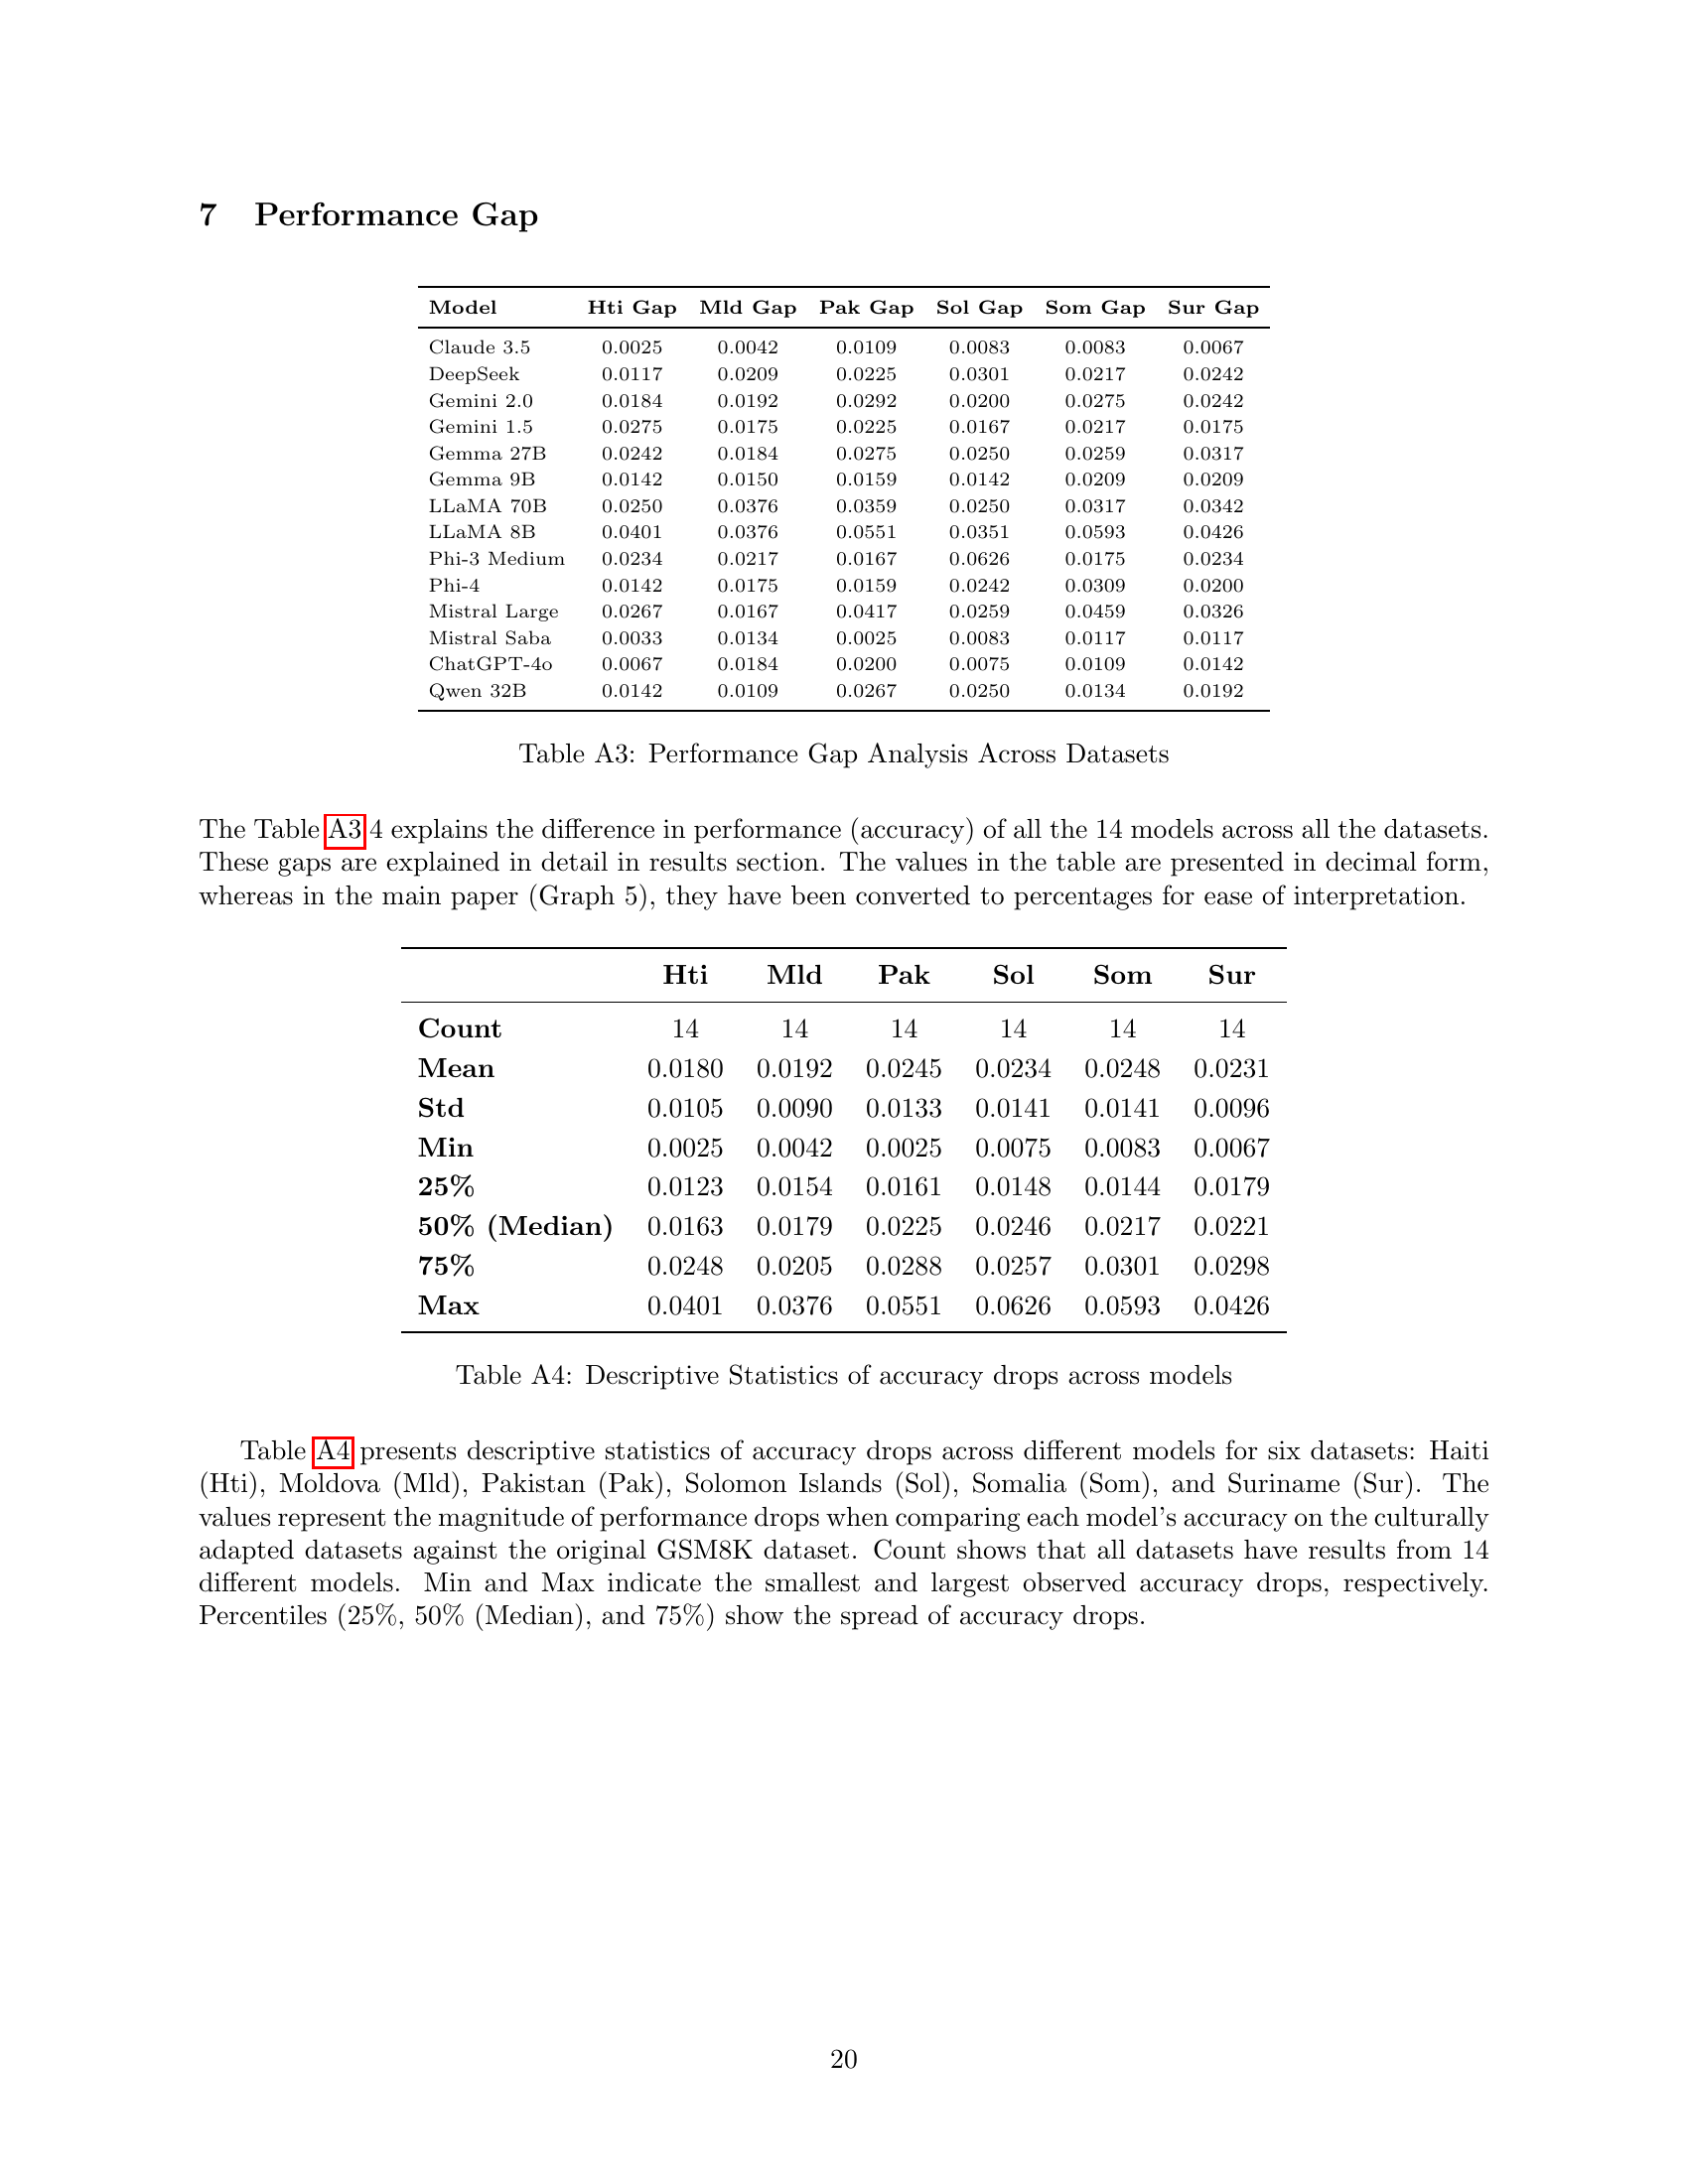
🔼 This table presents the performance gap between the original GSM8K dataset and its six culturally adapted versions for 14 different LLMs. The performance gap is calculated by subtracting the accuracy of each model on a culturally adapted version from its accuracy on the original GSM8K. A larger gap indicates that the model’s performance is more significantly affected by cultural adaptation. The table shows the gap for each model across six different datasets (Haiti, Moldova, Pakistan, Solomon Islands, Somalia, Suriname) and is useful for comparing how different LLMs handle cultural variations in mathematical reasoning problems.
read the caption
Table A3: Performance Gap Analysis Across Datasets
| Hti | Mld | Pak | Sol | Som | Sur | |
|---|---|---|---|---|---|---|
| Count | 14 | 14 | 14 | 14 | 14 | 14 |
| Mean | 0.0180 | 0.0192 | 0.0245 | 0.0234 | 0.0248 | 0.0231 |
| Std | 0.0105 | 0.0090 | 0.0133 | 0.0141 | 0.0141 | 0.0096 |
| Min | 0.0025 | 0.0042 | 0.0025 | 0.0075 | 0.0083 | 0.0067 |
| 25% | 0.0123 | 0.0154 | 0.0161 | 0.0148 | 0.0144 | 0.0179 |
| 50% (Median) | 0.0163 | 0.0179 | 0.0225 | 0.0246 | 0.0217 | 0.0221 |
| 75% | 0.0248 | 0.0205 | 0.0288 | 0.0257 | 0.0301 | 0.0298 |
| Max | 0.0401 | 0.0376 | 0.0551 | 0.0626 | 0.0593 | 0.0426 |
🔼 Table A4 presents descriptive statistics of accuracy drops across different models for six datasets. The values represent the magnitude of performance drops when comparing each model’s accuracy on the culturally adapted datasets against the original GSM8K dataset. ‘Count’ indicates the number of models evaluated for each dataset. ‘Mean’, ‘Std’, ‘Min’, ‘25%’, ‘50% (Median)’, and ‘75%’ show the central tendency, variability, and spread of the accuracy drops. ‘Max’ shows the largest observed accuracy drop.
read the caption
Table A4: Descriptive Statistics of accuracy drops across models
| Model | Hti | Mld | Pak | Sol | Som | Sur |
|---|---|---|---|---|---|---|
| Mistral Saba | 0.74933 | 0.12929 | 0.83585 | 0.36820 | 0.19335 | 0.17498 |
| (46,42) | (57,41) | (48,45) | (55,45) | (57,43) | (53,39) | |
| Gem Flash 1.5-8B | 0.00293∗∗∗ | 0.06171∗ | 0.01773∗∗ | 0.08241∗ | 0.01988∗∗ | 0.06399∗ |
| (75,42) | (68,47) | (74,47) | (70,50) | (71,45) | (69,48) | |
| Gemma 2-27B | 0.00346∗∗∗ | 0.01832∗∗ | 0.00119∗∗∗ | 0.00288∗∗∗ | 0.00152∗∗∗ | 0.00021∗∗∗ |
| (61,32) | (51,29) | (66,33) | (63,33) | (61,30) | (70,32) | |
| LLaMA 3.1-70B | 0.00231∗∗∗ | 0.00001∗∗∗ | 0.00003∗∗∗ | 0.00423∗∗∗ | 0.00018∗∗∗ | 0.00007∗∗∗ |
| (61,31) | (75,30) | (73,30) | (67,37) | (69,31) | (72,31) | |
| Gemma 2-9B | 0.16826 | 0.10461 | 0.10420 | 0.15212 | 0.04588∗∗ | 0.04140∗∗ |
| (76,59) | (64,46) | (71,52) | (71,54) | (85,60) | (82,57) | |
| Phi-4 | 0.06037∗ | 0.02203∗∗ | 0.05025∗ | 0.00169∗∗∗ | 0.00016∗∗∗ | 0.00631∗∗∗ |
| (45,28) | (49,28) | (52,33) | (55,26) | (65,28) | (48,24) | |
| DeepSeek | 0.14564 | 0.00804∗∗∗ | 0.00280∗∗∗ | 0.00016∗∗∗ | 0.00734∗∗∗ | 0.00169∗∗∗ |
| (47,33) | (54,29) | (52,25) | (62,26) | (57,31) | (55,26) | |
| Gem Flash 2.0 | 0.00094∗∗∗ | 0.00061∗∗∗ | 0.00000∗∗∗ | 0.00027∗∗∗ | 0.00000∗∗∗ | 0.00002∗∗∗ |
| (32,10) | (33,10) | (46,11) | (33,9) | (41,8) | (38,9) | |
| Phi-3 Medium | 0.08496∗ | 0.10346 | 0.20416 | 0.00000∗∗∗ | 0.18424 | 0.07479∗ |
| (137,109) | (131,105) | (122,102) | (161,86) | (124,103) | (129,101) | |
| Mistral Large | 0.00031∗∗∗ | 0.03079∗∗ | 0.00000∗∗∗ | 0.00117∗∗∗ | 0.00000∗∗∗ | 0.00002∗∗∗ |
| (54,22) | (49,29) | (66,16) | (59,28) | (75,20) | (61,22) | |
| ChatGPT-4o | 0.33175 | 0.00535∗∗∗ | 0.00427∗∗∗ | 0.27168 | 0.11116 | 0.02701∗∗ |
| (30,22) | (40,18) | (45,21) | (31,22) | (35,22) | (35,18) | |
| Qwen 2.5-32B | 0.06755∗ | 0.19276 | 0.00111∗∗∗ | 0.00161∗∗∗ | 0.10523 | 0.02202∗∗ |
| (47,30) | (49,36) | (62,30) | (58,28) | (51,35) | (58,35) | |
| Claude 3.5 | 0.74283 | 0.47313 | 0.06599∗ | 0.09874∗ | 0.14331 | 0.24298 |
| (20,17) | (18,13) | (28,15) | (20,10) | (24,14) | (22,14) | |
| LLaMA 3.1-8B | 0.00674∗∗∗ | 0.00879∗∗∗ | 0.00017∗∗∗ | 0.01628∗∗ | 0.00005∗∗∗ | 0.00242∗∗∗ |
| (175,127) | (164,119) | (184,118) | (167,125) | (185,114) | (162,111) |
🔼 Table A5 presents the results of McNemar’s Test, a statistical method used to compare the accuracy of different language models across various datasets. Specifically, it examines whether the accuracy changes significantly when using culturally adapted versions of the questions compared to the original questions. The p-values indicate the statistical significance of the difference in accuracy between these two sets of questions. Lower p-values (p < 0.01, p < 0.05) denote statistically significant changes in accuracy, indicating that the models’ performance is affected by the cultural adaptations. The (b,c) values show the counts of cases where the model is correct/incorrect on the original dataset and its culturally adapted version, providing insights into the nature of the accuracy differences.
read the caption
Table A5: McNemar Test Results for Model Performance Across Datasets. Values represent p-values (rounded to 5 decimal places). Significance: p∗<0.10superscript𝑝0.10{}^{*}p<0.10start_FLOATSUPERSCRIPT ∗ end_FLOATSUPERSCRIPT italic_p < 0.10, p∗∗<0.05superscript𝑝absent0.05{}^{**}p<0.05start_FLOATSUPERSCRIPT ∗ ∗ end_FLOATSUPERSCRIPT italic_p < 0.05, p∗∗∗<0.01superscript𝑝absent0.01{}^{***}p<0.01start_FLOATSUPERSCRIPT ∗ ∗ ∗ end_FLOATSUPERSCRIPT italic_p < 0.01. (b,c) values in parentheses.
Full paper#