TL;DR#
Diffusion models struggle with high-resolution image generation, often leading to distortions or content repetition. Reference-based methods guide generation using upsampled references but face issues: latent space upsampling causes manifold deviation, degrading quality, while RGB space upsampling produces overly smooth results. This requires novel frameworks to mitigate these problems.
LSRNA is introduced, combining Latent space SR (LSR) for manifold alignment with Region-wise Noise Addition (RNA) to enhance details. LSR maps low-resolution latent representations onto higher-resolution manifolds, and RNA adaptively injects Gaussian noise into upsampled reference latents. Experiments demonstrate that LSRNA outperforms state-of-the-art methods, preserves detail, and accelerates generation.
Key Takeaways#
Why does it matter?#
This paper introduces LSRNA, which effectively combines latent space SR and region-wise noise addition. It addresses the challenges of high-resolution image generation, offering faster speeds, detail enhancement, and manifold alignment, paving the way for future advancements in diffusion models.
Visual Insights#

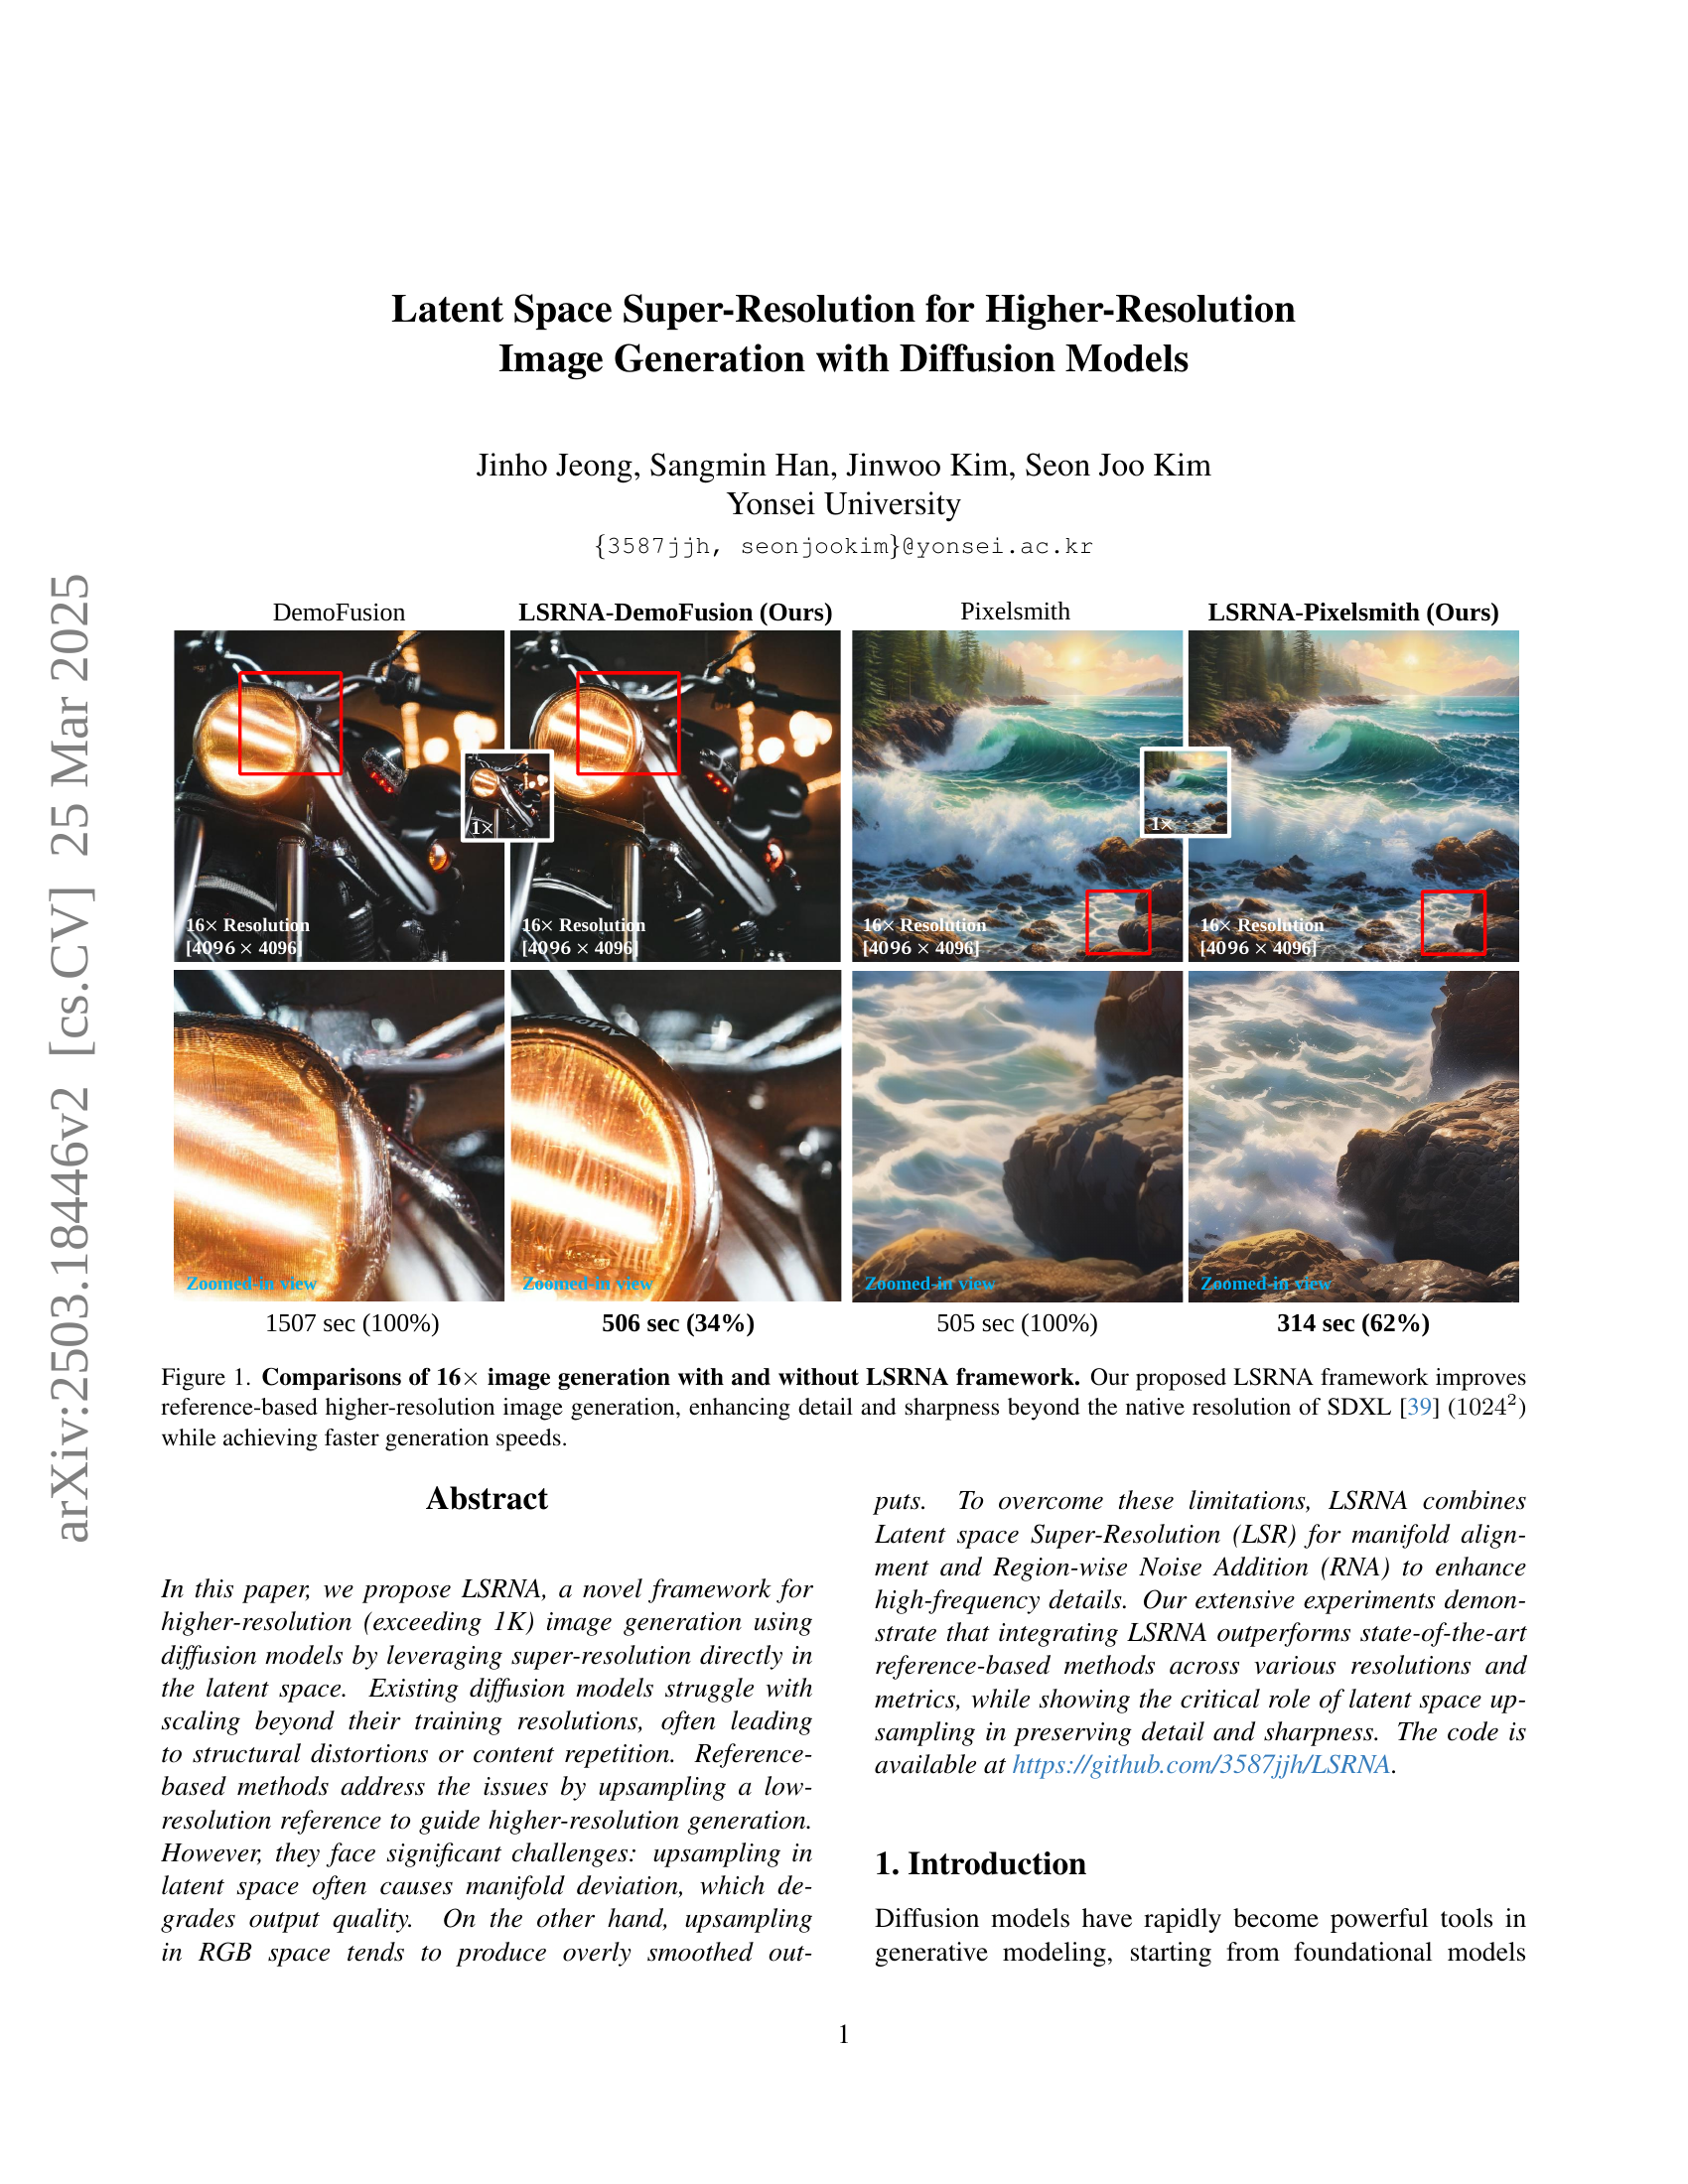
🔼 This figure demonstrates the improved performance of the LSRNA framework in generating higher-resolution images compared to existing methods. It shows four image pairs: two generated using reference-based methods (DemoFusion and Pixelsmith) without LSRNA, and two generated with the LSRNA framework integrated into DemoFusion and Pixelsmith. The LSRNA-enhanced images exhibit significantly improved detail and sharpness, exceeding the native 1024x1024 resolution of the SDXL diffusion model. Furthermore, the generation times are considerably faster for the LSRNA-enhanced images.
read the caption
Figure 1: Comparisons of 16×\times× image generation with and without LSRNA framework. Our proposed LSRNA framework improves reference-based higher-resolution image generation, enhancing detail and sharpness beyond the native resolution of SDXL [39] (10242superscript102421024^{2}1024 start_POSTSUPERSCRIPT 2 end_POSTSUPERSCRIPT) while achieving faster generation speeds.
| Resolution | Method | FID (↓) | KID (↓) | pFID (↓) | pKID (↓) | IS (↑) | CLIP (↑) | Time (sec) |
|---|---|---|---|---|---|---|---|---|
| SDXLBSRGAN [58] | 84.32 | 0.0080 | 39.71 | 0.0090 | 30.11 | 0.303 | 16 | |
| SDXL (Direct) [39] | 113.19 | 0.0222 | 64.20 | 0.0198 | 19.13 | 0.294 | 80 | |
| ScaleCrafter [19] | 91.76 | 0.0103 | 45.60 | 0.0106 | 29.09 | 0.301 | 101 | |
| FouriScale [25] | 104.30 | 0.0175 | 57.00 | 0.0167 | 23.90 | 0.300 | 134 | |
| HiDiffusion [61] | 90.23 | 0.0106 | 43.76 | 0.0099 | 27.17 | 0.299 | 50 | |
| \cdashline2-9 | Self-Cascade [17] | 83.50 | 0.0064 | 36.44 | 0.0070 | 31.56 | 0.305 | 90 |
| DemoFusion [13] | 85.02 | 0.0079 | 38.96 | 0.0087 | 32.54 | 0.302 | 205 | |
| LSRNA-DemoFusion (Ours) | 83.58 | 0.0077 | 36.55 | 0.0069 | 31.74 | 0.303 | 115 | |
| Pixelsmith [55] | 85.40 | 0.0091 | 39.51 | 0.0087 | 30.84 | 0.304 | 126 | |
| 20482048 | LSRNA-Pixelsmith (Ours) | 83.90 | 0.0079 | 37.33 | 0.0074 | 30.75 | 0.302 | 86 |
| SDXLBSRGAN [58] | 80.71 | 0.0058 | 39.81 | 0.0122 | 25.95 | 0.294 | 17 | |
| SDXL (Direct) [39] | 134.57 | 0.0370 | 71.73 | 0.0230 | 12.57 | 0.276 | 245 | |
| ScaleCrafter [19] | 93.32 | 0.0142 | 43.35 | 0.0130 | 23.12 | 0.288 | 419 | |
| HiDiffusion [61] | 101.10 | 0.0177 | 51.66 | 0.0158 | 21.90 | 0.283 | 129 | |
| \cdashline2-9 | Self-Cascade [17] | 78.34 | 0.0042 | 34.40 | 0.0076 | 25.93 | 0.294 | 210 |
| DemoFusion [13] | 83.63 | 0.0072 | 38.64 | 0.0082 | 27.74 | 0.294 | 648 | |
| LSRNA-DemoFusion (Ours) | 80.53 | 0.0057 | 33.31 | 0.0064 | 27.17 | 0.297 | 223 | |
| Pixelsmith [55] | 81.21 | 0.0069 | 40.86 | 0.0108 | 25.59 | 0.294 | 232 | |
| 20484096 | LSRNA-Pixelsmith (Ours) | 78.47 | 0.0050 | 32.96 | 0.0062 | 28.04 | 0.295 | 157 |
| SDXLBSRGAN [58] | 84.64 | 0.0081 | 37.04 | 0.0149 | 30.13 | 0.302 | 17 | |
| SDXL (Direct) [39] | 217.88 | 0.0976 | 99.05 | 0.0468 | 9.15 | 0.270 | 786 | |
| ScaleCrafter [19] | 110.49 | 0.0202 | 54.91 | 0.0196 | 21.80 | 0.293 | 1351 | |
| HiDiffusion [61] | 128.28 | 0.0319 | 100.85 | 0.0564 | 19.62 | 0.280 | 240 | |
| \cdashline2-9 | Self-Cascade [17] | 90.94 | 0.0106 | 43.91 | 0.0187 | 27.22 | 0.300 | 669 |
| DemoFusion [13] | 87.29 | 0.0089 | 32.89 | 0.0102 | 29.69 | 0.300 | 1507 | |
| LSRNA-DemoFusion (Ours) | 85.03 | 0.0077 | 29.12 | 0.0085 | 31.50 | 0.304 | 506 | |
| Pixelsmith [55] | 84.75 | 0.0086 | 32.34 | 0.0111 | 30.21 | 0.303 | 505 | |
| 40964096 | LSRNA-Pixelsmith (Ours) | 84.19 | 0.0075 | 29.62 | 0.0090 | 31.74 | 0.302 | 313 |
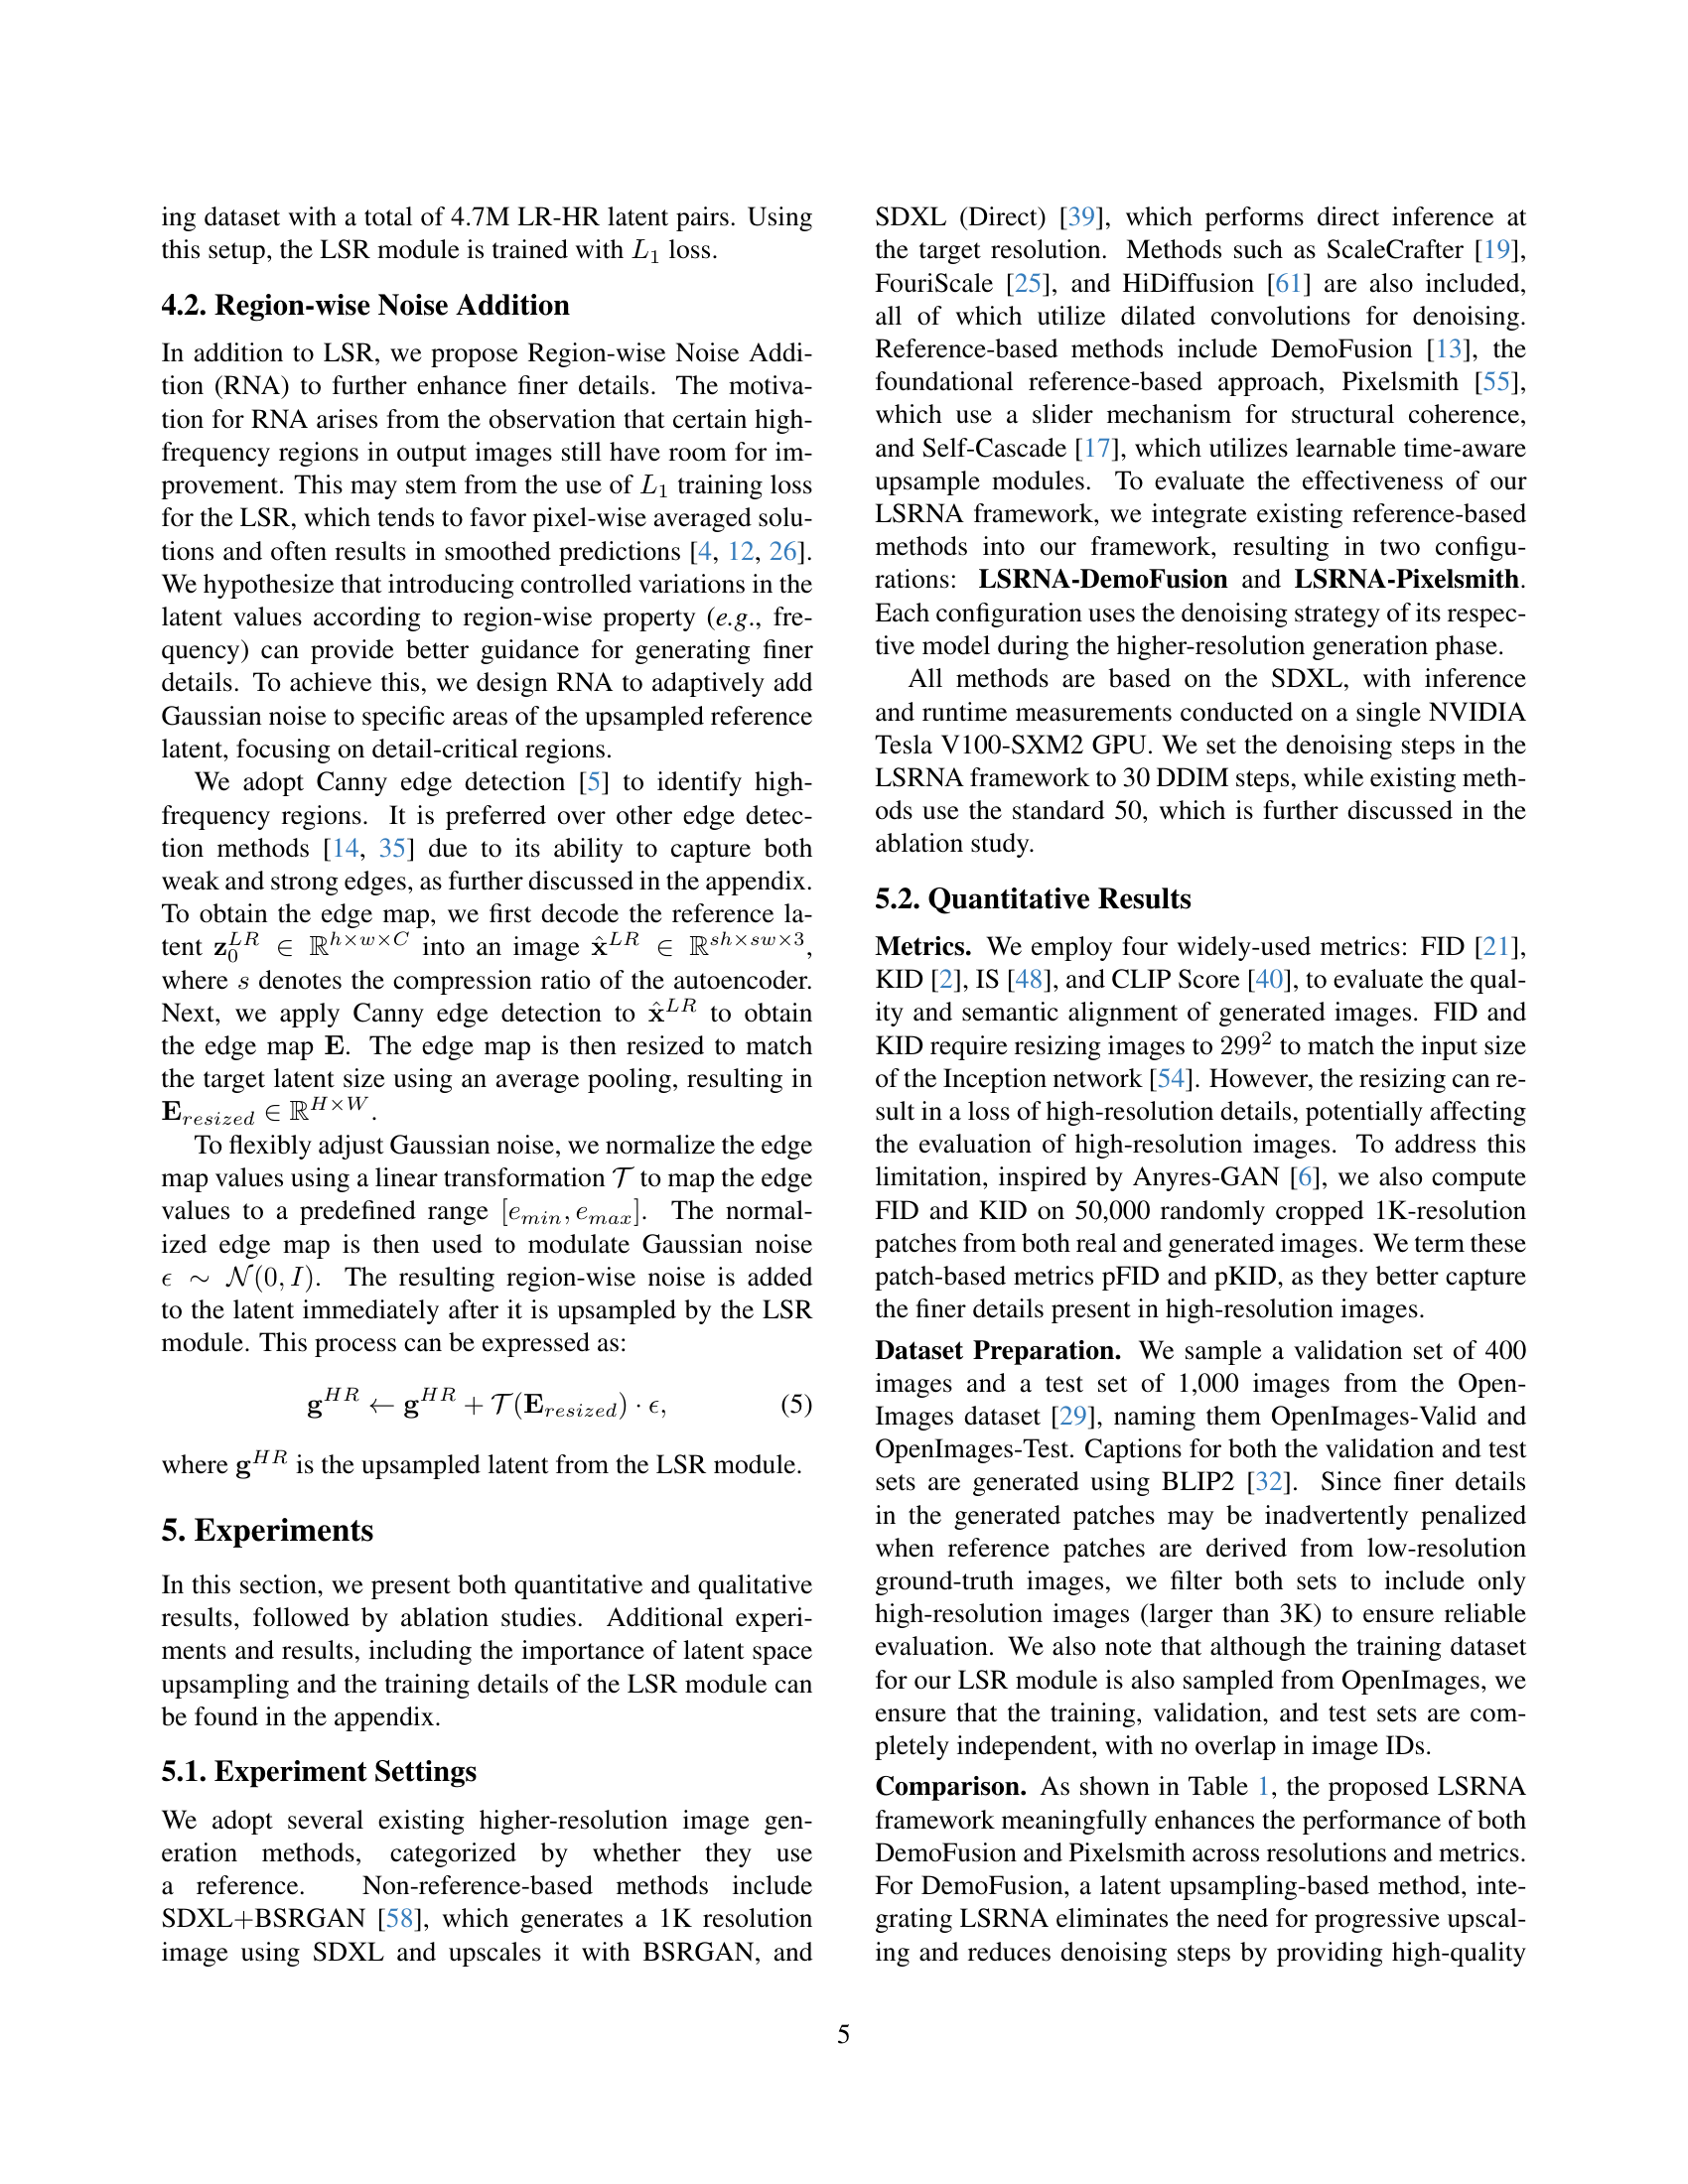
🔼 This table presents a quantitative comparison of various image generation methods’ performance on the OpenImages-Test dataset. The metrics used are FID, KID, pFID, pKID, IS, and CLIP, measuring different aspects of image quality and semantic alignment. Performance is categorized by whether the method uses a reference image or not. Methods are compared at three different resolutions (2048x2048, 2048x4096, and 4096x4096). The best and second-best results for each metric are highlighted for easy comparison. Due to memory limitations, the FouriScale method’s results are not included for resolutions larger than 2K.
read the caption
Table 1: Quantitative comparison results on OpenImages-Test. The best and second-best performances are highlighted in red and blue, respectively. Methods above the dashed line are non-reference-based, while those below are reference-based. FouriScale is not measured above 2K due to out-of-memory on our V100 GPU.
In-depth insights#
Latent SR Insight#
Latent Space Super-Resolution (SR) offers a compelling avenue for enhancing image generation with diffusion models. Unlike direct RGB space SR which often leads to overly smoothed outputs, latent SR operates within a compressed feature space, preserving high-level information crucial for detail and sharpness. By upsampling in the latent domain, methods can potentially leverage learned representations to better align with the target resolution’s manifold, reducing artifacts and improving perceptual quality. The challenge lies in effectively mapping low-resolution latent representations to their high-resolution counterparts without introducing manifold deviations. Techniques like Region-wise Noise Addition (RNA) can further refine the process by selectively enhancing high-frequency details in the upsampled latent space. This nuanced approach enables diffusion models to generate higher-resolution images with greater fidelity and visual appeal, while maintaining faster generation speeds.
RNA Detail Focus#
RNA Detail Focus likely refers to a technique within the research to specifically enhance the finer details in generated images. Considering the context of diffusion models and super-resolution, this probably involves a targeted approach to add noise or refine the high-frequency components of the image. It’s reasonable to assume that the method aims to address the common issue of diffusion models producing overly smooth or blurry results. The core idea is to guide the model towards generating sharper textures, intricate patterns, and subtle details that contribute to a more realistic and visually appealing output. This “RNA Detail Focus” would probably utilize edge detection or other methods to identify areas where detail enhancement is most needed, allowing for adaptive application and preventing unwanted artifacts or over-sharpening in less critical regions.
LSRNA Framework#
The LSRNA framework, as proposed in the paper, represents a significant advancement in the field of high-resolution image generation using diffusion models. The core idea revolves around addressing the limitations of existing methods when scaling beyond the training resolution of these models. Existing methods often suffer from structural distortions or content repetition. The framework introduces two key components: the Latent Space Super-Resolution (LSR) module and the Region-wise Noise Addition (RNA) module. The LSR module aims to align low-resolution latent representations with the higher-resolution manifold, addressing manifold deviation issues caused by naive latent space upsampling. The RNA module enhances high-frequency details by adaptively injecting Gaussian noise into specific regions of the upsampled latent, guided by a Canny edge detection map. This combination allows for both manifold alignment and detailed texture generation, leading to improved image quality. The framework’s effectiveness is demonstrated through integration with existing reference-based methods, showcasing its adaptability and potential to push the boundaries of high-resolution image generation.
Ablation Analyses#
Ablation analyses are crucial for understanding the contribution of different components within a complex system like the proposed LSRNA framework. By systematically removing or modifying parts of the system, such as the Latent Space Super-Resolution (LSR) module or the Region-wise Noise Addition (RNA) module, researchers can isolate the impact of each component on overall performance. These analyses help verify the necessity of each module and whether they are truly contributing to the desired outcome of improved image quality and faster generation speeds. Furthermore, ablation studies can identify potential redundancies or areas where a component’s effectiveness is limited. For instance, varying the parameters of RNA or the specific architecture of LSR can reveal optimal configurations and trade-offs. Analyzing the results with different metrics, like FID and KID scores, provides a comprehensive assessment. The absence of a module and its impact on final results is a key factor in deciding whether the said module is important or not. These analyses show that the LSR module plays an important role. Finally, ablation studies help researchers gain a deeper understanding of the underlying mechanisms and guide future research directions to develop improved methods.
Detail Preserving#
In the context of image super-resolution and generation, detail preservation is a critical aspect that determines the visual fidelity and perceptual quality of the output. Preserving intricate details such as fine textures, sharp edges, and subtle color variations is essential for creating realistic and visually appealing images. Techniques like Latent Space Super-Resolution (LSR) aim to minimize manifold deviation during upsampling to retain structural coherence. Further enhancement through methods like Region-wise Noise Addition (RNA) can inject high-frequency details, helping to restore or even augment textures that might be lost during scaling. The challenge lies in balancing detail enhancement with the introduction of artifacts or noise, requiring careful calibration of parameters. The preservation of details often trades off against computational efficiency, where more aggressive methods can demand higher processing power.
More visual insights#
More on figures

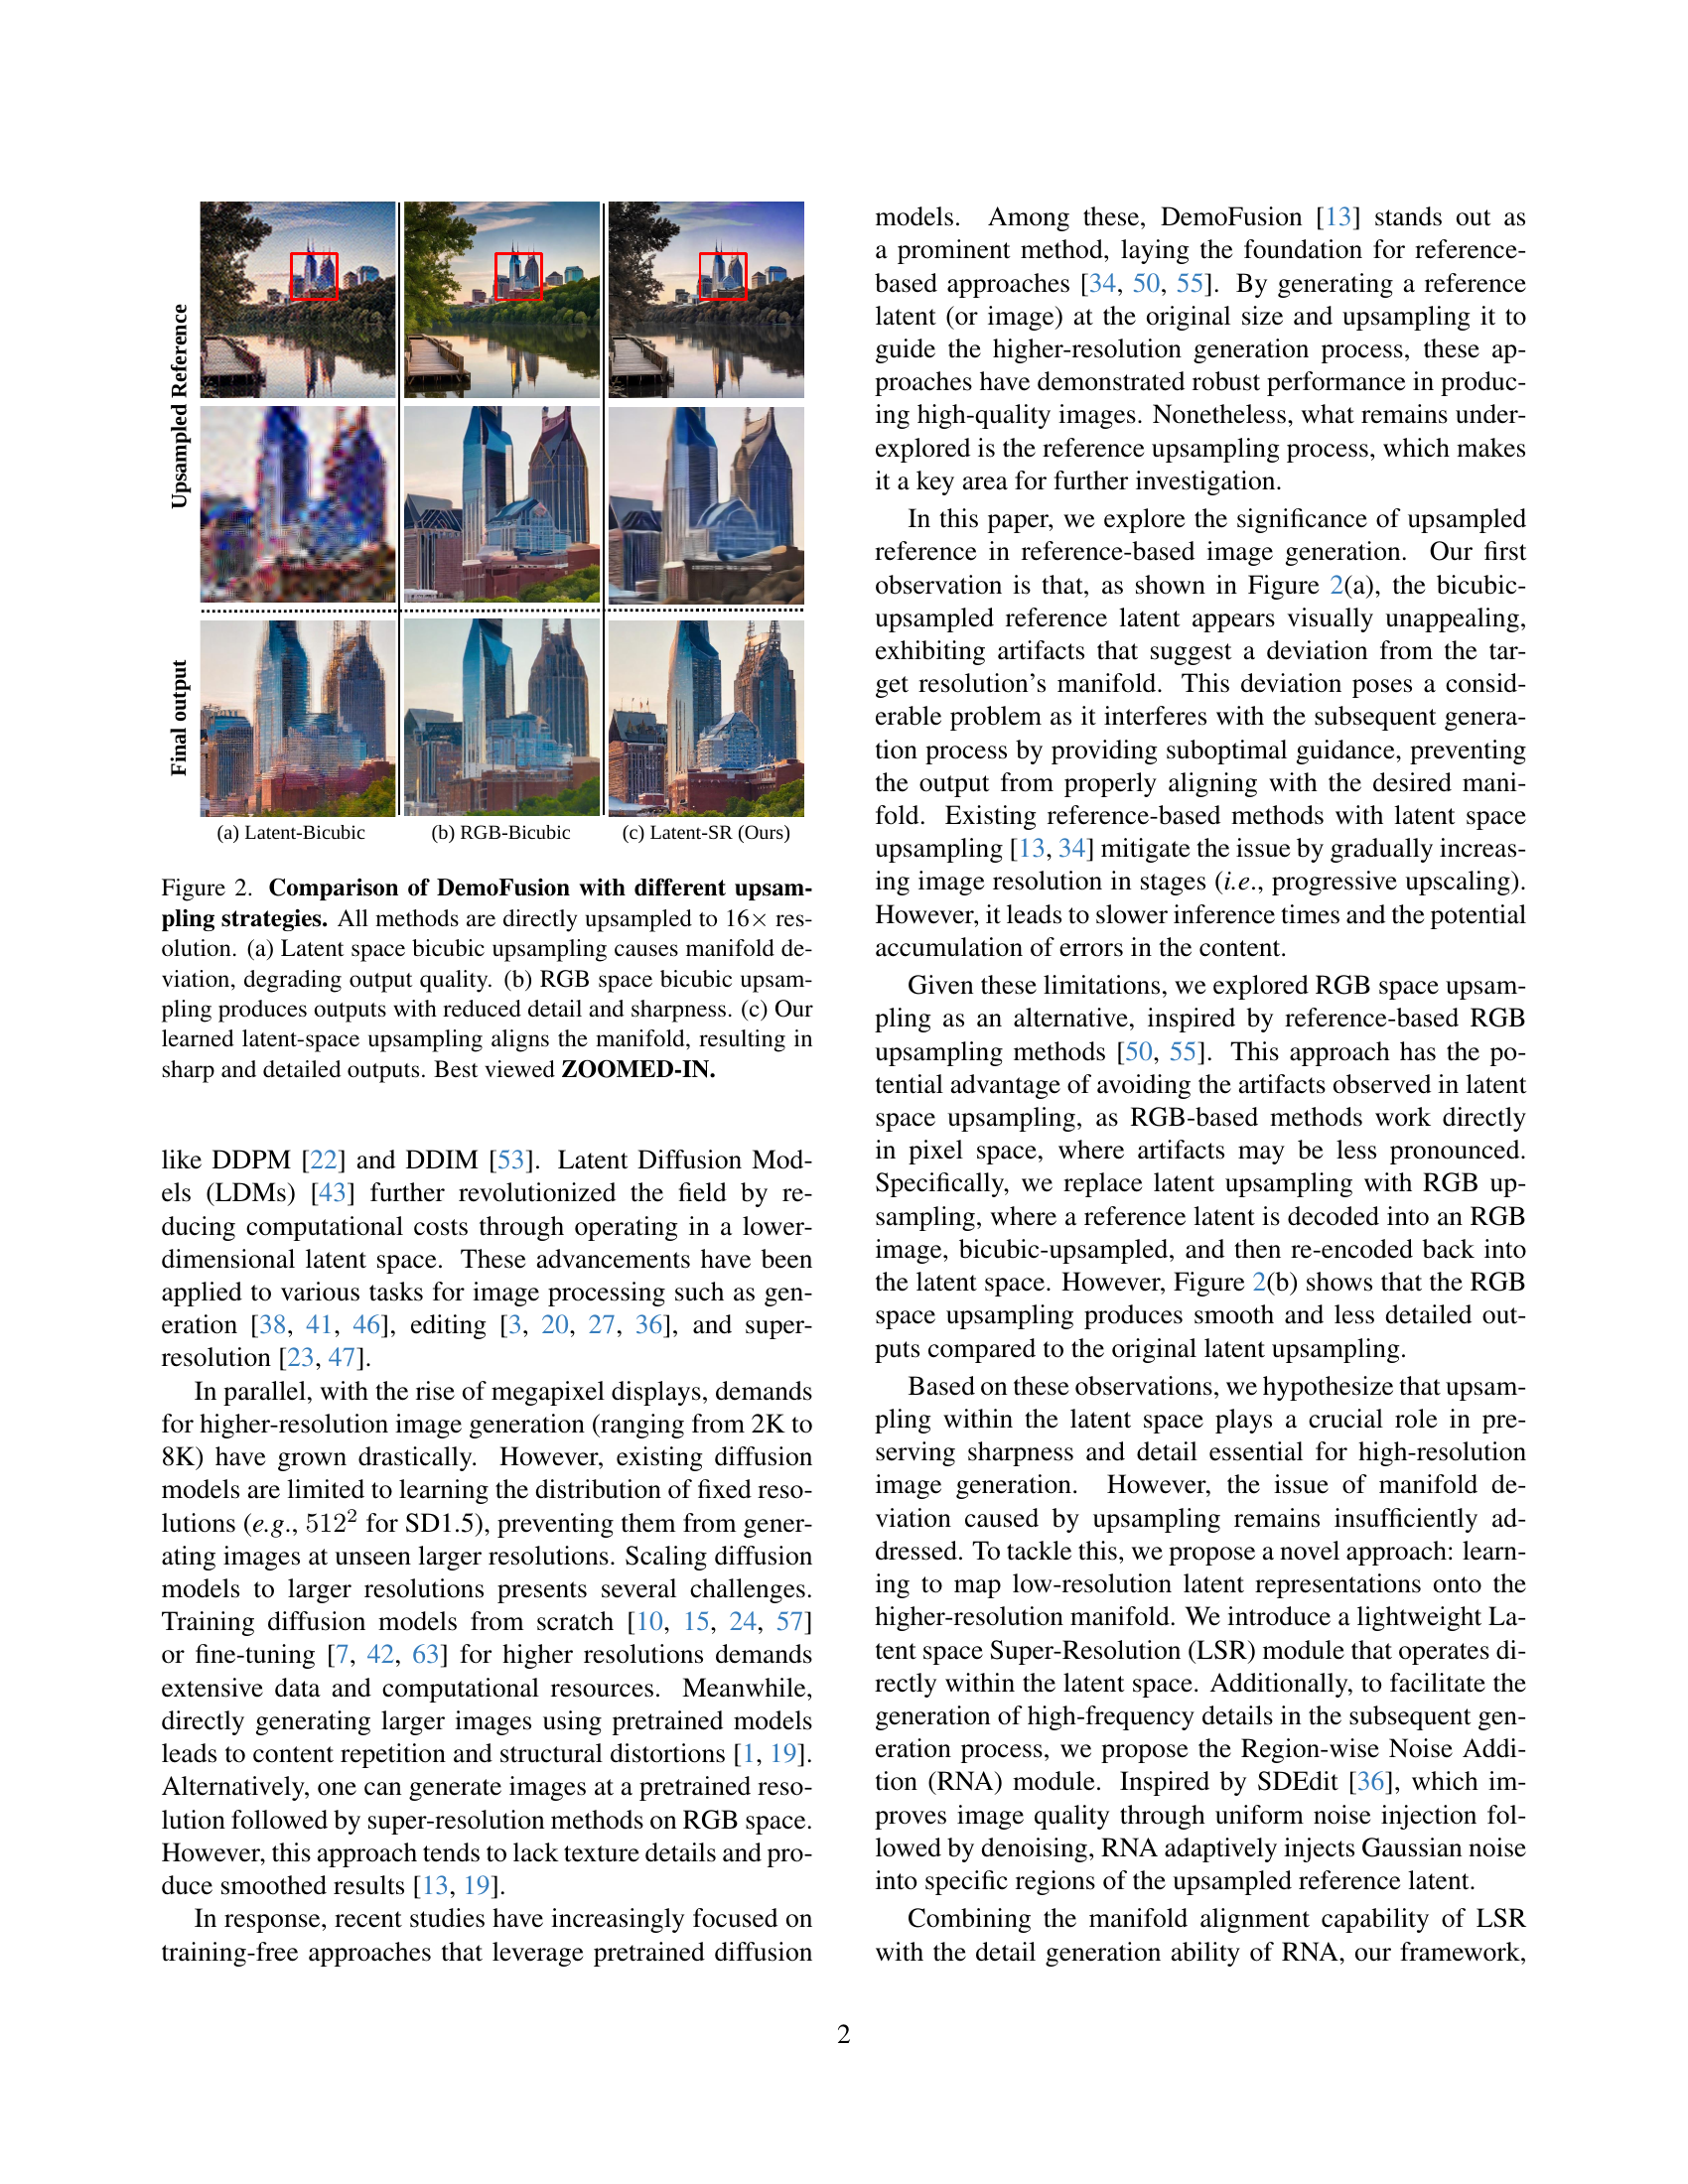
🔼 Figure 2 demonstrates the effects of different upsampling techniques on the quality of images generated using DemoFusion. It compares three approaches: (a) directly upsampling the latent representation using bicubic interpolation, which results in artifacts and a degradation in image quality due to manifold deviation; (b) directly upsampling the image in RGB space using bicubic interpolation, which produces a smoother image with less detail; and (c) the authors’ method, LSRNA, which learns a latent-space upsampling technique to align the manifold and generate sharp, high-quality images. The figure highlights the importance of latent-space upsampling for maintaining high-fidelity image generation.
read the caption
Figure 2: Comparison of DemoFusion with different upsampling strategies. All methods are directly upsampled to 16×\times× resolution. (a) Latent space bicubic upsampling causes manifold deviation, degrading output quality. (b) RGB space bicubic upsampling produces outputs with reduced detail and sharpness. (c) Our learned latent-space upsampling aligns the manifold, resulting in sharp and detailed outputs. Best viewed ZOOMED-IN.

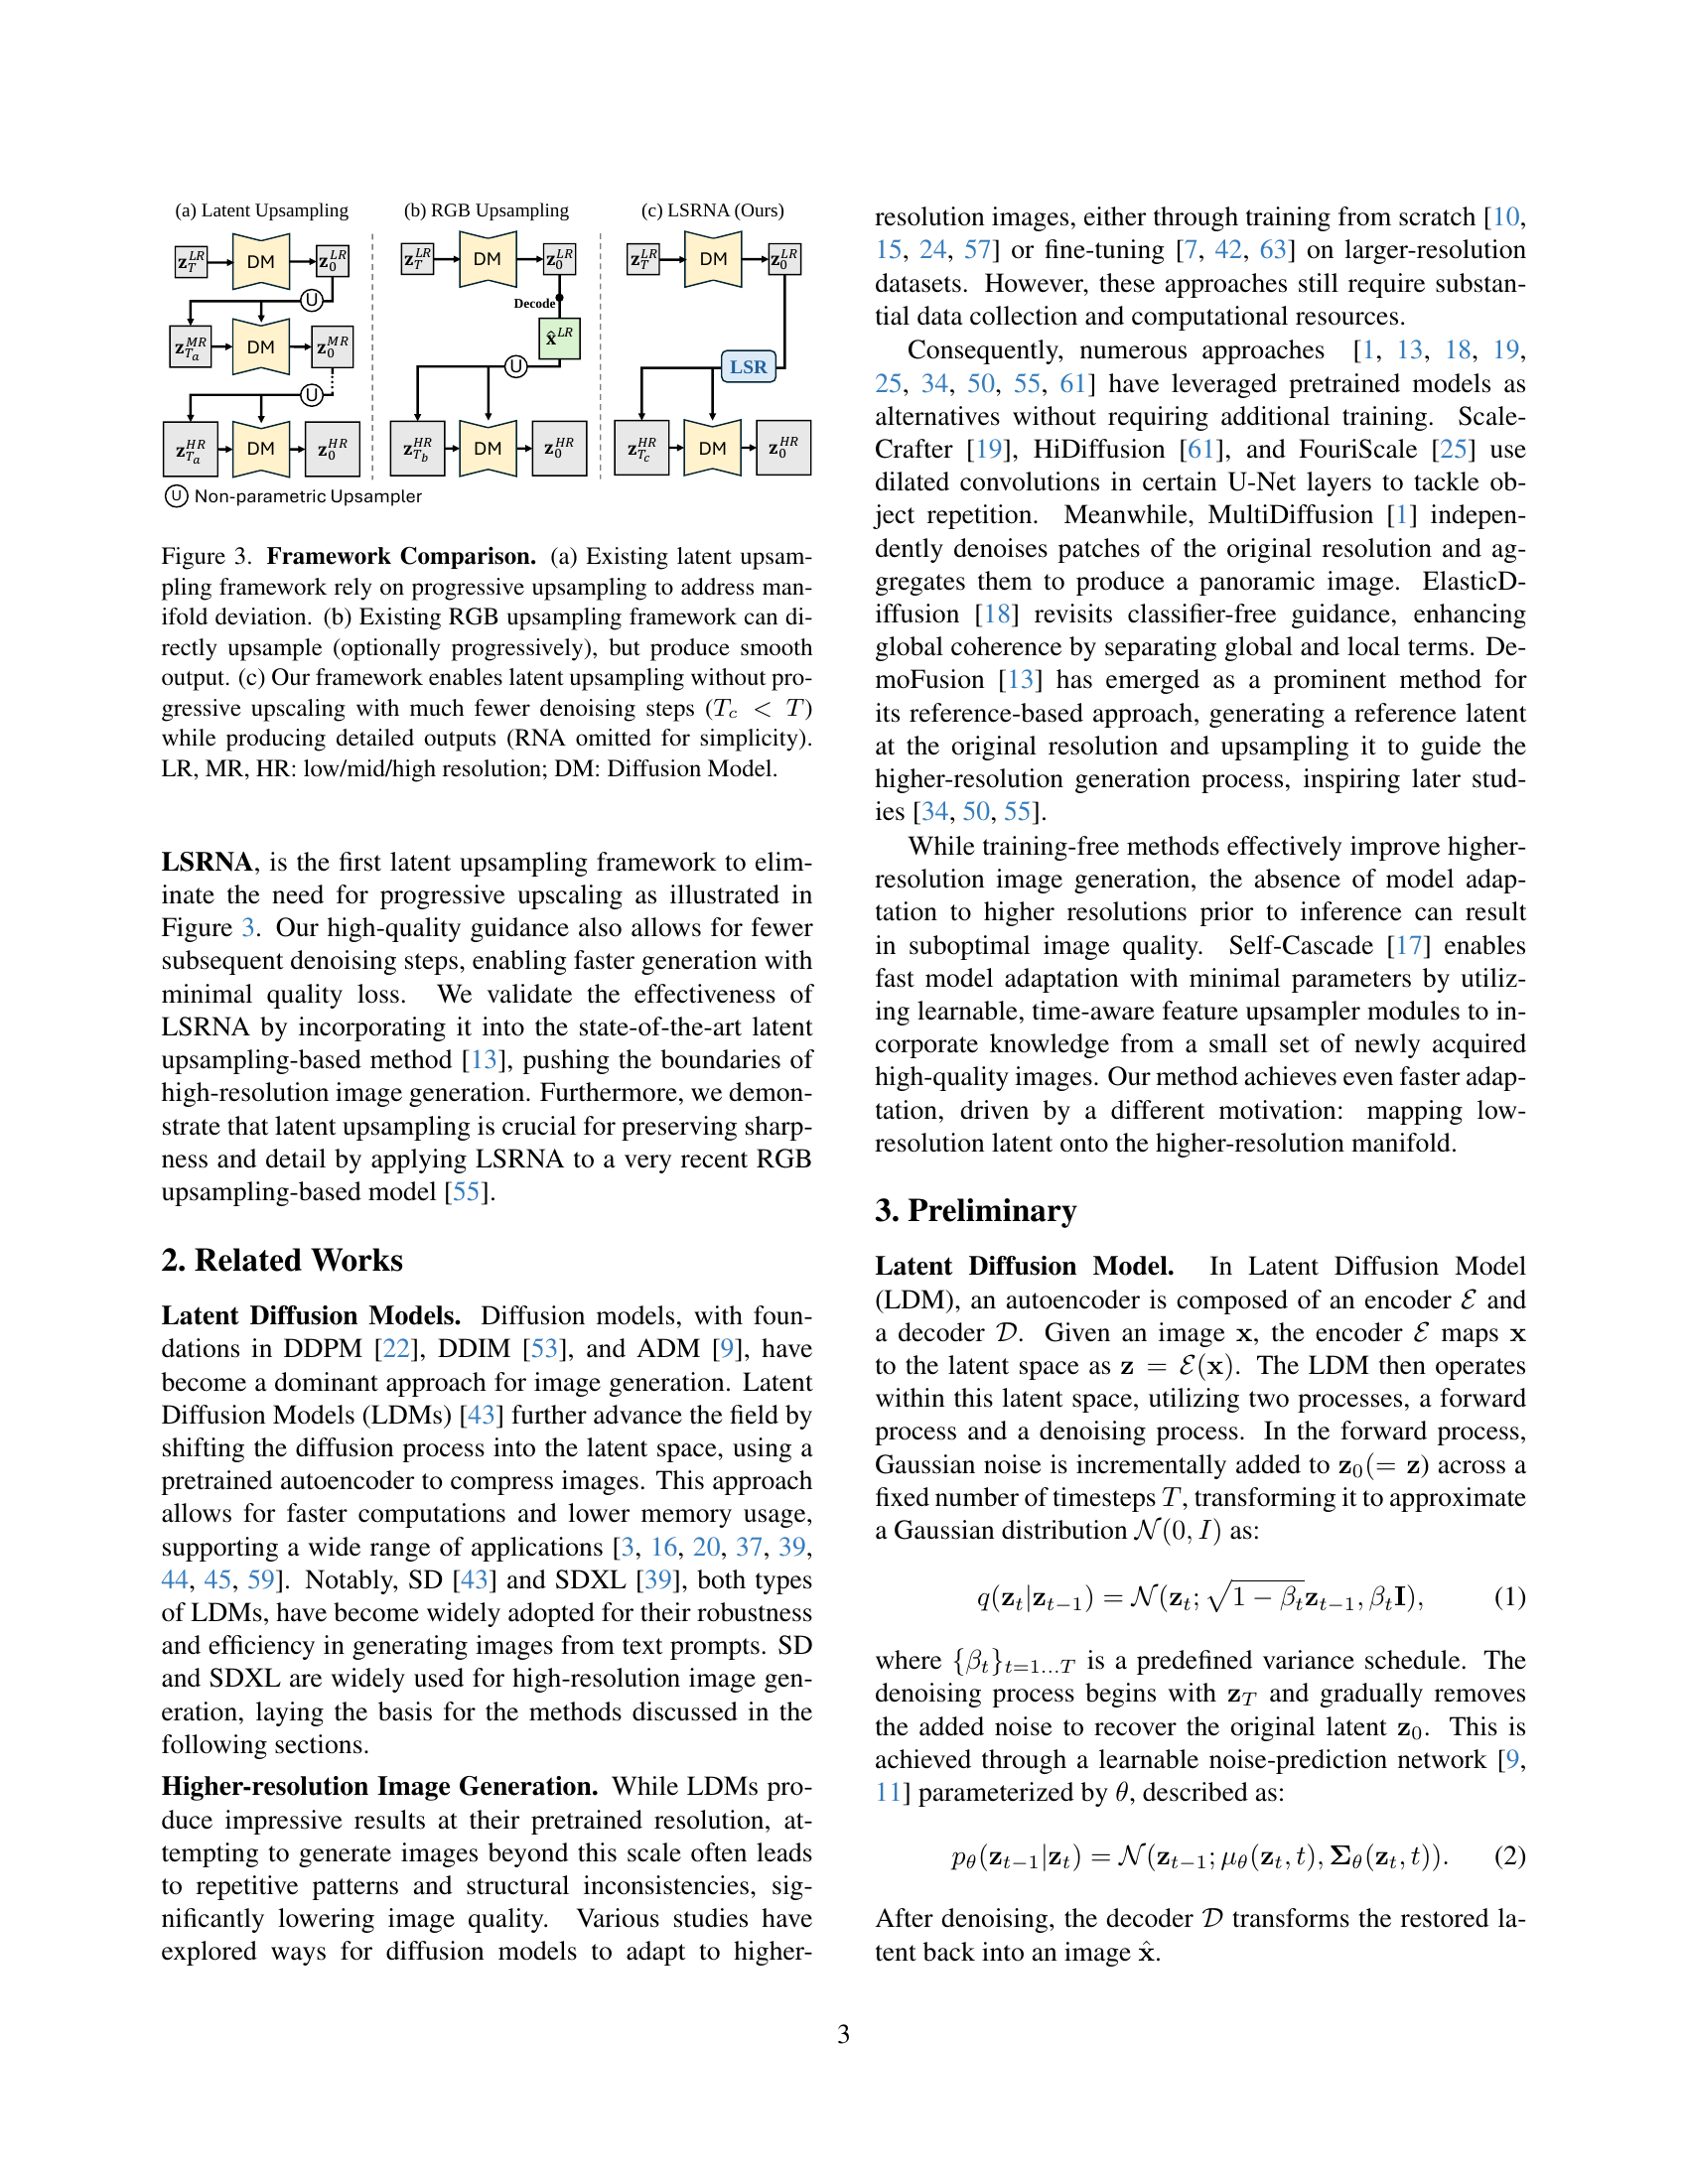
🔼 Figure 3 compares three different approaches to generating high-resolution images using diffusion models. (a) shows the traditional latent upsampling method, which progressively increases the resolution to reduce errors in mapping between different resolution manifolds. However, this method is slow. (b) demonstrates the alternative RGB upsampling method, which directly upsamples to the target resolution, but tends to result in smoother, less detailed output. (c) introduces the authors’ proposed LSRNA framework, performing upsampling directly in the latent space without progressive steps. This greatly speeds up image generation, resulting in sharper, more detailed output.
read the caption
Figure 3: Framework Comparison. (a) Existing latent upsampling framework rely on progressive upsampling to address manifold deviation. (b) Existing RGB upsampling framework can directly upsample (optionally progressively), but produce smooth output. (c) Our framework enables latent upsampling without progressive upscaling with much fewer denoising steps (Tc

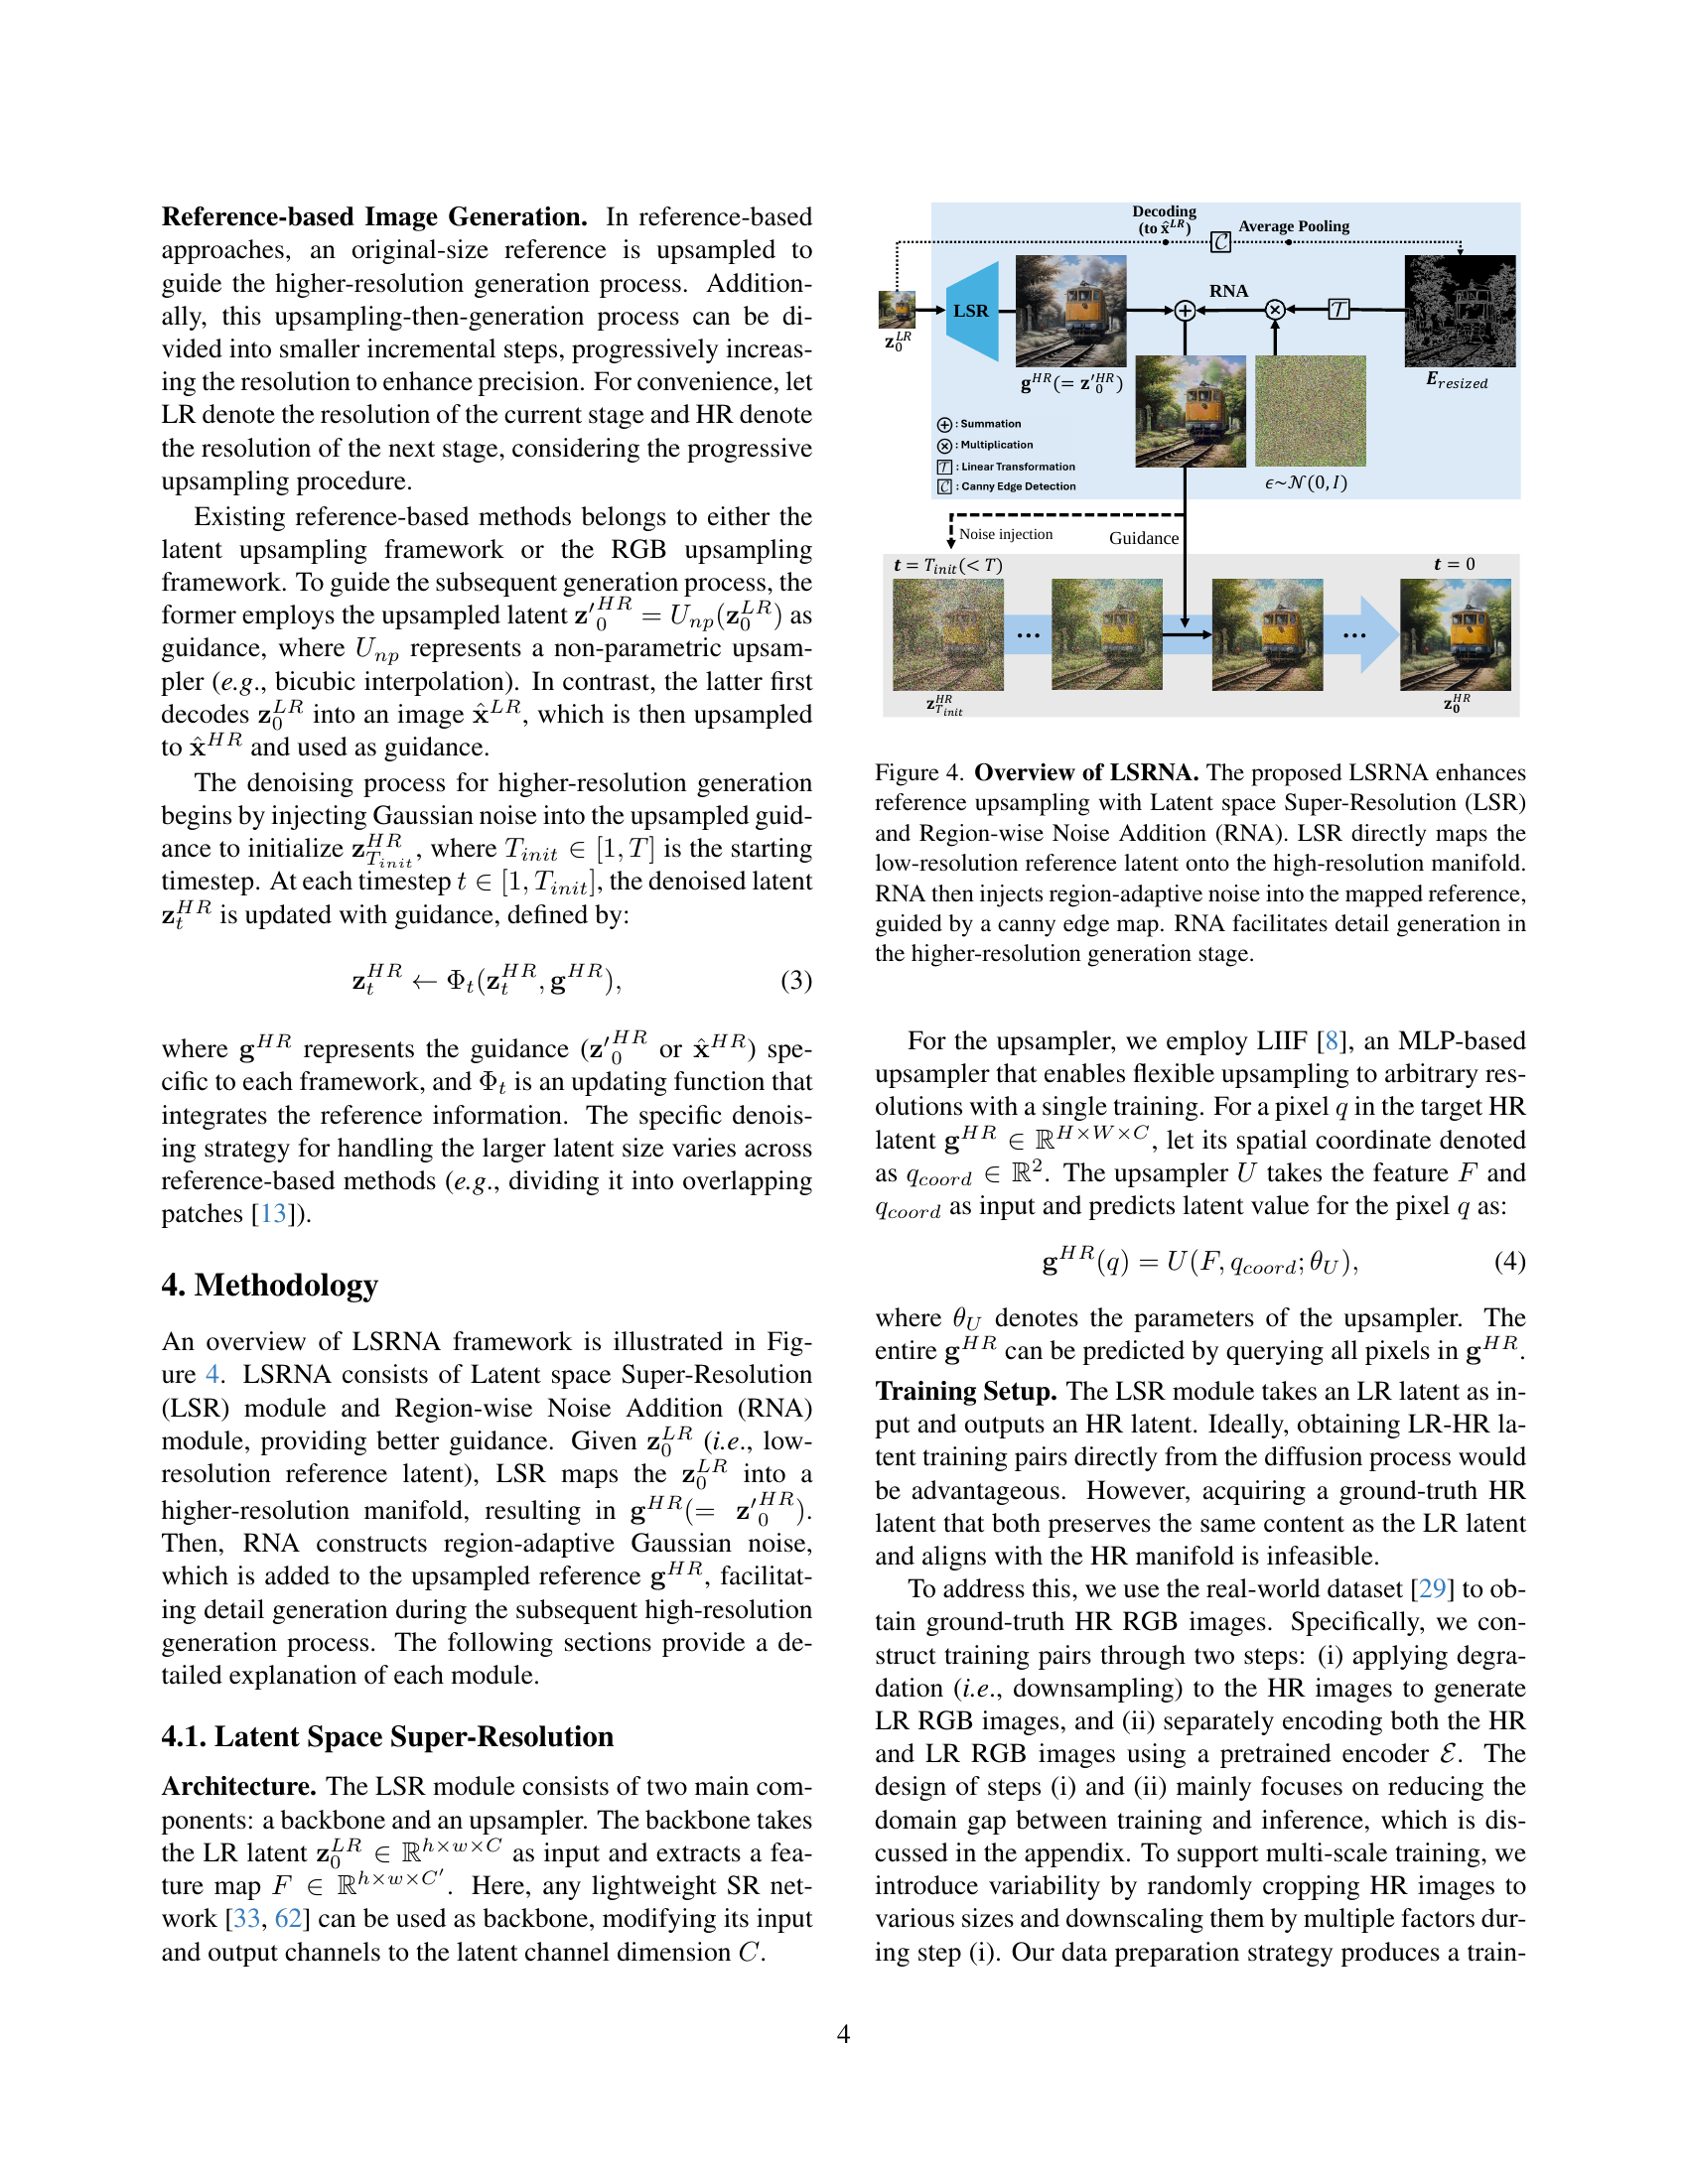
🔼 The figure illustrates the LSRNA framework, which enhances reference-based image upscaling for higher-resolution generation using diffusion models. It consists of two main modules: Latent Space Super-Resolution (LSR) and Region-wise Noise Addition (RNA). LSR maps a low-resolution latent representation to a high-resolution manifold, ensuring detail preservation during upsampling. RNA then adds region-specific noise guided by a Canny edge map to the upscaled latent, further enhancing high-frequency details during the subsequent diffusion process. This results in improved higher-resolution images that retain sharpness and detail.
read the caption
Figure 4: Overview of LSRNA. The proposed LSRNA enhances reference upsampling with Latent space Super-Resolution (LSR) and Region-wise Noise Addition (RNA). LSR directly maps the low-resolution reference latent onto the high-resolution manifold. RNA then injects region-adaptive noise into the mapped reference, guided by a canny edge map. RNA facilitates detail generation in the higher-resolution generation stage.
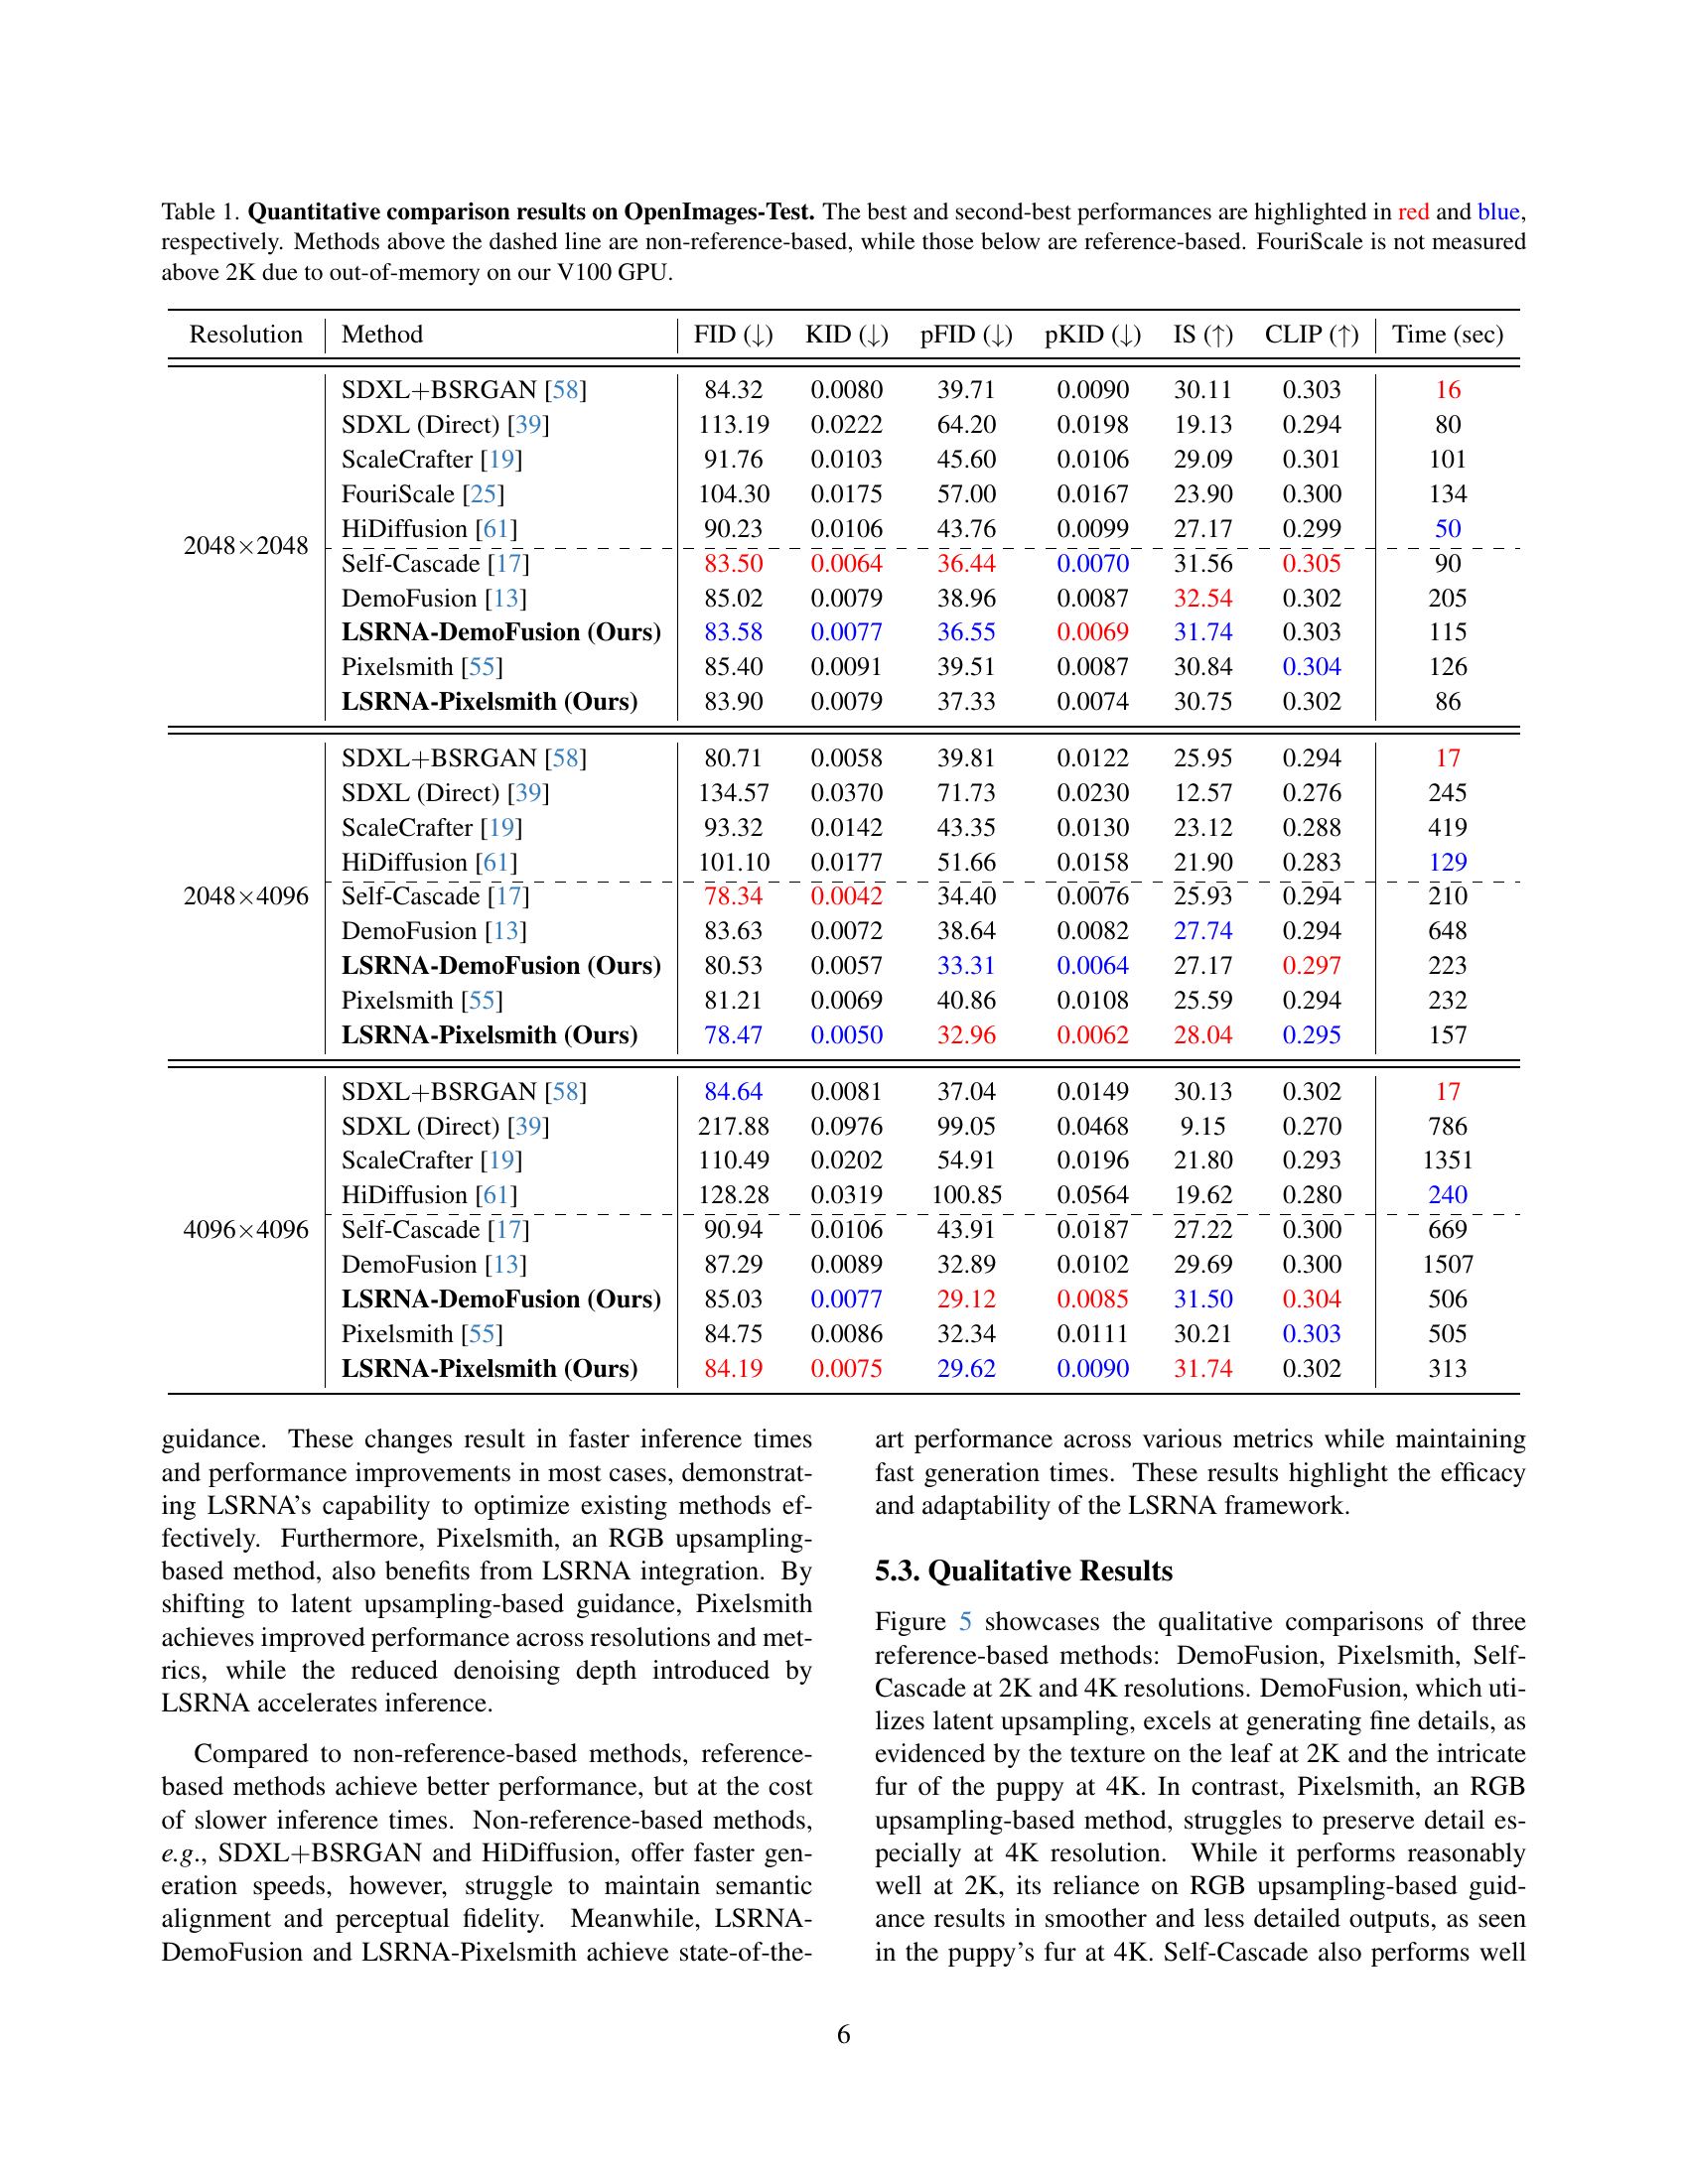
🔼 This figure displays a qualitative comparison of different reference-based image generation methods at resolutions of 2K and 4K. It showcases the outputs of these methods for generating images of an apple and a puppy. The goal is to demonstrate the visual differences in terms of detail, sharpness, and overall quality between the various approaches. The figure highlights the impact of different upsampling strategies (latent space vs. RGB space) and the role of denoising steps on the final image output.
read the caption
Figure 5: Qualitative comparisons across reference-based methods at 2K and 4K resolutions.

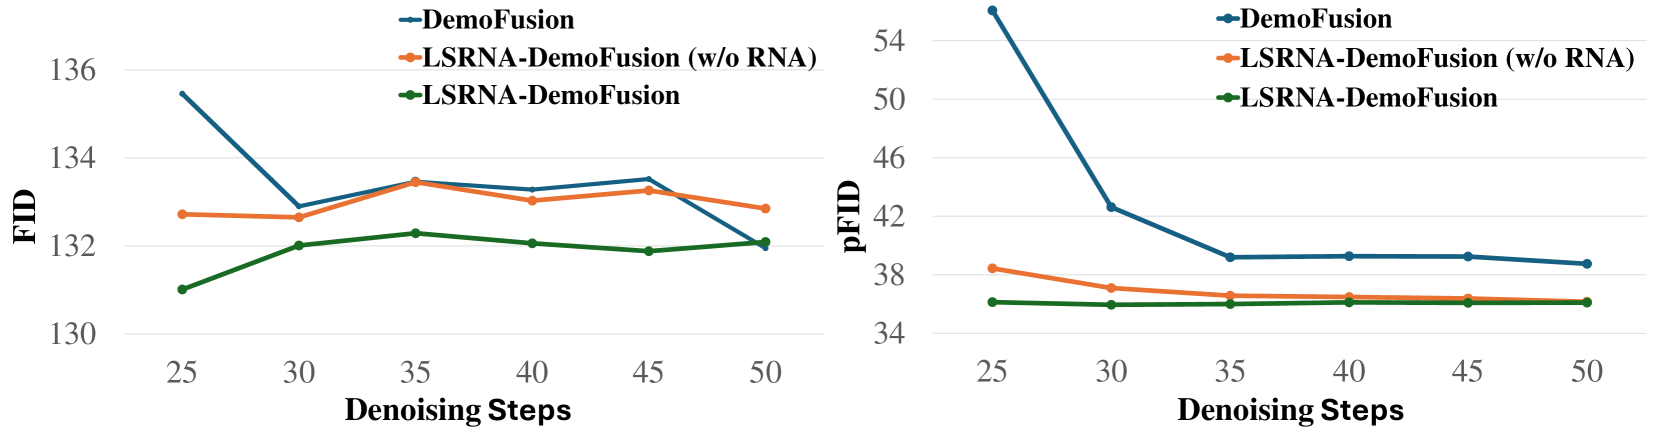
🔼 This ablation study investigates the impact of varying the number of denoising steps on the performance of the DemoFusion model. It compares the original DemoFusion model with two variations incorporating the LSRNA framework: one without RNA (Region-wise Noise Addition), and the full LSRNA model. The plot likely shows how image quality metrics (like FID and pFID, which are discussed in the paper) change as the number of denoising steps increases for each model configuration, illustrating the effectiveness of LSRNA in reducing the necessary number of steps to achieve high-quality results.
read the caption
Figure 6: Ablation study of denoising steps with DemoFusion.

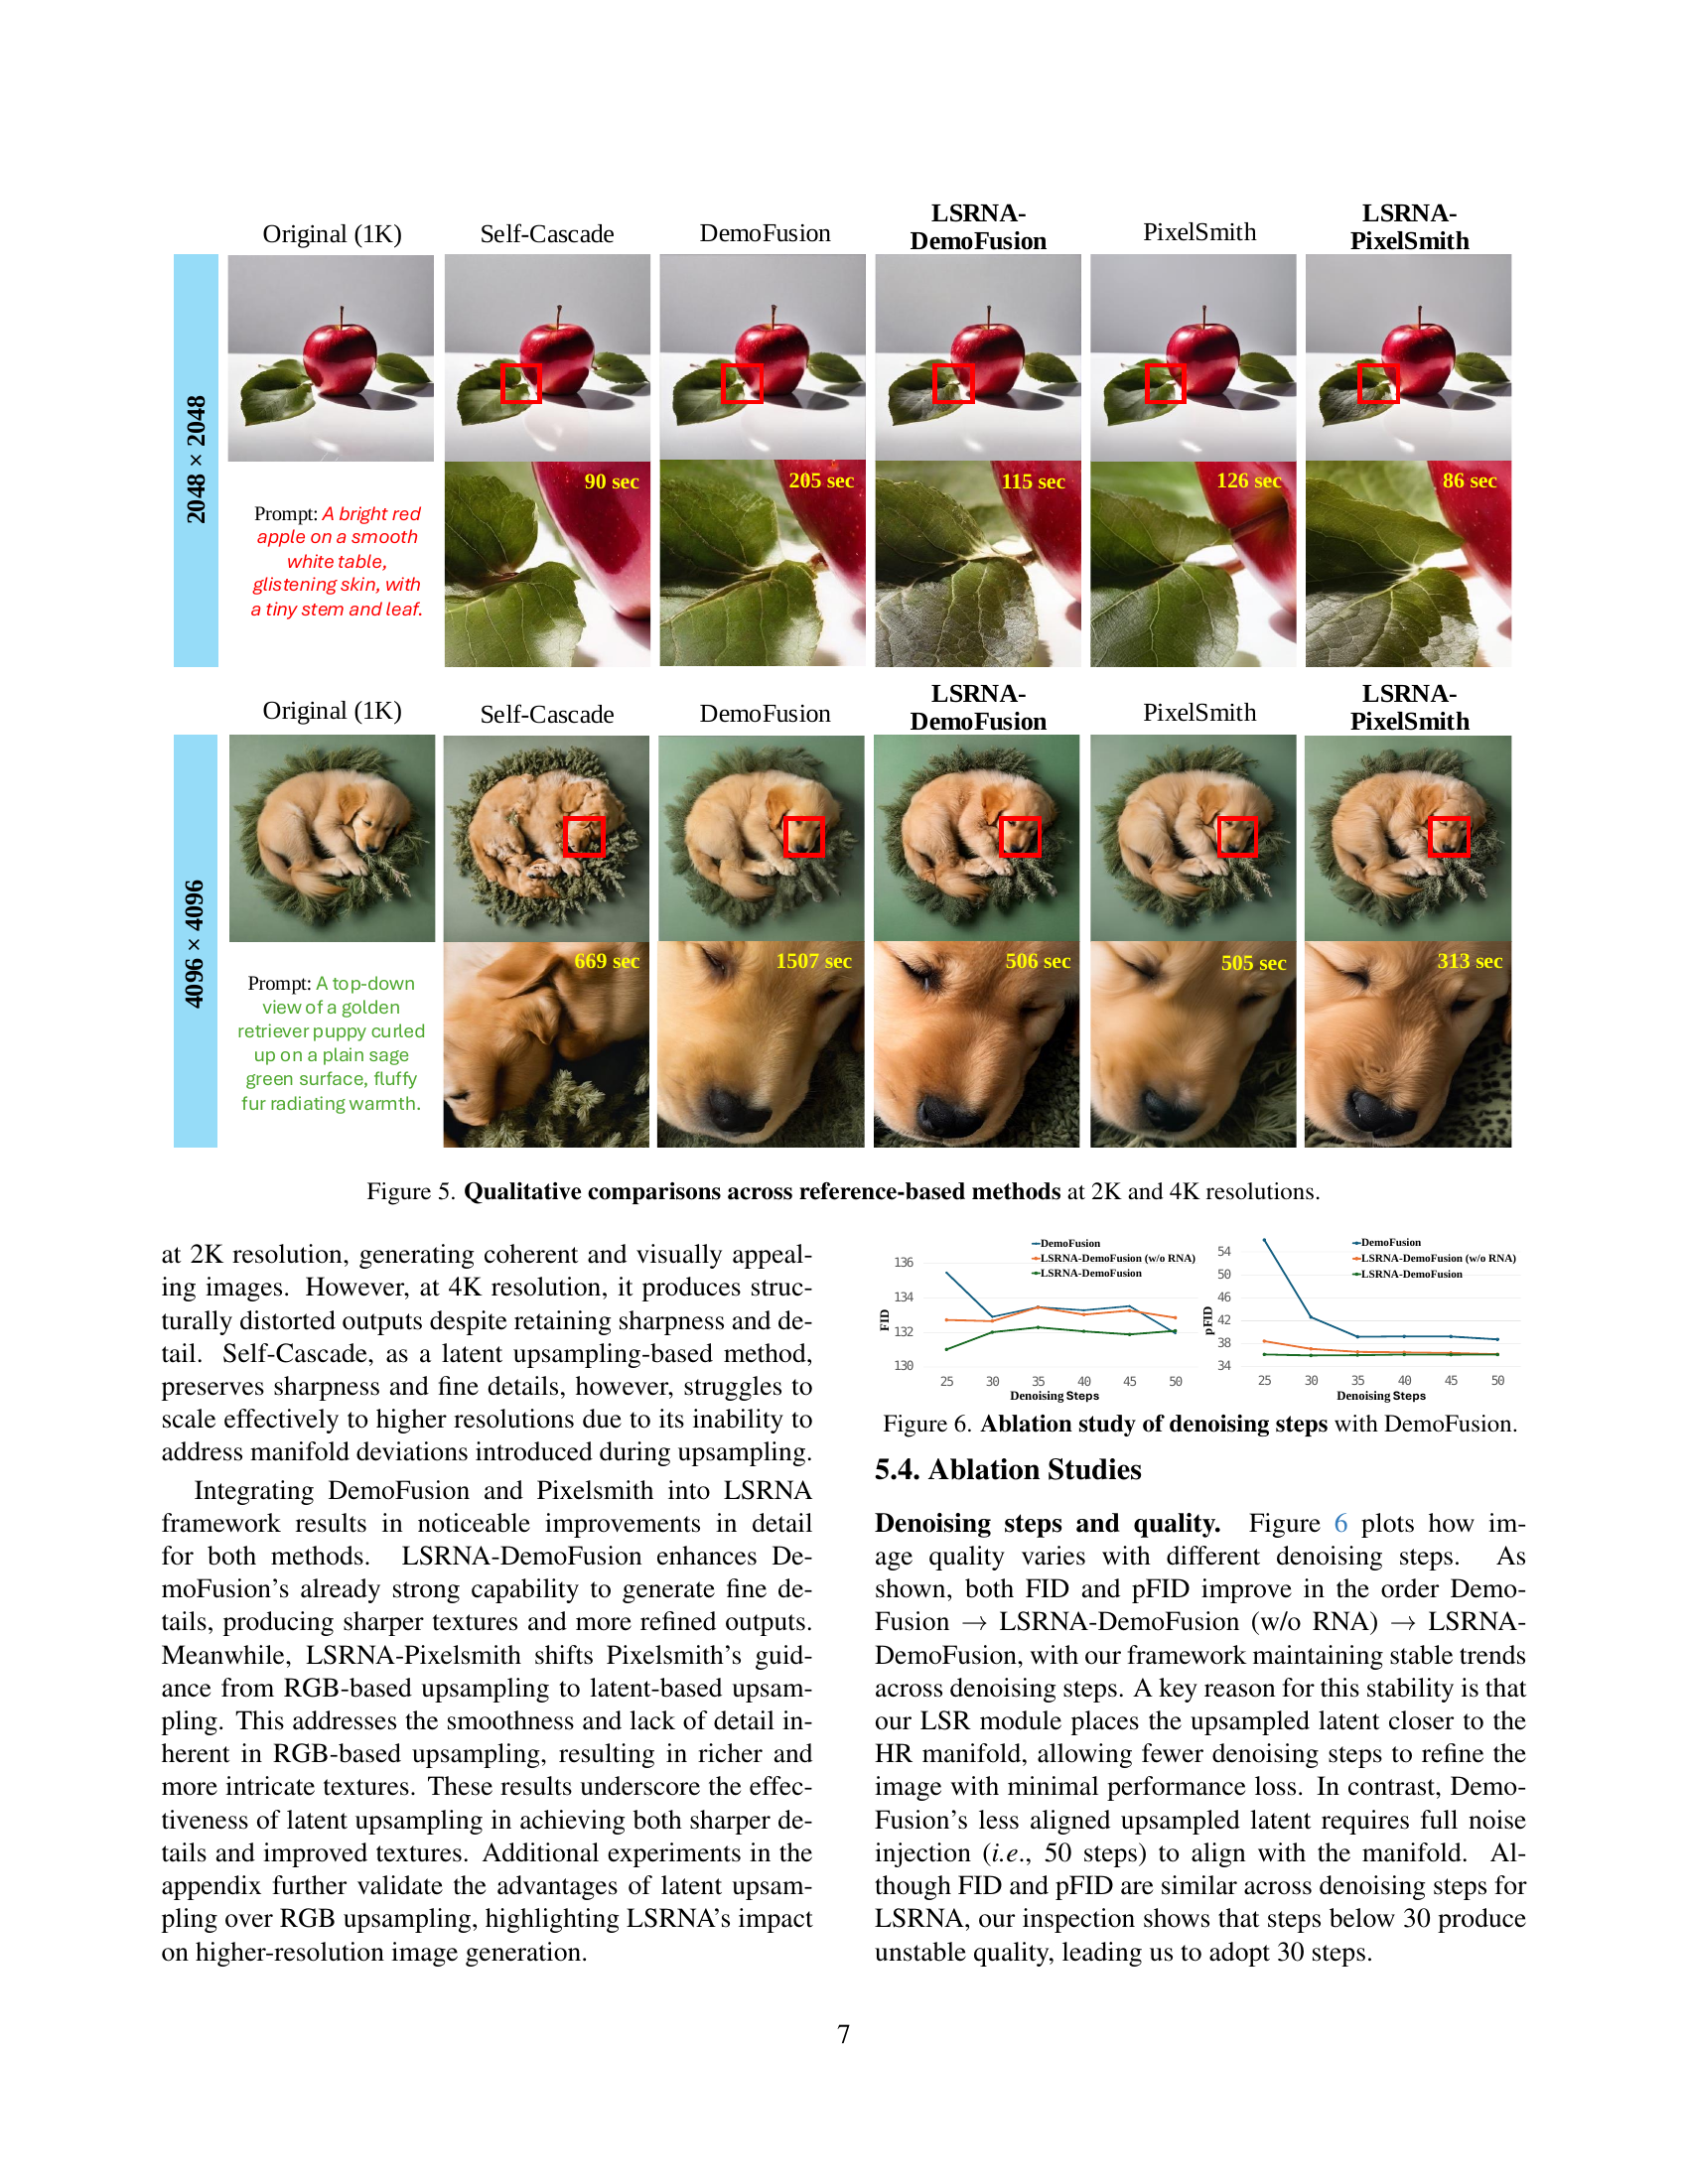
🔼 This figure demonstrates a comparison between Region-wise Noise Addition (RNA) and Uniform Noise Addition (UNA) methods. The left side shows RNA, effectively preserving low-frequency image regions while enhancing high-frequency details and textures. Conversely, the right side shows UNA, where introducing noise across various regions at higher levels leads to visual artifacts.
read the caption
Figure 7: Qualitative comparison of Region-wise Noise Addition (RNA) and Uniform Noise Addition (UNA). RNA (left) effectively preserves low-frequency areas while enhancing high-frequency detail and texture. In contrast, UNA (right) introduce artifacts across various regions at higher noise levels.

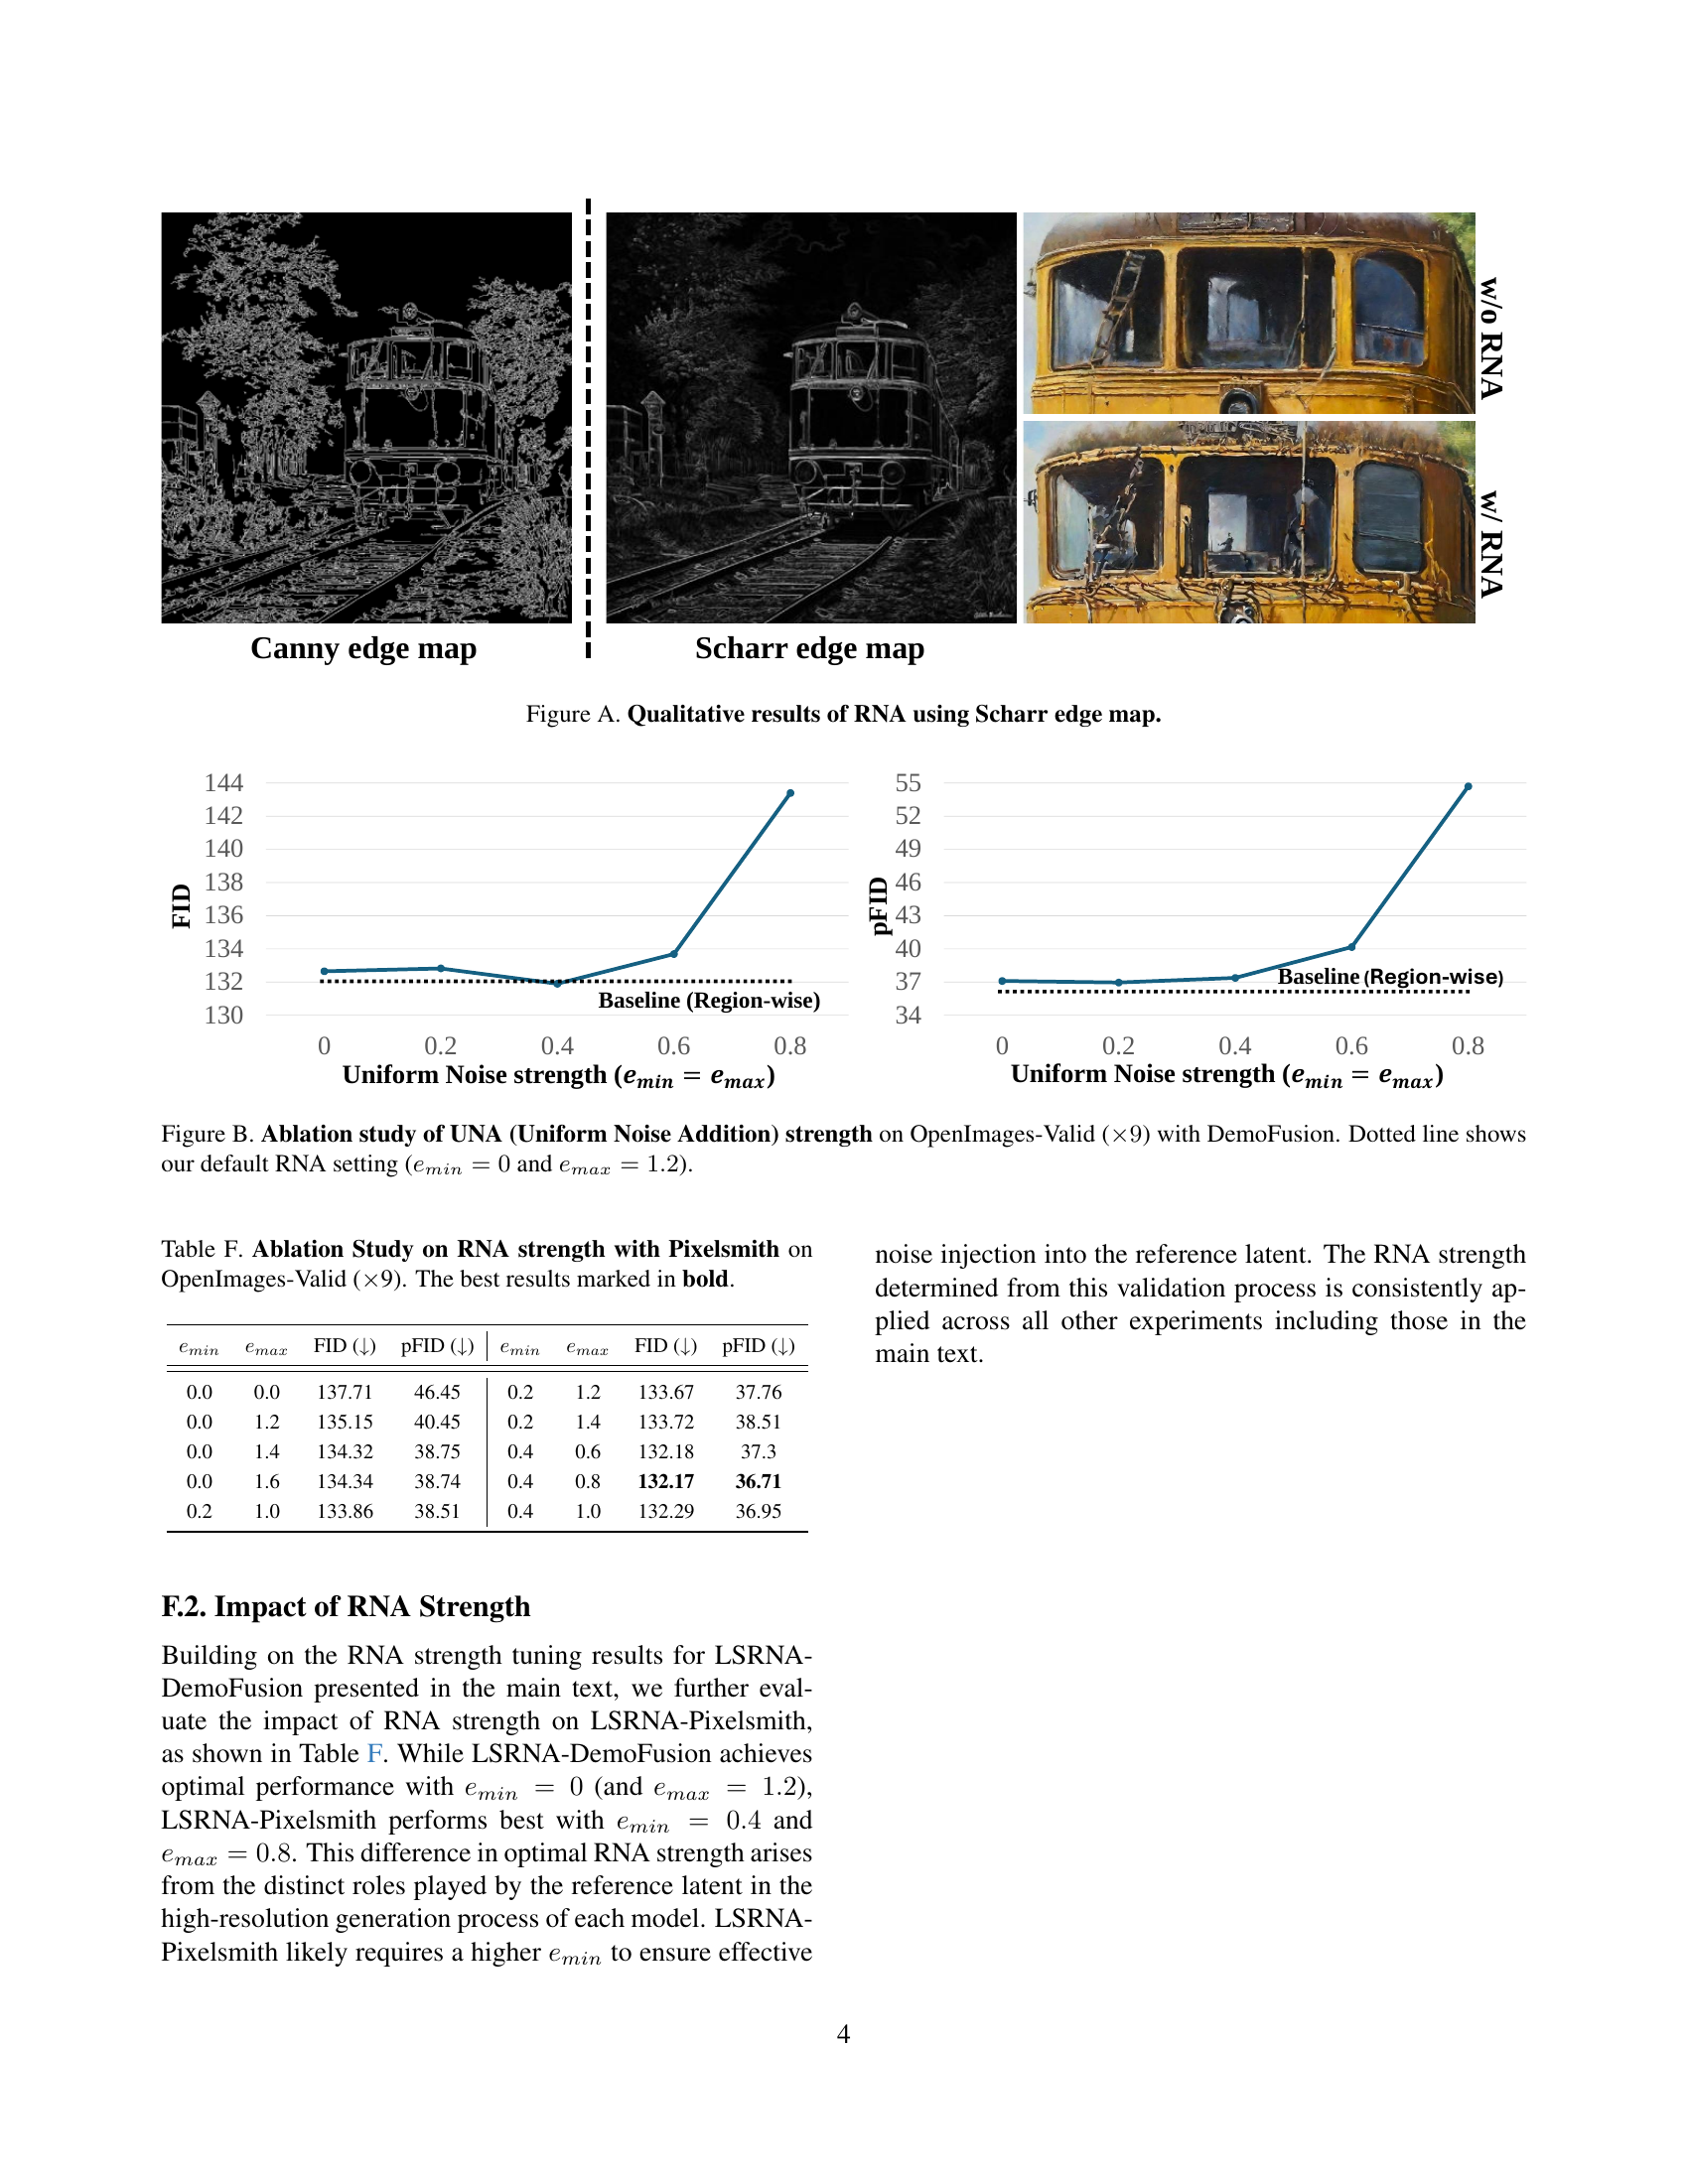
🔼 This figure shows a qualitative comparison of the results obtained using region-wise noise addition (RNA) with two different edge detection methods: the Canny edge detector and the Scharr edge detector. It visually demonstrates the impact of the edge detection method on the quality of the generated images. The Scharr edge detector produces less satisfactory results compared to the Canny edge detector, showing artifacts and less effective detail enhancement.
read the caption
Figure A: Qualitative results of RNA using Scharr edge map.

🔼 This ablation study investigates the effect of varying the strength of Uniform Noise Addition (UNA) on image generation quality. The experiment uses the DemoFusion model and the OpenImages-Valid dataset, which has been downsampled 9 times. The x-axis represents the strength of UNA, controlled by parameters emin and emax, both ranging from 0 to 1. The y-axis shows the resulting pFID (Patch-based Fréchet Inception Distance) scores, which are lower is better. The dotted line indicates the performance of the default Region-wise Noise Addition (RNA) settings from the main paper (emin = 0, emax = 1.2). The results of this experiment show how changing the strength of uniform noise impacts the generated image quality. The figure illustrates the comparison between uniform noise addition and the authors’ proposed region-wise noise addition.
read the caption
Figure B: Ablation study of UNA (Uniform Noise Addition) strength on OpenImages-Valid (×9absent9\times 9× 9) with DemoFusion. Dotted line shows our default RNA setting (emin=0subscript𝑒𝑚𝑖𝑛0e_{min}=0italic_e start_POSTSUBSCRIPT italic_m italic_i italic_n end_POSTSUBSCRIPT = 0 and emax=1.2subscript𝑒𝑚𝑎𝑥1.2e_{max}=1.2italic_e start_POSTSUBSCRIPT italic_m italic_a italic_x end_POSTSUBSCRIPT = 1.2).

🔼 This figure compares the results of three different upsampling methods used in DemoFusion, a technique for generating higher-resolution images. The methods being compared are: bicubic upsampling in RGB space, super-resolution in RGB space, and the authors’ proposed latent space super-resolution method (LSRNA). All three methods are used to upscale a low-resolution image to 16 times its original size. The prompt used to generate the images is: “the sun is setting over the ocean on a cloudy day”. The results demonstrate that the proposed LSRNA method produces images with superior sharpness and detail compared to upsampling directly in RGB space.
read the caption
Figure C: RGB vs. Latent Space Upsampling for DemoFusion on 16×\times×. Prompt used is 'the sun is setting over the ocean on a cloudy day'. Best viewed ZOOMED-IN.
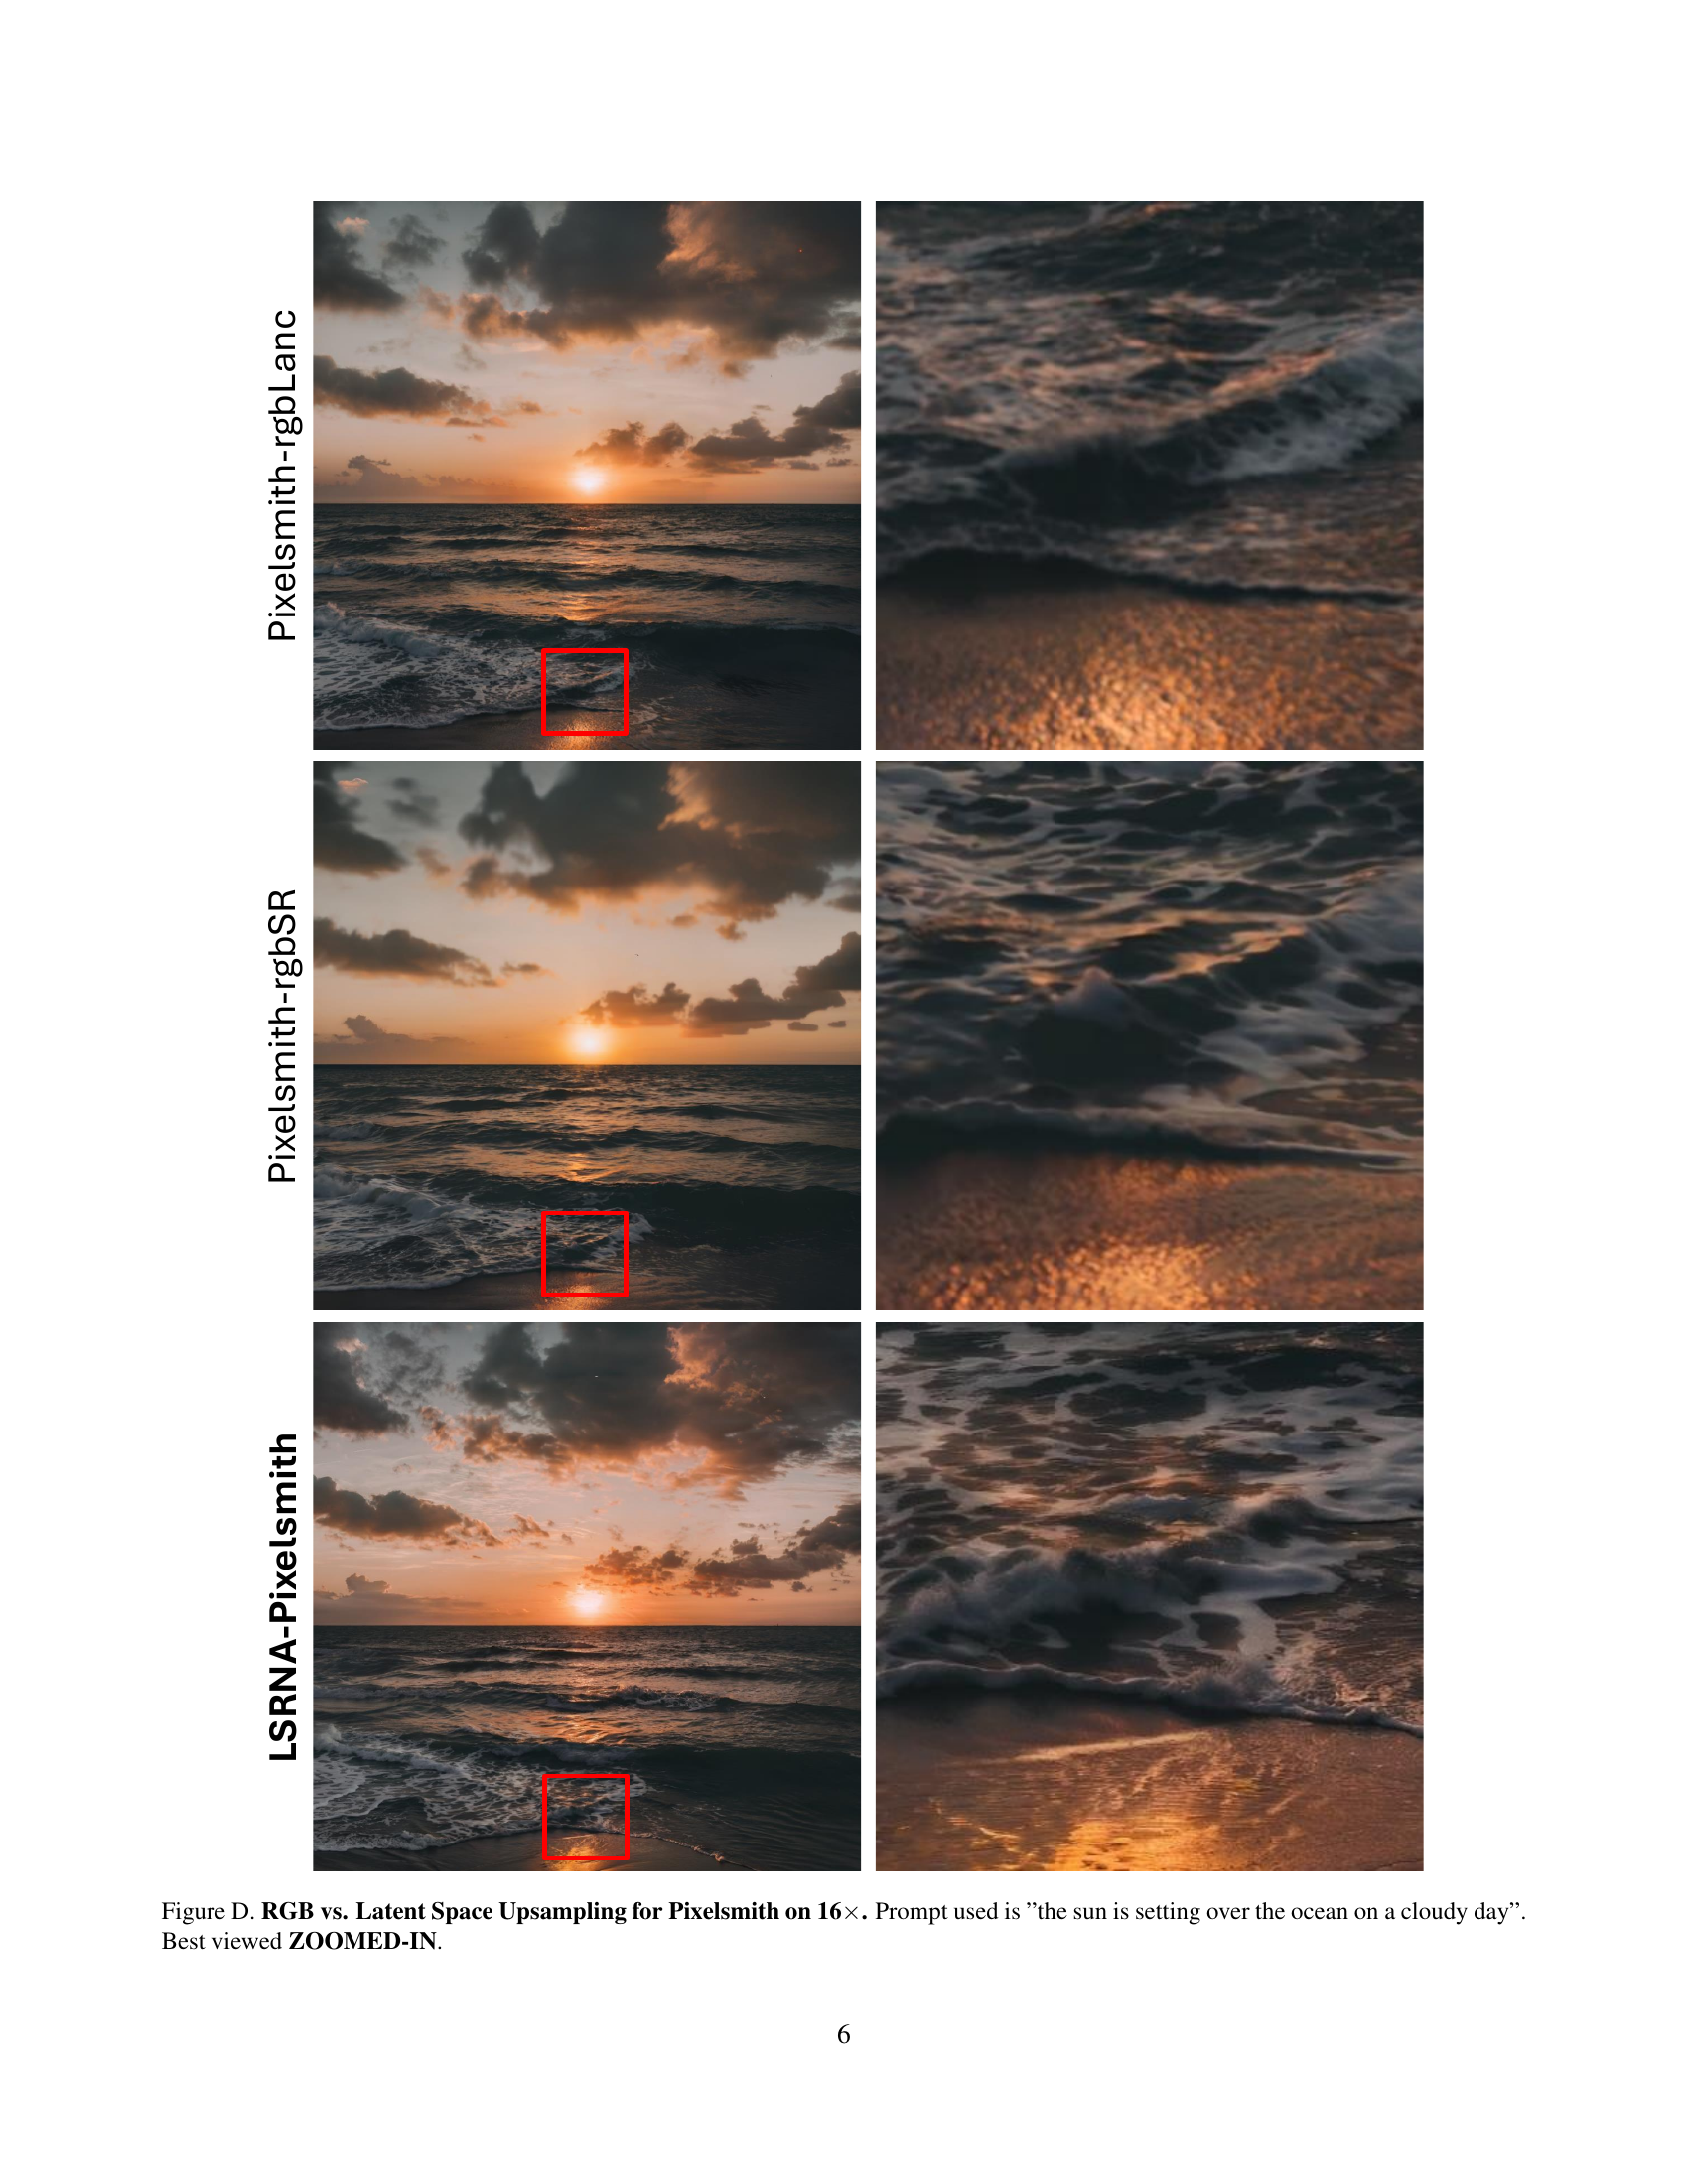
🔼 This figure compares the results of three different upsampling methods used in the Pixelsmith model for generating 16 times higher resolution images of a sunset over the ocean. The three methods are: RGB upsampling using bicubic interpolation (Pixelsmith-rgbLanc), RGB upsampling with a super-resolution network (Pixelsmith-rgbSR), and latent space upsampling using the proposed LSRNA framework (LSRNA-Pixelsmith). The images clearly demonstrate the superior quality and detail preservation capabilities of the latent space upsampling method, producing sharper and more visually appealing results compared to the RGB-based approaches. The comparison highlights the importance of latent space upsampling for achieving high-quality higher-resolution image generation with diffusion models.
read the caption
Figure D: RGB vs. Latent Space Upsampling for Pixelsmith on 16×\times×. Prompt used is 'the sun is setting over the ocean on a cloudy day'. Best viewed ZOOMED-IN.

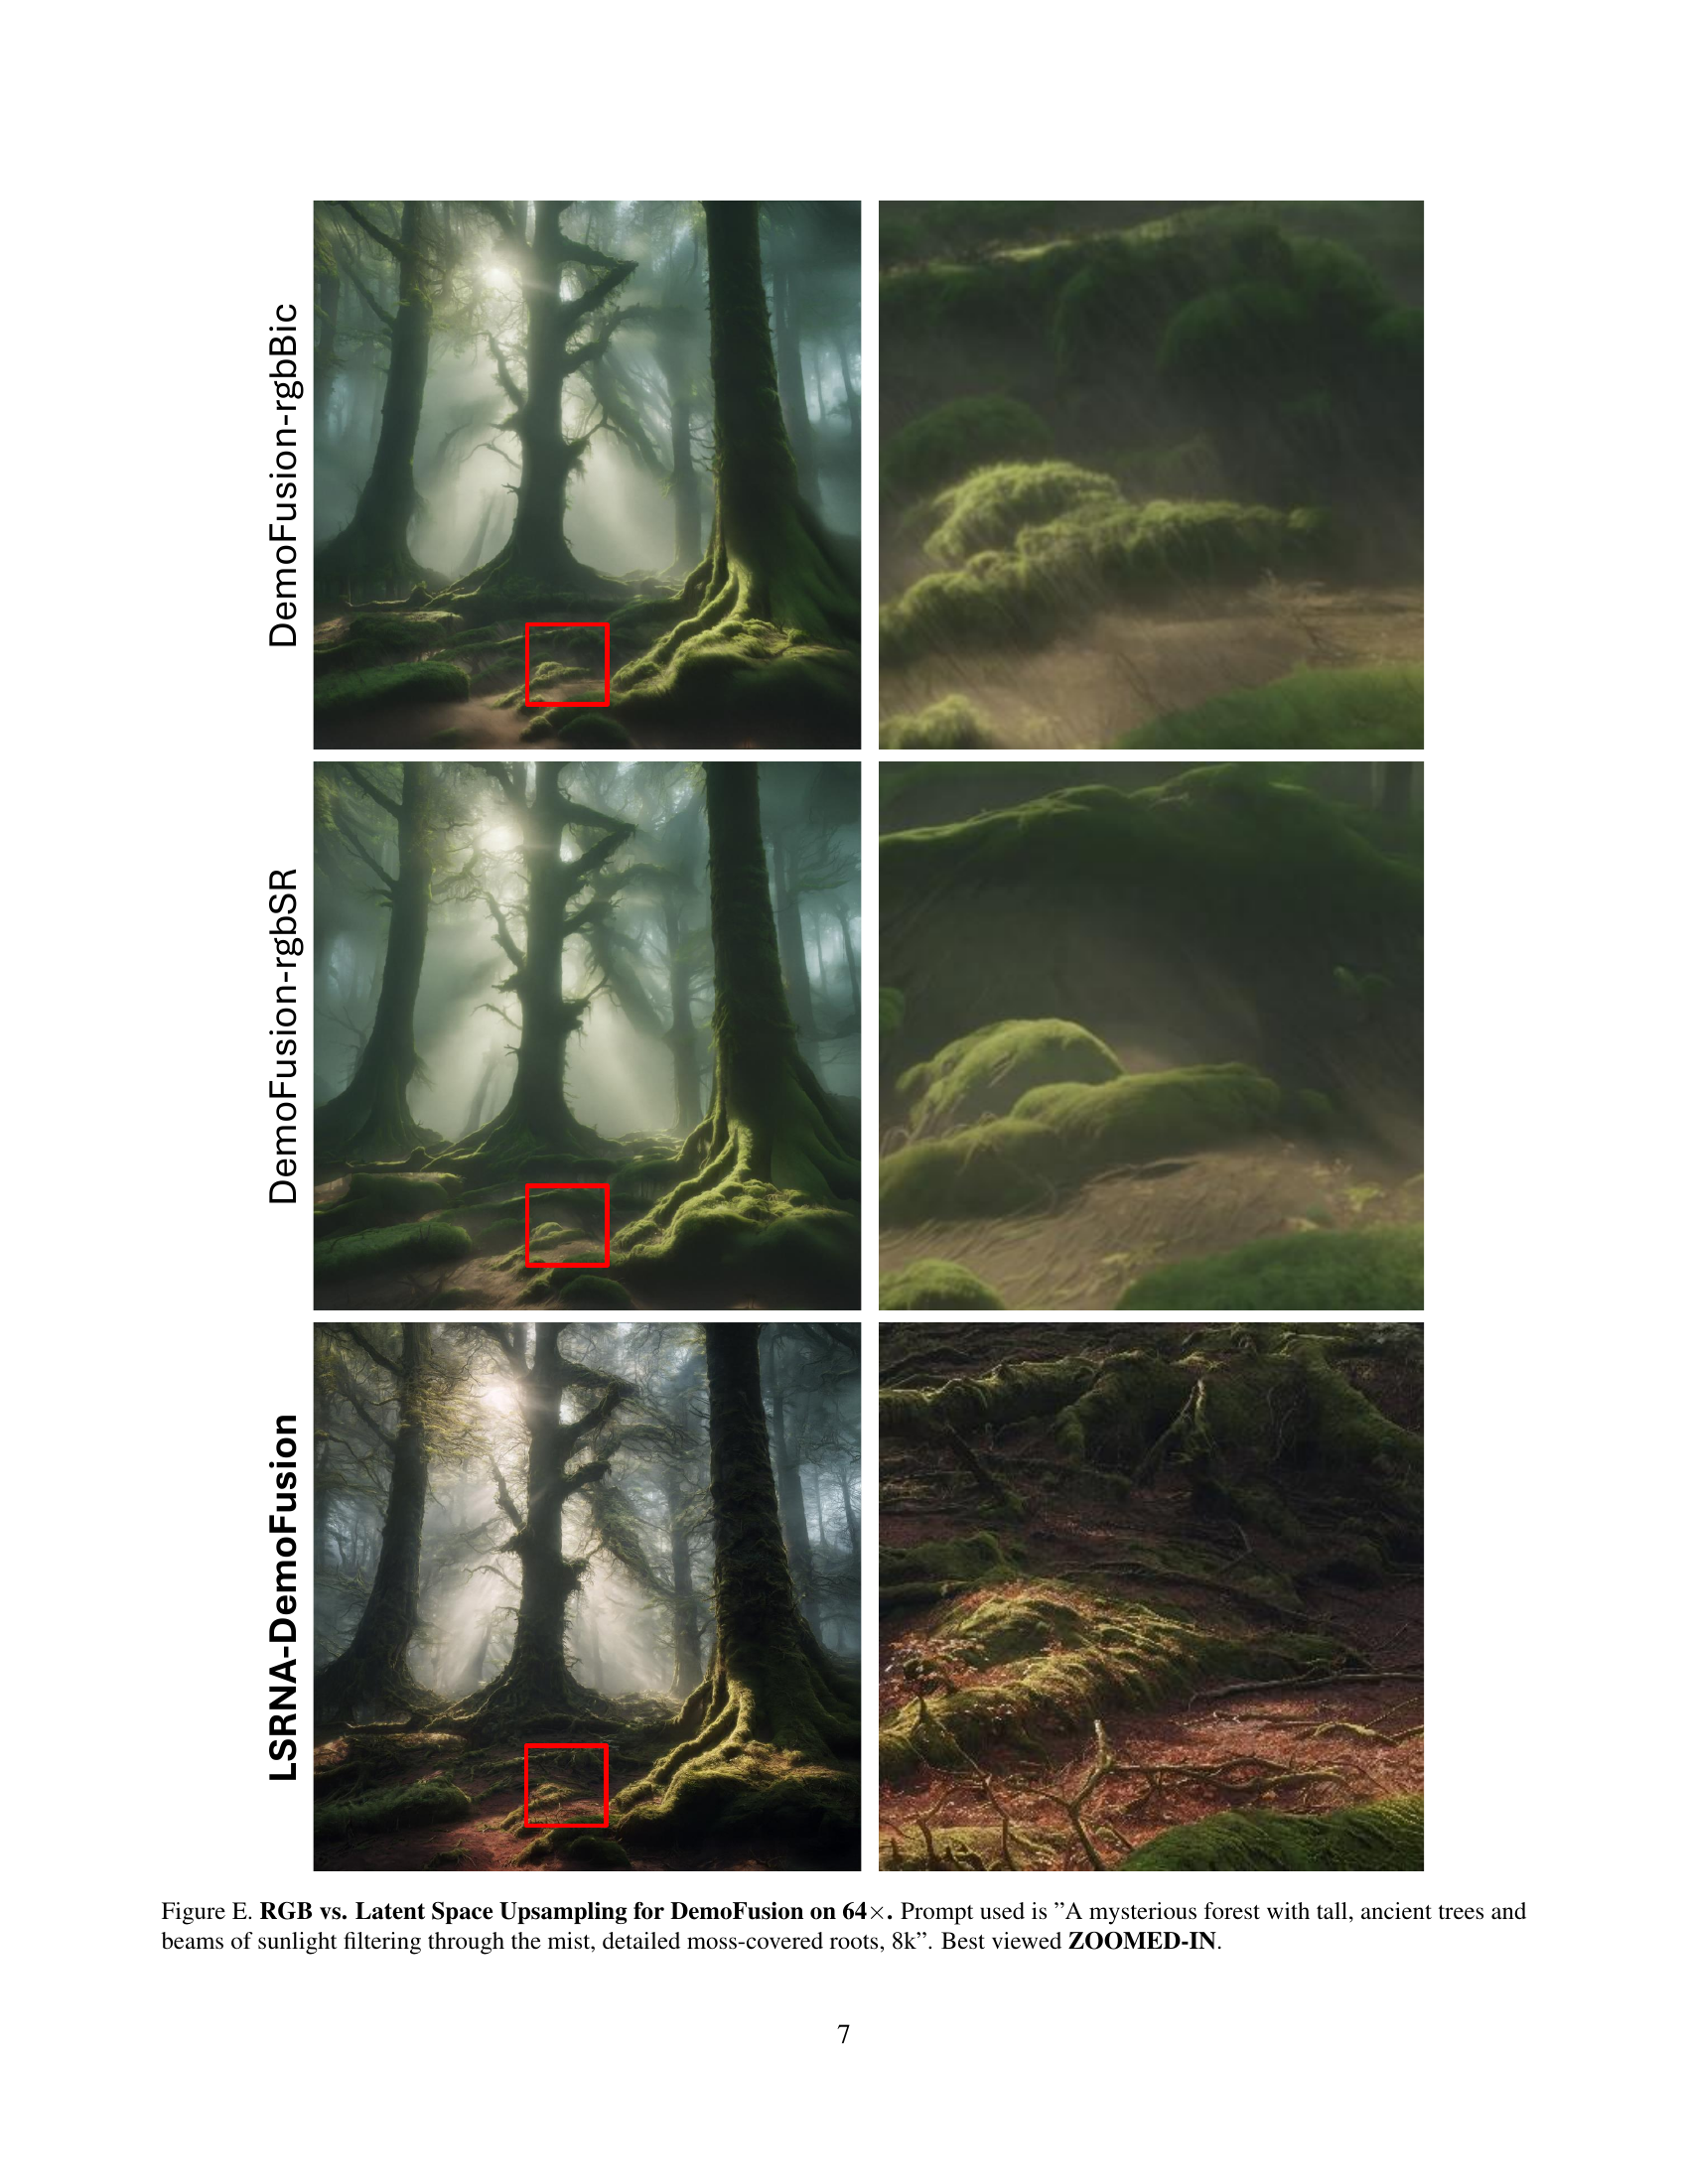
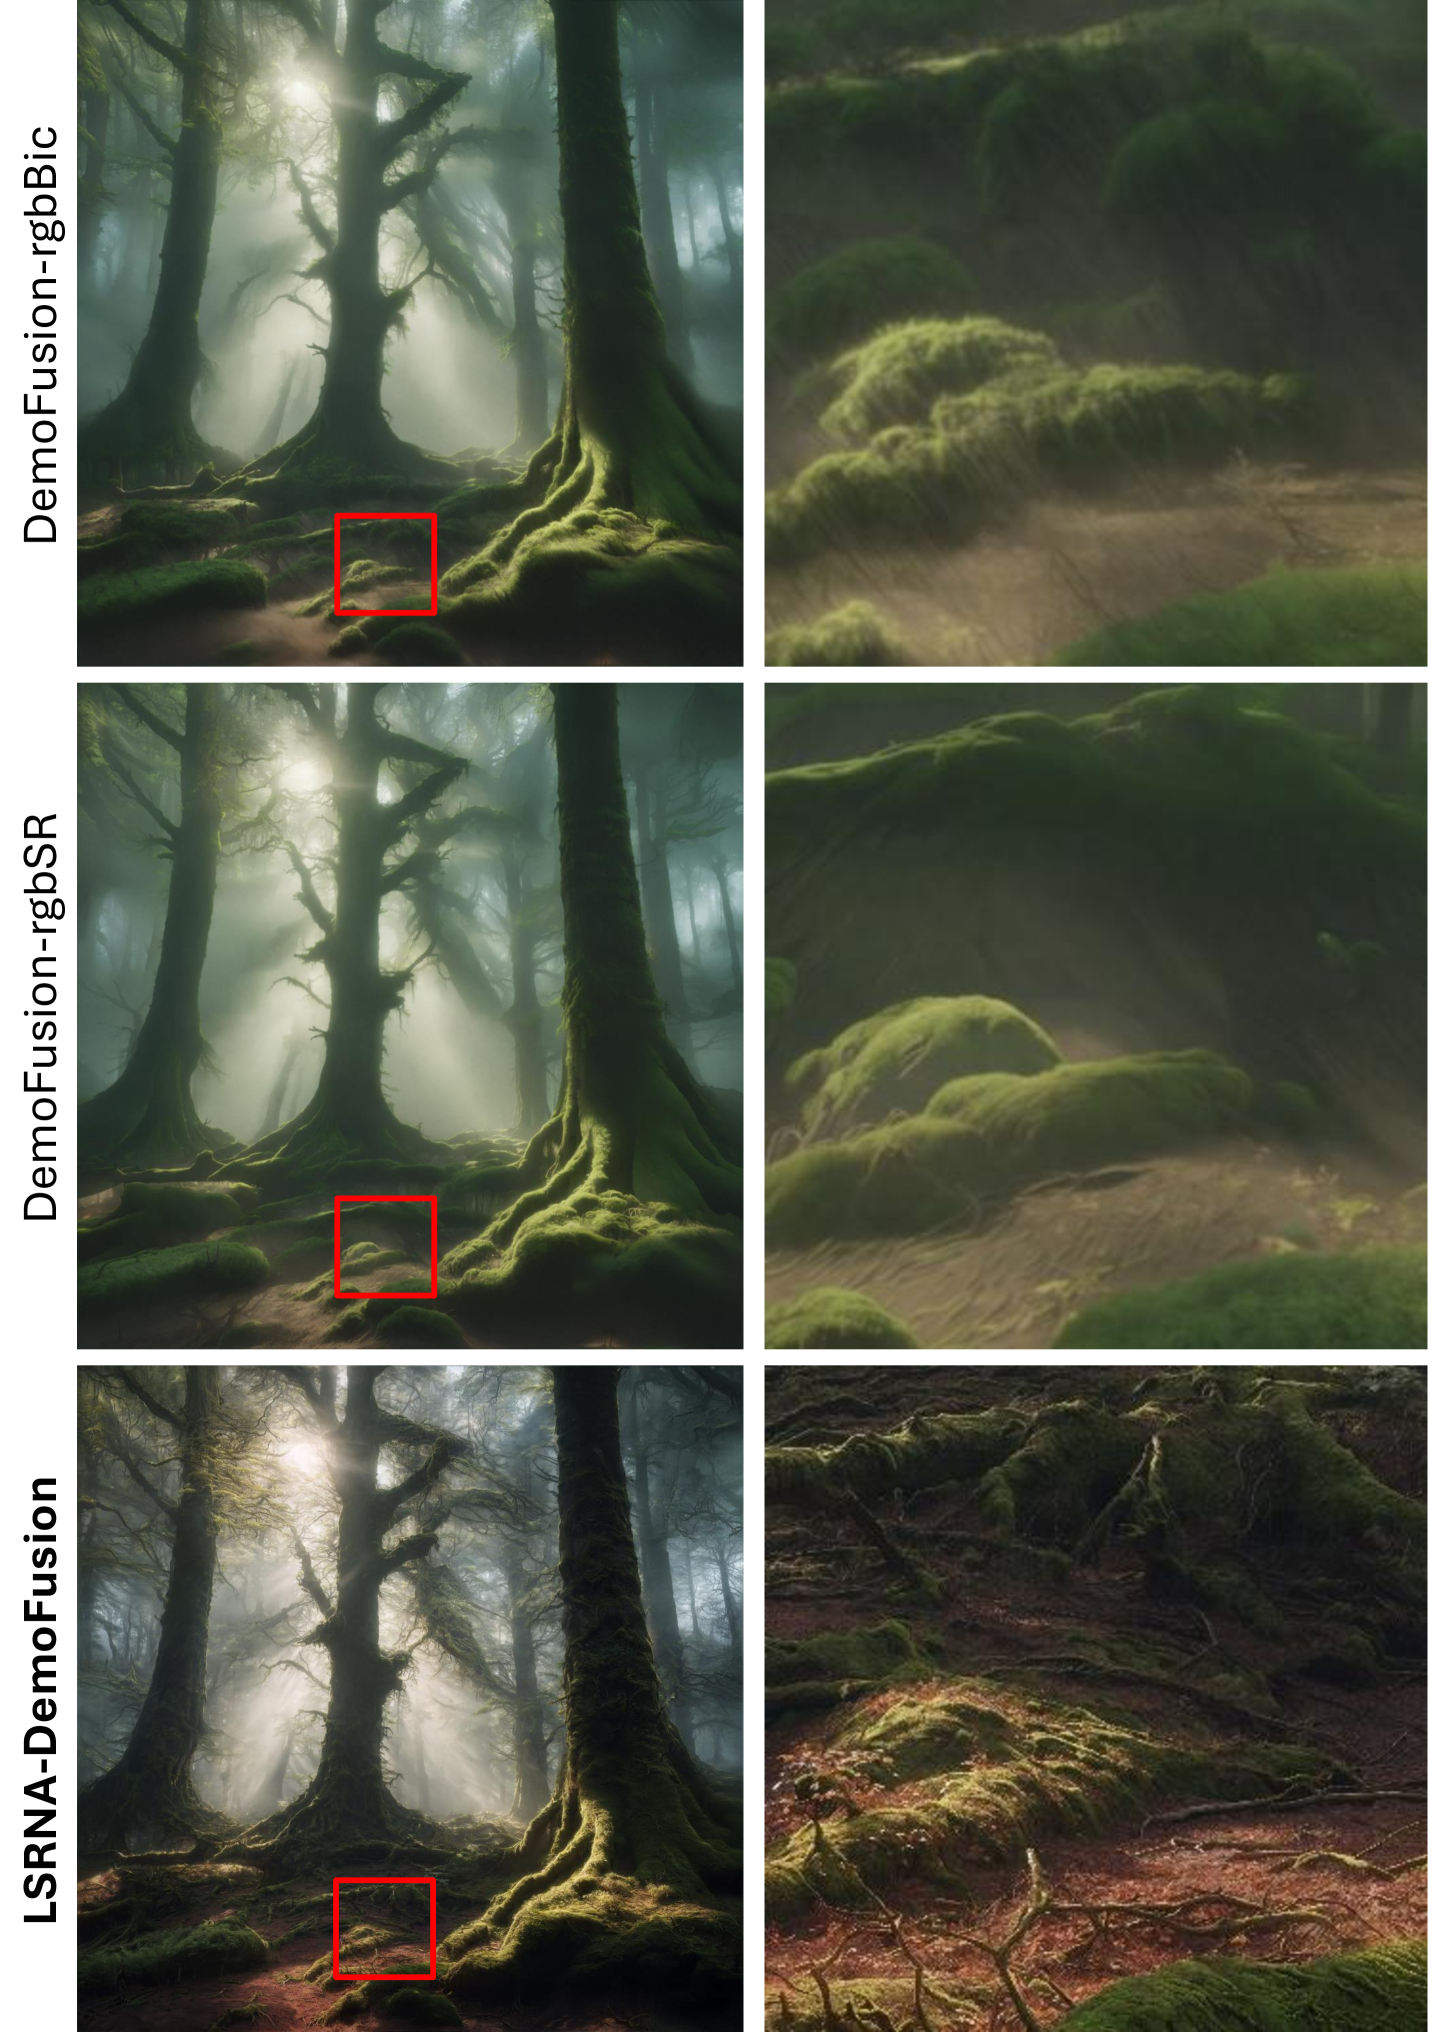
🔼 This figure compares the results of generating a 64x upscaled image using DemoFusion with different upsampling methods. It demonstrates the visual differences between upsampling in RGB space (using bicubic and super-resolution methods) versus upsampling directly in the latent space (using the LSRNA framework). The prompt used for image generation is: ‘A mysterious forest with tall, ancient trees and beams of sunlight filtering through the mist, detailed moss-covered roots, 8k’. The latent space upsampling method is shown to produce sharper and more detailed results.
read the caption
Figure E: RGB vs. Latent Space Upsampling for DemoFusion on 64×\times×. Prompt used is 'A mysterious forest with tall, ancient trees and beams of sunlight filtering through the mist, detailed moss-covered roots, 8k'. Best viewed ZOOMED-IN.
More on tables
| FID (↓) | KID (↓) | pFID (↓) | pKID (↓) | Time (sec) | |
|---|---|---|---|---|---|
| DemoFusion | 131.95 | 0.0064 | 38.75 | 0.0075 | 660 |
| \cdashline1-6 LSRNA-DemoFusion (w/o RNA) | 132.65 | 0.0065 | 37.10 | 0.0057 | 272 |
| LSRNA-DemoFusion | 132.01 | 0.0053 | 35.95 | 0.0057 | 272 |
🔼 This table presents the results of ablation studies conducted on the LSRNA framework using the DemoFusion model. The goal is to show the impact of each component of LSRNA (Latent Space Super-Resolution and Region-wise Noise Addition) on image generation quality. The table shows FID, KID, pFID, pKID, and inference time for three scenarios: the baseline DemoFusion model, DemoFusion with only the LSR module, and the full LSRNA framework. The metrics are evaluated on the OpenImages-Valid dataset, upscaled by a factor of 9. The best-performing configuration for each metric is highlighted in bold.
read the caption
Table 2: LSR & RNA ablation on OpenImages-Valid (×\times×9) with DemoFusion. The best results marked in bold.
| 4 (20482048) | 9 (30723072) | 16 (40964096) | |||||||
| FID (↓) | pFID (↓) | FID (↓) | pFID (↓) | FID (↓) | pFID (↓) | ||||
| 0.0 | 132.27 | 53.40 | 0.0 | 132.65 | 37.10 | 0.0 | 135.00 | 34.00 | |
| \cdashline1-9 0.8 | 131.87 | 53.03 | 0.8 | 132.68 | 36.40 | 0.8 | 135.29 | 33.62 | |
| 1.0 | 132.13 | 53.28 | 1.0 | 132.43 | 36.12 | 1.0 | 135.09 | 33.64 | |
| 1.2 | 131.47 | 52.96 | 1.2 | 132.01 | 35.95 | 1.2 | 134.90 | 33.35 | |
| 1.4 | 131.44 | 53.12 | 1.4 | 131.73 | 36.04 | 1.4 | 134.71 | 33.77 | |
🔼 This table presents the results of an ablation study investigating the impact of different RNA (Region-wise Noise Addition) strengths on the quality of images generated using the DemoFusion model. The study varies the maximum value (emax) of the normalized edge map used to modulate Gaussian noise, while keeping the minimum value (emin) fixed at 0. The table evaluates the performance using FID and pFID metrics (Frechet Inception Distance and patch-based FID, respectively) at three different resolutions (2048x2048, 3072x3072, and 4096x4096). The goal is to determine the optimal RNA strength that balances detail enhancement and avoids over-generation.
read the caption
Table 3: Ablation study on RNA strength using OpenImages-Valid with DemoFusion. The best results are marked in bold. eminsubscript𝑒𝑚𝑖𝑛e_{min}italic_e start_POSTSUBSCRIPT italic_m italic_i italic_n end_POSTSUBSCRIPT is set to 0.
| FID (↓) | KID (↓) | pFID (↓) | pKID (↓) | |
|---|---|---|---|---|
| DemoFusion-rgbBic | 134.56 | 0.0084 | 37.44 | 0.0062 |
| DemoFusion-rgbSR | 134.55 | 0.0093 | 37.35 | 0.0061 |
| \cdashline1-5 LSRNA-DemoFusion | 132.01 | 0.0053 | 35.95 | 0.0057 |
| Pixelsmith-rgbLanc | 134.31 | 0.0095 | 40.64 | 0.0084 |
| Pixelsmith-rgbSR | 134.34 | 0.0102 | 44.41 | 0.0110 |
| \cdashline1-5 LSRNA-Pixelsmith | 132.17 | 0.0077 | 36.71 | 0.0057 |
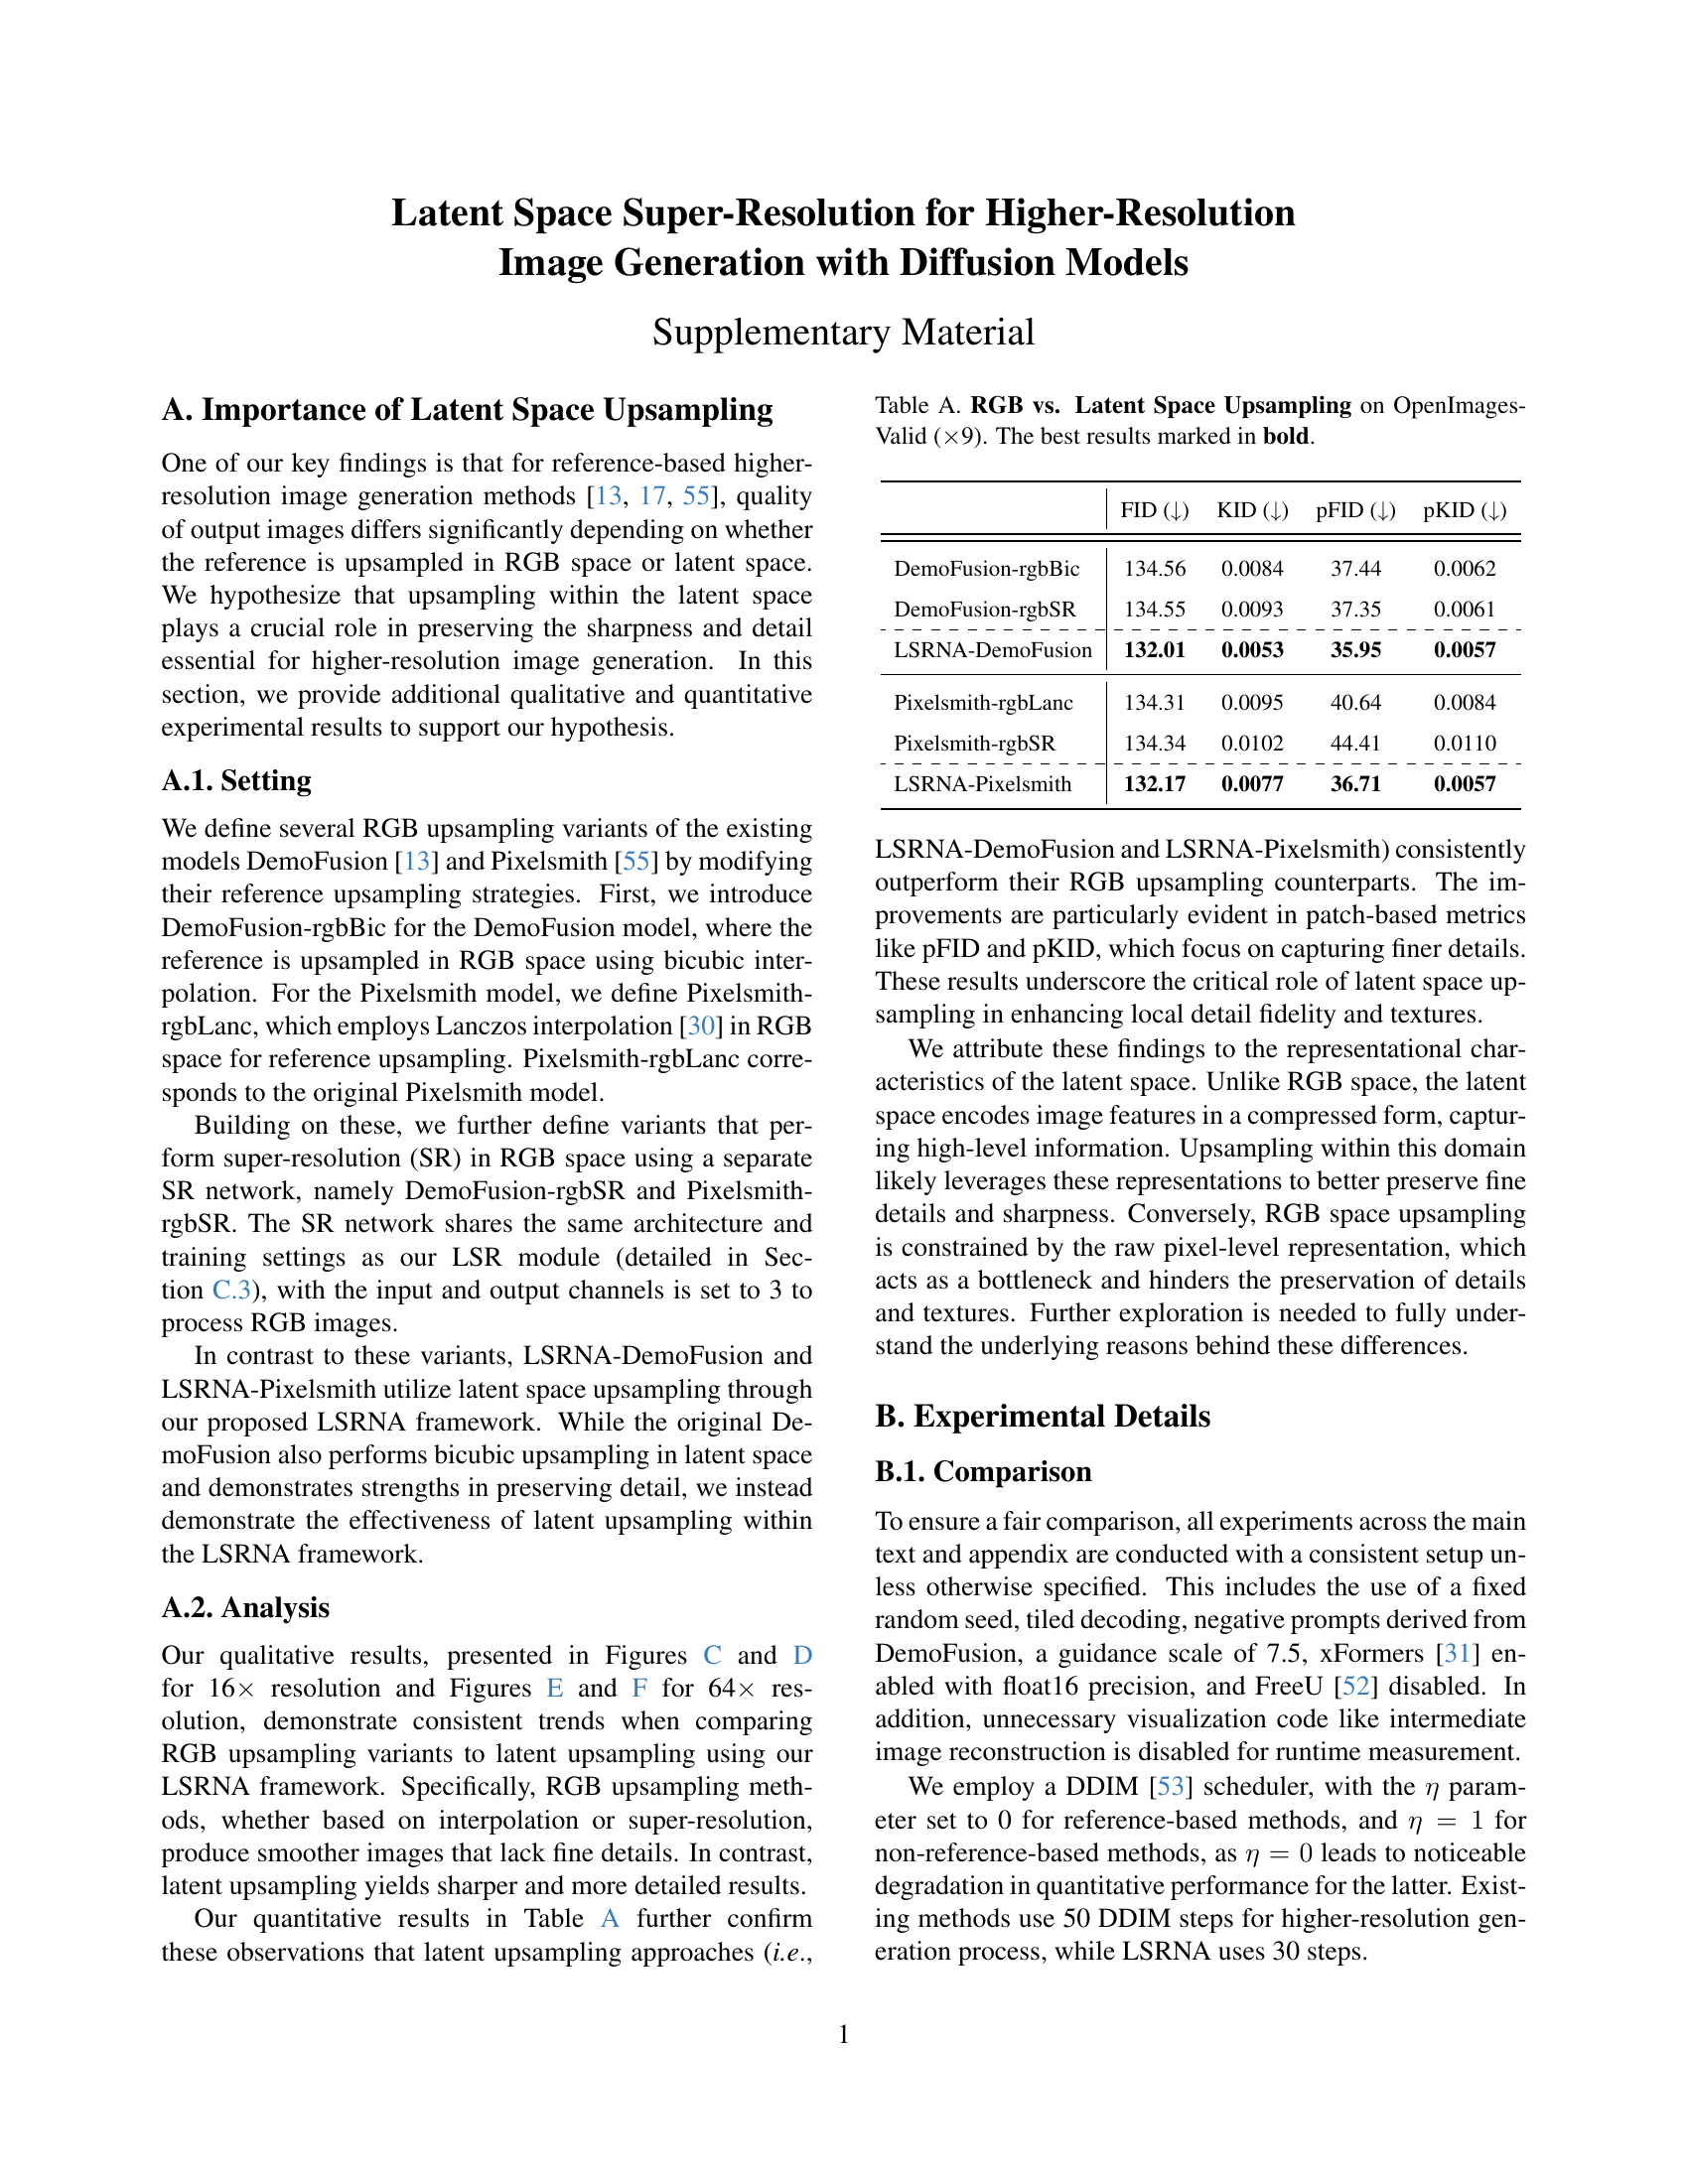
🔼 This table presents a quantitative comparison of different image generation methods, categorized by whether they use RGB or latent space upsampling. It shows the FID, KID, pFID, and pKID scores for each method, providing insights into how the choice of upsampling space affects the overall quality of the generated images, particularly regarding detail preservation. Specifically, it compares standard methods (DemoFusion and Pixelsmith) to versions of those models that use bicubic upsampling or super-resolution upsampling in RGB space, and to the same models modified to use the authors’ proposed latent-space upsampling techniques (LSRNA-DemoFusion and LSRNA-Pixelsmith). The results highlight the superiority of latent-space upsampling for achieving both higher quality and faster inference times.
read the caption
Table A: RGB vs. Latent Space Upsampling on OpenImages-Valid (×\times×9). The best results marked in bold.
| LSRNA-DemoFusion | v1 (adpoted) | v2 | v3 | v4 |
|---|---|---|---|---|
| Params | 1.29M | 1.29M | 1.29M | 15.64M |
| Backbone | SwinIR (Light) | SwinIR (Light) | SwinIR (Light) | RCAN |
| \cdashline1-5 Initial learning rate | ||||
| Batch size | 32 | 32 | 16 | 32 |
| Training iteration | 200K | 1000K | 200K | 200K |
| Training time | 26h | 129h | 15h | 26h |
| \cdashline1-5 FID (↓) | 134.84 | 134.90 | 134.28 | 134.25 |
| KID (↓) | 0.0077 | 0.0077 | 0.0077 | 0.0074 |
| pFID (↓) | 33.47 | 33.35 | 33.75 | 34.34 |
| pKID (↓) | 0.0073 | 0.0072 | 0.0074 | 0.0076 |
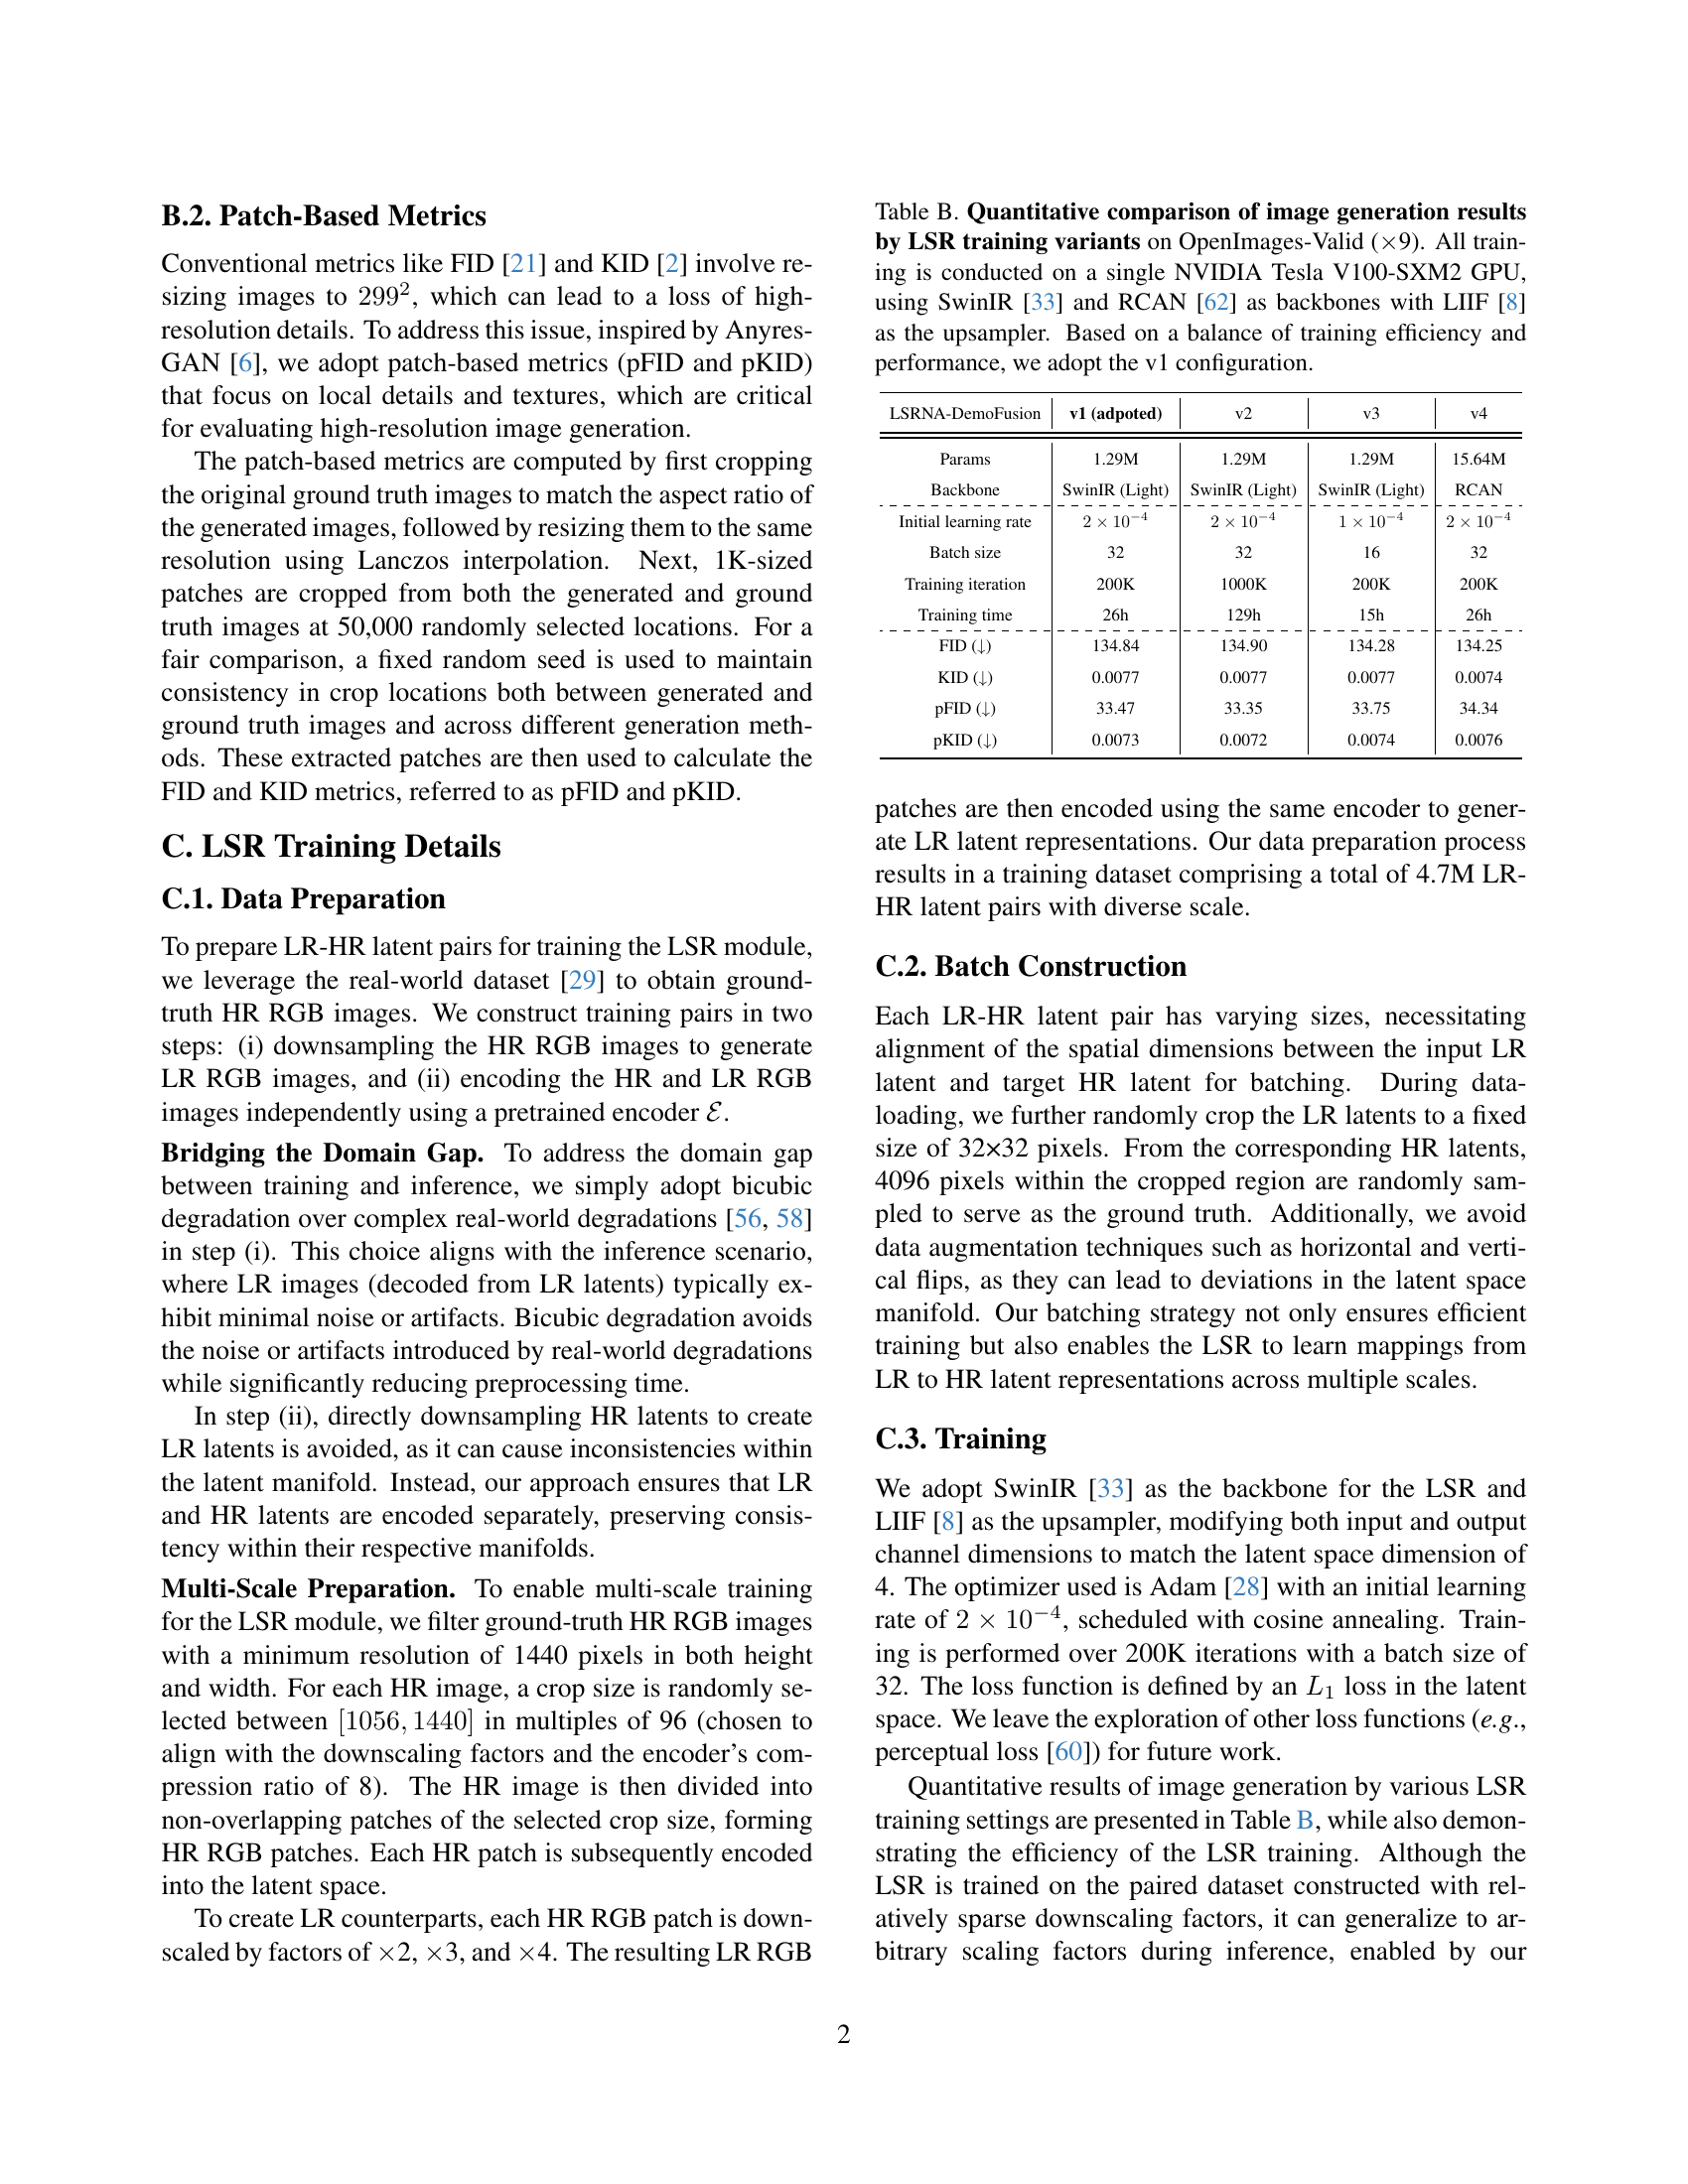
🔼 Table B presents a quantitative comparison of image generation results obtained using different configurations for training the Latent Space Super-Resolution (LSR) module. Four training variants (v1-v4) were compared, each utilizing different backbones (SwinIR [33] and RCAN [62]) and upsamplers (LIIF [8]). The training was performed on a single NVIDIA Tesla V100-SXM2 GPU using the OpenImages-Valid dataset (×9). The v1 configuration was selected based on its balance of training efficiency and performance. The table provides metrics (FID, KID, pFID, pKID) to evaluate the image quality for each variant.
read the caption
Table B: Quantitative comparison of image generation results by LSR training variants on OpenImages-Valid (×\times×9). All training is conducted on a single NVIDIA Tesla V100-SXM2 GPU, using SwinIR [33] and RCAN [62] as backbones with LIIF [8] as the upsampler. Based on a balance of training efficiency and performance, we adopt the v1 configuration.
| lower | upper | FID (↓) | KID (↓) | pFID (↓) | pKID (↓) |
|---|---|---|---|---|---|
| 0 | 255 | 132.01 | 0.0053 | 35.95 | 0.0057 |
| 30 | 180 | 132.18 | 0.0055 | 36.01 | 0.0057 |
| 50 | 200 | 132.54 | 0.0055 | 36.09 | 0.0057 |
| 60 | 150 | 132.19 | 0.0055 | 36.12 | 0.0057 |
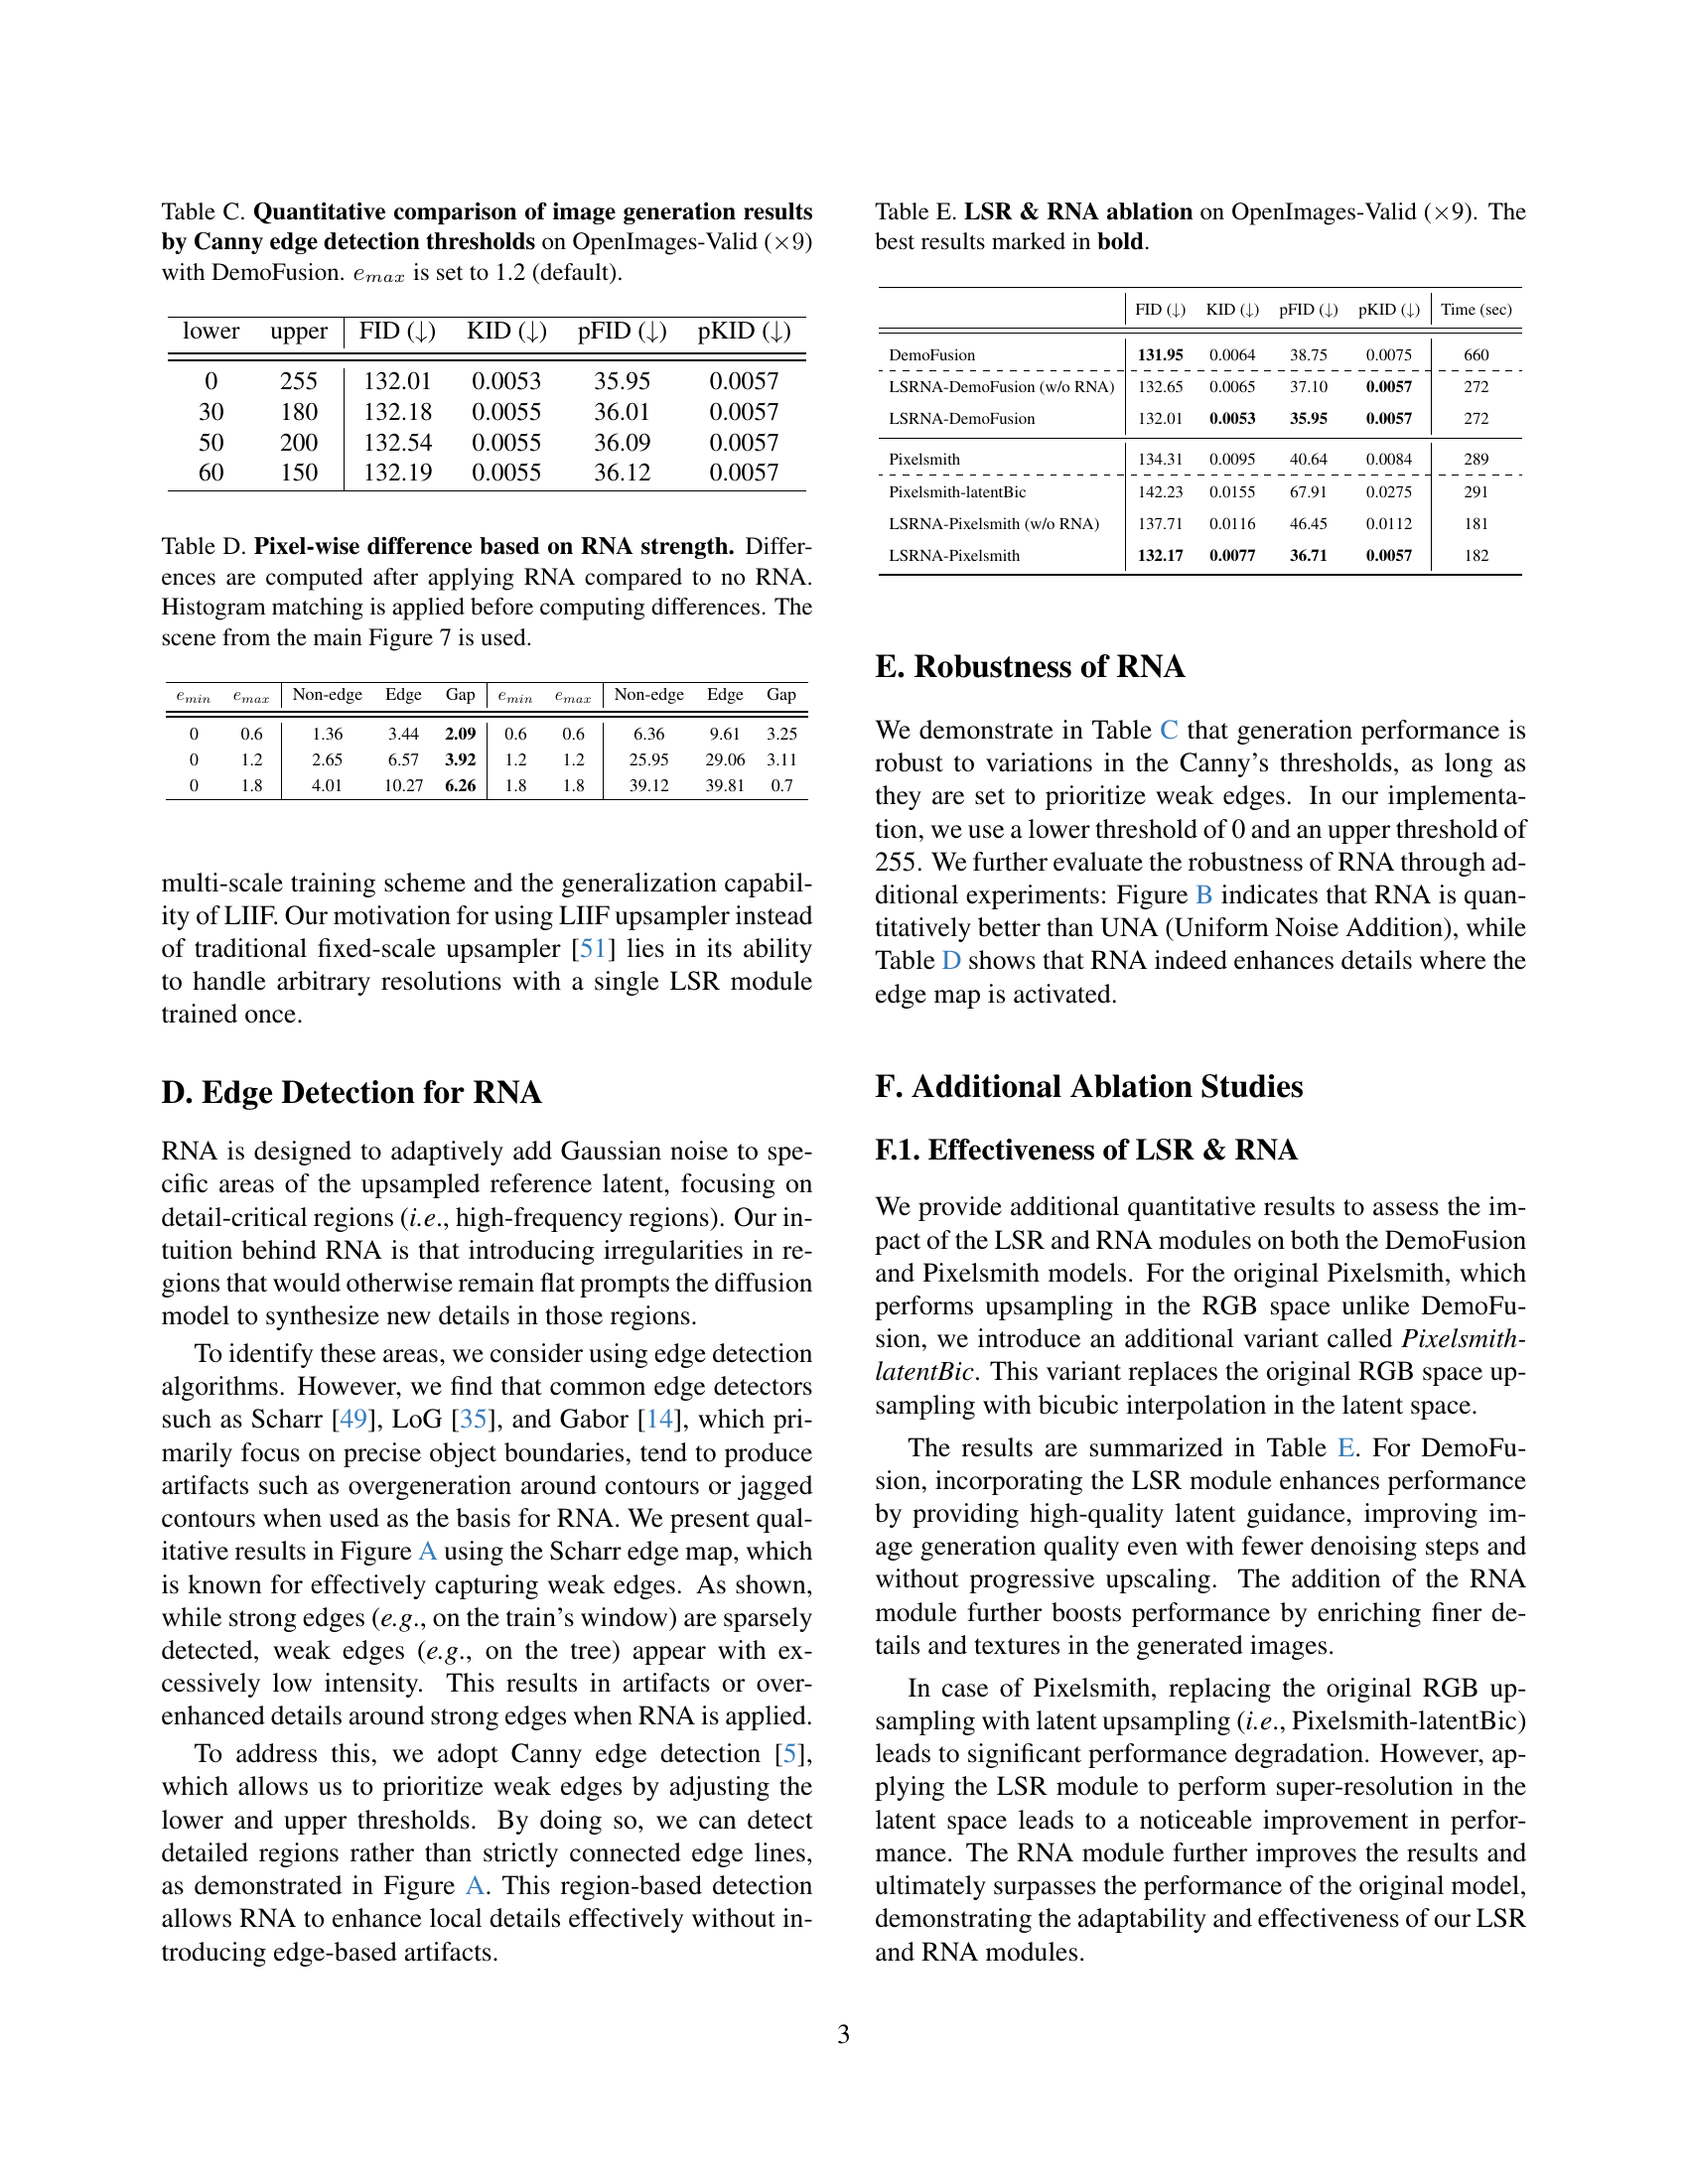
🔼 Table C presents a quantitative analysis of image generation results using the DemoFusion model. The key variable manipulated is the threshold used in Canny edge detection, which is a crucial component of the Region-wise Noise Addition (RNA) module within the LSRNA framework. The table shows how different Canny edge detection thresholds impact the quality of the generated images on the OpenImages-Valid dataset, specifically comparing metrics like FID, KID, pFID, and pKID at different resolution levels. The results demonstrate the sensitivity of the image generation process to the choice of edge detection parameters within the RNA module and help to optimize this parameter for improved image quality.
read the caption
Table C: Quantitative comparison of image generation results by Canny edge detection thresholds on OpenImages-Valid (×9absent9\times 9× 9) with DemoFusion. emaxsubscript𝑒𝑚𝑎𝑥e_{max}italic_e start_POSTSUBSCRIPT italic_m italic_a italic_x end_POSTSUBSCRIPT is set to 1.2 (default).
| Non-edge | Edge | Gap | Non-edge | Edge | Gap | ||||
|---|---|---|---|---|---|---|---|---|---|
| 0 | 0.6 | 1.36 | 3.44 | 2.09 | 0.6 | 0.6 | 6.36 | 9.61 | 3.25 |
| 0 | 1.2 | 2.65 | 6.57 | 3.92 | 1.2 | 1.2 | 25.95 | 29.06 | 3.11 |
| 0 | 1.8 | 4.01 | 10.27 | 6.26 | 1.8 | 1.8 | 39.12 | 39.81 | 0.7 |
🔼 This table presents a quantitative analysis of the impact of RNA strength on pixel-wise image differences. For each RNA strength level (specified by parameters ’emin’ and ’emax’), the table shows the average difference in pixel values compared to an image generated without RNA. Before computing differences, histogram matching was performed to ensure consistent brightness levels between the images. The image differences are broken down for non-edge, edge, and gap regions to understand where the RNA has a greater impact. The example used is from Figure 7 of the main paper, showing a train and scenery.
read the caption
Table D: Pixel-wise difference based on RNA strength. Differences are computed after applying RNA compared to no RNA. Histogram matching is applied before computing differences. The scene from the main Figure 7 is used.
| FID (↓) | KID (↓) | pFID (↓) | pKID (↓) | Time (sec) | |
|---|---|---|---|---|---|
| DemoFusion | 131.95 | 0.0064 | 38.75 | 0.0075 | 660 |
| \cdashline1-6 LSRNA-DemoFusion (w/o RNA) | 132.65 | 0.0065 | 37.10 | 0.0057 | 272 |
| LSRNA-DemoFusion | 132.01 | 0.0053 | 35.95 | 0.0057 | 272 |
| Pixelsmith | 134.31 | 0.0095 | 40.64 | 0.0084 | 289 |
| \cdashline1-6 Pixelsmith-latentBic | 142.23 | 0.0155 | 67.91 | 0.0275 | 291 |
| LSRNA-Pixelsmith (w/o RNA) | 137.71 | 0.0116 | 46.45 | 0.0112 | 181 |
| LSRNA-Pixelsmith | 132.17 | 0.0077 | 36.71 | 0.0057 | 182 |
🔼 This table presents ablation study results evaluating the impact of the Latent Space Super-Resolution (LSR) and Region-wise Noise Addition (RNA) modules on the image generation quality using the OpenImages-Valid dataset upscaled by a factor of 9. It compares the performance of the baseline DemoFusion and Pixelsmith models against versions incorporating either just LSR, just RNA, or both LSR and RNA. The FID, KID, pFID, pKID, and inference time are reported for each model variation to quantify the effect of LSR and RNA on image quality and computational efficiency.
read the caption
Table E: LSR & RNA ablation on OpenImages-Valid (×\times×9). The best results marked in bold.
| FID (↓) | pFID (↓) | FID (↓) | pFID (↓) | ||||
|---|---|---|---|---|---|---|---|
| 0.0 | 0.0 | 137.71 | 46.45 | 0.2 | 1.2 | 133.67 | 37.76 |
| 0.0 | 1.2 | 135.15 | 40.45 | 0.2 | 1.4 | 133.72 | 38.51 |
| 0.0 | 1.4 | 134.32 | 38.75 | 0.4 | 0.6 | 132.18 | 37.3 |
| 0.0 | 1.6 | 134.34 | 38.74 | 0.4 | 0.8 | 132.17 | 36.71 |
| 0.2 | 1.0 | 133.86 | 38.51 | 0.4 | 1.0 | 132.29 | 36.95 |
🔼 This table presents the results of an ablation study investigating the impact of different Region-wise Noise Addition (RNA) strengths on the performance of the Pixelsmith model for image generation. The study uses the OpenImages-Valid dataset, upscaled by a factor of 9. The table shows how varying the minimum (emin) and maximum (emax) values of the normalized edge map used to control the amount of noise affects FID and pFID scores. The best performing RNA strength combination is highlighted in bold, demonstrating the optimal balance between enhancing image details and avoiding over-generation.
read the caption
Table F: Ablation Study on RNA strength with Pixelsmith on OpenImages-Valid (×\times×9). The best results marked in bold.
Full paper#