TL;DR#
Text-to-Video (T2V) generation has gained traction, but balancing visual quality with computational efficiency, especially on devices with limited resources (e.g., iGPUs, mobile phones), is challenging. Existing models often prioritize visual fidelity, neglecting the need for smaller, more efficient models suitable for real-world deployment. Thus, how do we achieve both computational efficiency and high visual performance, and the large model sizes hinder deployment on edge devices. To address this, a novel approach in needed to pruning the network structure without causing performance degradation.
To tackle this, the paper introduces Hummingbird, a lightweight T2V framework that prunes existing models and enhances visual quality through visual feedback learning, reducing the U-Net size from 1.4B to 0.7B parameters. It also presents a novel data processing pipeline using Large Language Models (LLMs) and Video Quality Assessment (VQA) models to improve text prompts and video data quality. Experimental results demonstrate a 31× speedup over state-of-the-art models like VideoCrafter2, achieving the highest VBench score.
Key Takeaways#
Why does it matter?#
This paper is important for researchers because it introduces a new efficient T2V generation framework that addresses the limitations of existing models. It’s relevant to current research trends focused on improving the scalability and performance of AI models on resource-constrained devices, opening avenues for real-world applications and further investigations into efficient AI solutions.
Visual Insights#

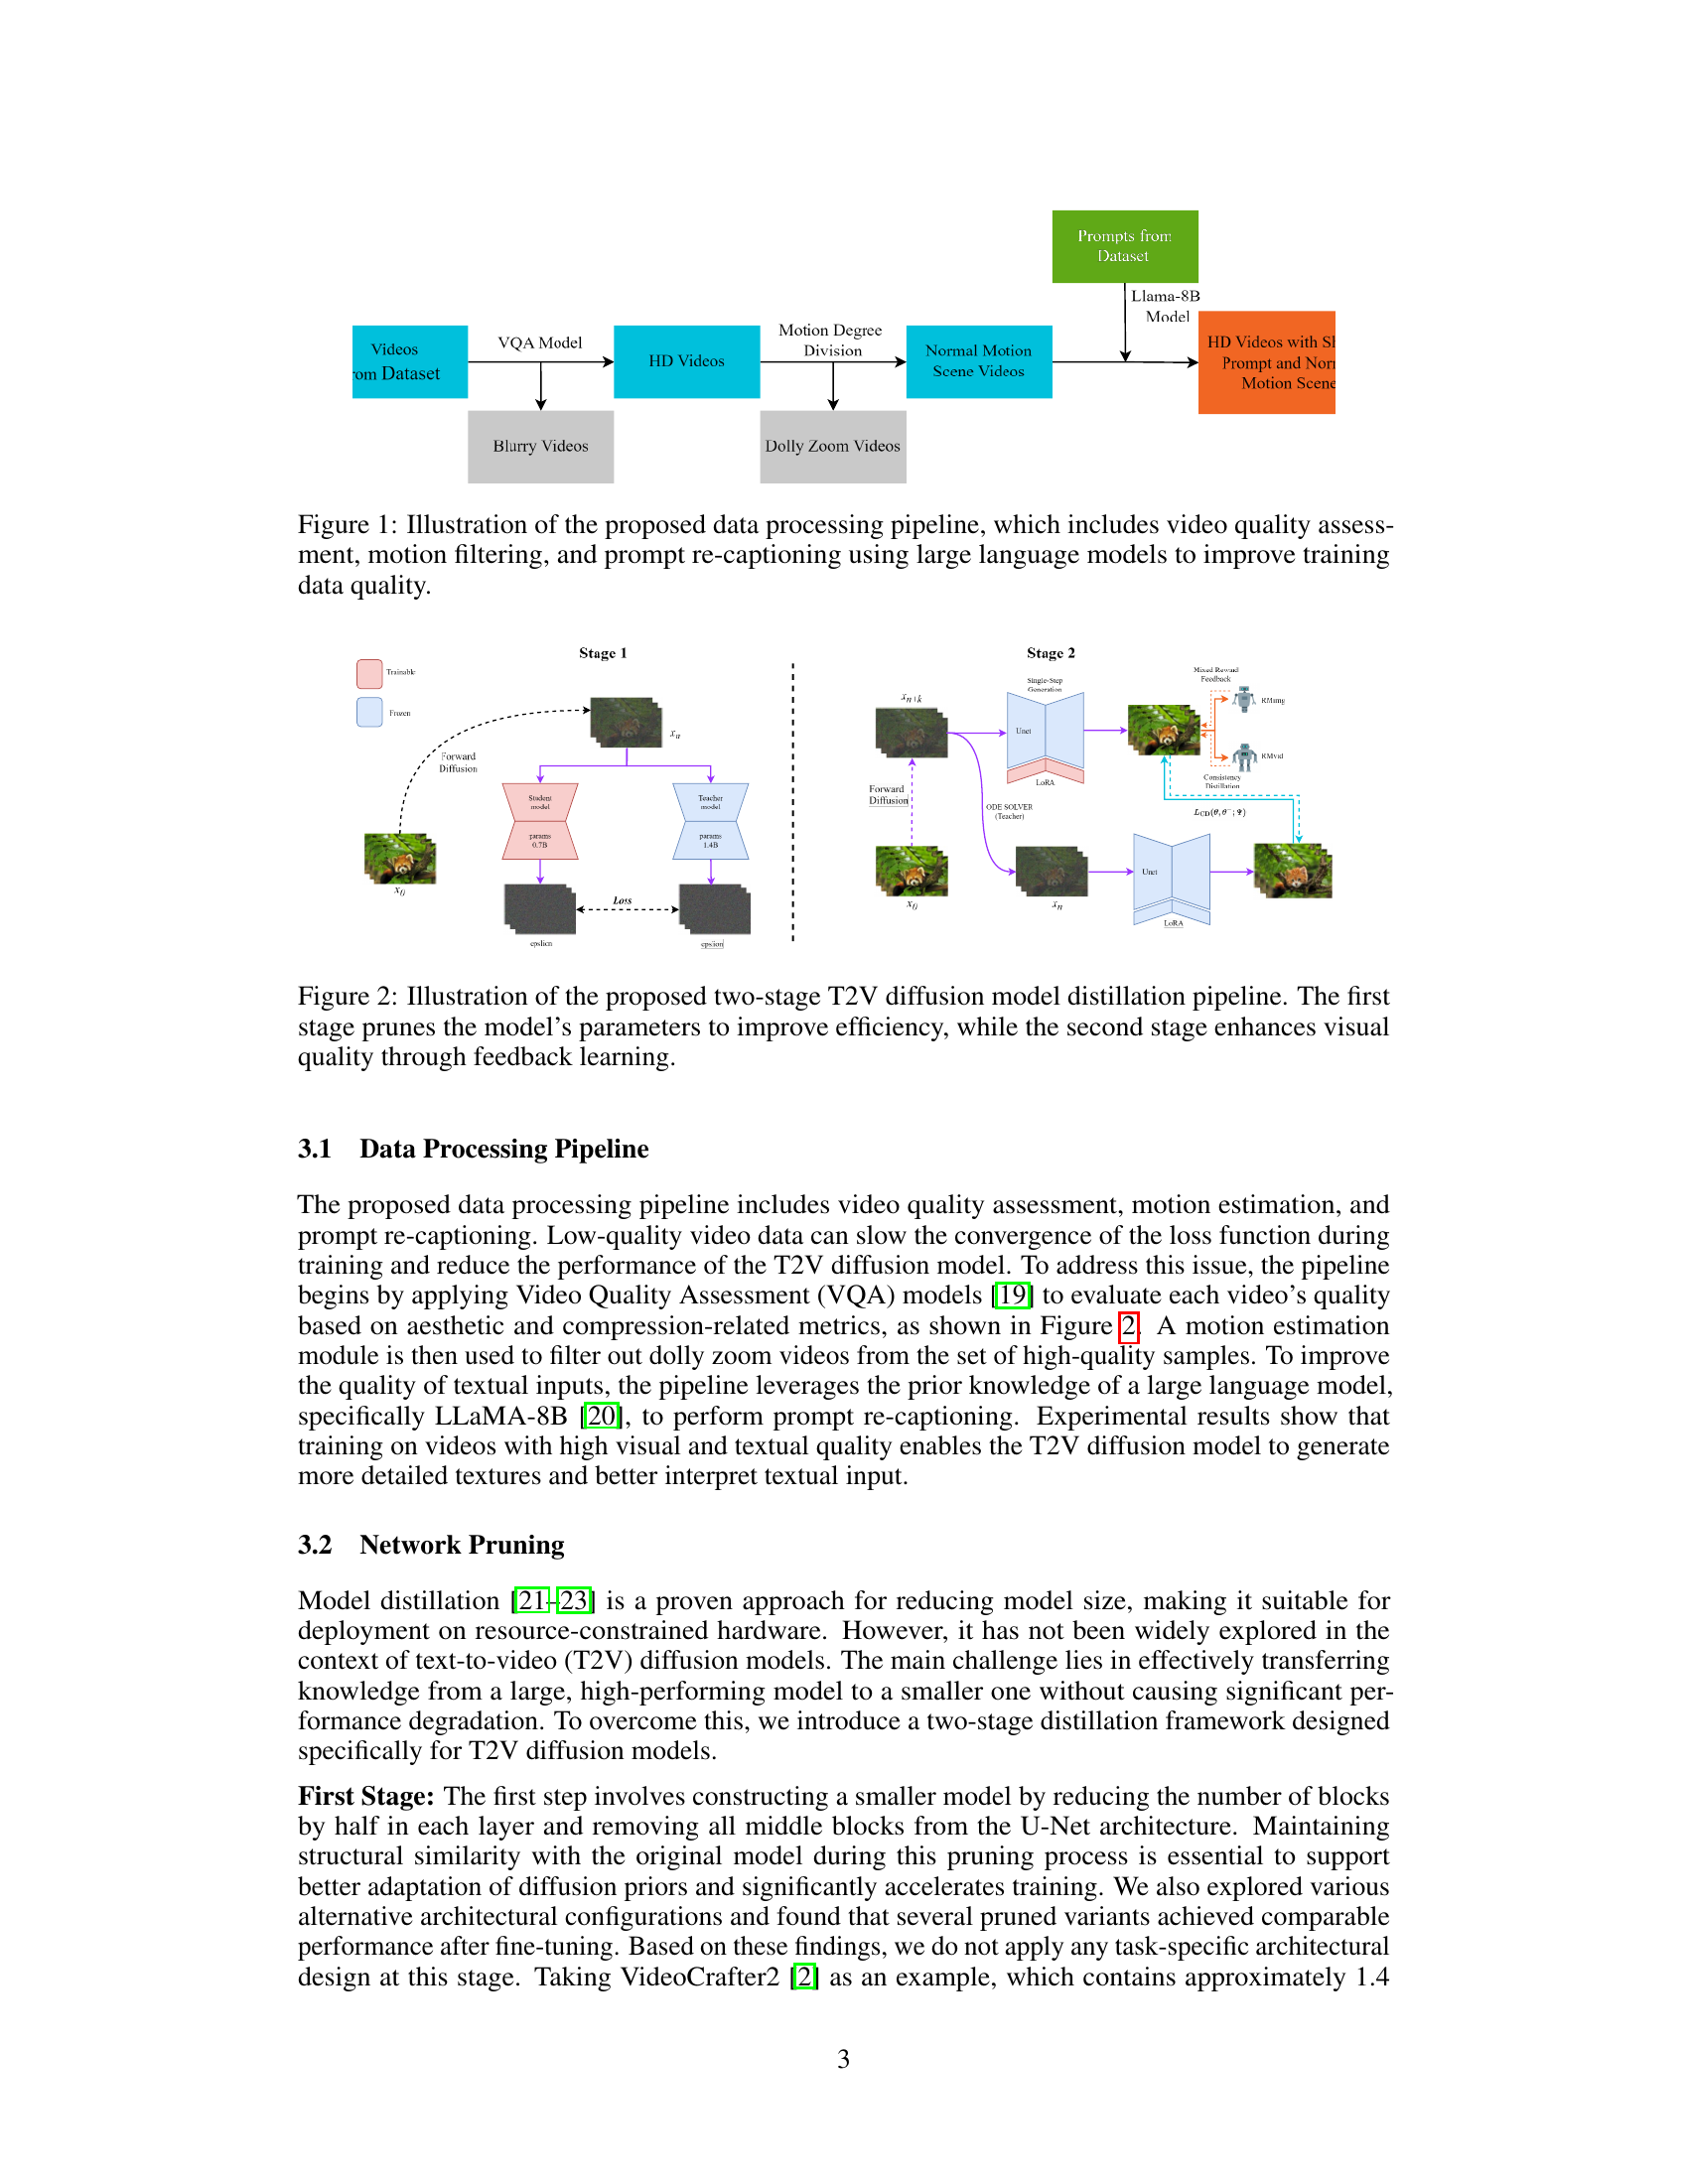
🔼 This figure illustrates the data processing pipeline used to enhance the quality of the training data for the text-to-video model. The pipeline consists of three main stages: 1) Video Quality Assessment: This stage uses a VQA model to evaluate the quality of videos based on metrics like aesthetics and compression, discarding low-quality videos. 2) Motion Filtering: This stage employs a motion estimation module to filter out videos with undesirable motion characteristics (e.g., dolly zoom effects). This filtering focuses the training data on videos with more natural and consistent movements, enhancing the model’s understanding of typical video characteristics. 3) Prompt Re-captioning: In this stage, large language models (LLMs) are utilized to rephrase or re-caption the text prompts associated with each video. The goal is to refine the prompts to be more accurate, consistent, and effective in guiding the video generation process. The improved data from all these stages are used to feed into the training of the T2V model, improving overall visual quality and model performance.
read the caption
Figure 1: Illustration of the proposed data processing pipeline, which includes video quality assessment, motion filtering, and prompt re-captioning using large language models to improve training data quality.
| Models | \CenterstackTotal | ||||||||
| \CenterstackQuality | |||||||||
| \CenterstackSubject | |||||||||
| \CenterstackBG | |||||||||
| \CenterstackTemporal | |||||||||
| \CenterstackMotion | |||||||||
| \CenterstackAesthetic | |||||||||
| \CenterstackDynamic | |||||||||
| \CenterstackImage | |||||||||
| Quality | |||||||||
| ModelScopeT2V | 75.75 | 78.05 | 89.87 | 95.29 | 98.28 | 95.79 | 52.06 | 66.39 | 58.57 |
| LaVie | 77.08 | 78.78 | 91.41 | 97.47 | 98.30 | 96.38 | 54.94 | 49.72 | 61.90 |
| Show-1 | 78.93 | 80.42 | 95.53 | 98.02 | 99.12 | 98.24 | 57.35 | 44.44 | 58.66 |
| VideoCrafter1 | 79.72 | 81.59 | 95.10 | 98.04 | 98.93 | 95.67 | 62.67 | 55.00 | 65.46 |
| Pika | 80.40 | 82.68 | 96.76 | 98.95 | 99.77 | 99.51 | 63.15 | 37.22 | 62.33 |
| VideoCrafter2 | 80.44 | 82.20 | 96.85 | 98.22 | 98.41 | 97.73 | 63.13 | 42.50 | 67.22 |
| Gen-2 | 80.58 | 82.47 | 97.61 | 97.61 | 99.56 | 99.58 | 66.96 | 18.89 | 67.42 |
| AnimateLCM | 77.74 | 80.68 | 96.57 | 96.57 | 98.41 | 98.33 | 63.26 | 33.33 | 62.30 |
| VideoLCM | 73.27 | 77.65 | 96.55 | 97.23 | 97.33 | 97.01 | 59.93 | 5.56 | 66.43 |
| T2V-Turbo | 81.01 | 82.57 | 96.28 | 97.02 | 97.48 | 97.34 | 63.04 | 49.17 | 72.49 |
| Hummingbird 16 frames (Ours) | 81.35 | 83.73 | 95.87 | 96.77 | 95.24 | 96.14 | 68.04 | 79.17 | 71.04 |
| Hummingbird 26 frames (Ours) | 80.31 | 83.11 | 96.97 | 97.73 | 97.64 | 96.97 | 67.82 | 50.00 | 69.94 |
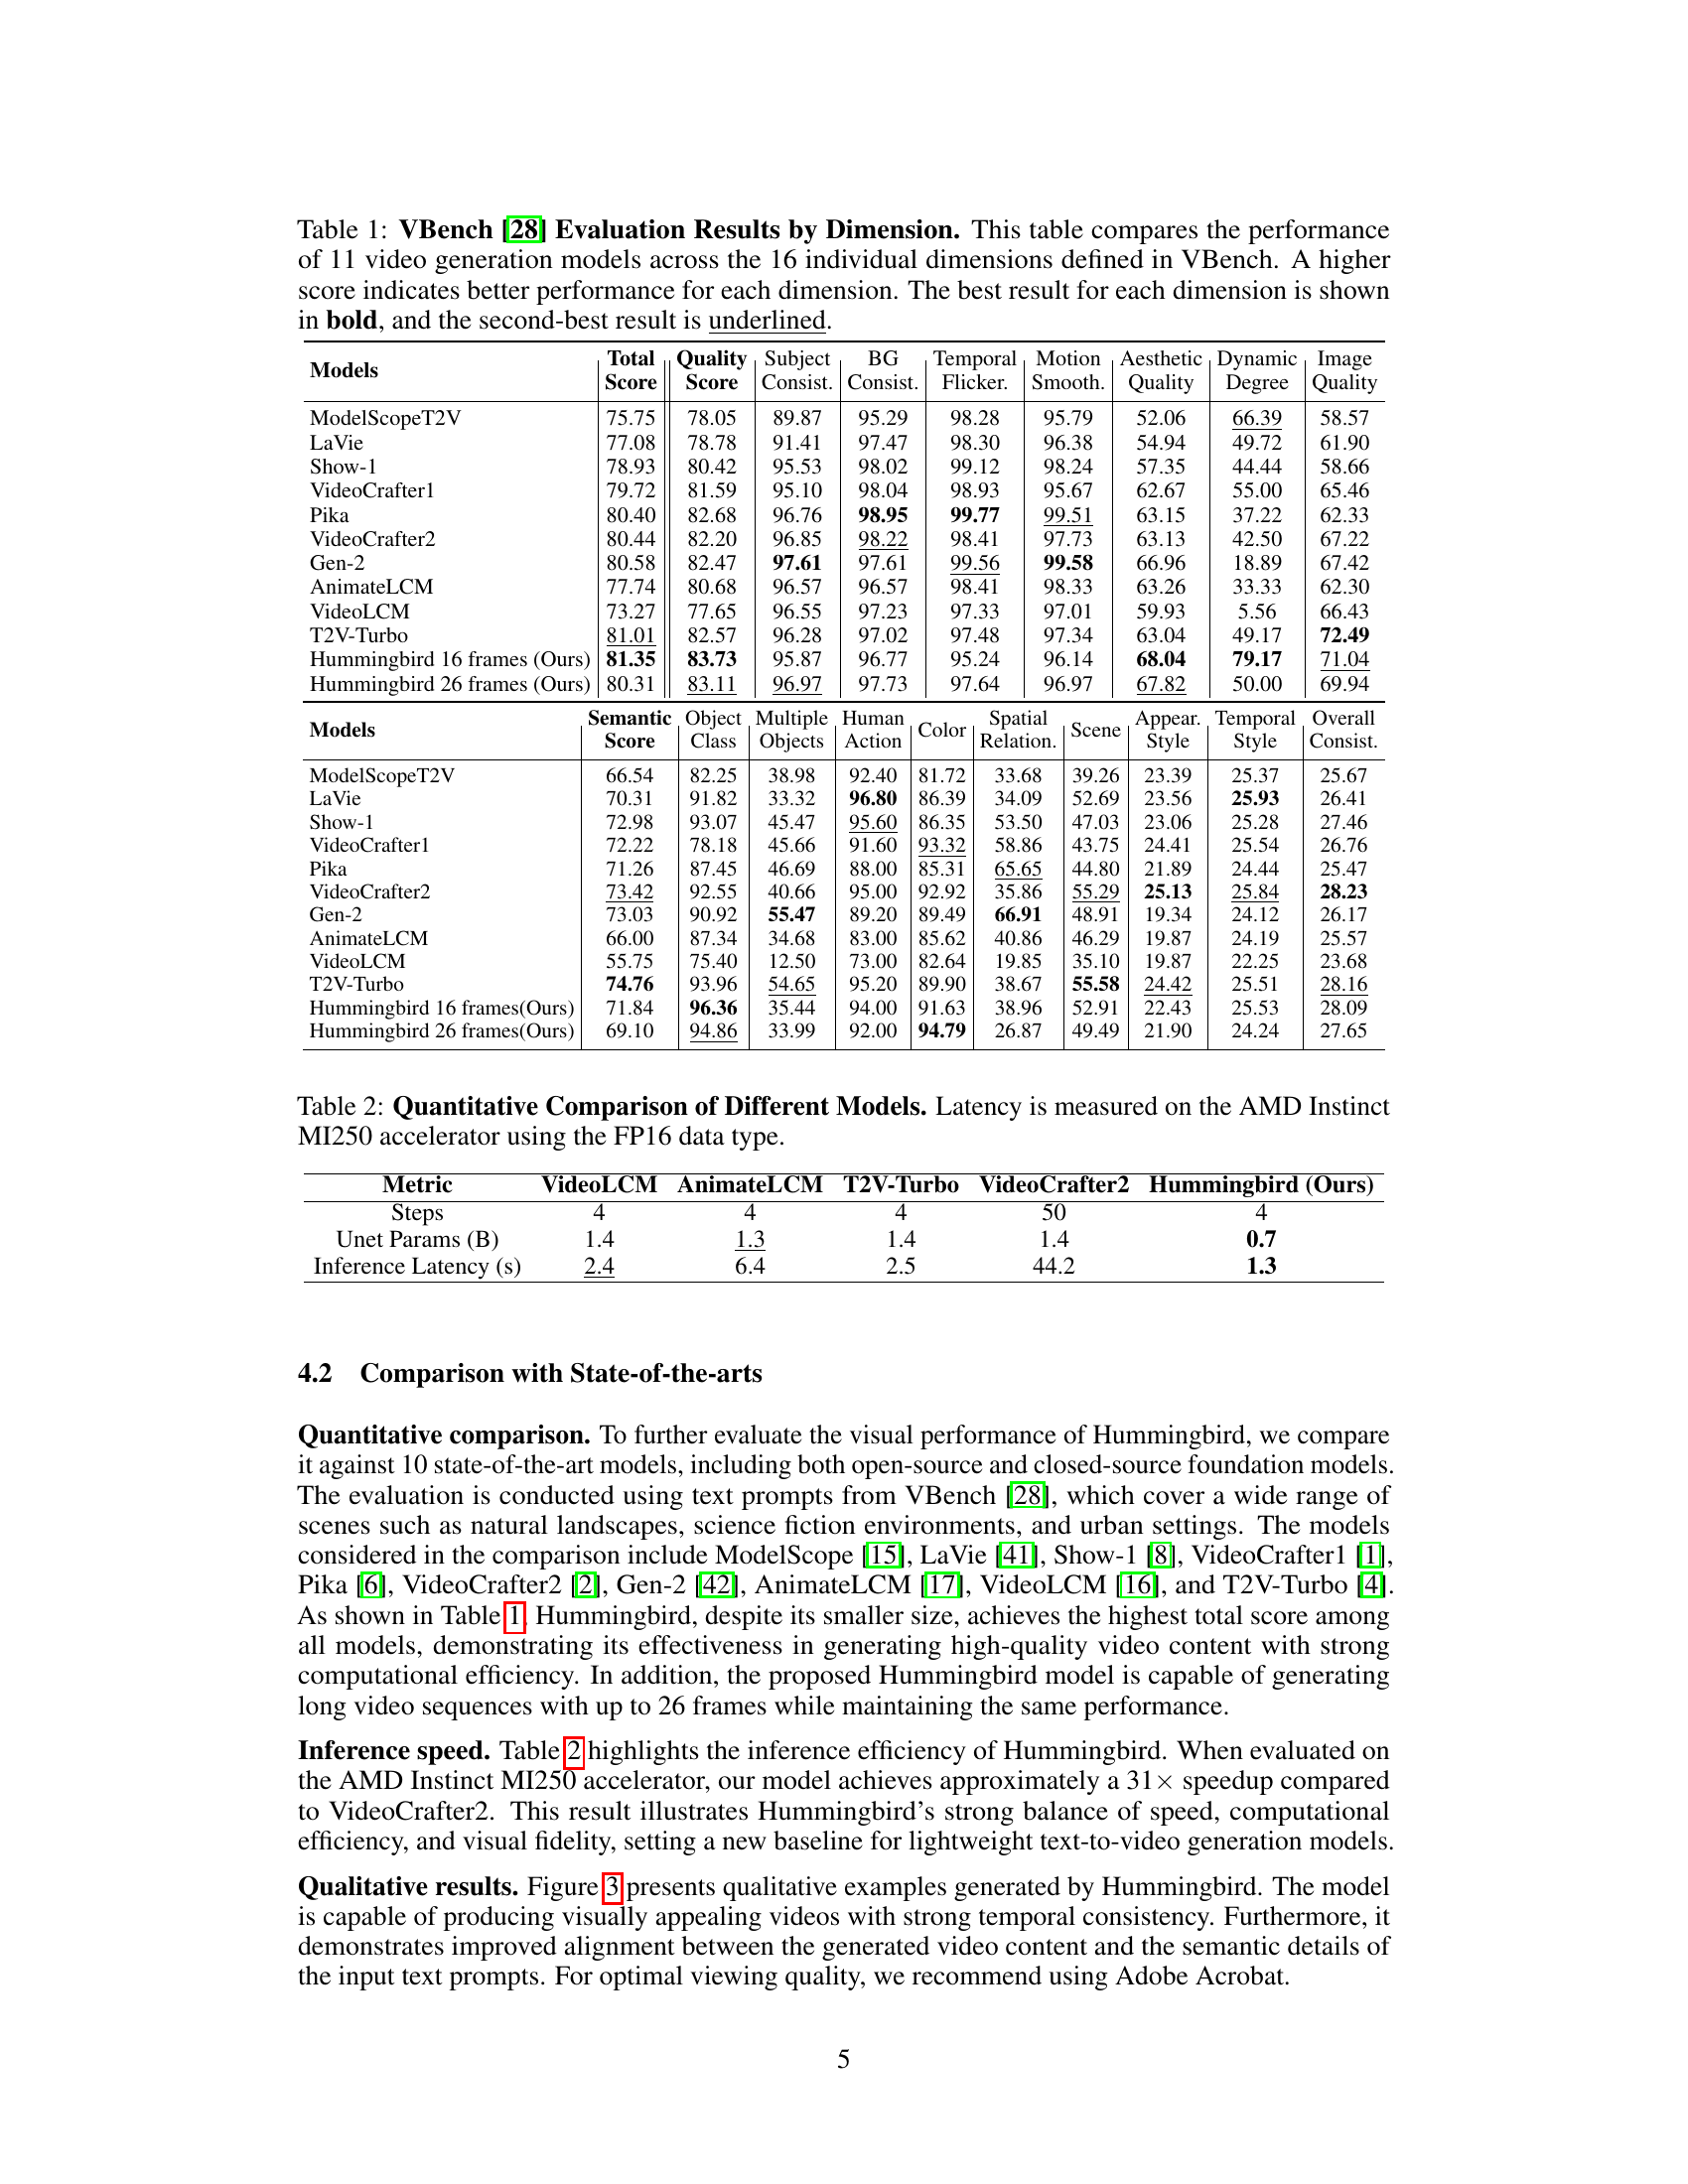
🔼 Table 1 presents a comprehensive comparison of eleven video generation models using the VBench benchmark. VBench evaluates video quality across sixteen distinct dimensions. The table shows each model’s score for every dimension, highlighting the strengths and weaknesses of each model. Higher scores signify better performance. The best score in each dimension is bolded, and the second-best score is underlined, allowing for easy identification of top-performing models in specific aspects of video generation. This detailed comparison facilitates a nuanced understanding of the relative merits of different approaches to video generation.
read the caption
Table 1: VBench [28] Evaluation Results by Dimension. This table compares the performance of 11 video generation models across the 16 individual dimensions defined in VBench. A higher score indicates better performance for each dimension. The best result for each dimension is shown in bold, and the second-best result is underlined.
Full paper#