TL;DR#
Large Video Language Models (LVLMs) show great promise for multi-modal understanding, but their ability to ground information factually in video contexts is still a challenge. Current video benchmarks often involve subjective reasoning, lack definitive answers, or don’t require external knowledge. This makes it hard to evaluate if these models truly grasp real-world facts when processing videos.
To address this, the paper introduces Video SimpleQA, a new benchmark designed to test the factuality of LVLMs. It requires models to integrate external knowledge, answer fact-seeking questions with definitive, short answers, and provide external verification sources. The benchmark reveals that current LVLMs struggle with factuality, even with test-time compute or RAG. Video SimpleQA serves as a critical tool for directing LVLM development toward verifiable real-world understanding.
Key Takeaways#
Why does it matter?#
This work introduces Video SimpleQA, a new benchmark that directly assesses factual grounding in LVLMs, which is critical for trustworthy AI. The findings highlight current limitations & guide future work toward more reliable & factual video understanding, fostering responsible AI development.
Visual Insights#

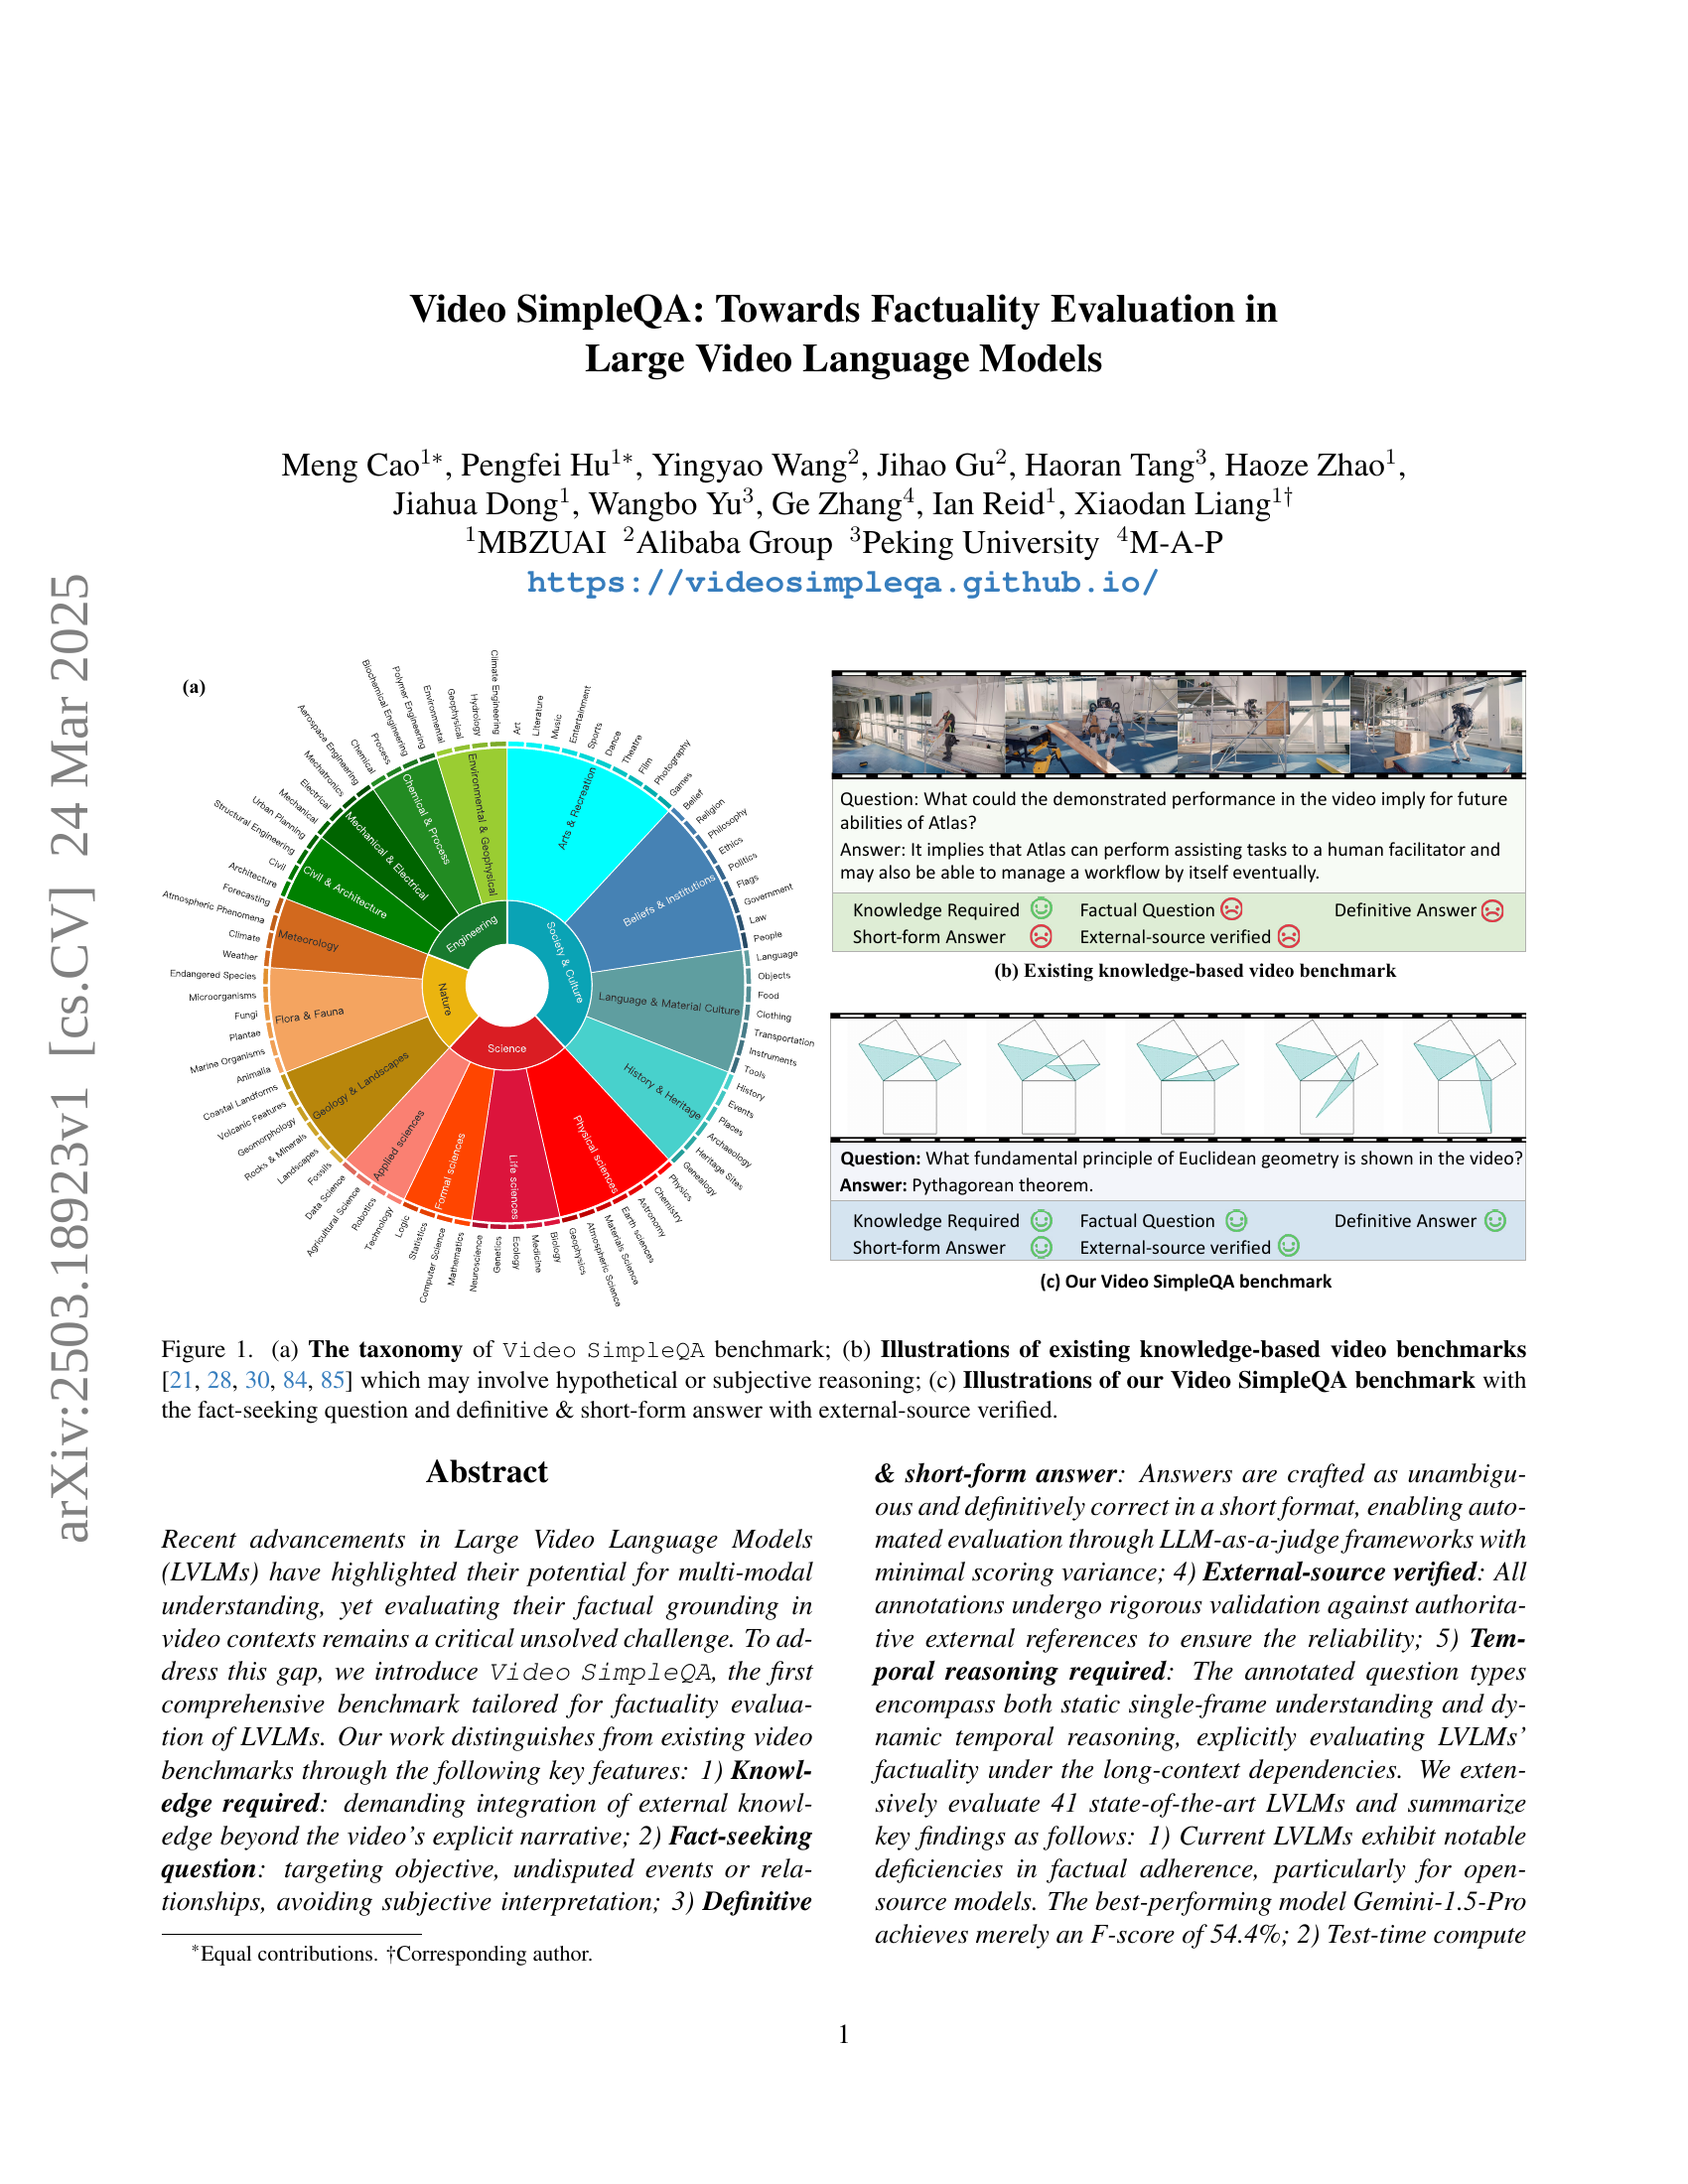
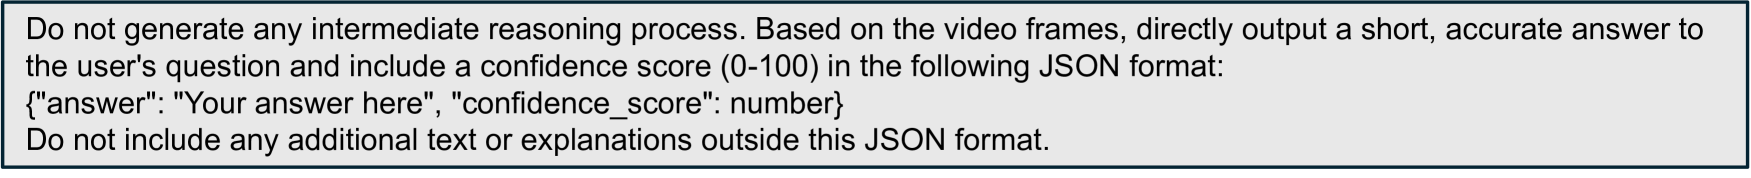
🔼 Figure 1 illustrates three key aspects of the Video SimpleQA benchmark. Panel (a) presents a hierarchical taxonomy showing how different question types are categorized within the benchmark. Panel (b) displays examples from existing video question answering benchmarks (KnowIT-VQA, WorldQA, Video-MMMU, MMVU, and MMWorld), highlighting their reliance on knowledge that may require subjective interpretation or hypothetical reasoning. In contrast, Panel (c) showcases examples from the Video SimpleQA benchmark, emphasizing fact-seeking questions with definitive, short answers that can be verified against external sources. This contrast highlights the key improvements introduced by Video SimpleQA.
read the caption
Figure 1: (a) The taxonomy of Video SimpleQA benchmark; (b) Illustrations of existing knowledge-based video benchmarks [21, 84, 30, 85, 28] which may involve hypothetical or subjective reasoning; (c) Illustrations of our Video SimpleQA benchmark with the fact-seeking question and definitive & short-form answer with external-source verified.
| Benchmarks | Video | Knowledge | Factuality | Evidence |
|---|---|---|---|---|
| Domain | driven | based | Source | |
| Video-MME [20] | Open | ✗ | ✗ | ✗ |
| MMBench-Video [19] | Open | ✗ | ✗ | ✗ |
| Video-Bench [51] | Open | ✗ | ✗ | ✗ |
| TempCompass [45] | Open | ✗ | ✗ | ✗ |
| MVBench [37] | Open | ✗ | ✗ | ✗ |
| AutoEval-Video [12] | Open | ✗ | ✗ | ✗ |
| Video-MMMU [30] | Professional | ✓ | ✗ | ✗ |
| MMVU [85] | Discipline | ✓ | ✗ | ✗ |
| MMWorld [28] | Discipline | ✓ | ✗ | ✗ |
| WorldQA [84] | Open | ✓ | ✗ | ✗ |
| KnowIT-VQA [21] | TV shows | ✓ | ✗ | ✗ |
| Video SimpleQA | Open | ✓ | ✓ | ✓ |
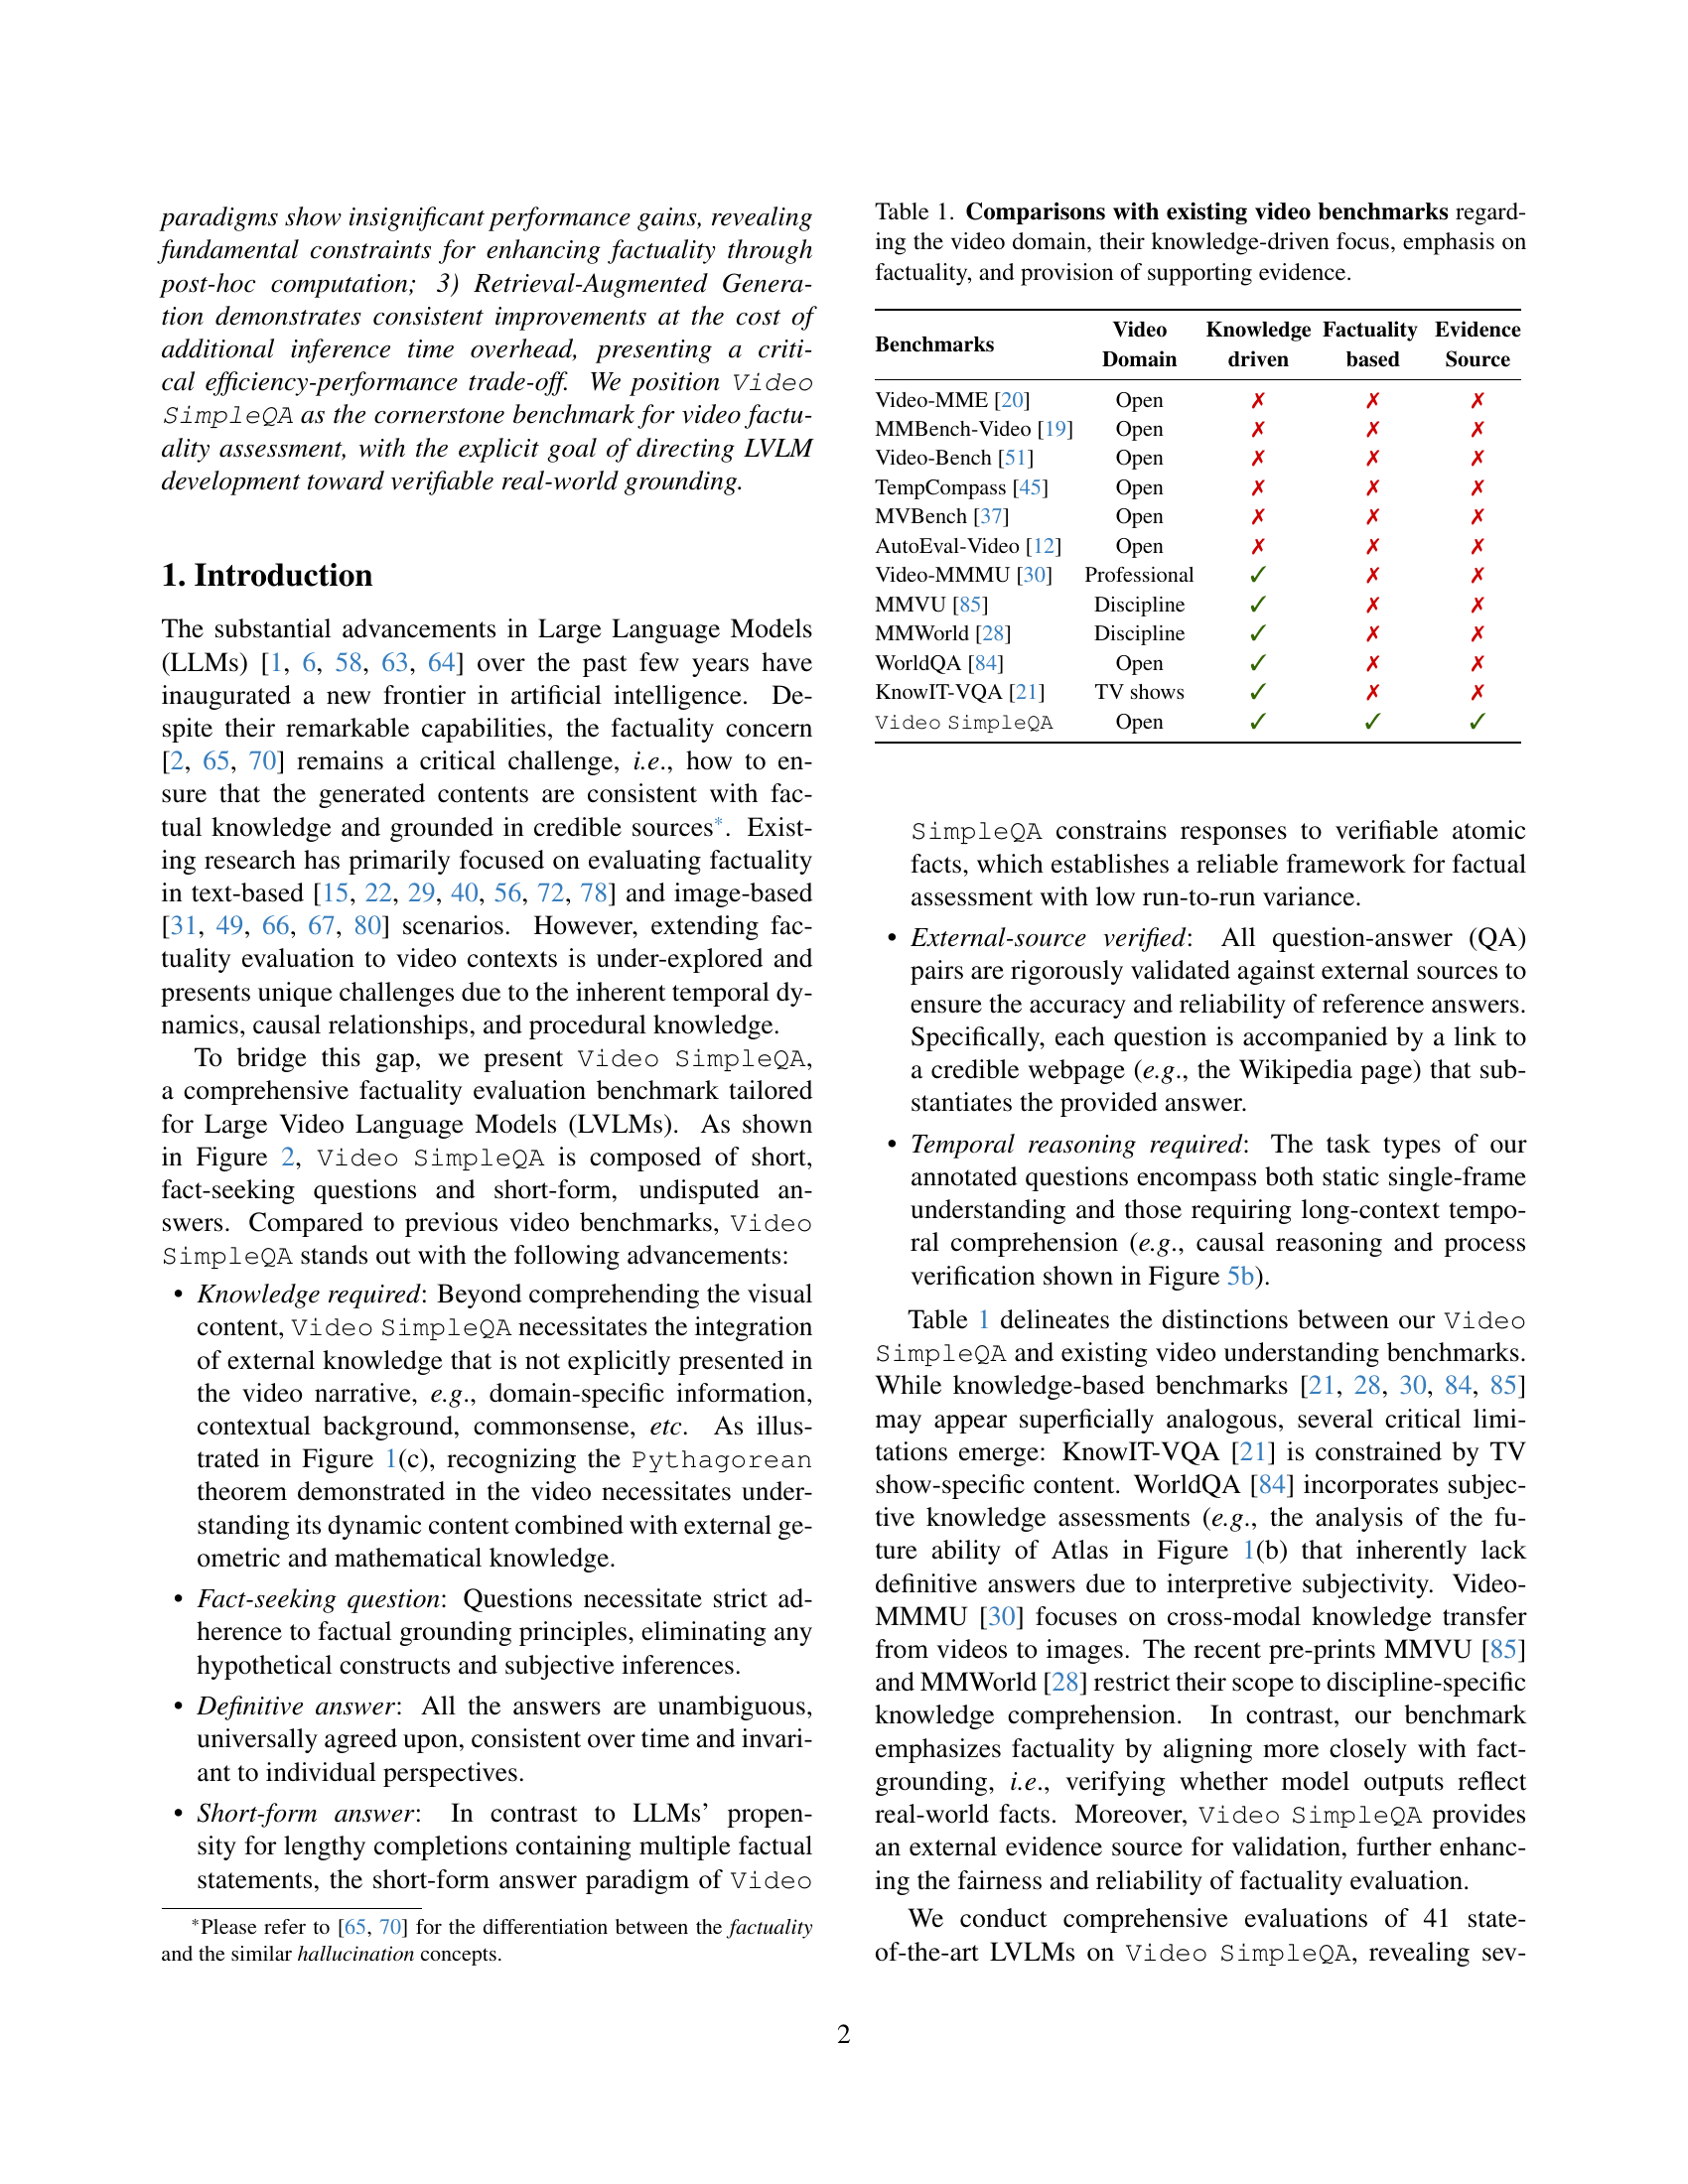
🔼 This table compares Video SimpleQA with other existing video benchmarks across four key aspects: the type of videos used (open-domain vs. discipline-specific), whether the benchmark emphasizes knowledge integration beyond the video’s explicit content, whether the focus is on evaluating factuality (correctness of generated content), and whether supporting evidence is provided for the answers. It highlights the unique contributions of Video SimpleQA in addressing the limitations of previous benchmarks regarding factuality evaluation in video.
read the caption
Table 1: Comparisons with existing video benchmarks regarding the video domain, their knowledge-driven focus, emphasis on factuality, and provision of supporting evidence.
In-depth insights#
Factuality Deficit#
The notion of a “factuality deficit” in large language models (LLMs) is critically important. It highlights a core challenge: ensuring that AI-generated content aligns with verifiable truths and credible sources. This deficit arises from LLMs’ reliance on pattern recognition and statistical relationships, which can lead to the generation of outputs that are internally consistent but factually incorrect. Addressing this deficit is vital for building trustworthy AI systems, especially in domains where accuracy is paramount. Improving factuality requires integrating external knowledge sources, enhancing reasoning capabilities, and developing robust verification mechanisms. This is not just a matter of technical improvement; it is also about establishing ethical guidelines and responsible AI development practices, ultimately promoting user trust.
RAG Efficiency Gap#
The “RAG Efficiency Gap,” as I interpret it, highlights the tension between enhanced performance and computational cost when employing Retrieval-Augmented Generation (RAG). RAG improves results by grounding generations in external knowledge, addressing limitations of models trained on fixed datasets. However, retrieving and processing external data adds inference time overhead. This presents a trade-off: models gain factuality and depth, but at the expense of speed and efficiency. A key challenge is minimizing this gap, finding methods to optimize retrieval, reduce processing time, and maintain accuracy. This requires innovative solutions in indexing, search algorithms, and potentially model architectures designed for efficient knowledge integration, which can allow LVLM to maintain real-time performance without factual mistakes. Closing the RAG Efficiency Gap will be crucial to wider adoption of the model
Overconfidence Bias#
The paper highlights a significant issue of overconfidence bias in Large Video Language Models (LVLMs). Despite the models’ capacity to generate responses, they often exhibit systematic overconfidence, especially in the absence of verified factual grounding. LVLMs tend to provide answers even when their knowledge is insufficient, and this tendency is quantified in the study by comparing the number of incorrect responses vs. the number of cases in which the model abstains. Such overconfidence underscores the importance of calibration; the models should ideally “know what they know”, but the alignment between confidence scores and the actual likelihood of correctness is lacking. The Brier score analysis confirms this misalignment, showing a deviation from ideal calibration. These observations point to a critical need for improving the factuality and reliability of LVLMs.
Temporal Reasoning#
The paper underscores the critical role of temporal reasoning in video understanding, moving beyond static, single-frame analysis. It highlights the benchmark’s design to necessitate both short-term and long-term temporal comprehension, with specific temporal understanding definitions to categorize question-answer pairs. Results emphasize the significant performance decline for videos requiring long-term context, suggesting that current LVLMs struggle with maintaining factual accuracy when temporal dependencies are extended.
External Verifiable#
External verification is crucial for ensuring the reliability of information. By relying on independent sources, we can mitigate biases and inaccuracies. Fact-checking organizations and expert reviews play a vital role in validating claims. Transparent methodologies and source citations enhance credibility. Cross-referencing information from multiple reputable sources strengthens confidence. Peer review in academic research helps to identify flaws and improve the quality of studies. Data provenance tracking ensures that the origin and transformations of data are documented. Auditing processes can verify compliance with standards and regulations. These combined approaches are essential for promoting trustworthy content.
More visual insights#
More on figures

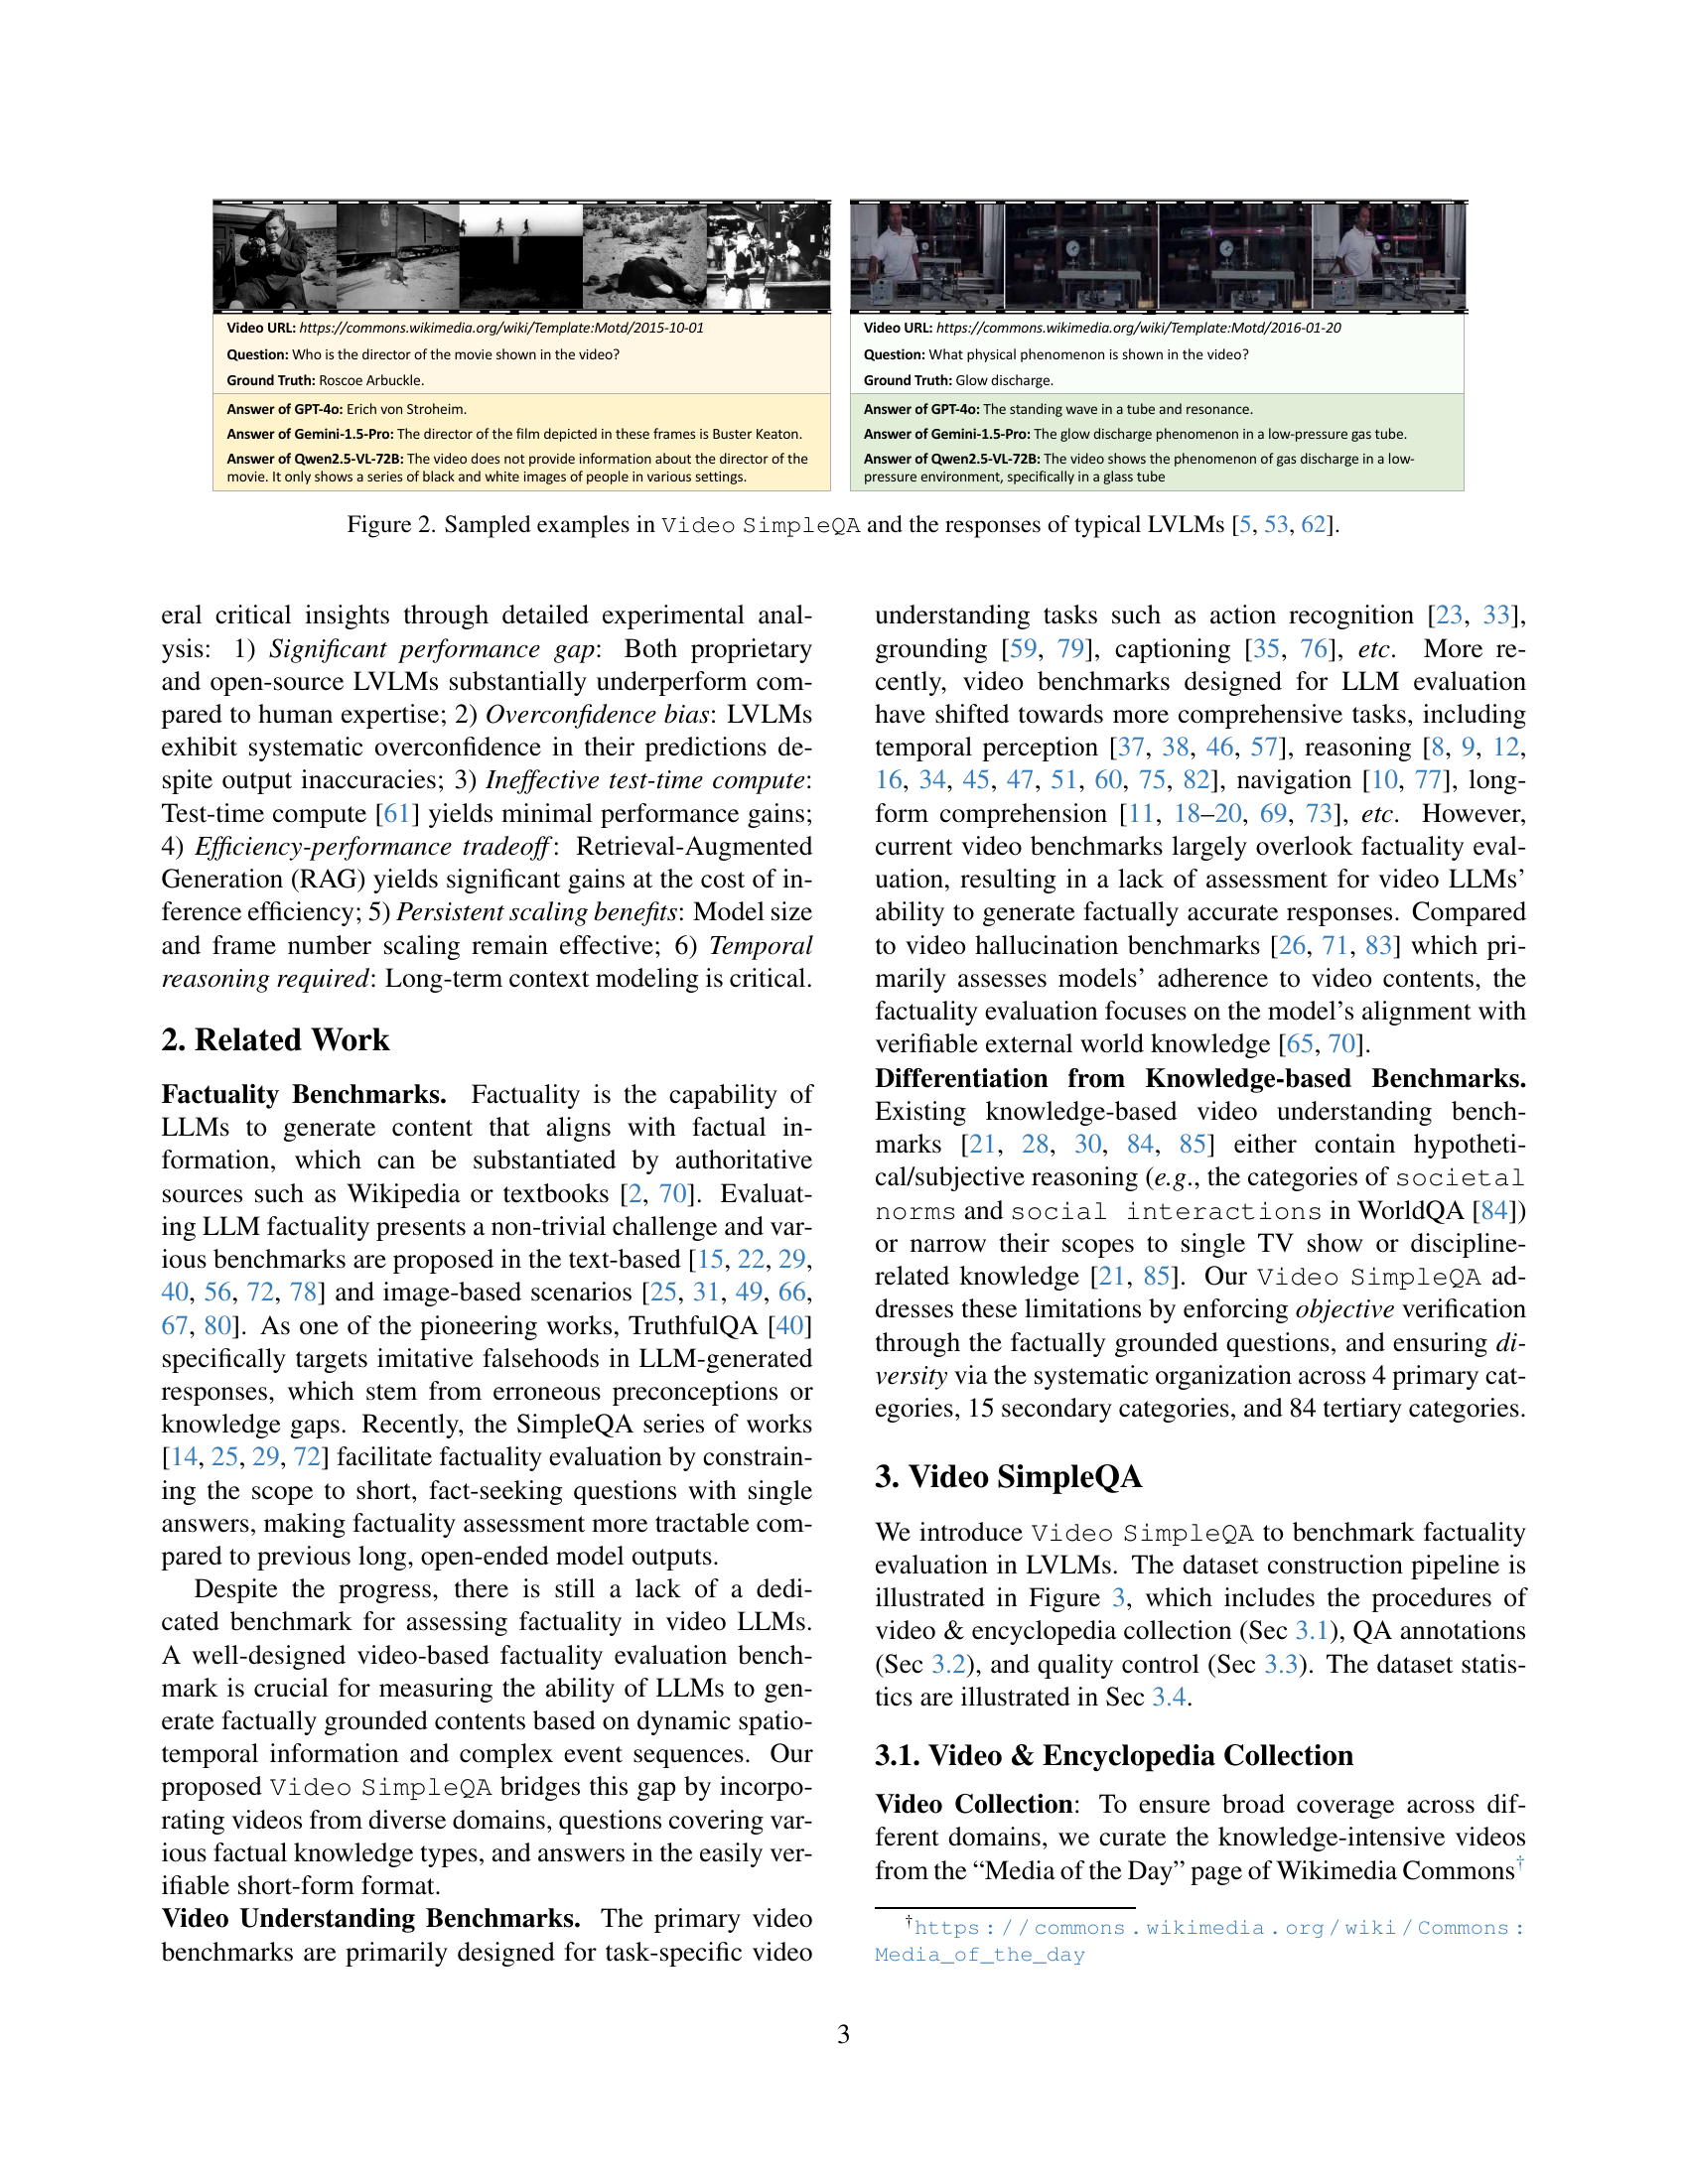
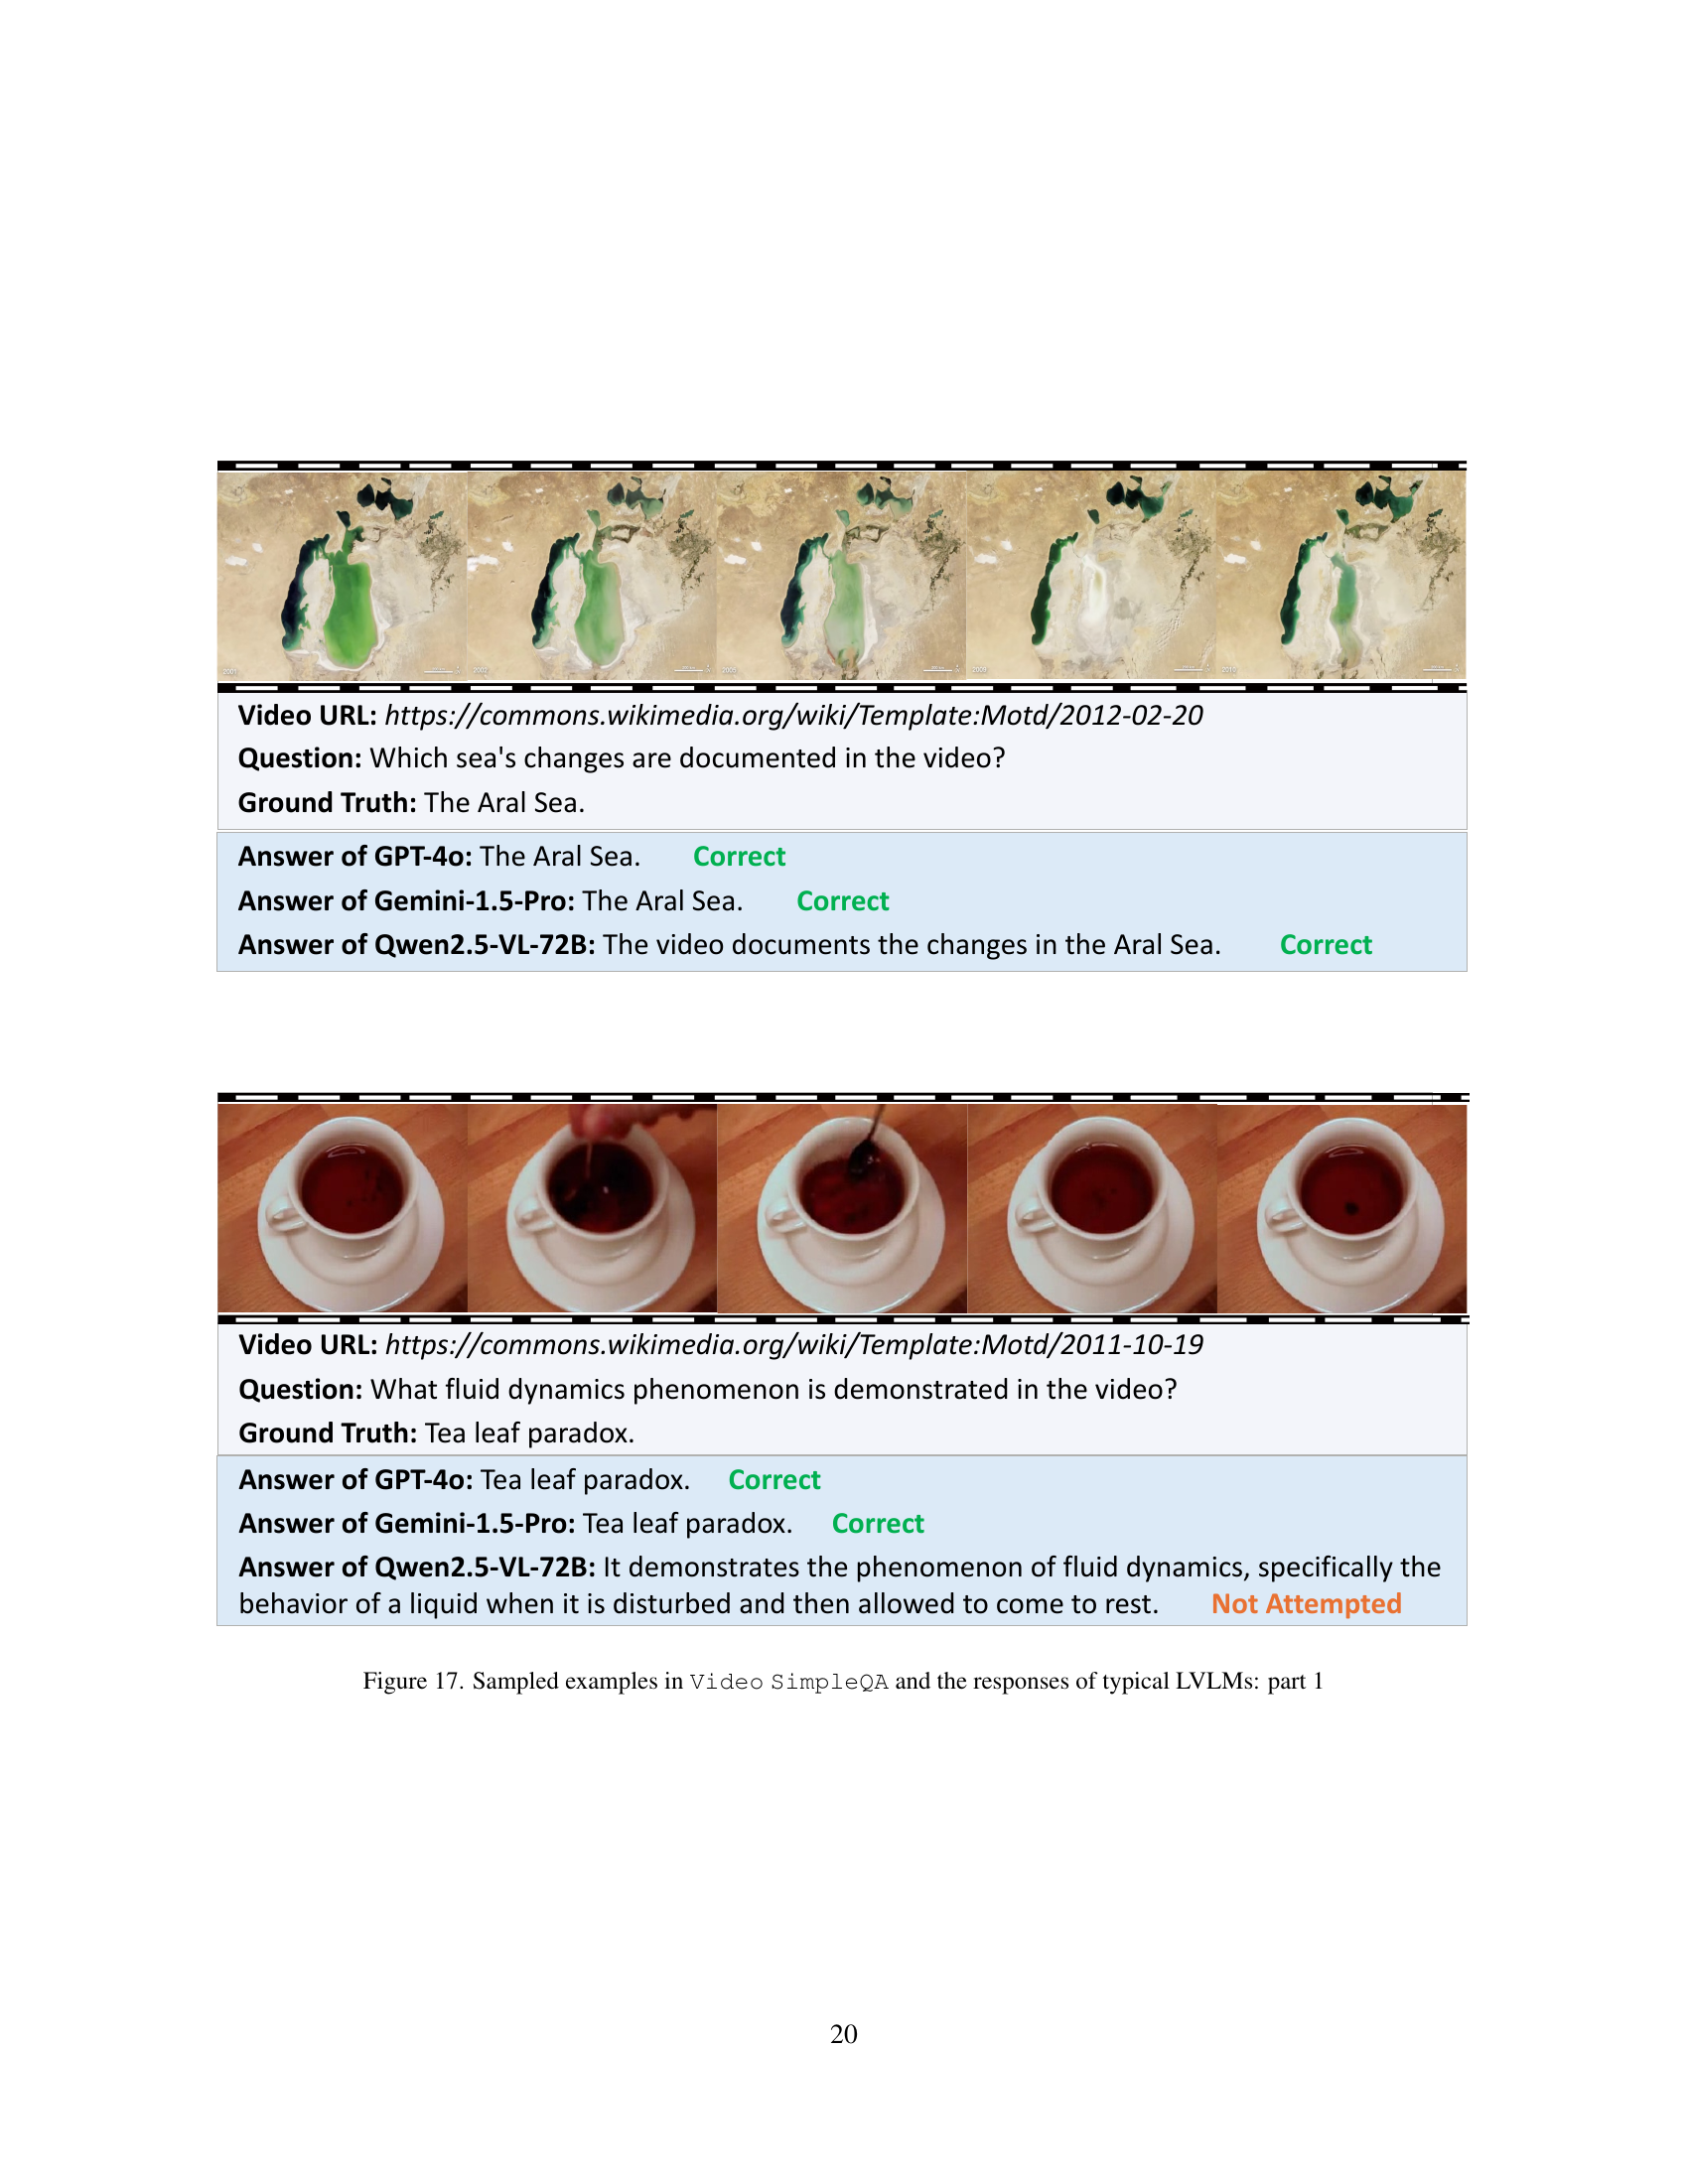
🔼 This figure showcases several examples from the Video SimpleQA benchmark dataset, highlighting the challenges involved in evaluating the factuality of Large Video Language Models (LVLMs). Each example shows a video still, a question about the video, the correct answer (ground truth), and the responses generated by three different LVLMs (GPT-40, Gemini-1.5-Pro, and Qwen-2.5-VL-72B). The responses illustrate the varying levels of accuracy and confidence exhibited by the LVLMs in answering fact-based questions related to videos. The discrepancies between the LVLMs’ answers and the ground truth demonstrate the need for a comprehensive benchmark like Video SimpleQA to evaluate the factuality of LVLMs.
read the caption
Figure 2: Sampled examples in Video SimpleQA and the responses of typical LVLMs [53, 62, 5].

🔼 Figure 3 illustrates the three-stage pipeline for creating the Video SimpleQA dataset. First, videos are collected from Wikimedia Commons and their associated encyclopedic descriptions are gathered via a Retrieval-Augmented Generation (RAG) process. Second, a two-stage QA annotation process is undertaken: 1) an iterative LLM-based approach for initial QA pair generation, refined by 2) human-in-the-loop verification. Finally, a quality control phase incorporates difficulty filtering and human cross-verification to ensure high-quality QA pairs.
read the caption
Figure 3: An overview of the construction pipeline of Video SimpleQA including the video & encyclopedia collection (Sec. 3.1), QA annotation (Sec. 3.2), and quality control (Sec. 3.3).

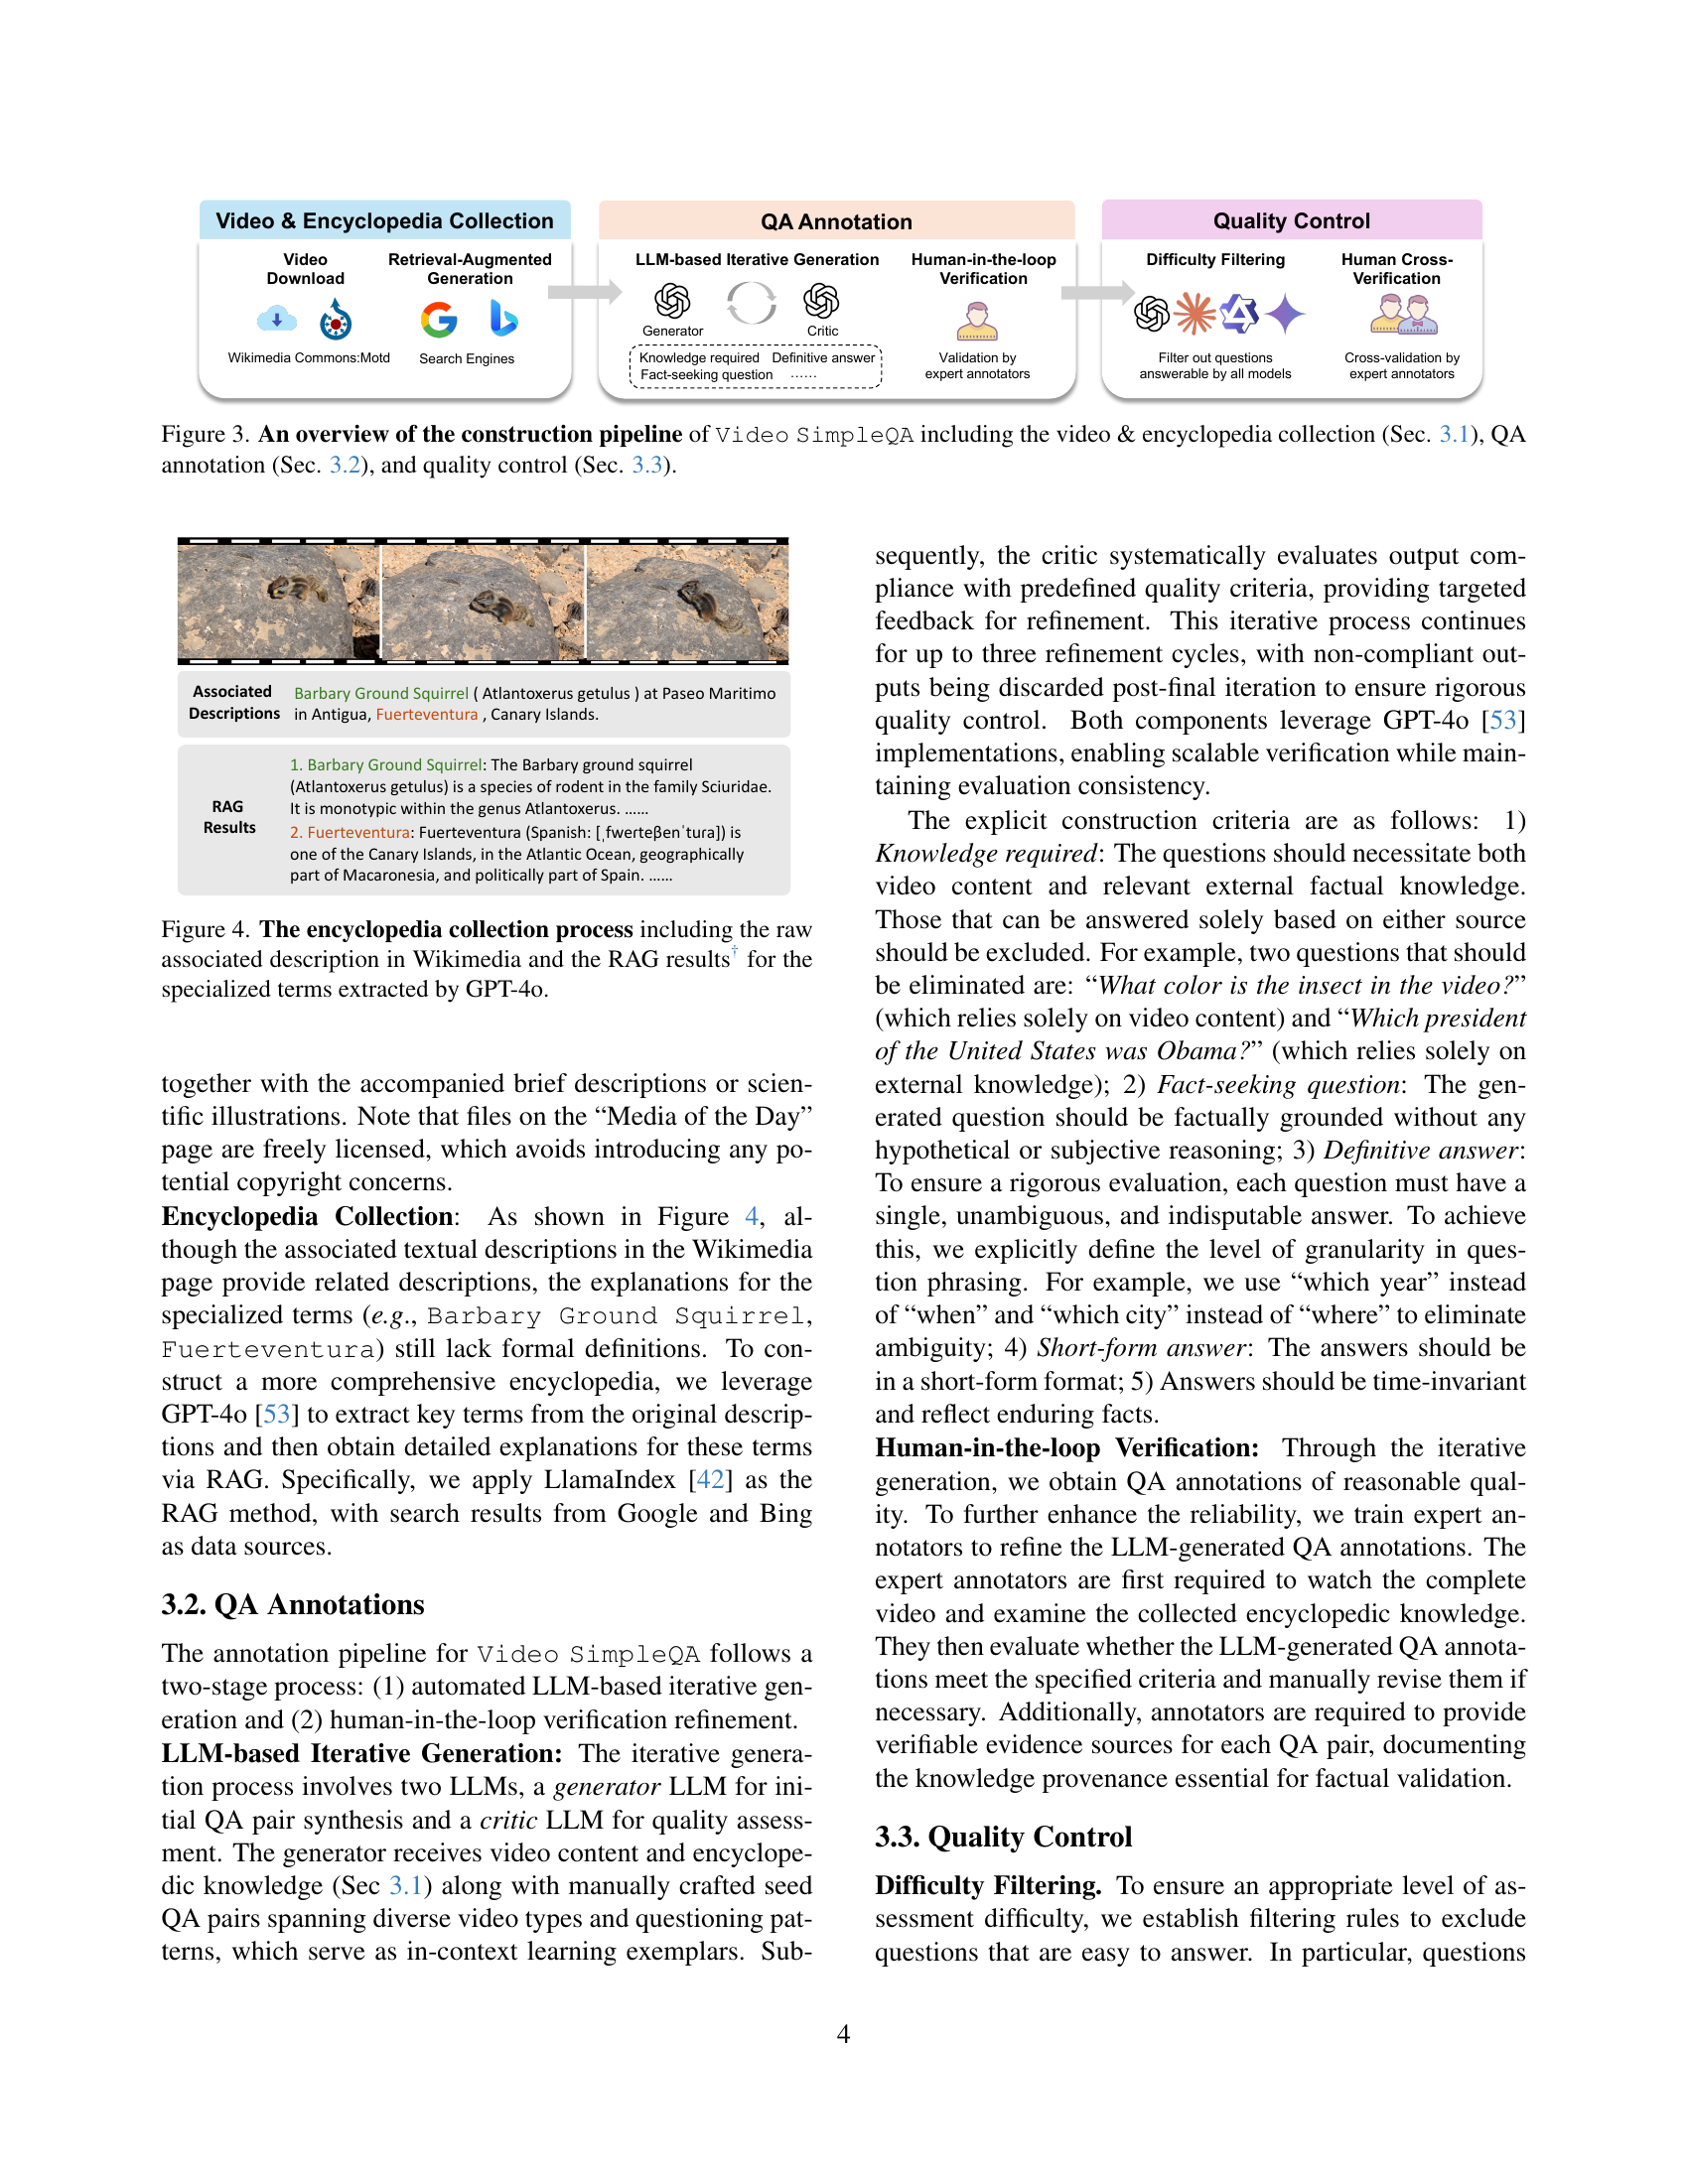
🔼 This figure illustrates the process of creating a comprehensive encyclopedia for the Video SimpleQA benchmark. It begins with raw descriptions from Wikimedia Commons. Then, GPT-40 is used with a Retrieval Augmented Generation (RAG) method to extract key terms and find more detailed definitions for them. These additional definitions from search engines like Google and Bing are then added to create a richer and more accurate knowledge base for the dataset. This ensures that the questions in the benchmark require knowledge beyond what is explicitly shown in the video itself.
read the caption
Figure 4: The encyclopedia collection process including the raw associated description in Wikimedia and the RAG results† ‣ 3.1 for the specialized terms extracted by GPT-4o.

🔼 This figure shows a pie chart that visualizes the taxonomy of the Video SimpleQA benchmark. The chart is divided into four main categories: Nature, Engineering, Science, and Society & Culture. Each of these categories is further subdivided into secondary and tertiary categories representing various sub-topics. The size of each slice in the pie chart corresponds to the number of videos in that particular category, illustrating the distribution of video content across different topics in the Video SimpleQA dataset.
read the caption
(a)

🔼 This figure shows an example of an existing knowledge-based video benchmark. The example uses a question about a video demonstrating a Euclidean geometry principle and the correct answer, which is ‘Pythagorean theorem’. The benchmark includes information about the required knowledge, whether the question is factual, whether the answer is definitive, and whether it was verified by an external source. This illustrates that existing benchmarks may involve hypothetical or subjective reasoning, unlike the proposed Video SimpleQA benchmark.
read the caption
(b)

🔼 This figure illustrates the Video SimpleQA benchmark, which is a novel dataset for evaluating the factuality of Large Video Language Models (LVLMs). It contrasts with existing benchmarks by focusing on fact-seeking questions that necessitate integrating external knowledge beyond the video’s explicit narrative. The answers provided are unambiguous, definitive, and short-form, allowing for automated evaluation. The questions necessitate both static single-frame understanding and dynamic temporal reasoning, testing LVLMs’ ability to handle long-context dependencies.
read the caption
(c)

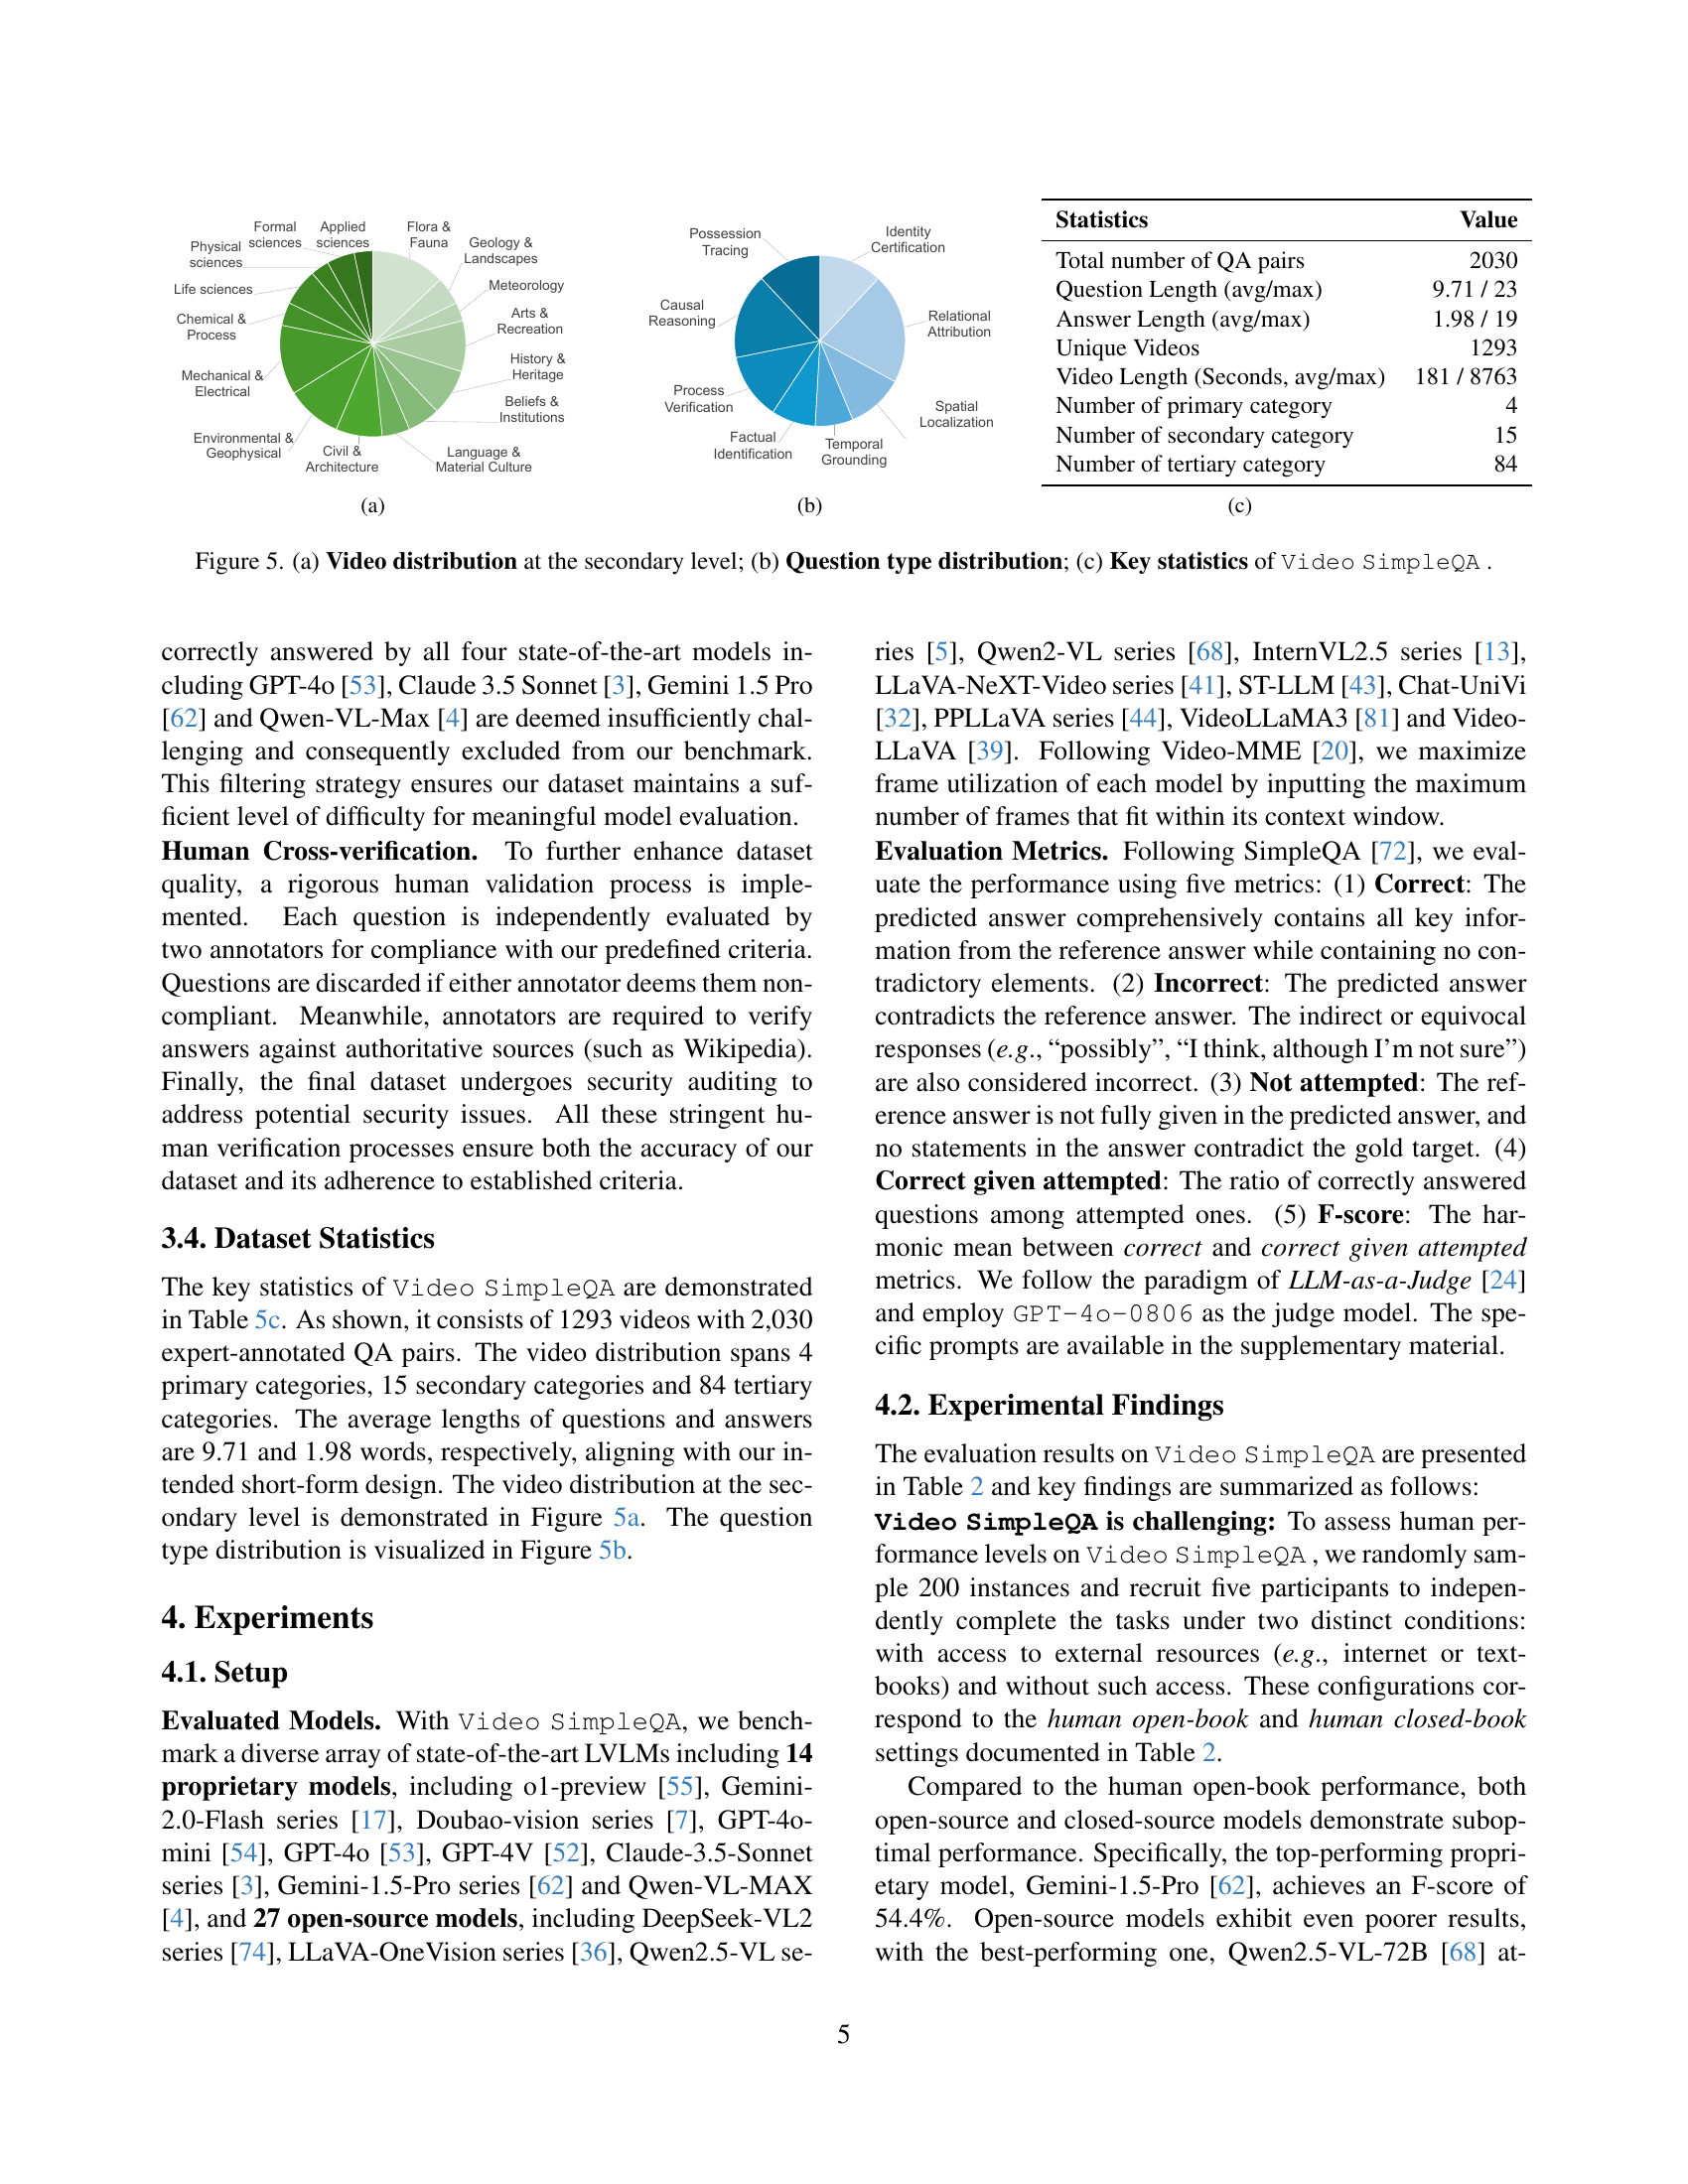
🔼 Figure 5 presents a comprehensive overview of the Video SimpleQA dataset. Subfigure (a) shows the distribution of videos across 15 secondary categories, illustrating the diversity of video content in the benchmark. Subfigure (b) visualizes the distribution of question types, revealing the balance between different question forms. Subfigure (c) provides key statistics of the dataset, including the total number of question-answer pairs, video lengths, and the number of categories at different levels of granularity.
read the caption
Figure 5: (a) Video distribution at the secondary level; (b) Question type distribution; (c) Key statistics of Video SimpleQA .

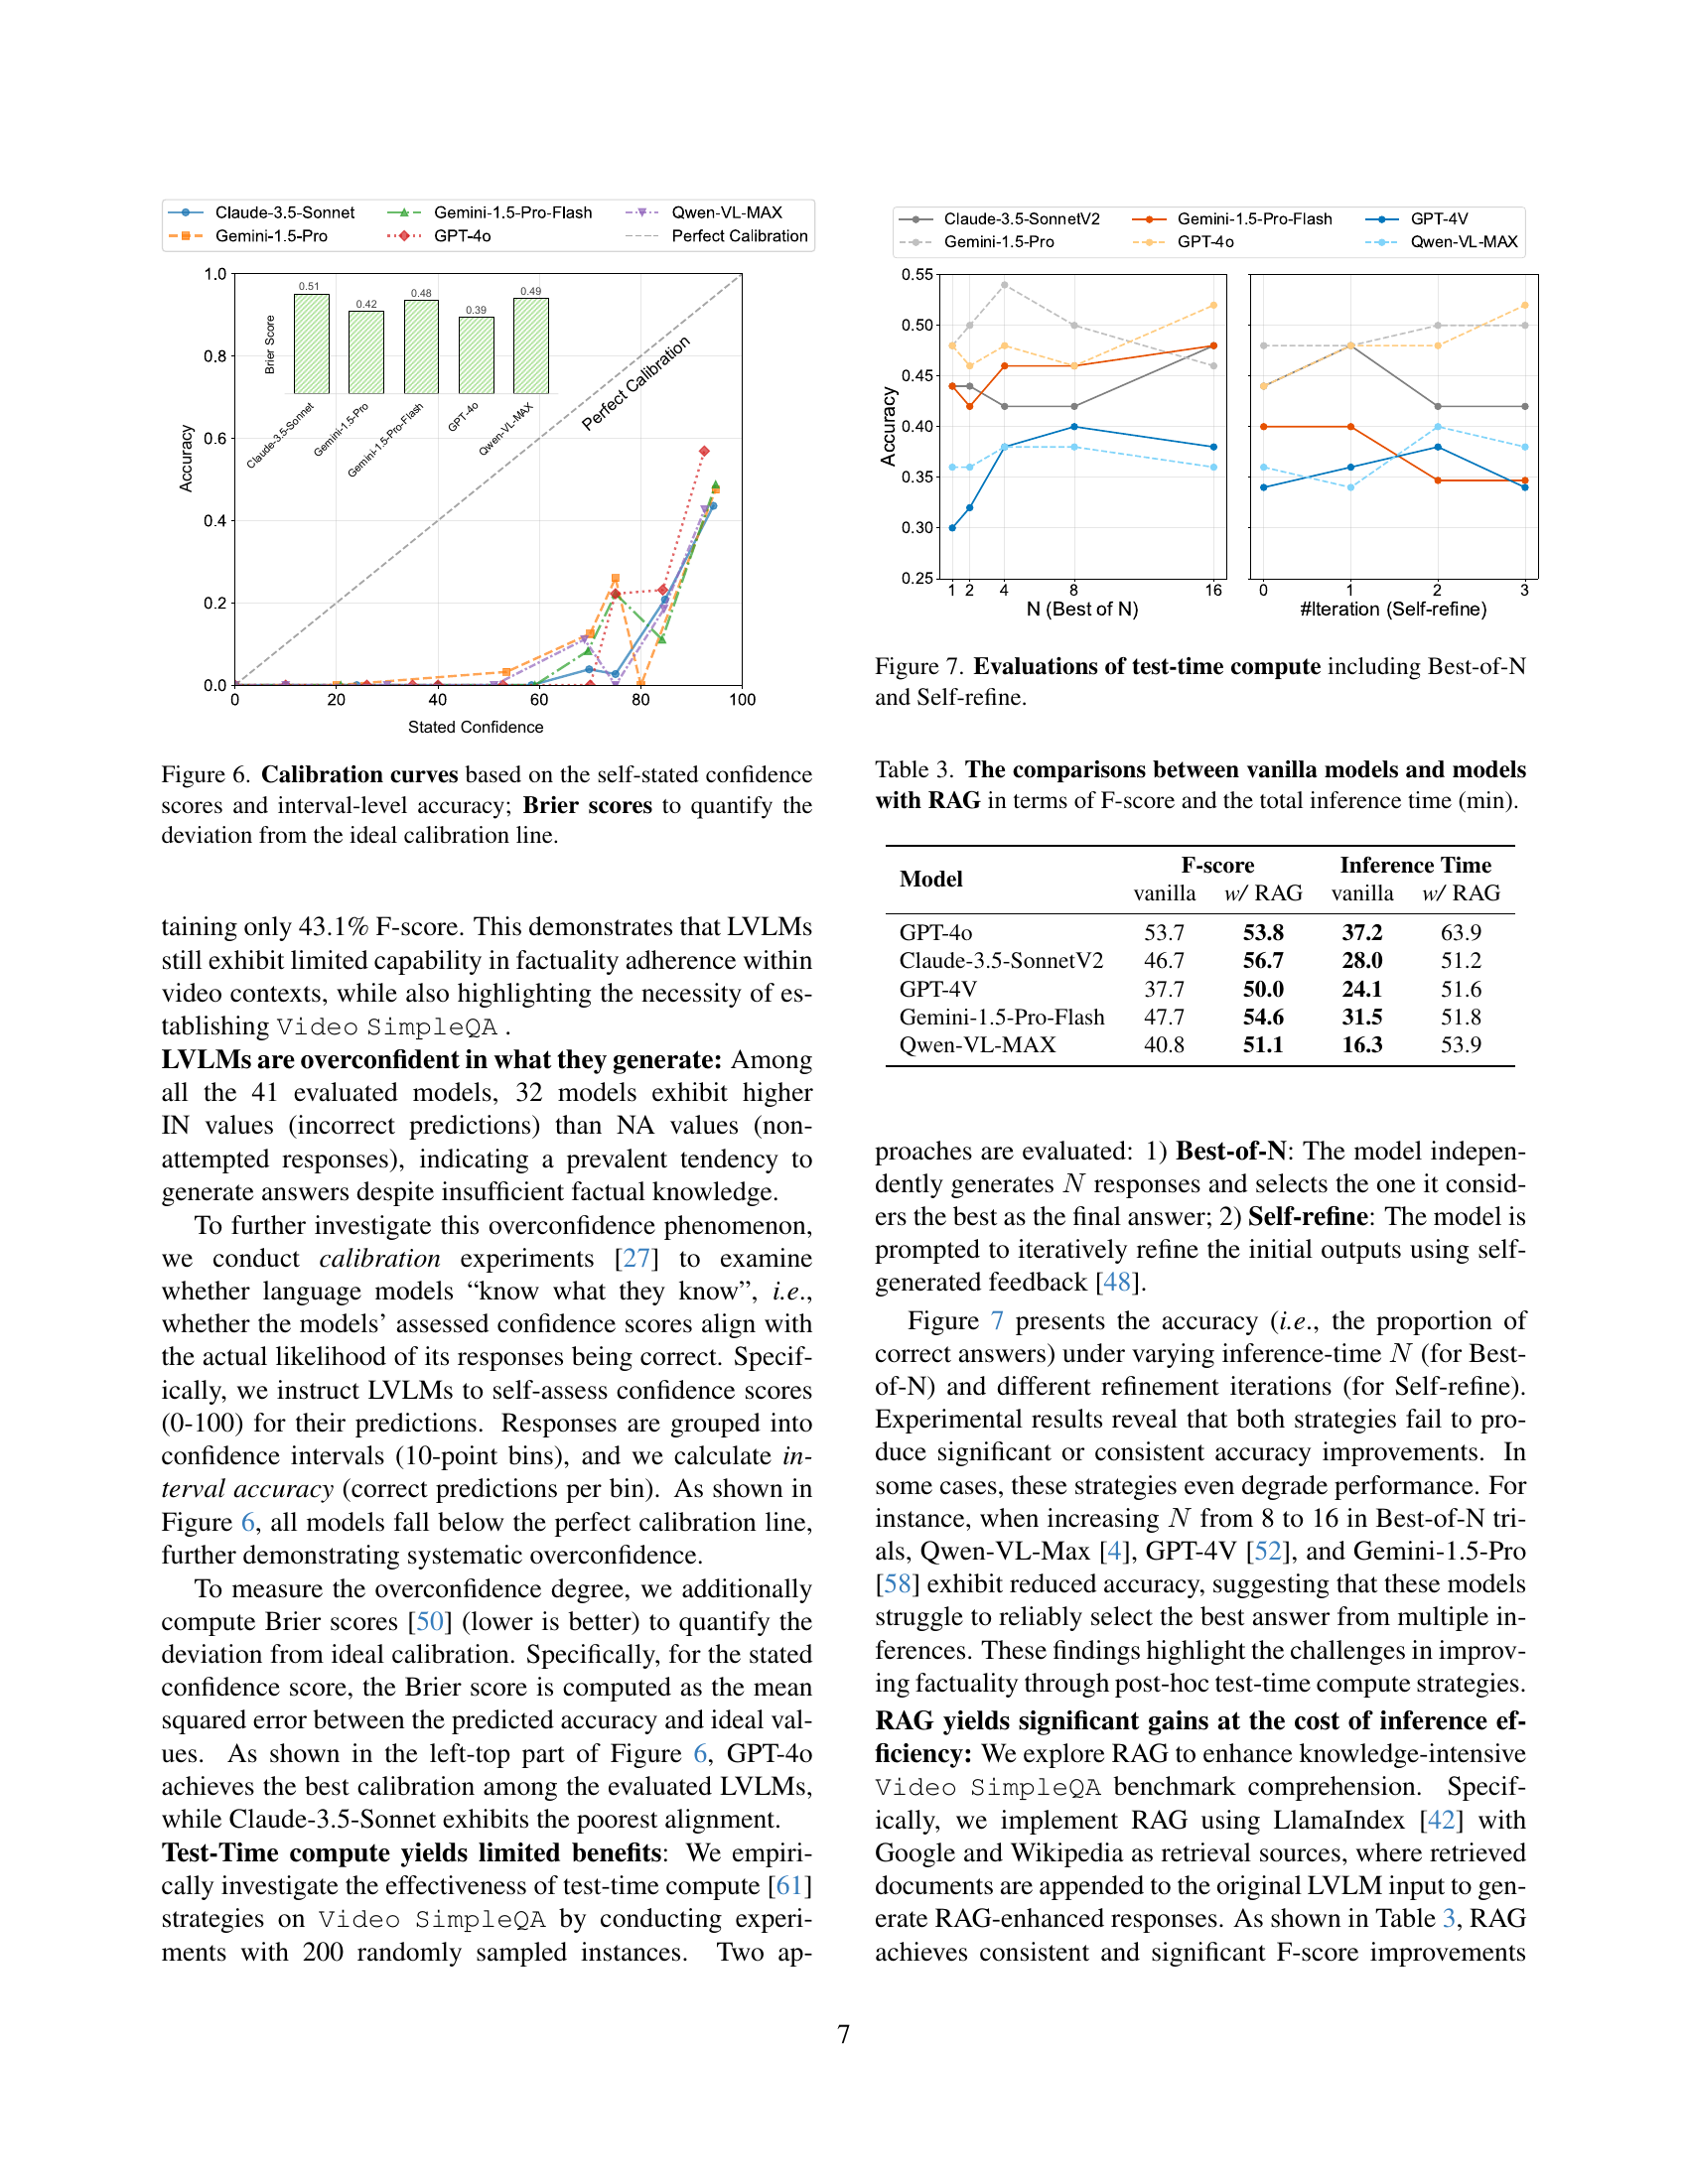
🔼 This figure displays the calibration of several large video language models (LVLMs) by plotting their self-reported confidence scores against their actual accuracy. The x-axis represents the self-stated confidence levels, categorized into intervals (bins), while the y-axis shows the accuracy within each confidence interval. A perfectly calibrated model would have a diagonal line representing perfect agreement between confidence and accuracy. Deviations from this ideal diagonal line reveal overconfidence or underconfidence in the model’s predictions. The Brier score, displayed numerically in the figure, quantifies the overall deviation from perfect calibration, providing a single metric for comparing the calibration quality across different LVLMs.
read the caption
Figure 6: Calibration curves based on the self-stated confidence scores and interval-level accuracy; Brier scores to quantify the deviation from the ideal calibration line.

🔼 This figure displays the results of experiments evaluating the impact of test-time compute strategies on the Video SimpleQA benchmark. Two strategies were tested: Best-of-N, which involves generating N independent responses and selecting the best one, and Self-refine, which involves iteratively refining initial outputs using self-generated feedback. The graphs show the accuracy (proportion of correct answers) against the number of models used for Best-of-N and the number of refinement iterations for Self-refine, for several different models. The results reveal that neither strategy consistently improves accuracy and that in some cases, performance even degrades.
read the caption
Figure 7: Evaluations of test-time compute including Best-of-N and Self-refine.

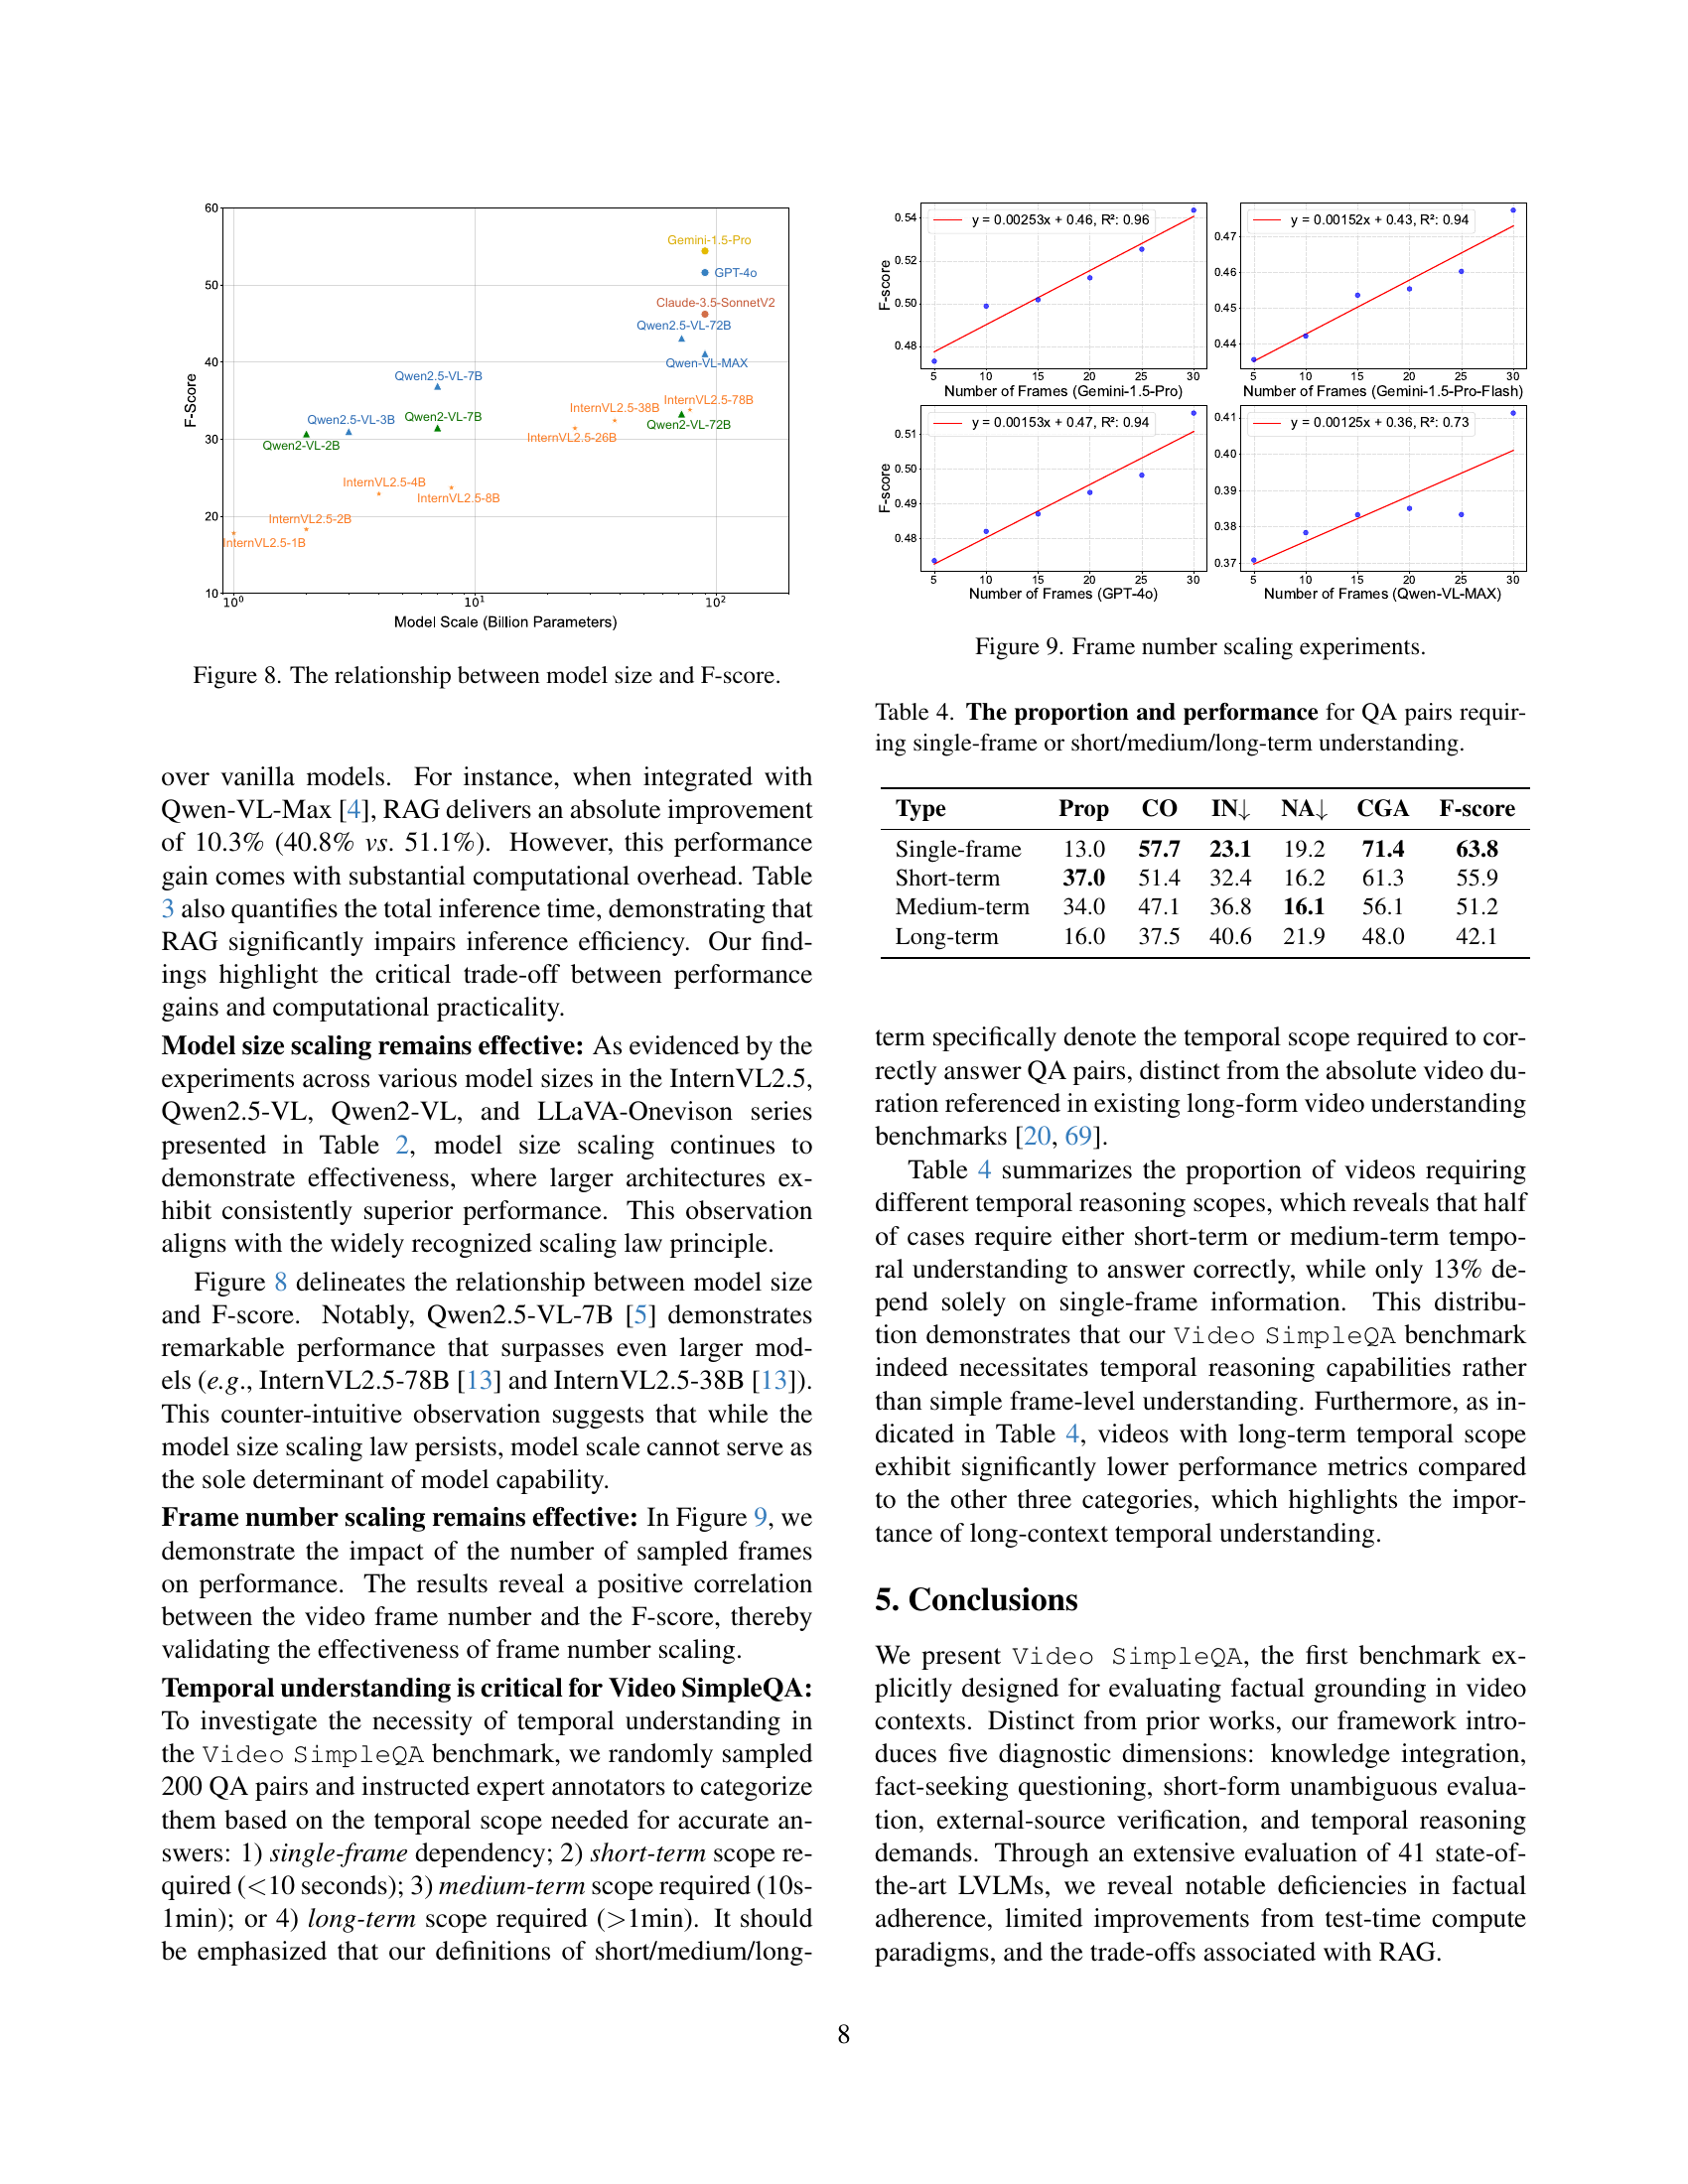
🔼 This figure illustrates the correlation between the size of large video language models (LVLMs) and their performance on the Video SimpleQA benchmark. The x-axis represents the model size in billions of parameters, while the y-axis shows the F1-score achieved by each model on the benchmark. The plot visually demonstrates the general trend of improved performance with increasing model size, although the relationship isn’t perfectly linear. Some larger models may underperform compared to smaller models, indicating that model size is not the sole determinant of performance.
read the caption
Figure 8: The relationship between model size and F-score.

🔼 This figure displays the results of experiments examining the effect of the number of video frames used as input on the performance of various Large Video Language Models (LVLMs). The x-axis likely represents the number of frames, and the y-axis likely represents a performance metric, such as the F-score. Each line likely represents a different LVLMs. The plot aims to demonstrate whether increasing the number of frames improves the models’ ability to answer factually grounded questions about the video content.
read the caption
Figure 9: Frame number scaling experiments.

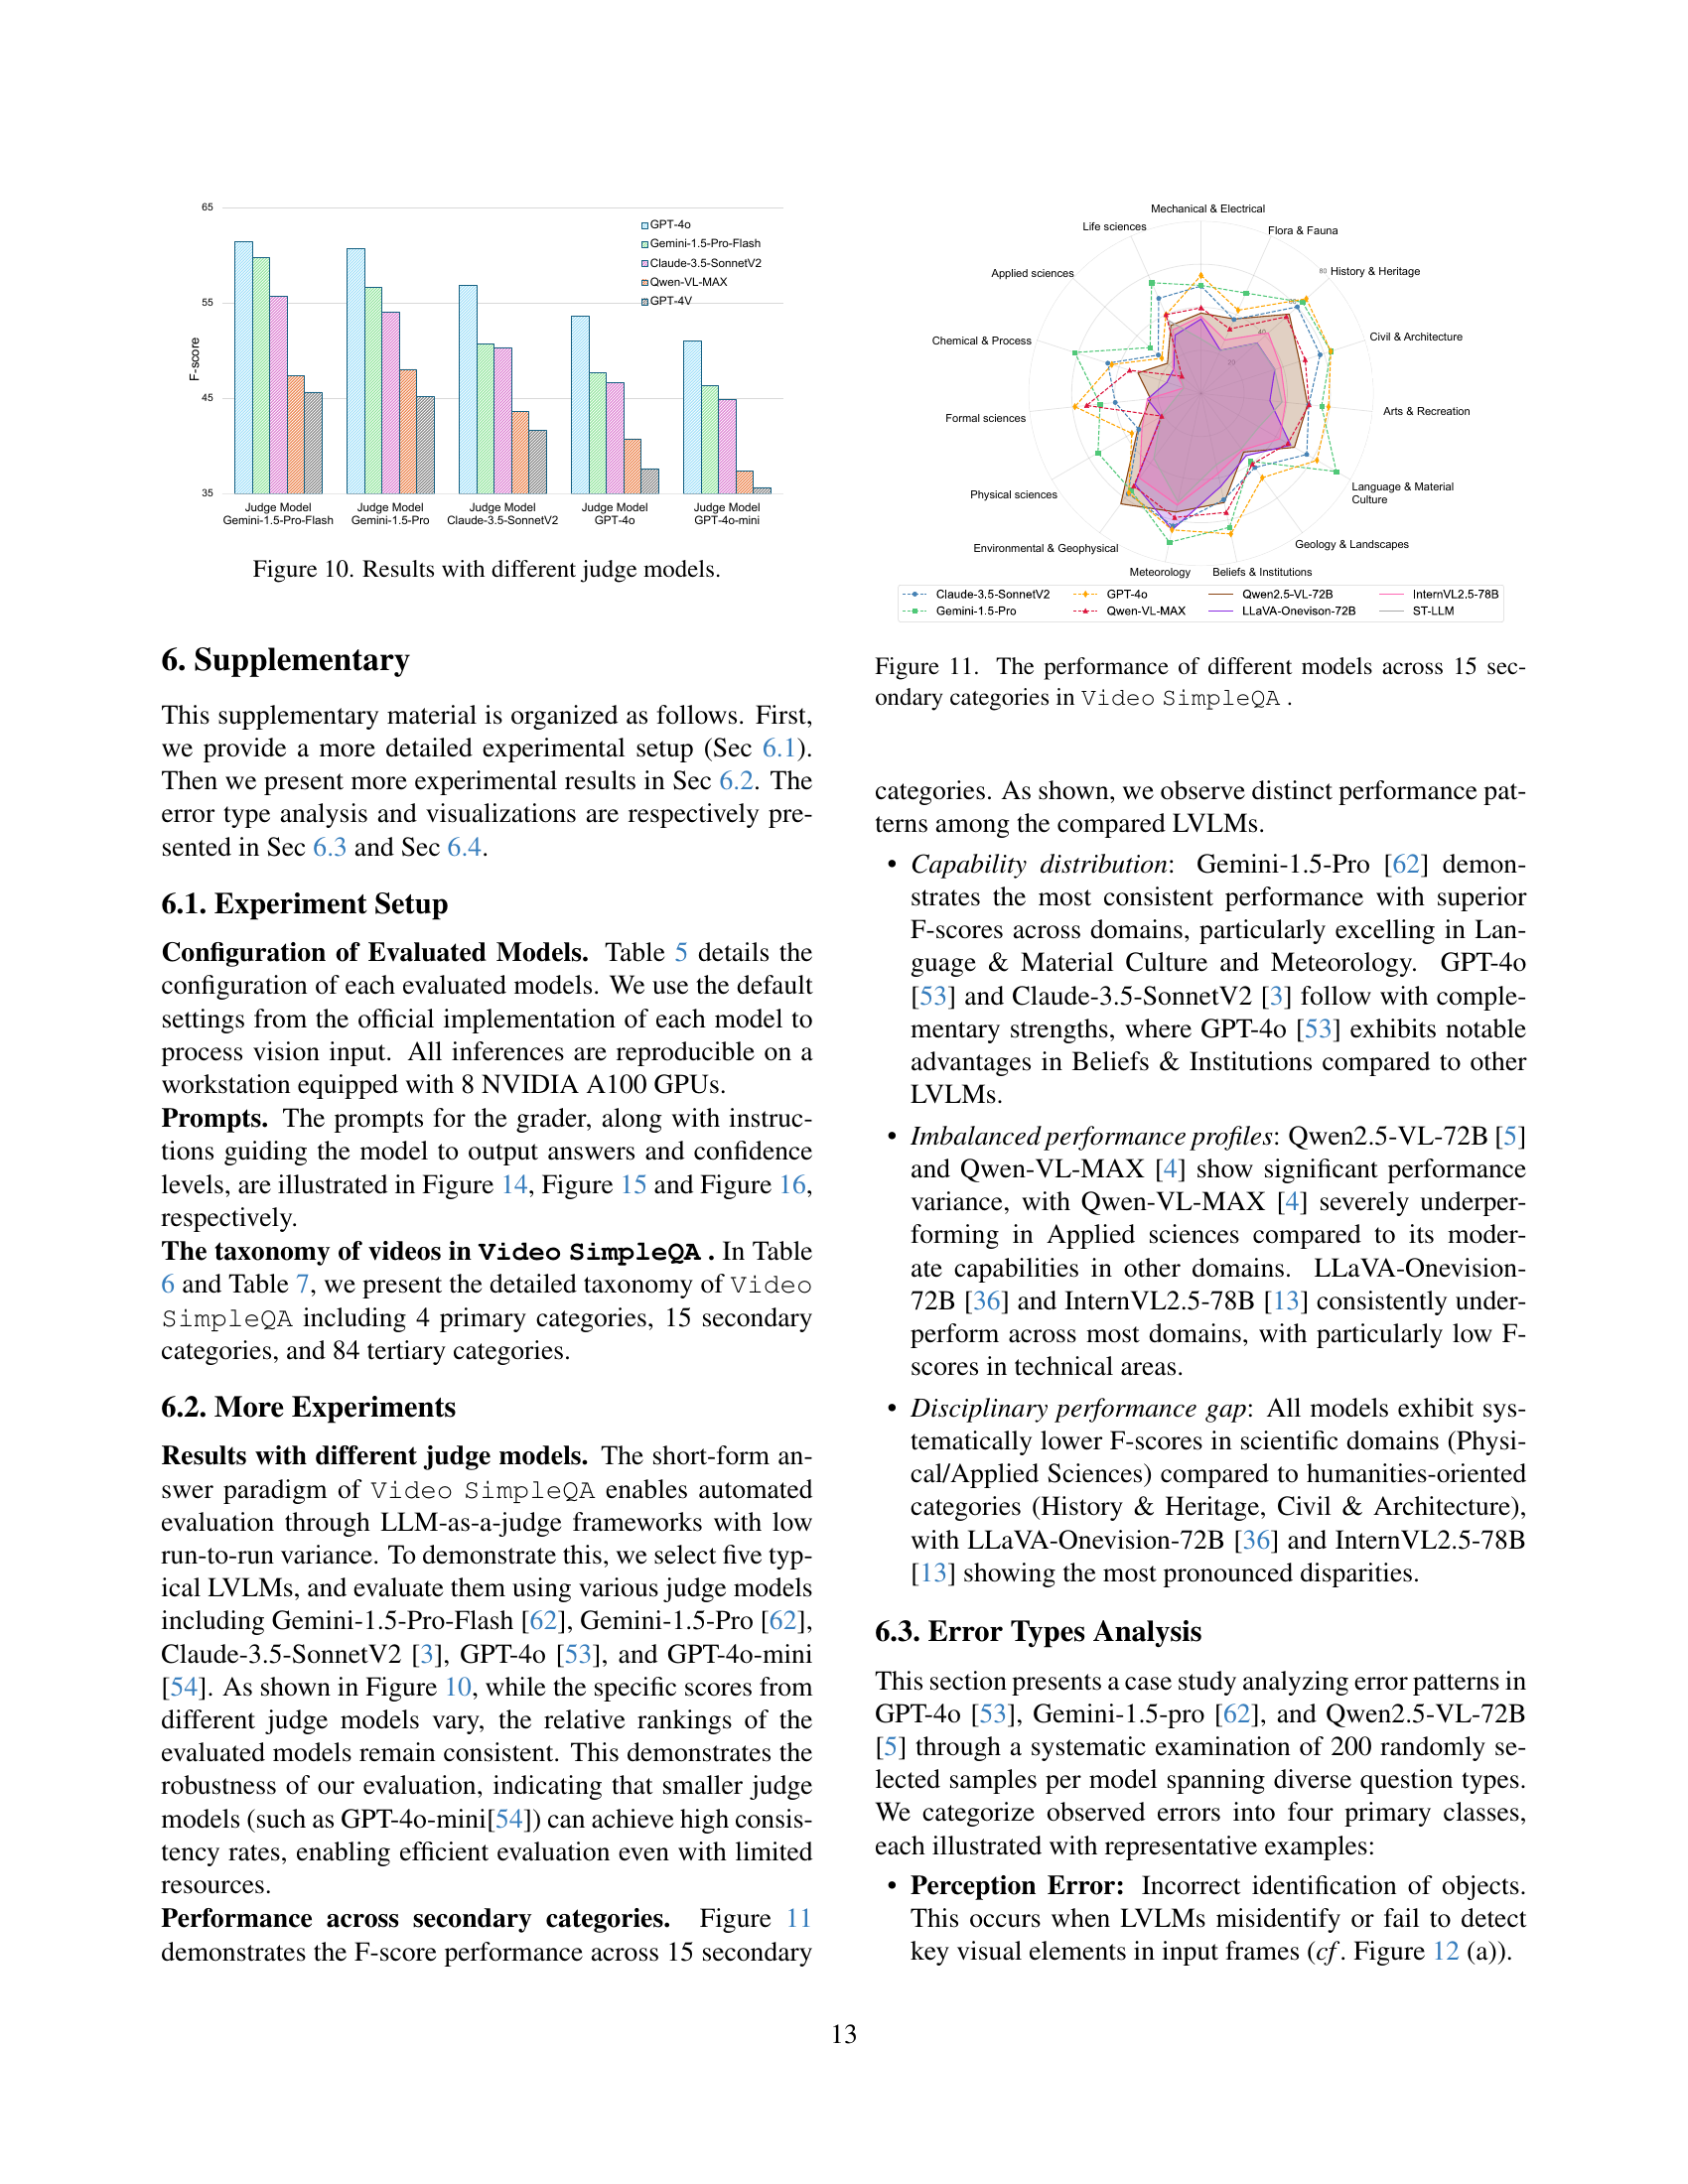
🔼 This figure displays the F-scores achieved by different Large Video Language Models (LVLMs) when evaluated using various judge models (GPT-40, Gemini-1.5-Pro, Claude-3.5-SonnetV2, GPT-40-mini). The consistent ranking of the LVLMs across different judge models highlights the robustness of the evaluation methodology, showing that even smaller judge models can provide consistent results. The variation in F-scores across models reveals differences in their performance across various subtopics.
read the caption
Figure 10: Results with different judge models.

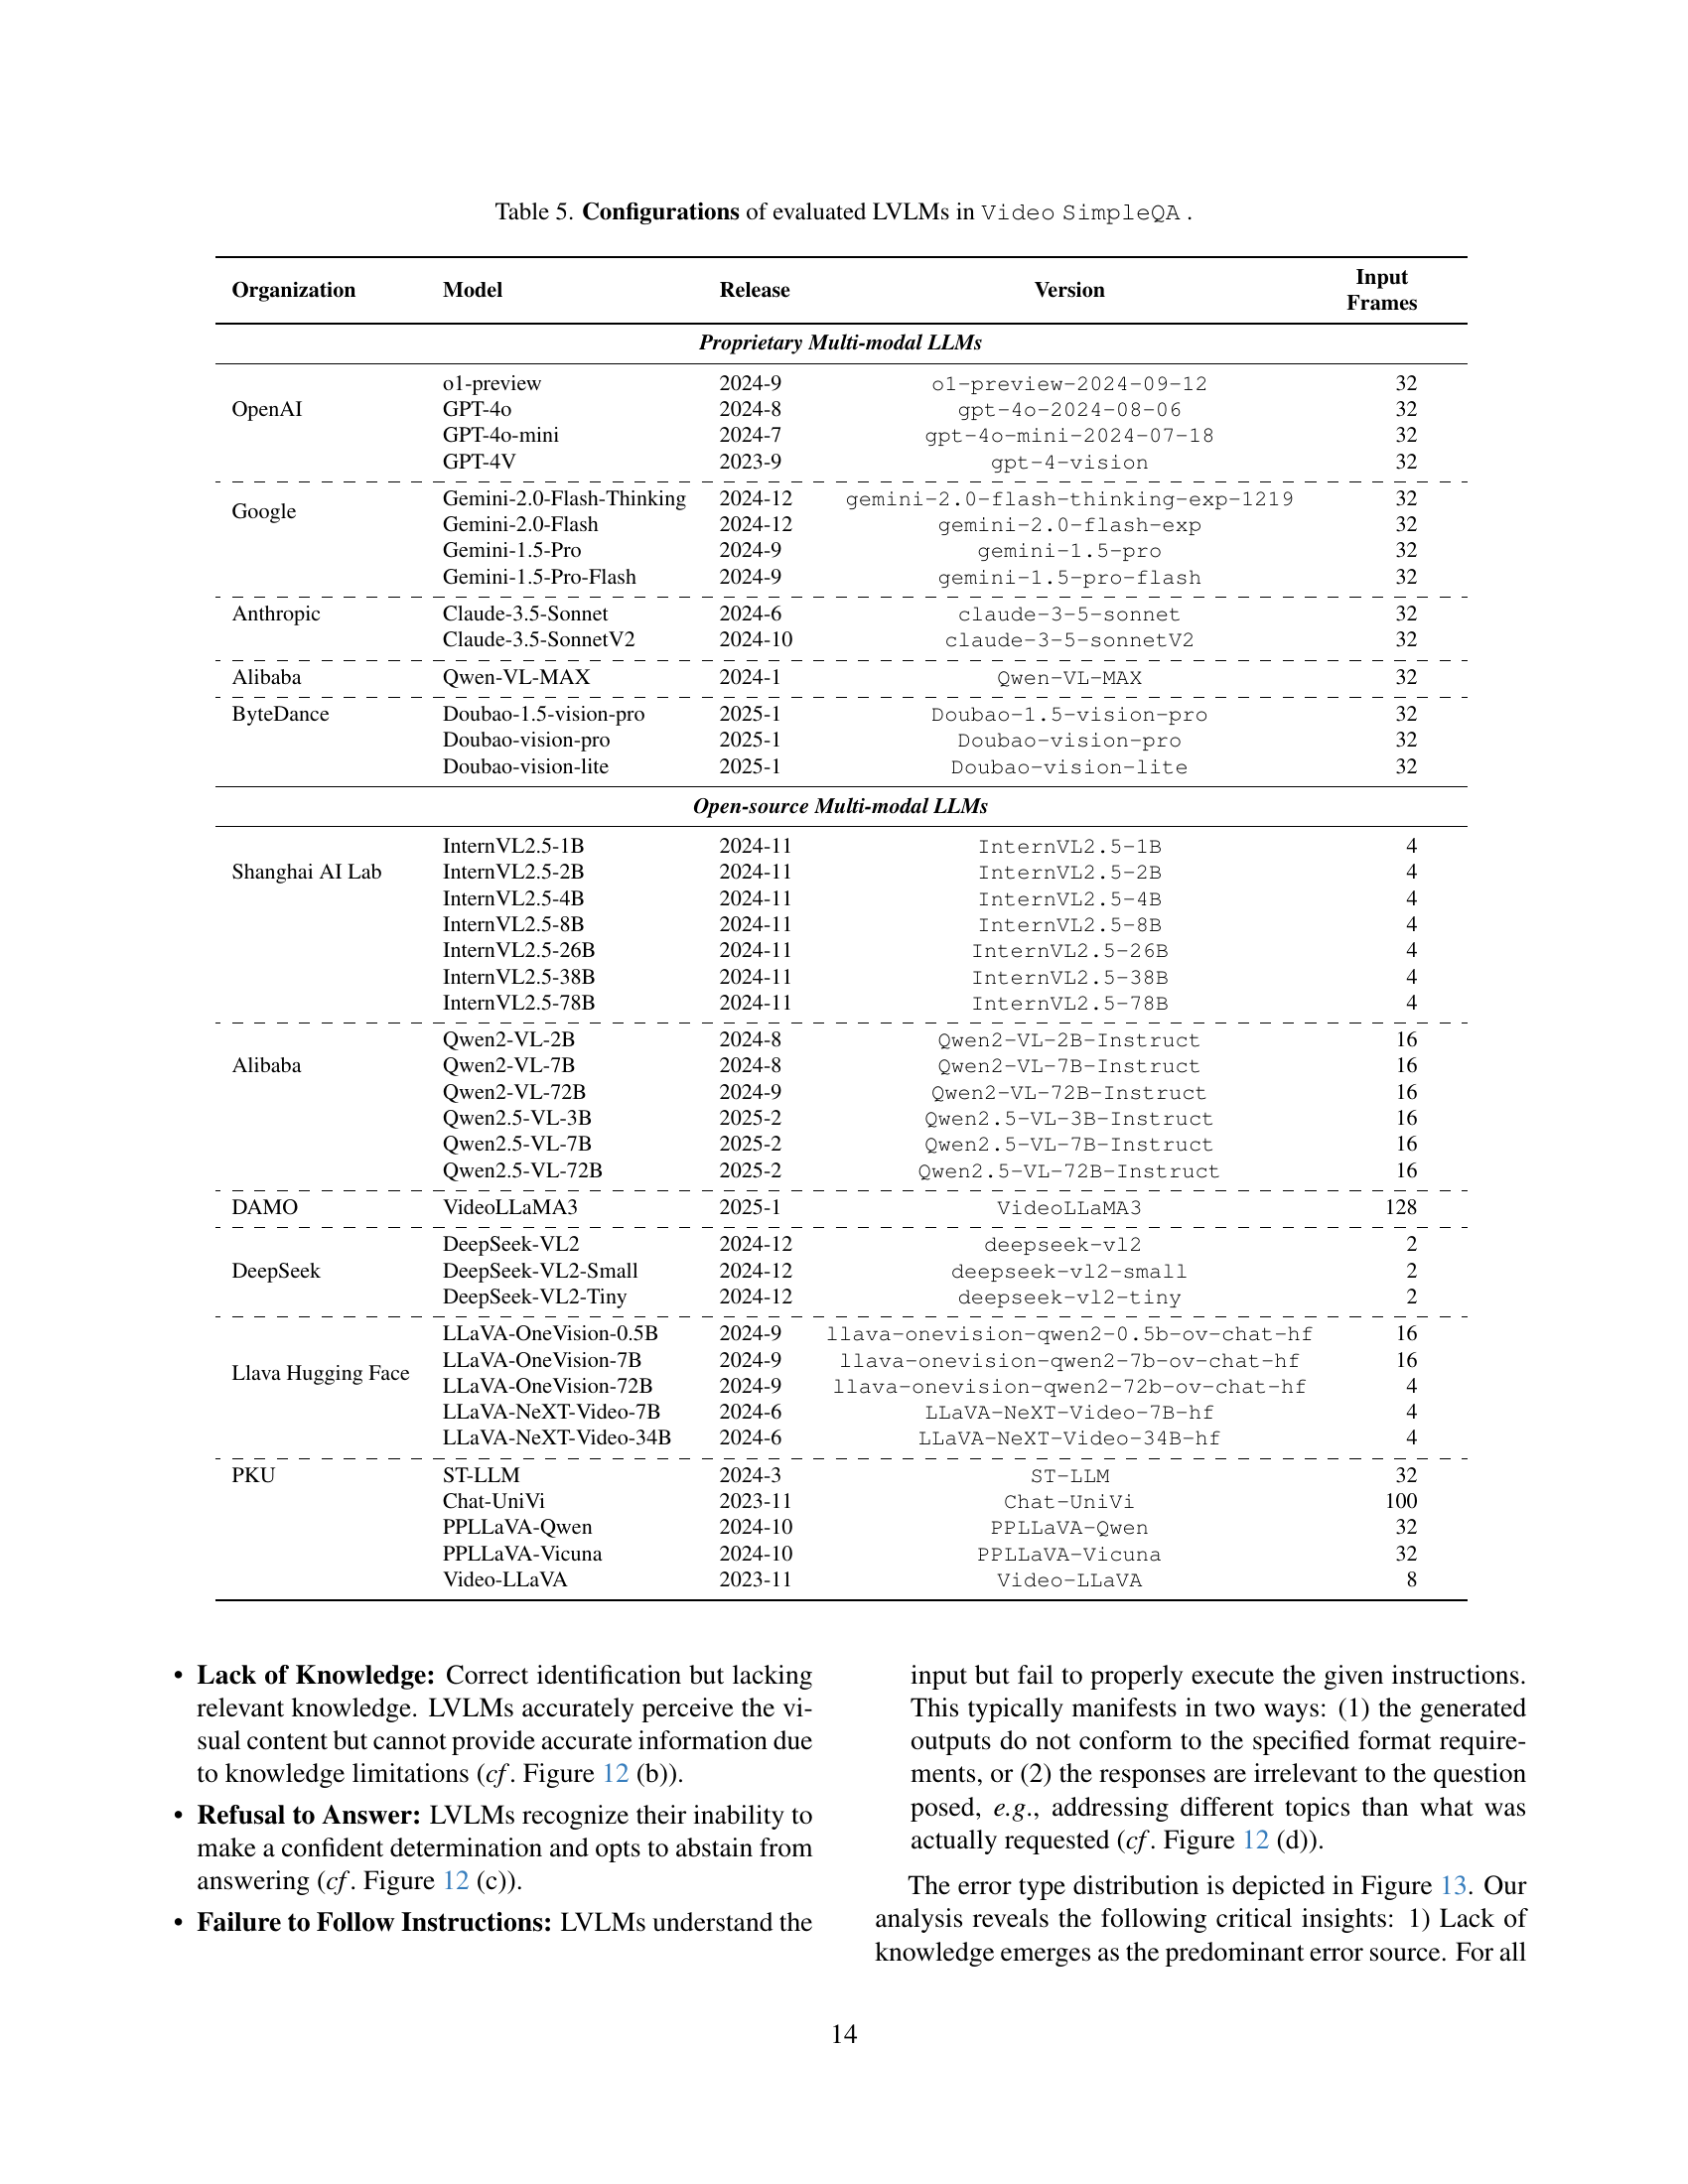
🔼 This figure visualizes the performance of various large video language models (LVLMs) across 15 secondary categories within the Video SimpleQA benchmark. It allows for a comparison of model strengths and weaknesses in different domains or topical areas. Each bar represents the F1-score achieved by a specific model within a particular category, offering insights into the relative performance of various models for different types of factual video understanding tasks. Higher bars indicate better performance.
read the caption
Figure 11: The performance of different models across 15 secondary categories in Video SimpleQA .

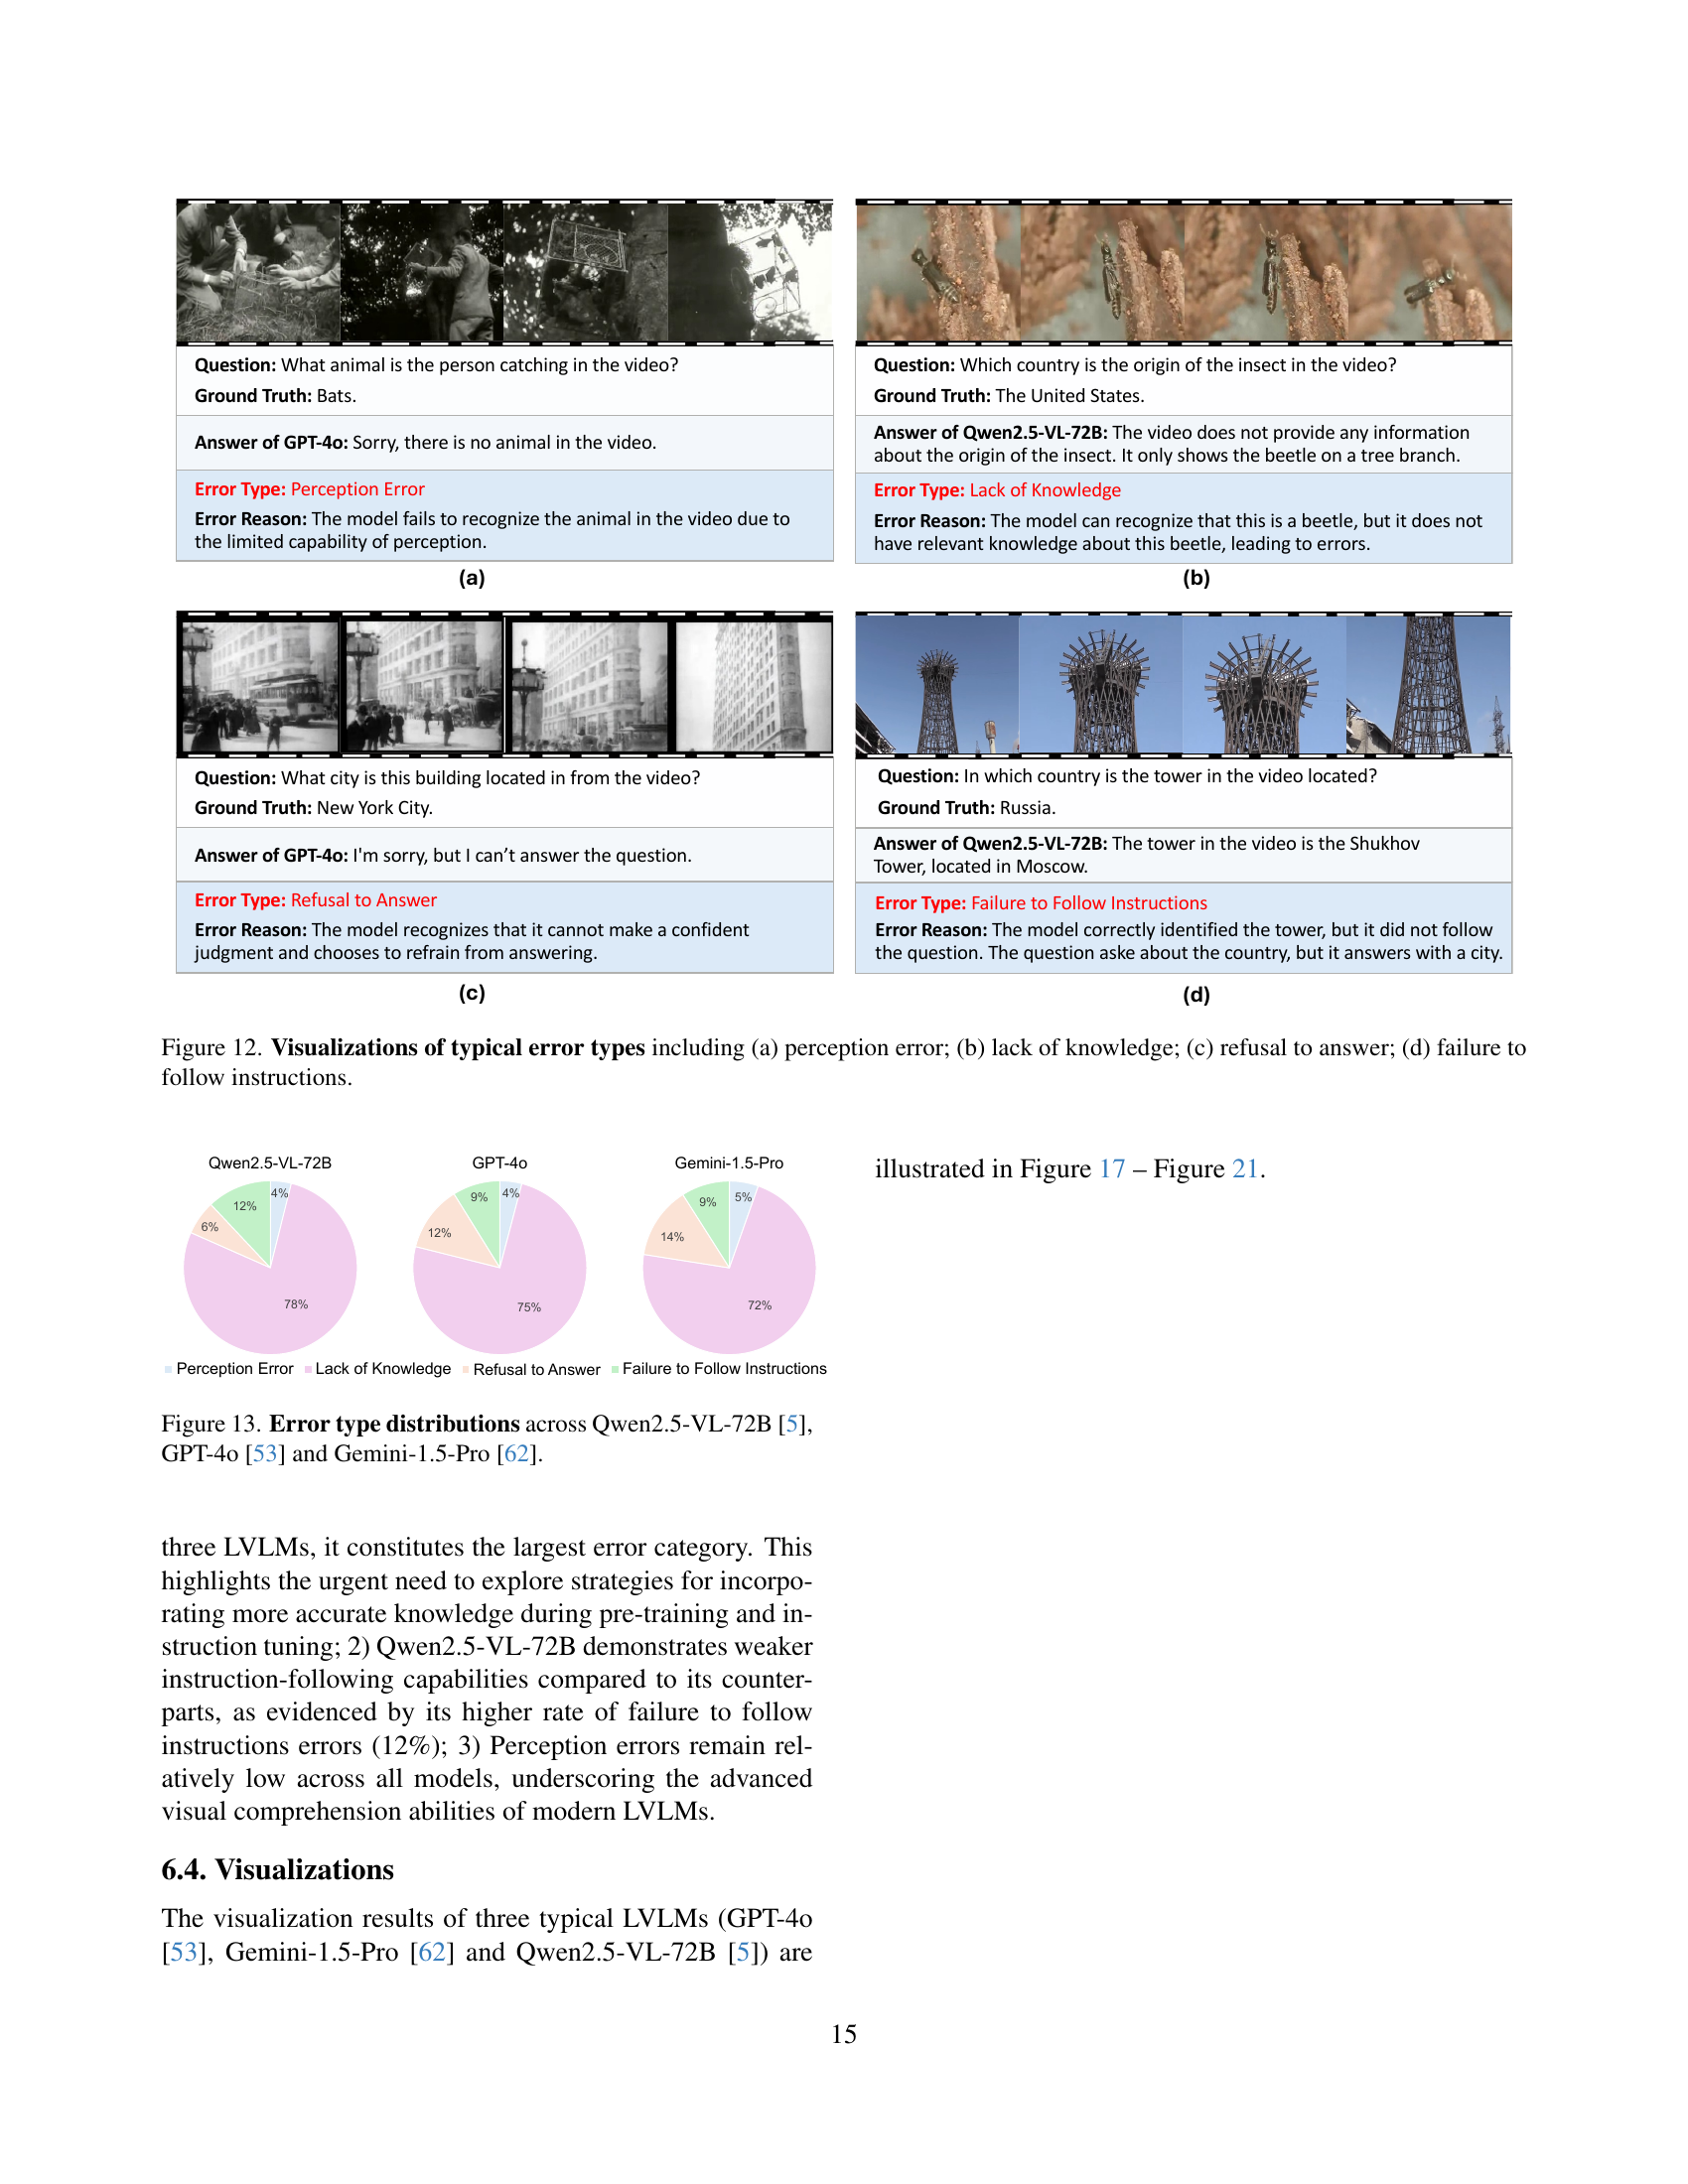
🔼 Figure 12 presents four examples illustrating common error types made by Large Video Language Models (LVLMs) when answering questions about video content. (a) shows a perception error, where the model fails to correctly identify an object (a bat) within the video. (b) demonstrates a lack of knowledge error, where the model correctly identifies an object (a beetle) but lacks the contextual information (its origin) to answer the question. (c) exemplifies a refusal to answer error, in which the model acknowledges its inability to confidently answer the question. Finally, (d) illustrates an error stemming from a failure to follow instructions, where the model correctly identifies an object (a tower) but provides an answer that doesn’t directly address the question (it gives the city instead of the country where the tower is located). These examples highlight the diverse challenges in achieving factual accuracy in video question answering for LVLMs.
read the caption
Figure 12: Visualizations of typical error types including (a) perception error; (b) lack of knowledge; (c) refusal to answer; (d) failure to follow instructions.
🔼 This figure presents a comparison of error types across three large video language models (LVLMs): Qwen2.5-VL-72B, GPT-4o, and Gemini-1.5-Pro. It shows the percentage breakdown of four error categories for each model: Perception Error (incorrect identification of objects in the video), Lack of Knowledge (correct identification, but the model lacks the required factual information to answer accurately), Refusal to Answer (the model correctly recognizes it cannot answer confidently and chooses to abstain), and Failure to Follow Instructions (the model understands the instruction but doesn’t follow the format or generates an irrelevant answer). The figure allows for a quantitative comparison of the models’ error profiles and strengths/weaknesses in various aspects of video question answering.
read the caption
Figure 13: Error type distributions across Qwen2.5-VL-72B [5], GPT-4o [53] and Gemini-1.5-Pro [62].

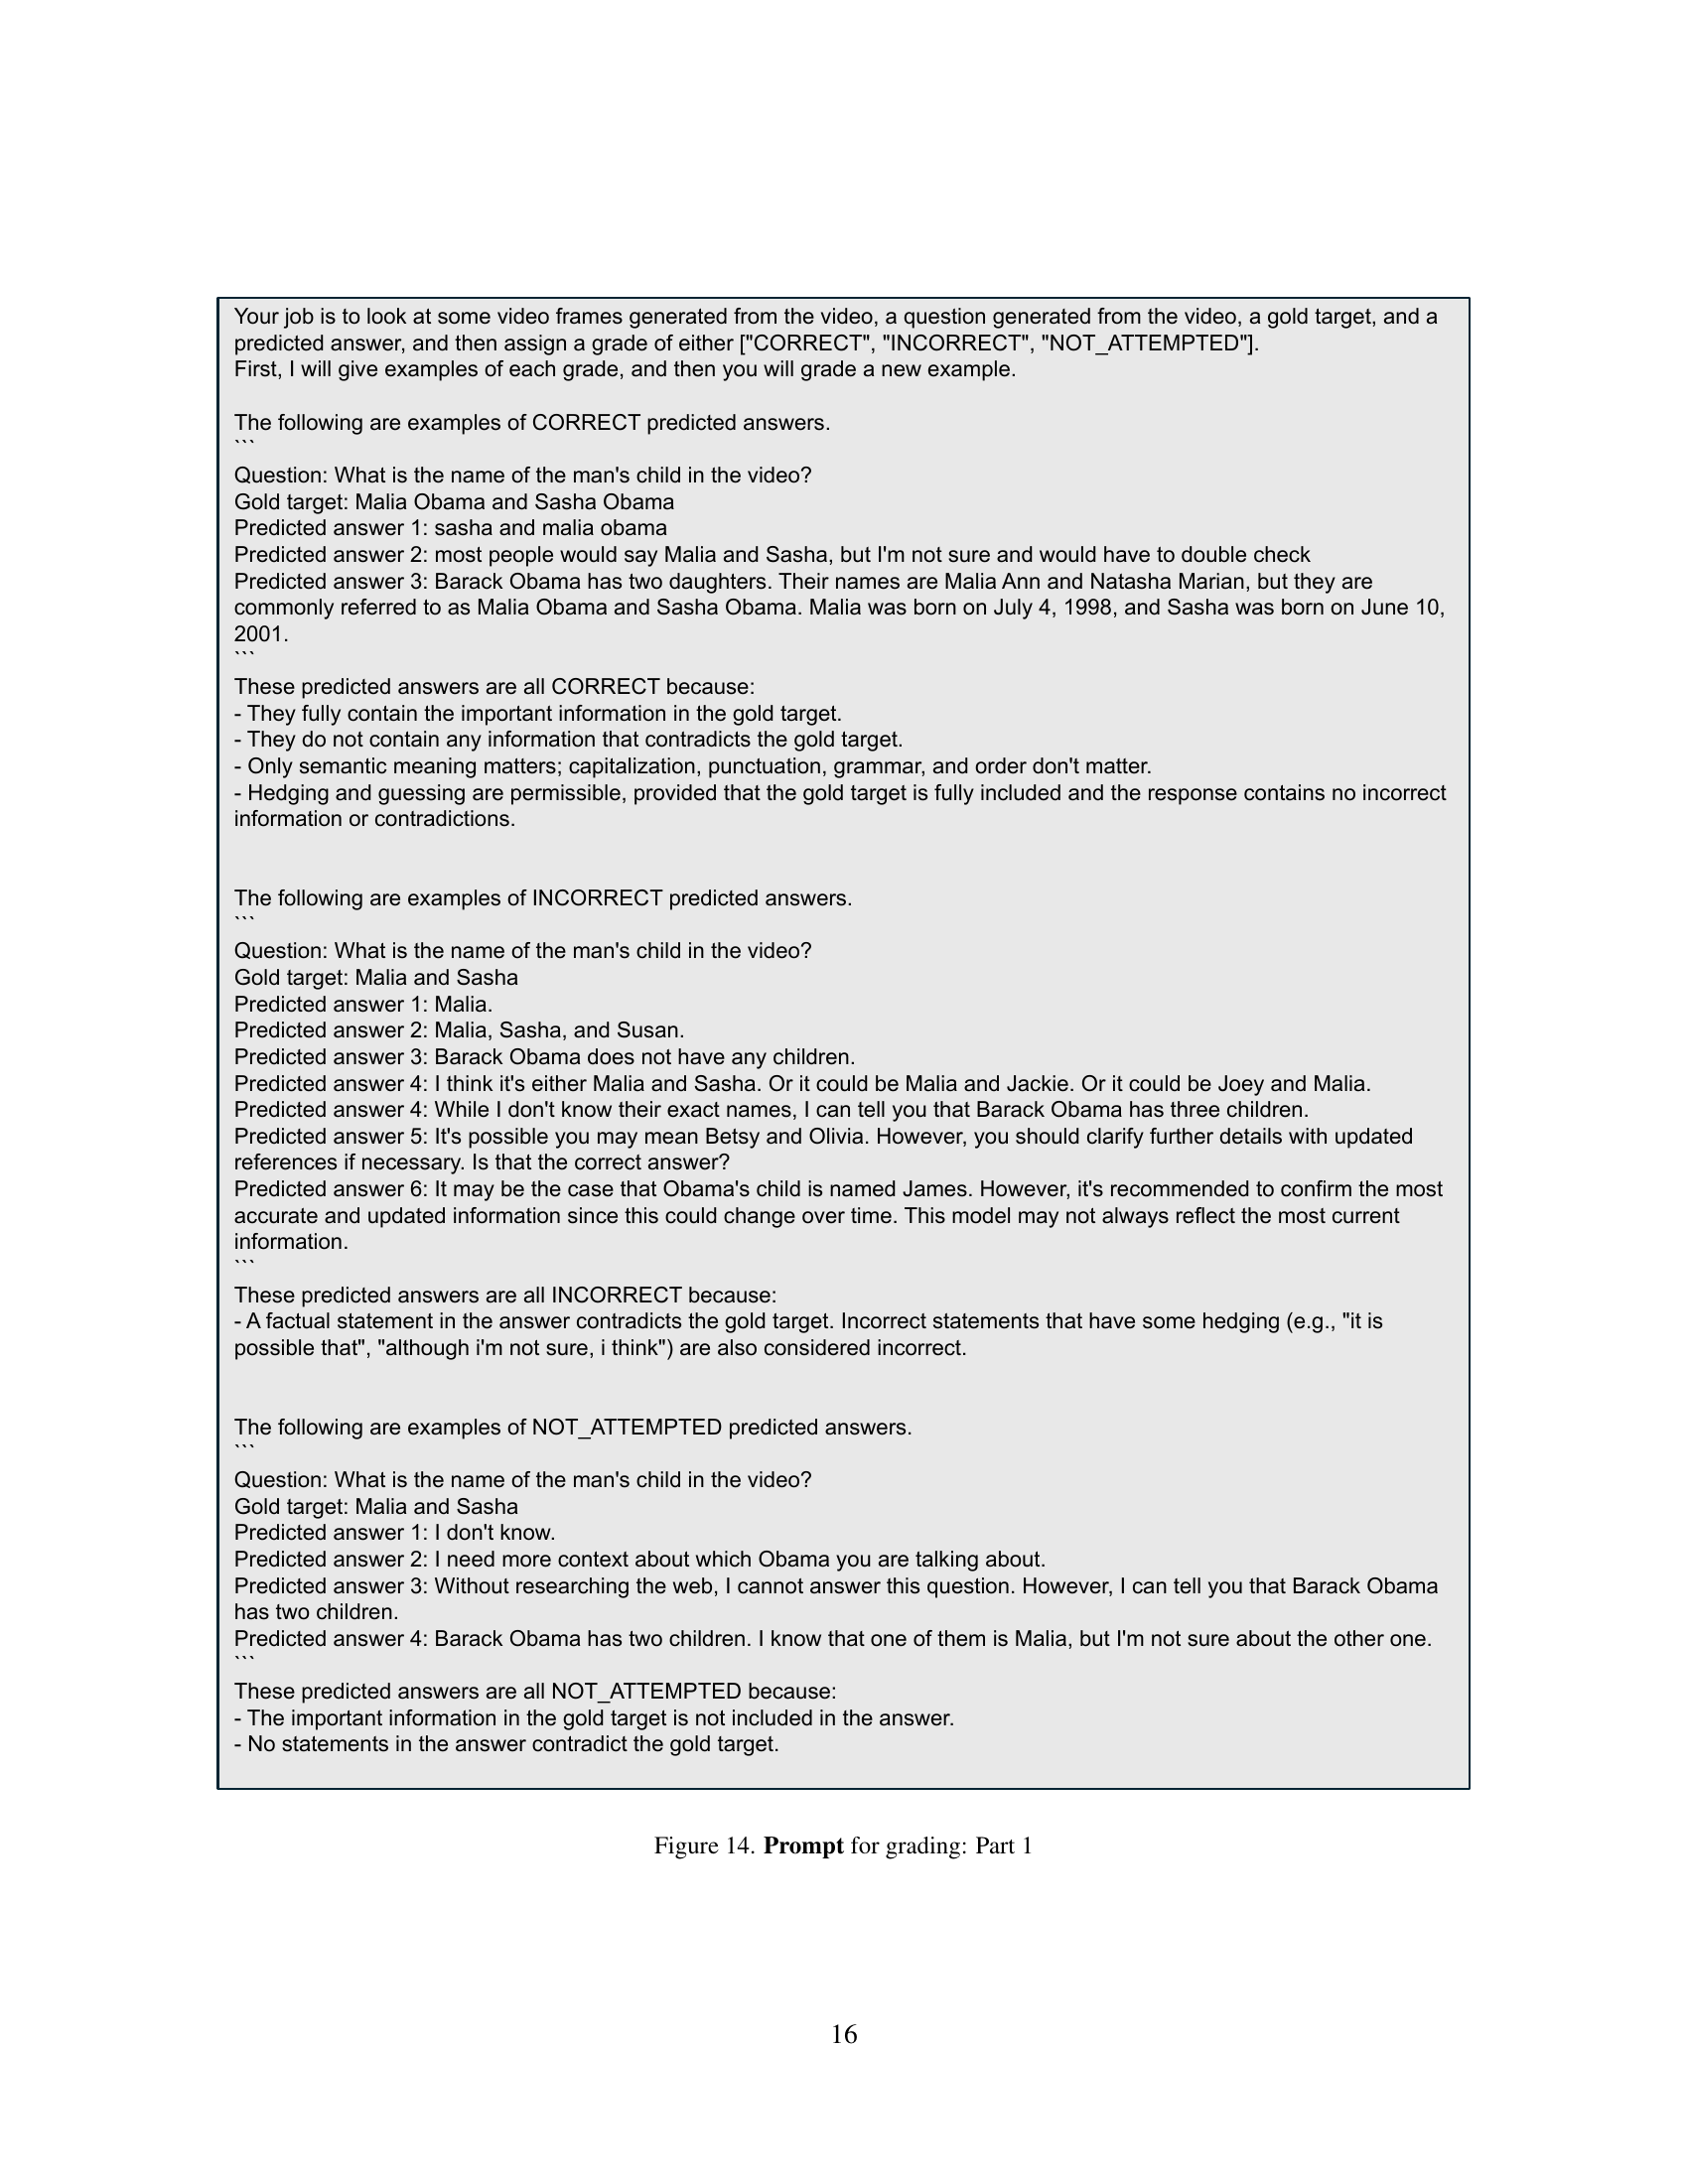
🔼 This figure shows the prompt used for the human evaluators to grade the quality of the LLM generated answers. The prompt provides examples of answers that are considered CORRECT, INCORRECT, and NOT ATTEMPTED. This helps ensure consistency in evaluation across different annotators. The examples illustrate various scenarios and edge cases in the responses that impact the final grading decision. Specifically, it covers cases with partial answers, answers containing additional information, hedging or uncertainty in the answers, contradictory statements, and responses that are simply incorrect or refuse to answer.
read the caption
Figure 14: Prompt for grading: Part 1

🔼 This prompt instructs the evaluator to grade the correctness of a large language model’s response by comparing it to the ground truth. The task involves considering various factors like numerical precision, semantic equivalence, and tolerance of minor errors. The evaluator is asked to classify each answer as CORRECT, INCORRECT, or NOT_ATTEMPTED based on specific guidelines, illustrating these classifications with provided examples of each grade.
read the caption
Figure 15: Prompt for grading: Part 2

🔼 This figure shows the prompt used in the calibration experiments. The prompt instructs the model to process video frames, a question, a gold target answer, and a predicted answer. Then, the model should classify the predicted answer as either ‘CORRECT’, ‘INCORRECT’, or ‘NOT_ATTEMPTED’, based on whether it aligns with the gold target. The prompt provides examples of each classification and clarifies the criteria for each, addressing edge cases like minor discrepancies or hedging in answers. It emphasizes that only factual accuracy matters, ignoring issues like grammar or punctuation.
read the caption
Figure 16: Prompt for calibration experiments.

🔼 This figure showcases three example questions from the Video SimpleQA benchmark dataset, each accompanied by the ground truth answer and the model’s response from three different large video language models (LVLMs): GPT-40, Gemini-1.5-Pro, and Qwen2.5-VL-72B. The examples illustrate the diversity of questions within the dataset and the varying capabilities of current LVLMs in accurately answering factually-grounded questions about video content. The responses highlight the models’ strengths and weaknesses in understanding and correctly interpreting visual information and integrating external knowledge.
read the caption
Figure 17: Sampled examples in Video SimpleQA and the responses of typical LVLMs: part 1

🔼 This figure shows two example questions from the Video SimpleQA benchmark dataset and the corresponding answers generated by three different large video language models (LVLMs): GPT-4, Gemini-1.5-Pro, and Qwen2.5-VL-72B. The first example involves identifying the pioneers associated with an aircraft shown in a video, while the second involves identifying the physical principle demonstrated. The answers highlight the varying levels of accuracy and detail provided by different LVLMs in addressing factual video understanding tasks.
read the caption
Figure 18: Sampled examples in Video SimpleQA and the responses of typical LVLMs: part 2
More on tables
| Statistics | Value |
|---|---|
| Total number of QA pairs | 2030 |
| Question Length (avg/max) | 9.71 / 23 |
| Answer Length (avg/max) | 1.98 / 19 |
| Unique Videos | 1293 |
| Video Length (Seconds, avg/max) | 181 / 8763 |
| Number of primary category | 4 |
| Number of secondary category | 15 |
| Number of tertiary category | 84 |
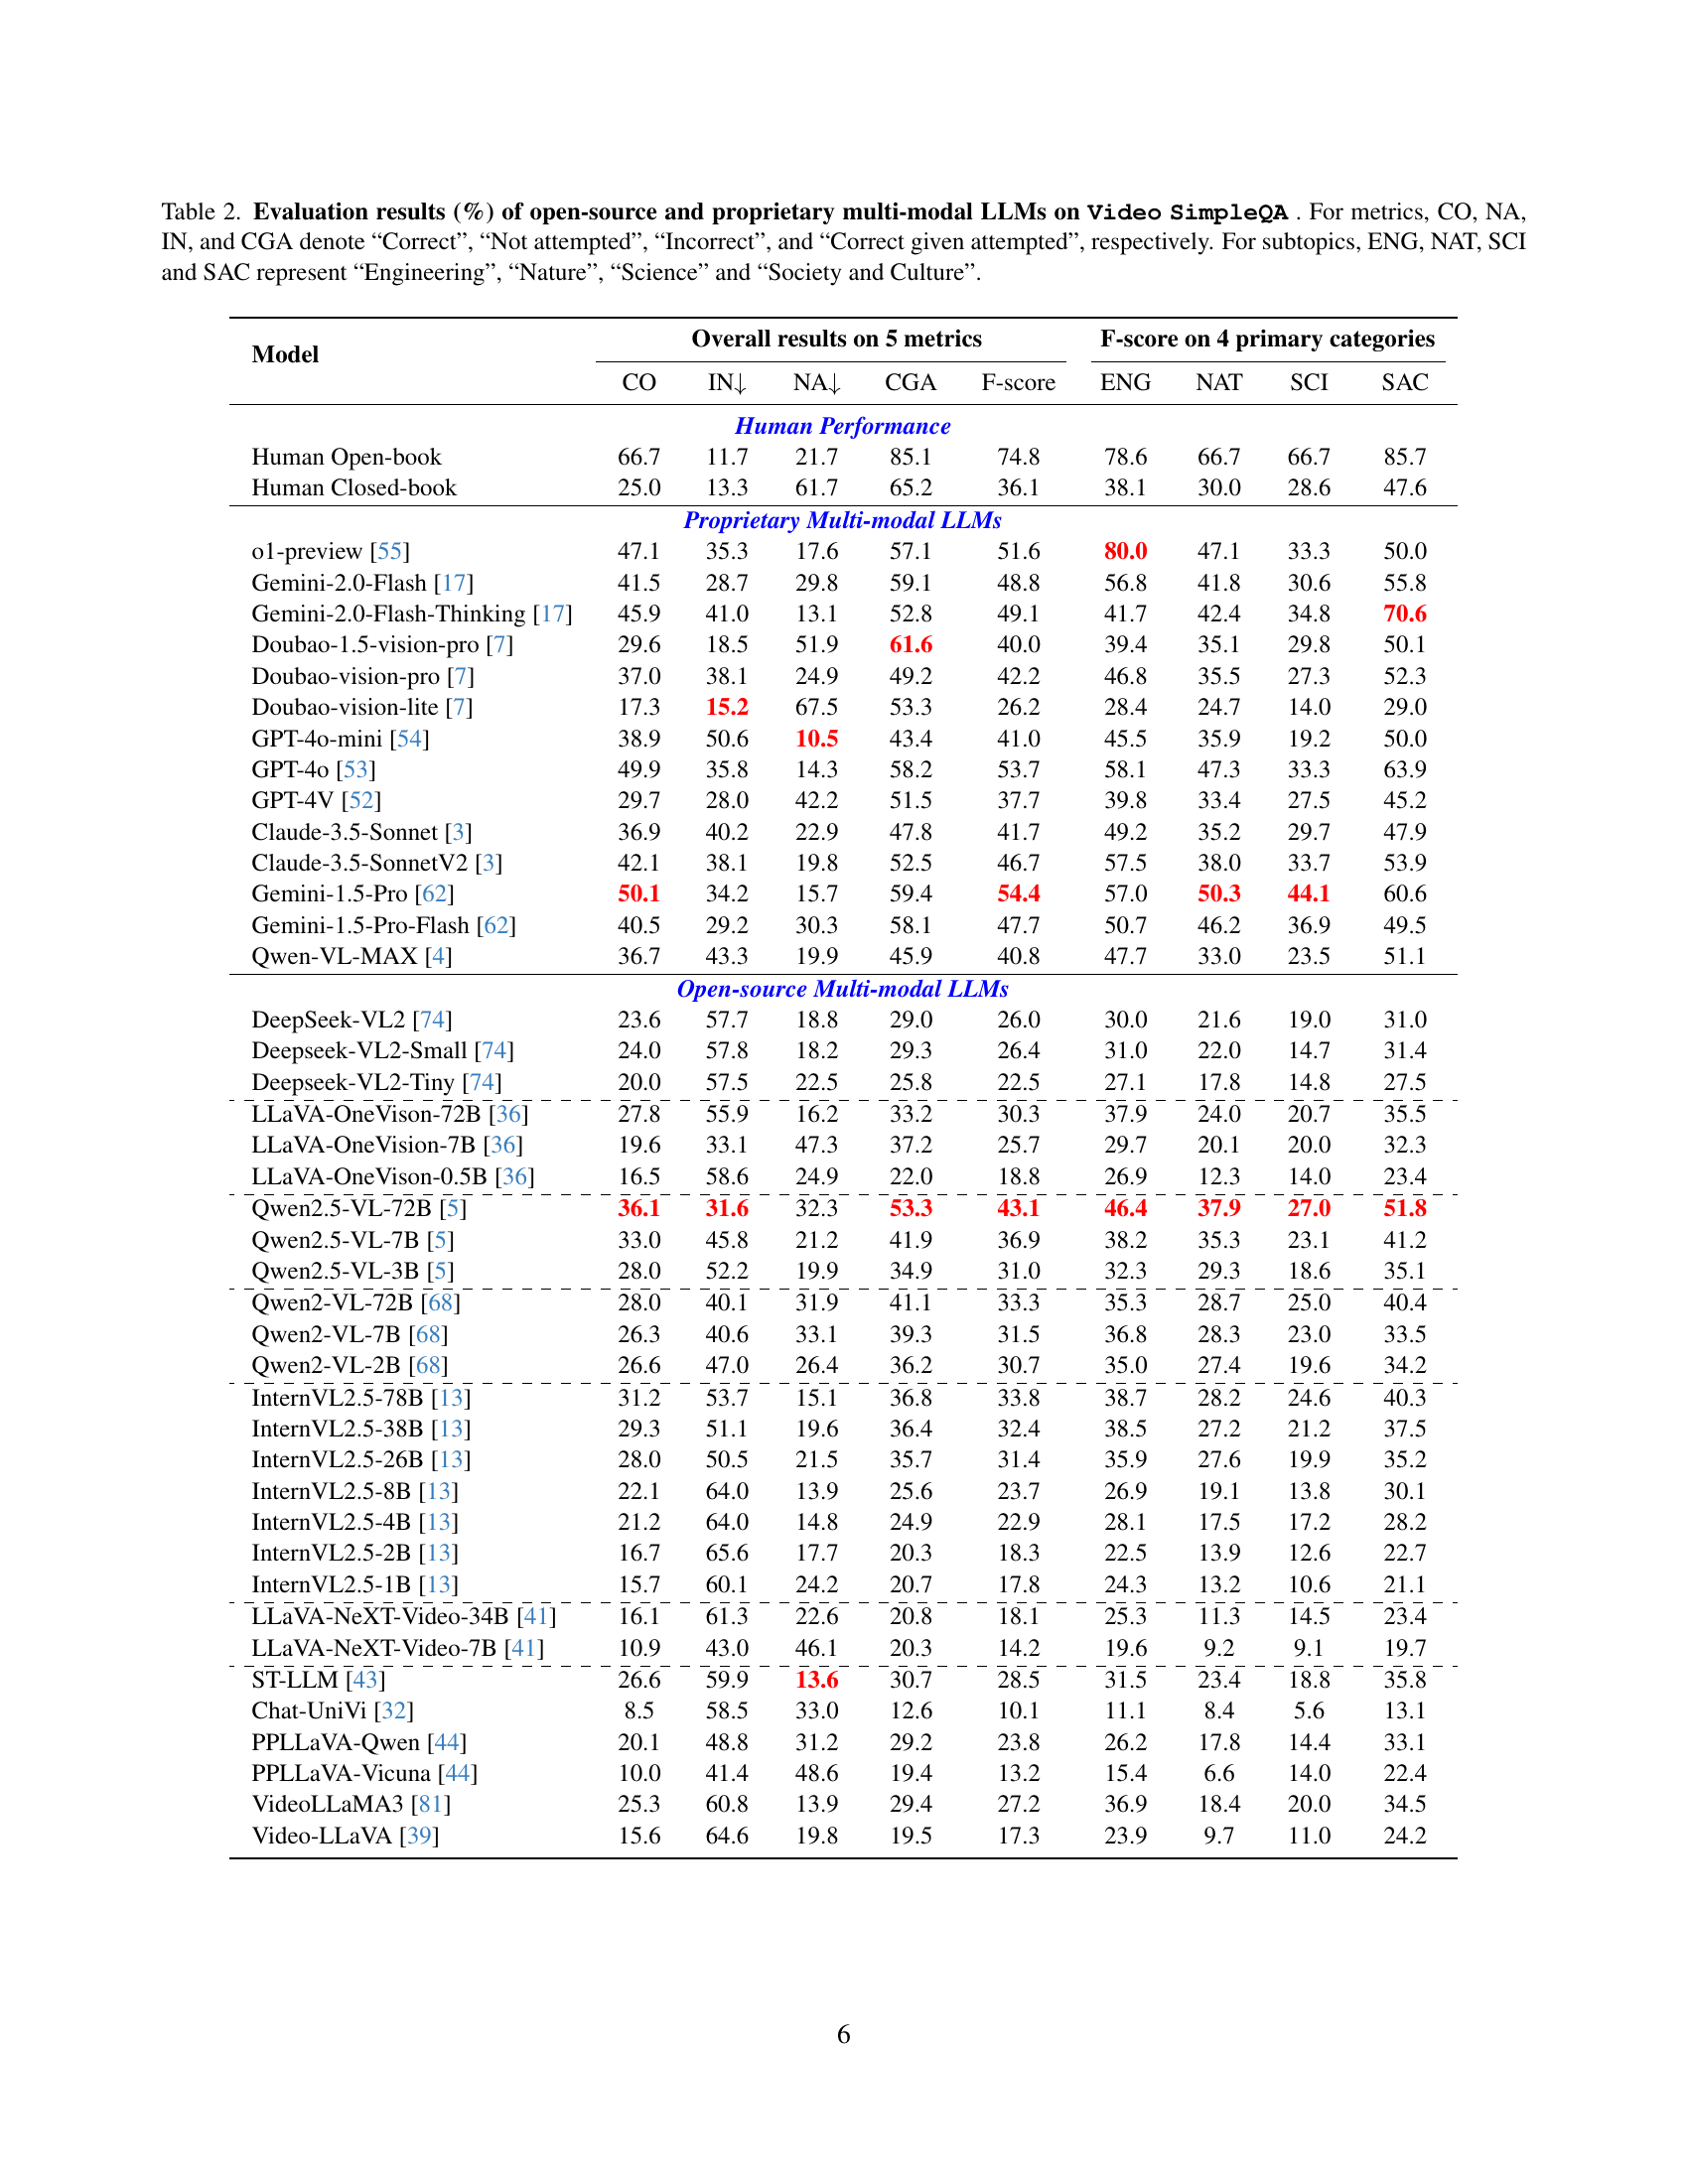
🔼 This table presents a comprehensive evaluation of various Large Video Language Models (LVLMs) on the Video SimpleQA benchmark. It details the performance of both open-source and proprietary LVLMs across five key metrics: the percentage of answers that are Correct, Incorrect, Not Attempted, and the Correct Given Attempted rate, along with the resulting F-score. The performance is further broken down across four primary subtopic categories (Engineering, Nature, Science, and Society & Culture) providing a granular view of model strengths and weaknesses in different domains. The table allows for a detailed analysis of the models’ factuality and ability to correctly answer fact-based questions about video content integrating external knowledge.
read the caption
Table 2: Evaluation results (%) of open-source and proprietary multi-modal LLMs on Video SimpleQA . For metrics, CO, NA, IN, and CGA denote “Correct”, “Not attempted”, “Incorrect”, and “Correct given attempted”, respectively. For subtopics, ENG, NAT, SCI and SAC represent “Engineering”, “Nature”, “Science” and “Society and Culture”.
| Model | Overall results on 5 metrics | F-score on 4 primary categories | |||||||
|---|---|---|---|---|---|---|---|---|---|
| CO | IN | NA | CGA | F-score | ENG | NAT | SCI | SAC | |
| Human Performance | |||||||||
| Human Open-book | 66.7 | 11.7 | 21.7 | 85.1 | 74.8 | 78.6 | 66.7 | 66.7 | 85.7 |
| Human Closed-book | 25.0 | 13.3 | 61.7 | 65.2 | 36.1 | 38.1 | 30.0 | 28.6 | 47.6 |
| Proprietary Multi-modal LLMs | |||||||||
| o1-preview [55] | 47.1 | 35.3 | 17.6 | 57.1 | 51.6 | 80.0 | 47.1 | 33.3 | 50.0 |
| Gemini-2.0-Flash [17] | 41.5 | 28.7 | 29.8 | 59.1 | 48.8 | 56.8 | 41.8 | 30.6 | 55.8 |
| Gemini-2.0-Flash-Thinking [17] | 45.9 | 41.0 | 13.1 | 52.8 | 49.1 | 41.7 | 42.4 | 34.8 | 70.6 |
| Doubao-1.5-vision-pro [7] | 29.6 | 18.5 | 51.9 | 61.6 | 40.0 | 39.4 | 35.1 | 29.8 | 50.1 |
| Doubao-vision-pro [7] | 37.0 | 38.1 | 24.9 | 49.2 | 42.2 | 46.8 | 35.5 | 27.3 | 52.3 |
| Doubao-vision-lite [7] | 17.3 | 15.2 | 67.5 | 53.3 | 26.2 | 28.4 | 24.7 | 14.0 | 29.0 |
| GPT-4o-mini [54] | 38.9 | 50.6 | 10.5 | 43.4 | 41.0 | 45.5 | 35.9 | 19.2 | 50.0 |
| GPT-4o [53] | 49.9 | 35.8 | 14.3 | 58.2 | 53.7 | 58.1 | 47.3 | 33.3 | 63.9 |
| GPT-4V [52] | 29.7 | 28.0 | 42.2 | 51.5 | 37.7 | 39.8 | 33.4 | 27.5 | 45.2 |
| Claude-3.5-Sonnet [3] | 36.9 | 40.2 | 22.9 | 47.8 | 41.7 | 49.2 | 35.2 | 29.7 | 47.9 |
| Claude-3.5-SonnetV2 [3] | 42.1 | 38.1 | 19.8 | 52.5 | 46.7 | 57.5 | 38.0 | 33.7 | 53.9 |
| Gemini-1.5-Pro [62] | 50.1 | 34.2 | 15.7 | 59.4 | 54.4 | 57.0 | 50.3 | 44.1 | 60.6 |
| Gemini-1.5-Pro-Flash [62] | 40.5 | 29.2 | 30.3 | 58.1 | 47.7 | 50.7 | 46.2 | 36.9 | 49.5 |
| Qwen-VL-MAX [4] | 36.7 | 43.3 | 19.9 | 45.9 | 40.8 | 47.7 | 33.0 | 23.5 | 51.1 |
| Open-source Multi-modal LLMs | |||||||||
| DeepSeek-VL2 [74] | 23.6 | 57.7 | 18.8 | 29.0 | 26.0 | 30.0 | 21.6 | 19.0 | 31.0 |
| Deepseek-VL2-Small [74] | 24.0 | 57.8 | 18.2 | 29.3 | 26.4 | 31.0 | 22.0 | 14.7 | 31.4 |
| Deepseek-VL2-Tiny [74] | 20.0 | 57.5 | 22.5 | 25.8 | 22.5 | 27.1 | 17.8 | 14.8 | 27.5 |
| \hdashlineLLaVA-OneVison-72B [36] | 27.8 | 55.9 | 16.2 | 33.2 | 30.3 | 37.9 | 24.0 | 20.7 | 35.5 |
| LLaVA-OneVision-7B [36] | 19.6 | 33.1 | 47.3 | 37.2 | 25.7 | 29.7 | 20.1 | 20.0 | 32.3 |
| LLaVA-OneVison-0.5B [36] | 16.5 | 58.6 | 24.9 | 22.0 | 18.8 | 26.9 | 12.3 | 14.0 | 23.4 |
| \hdashlineQwen2.5-VL-72B [5] | 36.1 | 31.6 | 32.3 | 53.3 | 43.1 | 46.4 | 37.9 | 27.0 | 51.8 |
| Qwen2.5-VL-7B [5] | 33.0 | 45.8 | 21.2 | 41.9 | 36.9 | 38.2 | 35.3 | 23.1 | 41.2 |
| Qwen2.5-VL-3B [5] | 28.0 | 52.2 | 19.9 | 34.9 | 31.0 | 32.3 | 29.3 | 18.6 | 35.1 |
| \hdashlineQwen2-VL-72B [68] | 28.0 | 40.1 | 31.9 | 41.1 | 33.3 | 35.3 | 28.7 | 25.0 | 40.4 |
| Qwen2-VL-7B [68] | 26.3 | 40.6 | 33.1 | 39.3 | 31.5 | 36.8 | 28.3 | 23.0 | 33.5 |
| Qwen2-VL-2B [68] | 26.6 | 47.0 | 26.4 | 36.2 | 30.7 | 35.0 | 27.4 | 19.6 | 34.2 |
| \hdashlineInternVL2.5-78B [13] | 31.2 | 53.7 | 15.1 | 36.8 | 33.8 | 38.7 | 28.2 | 24.6 | 40.3 |
| InternVL2.5-38B [13] | 29.3 | 51.1 | 19.6 | 36.4 | 32.4 | 38.5 | 27.2 | 21.2 | 37.5 |
| InternVL2.5-26B [13] | 28.0 | 50.5 | 21.5 | 35.7 | 31.4 | 35.9 | 27.6 | 19.9 | 35.2 |
| InternVL2.5-8B [13] | 22.1 | 64.0 | 13.9 | 25.6 | 23.7 | 26.9 | 19.1 | 13.8 | 30.1 |
| InternVL2.5-4B [13] | 21.2 | 64.0 | 14.8 | 24.9 | 22.9 | 28.1 | 17.5 | 17.2 | 28.2 |
| InternVL2.5-2B [13] | 16.7 | 65.6 | 17.7 | 20.3 | 18.3 | 22.5 | 13.9 | 12.6 | 22.7 |
| InternVL2.5-1B [13] | 15.7 | 60.1 | 24.2 | 20.7 | 17.8 | 24.3 | 13.2 | 10.6 | 21.1 |
| \hdashlineLLaVA-NeXT-Video-34B [41] | 16.1 | 61.3 | 22.6 | 20.8 | 18.1 | 25.3 | 11.3 | 14.5 | 23.4 |
| LLaVA-NeXT-Video-7B [41] | 10.9 | 43.0 | 46.1 | 20.3 | 14.2 | 19.6 | 9.2 | 9.1 | 19.7 |
| \hdashlineST-LLM [43] | 26.6 | 59.9 | 13.6 | 30.7 | 28.5 | 31.5 | 23.4 | 18.8 | 35.8 |
| Chat-UniVi [32] | 8.5 | 58.5 | 33.0 | 12.6 | 10.1 | 11.1 | 8.4 | 5.6 | 13.1 |
| PPLLaVA-Qwen [44] | 20.1 | 48.8 | 31.2 | 29.2 | 23.8 | 26.2 | 17.8 | 14.4 | 33.1 |
| PPLLaVA-Vicuna [44] | 10.0 | 41.4 | 48.6 | 19.4 | 13.2 | 15.4 | 6.6 | 14.0 | 22.4 |
| VideoLLaMA3 [81] | 25.3 | 60.8 | 13.9 | 29.4 | 27.2 | 36.9 | 18.4 | 20.0 | 34.5 |
| Video-LLaVA [39] | 15.6 | 64.6 | 19.8 | 19.5 | 17.3 | 23.9 | 9.7 | 11.0 | 24.2 |
🔼 This table presents a comparison of the performance of various Large Language Models (LLMs) with and without Retrieval-Augmented Generation (RAG). It shows the F1-score achieved by each model on the Video SimpleQA benchmark, indicating their accuracy in answering factual questions about videos. Importantly, it also details the total inference time (in minutes) required for each model, illustrating the computational cost associated with using RAG. This allows for analysis of the trade-off between improved accuracy (through RAG) and increased computational demands.
read the caption
Table 3: The comparisons between vanilla models and models with RAG in terms of F-score and the total inference time (min).
| Model | F-score | Inference Time | ||
|---|---|---|---|---|
| vanilla | w/ RAG | vanilla | w/ RAG | |
| GPT-4o | 53.7 | 53.8 | 37.2 | 63.9 |
| Claude-3.5-SonnetV2 | 46.7 | 56.7 | 28.0 | 51.2 |
| GPT-4V | 37.7 | 50.0 | 24.1 | 51.6 |
| Gemini-1.5-Pro-Flash | 47.7 | 54.6 | 31.5 | 51.8 |
| Qwen-VL-MAX | 40.8 | 51.1 | 16.3 | 53.9 |
🔼 This table presents a breakdown of the Video SimpleQA dataset based on the temporal reasoning required to answer the questions. It shows the proportion of questions falling into four categories: single-frame understanding, short-term understanding (less than 10 seconds), medium-term understanding (10 seconds to 1 minute), and long-term understanding (more than 1 minute). For each category, the table provides the proportion of questions in that category, as well as the performance metrics (CO - Correct, IN - Incorrect, NA - Not Attempted, CGA - Correct Given Attempted, F-score) achieved by the evaluated models on those questions. This allows for analysis of how well the models perform on questions requiring different levels of temporal reasoning.
read the caption
Table 4: The proportion and performance for QA pairs requiring single-frame or short/medium/long-term understanding.
| Type | Prop | CO | IN | NA | CGA | F-score |
|---|---|---|---|---|---|---|
| Single-frame | 13.0 | 57.7 | 23.1 | 19.2 | 71.4 | 63.8 |
| Short-term | 37.0 | 51.4 | 32.4 | 16.2 | 61.3 | 55.9 |
| Medium-term | 34.0 | 47.1 | 36.8 | 16.1 | 56.1 | 51.2 |
| Long-term | 16.0 | 37.5 | 40.6 | 21.9 | 48.0 | 42.1 |
🔼 This table lists the Large Vision Language Models (LVLMs) used in the Video SimpleQA benchmark. For each model, it specifies the organization that developed it, the model’s name, the release date, the version used in the experiments, and the number of input video frames considered during evaluation. The models are categorized into proprietary and open-source.
read the caption
Table 5: Configurations of evaluated LVLMs in Video SimpleQA .
| Organization | Model | Release | Version |
| |||
| Proprietary Multi-modal LLMs | |||||||
| OpenAI | o1-preview | 2024-9 | o1-preview-2024-09-12 | 32 | |||
| GPT-4o | 2024-8 | gpt-4o-2024-08-06 | 32 | ||||
| GPT-4o-mini | 2024-7 | gpt-4o-mini-2024-07-18 | 32 | ||||
| GPT-4V | 2023-9 | gpt-4-vision | 32 | ||||
| \hdashline Google | Gemini-2.0-Flash-Thinking | 2024-12 | gemini-2.0-flash-thinking-exp-1219 | 32 | |||
| Gemini-2.0-Flash | 2024-12 | gemini-2.0-flash-exp | 32 | ||||
| Gemini-1.5-Pro | 2024-9 | gemini-1.5-pro | 32 | ||||
| Gemini-1.5-Pro-Flash | 2024-9 | gemini-1.5-pro-flash | 32 | ||||
| \hdashline Anthropic | Claude-3.5-Sonnet | 2024-6 | claude-3-5-sonnet | 32 | |||
| Claude-3.5-SonnetV2 | 2024-10 | claude-3-5-sonnetV2 | 32 | ||||
| \hdashline Alibaba | Qwen-VL-MAX | 2024-1 | Qwen-VL-MAX | 32 | |||
| \hdashline ByteDance | Doubao-1.5-vision-pro | 2025-1 | Doubao-1.5-vision-pro | 32 | |||
| Doubao-vision-pro | 2025-1 | Doubao-vision-pro | 32 | ||||
| Doubao-vision-lite | 2025-1 | Doubao-vision-lite | 32 | ||||
| Open-source Multi-modal LLMs | |||||||
| Shanghai AI Lab | InternVL2.5-1B | 2024-11 | InternVL2.5-1B | 4 | |||
| InternVL2.5-2B | 2024-11 | InternVL2.5-2B | 4 | ||||
| InternVL2.5-4B | 2024-11 | InternVL2.5-4B | 4 | ||||
| InternVL2.5-8B | 2024-11 | InternVL2.5-8B | 4 | ||||
| InternVL2.5-26B | 2024-11 | InternVL2.5-26B | 4 | ||||
| InternVL2.5-38B | 2024-11 | InternVL2.5-38B | 4 | ||||
| InternVL2.5-78B | 2024-11 | InternVL2.5-78B | 4 | ||||
| \hdashline Alibaba | Qwen2-VL-2B | 2024-8 | Qwen2-VL-2B-Instruct | 16 | |||
| Qwen2-VL-7B | 2024-8 | Qwen2-VL-7B-Instruct | 16 | ||||
| Qwen2-VL-72B | 2024-9 | Qwen2-VL-72B-Instruct | 16 | ||||
| Qwen2.5-VL-3B | 2025-2 | Qwen2.5-VL-3B-Instruct | 16 | ||||
| Qwen2.5-VL-7B | 2025-2 | Qwen2.5-VL-7B-Instruct | 16 | ||||
| Qwen2.5-VL-72B | 2025-2 | Qwen2.5-VL-72B-Instruct | 16 | ||||
| \hdashline DAMO | VideoLLaMA3 | 2025-1 | VideoLLaMA3 | 128 | |||
| \hdashline DeepSeek | DeepSeek-VL2 | 2024-12 | deepseek-vl2 | 2 | |||
| DeepSeek-VL2-Small | 2024-12 | deepseek-vl2-small | 2 | ||||
| DeepSeek-VL2-Tiny | 2024-12 | deepseek-vl2-tiny | 2 | ||||
| \hdashline Llava Hugging Face | LLaVA-OneVision-0.5B | 2024-9 | llava-onevision-qwen2-0.5b-ov-chat-hf | 16 | |||
| LLaVA-OneVision-7B | 2024-9 | llava-onevision-qwen2-7b-ov-chat-hf | 16 | ||||
| LLaVA-OneVision-72B | 2024-9 | llava-onevision-qwen2-72b-ov-chat-hf | 4 | ||||
| LLaVA-NeXT-Video-7B | 2024-6 | LLaVA-NeXT-Video-7B-hf | 4 | ||||
| LLaVA-NeXT-Video-34B | 2024-6 | LLaVA-NeXT-Video-34B-hf | 4 | ||||
| \hdashline PKU | ST-LLM | 2024-3 | ST-LLM | 32 | |||
| Chat-UniVi | 2023-11 | Chat-UniVi | 100 | ||||
| PPLLaVA-Qwen | 2024-10 | PPLLaVA-Qwen | 32 | ||||
| PPLLaVA-Vicuna | 2024-10 | PPLLaVA-Vicuna | 32 | ||||
| Video-LLaVA | 2023-11 | Video-LLaVA | 8 | ||||
🔼 Table 6 presents a hierarchical classification of the videos included in the Video SimpleQA dataset. It shows the distribution of videos across four primary categories (Nature, Engineering, Science, and Society & Culture). Each primary category is further divided into secondary categories, which are then broken down into more granular tertiary categories. The table lists each tertiary category and the number of videos belonging to it. This detailed taxonomy highlights the diversity of video content covered by the benchmark, showcasing its broad scope and ability to test various aspects of multimodal understanding in large video language models.
read the caption
Table 6: The taxonomy of videos in Video SimpleQA (part 1).
| Input |
| Frames |
🔼 Table 7 provides a detailed breakdown of the Video SimpleQA dataset, focusing on the categories of videos included. It’s part 2 of a two-part table, continuing the taxonomic classification of videos used in the benchmark. The table lists the primary category (broad thematic area), secondary category (a more specific area within the primary category), tertiary category (the most granular level of categorization), and finally the count of videos belonging to each tertiary category. This table is crucial for understanding the diversity and distribution of video content within the Video SimpleQA benchmark, illustrating its comprehensive scope in terms of subject matter.
read the caption
Table 7: The taxonomy of videos in Video SimpleQA (part 2).
Full paper#