TL;DR#
Pre-trained Vision Foundation Models (VFMs) excel in visual tasks, but face challenges in handling varied input sizes and aligning with language representations. Current methods struggle with diverse input resolutions and rely heavily on text-based supervision, leading to representation gaps. To address these issues, this paper introduces a Continual Multimodal Pre-training pipeline for prevailing VFMs.
The proposed pipeline leverages a Continual Rotary Position Embedding to accommodate different visual input resolutions, and an Alignment Loss to improve cross-modal alignment between visual and textual features. The resulting models achieve remarkable improvements in both multimodal understanding and traditional visual tasks, showcasing the effectiveness of the approach.
Key Takeaways#
Why does it matter?#
This paper introduces a novel continual multimodal pre-training pipeline that enhances visual representations and cross-modal alignment. The findings are significant for researchers in computer vision and multimodal learning, enabling better visual understanding and opening new avenues for building more effective vision-language models.
Visual Insights#

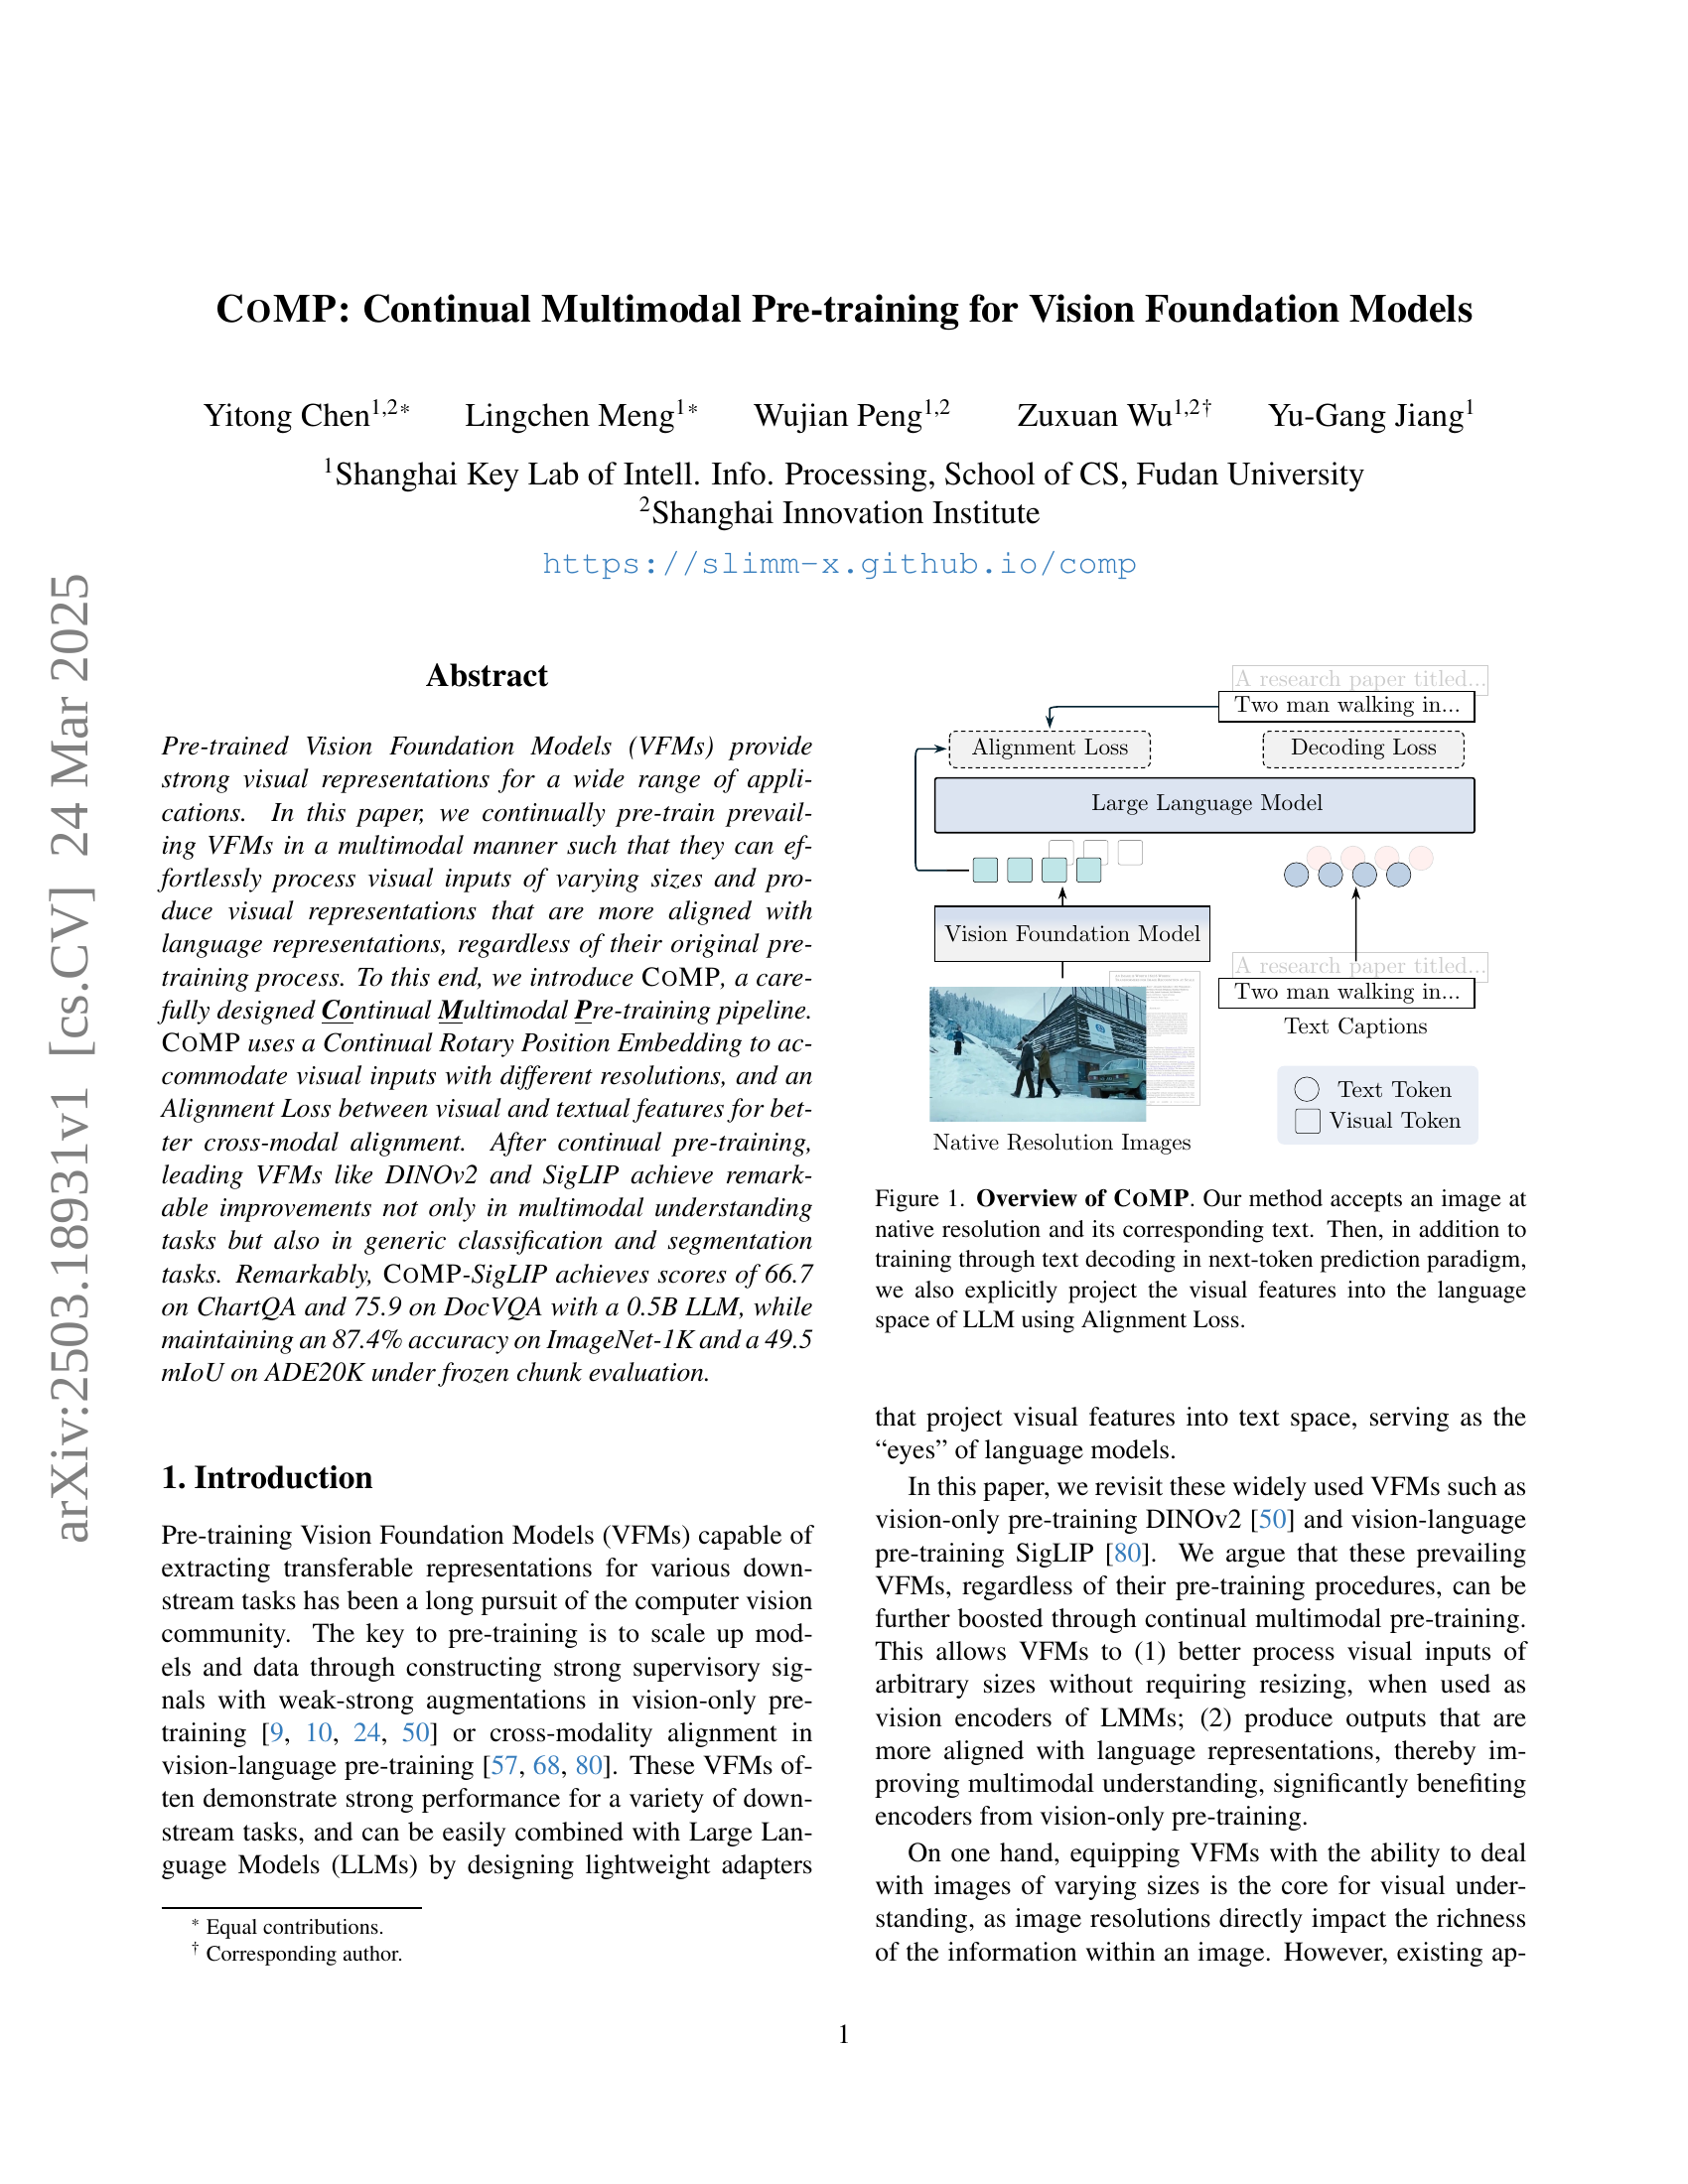
🔼 The figure illustrates the CoMP (Continual Multimodal Pre-training) framework. CoMP takes an image at its original resolution and its corresponding text as input. It then performs training in two ways: 1) standard next-token prediction using text decoding, and 2) explicitly projects the visual features into the language space of a large language model (LLM) via an Alignment Loss. This dual-training approach aims to better align visual and textual representations, improving the model’s performance on various tasks.
read the caption
Figure 1: Overview of CoMP. Our method accepts an image at native resolution and its corresponding text. Then, in addition to training through text decoding in next-token prediction paradigm, we also explicitly project the visual features into the language space of LLM using Alignment Loss.
| Model | #PT | #IT | Text-rich and Fine-grained | General and Real-world | |||||||
| ChartQA | DocVQA† | AI2D | Inst-IT | VQAv2 | GQA | MMMU† | MMBench† | RWQA | |||
| 1B models | |||||||||||
| Deepseek-VL [45] | 3.75M | N/A | - | - | 51.5 | - | - | - | 32.2 | - | - |
| LLaVA-OV (SI) [32] | 4.6M | 3.2M | 61.0 | 75.0 | 54.2 | 44.2 | - | - | 31.2 | 43.8 | 53.7 |
| LLaVA-OV [32] | 4.6M | 4.8M | 61.4 | 73.7 | 57.1 | 47.8 | - | - | 31.4 | 52.1 | 55.6 |
| CoMP-MM | 4.6M | 3.2M | 66.7 | 75.9 | 61.9 | 50.1 | 78.2 | 60.4 | 33.0 | 56.4 | 58.3 |
| 7B models | |||||||||||
| LLaVA-1.5 [40] | 558K | 665K | 18.2 | 28.1 | - | 32.1 | 78.5 | 62.0 | 35.3 | - | - |
| LLaVA-NeXT [43] | 558K | 765K | 54.8 | 74.4 | - | 42.4 | 81.8 | 64.2 | 35.1 | - | - |
| Deepseek-VL [45] | 3.75M | N/A | - | - | 65.3 | - | - | - | 36.6 | - | - |
| Cambrian-1 [65] | 1.2M | 7.0M | 73.3 | 77.8 | 73.0 | - | - | 64.6 | 42.7 | - | 64.2 |
| LLaVA-OV (SI) [32] | 4.6M | 3.2M | 78.8 | 89.3 | 81.6 | 61.8 | - | - | 47.3 | 81.7 | 65.5 |
| LLaVA-OV [32] | 4.6M | 4.8M | 80.0 | 90.2 | 81.4 | 71.7 | - | - | 48.8 | 80.8 | 66.3 |
| CoMP-MM | 4.6M | 3.2M | 79.6 | 91.0 | 81.4 | 65.0 | 81.9 | 65.9 | 48.9 | 81.4 | 66.4 |
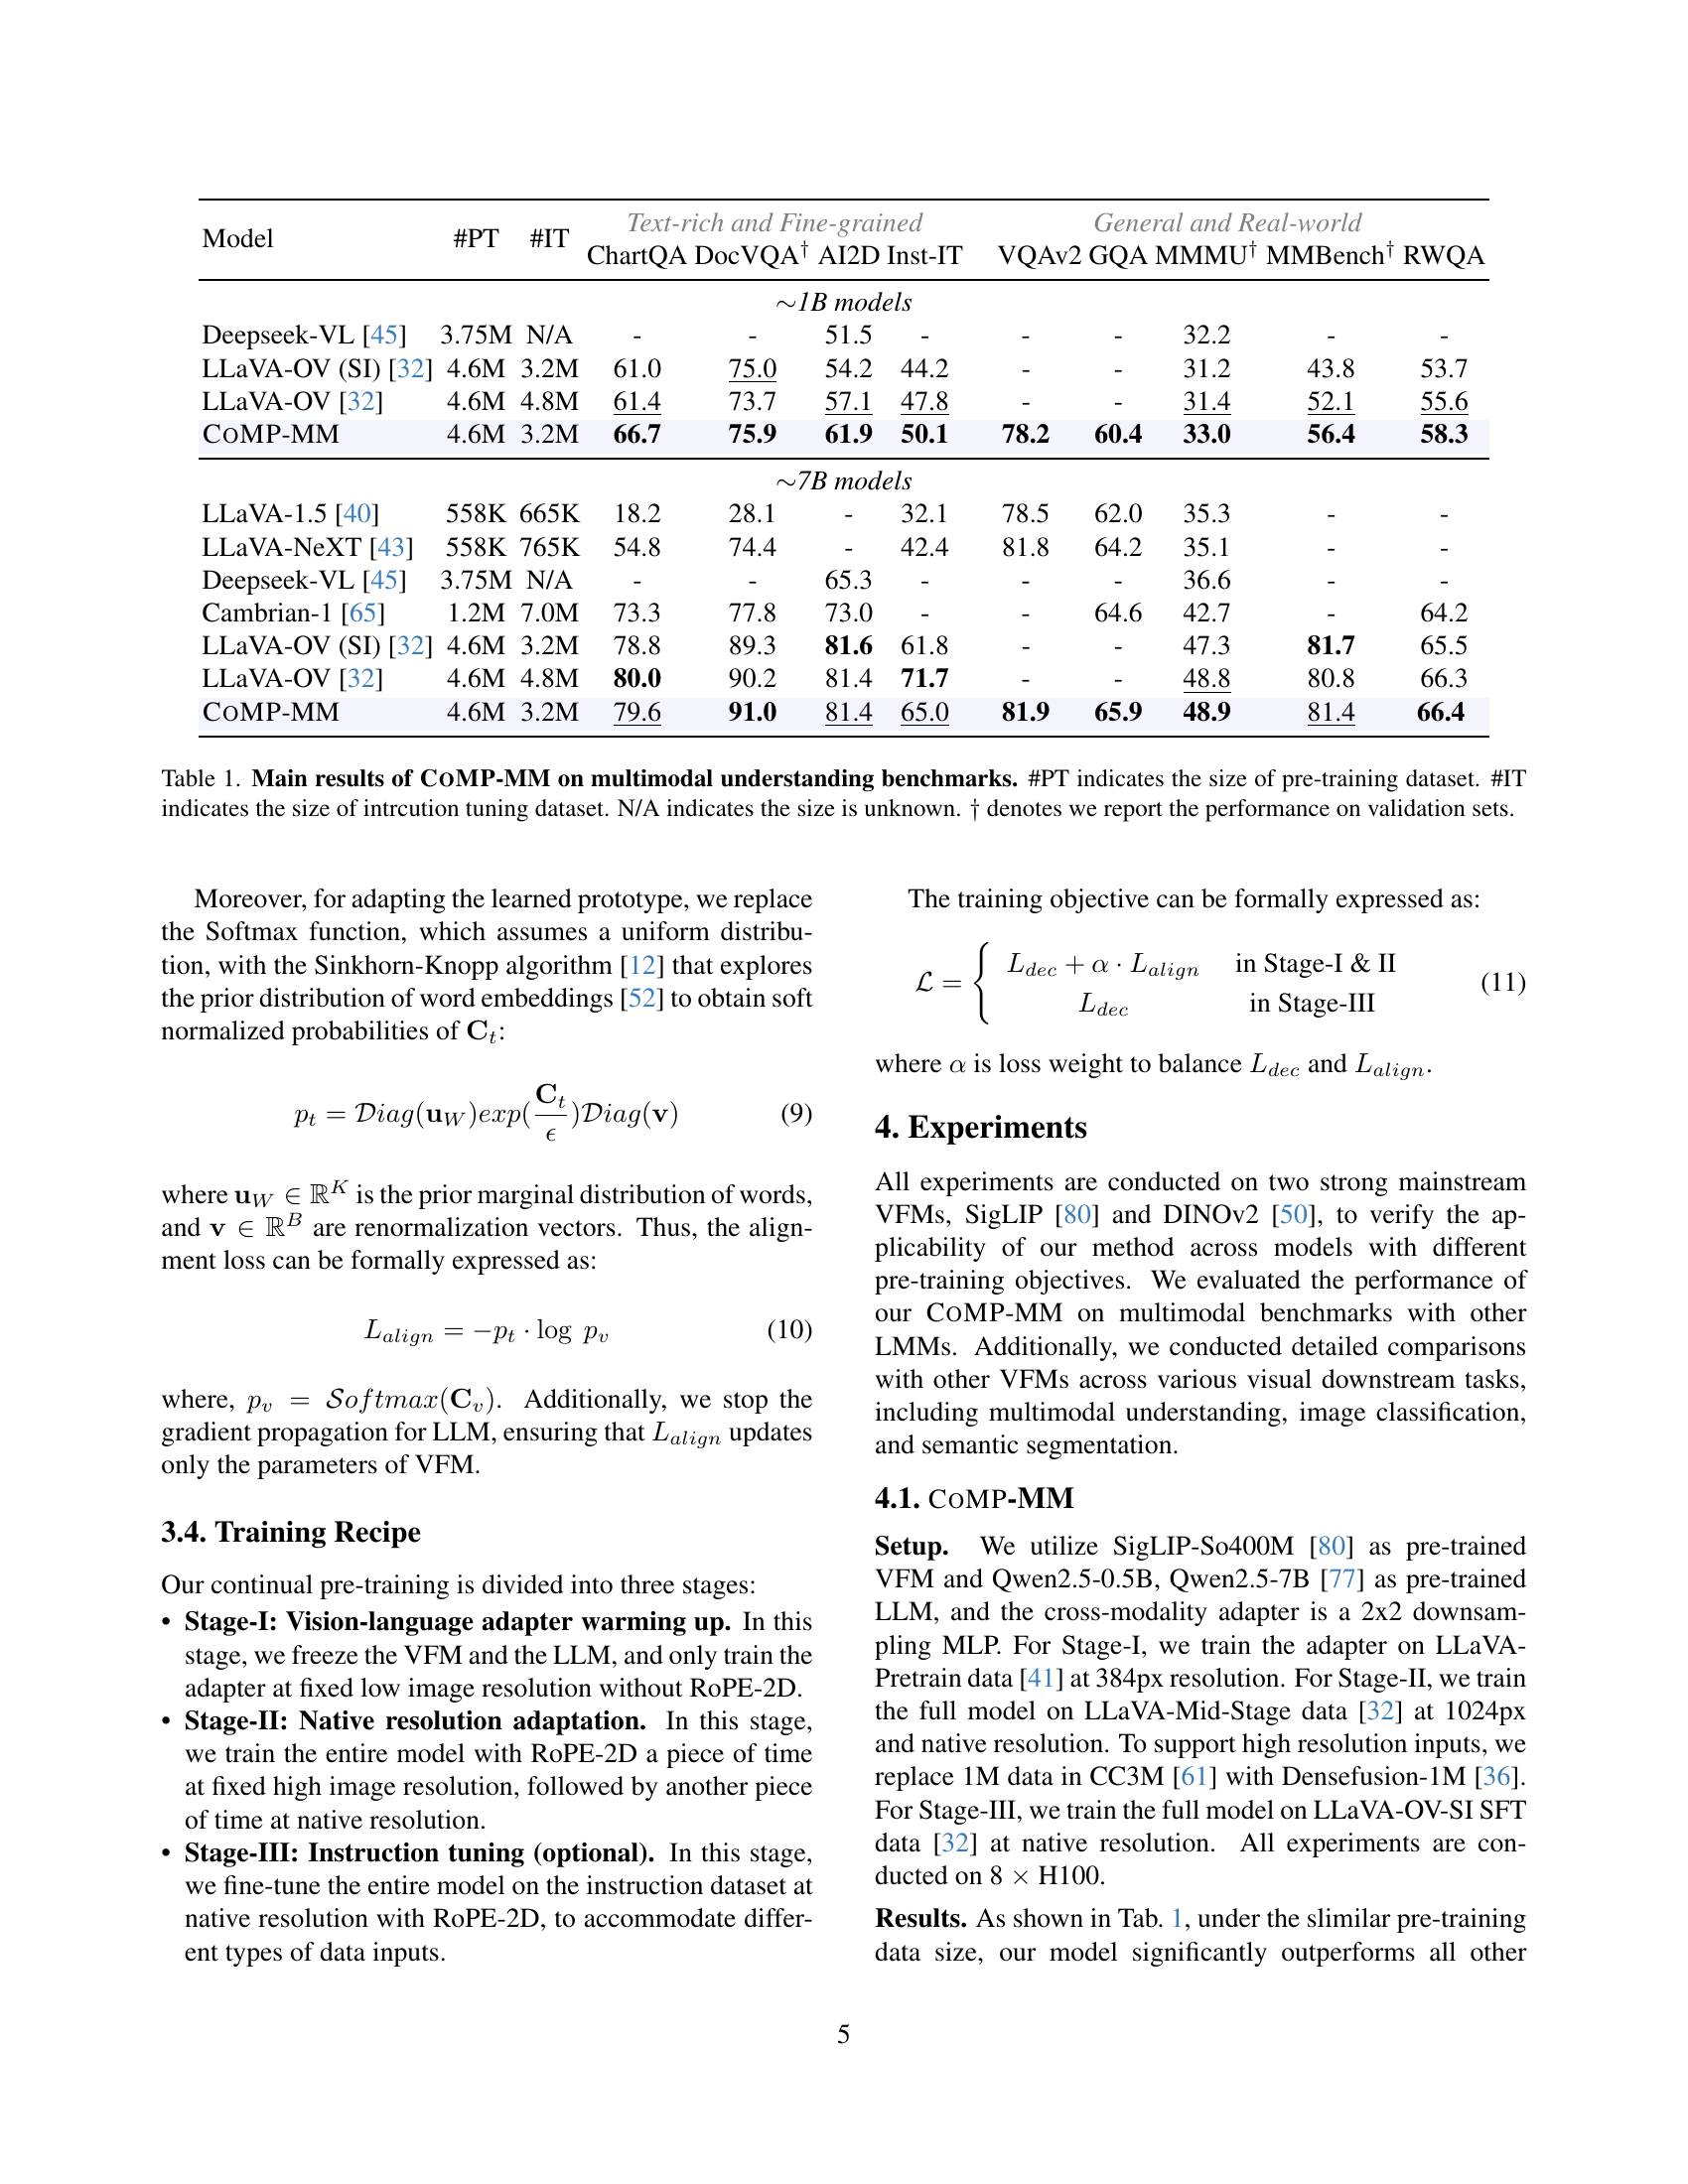
🔼 This table presents the performance of the COMP-MM model on various multimodal understanding benchmarks. It compares the performance of COMP-MM against other state-of-the-art models, focusing on metrics for both text-rich and fine-grained tasks as well as general and real-world scenarios. The table shows the size of the pre-training (#PT) and instruction tuning (#IT) datasets used for each model. Note that results for some datasets are reported on validation sets (indicated by †).
read the caption
Table 1: Main results of CoMP-MM on multimodal understanding benchmarks. #PT indicates the size of pre-training dataset. #IT indicates the size of intrcution tuning dataset. N/A indicates the size is unknown. ††\dagger† denotes we report the performance on validation sets.
In-depth insights#
Continual VFM#
Continual Vision Foundation Models (VFMs) represent a paradigm shift in how we develop and deploy visual AI systems. Unlike traditional, static VFMs, continual VFMs are designed to adapt and improve over time as they encounter new data and tasks. This addresses a key limitation of standard VFMs, which can suffer from performance degradation when faced with distribution shifts or novel scenarios. The core idea involves a continuous learning loop, where the model is iteratively updated with new information without catastrophically forgetting previously learned knowledge. This requires sophisticated techniques such as regularization strategies, memory replay, and architectural adaptations to maintain stability and plasticity. The ability to handle varying input resolutions and modalities also becomes crucial for real-world deployment. Continual VFMs pave the way for more robust, adaptable, and generalizable visual AI systems capable of thriving in dynamic environments.
C-ROPE Adaption#
C-ROPE (Continual Rotary Position Embedding) adaption addresses a core challenge in vision foundation models (VFMs): handling varying input resolutions. Existing methods often resize images, losing crucial details. C-ROPE innovatively integrates relative (RoPE-2D) and absolute positional embeddings. It leverages pre-trained knowledge and ensures smooth transition from pre-trained ViT models to arbitrary resolutions. This is achieved by interpolating the original positional embeddings. The main point is that visual transformers handle images with varying resolutions. This is crucial for improving detail understanding.
Aligning VFMs#
Aligning Vision Foundation Models (VFMs) is a crucial aspect for enhancing multimodal understanding. The goal is to bridge the gap between VFMs and Large Language Models (LLMs), enabling seamless integration and improved performance. This alignment addresses inconsistencies arising from distinct training objectives and data modalities. Effective alignment enables LLMs to better interpret visual inputs, requiring projecting VFM embeddings into the textual space of LLMs. Current approaches are insufficient, often relying solely on text-based supervision, which doesn’t fully capture visual nuances. Explicit alignment strategies, such as cross-entropy loss between visual and textual features, are essential for better feature space mapping. Successfully aligned VFMs improve performance in multimodal tasks and also enhance generic classification and segmentation.
COMP-MM Results#
Analyzing potential ‘COMP-MM Results,’ one anticipates significant performance gains in multimodal tasks. COMP-MM likely enhances existing Vision Foundation Models through continual multimodal pre-training. Results would demonstrate improved performance on benchmarks like ChartQA and DocVQA, validating the approach. A key aspect would be native resolution support, enabling better handling of fine-grained details in high-resolution inputs. The results may show remarkable performance compared to existing models on multimodal understanding.
Ablation Insights#
Ablation studies offer vital insights into the effectiveness of individual components within a complex system like COMP. By selectively removing or modifying parts like C-ROPE or the Alignment Loss, we can discern their specific contributions. For instance, ablating C-ROPE would reveal its impact on handling variable resolution inputs, while removing the Alignment Loss would highlight its role in bridging the representation gap between visual and language models. Analyzing the resulting performance changes helps to validate design choices and pinpoint areas for further improvement. Performance drops upon removal signify a component’s importance, while minimal changes suggest redundancy or the need for optimization. These insights guide future research by focusing efforts on the most impactful aspects of the architecture. Furthermore, ablations can uncover unexpected interactions between components, leading to a deeper understanding of the system as a whole. The insights gained from ablation studies are crucial for refining and optimizing the COMP architecture, leading to more efficient and effective multimodal pre-training. This meticulous approach ensures that each element contributes meaningfully to the overall performance.
More visual insights#
More on figures

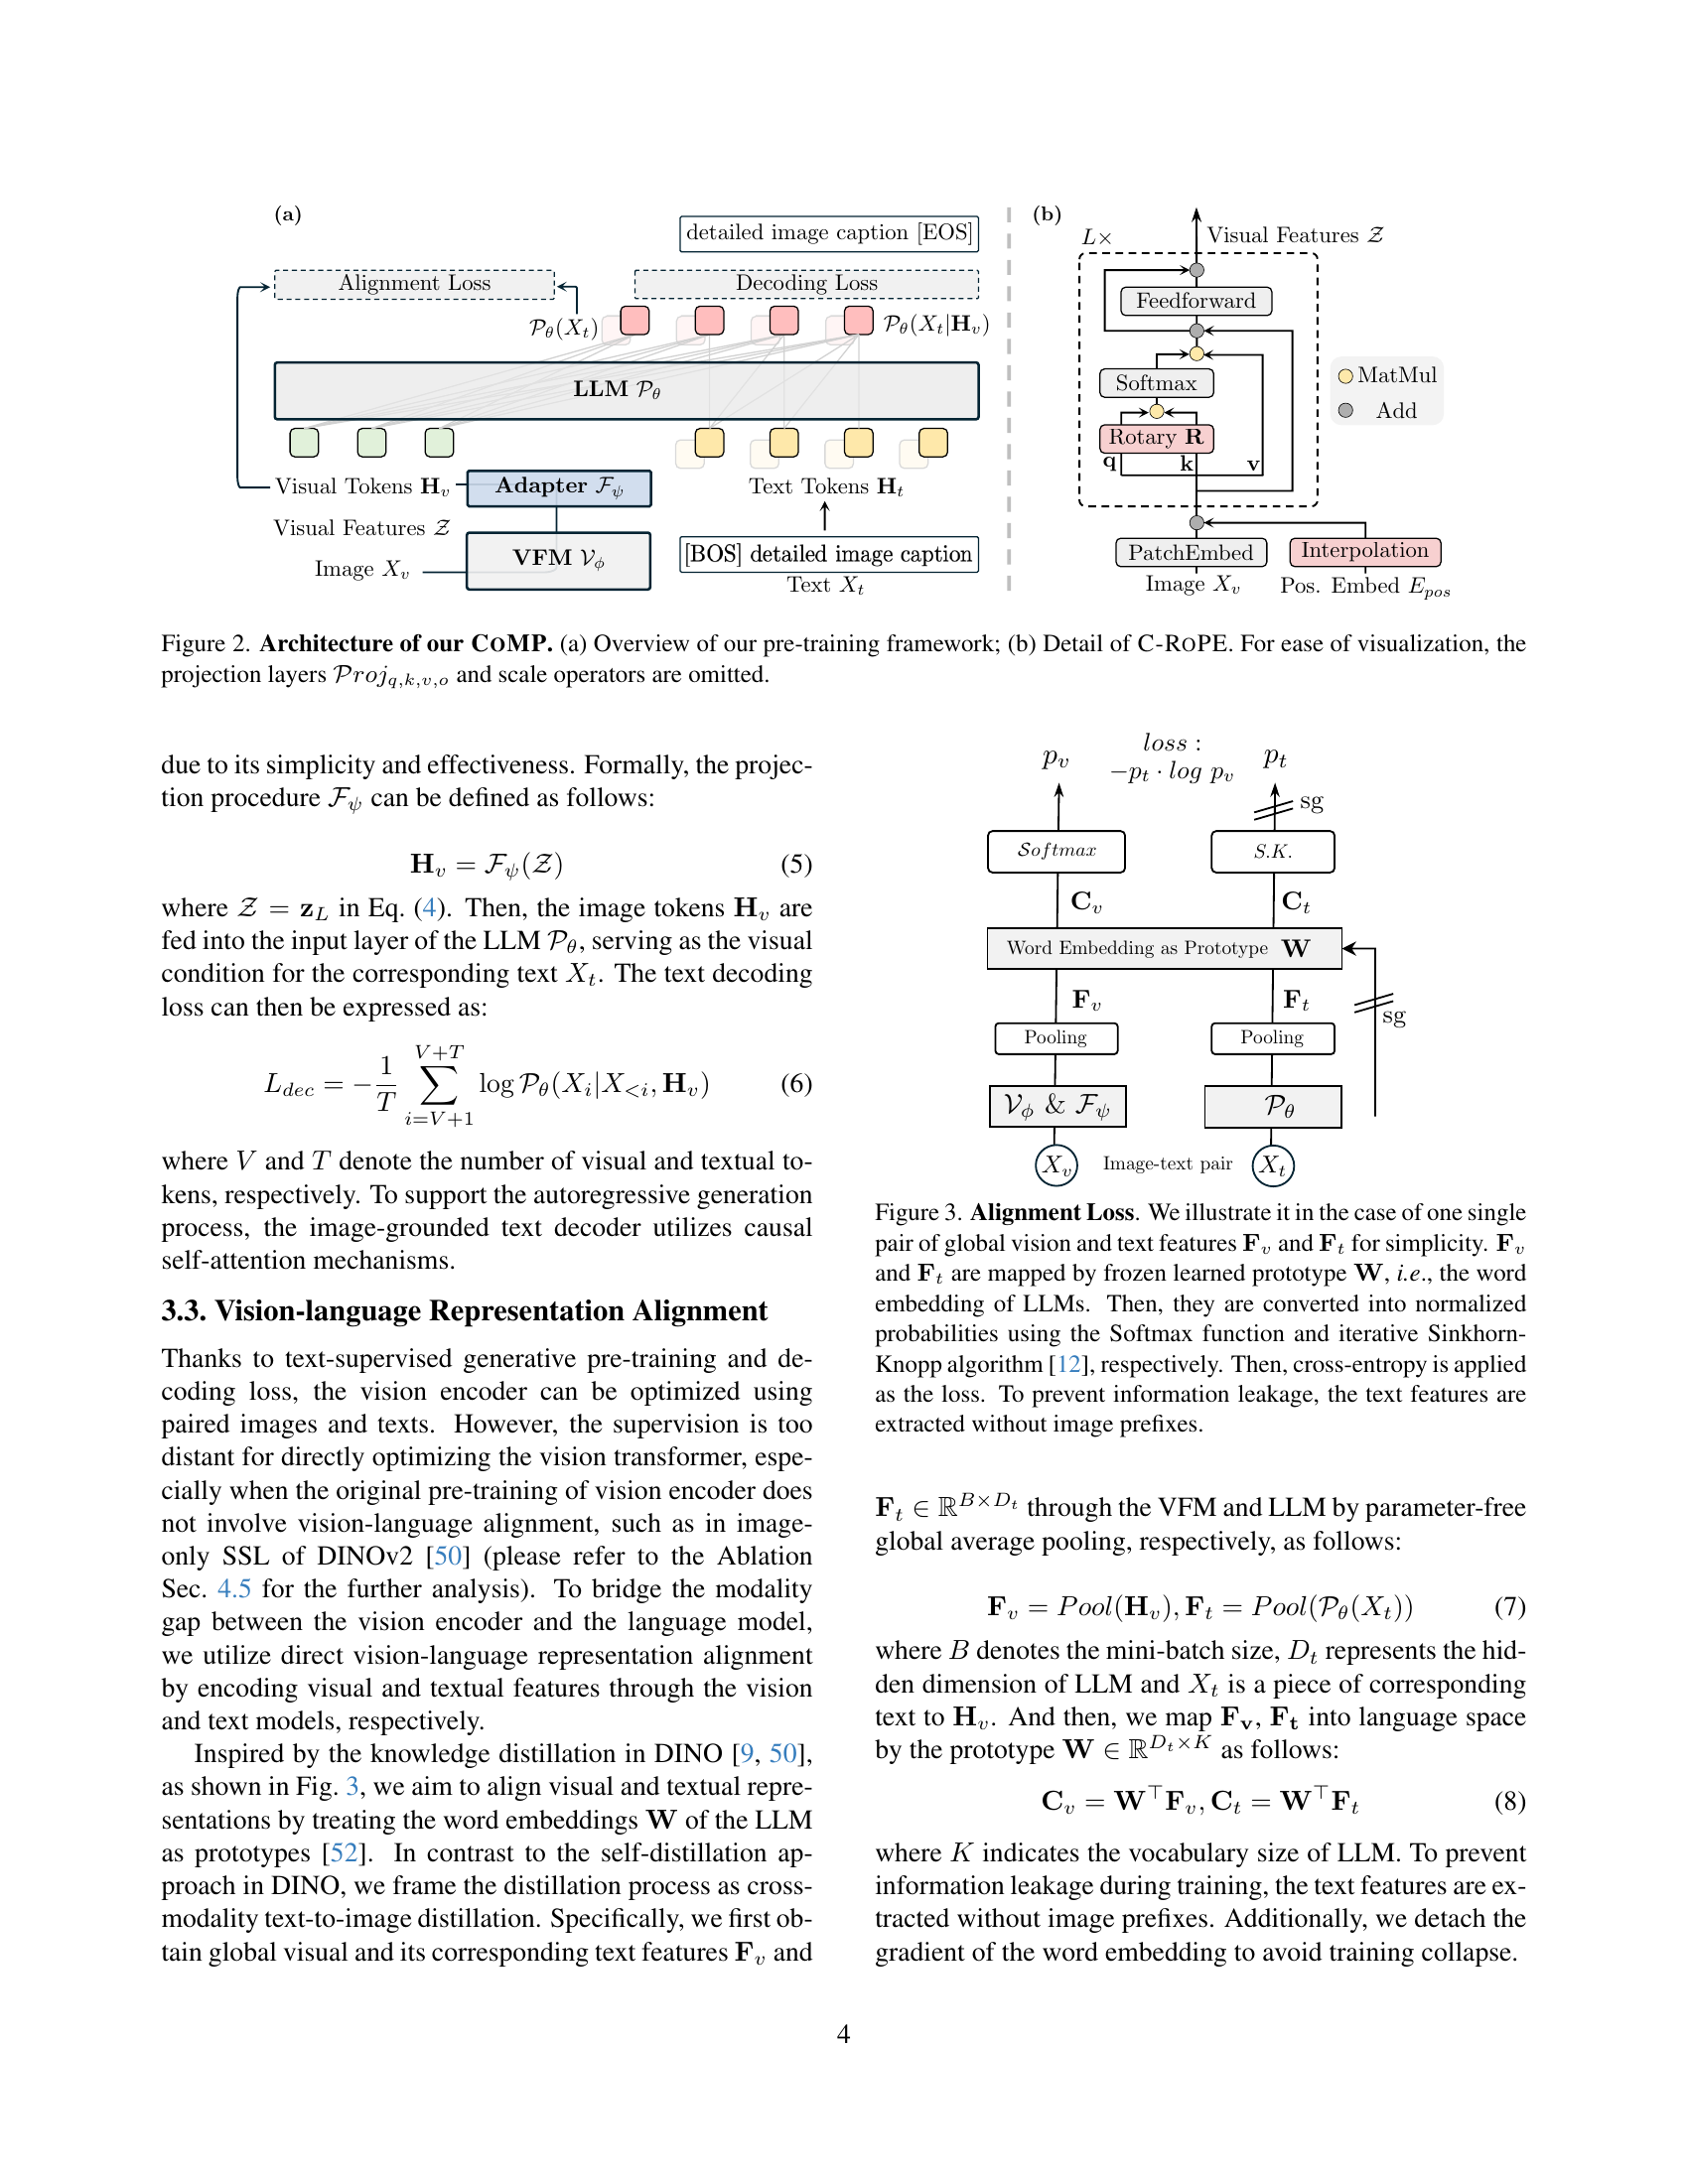
🔼 Figure 2 illustrates the architecture of the COMP (Continual Multimodal Pre-training) framework. Panel (a) provides a high-level overview of the entire pre-training pipeline, showcasing the integration of a Vision Foundation Model (VFM), a Large Language Model (LLM), and a newly proposed continual multimodal pre-training process. It highlights the two key loss functions: the decoding loss for text generation and the alignment loss for aligning visual and textual representations. Panel (b) focuses specifically on the Continual Rotary Position Embedding (C-ROPE) module, detailing how it handles variable-resolution visual inputs. For clarity, minor components like projection and scaling operations are omitted in the diagram.
read the caption
Figure 2: Architecture of our CoMP. (a) Overview of our pre-training framework; (b) Detail of C-RoPE. For ease of visualization, the projection layers 𝒫rojq,k,v,o𝒫𝑟𝑜subscript𝑗𝑞𝑘𝑣𝑜\mathcal{P}roj_{q,k,v,o}caligraphic_P italic_r italic_o italic_j start_POSTSUBSCRIPT italic_q , italic_k , italic_v , italic_o end_POSTSUBSCRIPT and scale operators are omitted.
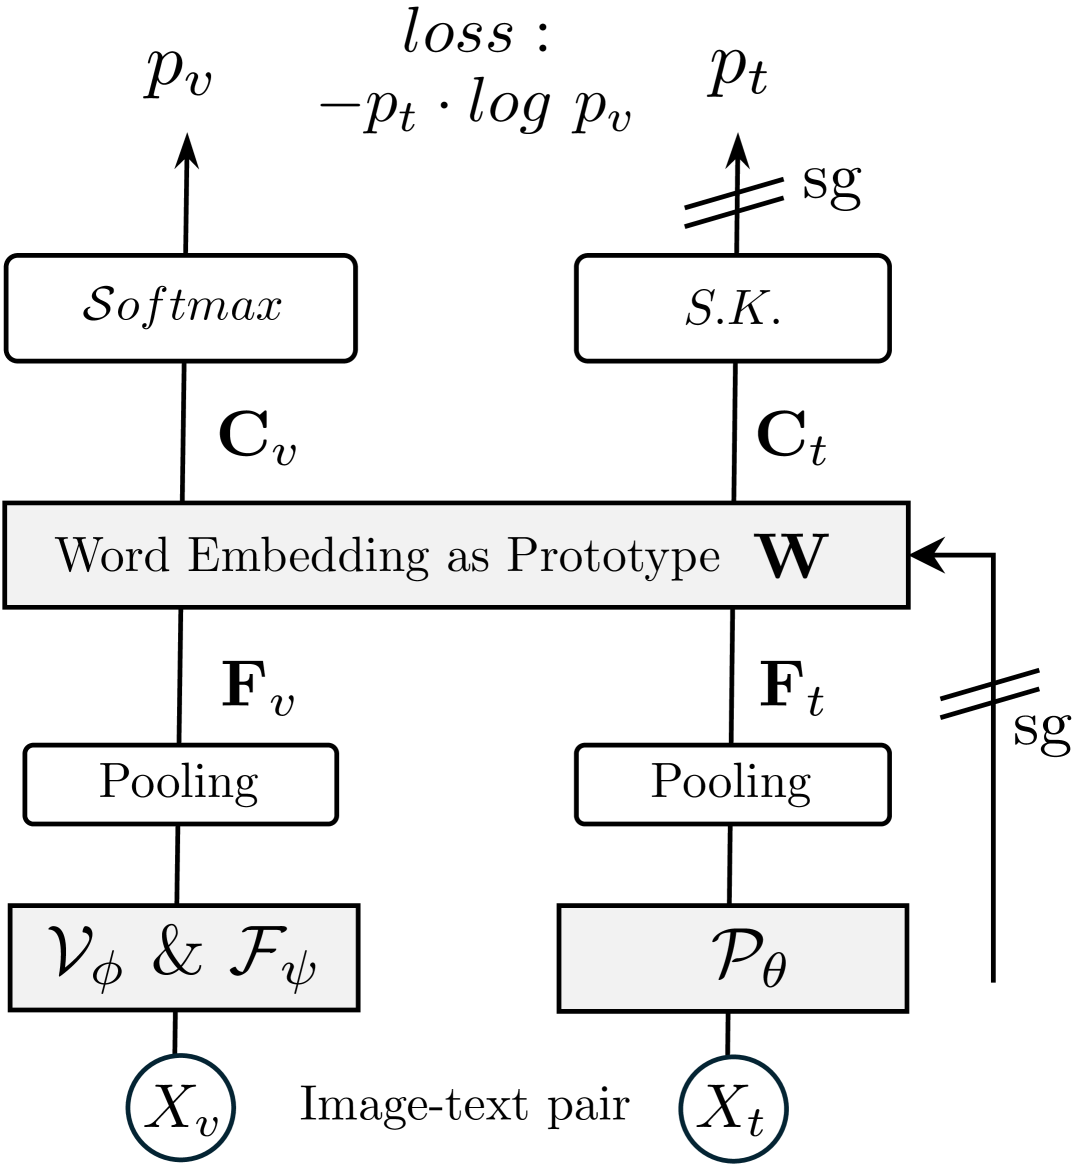
🔼 The Alignment Loss in the figure is calculated using global visual features (Fv) and text features (Ft). These features are projected into the language space using a learned prototype (W), which is the word embedding of Large Language Models (LLMs). The Sinkhorn-Knopp algorithm normalizes the projected features into probability distributions, and then cross-entropy is used to compute the loss, encouraging alignment between visual and textual representations. To avoid information leakage from the image, text features are extracted without the image prefix.
read the caption
Figure 3: Alignment Loss. We illustrate it in the case of one single pair of global vision and text features 𝐅vsubscript𝐅𝑣\mathbf{F}_{v}bold_F start_POSTSUBSCRIPT italic_v end_POSTSUBSCRIPT and 𝐅tsubscript𝐅𝑡\mathbf{F}_{t}bold_F start_POSTSUBSCRIPT italic_t end_POSTSUBSCRIPT for simplicity. 𝐅vsubscript𝐅𝑣\mathbf{F}_{v}bold_F start_POSTSUBSCRIPT italic_v end_POSTSUBSCRIPT and 𝐅tsubscript𝐅𝑡\mathbf{F}_{t}bold_F start_POSTSUBSCRIPT italic_t end_POSTSUBSCRIPT are mapped by frozen learned prototype 𝐖𝐖\mathbf{W}bold_W, i.e., the word embedding of LLMs. Then, they are converted into normalized probabilities using the Softmax function and iterative Sinkhorn-Knopp algorithm [12], respectively. Then, cross-entropy is applied as the loss. To prevent information leakage, the text features are extracted without image prefixes.

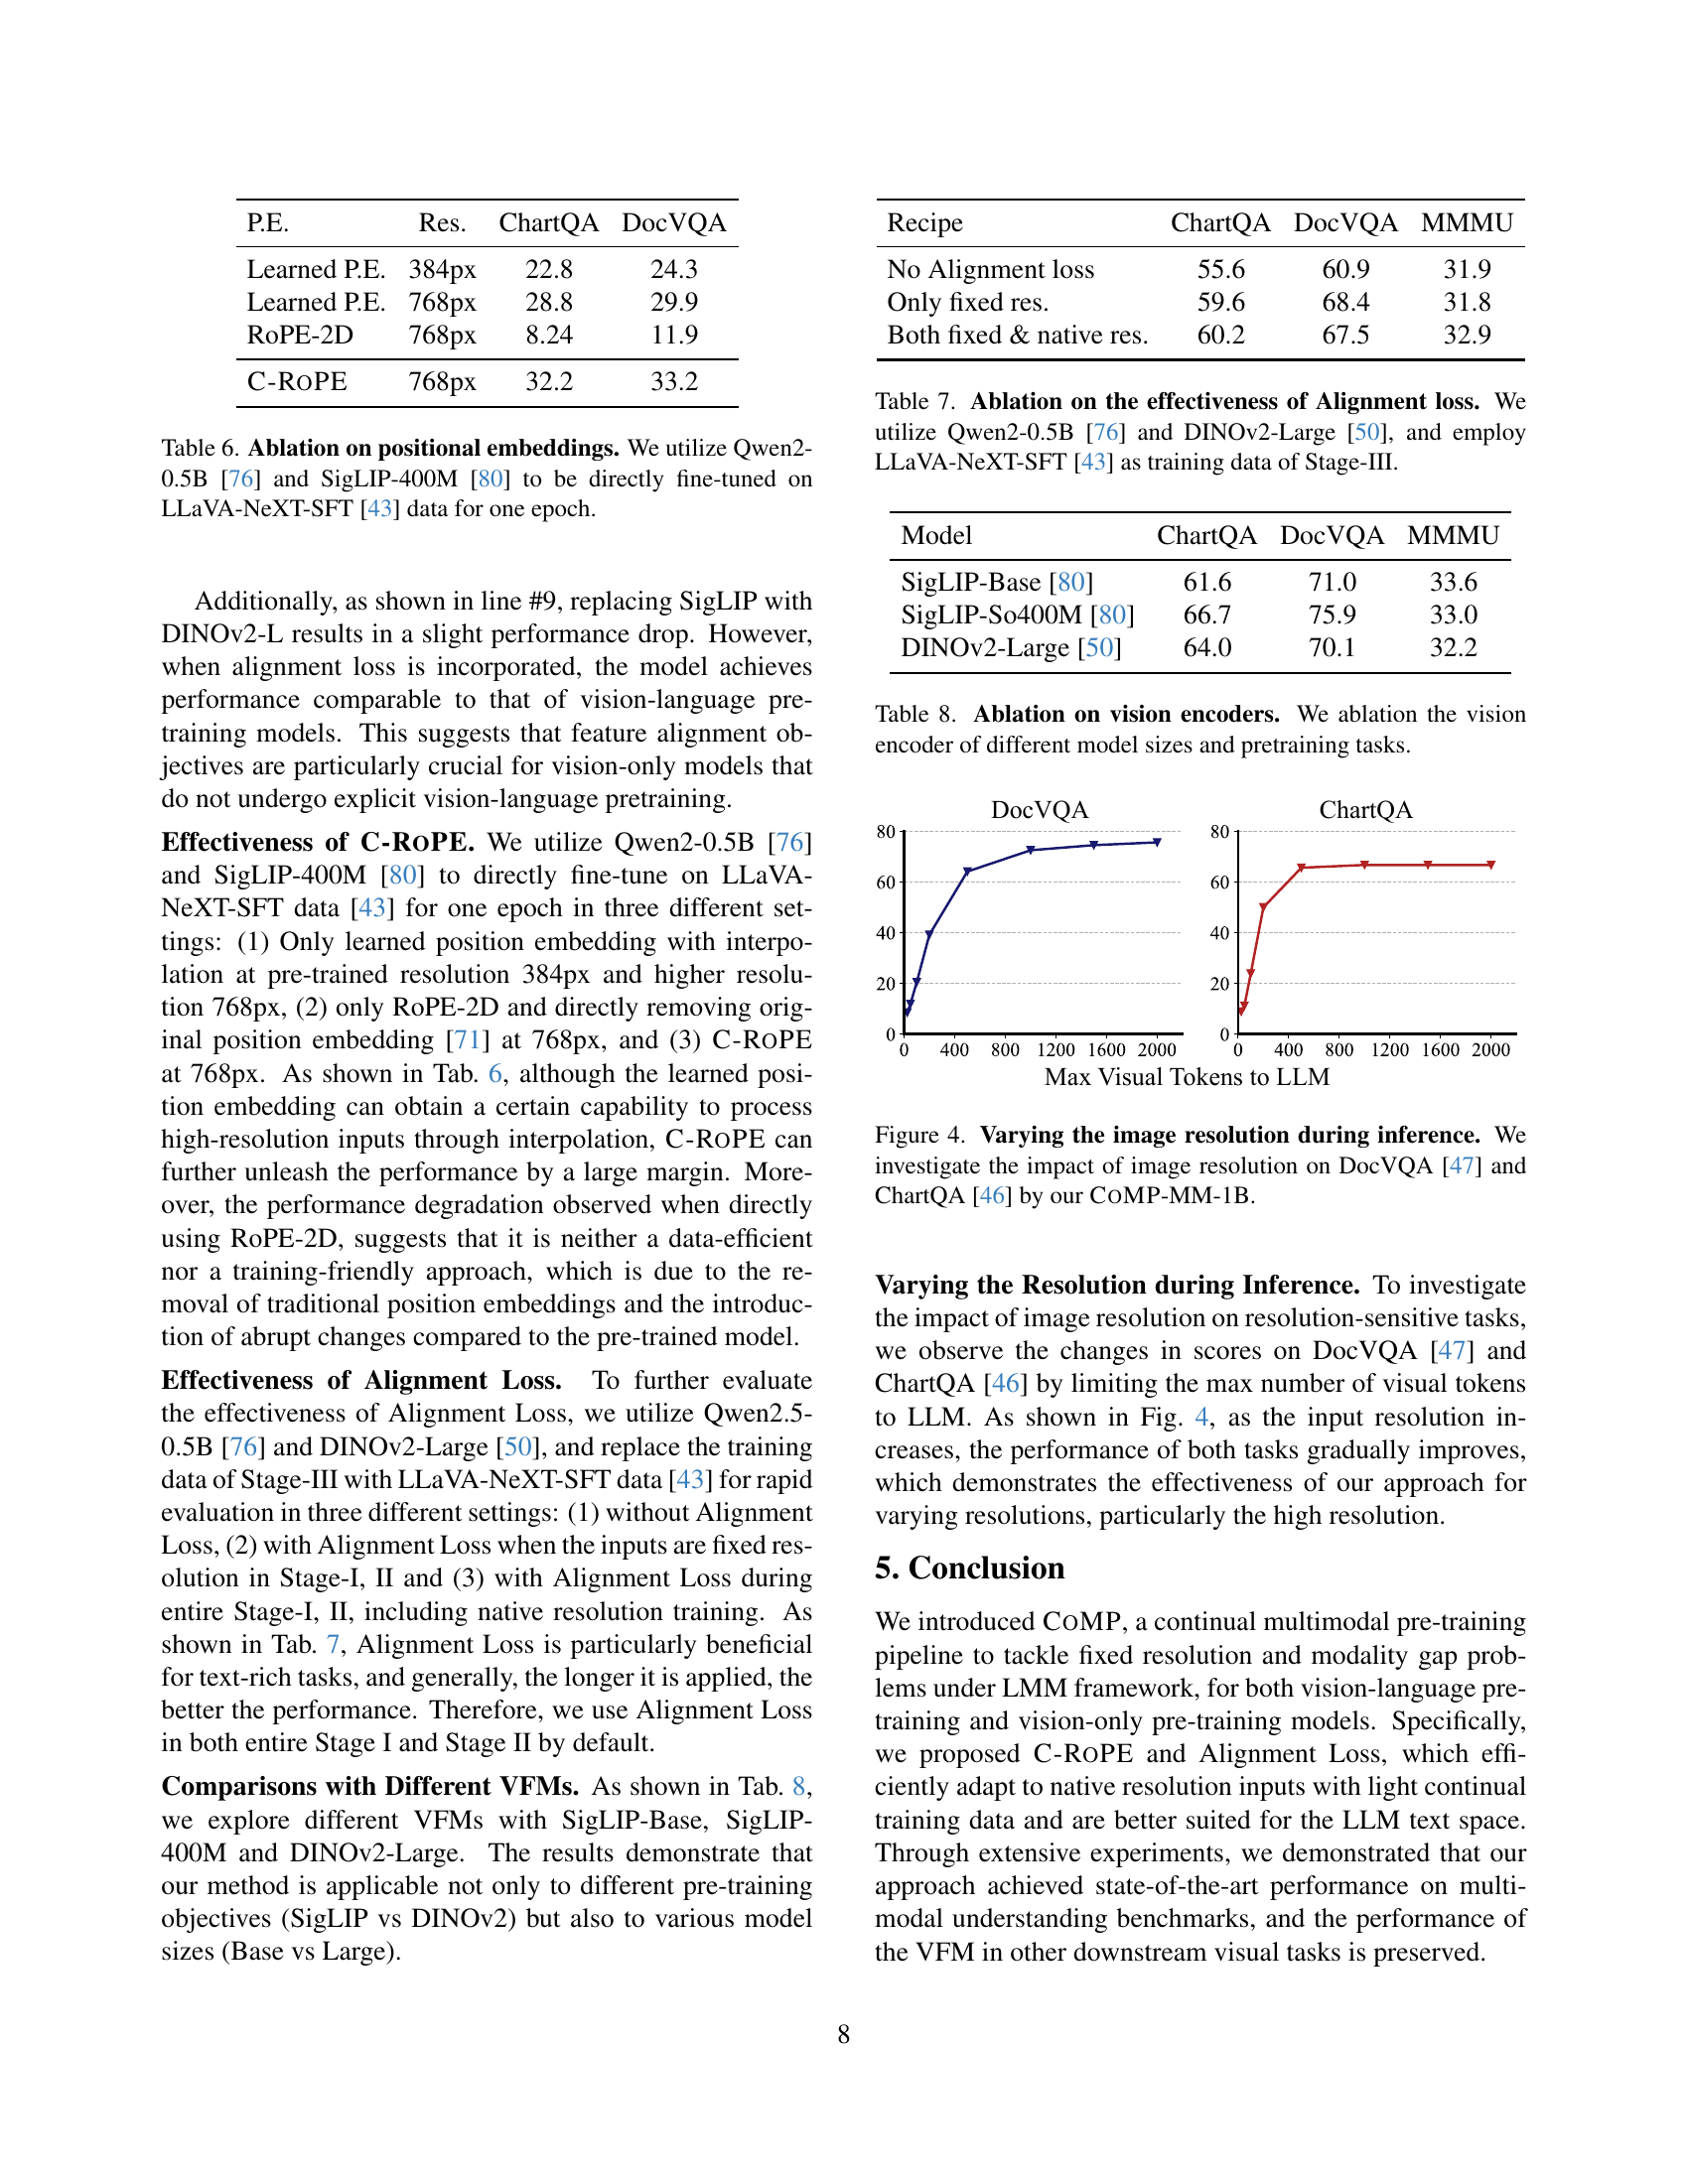
🔼 This figure analyzes how varying image resolution at inference time affects the performance of the CoMP-MM-1B model on two specific downstream tasks: DocVQA [47] and ChartQA [46]. DocVQA focuses on question answering about document images, while ChartQA involves understanding chart-related queries. Both tasks are sensitive to image resolution. The graph shows that increased resolution leads to improved accuracy. This demonstrates CoMP-MM-1B’s ability to handle high-resolution inputs effectively.
read the caption
Figure 4: Varying the image resolution during inference. We investigate the impact of image resolution on DocVQA [47] and ChartQA [46] by our CoMP-MM-1B.
More on tables
| Model | ViT | #Patches | OKVQA† | TextVQA† | DocVQA | InfoVQA | ChartQA | SEED | MME |
| DINOv2 [50] | L/14 | 576 | 54.1 | 13.4 | 7.3 | 21.3 | 10.8 | 57.0 | 1345 |
| DINOv2 [50] | G/14 | 3034 | 56.9 | 15.1 | 8.2 | 19.7 | 12.0 | 68.9 | 1423 |
| CLIP [57] | L/14 | 576 | 60.0 | 47.5 | 25.6 | 21.8 | 19.2 | 70.1 | 1481 |
| SigLIP [80] | L/14 | 576 | 59.3 | 44.1 | 16.9 | 20.7 | 14.4 | 66.8 | 1416 |
| SigLIP [80] | So/14 | 729 | 60.1 | 47.5 | 19.2 | 21.0 | 14.7 | 67.5 | 1433 |
| AIMv2 [20] | L/14 | 576 | 60.8 | 53.6 | 26.6 | 22.8 | 19.2 | 71.8 | 1472 |
| AIMv2 [20] | H/14 | 576 | 61.3 | 55.5 | 27.8 | 23.1 | 19.9 | 72.1 | 1545 |
| CoMP-DINOv2 | L/14 | 576 | 59.0 | 53.6 | 24.7 | 22.8 | 23.8 | 72.8 | 1484 |
| CoMP-SigLIP | So/14 | 576 | 61.0 | 62.5 | 34.0 | 26.0 | 25.0 | 74.3 | 1543 |
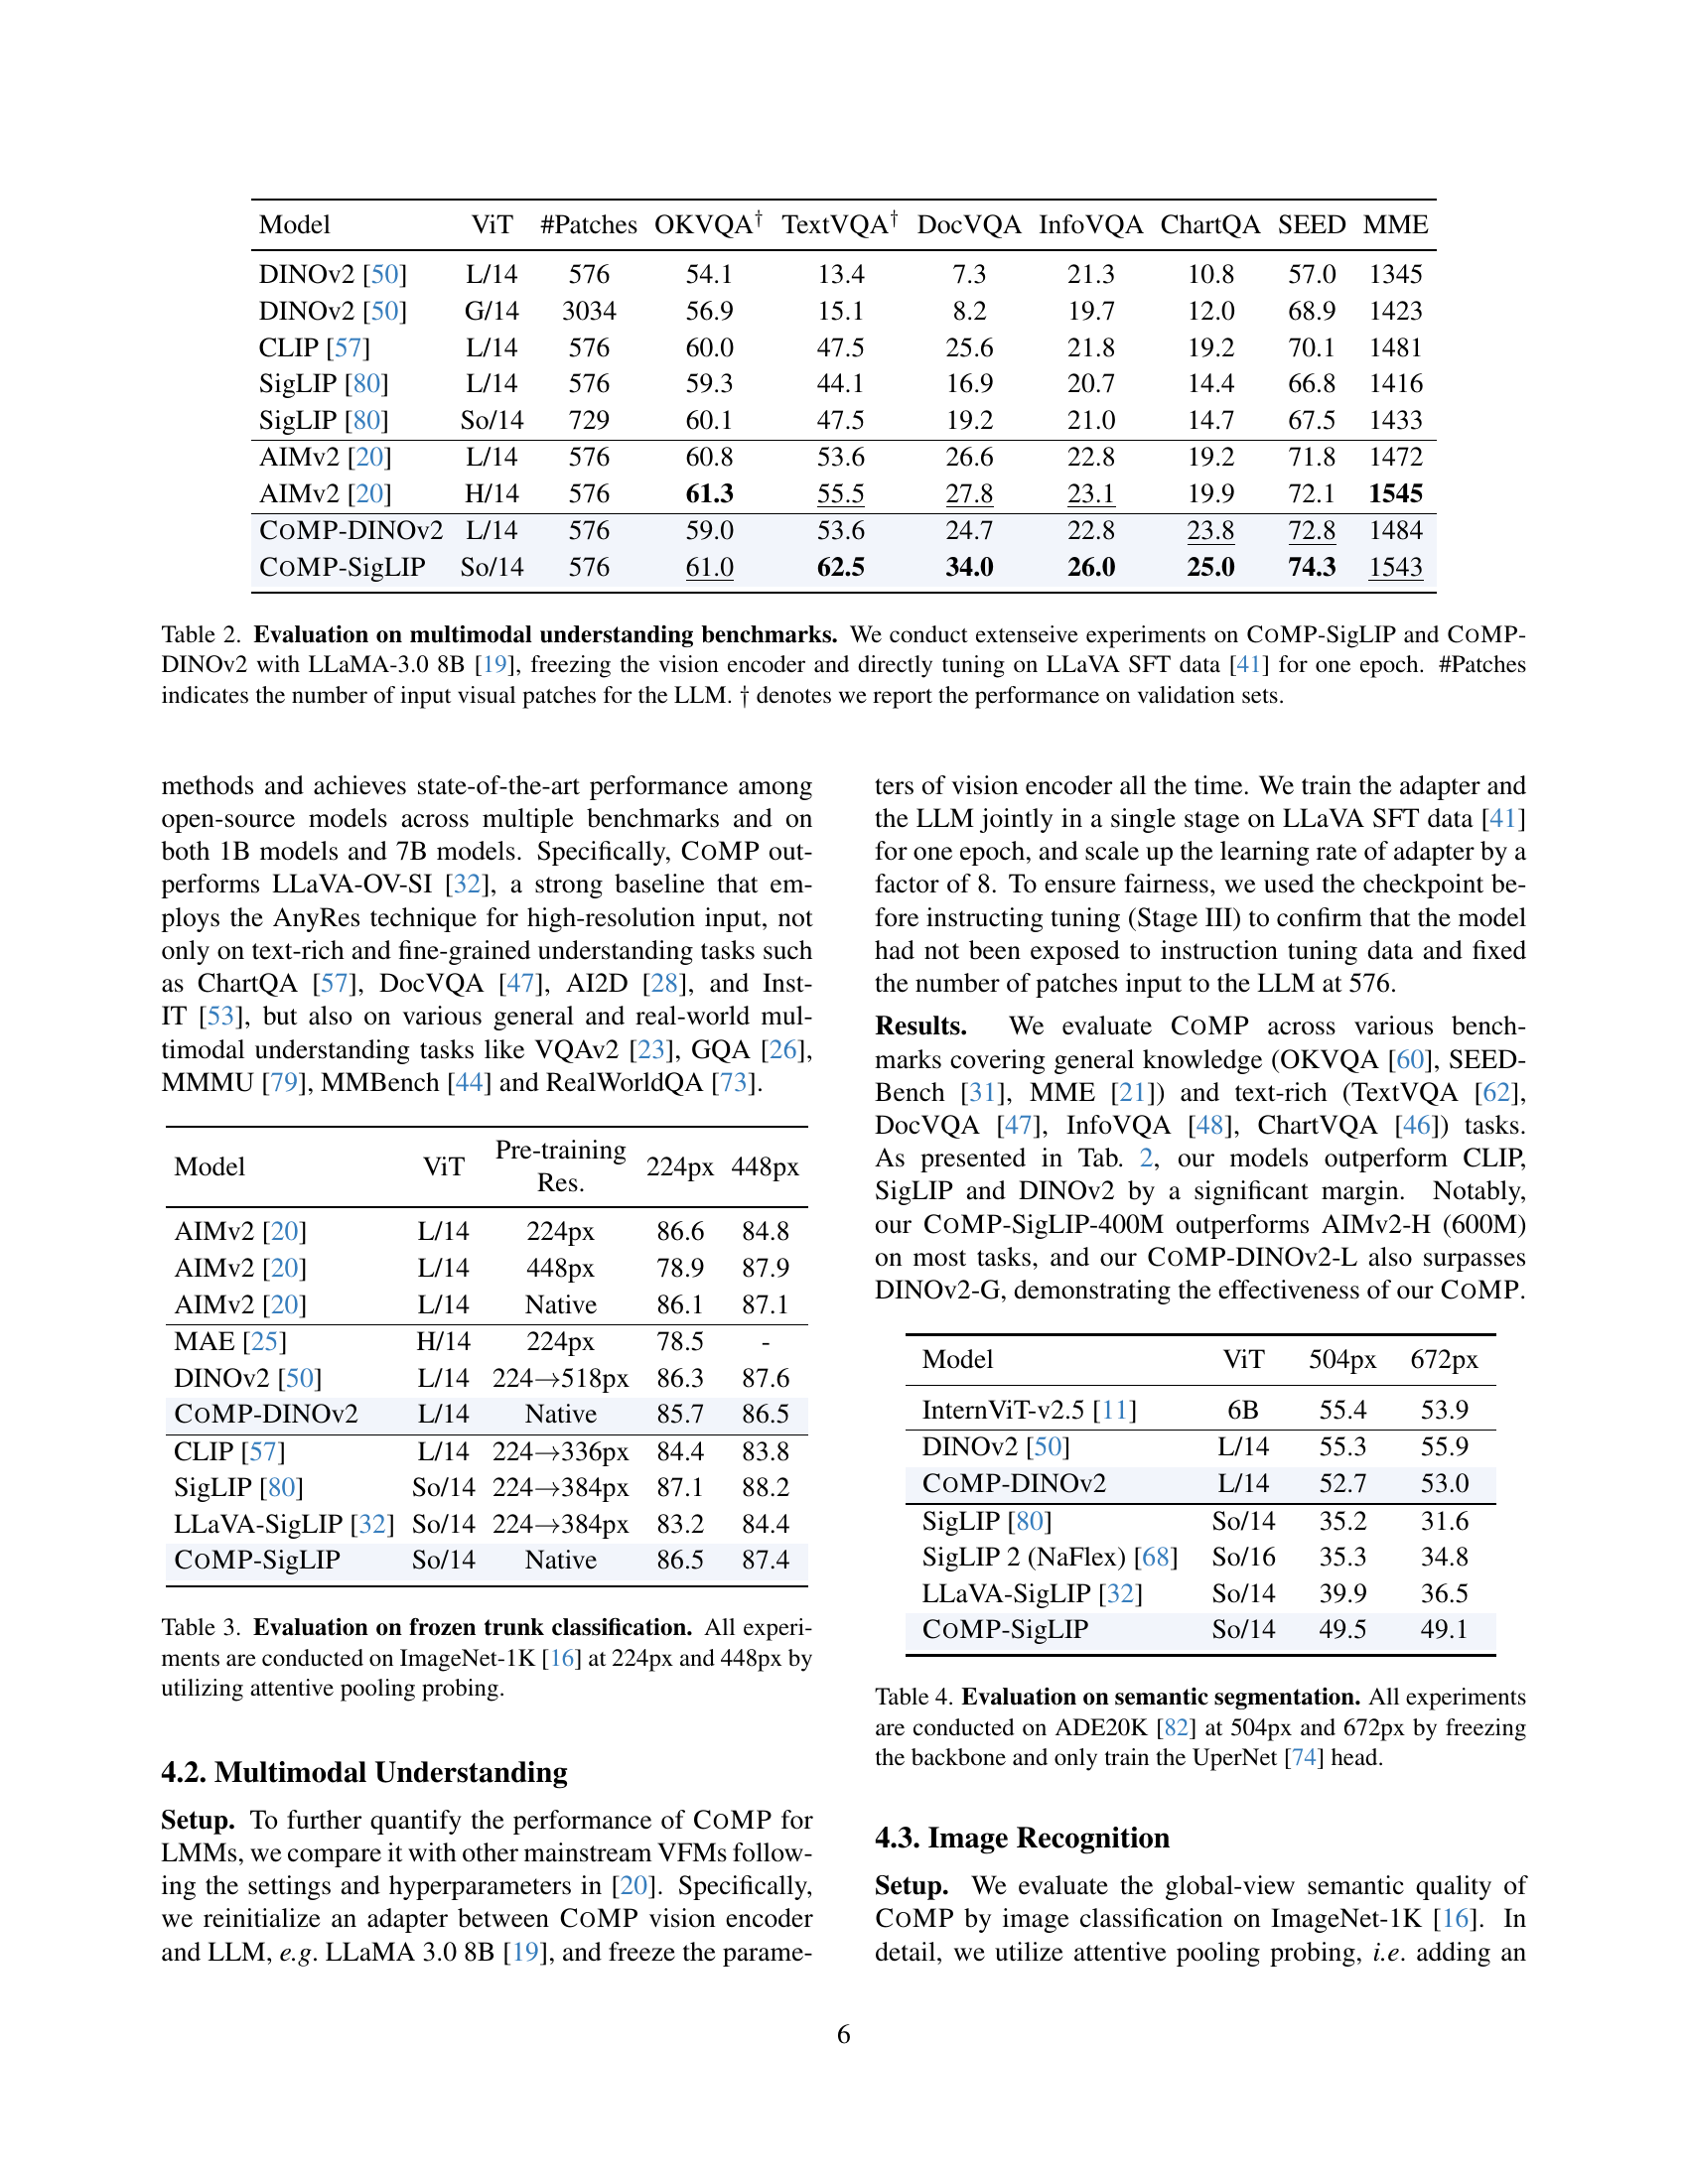
🔼 This table presents a comprehensive evaluation of the COMP (Continual Multimodal Pre-training) method on various multimodal understanding benchmarks. The experiments were performed using two different Vision Foundation Models (VFMs), CoMP-SigLIP and CoMP-DINOv2, in conjunction with the LLaMA-3.0 8B language model. The vision encoders were frozen, and only the language model was fine-tuned for a single epoch using the LLaVA SFT dataset. The table compares the performance of these models against other state-of-the-art approaches, highlighting the improvements achieved by COMP. The ‘#Patches’ column indicates the number of visual patches processed by the LLM, providing insight into the computational demands of each model. Performance is reported on both training and validation sets, as indicated by the † symbol.
read the caption
Table 2: Evaluation on multimodal understanding benchmarks. We conduct extenseive experiments on CoMP-SigLIP and CoMP-DINOv2 with LLaMA-3.0 8B [19], freezing the vision encoder and directly tuning on LLaVA SFT data [41] for one epoch. #Patches indicates the number of input visual patches for the LLM. ††\dagger† denotes we report the performance on validation sets.
| Model | ViT | Pre-training Res. | 224px | 448px |
| AIMv2 [20] | L/14 | 224px | 86.6 | 84.8 |
| AIMv2 [20] | L/14 | 448px | 78.9 | 87.9 |
| AIMv2 [20] | L/14 | Native | 86.1 | 87.1 |
| MAE [25] | H/14 | 224px | 78.5 | - |
| DINOv2 [50] | L/14 | 224518px | 86.3 | 87.6 |
| CoMP-DINOv2 | L/14 | Native | 85.7 | 86.5 |
| CLIP [57] | L/14 | 224336px | 84.4 | 83.8 |
| SigLIP [80] | So/14 | 224384px | 87.1 | 88.2 |
| LLaVA-SigLIP [32] | So/14 | 224384px | 83.2 | 84.4 |
| CoMP-SigLIP | So/14 | Native | 86.5 | 87.4 |
🔼 Table 3 presents the results of image classification experiments conducted on the ImageNet-1K dataset [16]. The experiments utilized a ‘frozen trunk’ approach, meaning that only the final classification layers were trained while the pre-trained weights of the Vision Foundation Model (VFM) were kept unchanged. The performance of several VFMs (including those enhanced by the COMP method) is compared. The classification accuracy is reported for two different input image resolutions: 224x224 pixels and 448x448 pixels. Attentive pooling probing was used as the classification method.
read the caption
Table 3: Evaluation on frozen trunk classification. All experiments are conducted on ImageNet-1K [16] at 224px and 448px by utilizing attentive pooling probing.
| Model | ViT | 504px | 672px |
| InternViT-v2.5 [11] | 6B | 55.4 | 53.9 |
| DINOv2 [50] | L/14 | 55.3 | 55.9 |
| CoMP-DINOv2 | L/14 | 52.7 | 53.0 |
| SigLIP [80] | So/14 | 35.2 | 31.6 |
| SigLIP 2 (NaFlex) [68] | So/16 | 35.3 | 34.8 |
| LLaVA-SigLIP [32] | So/14 | 39.9 | 36.5 |
| CoMP-SigLIP | So/14 | 49.5 | 49.1 |
🔼 Table 4 presents the results of semantic segmentation experiments conducted on the ADE20K dataset. The experiments involved training the UperNet head while keeping the backbone model frozen. Two different input resolutions (504px and 672px) were used for a comprehensive evaluation. The table compares the performance of various Vision Foundation Models (VFMs) on this task, highlighting the impact of different pre-training methods and model architectures on segmentation accuracy.
read the caption
Table 4: Evaluation on semantic segmentation. All experiments are conducted on ADE20K [82] at 504px and 672px by freezing the backbone and only train the UperNet [74] head.
| # | AI2D | ChartQA | DocVQA | ||
| 1 | Baseline Recipe | 50.2 | 29.9 | 24.1 | - |
| 2 | + RoPE-2D from Stage-I | 51.5 | 11.0 | 11.4 | 10.1 |
| 3 | + RoPE-2D from Stage-II | 55.4 | 56.9 | 61.6 | 23.2 |
| 4 | + Freezing LM in Stage-II | 54.6 | 55.4 | 55.3 | 2.87 |
| 5 | + Native Resolution Training | 56.7 | 59.5 | 67.7 | 3.33 |
| 6 | + Increase Resolution to 1024px in Stage-II | 56.2 | 59.9 | 68.8 | 0.33 |
| 7 | + Scale Up Training Data | 62.0 | 65.2 | 75.0 | 5.77 |
| 8 | + Alignment Loss | 61.9 | 66.7 | 75.9 | 0.77 |
| 9 | Replace with DINOv2-Large in #7 | 58.9 | 61.5 | 68.5 | - |
| 10 | + Alignment Loss | 59.6 | 64.0 | 70.1 | 1.60 |
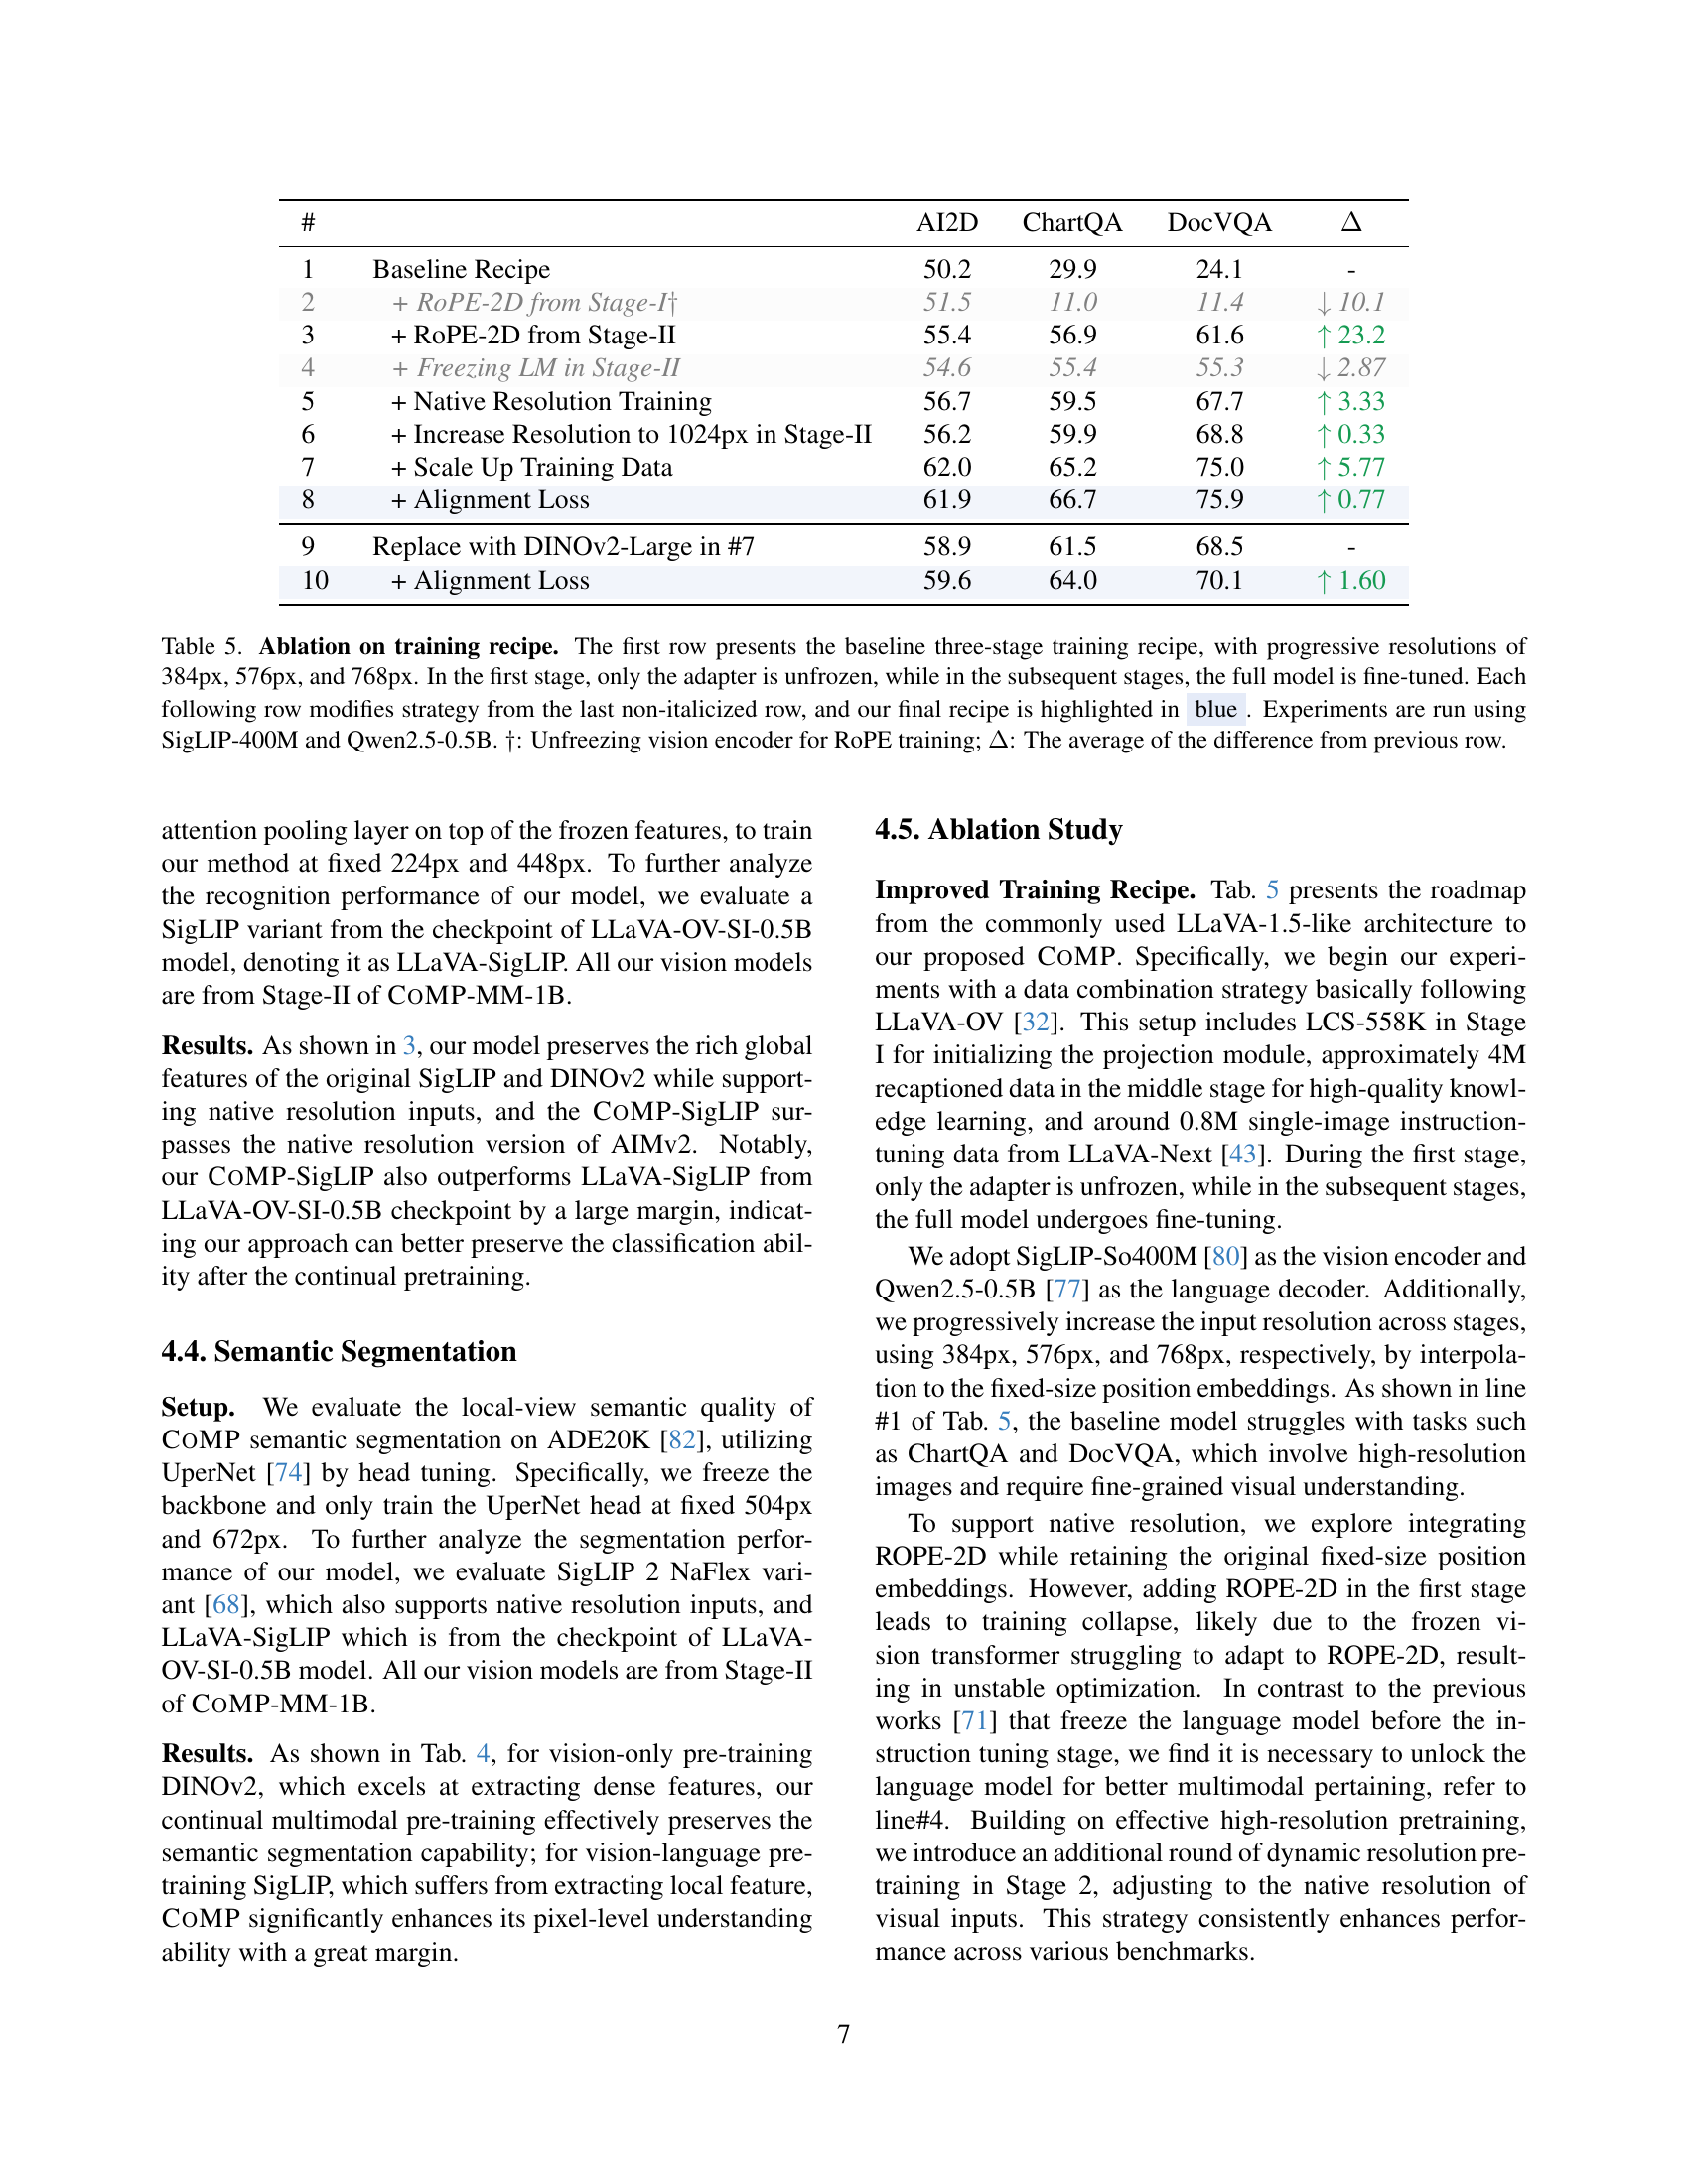
🔼 This table presents an ablation study on the training recipe used in the paper. It starts with a baseline three-stage training approach, using progressively higher image resolutions (384px, 576px, 768px). Each stage involves different training strategies: In the first stage, only the adapter is trained while the rest of the model is frozen; subsequent stages fine-tune the entire model. The table then systematically varies aspects of this baseline recipe (e.g., when RoPE-2D is introduced, whether the language model is frozen, training data size, etc.), showing the impact of each change on the performance metrics (AI2D, ChartQA, DocVQA). The final, optimal recipe is highlighted in blue. All experiments were conducted using the SigLIP-400M and Qwen2.5-0.5B models.
read the caption
Table 5: Ablation on training recipe. The first row presents the baseline three-stage training recipe, with progressive resolutions of 384px, 576px, and 768px. In the first stage, only the adapter is unfrozen, while in the subsequent stages, the full model is fine-tuned. Each following row modifies strategy from the last non-italicized row, and our final recipe is highlighted in blue. Experiments are run using SigLIP-400M and Qwen2.5-0.5B. ††\dagger†: Unfreezing vision encoder for RoPE training; ΔΔ\Deltaroman_Δ: The average of the difference from previous row.
| P.E. | Res. | ChartQA | DocVQA |
| Learned P.E. | 384px | 22.8 | 24.3 |
| Learned P.E. | 768px | 28.8 | 29.9 |
| RoPE-2D | 768px | 8.24 | 11.9 |
| C-RoPE | 768px | 32.2 | 33.2 |
🔼 This table presents an ablation study on the impact of different positional embedding methods on the performance of a multimodal model. Specifically, it compares the results of using learned positional embeddings at different resolutions (384px and 768px), using Rotary Position Embedding (ROPE)-2D at 768px, and finally using the proposed Continual Rotary Position Embedding (C-ROPE) at 768px. The experiment uses Qwen2-0.5B [76] and SigLIP-400M [80] models, fine-tuned for one epoch on LLaVA-NeXT-SFT [43] data. The evaluation metrics are ChartQA and DocVQA scores.
read the caption
Table 6: Ablation on positional embeddings. We utilize Qwen2-0.5B [76] and SigLIP-400M [80] to be directly fine-tuned on LLaVA-NeXT-SFT [43] data for one epoch.
| Recipe | ChartQA | DocVQA | MMMU |
| No Alignment loss | 55.6 | 60.9 | 31.9 |
| Only fixed res. | 59.6 | 68.4 | 31.8 |
| Both fixed & native res. | 60.2 | 67.5 | 32.9 |
🔼 This table presents an ablation study on the impact of the Alignment Loss component in the COMP model. Specifically, it shows the performance of the COMP model on three benchmark tasks (ChartQA, DocVQA, and MMMU) under different configurations. Two prominent vision foundation models, Qwen2-0.5B and DINOv2-Large, were used as backbones. The training data consisted of LLaVA-NeXT-SFT for Stage-III. The variations explored were the presence or absence of Alignment Loss, offering a comparison of the model’s performance with and without this crucial component. The results demonstrate the impact of Alignment Loss on model accuracy for multimodal understanding.
read the caption
Table 7: Ablation on the effectiveness of Alignment loss. We utilize Qwen2-0.5B [76] and DINOv2-Large [50], and employ LLaVA-NeXT-SFT [43] as training data of Stage-III.
| Model | ChartQA | DocVQA | MMMU |
| SigLIP-Base [80] | 61.6 | 71.0 | 33.6 |
| SigLIP-So400M [80] | 66.7 | 75.9 | 33.0 |
| DINOv2-Large [50] | 64.0 | 70.1 | 32.2 |
🔼 This table presents an ablation study on the impact of different vision encoders on the performance of the COMP model. It compares the results of using various vision encoders in terms of their size (Base vs. Large) and pretraining tasks (vision-only vs vision-language). The results are shown for three key metrics (ChartQA, DocVQA, MMMU) demonstrating how different choices for the vision encoder affect the overall performance of the multimodal understanding task.
read the caption
Table 8: Ablation on vision encoders. We ablation the vision encoder of different model sizes and pretraining tasks.
| Stage-I | Stage-II | Stage-III | ||
| Fixed | Native | |||
| Trainable | Adapter | Full Model | Full Model | Full Model |
| Batch Size | 328 | 328 | 328 | 168 |
| LRAdapter | ||||
| LRVFM | - | |||
| LRLLM | - | |||
| Epoch | 1 | 1 | 1 | 1 |
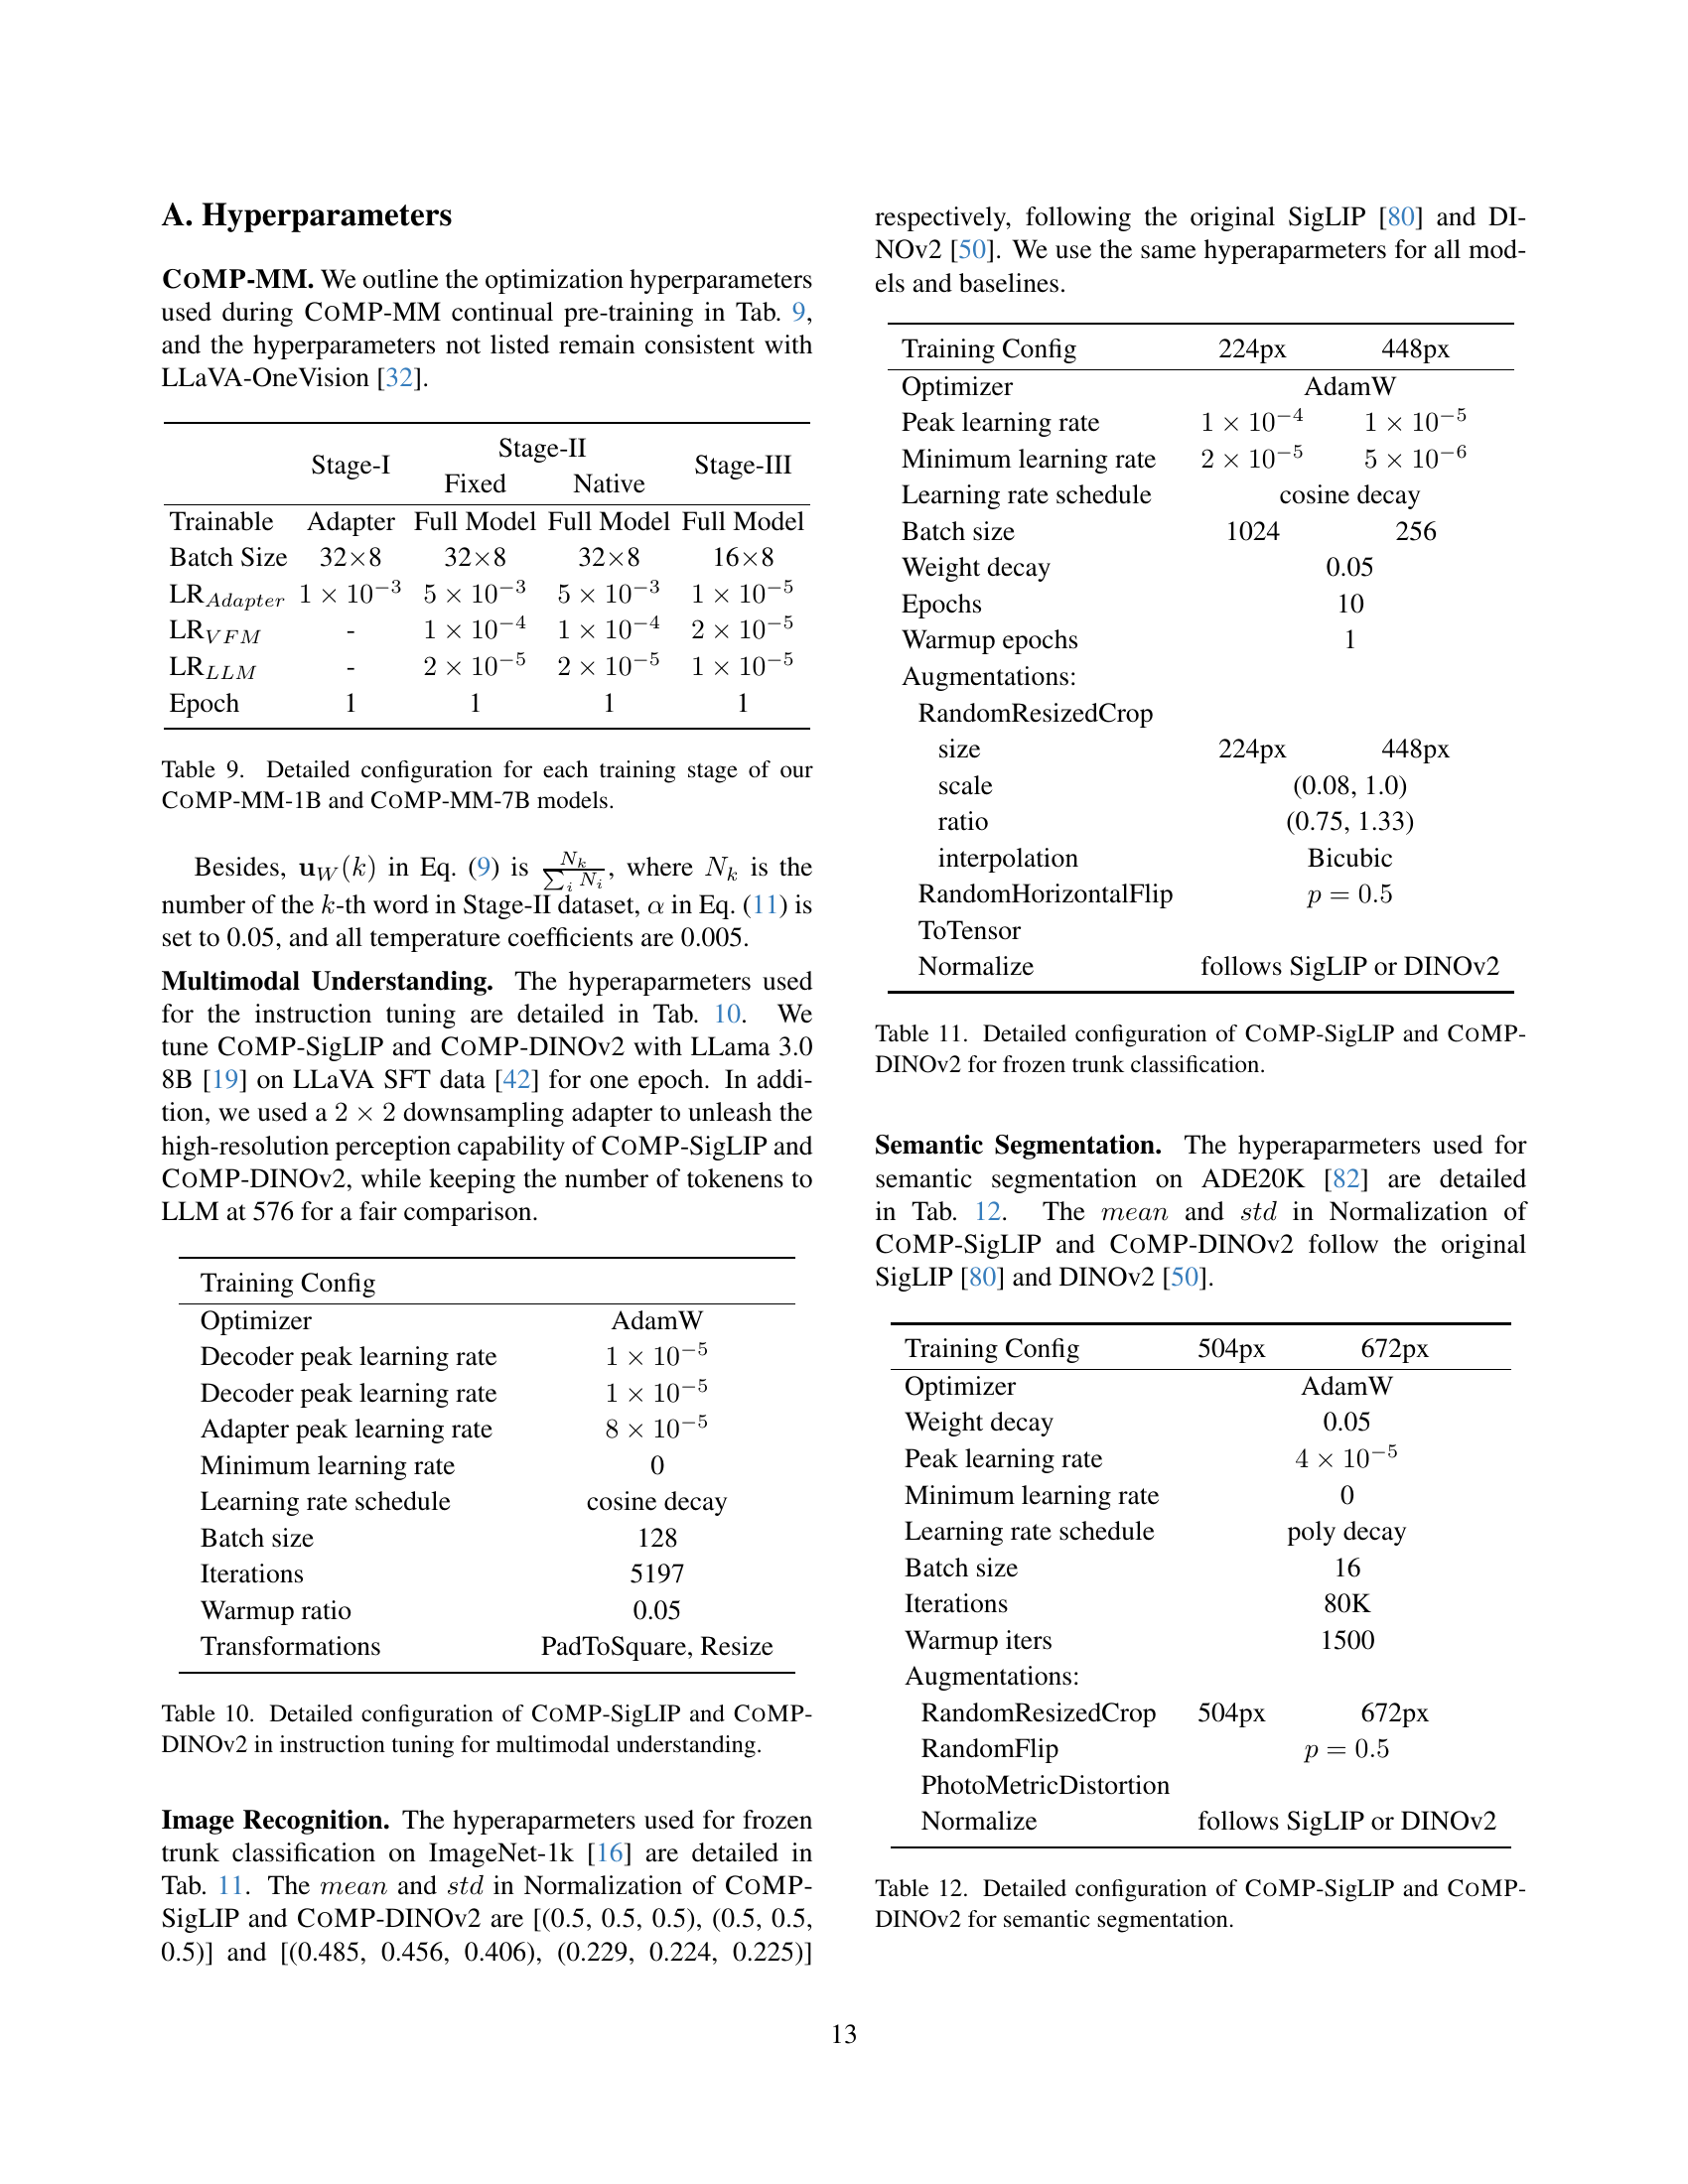
🔼 Table 9 details the configurations used for each of the three training stages (Stage-I, Stage-II, and Stage-III) in the CoMP-MM model training process for both the CoMP-MM-1B and CoMP-MM-7B model variants. It shows the hyperparameters for training the adapter, VFM, and LLM components, specifying details such as batch size, learning rates (for adapter, VFM, and LLM), and the number of epochs for each stage. The table highlights the differences in training configurations between the different stages and between the two model variants.
read the caption
Table 9: Detailed configuration for each training stage of our CoMP-MM-1B and CoMP-MM-7B models.
| Training Config | |
| Optimizer | AdamW |
| Decoder peak learning rate | |
| Decoder peak learning rate | |
| Adapter peak learning rate | |
| Minimum learning rate | 0 |
| Learning rate schedule | cosine decay |
| Batch size | 128 |
| Iterations | 5197 |
| Warmup ratio | 0.05 |
| Transformations | PadToSquare, Resize |
🔼 Table 10 presents the hyperparameters used for instruction tuning of the CoMP-SigLIP and CoMP-DINOv2 models. It details the optimizer, learning rates (peak and minimum), learning rate schedule, batch size, number of epochs, and warmup epochs. Specific configurations are provided for the adapter and vision foundation model (VFM) components separately. Transformations applied during data augmentation are also listed. This table provides a detailed breakdown of the training settings used to fine-tune the pre-trained vision models with instruction data for improved multimodal understanding.
read the caption
Table 10: Detailed configuration of CoMP-SigLIP and CoMP-DINOv2 in instruction tuning for multimodal understanding.
| Training Config | 224px | 448px |
| Optimizer | AdamW | |
| Peak learning rate | ||
| Minimum learning rate | ||
| Learning rate schedule | cosine decay | |
| Batch size | 1024 | 256 |
| Weight decay | 0.05 | |
| Epochs | 10 | |
| Warmup epochs | 1 | |
| Augmentations: | ||
| RandomResizedCrop | ||
| size | 224px | 448px |
| scale | (0.08, 1.0) | |
| ratio | (0.75, 1.33) | |
| interpolation | Bicubic | |
| RandomHorizontalFlip | ||
| ToTensor | ||
| Normalize | follows SigLIP or DINOv2 | |
🔼 Table 11 presents the hyperparameters used for the frozen trunk classification task on ImageNet-1K. It details the optimizer (AdamW), learning rates (peak and minimum), learning rate schedule (cosine decay), batch size, and augmentations used for both CoMP-SigLIP and CoMP-DINOv2 models. The table also specifies image resolutions (224px and 448px) and other training settings such as weight decay, epochs and warmup epochs. This table allows for a clear comparison of the settings used for training these two models on the ImageNet-1K dataset with a focus on evaluating their performance using only the frozen trunk.
read the caption
Table 11: Detailed configuration of CoMP-SigLIP and CoMP-DINOv2 for frozen trunk classification.
| Training Config | 504px | 672px |
| Optimizer | AdamW | |
| Weight decay | 0.05 | |
| Peak learning rate | ||
| Minimum learning rate | 0 | |
| Learning rate schedule | poly decay | |
| Batch size | 16 | |
| Iterations | 80K | |
| Warmup iters | 1500 | |
| Augmentations: | ||
| RandomResizedCrop | 504px | 672px |
| RandomFlip | ||
| PhotoMetricDistortion | ||
| Normalize | follows SigLIP or DINOv2 | |
🔼 This table details the specific hyperparameters used for semantic segmentation experiments on the ADE20K dataset, using two different vision foundation models: CoMP-SigLIP and CoMP-DINOv2. It breaks down the optimization settings, including the optimizer used (AdamW), learning rate scheduling (poly decay), batch size, number of iterations, warmup iterations, and augmentation techniques (RandomResizedCrop, RandomFlip, PhotoMetricDistortion, and normalization). The table provides a granular view of the training configurations for both models, enabling a comprehensive understanding of the experimental setup for this particular task.
read the caption
Table 12: Detailed configuration of CoMP-SigLIP and CoMP-DINOv2 for semantic segmentation.
Full paper#