TL;DR#
Diffusion models excel at visual content creation, but high computational costs hinder their use. The complexity of self-attention grows quadratically with image/video resolution. Current methods often sacrifice quality or need costly retraining. However, diffusion models are often pretrained at lower resolutions. The paper asks: Can we use low-resolution pretrained data to speed up high-resolution inference without losing quality?
The paper introduces Bottleneck Sampling, a training-free method that uses low-resolution priors to cut compute costs while keeping output quality high. It follows a high-low-high denoising process. It denoises at high-resolution initially and finally, but switches to lower resolutions in between. It refines resolution shifts and adapts denoising steps to avoid blurring. Experiments on image/video tasks show 3x/2.5x faster inference while matching standard quality.
Key Takeaways#
Why does it matter?#
This paper presents a promising approach to accelerate diffusion models without compromising output quality or requiring retraining. It’s relevant to researchers working on efficient generative models, offering a practical solution for deploying diffusion models in resource-constrained environments. It opens new avenues for exploring resolution-aware inference techniques and optimizing diffusion models for various applications.
Visual Insights#

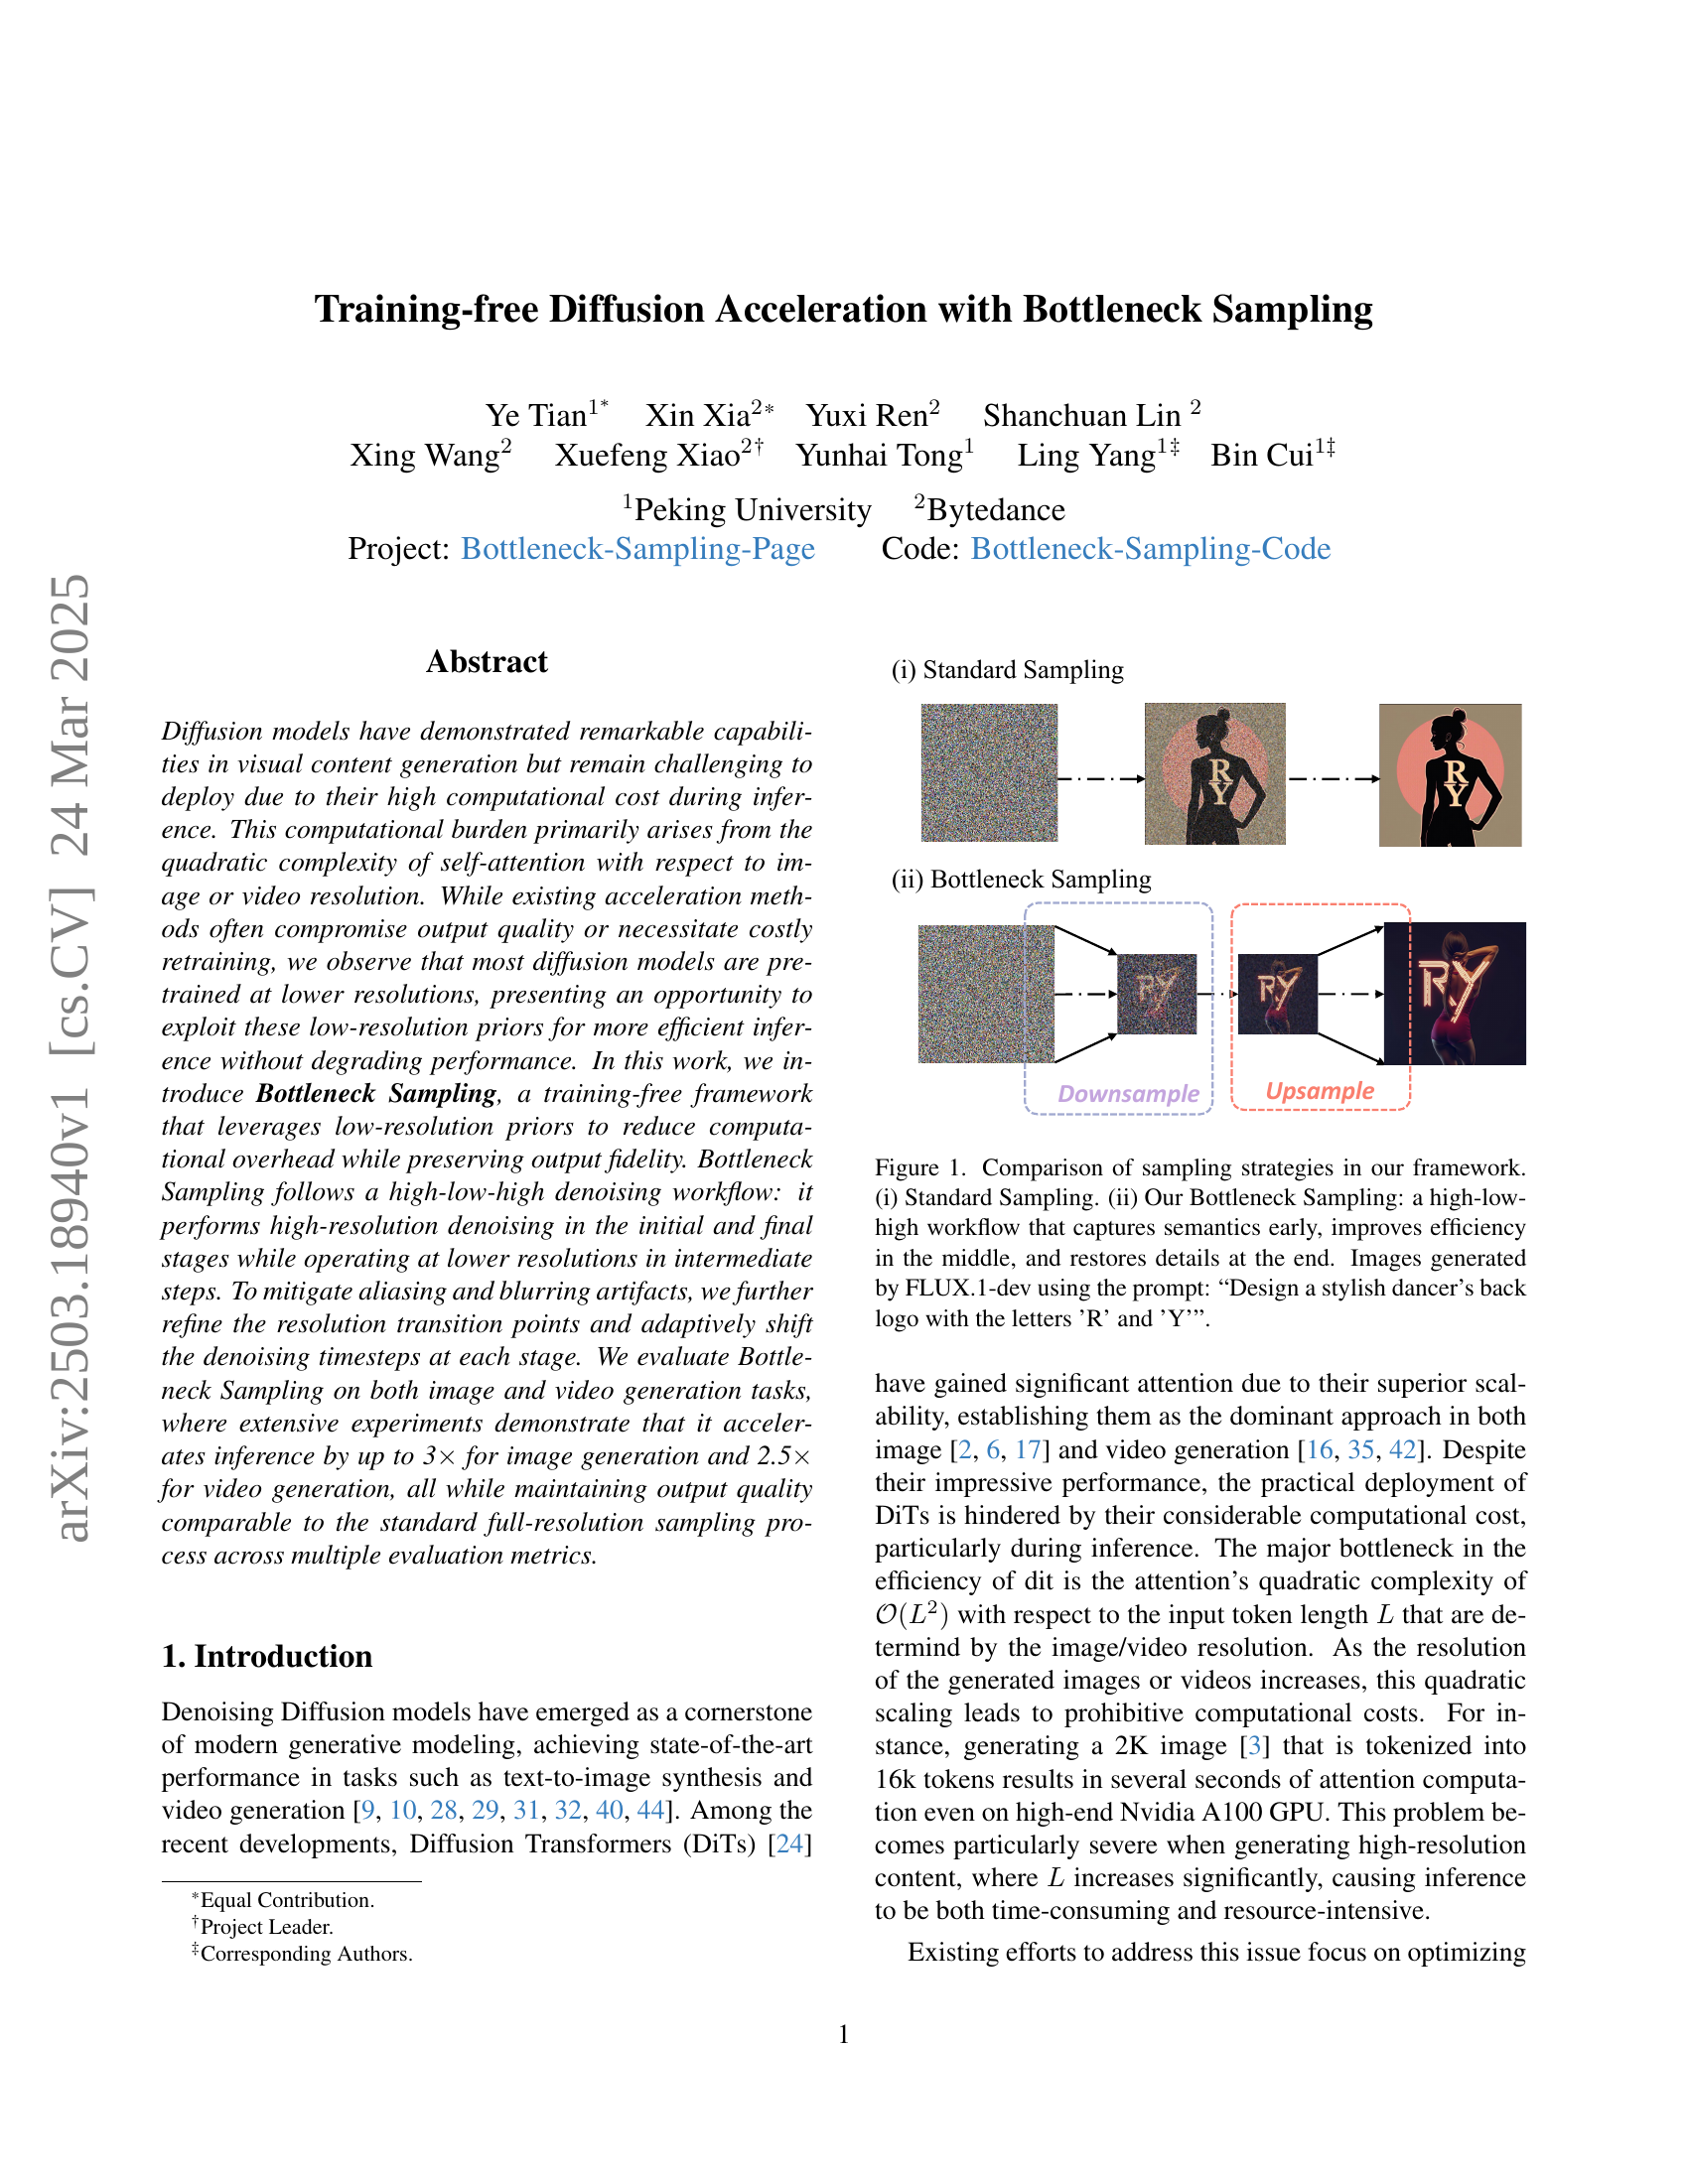
🔼 This figure compares two image generation sampling methods: standard sampling and the proposed Bottleneck Sampling. Standard sampling processes the image at full resolution throughout the generation process. Bottleneck sampling uses a three-stage approach: 1) initial high-resolution denoising to establish semantic information; 2) intermediate lower-resolution denoising for improved efficiency; and 3) final high-resolution denoising to restore fine details. The example images were generated using the FLUX.1-dev model with the prompt ‘Design a stylish dancer’s back logo with the letters ‘R’ and ‘Y’’. This illustrates how Bottleneck Sampling can improve efficiency without significant loss of image quality.
read the caption
Figure 1: Comparison of sampling strategies in our framework. (i) Standard Sampling. (ii) Our Bottleneck Sampling: a high-low-high workflow that captures semantics early, improves efficiency in the middle, and restores details at the end. Images generated by FLUX.1-dev using the prompt: “Design a stylish dancer’s back logo with the letters ’R’ and ’Y’”.
| Method | Latency(s) | FLOPs(T) | Speed | CLIP Score | Image Reward [39] | Gen Eval [39] | Average on T2I- Compbench |
| FLUX.1-dev [17] | 33.85 | 3719.50 | 1.00 | 0.460 | 1.258 | 0.6807 | 0.7032 |
| 33% steps | 11.28 | 1239.83 | 3 | 0.432 | 1.048 | 0.6423 | 0.6140 |
| 50% steps | 16.93 | 1859.75 | 2 | 0.453 | 1.239 | 0.6698 | 0.6808 |
| ToCa [47] | 19.88 | 2458.06 | 1.51 | 0.447 | 1.169 | 0.6630 | 0.6738 |
| Bottleneck Sampling ( 2) | 17.37 | 1870.10 | 2 | 0.460 | 1.257 | 0.6762 | 0.6820 |
| Bottleneck Sampling ( 3) | 14.46 | 1234.39 | 3 | 0.457 | 1.254 | 0.6773 | 0.6946 |
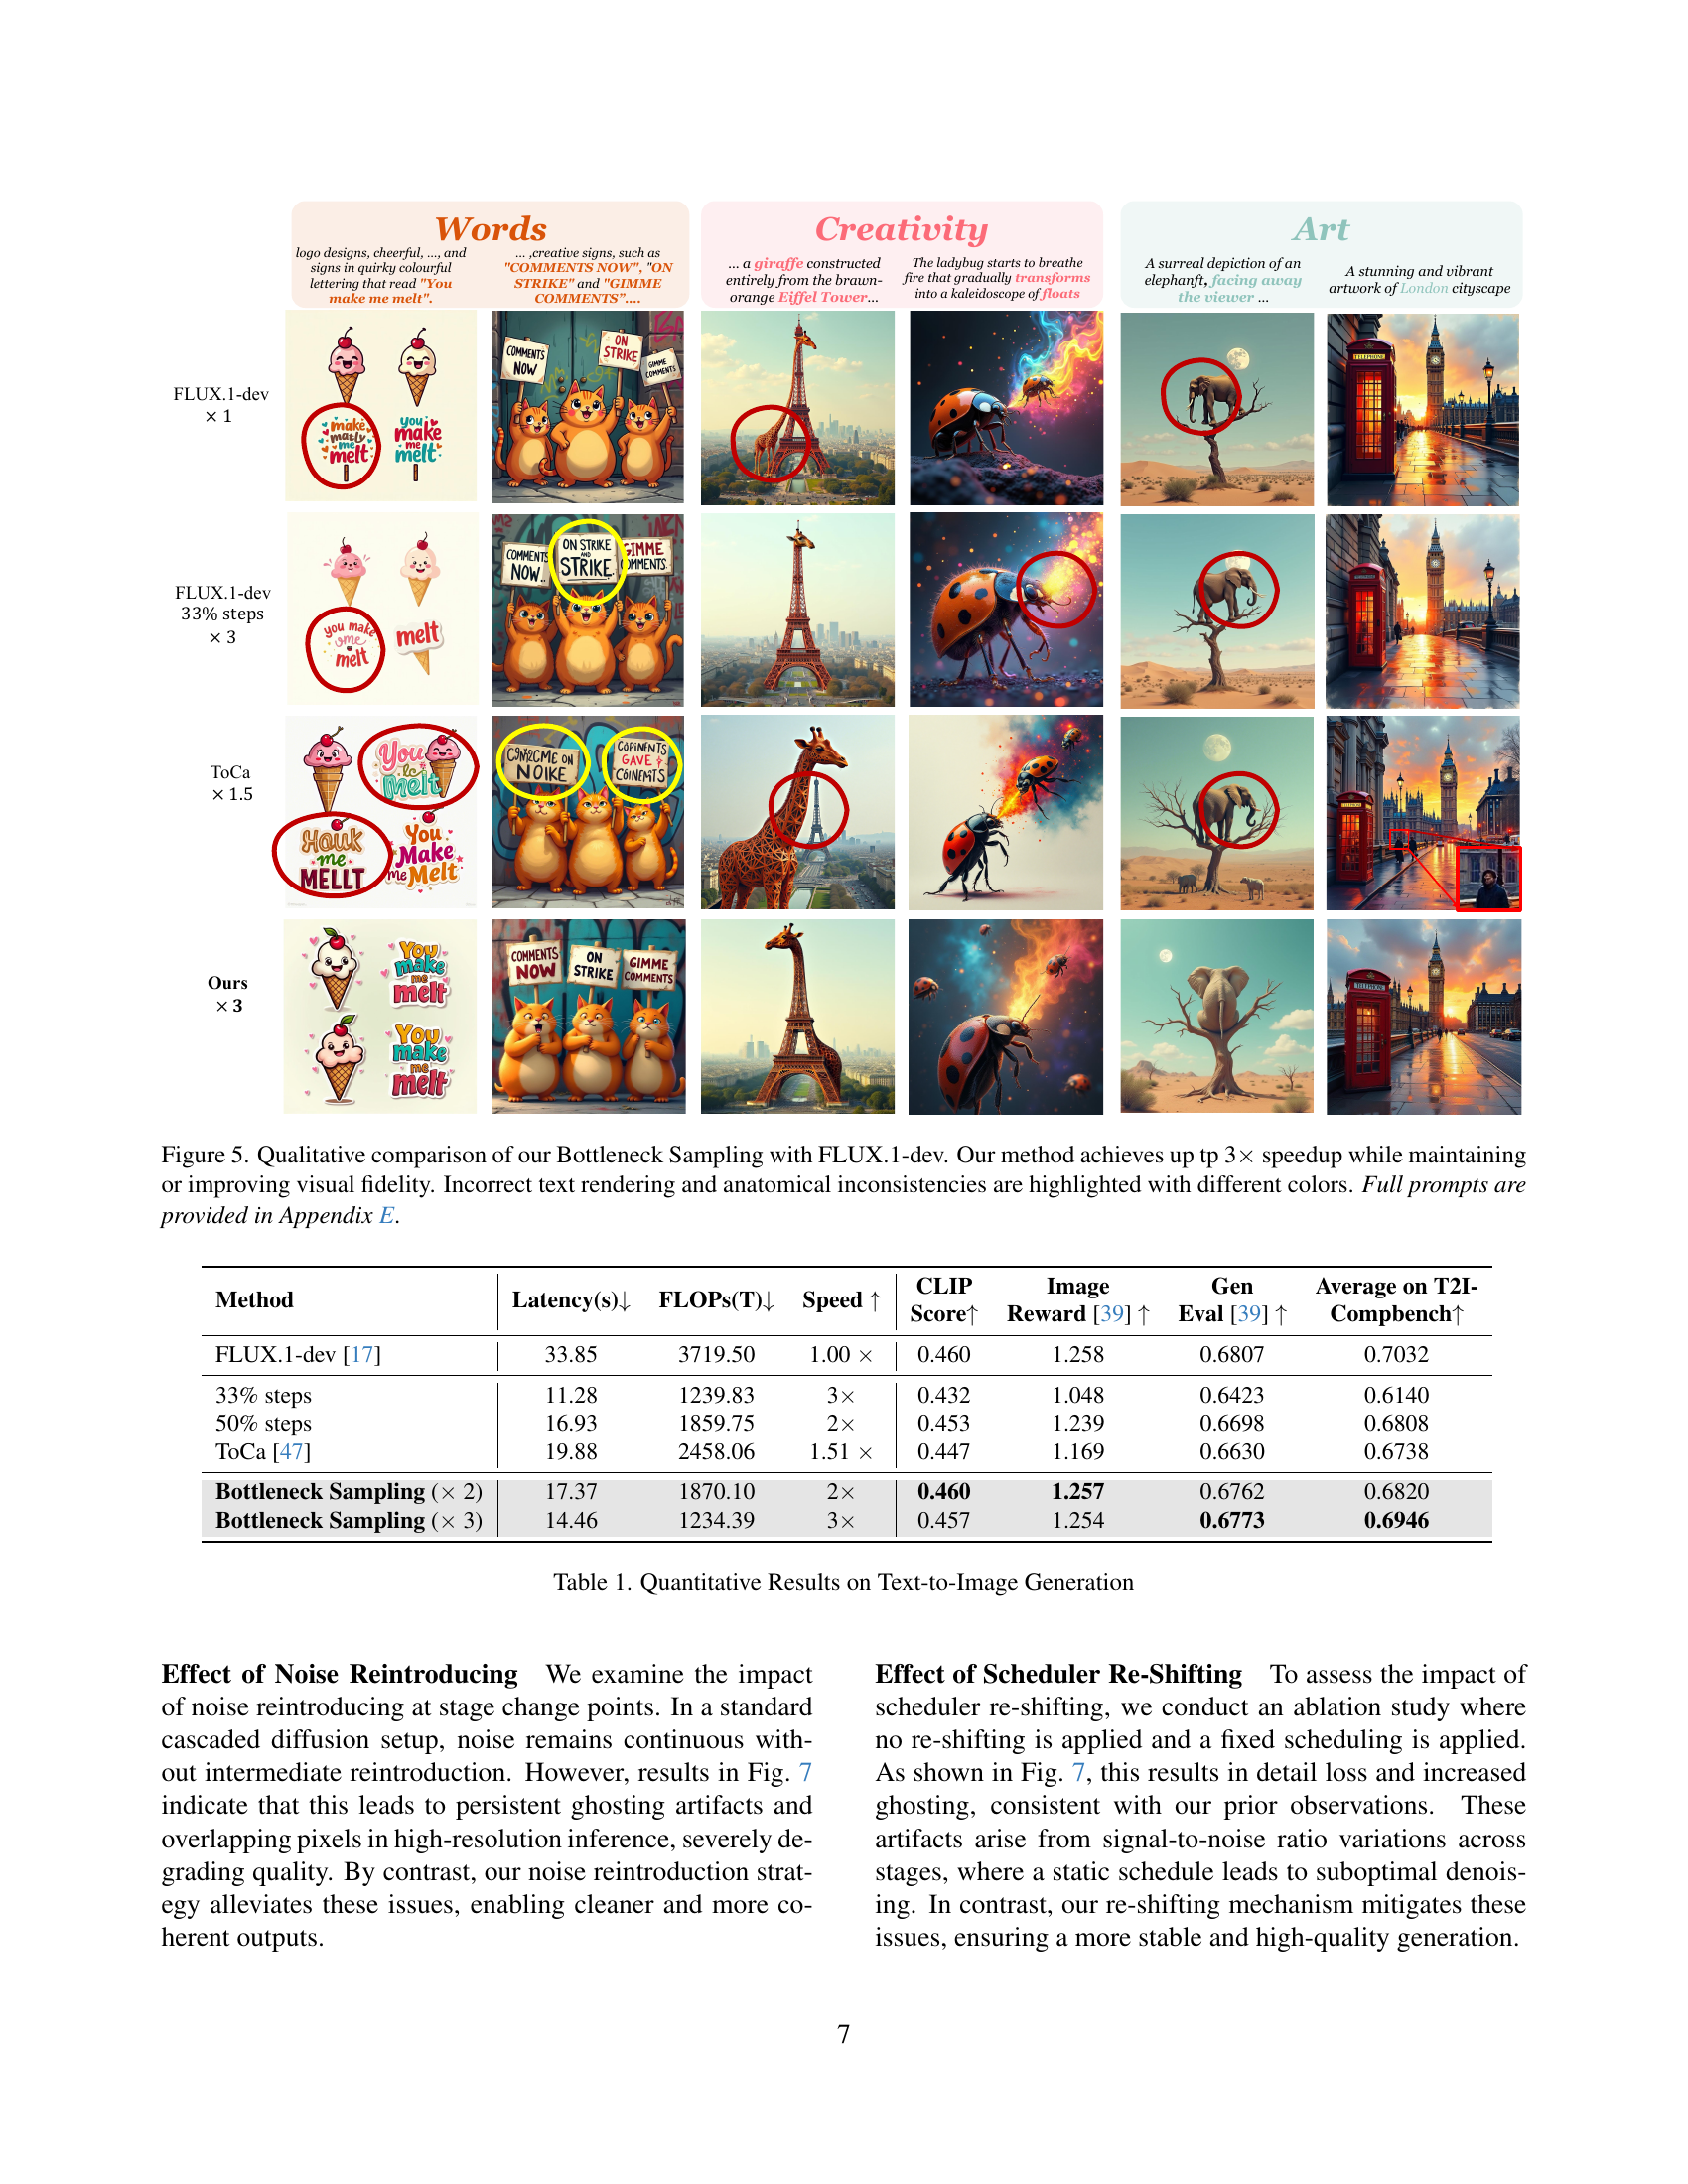
🔼 This table presents a quantitative comparison of different methods for text-to-image generation. It compares the latency (in seconds), FLOPs (floating-point operations), speed (relative to a baseline), CLIP score (measuring alignment between generated image and text prompt), ImageReward (a human preference score), GenEval (a holistic evaluation metric), and the average score on the T2I-Compbench benchmark. The methods compared include the FLUX.1-dev baseline, versions using reduced inference steps (33% and 50%), ToCa (a training-free acceleration method), and the proposed Bottleneck Sampling method (at 2x and 3x speedup). The results show the tradeoffs between speed and quality for different approaches.
read the caption
Table 1: Quantitative Results on Text-to-Image Generation
In-depth insights#
Low-Res Priors#
Low-resolution priors can be effectively leveraged in diffusion models to enhance efficiency without significantly compromising output quality. Pre-training at lower resolutions is common due to reduced computational demands. This presents an opportunity to exploit these learned priors for faster inference at higher resolutions. The underlying idea is that much of the global structure and semantic information can be captured at lower resolutions, allowing for a more efficient denoising process. By strategically incorporating low-resolution computations during inference, it is possible to reduce computational overhead while preserving high-resolution details, thereby improving overall efficiency.
Hierarchical Denoising#
Hierarchical denoising likely refers to a multi-stage process where noise reduction occurs at varying levels of detail. This approach could involve initially removing broad, coarse noise, followed by iterative refinements targeting finer, more intricate noise patterns. This could leverage techniques such as wavelet transforms or image pyramids to decompose the image into different frequency bands, allowing for targeted denoising at each level. Such an approach will be computationally efficient as well. Hierarchical denoising enables adaptive noise management as well, offering a balance between preserving image detail and effectively suppressing noise artifacts which are critical for many applications.
SNR-Aware Shifting#
While the specific term “SNR-Aware Shifting” wasn’t explicitly present, the paper consistently addressed challenges related to the signal-to-noise ratio (SNR) in diffusion model acceleration. The authors emphasized that naively applying techniques that reduce computational cost can degrade image quality, particularly by disrupting the delicate balance between signal and noise during denoising. Their Bottleneck Sampling strategy incorporates mechanisms to be mindful of the SNR, like re-introducing noise during resolution transitions. This ensures that denoising at each scale aligns with the appropriate SNR range, preventing artifacts and detail loss. Furthermore, their tailored scheduler re-shifting adjusts the denoising schedule based on resolution, concentrating denoising efforts in low-SNR regions where detail refinement is most crucial. By actively managing and adapting to the SNR at various stages, the method maintains high-quality generation while achieving substantial speedups, demonstrating that SNR-awareness is vital for training-free acceleration.
Plug-and-Play DiT#
Plug-and-Play DiT (Diffusion Transformer) signifies an architecture designed for seamless integration and adaptability. Its core strength lies in its modular design, allowing components to be effortlessly swapped or modified without retraining the entire model.** This allows for exploring diverse architectural choices, such as attention mechanisms or normalization layers, without significant overhead. The ‘plug-and-play’ nature enables quick experimentation with different pre-trained modules, facilitating transfer learning and adapting to new tasks or datasets. The flexibility makes it a valuable tool for research and development, accelerating the exploration of DiT variants and their performance characteristics across various applications, improving efficiency by leveraging existing resources to optimize novel configurations. It allows for flexible integration with other models and data pipelines, optimizing the model for specific application.
Resource-Awareness#
Resource-awareness in diffusion models is crucial given their high computational demands. Balancing computational cost and output quality is paramount. Exploring methods that minimize resource usage without sacrificing generation fidelity is key. The pre-training of models at lower resolutions presents an opportunity to exploit these priors for efficient inference. Frameworks like Bottleneck Sampling, which strategically use low-resolution computations, are a promising avenue. Techniques that optimize attention or reuse features are also important, but often involve quality trade-offs that must be carefully considered. Resource-awareness requires designing for efficient processing, considering how to adapt the model and training paradigm to achieve better performance with limited resources.
More visual insights#
More on figures

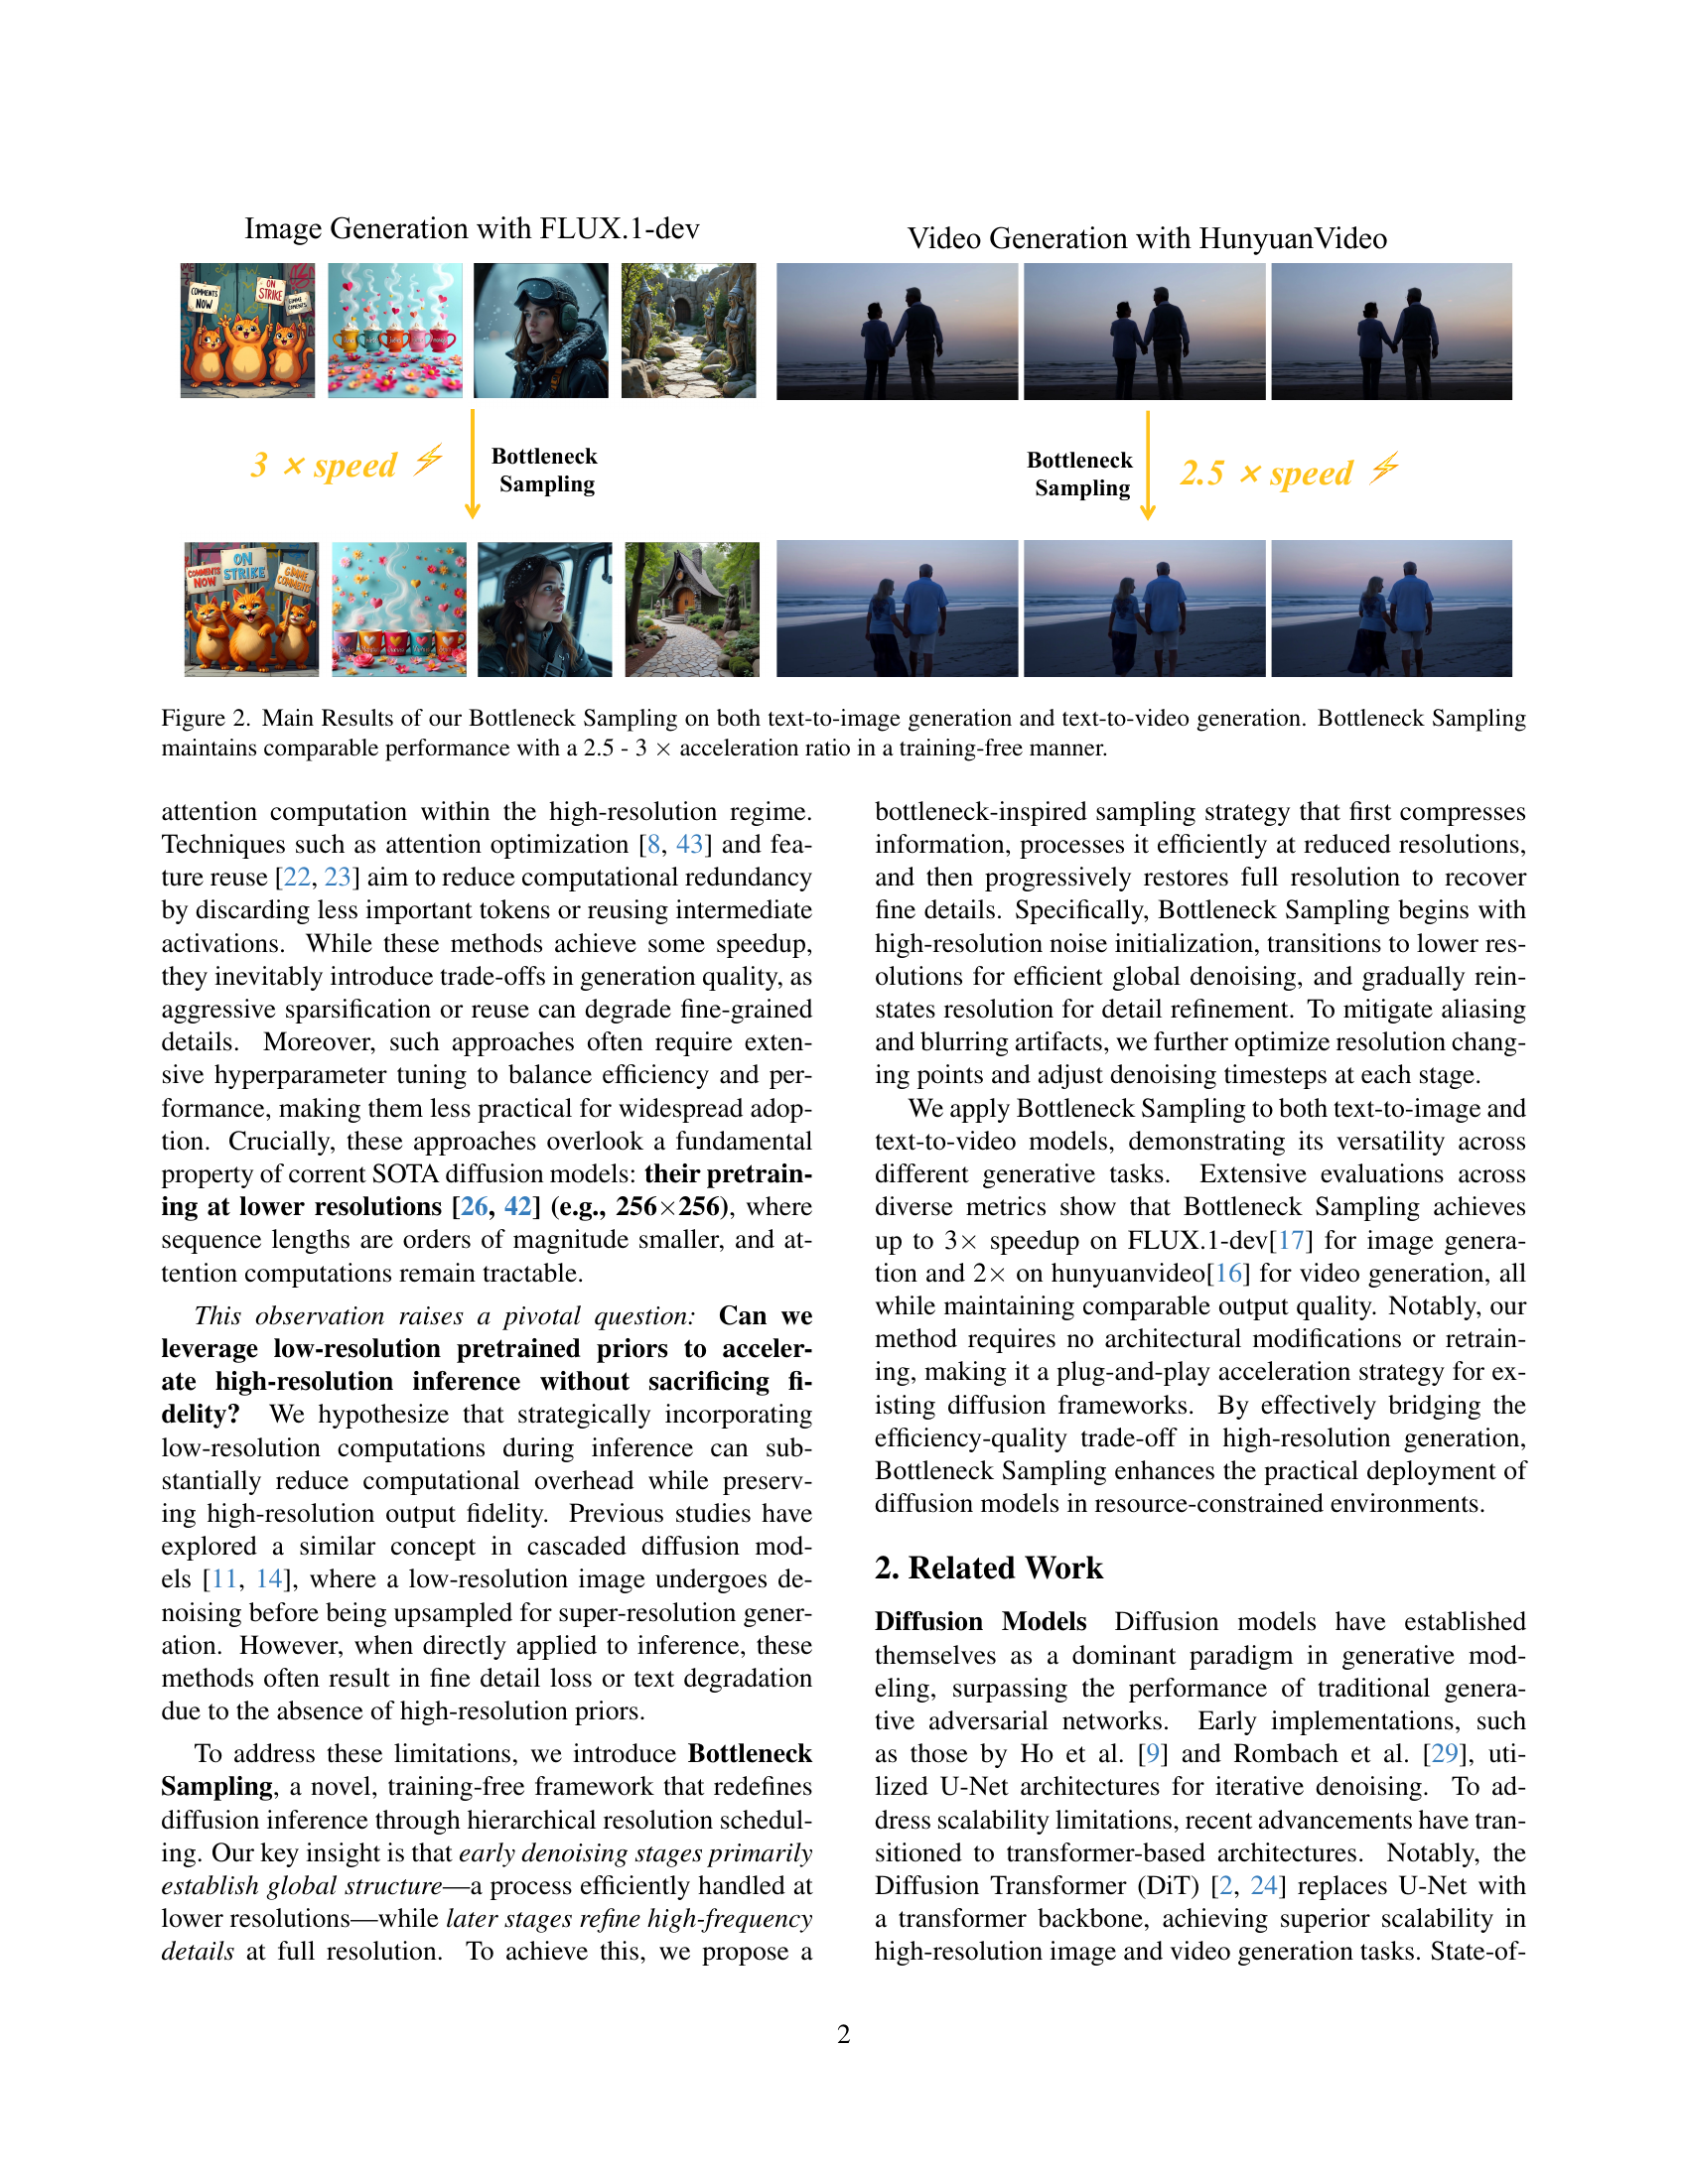
🔼 This figure shows the results of applying Bottleneck Sampling to both image and video generation tasks using the FLUX-1-dev and Hunyuan Video models, respectively. The left panel demonstrates that Bottleneck Sampling achieves 3x speedup in image generation compared to standard sampling while maintaining comparable image quality. The right panel shows that it achieves 2.5x speedup in video generation, again without significant loss of quality. This is notable because the method is training-free, meaning that it does not require retraining the models to achieve this speed improvement.
read the caption
Figure 2: Main Results of our Bottleneck Sampling on both text-to-image generation and text-to-video generation. Bottleneck Sampling maintains comparable performance with a 2.5 - 3 ×\times× acceleration ratio in a training-free manner.

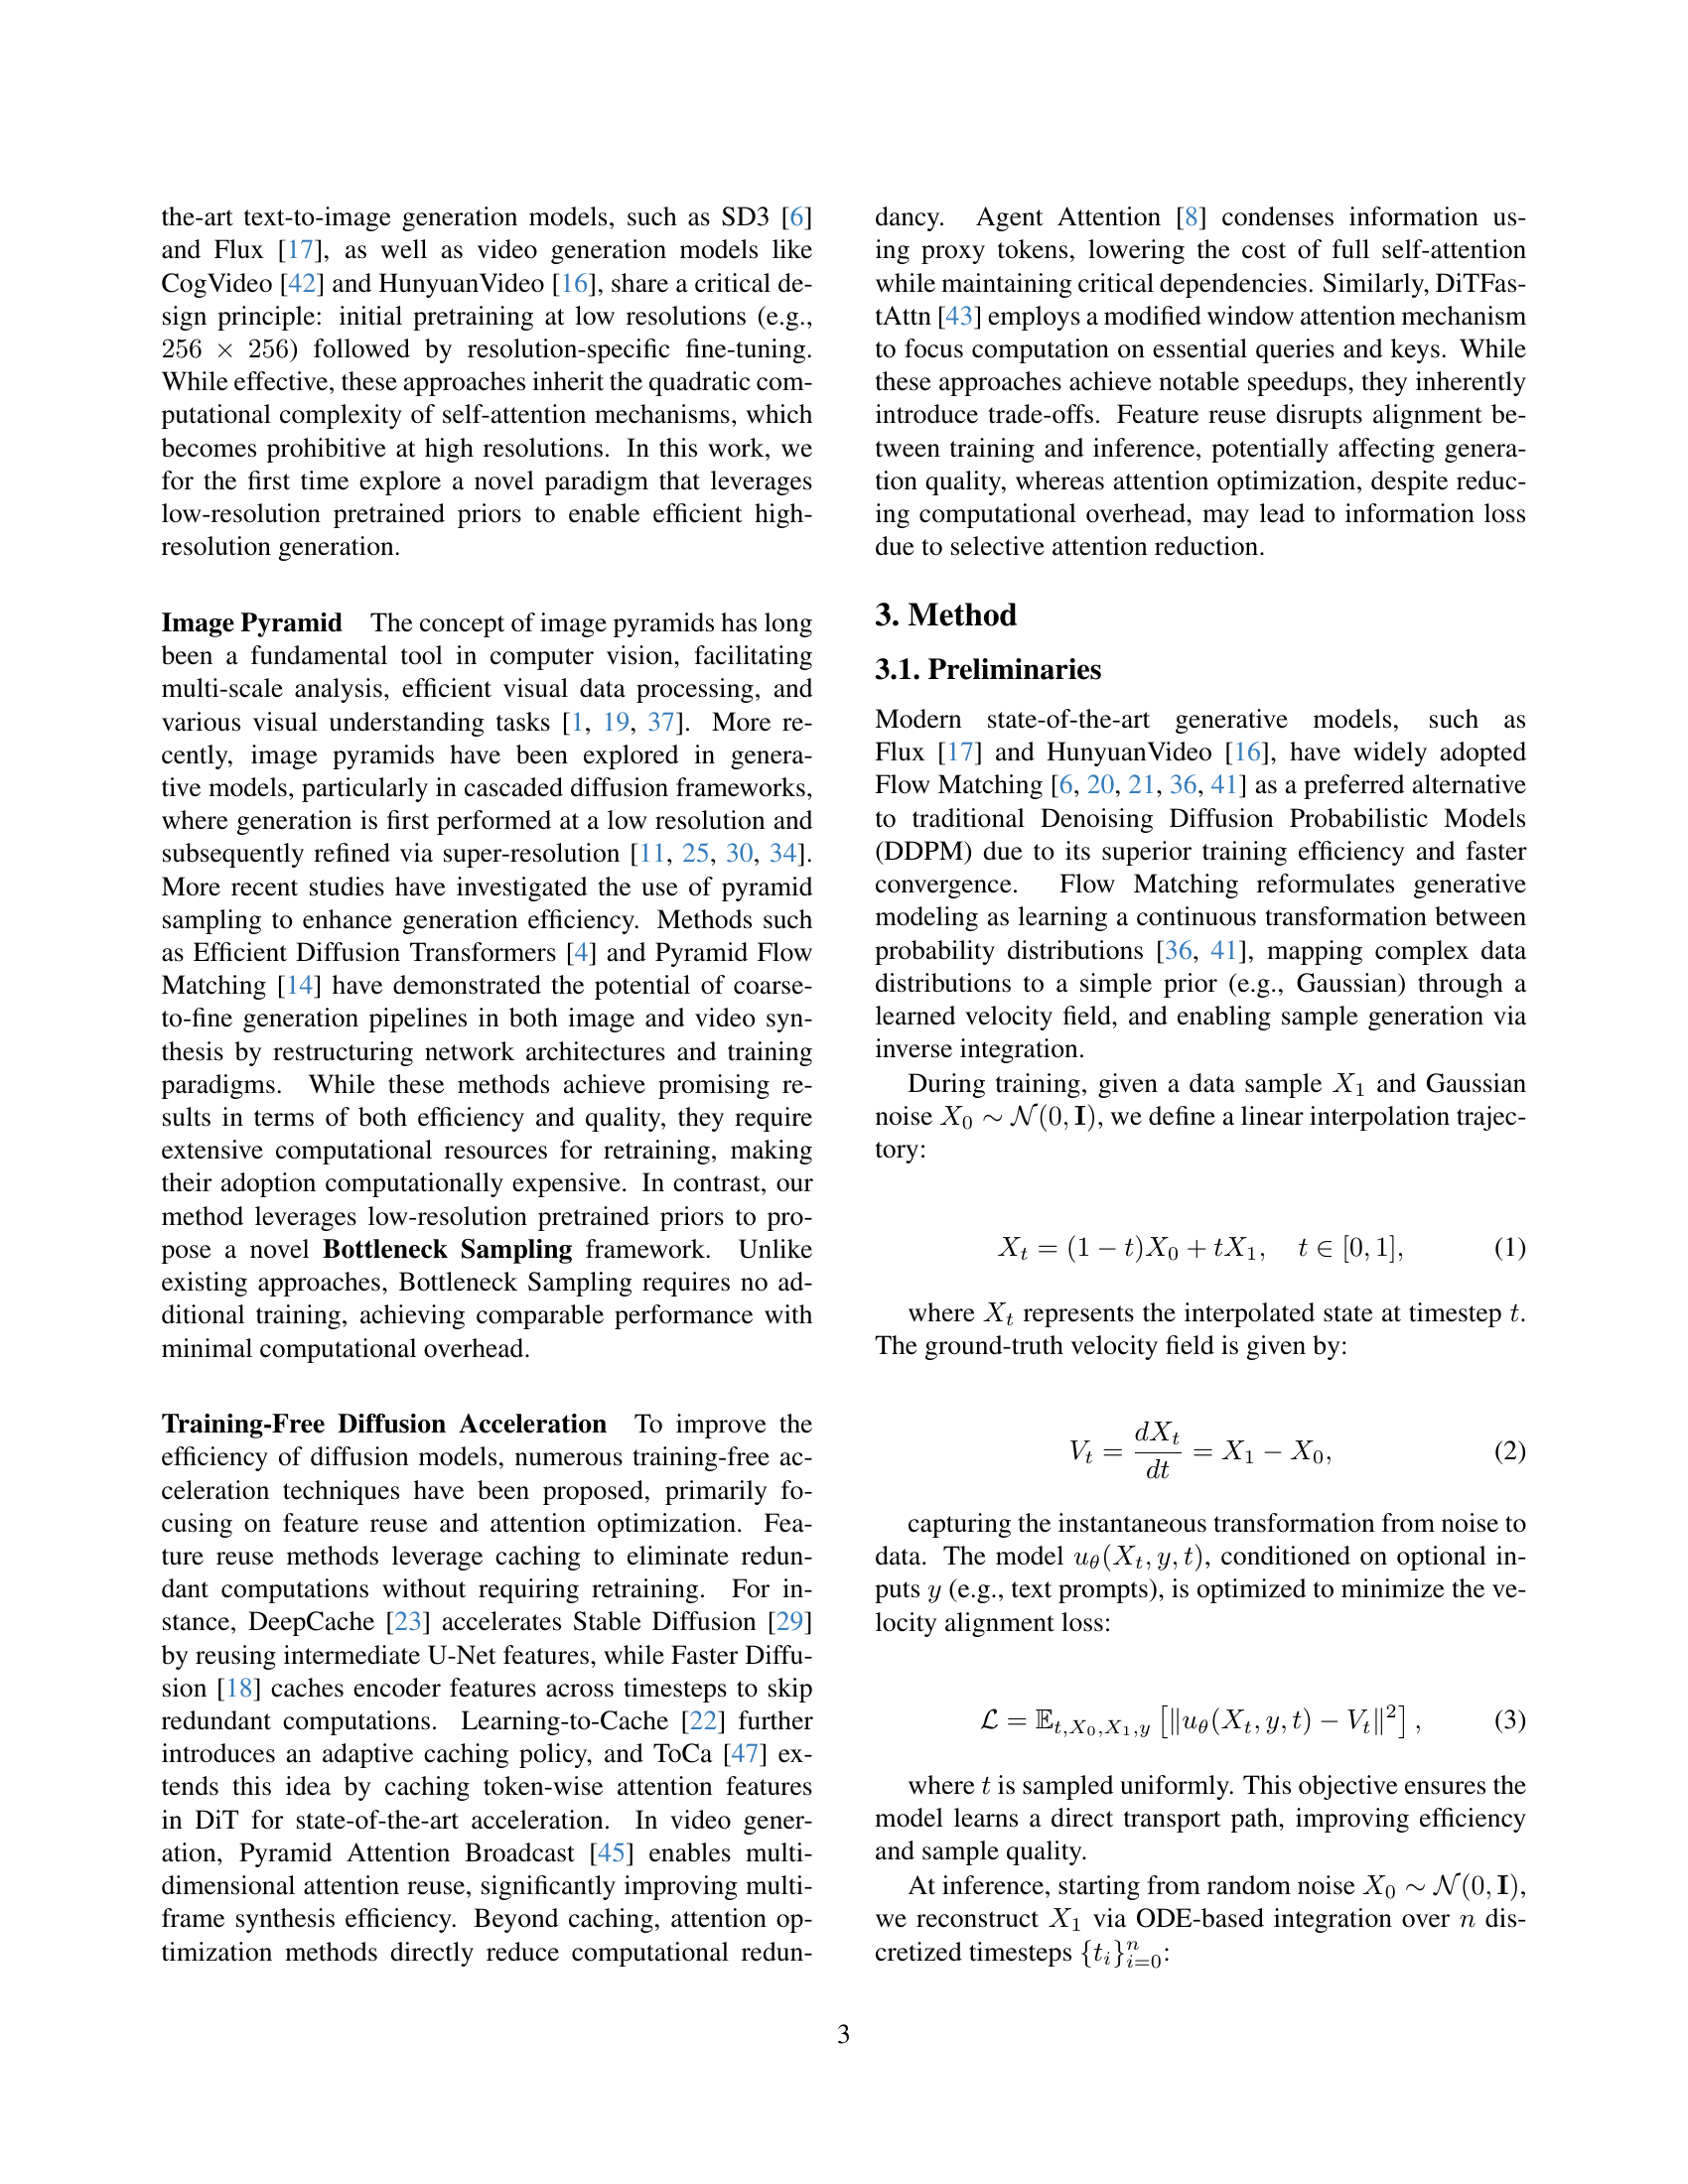
🔼 Bottleneck Sampling is a three-stage process. Stage 1 uses high resolution to preserve important semantic information in the early denoising steps. Stage 2 switches to a lower resolution for the intermediate denoising steps, significantly improving efficiency. Finally, Stage 3 returns to high resolution to restore fine details in the final denoising steps. This figure shows the workflow visually with example images generated from the prompt: “2D cartoon, Diagonal composition, Medium close-up, a whole body of a classical doll being held by a hand, the doll of a young boy with white hair dressed in purple, He has pale skin and white eyes.” using FLUX.1-dev.
read the caption
Figure 3: Overall pipeline of our Bottleneck Sampling. The process consists of three stages: (i) High-Resolution Denoising to preserve semantic information, (ii) Low-Resolution Denoising to improve efficiency, and (iii) High-Resolution Denoising to restore fine details. Images generated by FLUX.1-dev using the prompt: “2D cartoon,Diagonal composition, Medium close-up, a whole body of a classical doll being held by a hand, the doll of a young boy with white hair dressed in purple, He has pale skin and white eyes.”.

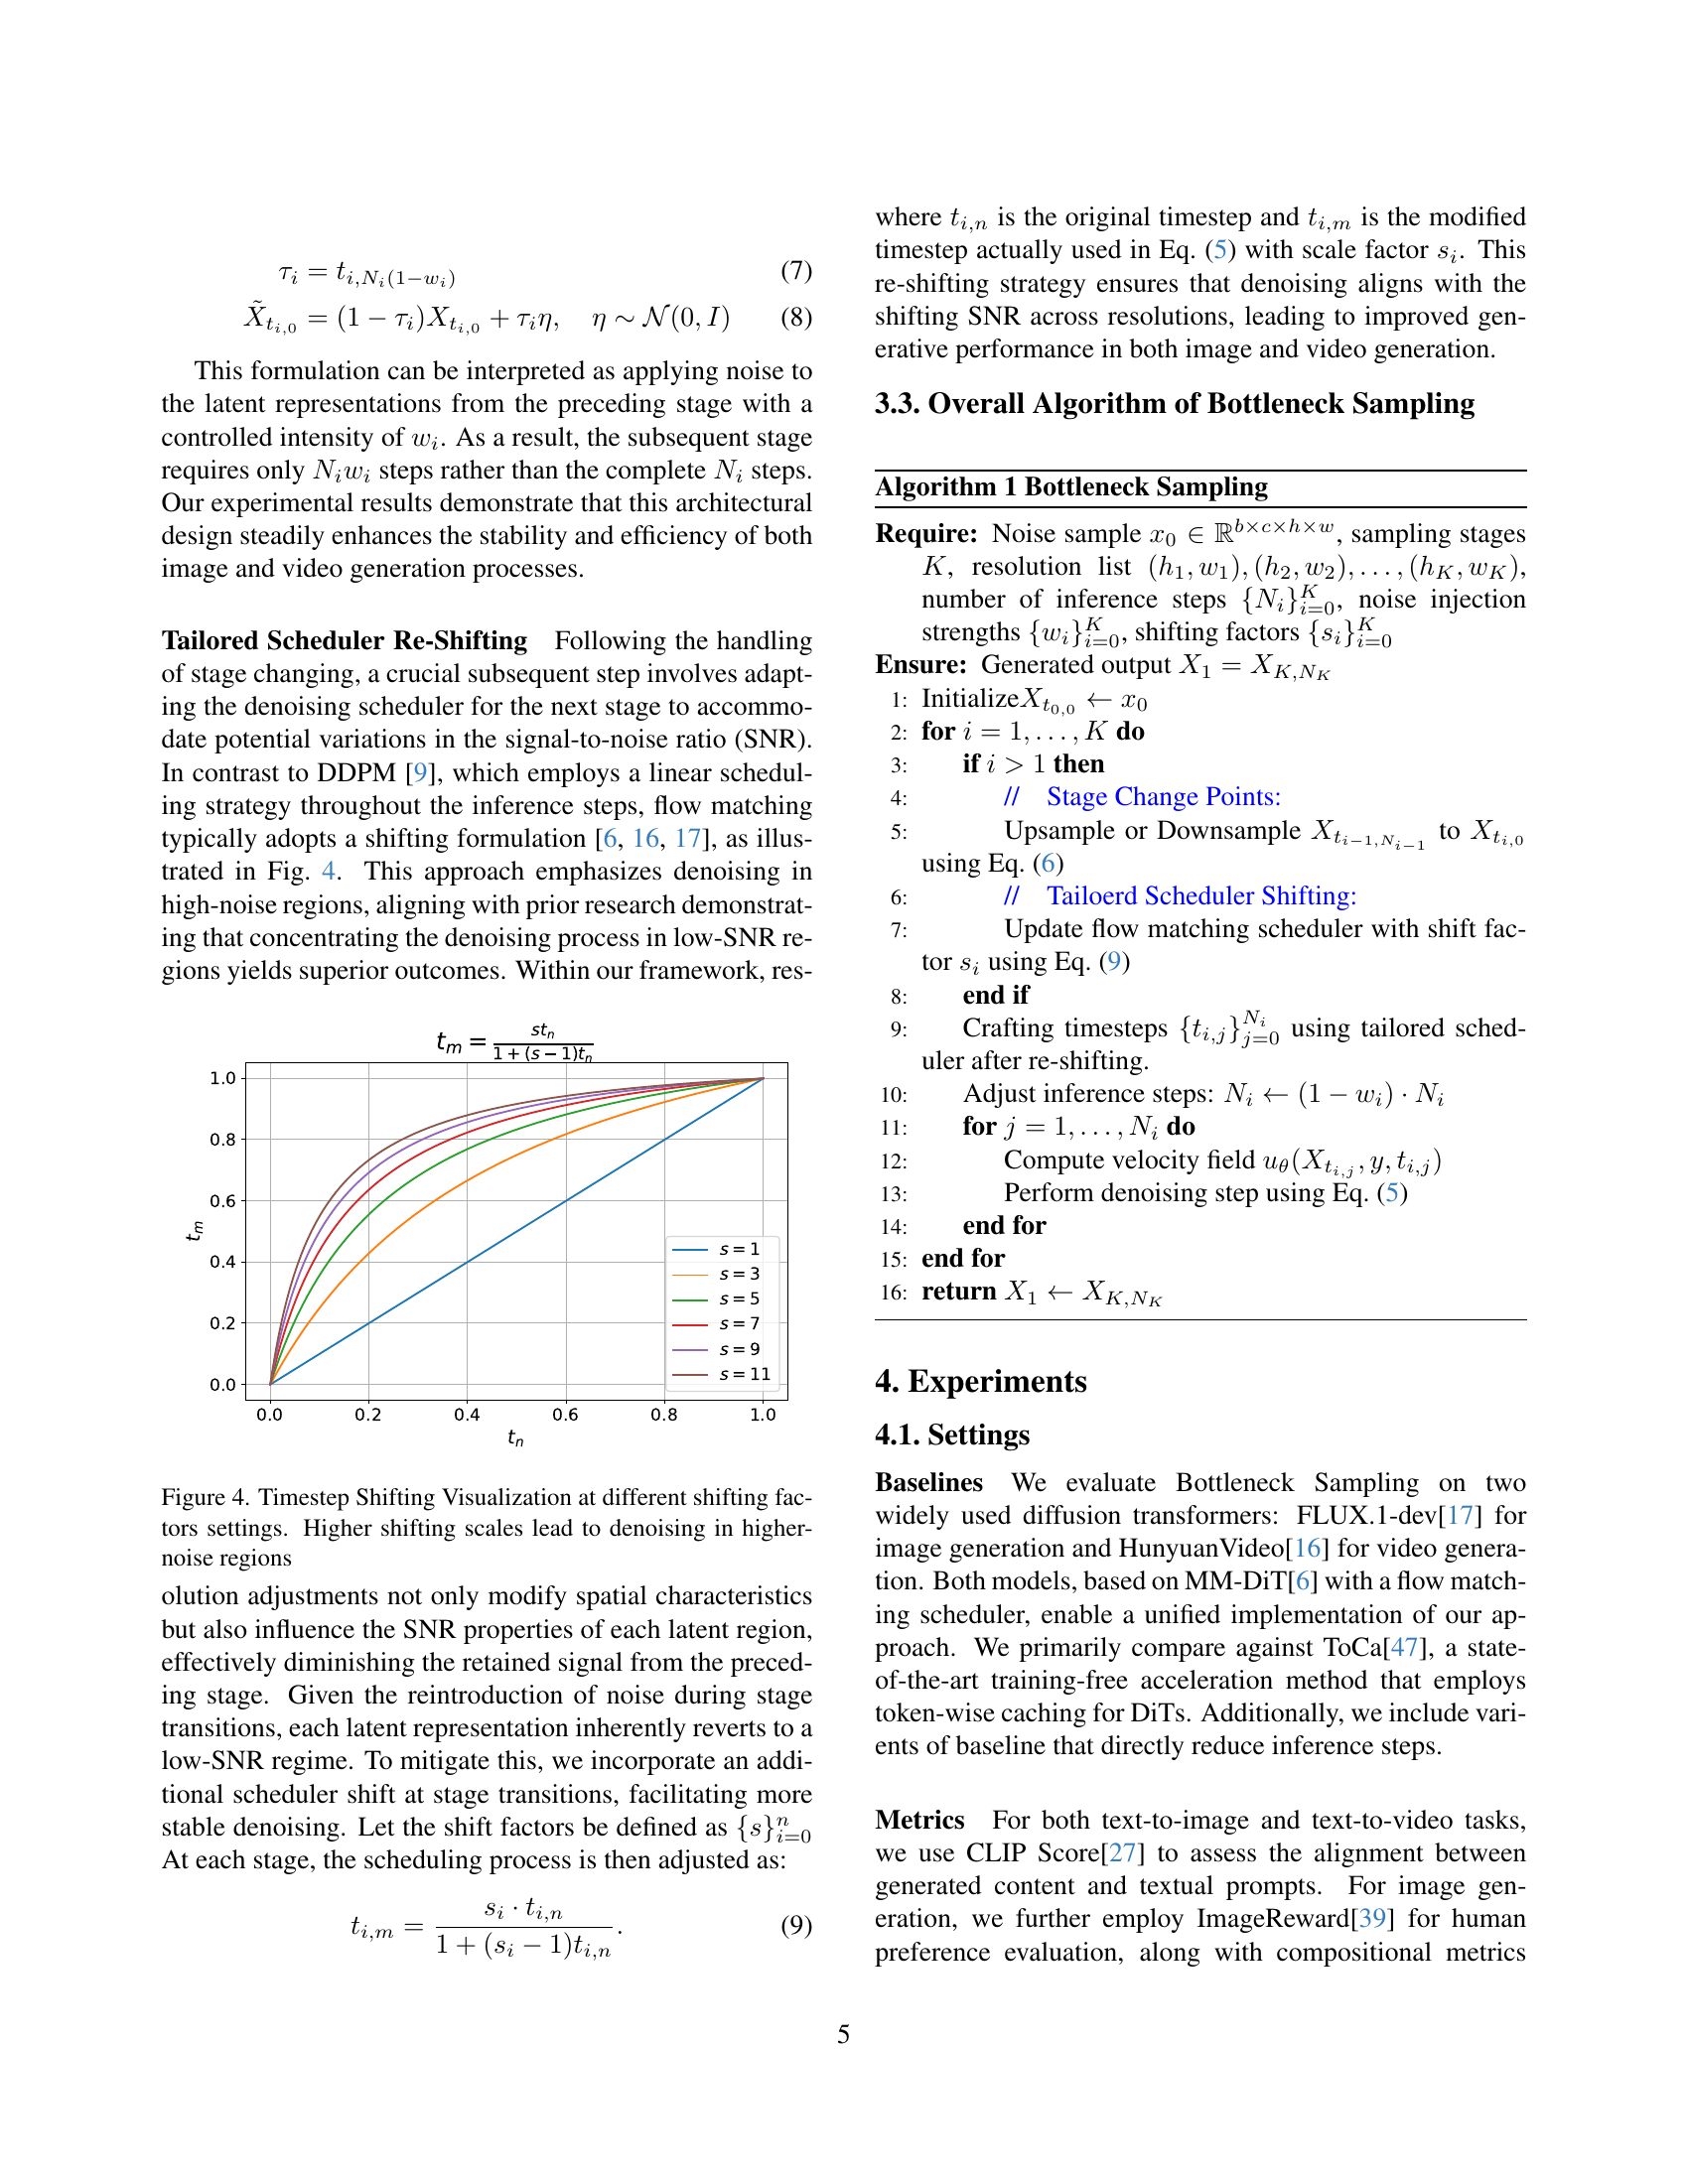
🔼 This figure visualizes how the denoising process in diffusion models is affected by different ‘shifting factors.’ In diffusion models, the denoising process happens across many timesteps, starting from pure noise and gradually revealing the generated image or video. The x-axis represents the original timestep, while the y-axis shows the modified timestep after the shift is applied. Higher shifting factors concentrate the denoising towards the later timesteps (higher noise levels) resulting in less denoising at the beginning of the process. This strategy is beneficial for improving generation quality, as discussed in the paper. Each curve represents a different shifting factor, showing how the amount of shift changes the denoising schedule.
read the caption
Figure 4: Timestep Shifting Visualization at different shifting factors settings. Higher shifting scales lead to denoising in higher-noise regions

🔼 Figure 5 showcases a qualitative comparison between image generation results from the standard FLUX.1-dev model and the proposed Bottleneck Sampling method. It demonstrates that Bottleneck Sampling achieves up to 3x speedup without sacrificing image quality; in many cases, visual fidelity even improves. Examples of text rendering issues and anatomical inconsistencies in the FLUX.1-dev images are highlighted for clear comparison. The full prompts used to generate these images are listed in Appendix E.
read the caption
Figure 5: Qualitative comparison of our Bottleneck Sampling with FLUX.1-dev. Our method achieves up tp 3×\times× speedup while maintaining or improving visual fidelity. Incorrect text rendering and anatomical inconsistencies are highlighted with different colors. Full prompts are provided in Appendix E.

🔼 Figure 6 presents a qualitative comparison of video generation results between the standard HunyuanVideo model and the proposed Bottleneck Sampling method. Three video generation examples are shown for each method. The Bottleneck Sampling method achieves up to a 2.5 times speed increase compared to the original HunyuanVideo model, without significant loss in visual quality. Instances of incorrect object motion or disappearing objects in the generated videos are circled in red for easier identification and comparison.
read the caption
Figure 6: Qualitative comparison of our Bottleneck Sampling with HunyuanVideo [16].Our method achieves up to 2.5×\times× speedup while maintaining visual fidelity. Incorrect object motion and object disappearing are highlighted with red circles.

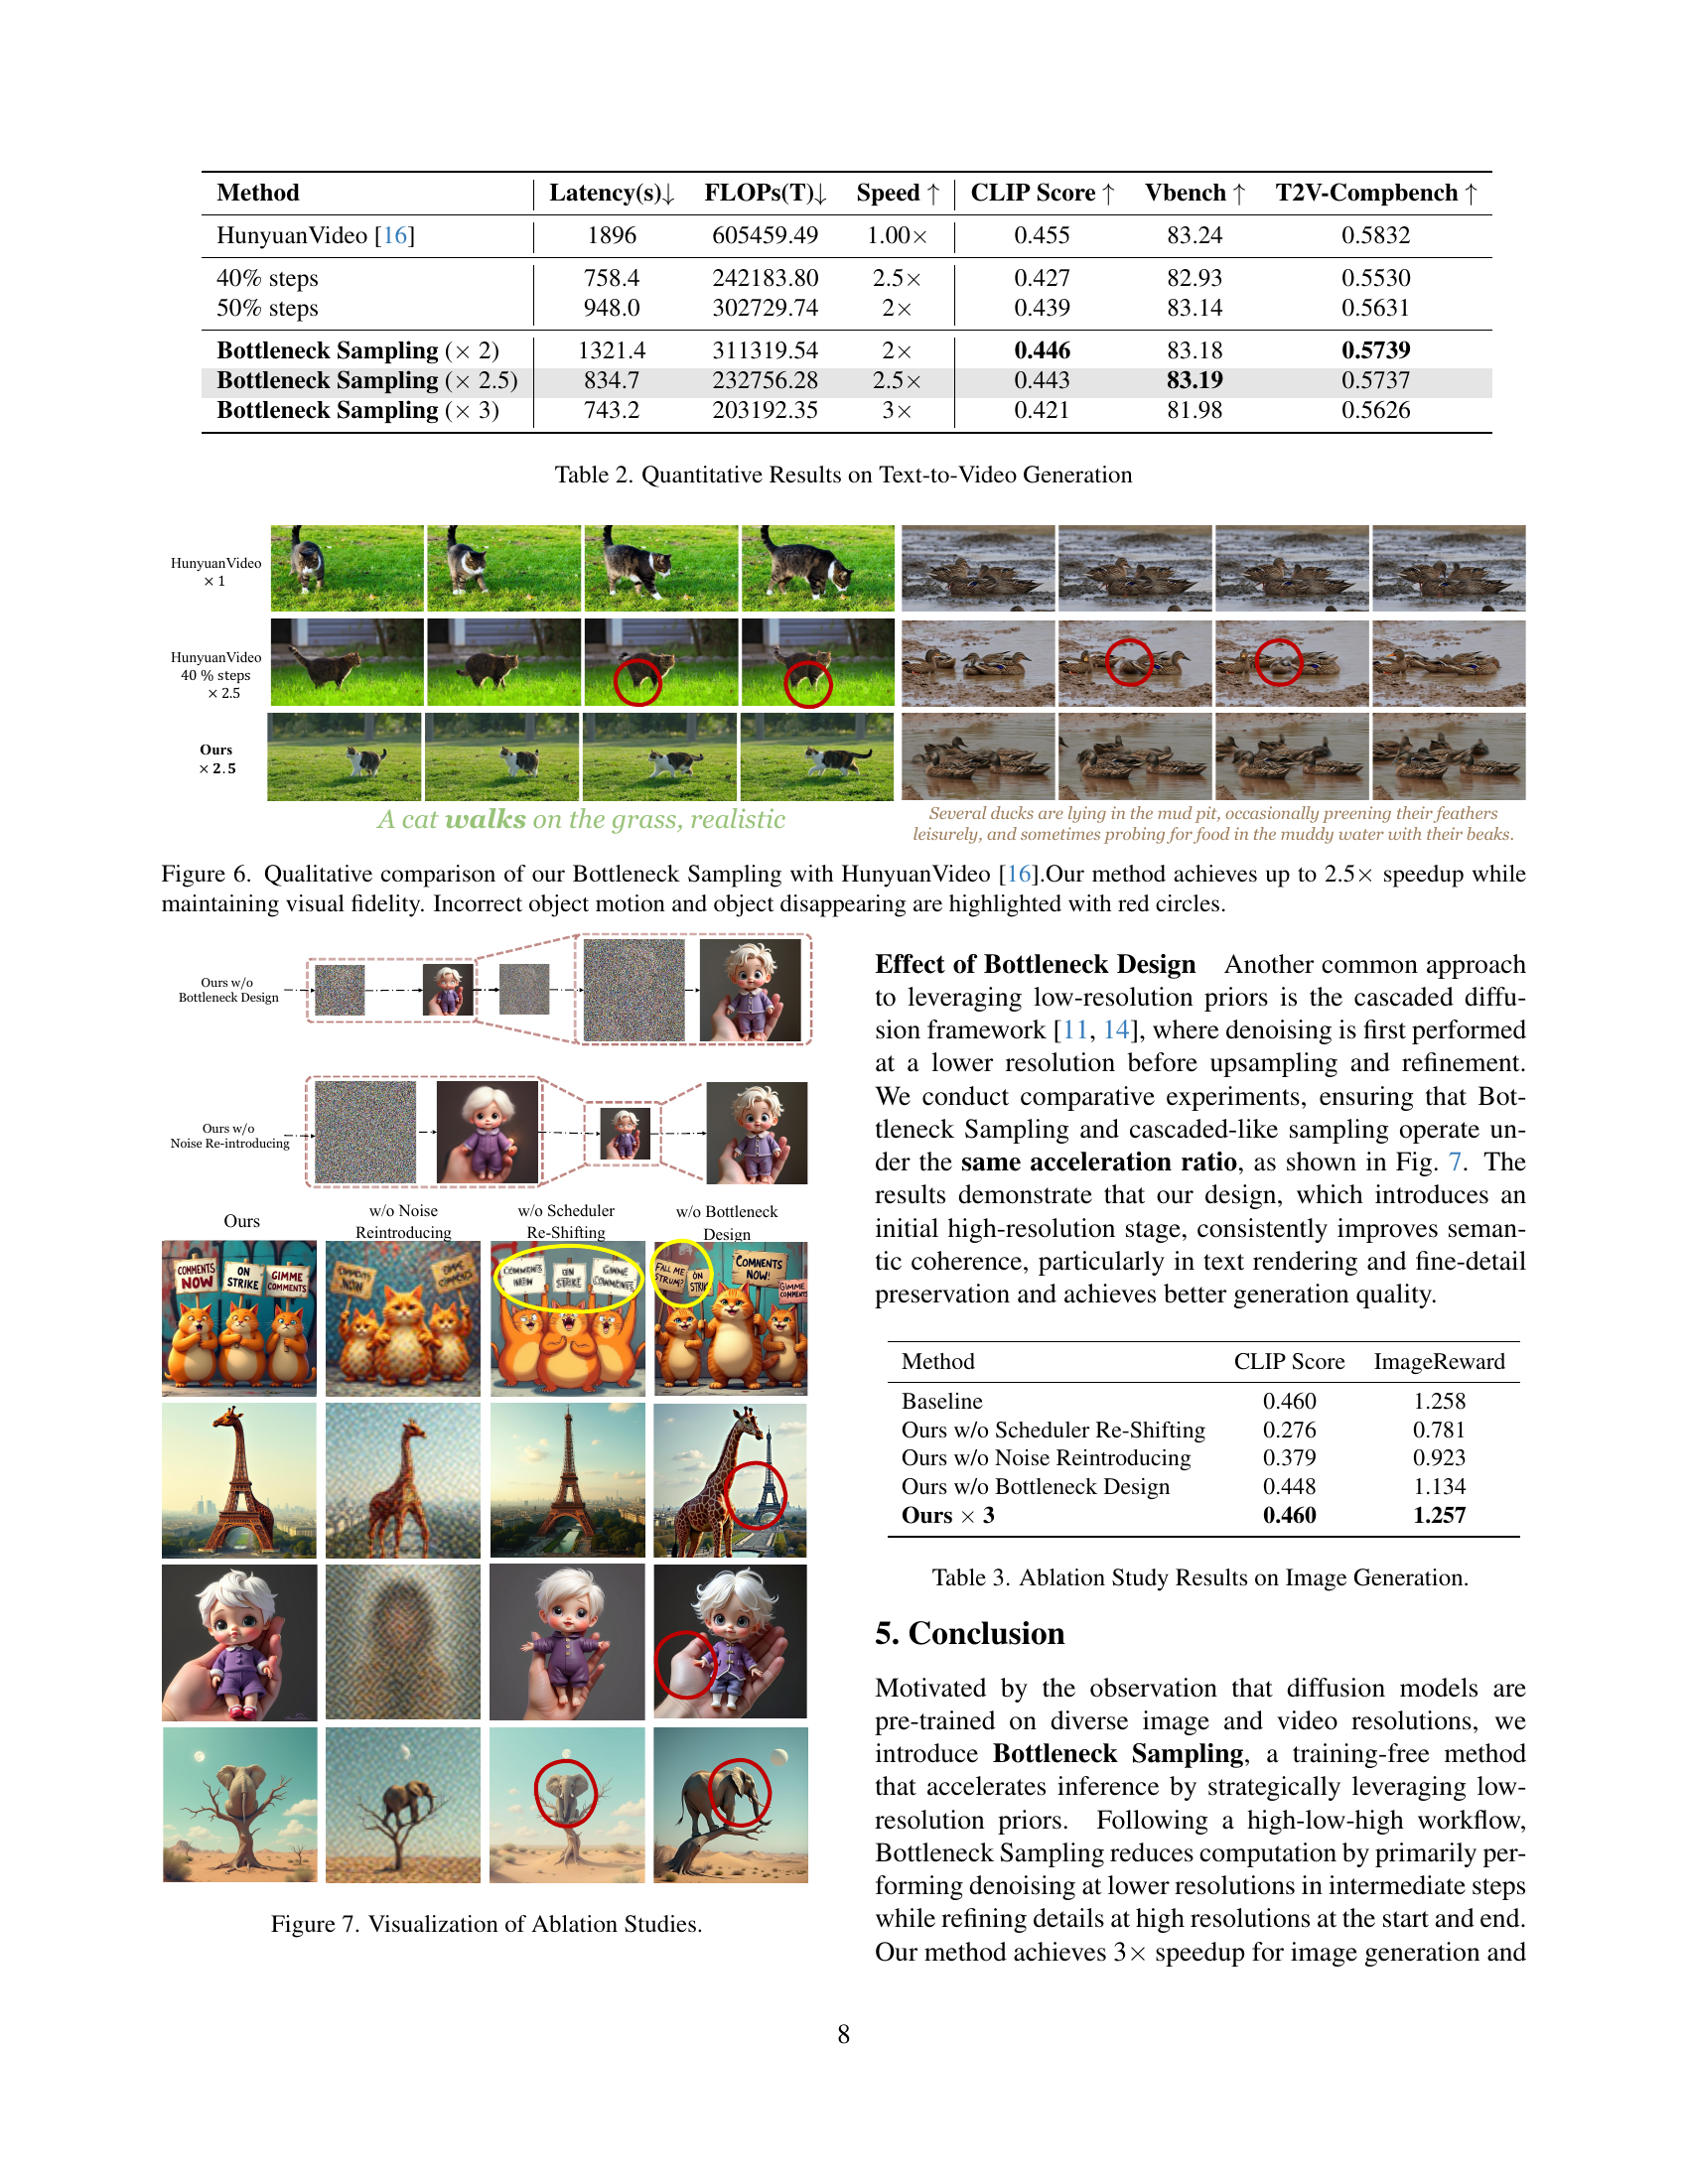
🔼 This figure visualizes the ablation study results for Bottleneck Sampling. It shows the impact of removing key components of the method, such as the bottleneck design, noise reintroduction at stage transitions, and scheduler re-shifting, on image generation quality. Each sub-figure presents examples from different ablation experiments showing changes in visual quality and comparing them to the full Bottleneck Sampling results. This allows readers to understand the contribution of each individual design choice in the overall performance of the method.
read the caption
Figure 7: Visualization of Ablation Studies.

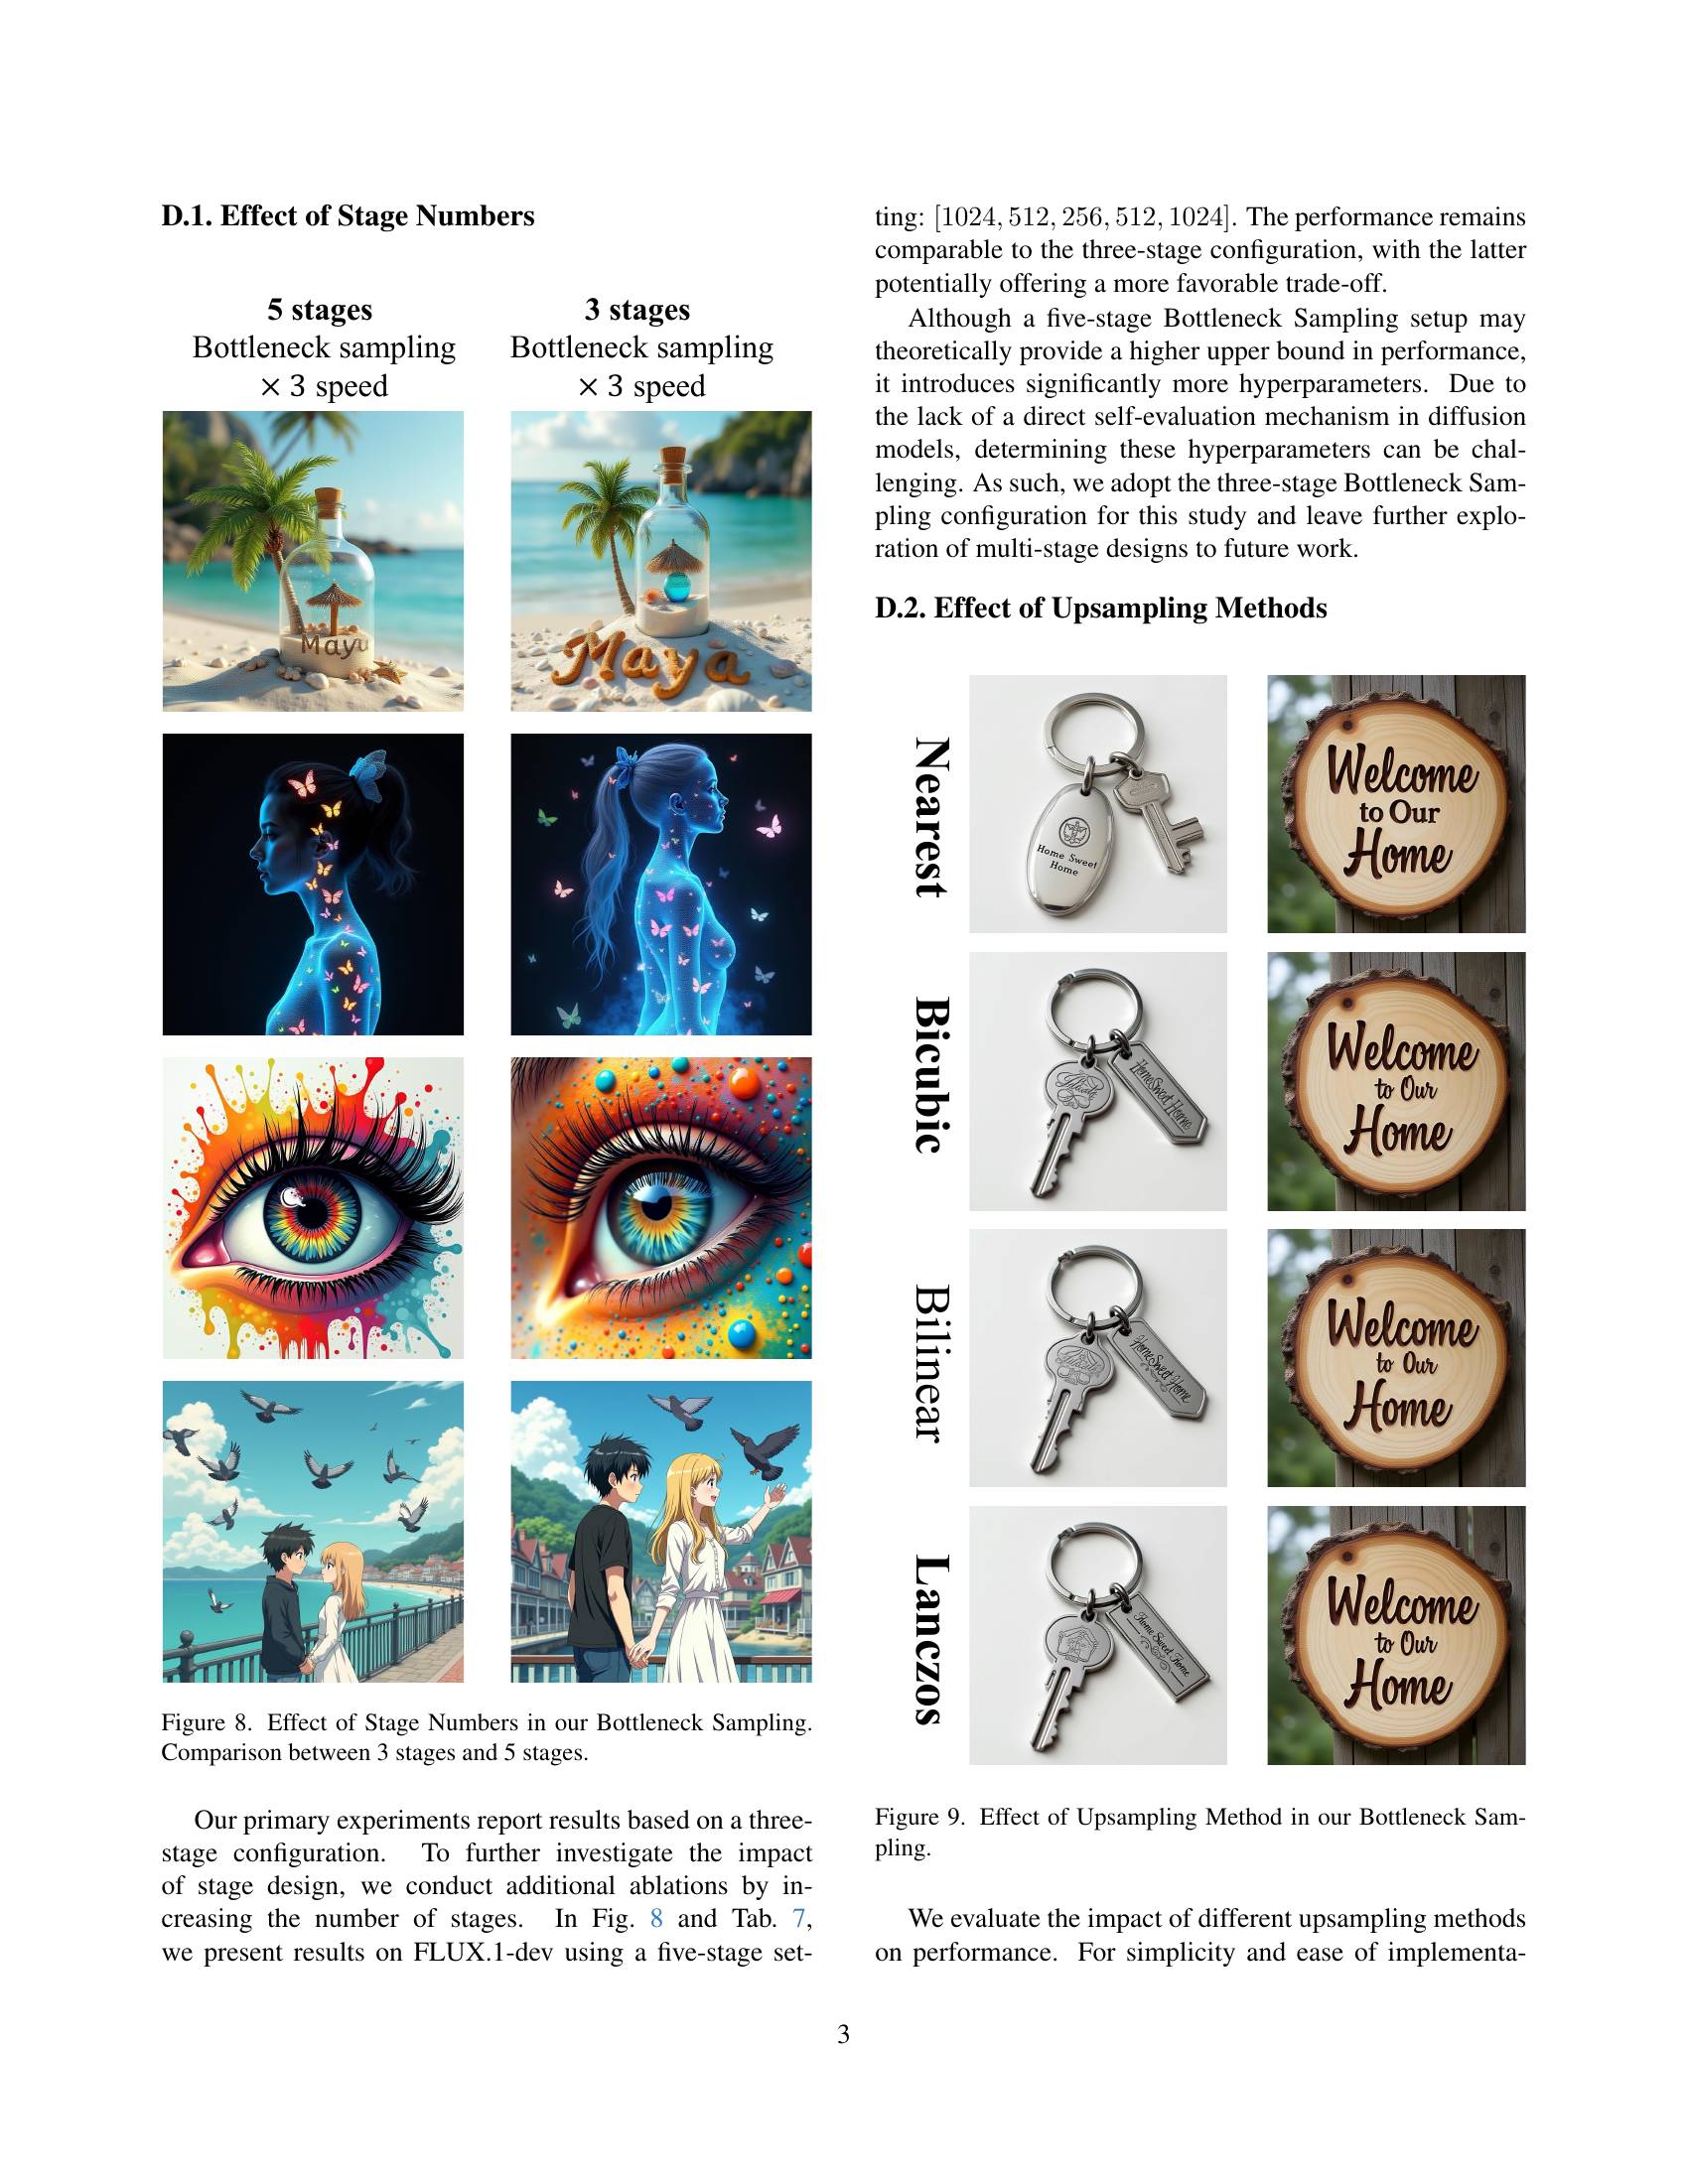
🔼 This figure compares the results of using 3 and 5 stages in the Bottleneck Sampling method. The Bottleneck Sampling method iteratively denoises an image at different resolutions, starting at a high resolution, moving to lower resolutions for efficiency, and finally returning to high resolution for detail refinement. This figure visually demonstrates how changing the number of stages affects the final image quality and potentially the computational cost. Different images are used to compare the results between using 3 and 5 stages of the method.
read the caption
Figure 8: Effect of Stage Numbers in our Bottleneck Sampling. Comparison between 3 stages and 5 stages.

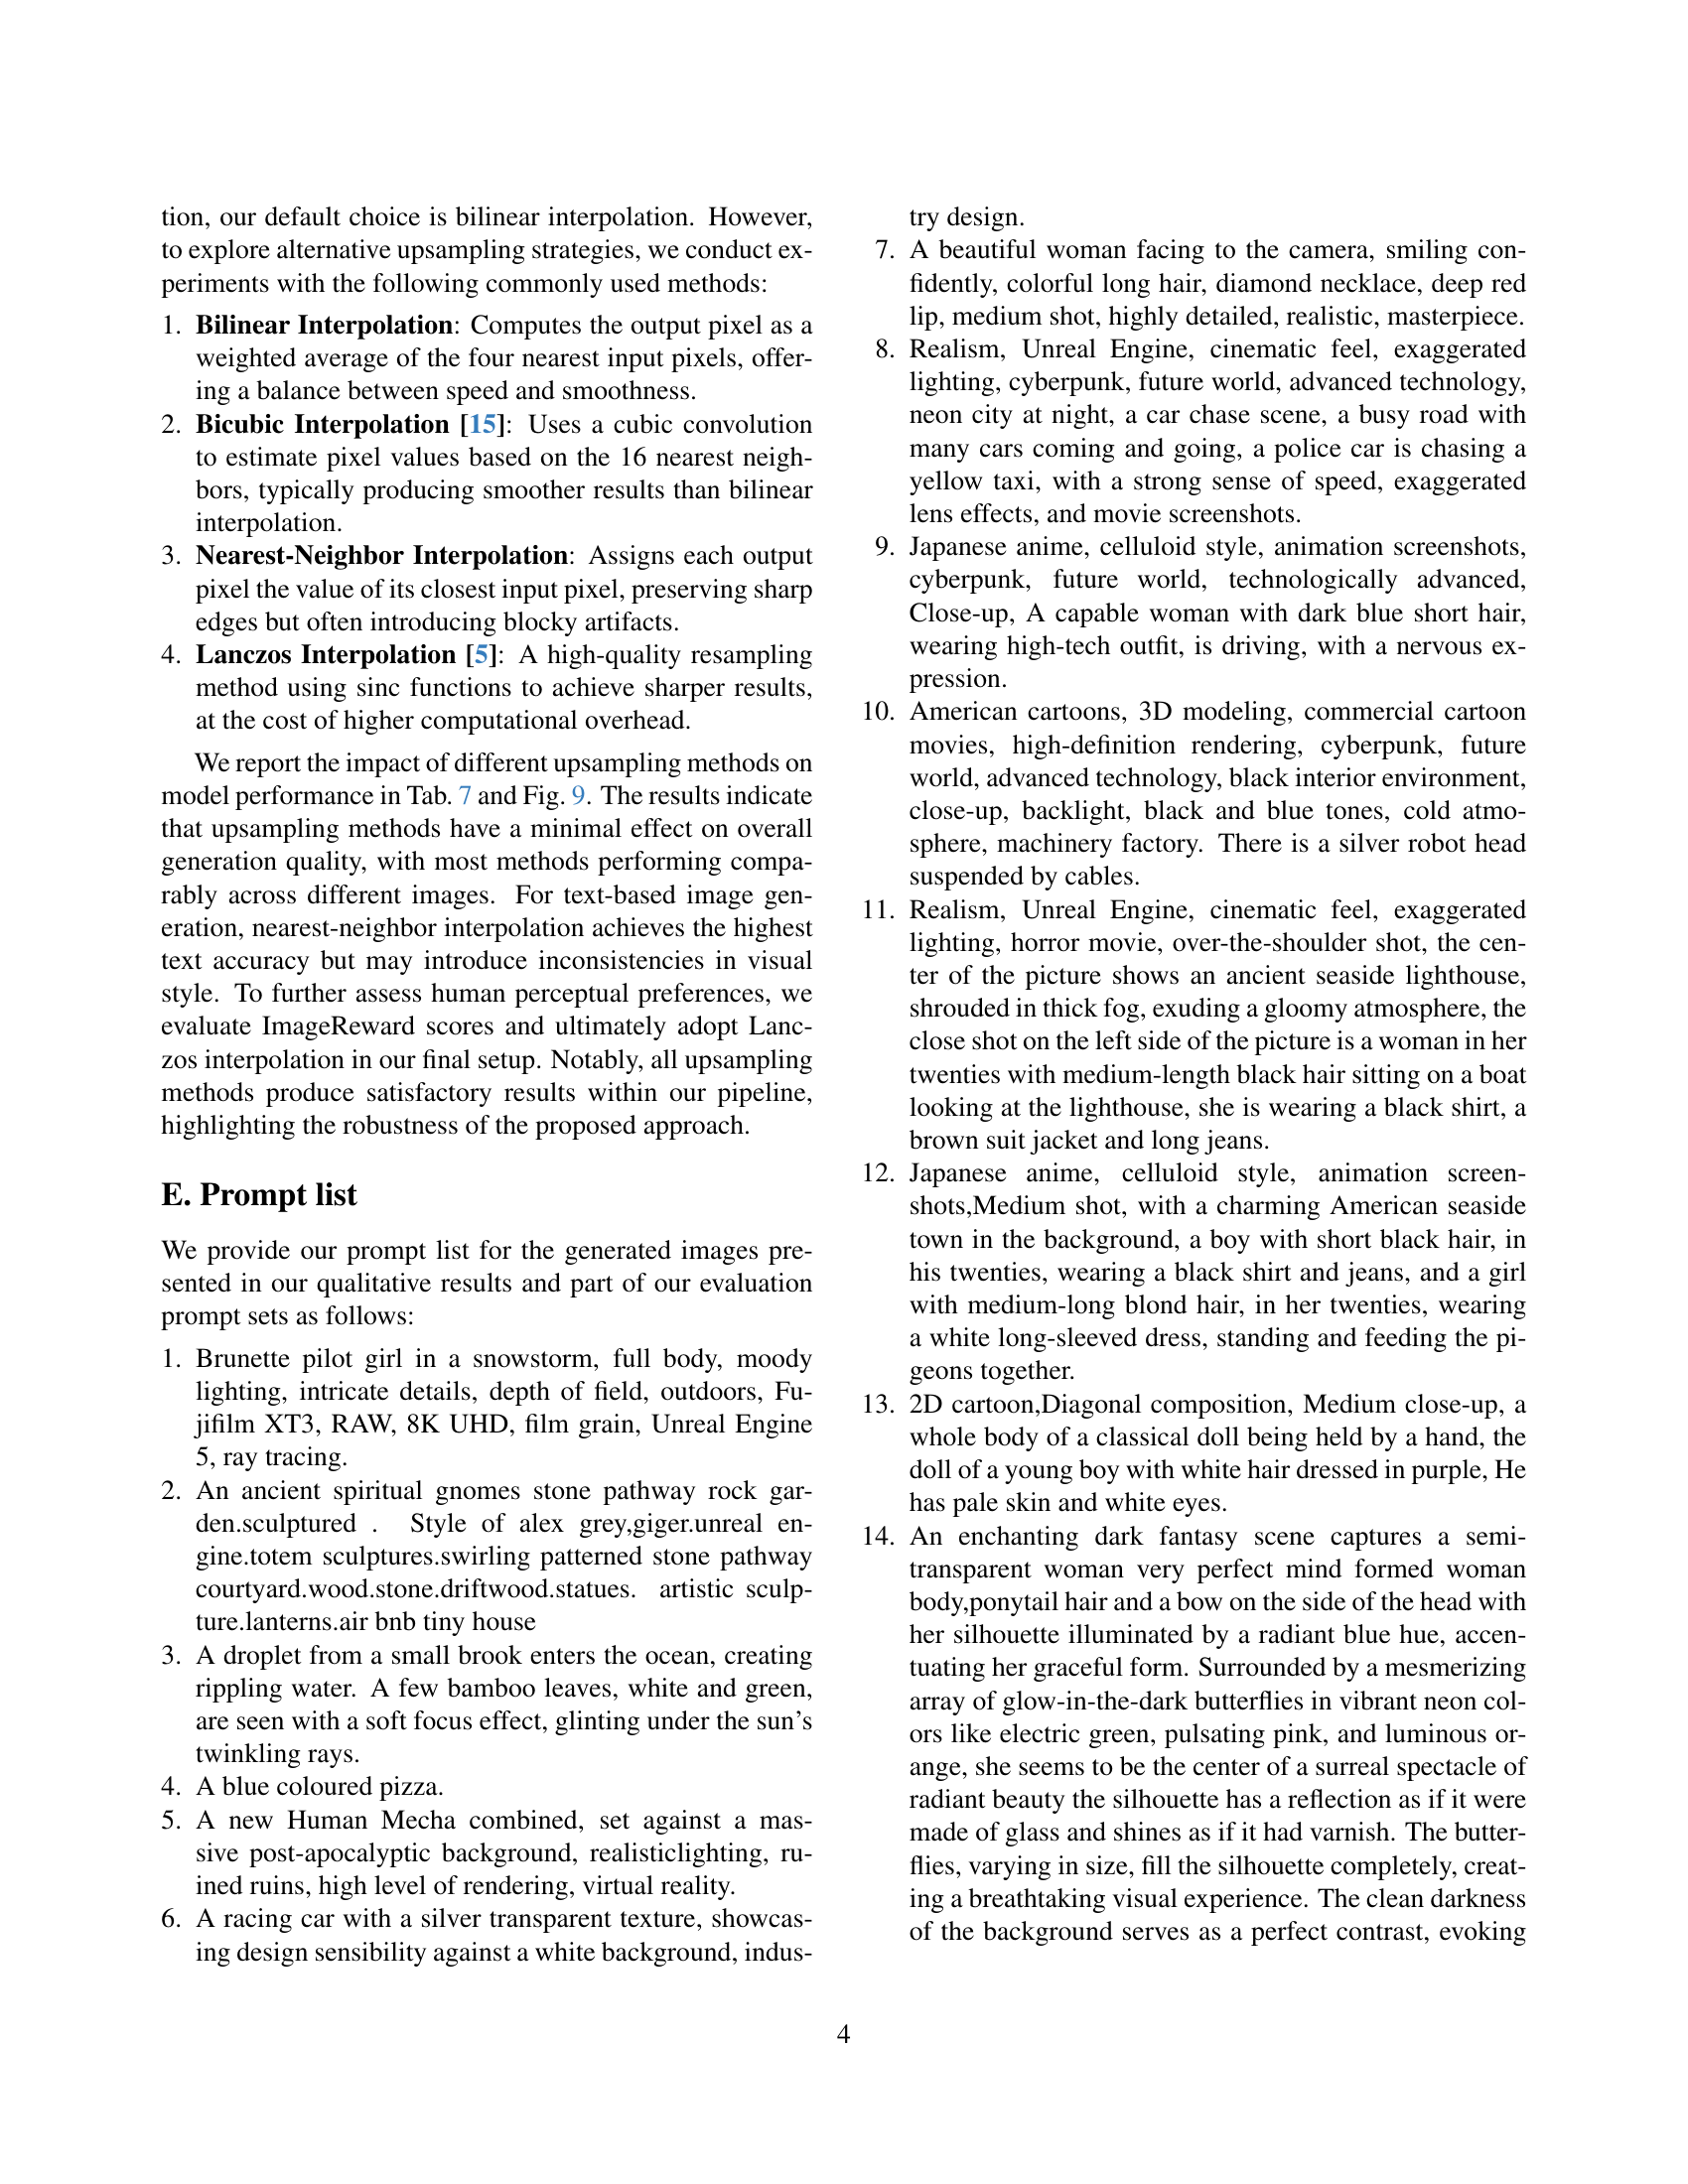
🔼 This figure shows the results of an ablation study on the effect of different upsampling methods within the Bottleneck Sampling framework. Four methods are compared: nearest-neighbor, bilinear, bicubic, and Lanczos interpolation. The goal was to determine which upsampling technique produced the best results in terms of image quality and speed while maintaining the overall efficiency and fidelity of the Bottleneck Sampling method. Visual examples are included to illustrate the differences in the quality of the generated images produced by the various upsampling methods.
read the caption
Figure 9: Effect of Upsampling Method in our Bottleneck Sampling.

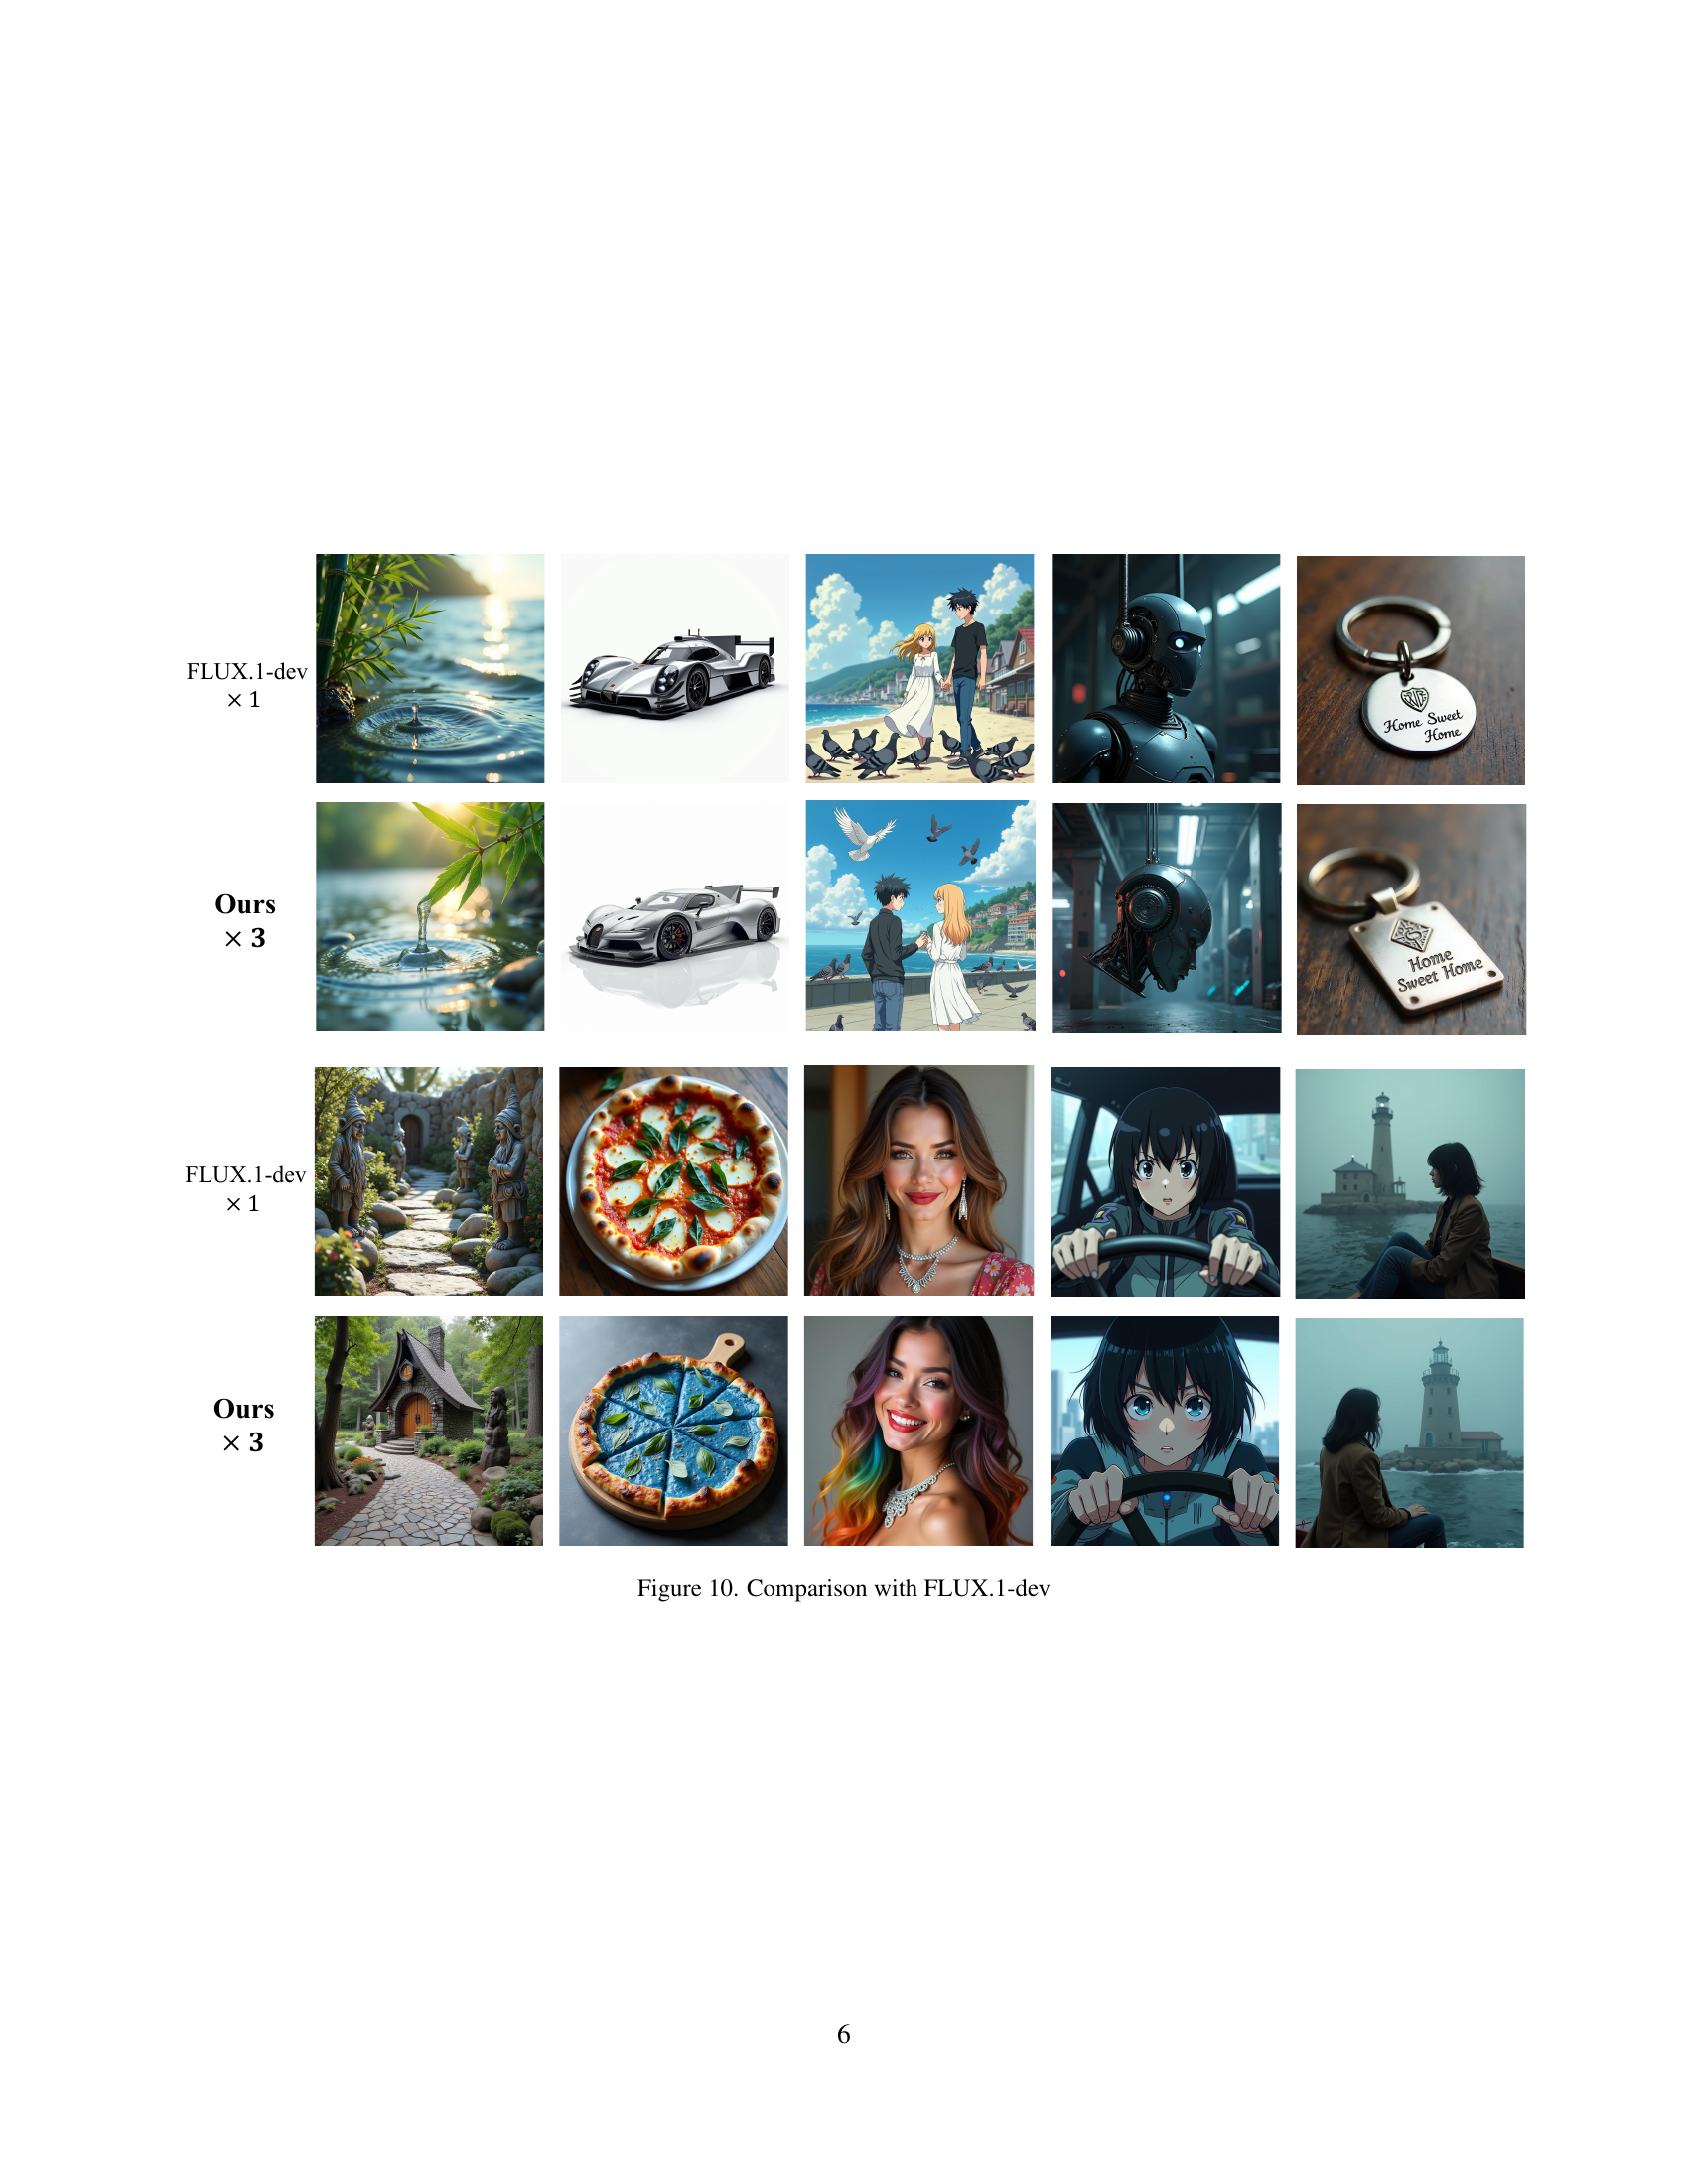
🔼 This figure displays a qualitative comparison of image generation results between the FLUX.1-dev model and the proposed Bottleneck Sampling method. It visually demonstrates the effectiveness of Bottleneck Sampling. For each of several different prompts (e.g., a racing car, a cartoon eye, an anime scene, etc.), FLUX.1-dev’s output is shown side-by-side with the Bottleneck Sampling output. The visual comparison showcases how the latter achieves comparable image quality at a significantly faster speed.
read the caption
Figure 10: Comparison with FLUX.1-dev

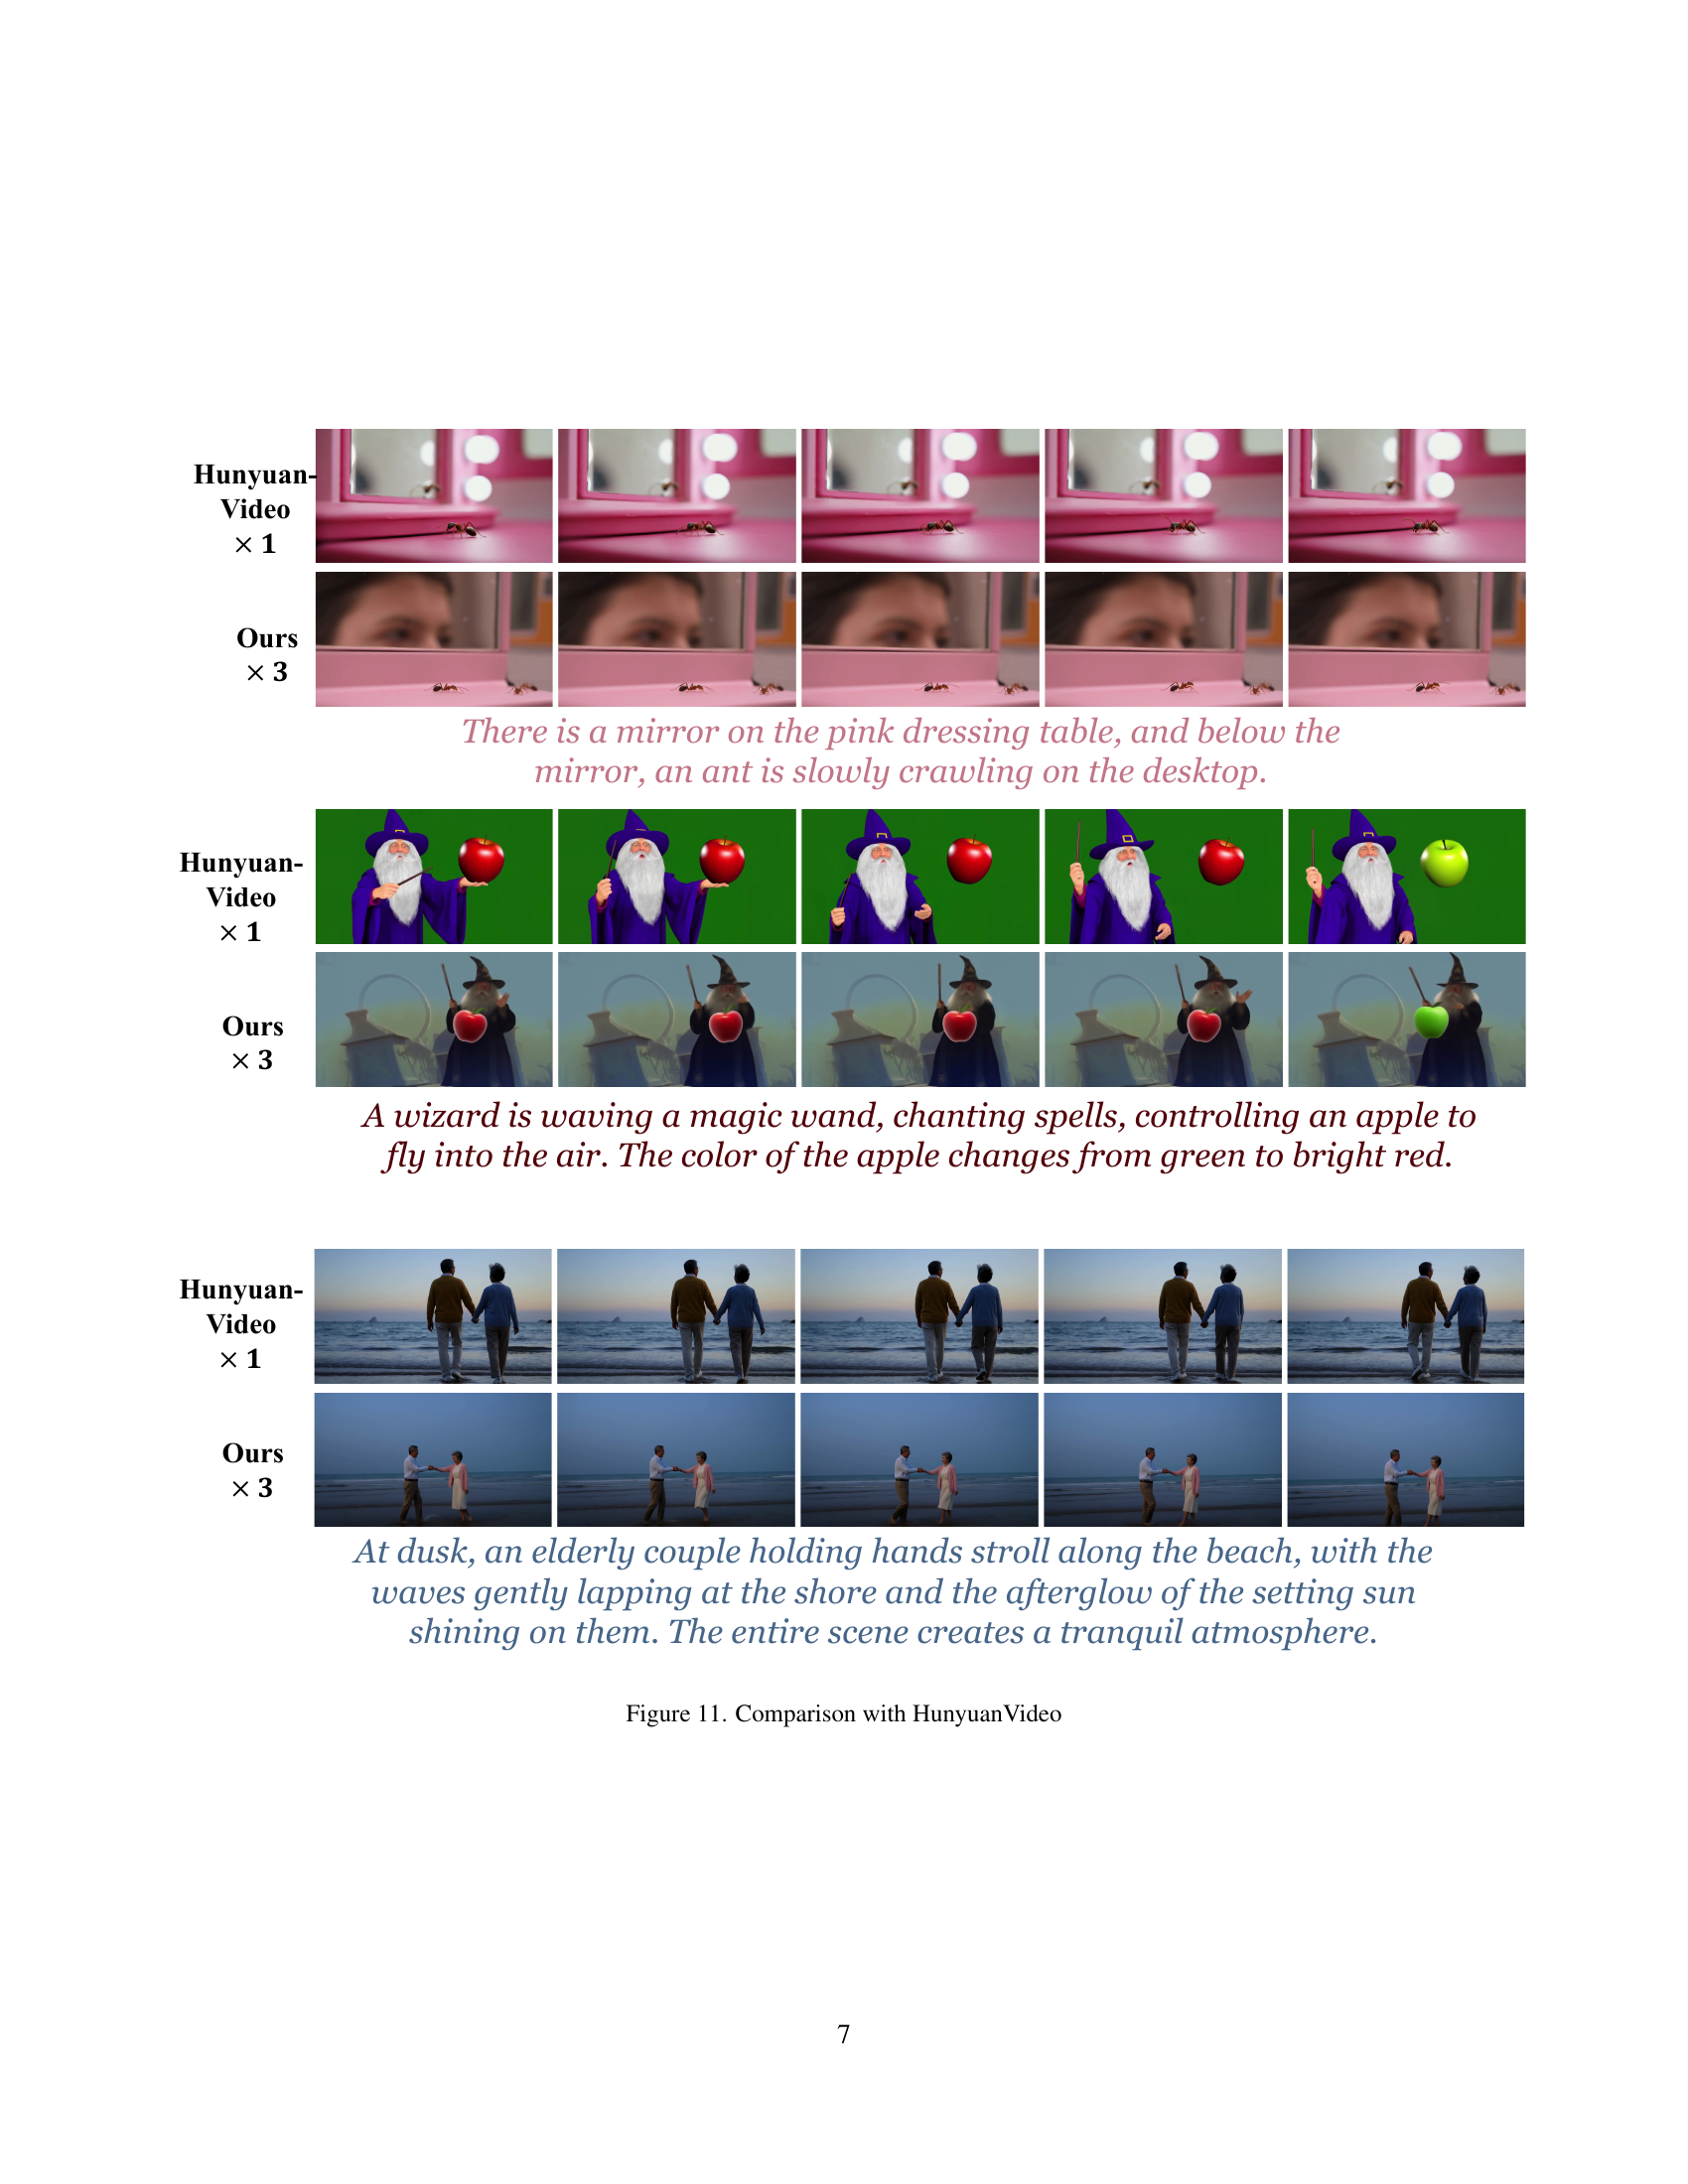
🔼 This figure displays a qualitative comparison of video generation results between the HunyuanVideo baseline model and the proposed Bottleneck Sampling method. Three different video generation scenarios are presented, with each scenario showing a sequence of frames generated by both models. The goal is to visually demonstrate that Bottleneck Sampling maintains comparable video quality to the baseline while offering significant speed improvements.
read the caption
Figure 11: Comparison with HunyuanVideo
More on tables
| Method | Latency(s) | FLOPs(T) | Speed | CLIP Score | Vbench | T2V-Compbench |
| HunyuanVideo [16] | 1896 | 605459.49 | 1.00 | 0.455 | 83.24 | 0.5832 |
| 40% steps | 758.4 | 242183.80 | 2.5 | 0.427 | 82.93 | 0.5530 |
| 50% steps | 948.0 | 302729.74 | 2 | 0.439 | 83.14 | 0.5631 |
| Bottleneck Sampling ( 2) | 1321.4 | 311319.54 | 2 | 0.446 | 83.18 | 0.5739 |
| Bottleneck Sampling ( 2.5) | 834.7 | 232756.28 | 2.5 | 0.443 | 83.19 | 0.5737 |
| Bottleneck Sampling ( 3) | 743.2 | 203192.35 | 3 | 0.421 | 81.98 | 0.5626 |
🔼 This table presents a quantitative comparison of video generation performance between the baseline Hunyuan Video model and the proposed Bottleneck Sampling method. It shows the latency (in seconds), FLOPs (in trillions), speedup factor (relative to the baseline), and scores on several metrics: CLIP Score (evaluating the alignment between generated videos and text prompts), Vbench (overall video quality), and T2V-Compbench (compositional quality). Different configurations of Bottleneck Sampling with varying speedup factors are compared to highlight the trade-off between efficiency and quality.
read the caption
Table 2: Quantitative Results on Text-to-Video Generation
| Method | CLIP Score | ImageReward |
| Baseline | 0.460 | 1.258 |
| Ours w/o Scheduler Re-Shifting | 0.276 | 0.781 |
| Ours w/o Noise Reintroducing | 0.379 | 0.923 |
| Ours w/o Bottleneck Design | 0.448 | 1.134 |
| Ours 3 | 0.460 | 1.257 |
🔼 This table presents the results of an ablation study conducted on image generation using the Bottleneck Sampling method. It shows the impact of removing key components of the proposed method, such as the scheduler re-shifting and noise reintroducing, and also shows the impact of removing the bottleneck design entirely. The results are evaluated using two metrics: CLIP Score and ImageReward, which assess the alignment between generated content and textual prompts and the overall quality of the image respectively. The table allows for a quantitative comparison of the performance with and without different components of the Bottleneck Sampling method, helping to determine their individual contributions to the overall improvement.
read the caption
Table 3: Ablation Study Results on Image Generation.
| Baseline | |
| height | |
| width | |
| number of inference steps | |
| shifting | |
| Bottleneck Sampling | |
| stage | 3 |
| height list | |
| width list | |
| Noise Reintroducing | |
| strength list | |
| number of inference steps | |
| Scheduler Re-Shifting | |
| shifting list |
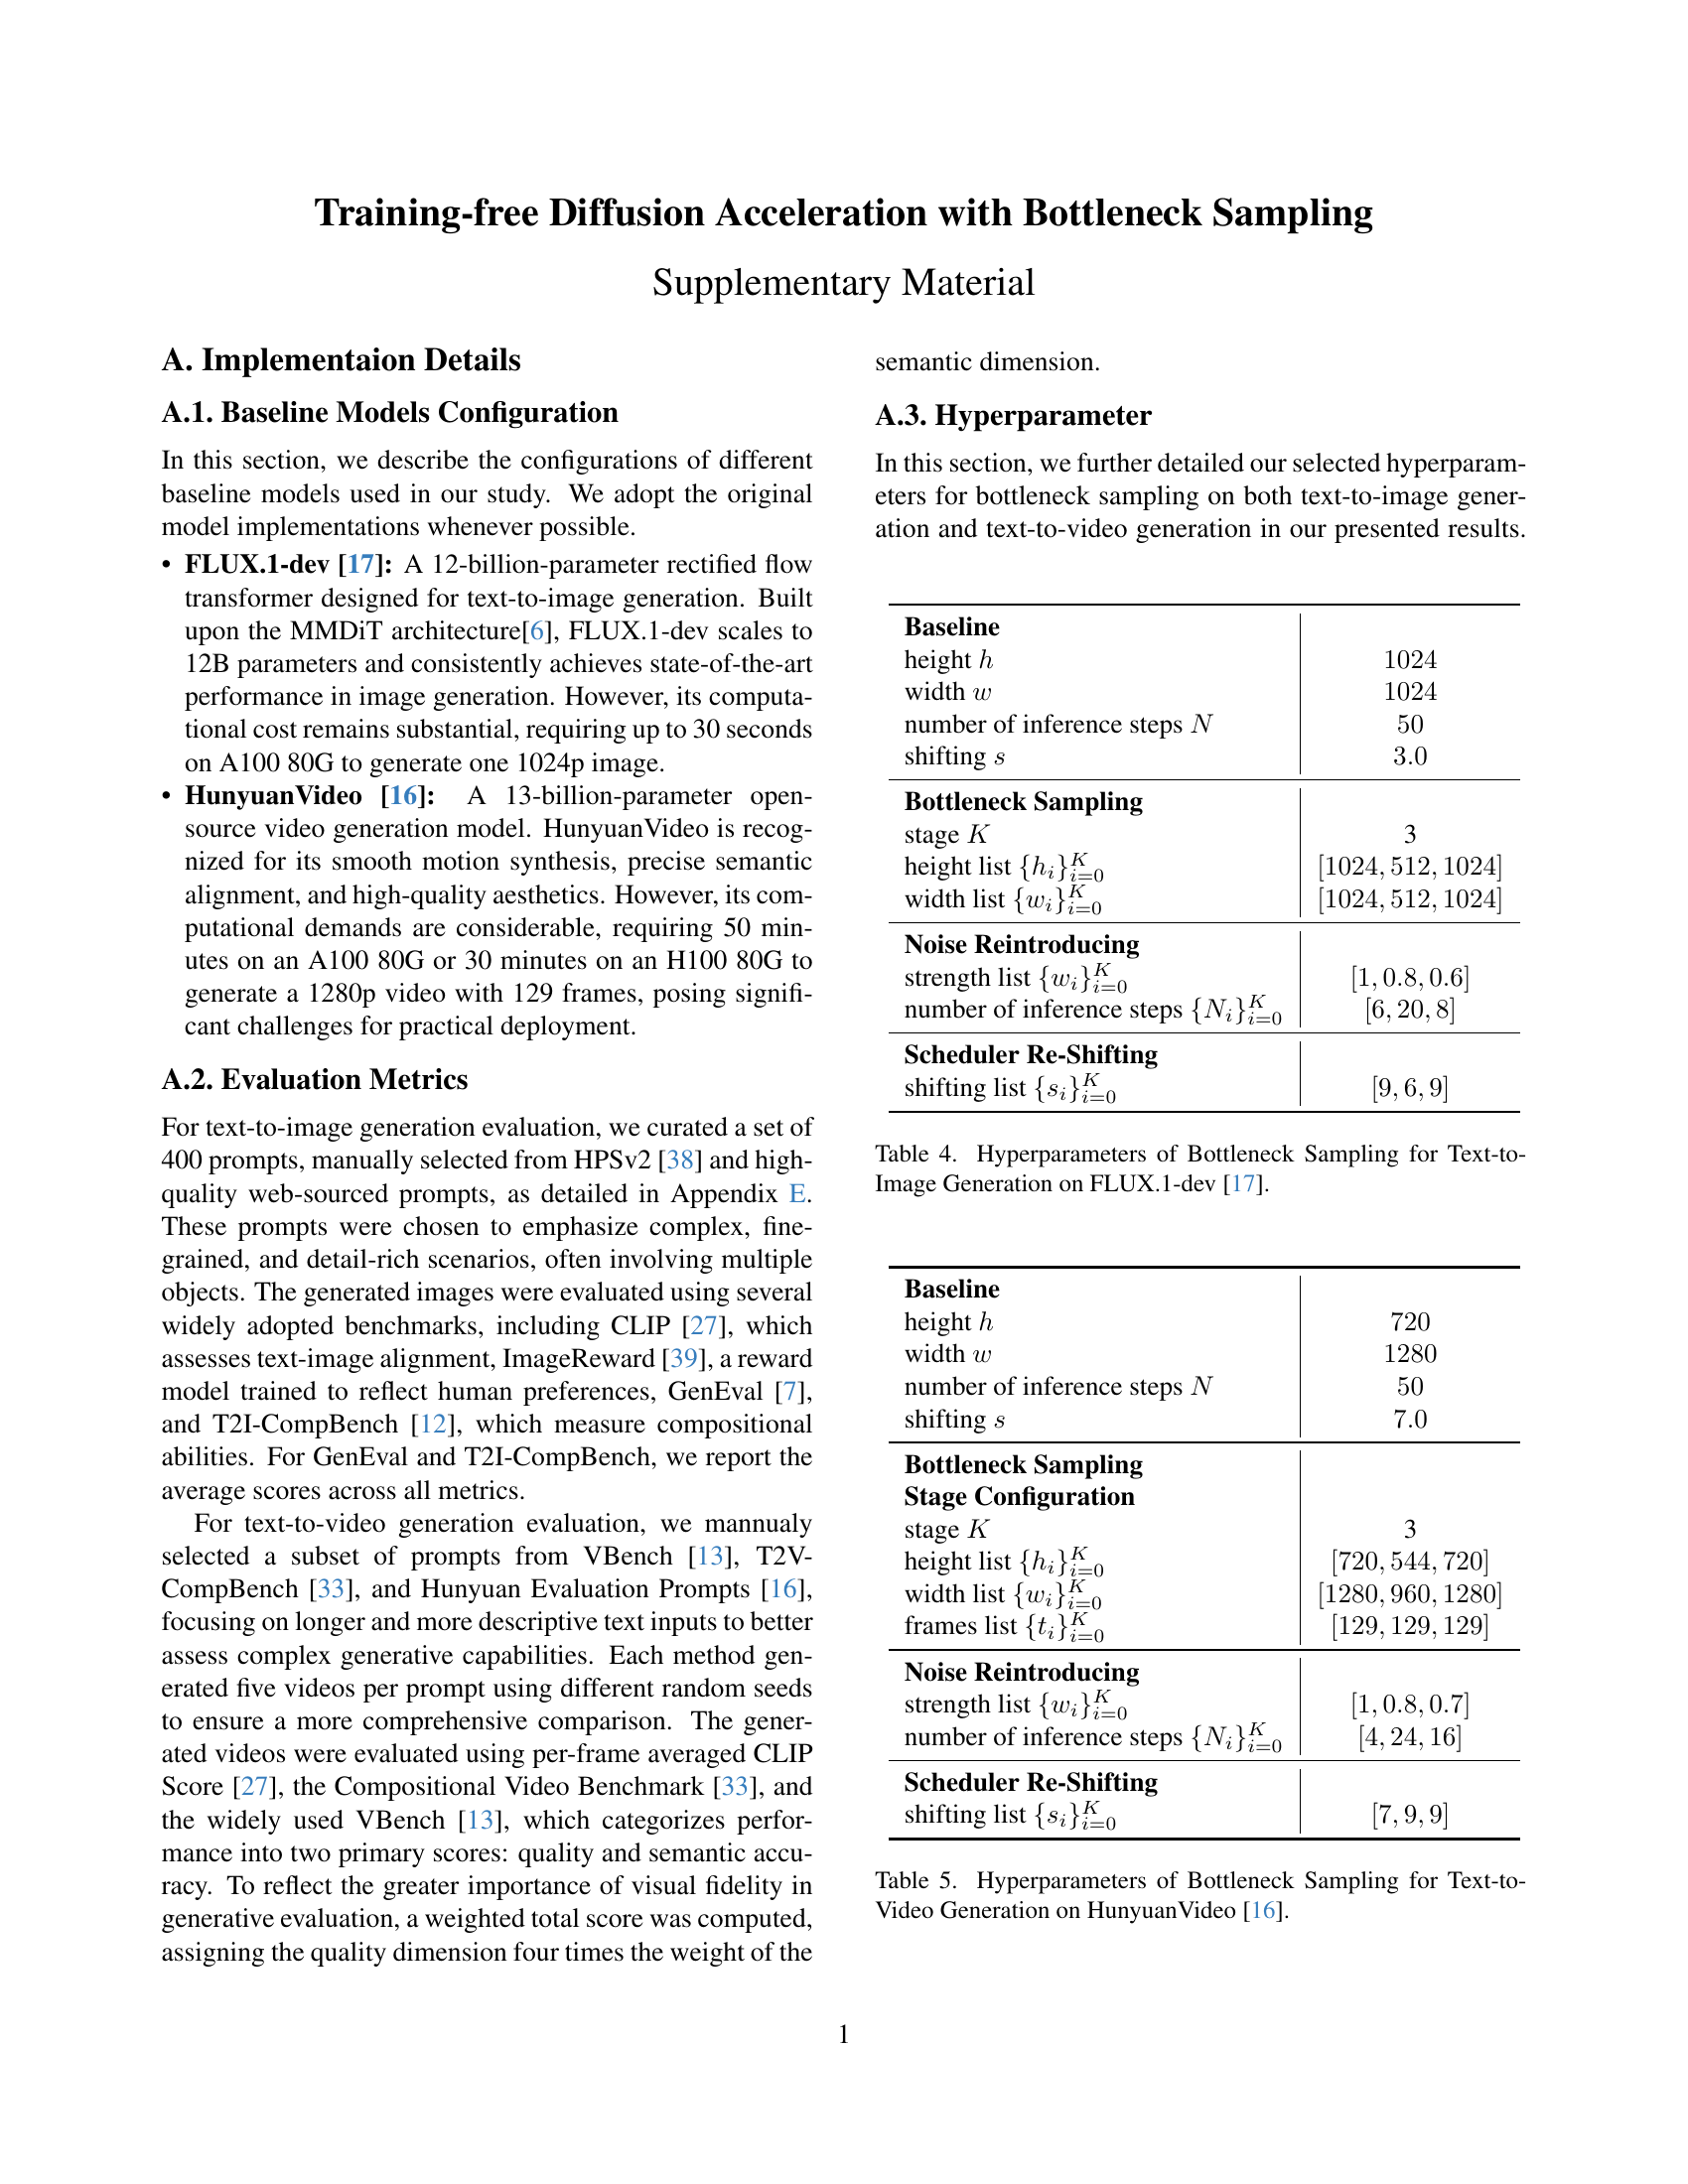
🔼 This table details the hyperparameters used in the Bottleneck Sampling method for text-to-image generation experiments using the FLUX.1-dev model. It lists the values for various parameters including the number of stages in the sampling process, the image resolution at each stage, the strength of noise reintroduction at stage transitions, the number of denoising steps at each stage, and the shifting factors applied to the scheduling process.
read the caption
Table 4: Hyperparameters of Bottleneck Sampling for Text-to-Image Generation on FLUX.1-dev [17].
| Baseline | |
| height | |
| width | |
| number of inference steps | |
| shifting | |
| Bottleneck Sampling | |
| Stage Configuration | |
| stage | 3 |
| height list | |
| width list | |
| frames list | |
| Noise Reintroducing | |
| strength list | |
| number of inference steps | |
| Scheduler Re-Shifting | |
| shifting list |
🔼 This table details the hyperparameters used in the Bottleneck Sampling method for text-to-video generation experiments conducted using the HunyuanVideo model. It outlines the configuration for a three-stage process (stage K=3), specifying resolutions (height and width), the number of inference steps within each stage, the noise reintroduction strength at each stage transition, and the schedule shifting factors used to adjust denoising timesteps.
read the caption
Table 5: Hyperparameters of Bottleneck Sampling for Text-to-Video Generation on HunyuanVideo [16].
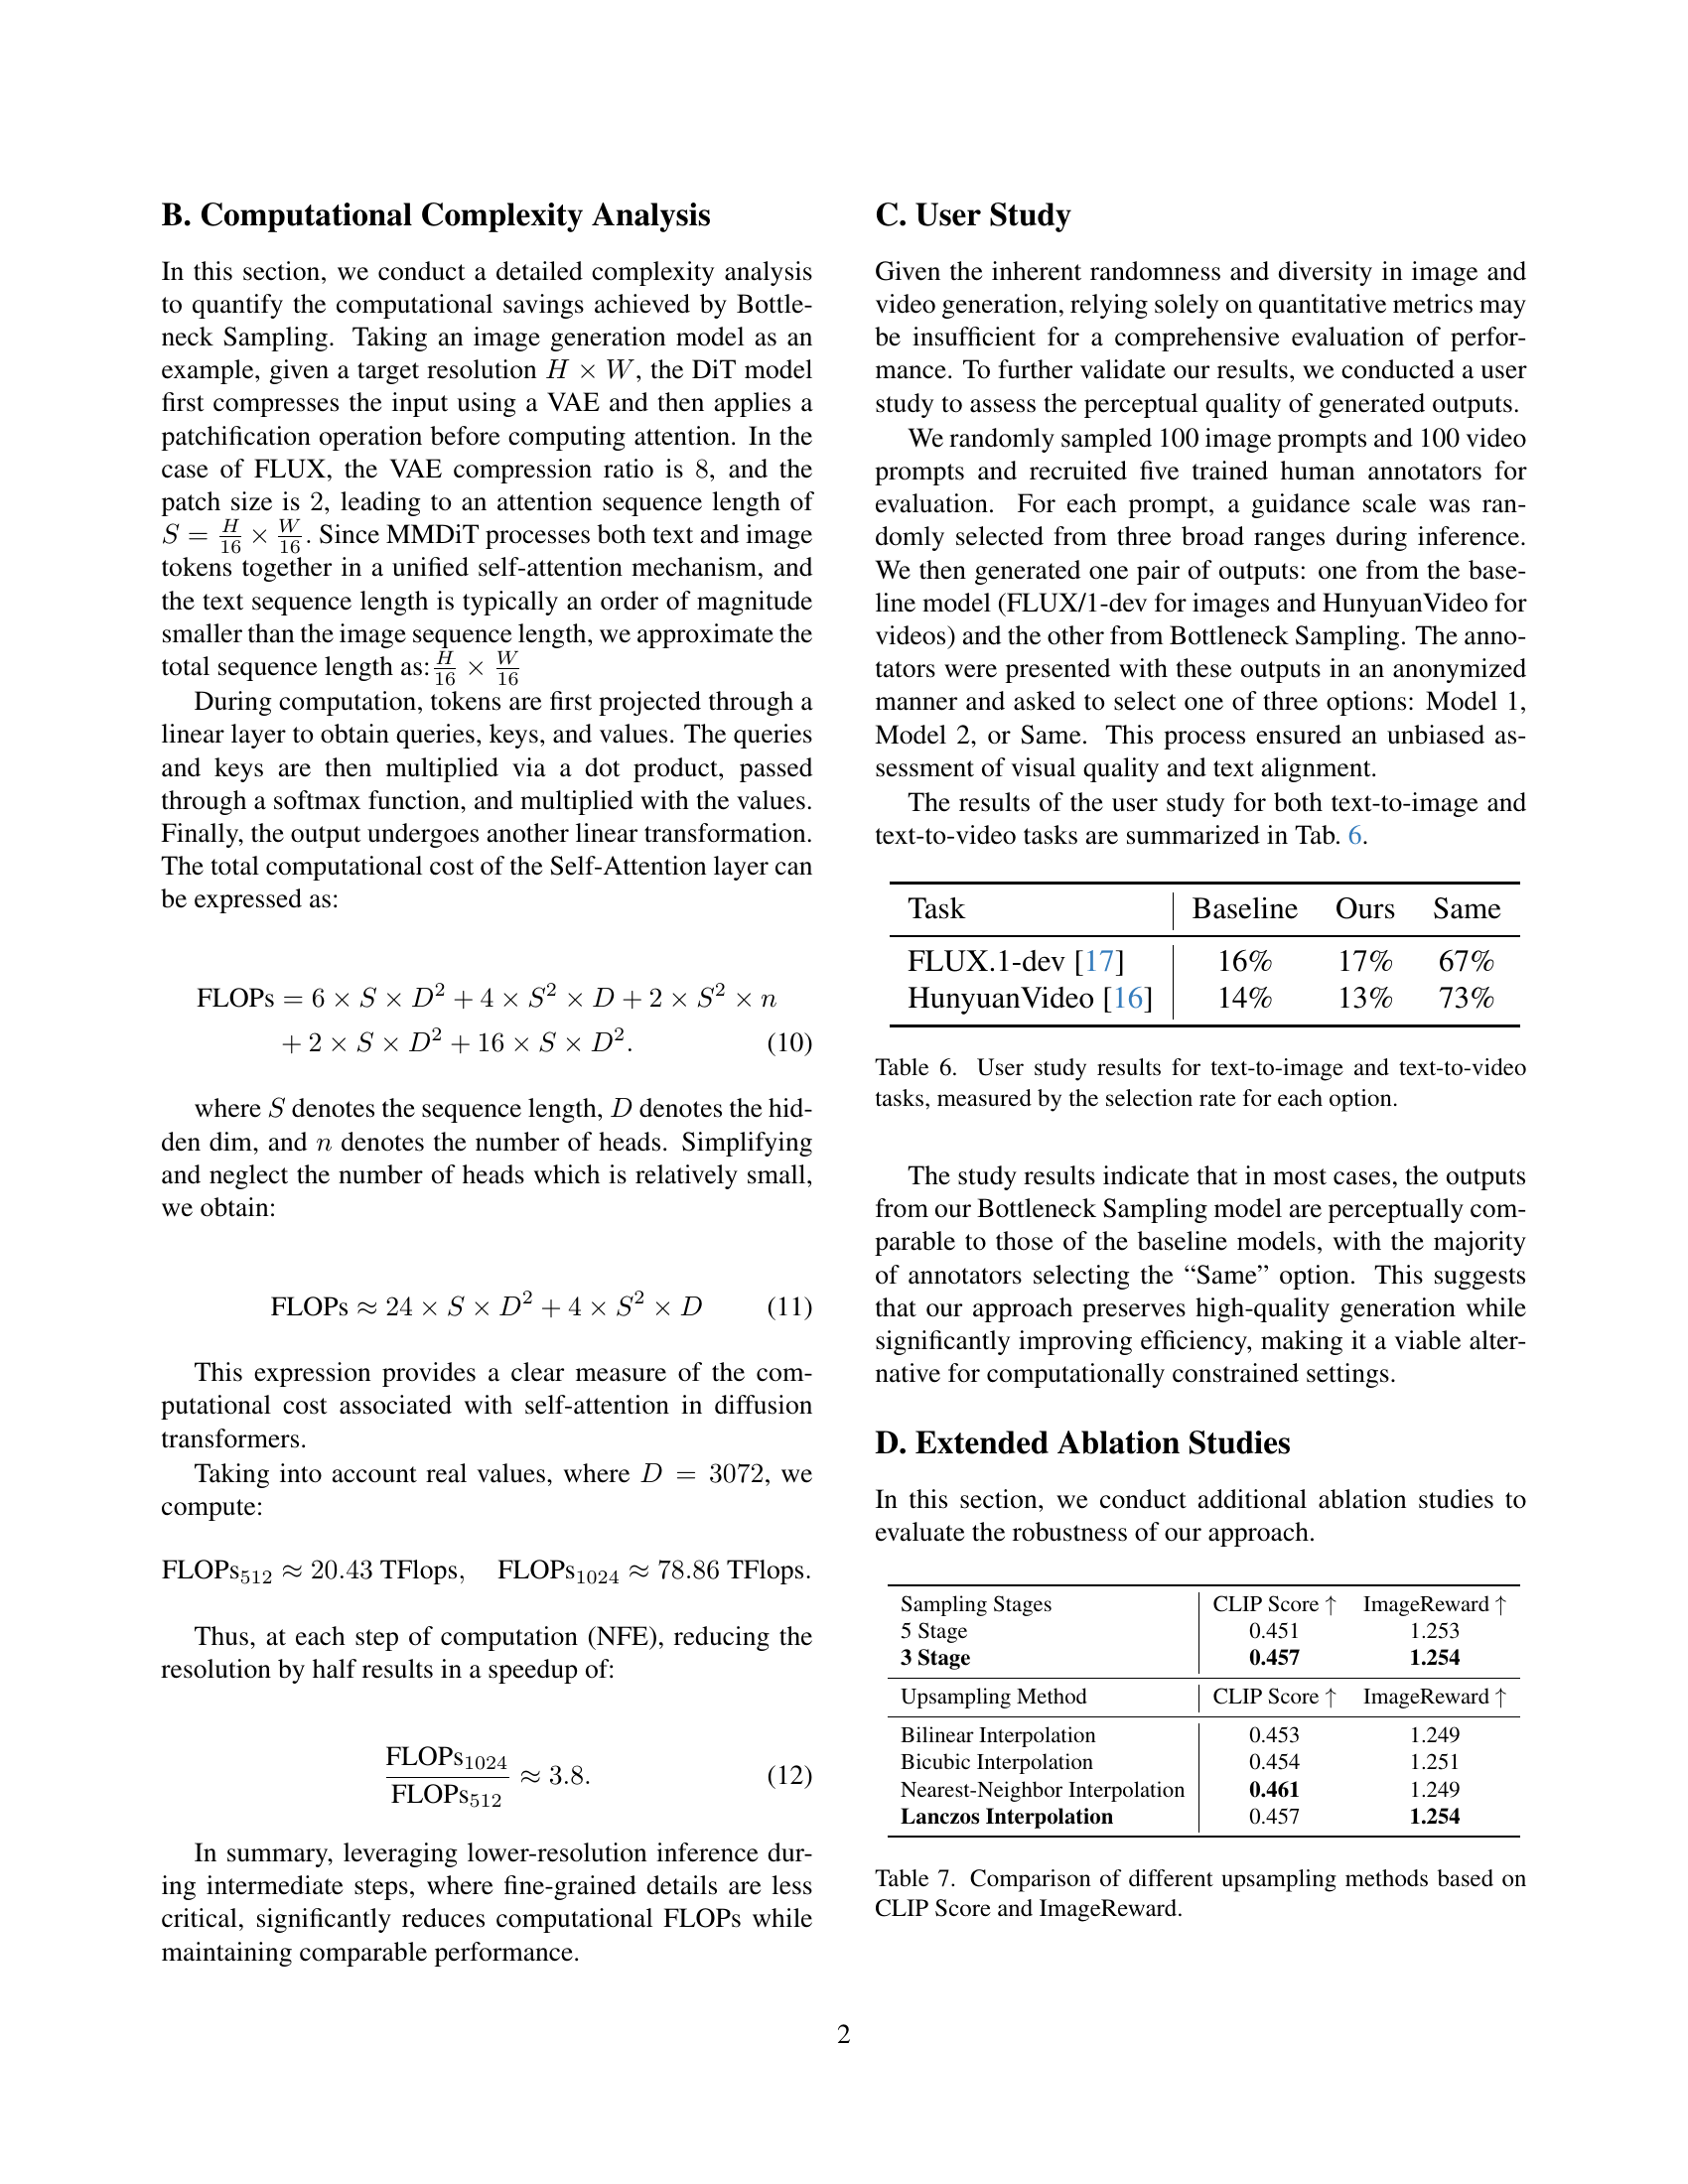
🔼 This table presents the results of a user study designed to evaluate the perceptual quality of images and videos generated by the proposed Bottleneck Sampling method compared to a baseline model. The study involved human annotators who were shown pairs of outputs, one from the baseline model and one from Bottleneck Sampling, for various prompts. For each pair, annotators were asked to select one of three options: indicating the baseline model as better, the Bottleneck Sampling model as better, or that both are of equal quality. The table shows the percentage of times each option was selected for both image and video generation tasks.
read the caption
Table 6: User study results for text-to-image and text-to-video tasks, measured by the selection rate for each option.
| Sampling Stages | CLIP Score | ImageReward |
| 5 Stage | 0.451 | 1.253 |
| 3 Stage | 0.457 | 1.254 |
| Upsampling Method | CLIP Score | ImageReward |
| Bilinear Interpolation | 0.453 | 1.249 |
| Bicubic Interpolation | 0.454 | 1.251 |
| Nearest-Neighbor Interpolation | 0.461 | 1.249 |
| Lanczos Interpolation | 0.457 | 1.254 |
🔼 This table presents the results of an ablation study comparing the impact of different upsampling methods on the quality of images generated using Bottleneck Sampling. The methods compared are bilinear interpolation, bicubic interpolation, nearest-neighbor interpolation, and Lanczos interpolation. The evaluation metrics used are CLIP Score and ImageReward, which assess the alignment between generated images and text prompts and reflect human preferences respectively. The table helps to determine the best upsampling approach for use within the Bottleneck Sampling framework, balancing quality and efficiency.
read the caption
Table 7: Comparison of different upsampling methods based on CLIP Score and ImageReward.
Full paper#