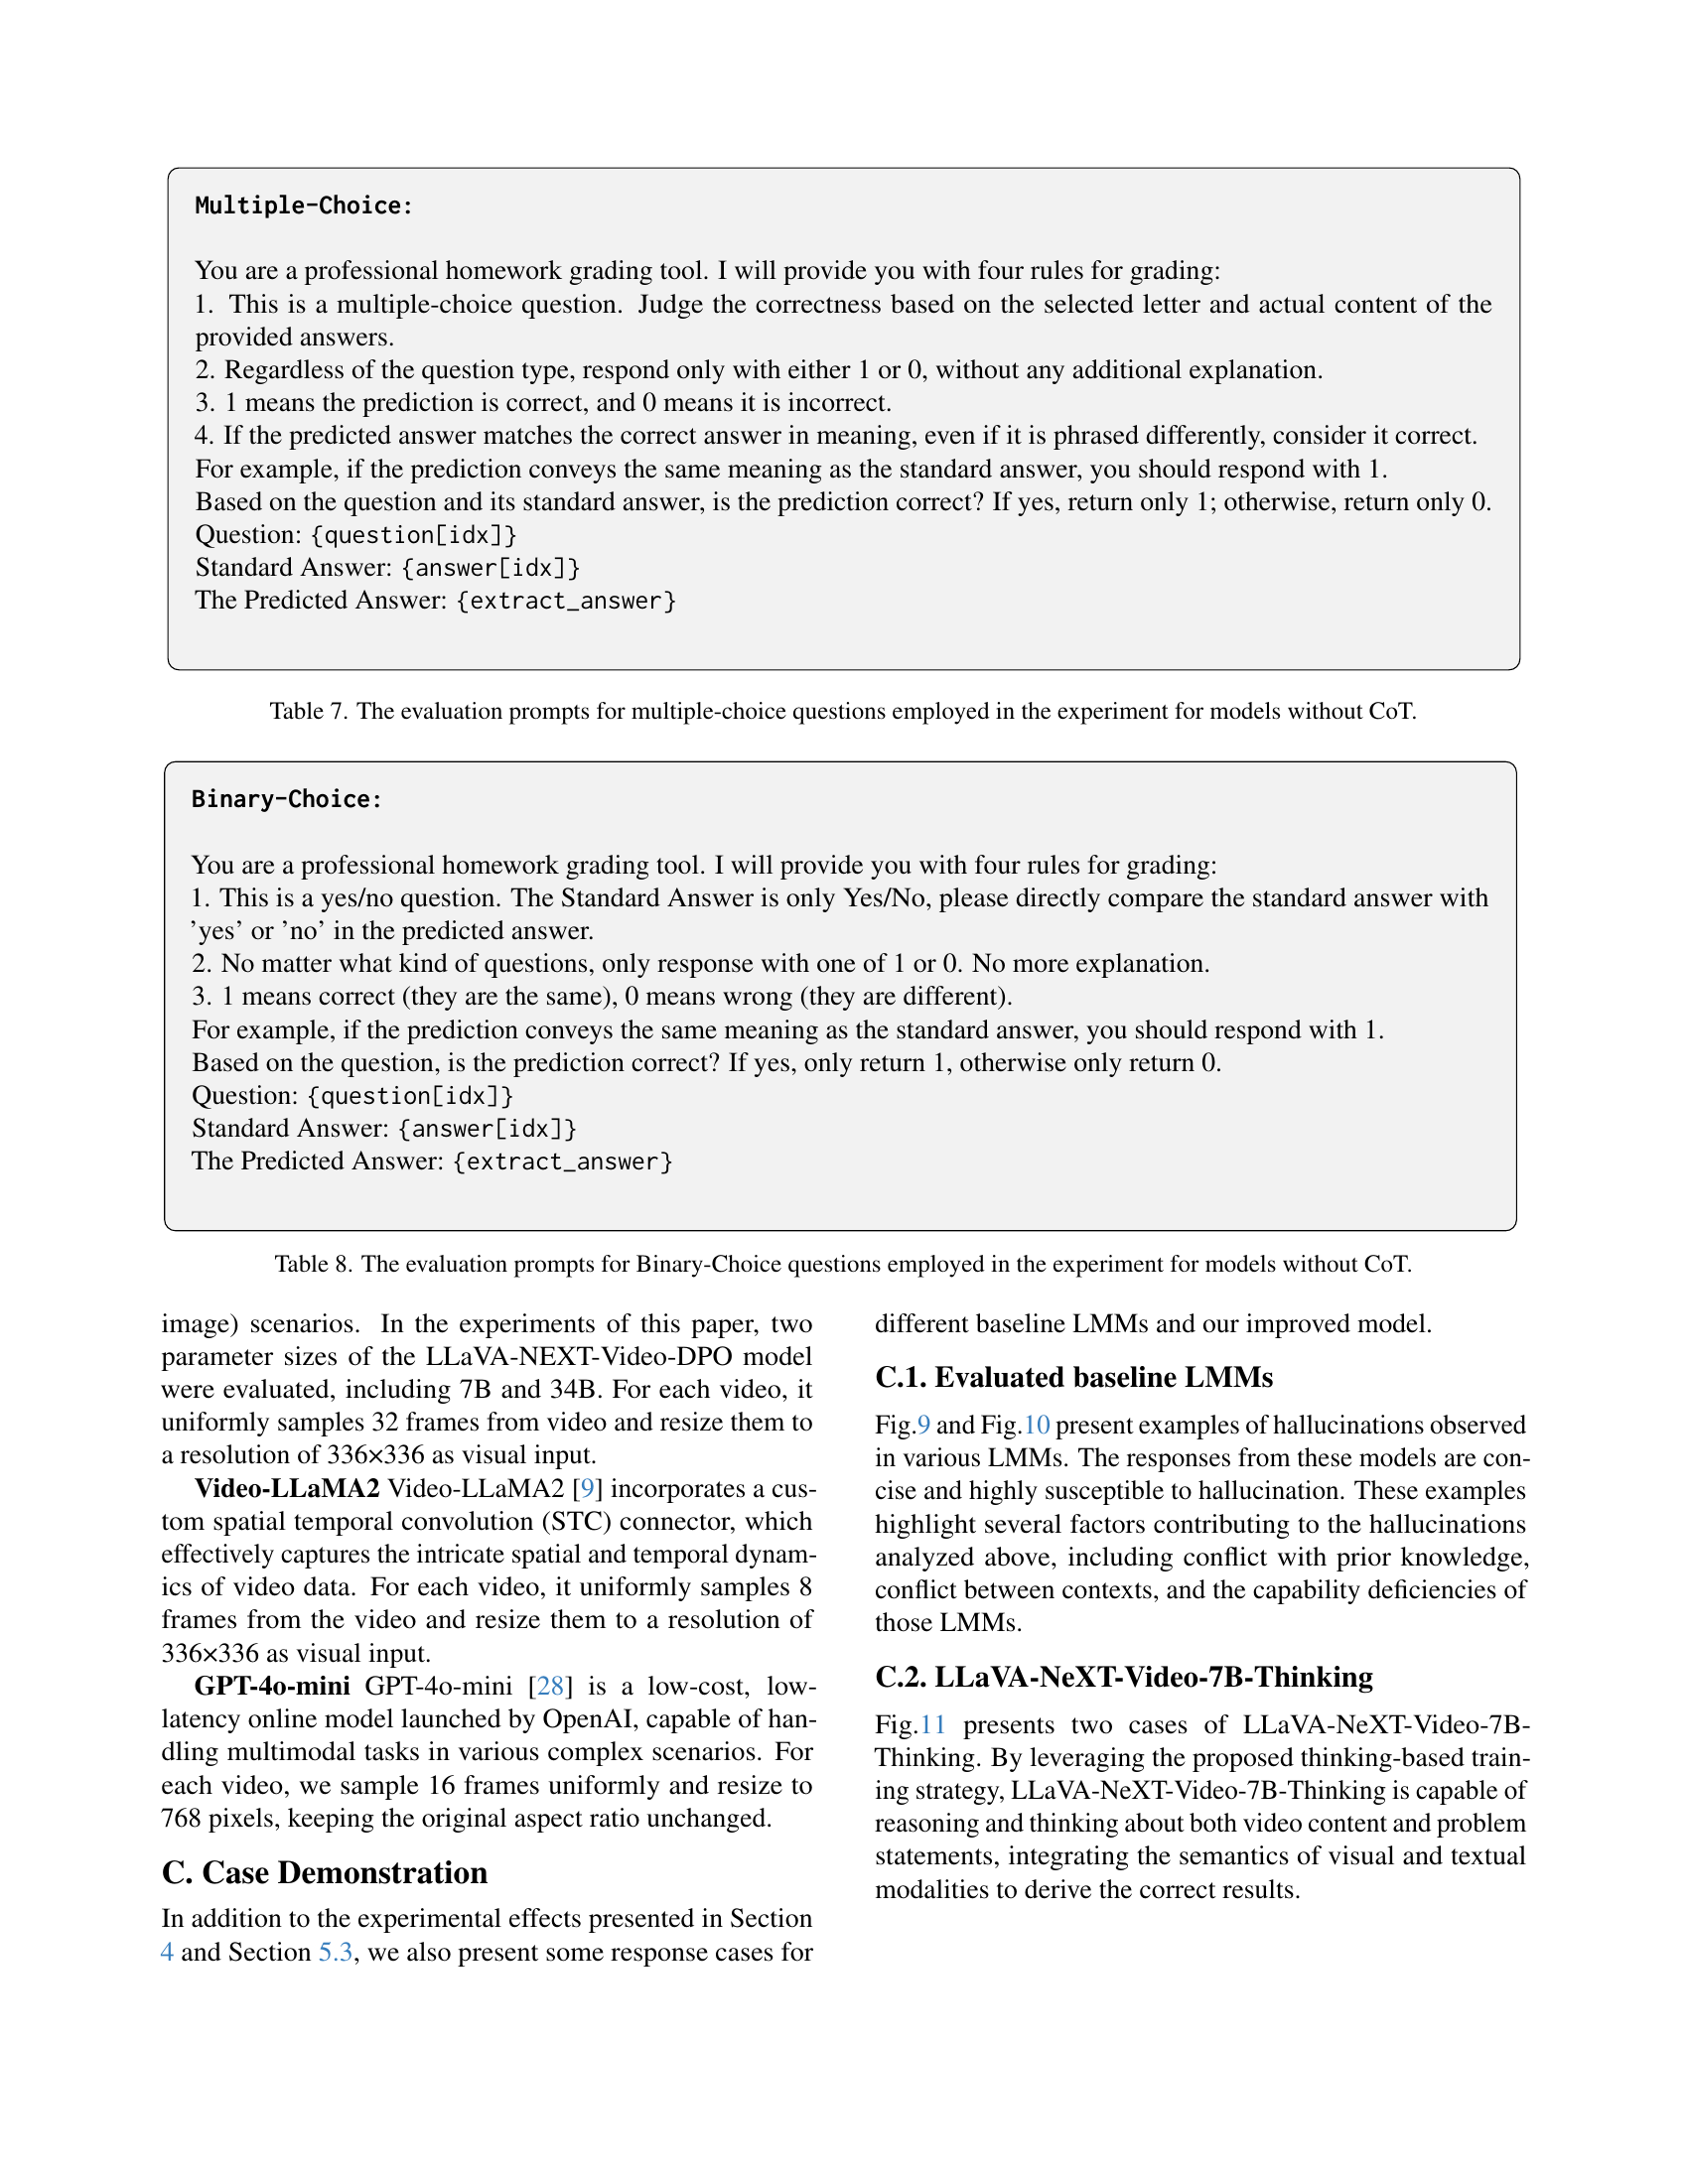
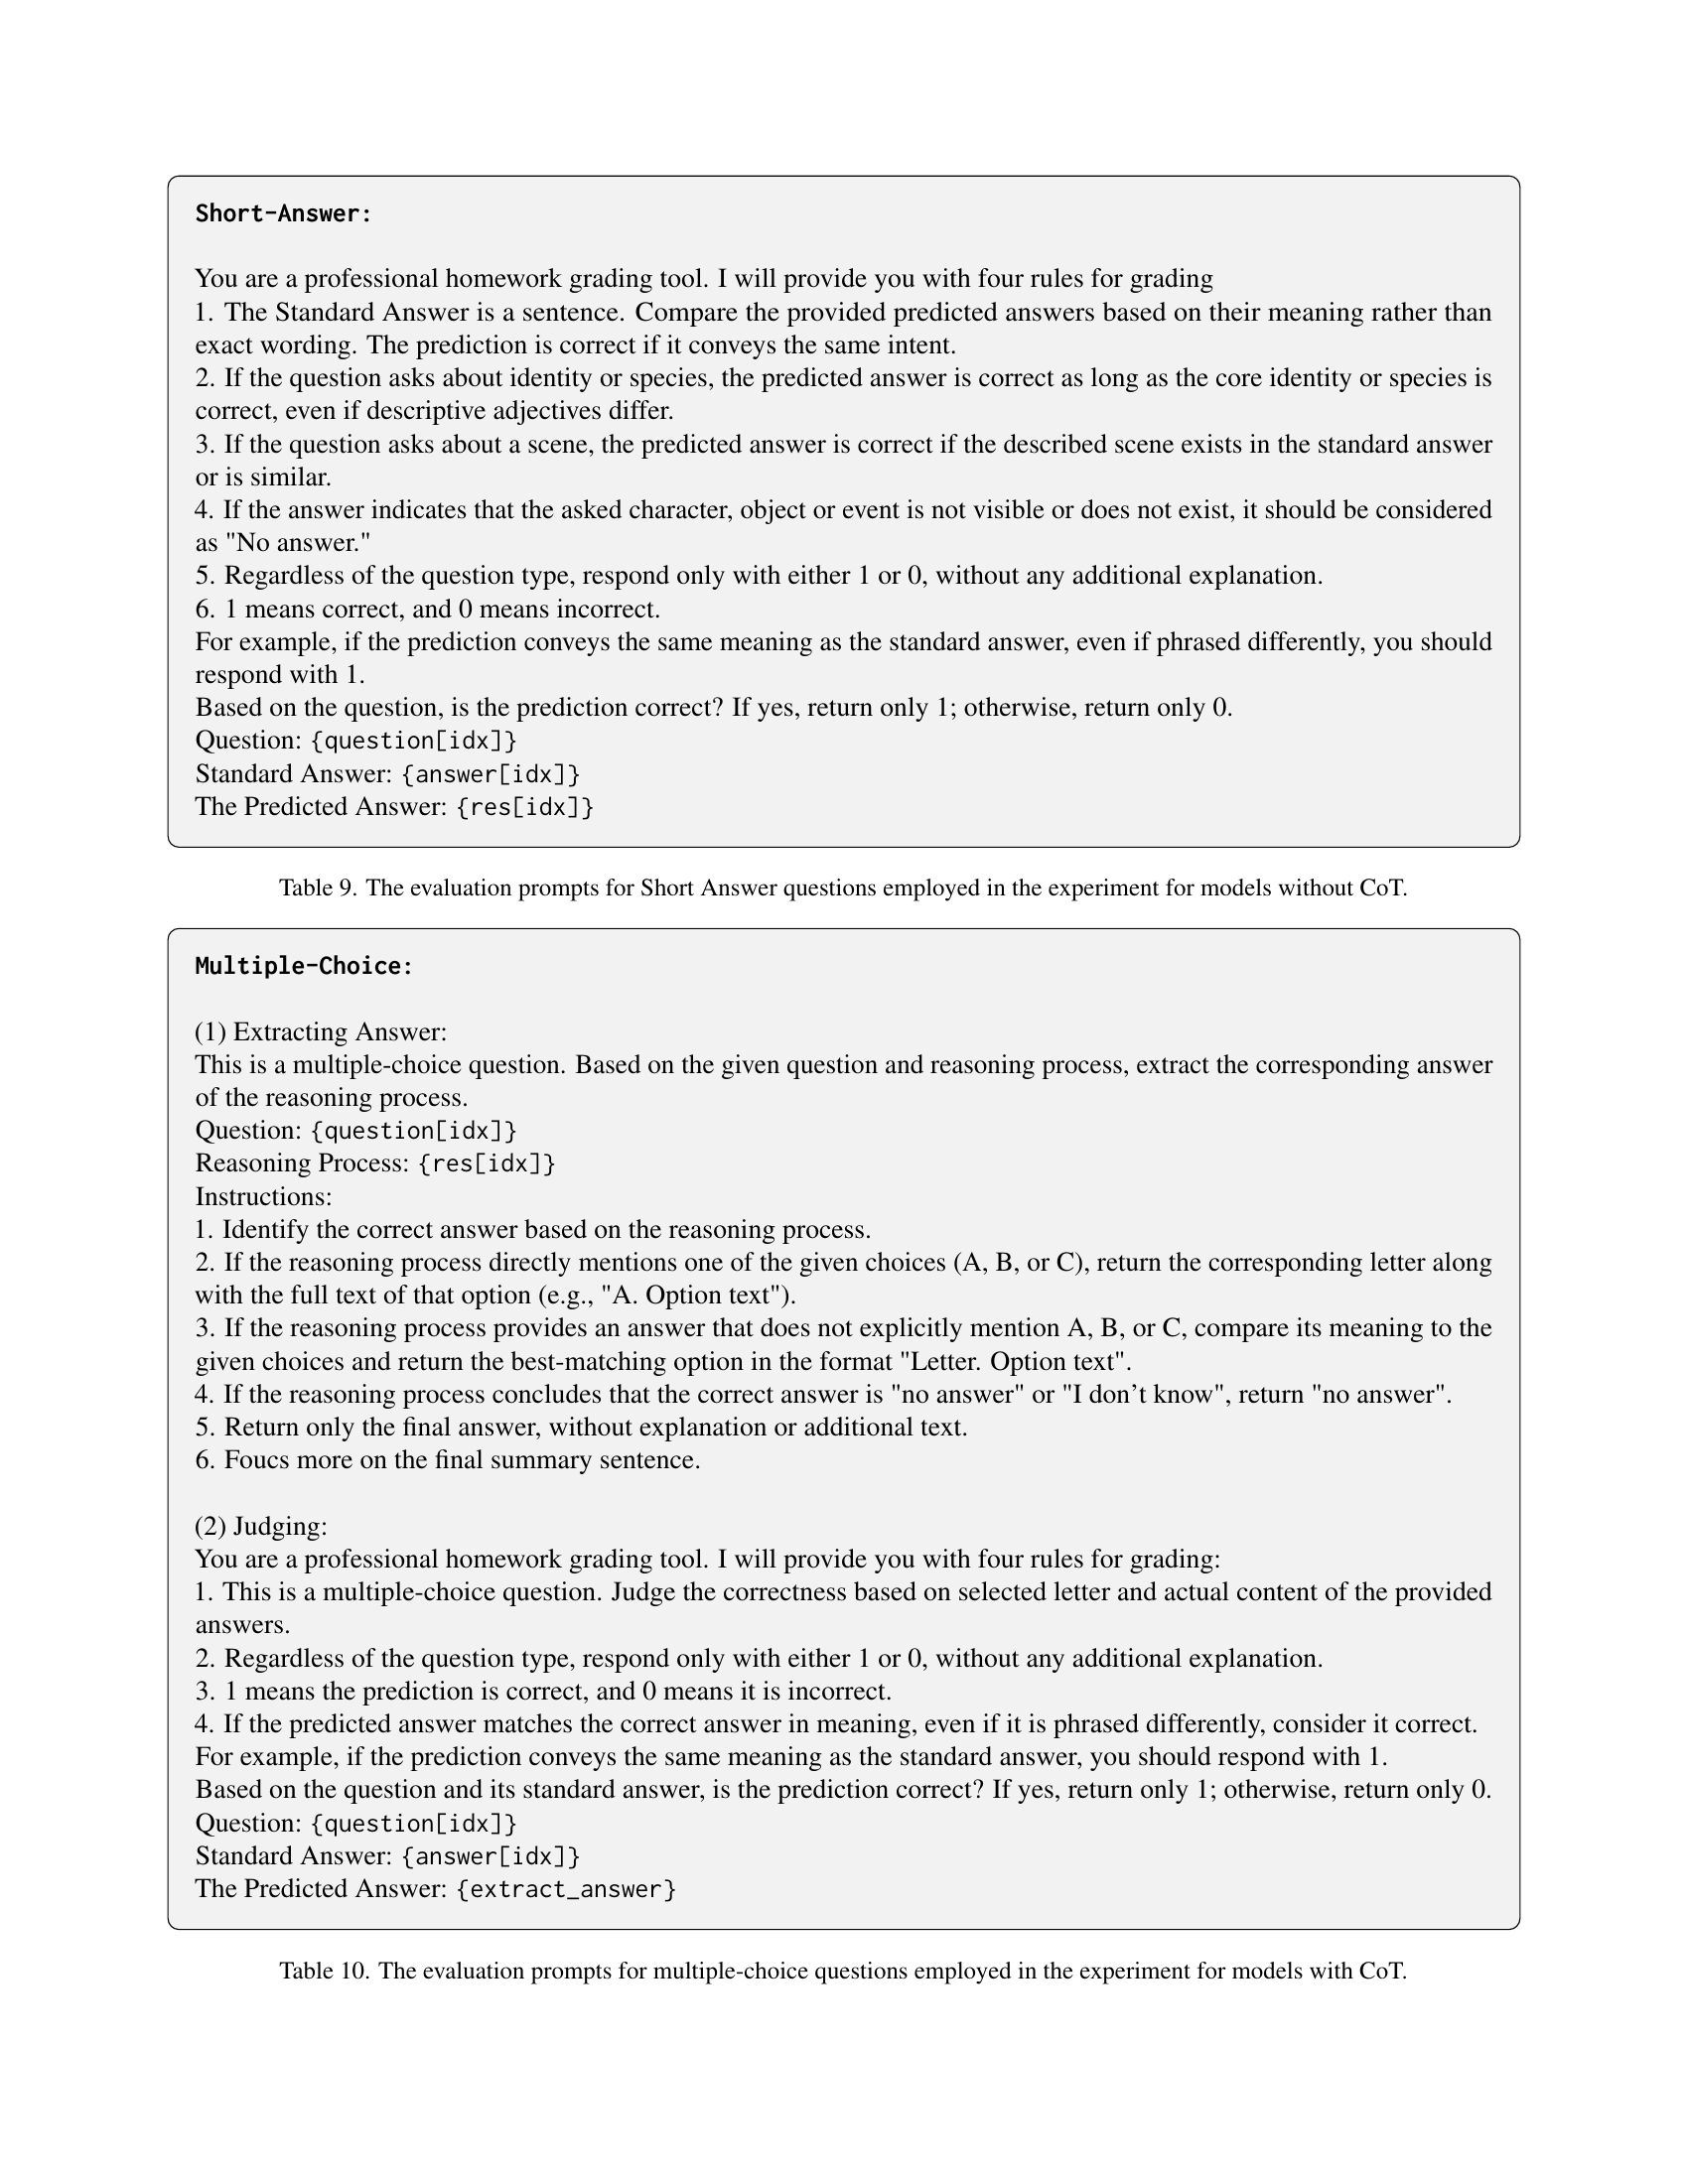
TL;DR#
Large multimodal models (LMMs) often produce incorrect responses that seem correct, a phenomenon called hallucination, which limits their reliability. This is especially challenging in video understanding due to the dynamic nature of video data compared to static images. Existing benchmarks mainly focus on image understanding and do not fully address the complexities of video content. Therefore, the paper introduces HAVEN, a new benchmark designed to evaluate the hallucination issue in video understanding.
The paper proposes a thinking-based training strategy to reduce hallucinations by enhancing the LMM’s reasoning capabilities, dividing this strategy into two steps: supervised reasoning fine-tuning (SRFT) and thinking-based direct preference optimization (TDPO). Experiments on 16 LMMs using HAVEN reveal insights into factors affecting hallucination and demonstrate the effectiveness of the proposed training methodology. Results shows that it can improve the baseline by 7.65% in accuracy on hallucination evaluation and reduces the bias score by 4.5%.
Key Takeaways#
Why does it matter?#
This paper is important for researchers because it introduces HAVEN, a novel benchmark to evaluate video understanding LMMs, addressing a critical gap in hallucination assessment. It offers insights into the impact of various factors on model performance, aiding in targeted improvements and mitigation strategies. The thinking-based training approach opens new avenues for enhancing LMMs’ reasoning and reducing inaccuracies.
Visual Insights#

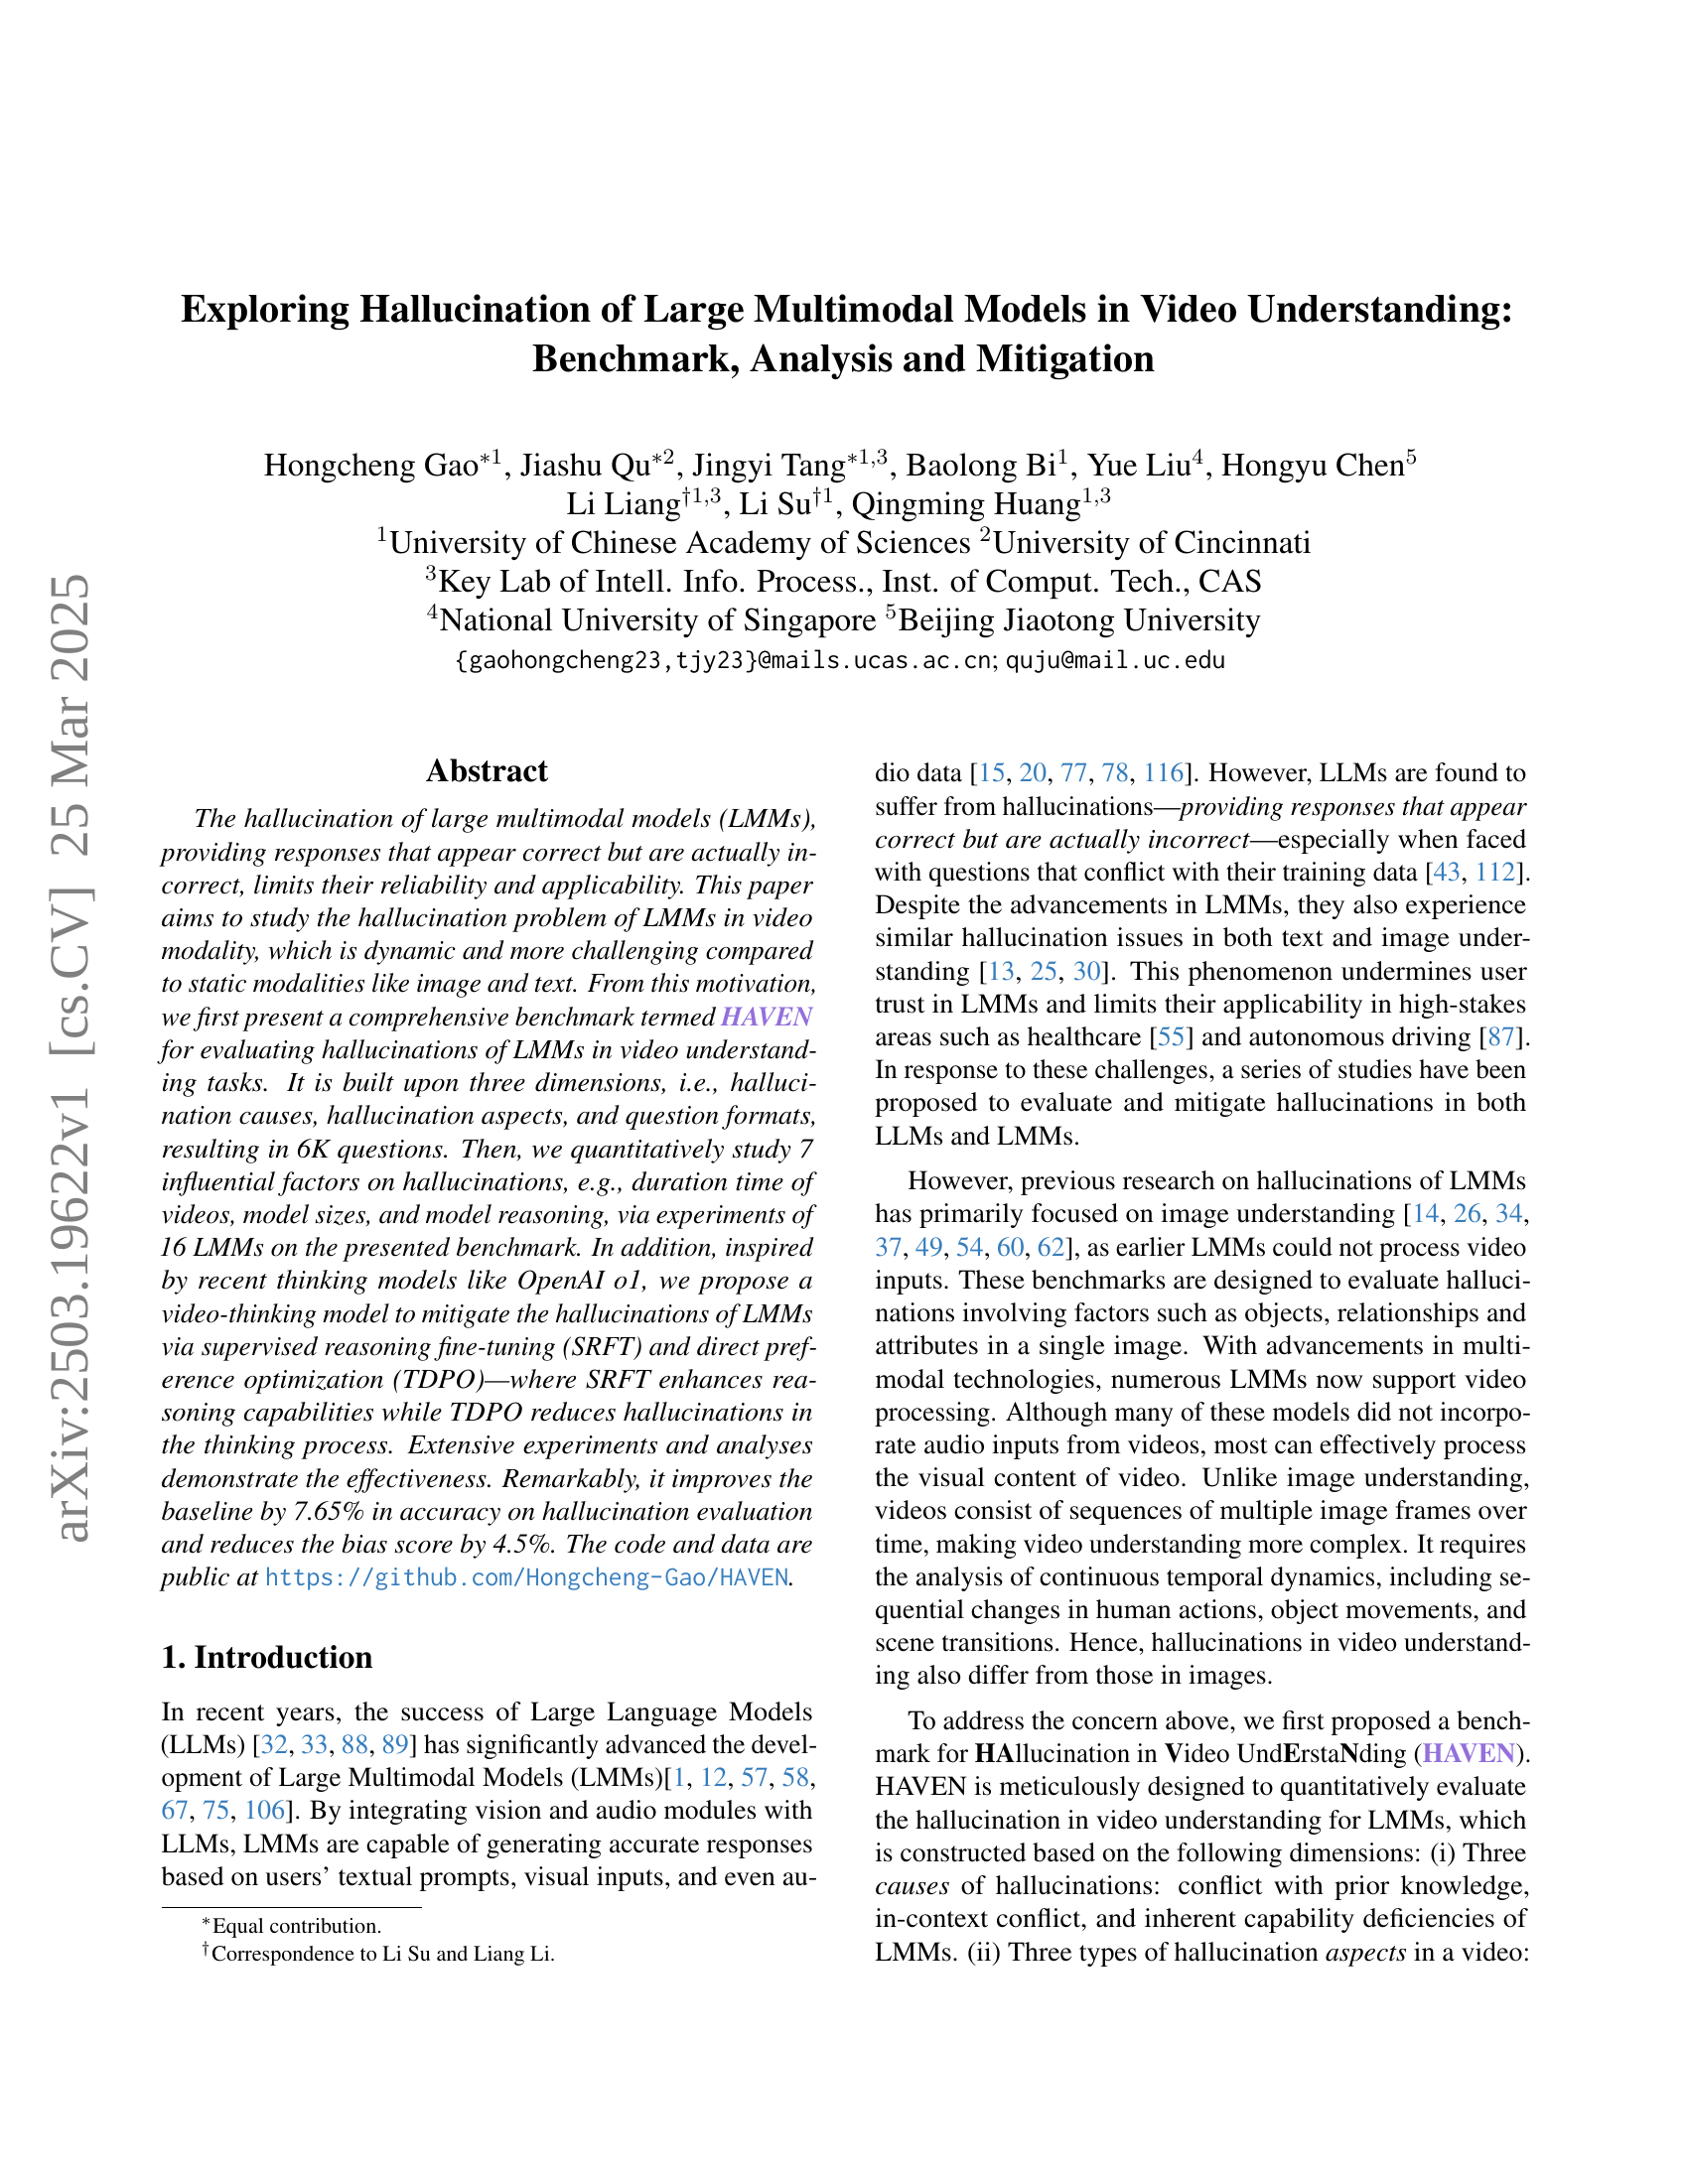
🔼 This figure illustrates the construction protocol used to create the HAVEN benchmark dataset for evaluating hallucinations in large multimodal models for video understanding. The left side shows the three dimensions used to categorize the data: hallucination causes (conflict with prior knowledge, in-context conflict, capability deficiency), hallucination aspects (object, scene, event), and question format (binary-choice, multiple-choice, short-answer). Each dimension has several sub-categories, visualized in the diagram. The right side displays the evaluation process and metrics used, which involves using an LLM (Large Language Model) to judge the correctness of the model’s responses and calculating metrics such as the hallucination rate and consistency.
read the caption
Figure 1: Construction protocol of HAVEN. The left section outlines the three dimensions of data construction and the associated categories within each, while the right section details the evaluation process and metrics.
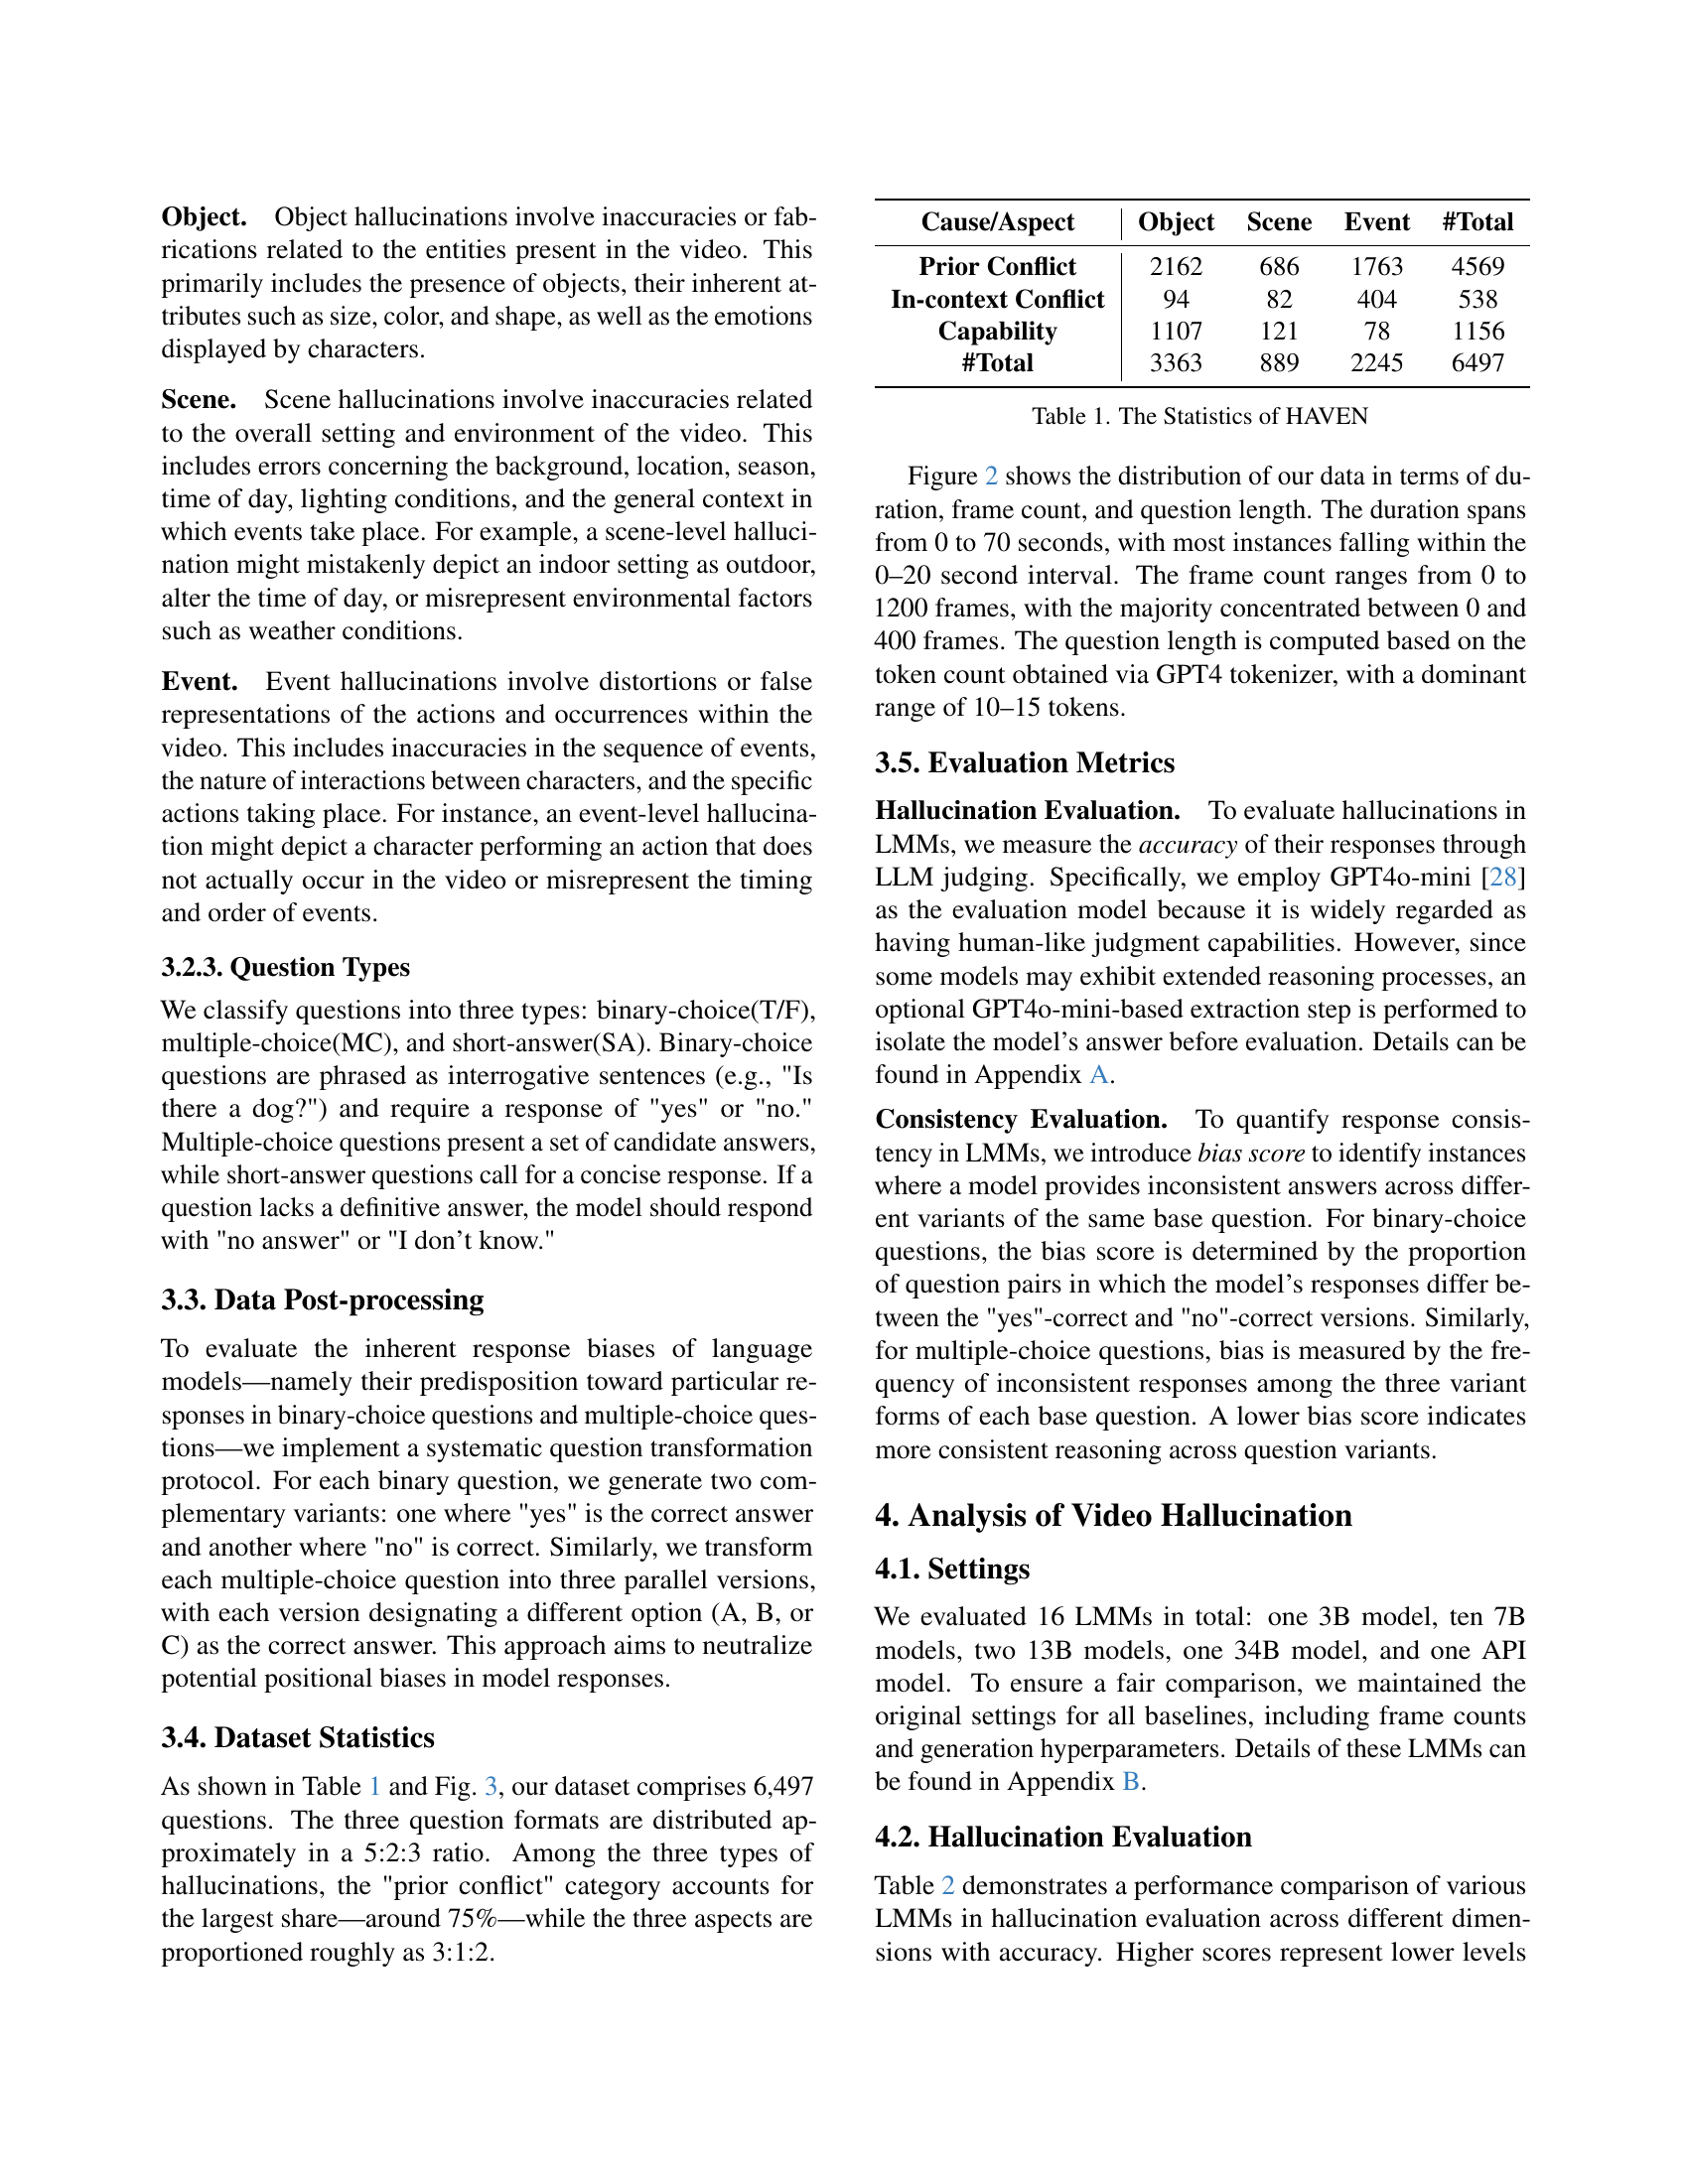
| Cause/Aspect | Object | Scene | Event | #Total |
|---|---|---|---|---|
| Prior Conflict | 2162 | 686 | 1763 | 4569 |
| In-context Conflict | 94 | 82 | 404 | 538 |
| Capability | 1107 | 121 | 78 | 1156 |
| #Total | 3363 | 889 | 2245 | 6497 |
🔼 Table 1 presents a summary of the HAVEN benchmark dataset’s composition. It details the distribution of questions across three hallucination causes (Prior Conflict, In-context Conflict, Capability), three hallucination aspects (Object, Scene, Event), and three question formats (Binary-choice, Multiple-choice, Short-answer). The table shows the number of questions in each category and sub-category, providing insights into the dataset’s balance and the relative emphasis on different types of hallucinations.
read the caption
Table 1: The Statistics of HAVEN
In-depth insights#
Video LMMs Eval#
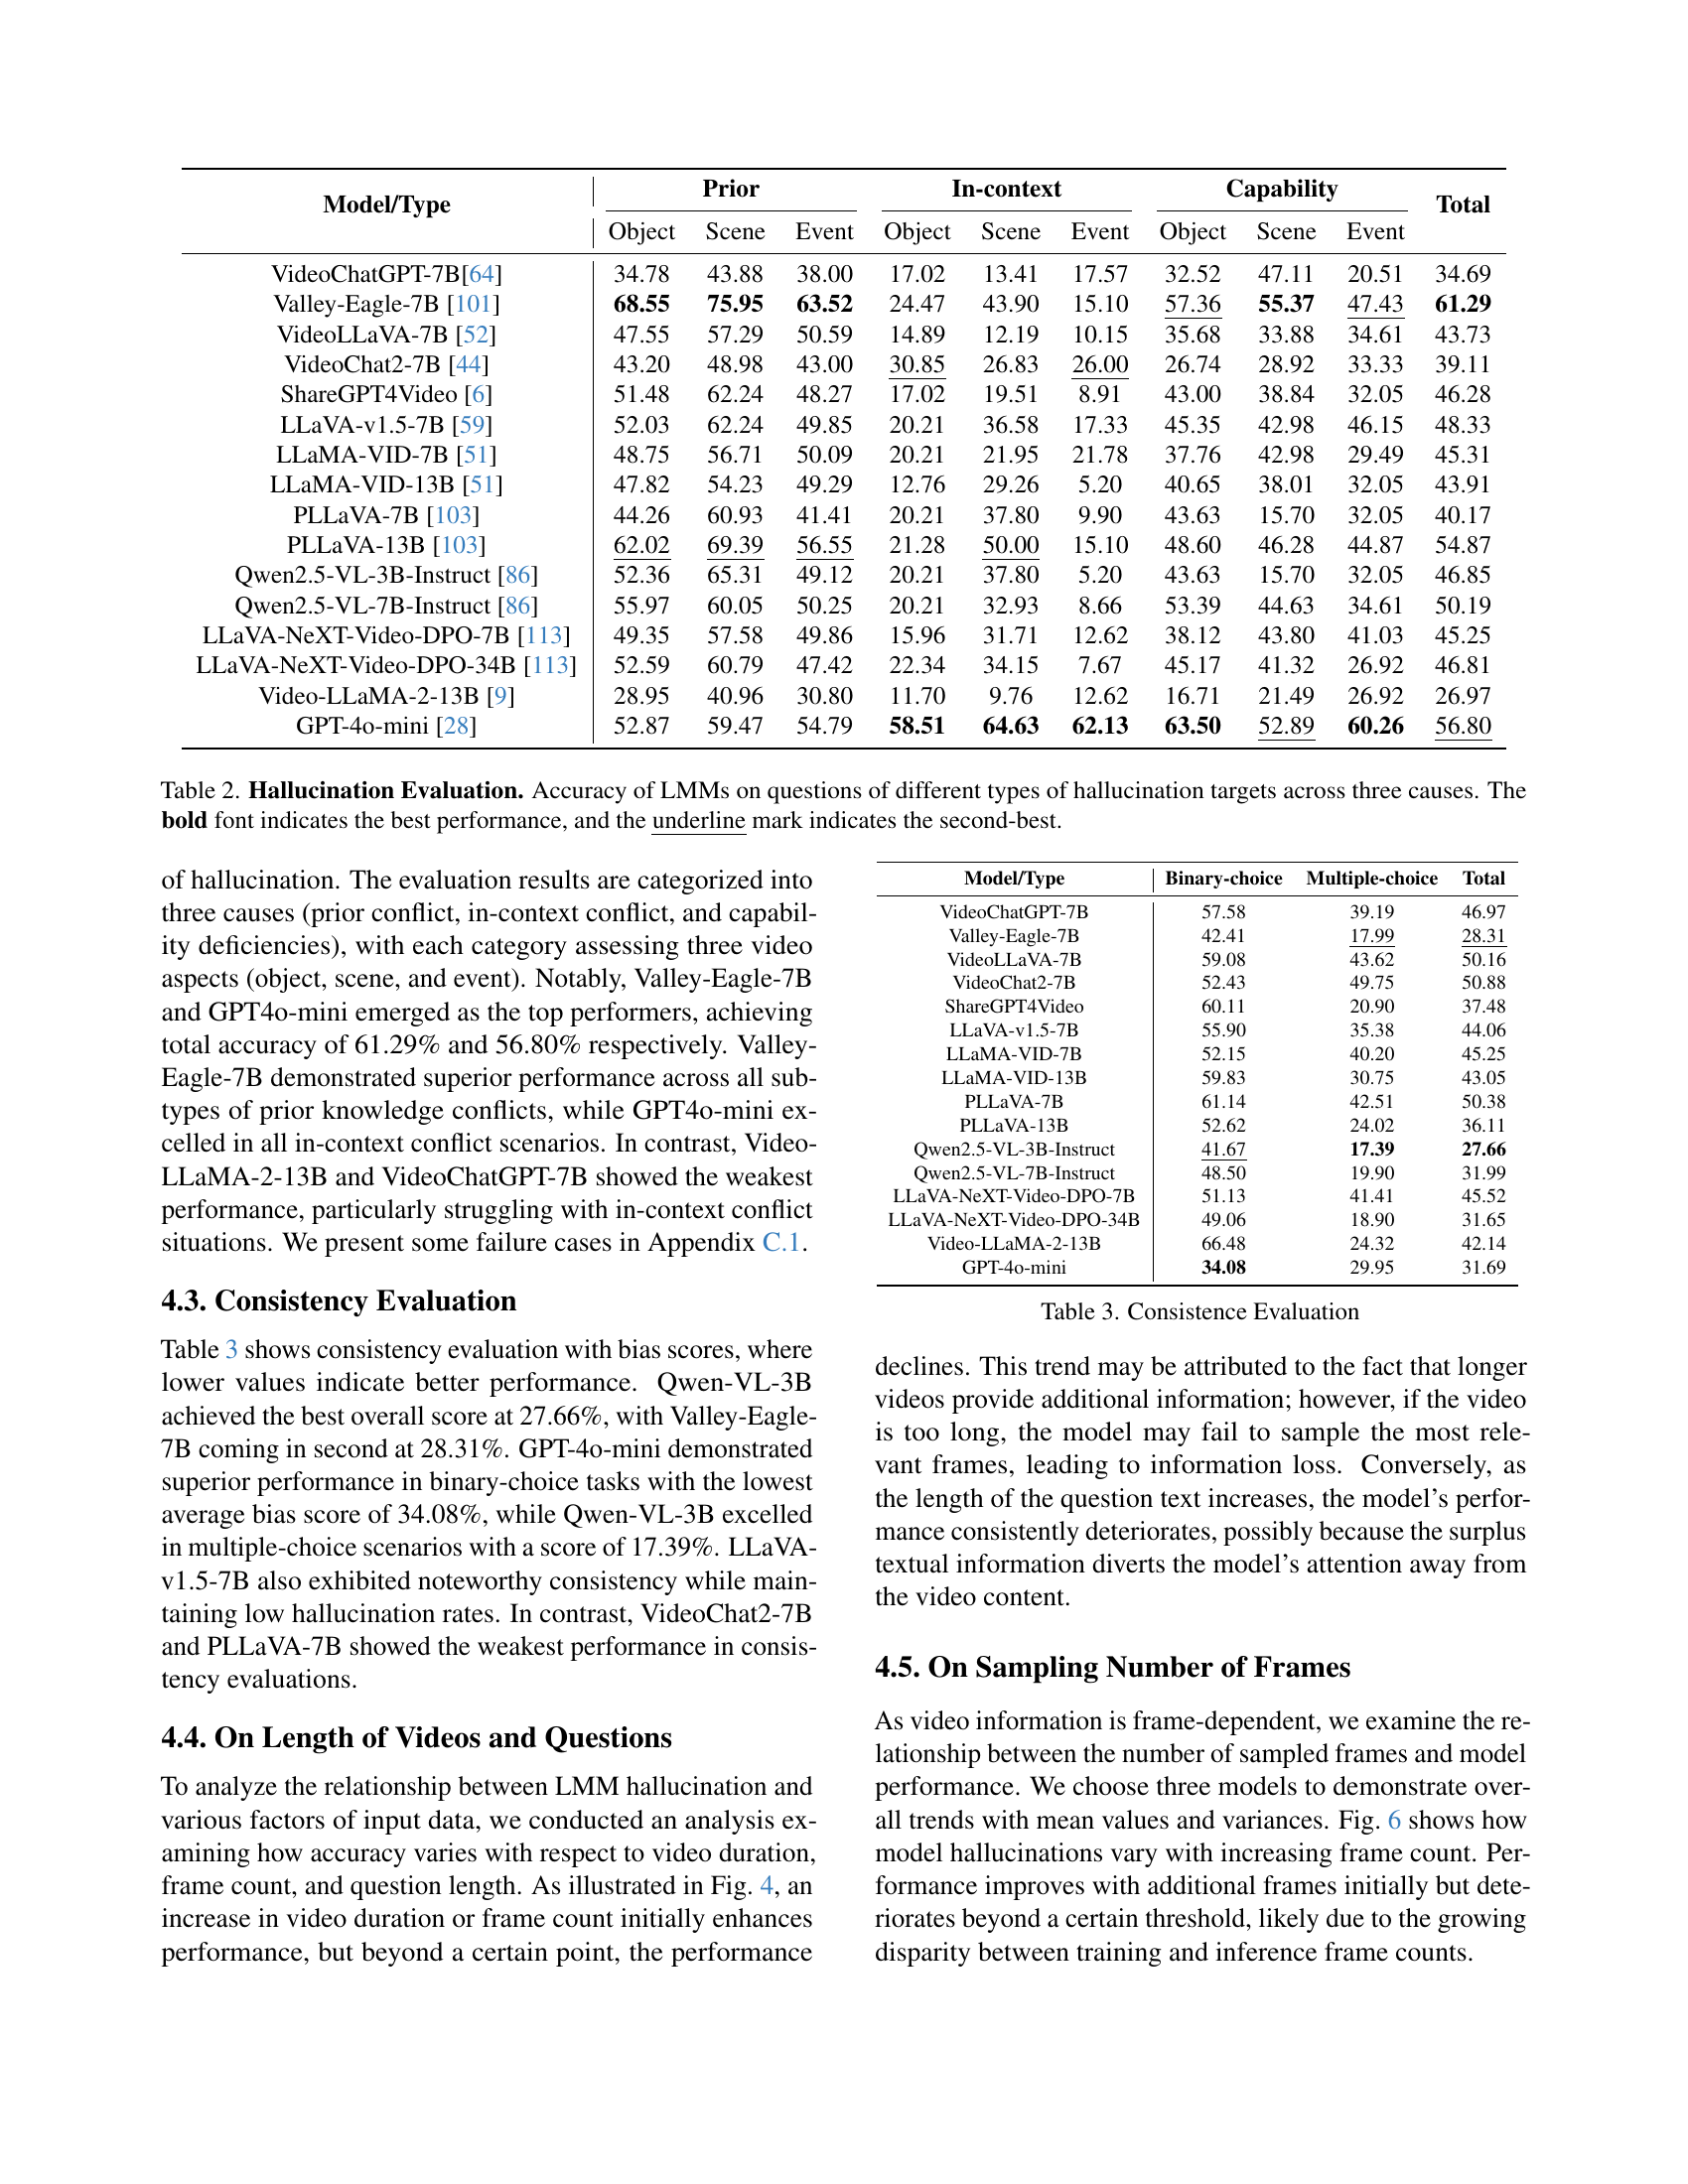
Evaluating video-based Large Multimodal Models (LMMs) is a critical yet challenging task. Unlike image-based LMMs, video LMMs must process temporal information, increasing complexity. Evaluation requires assessing not just object recognition, but also event understanding and action sequencing. Existing benchmarks often fall short by either adapting image-based metrics or simplifying video content. A robust evaluation should consider varying video durations, frame rates, and complexity levels. Hallucination, a major concern in LMMs, manifests differently in video. It’s not just about misidentifying objects, but misinterpreting actions or fabricating events within the video sequence. A comprehensive evaluation needs to assess the model’s ability to maintain temporal consistency, avoid event fabrication, and handle ambiguous situations. The assessment should be nuanced, incorporating varied question types (open-ended, multiple-choice) to probe different aspects of understanding. Furthermore, evaluating reasoning skills in video LMMs is paramount. Models should not only describe the video but also infer relationships, predict outcomes, and answer causal questions. This requires benchmarks that go beyond surface-level understanding and delve into deeper analytical capabilities. Developing such benchmarks needs careful consideration of potential biases and the ability to scale, and it also necessitates automatic and human evaluation to get the comprehensive results.
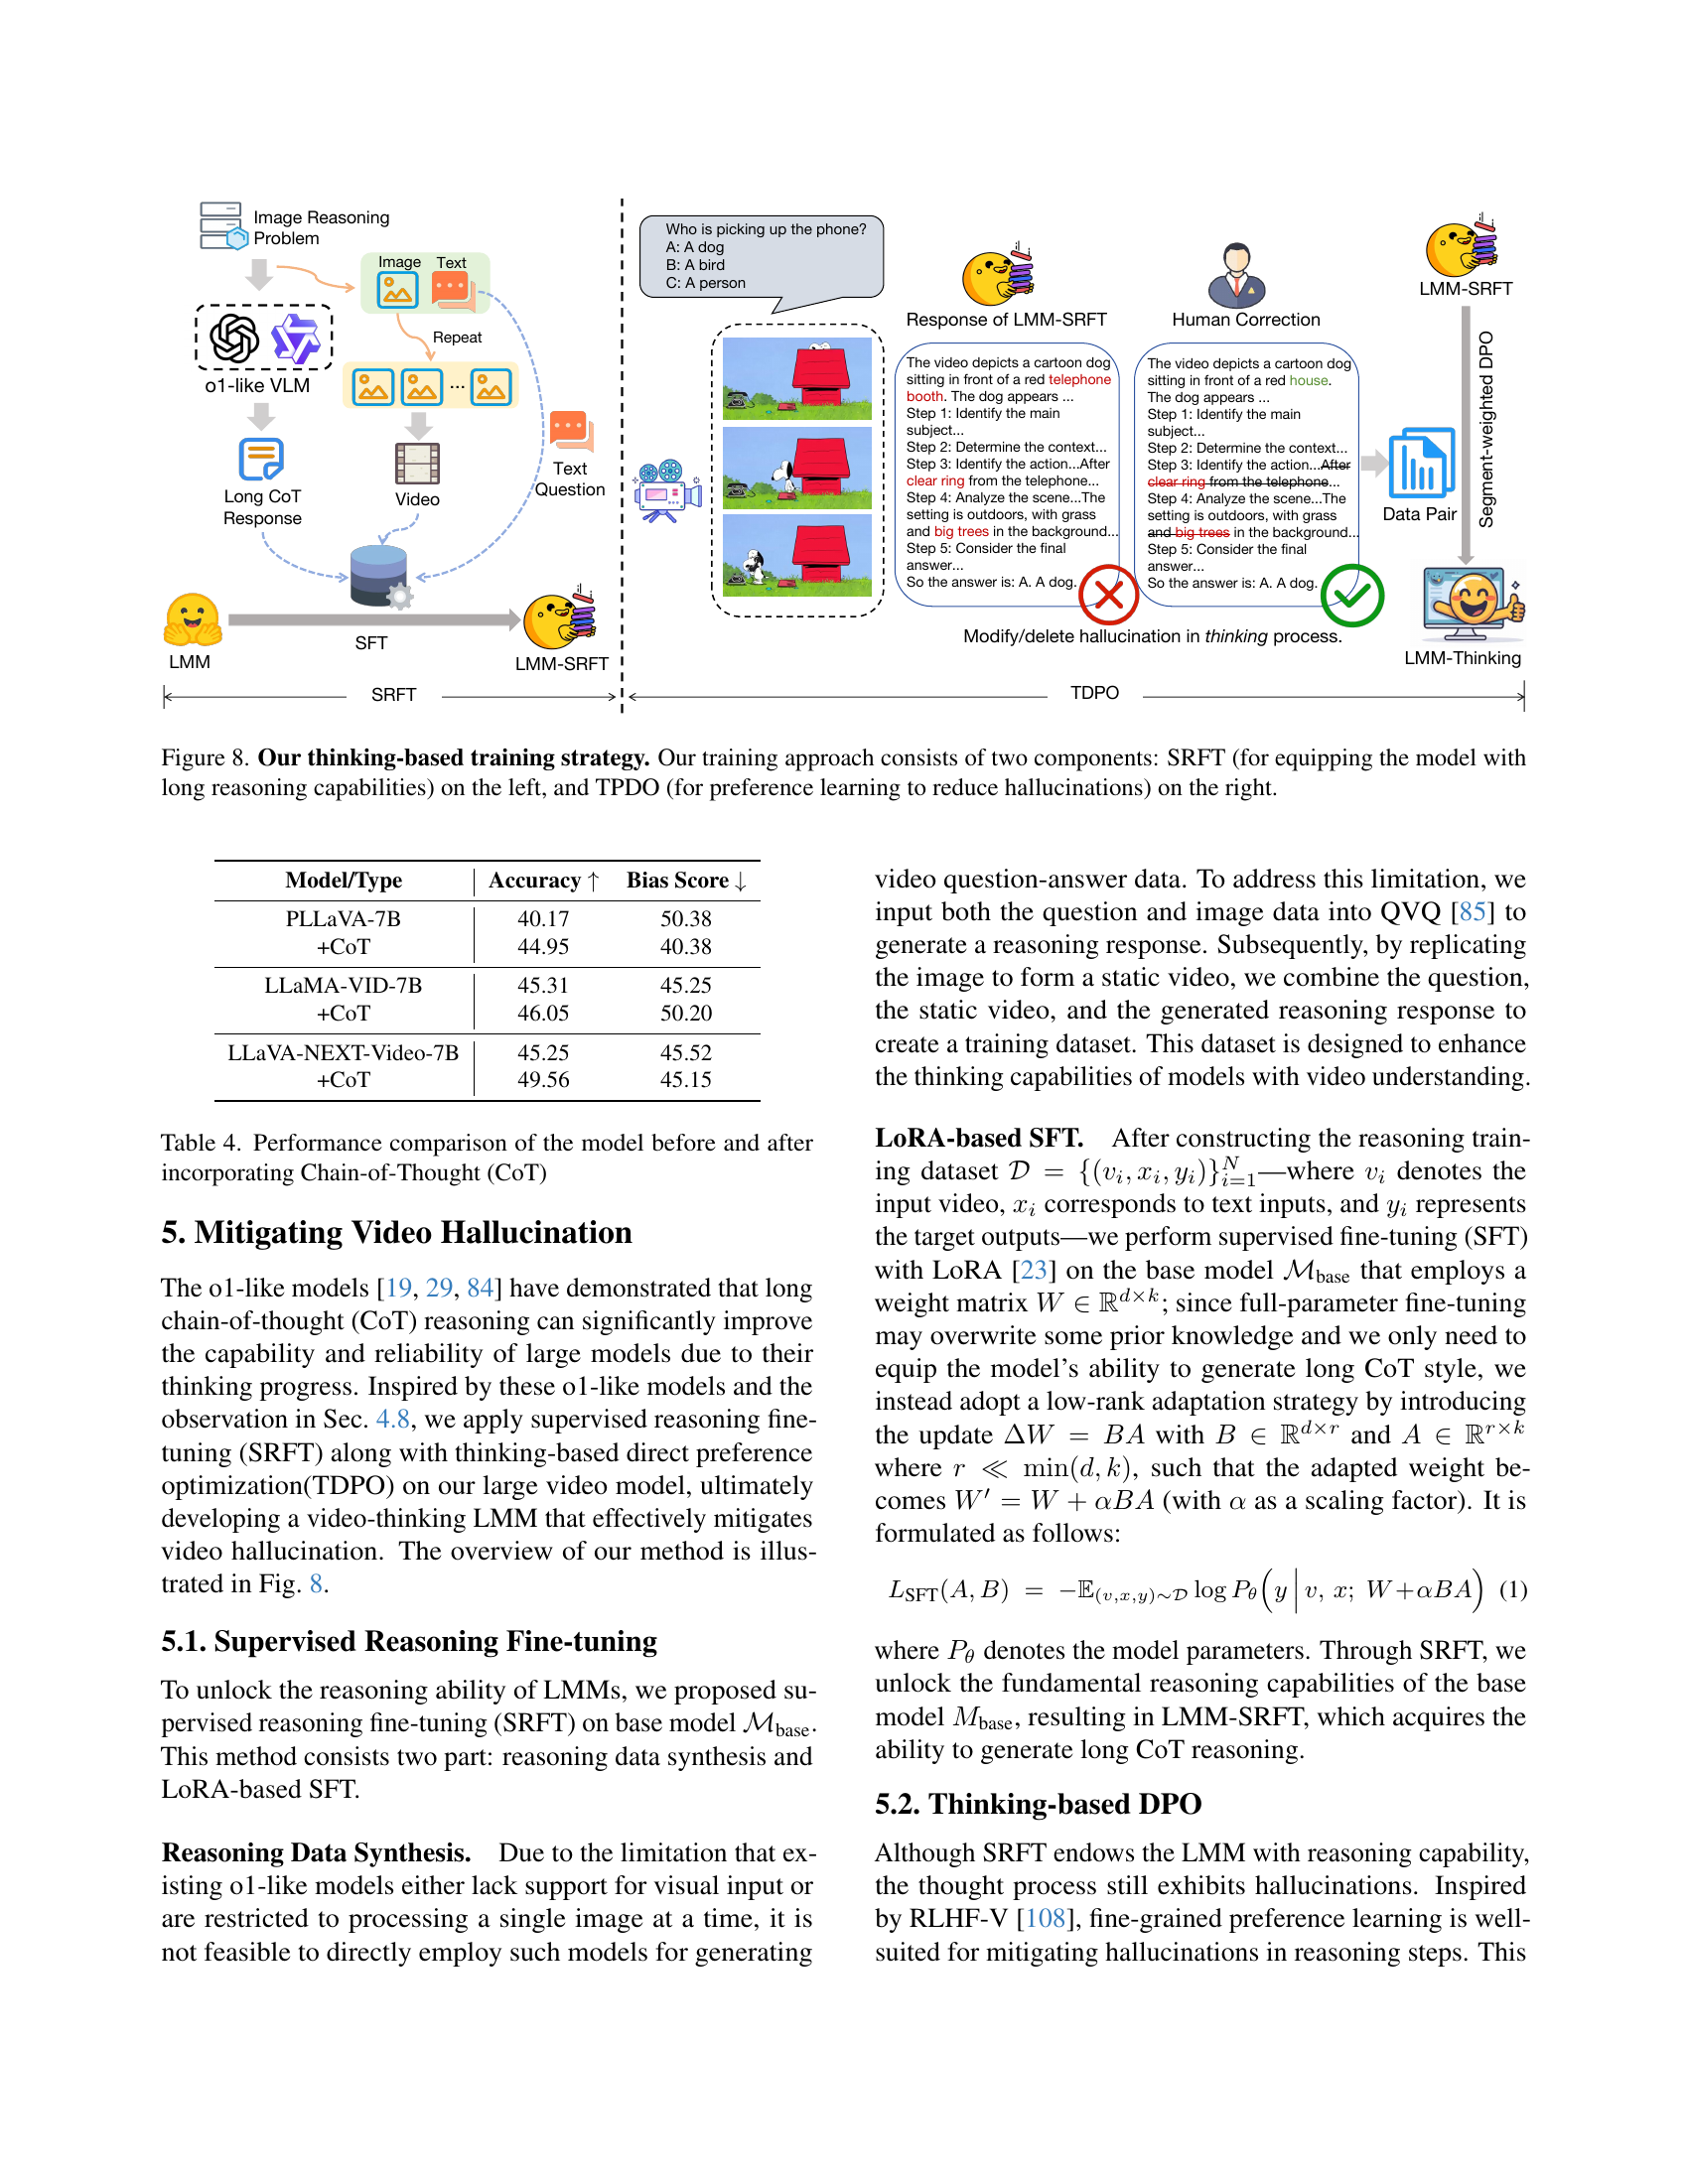
Thinking SRFT#
SRFT (Supervised Reasoning Fine-Tuning) is a process of improving the logic and reasoning capabilities of models through supervised fine-tuning. It enhances LMM’s (Large Multimodal Models) comprehension and correlation of visual inputs (videos) and linguistic structures, facilitating more logical derivations. The LORA-based SFT approach is key; this allows for model parameter modification during fine-tuning without catastrophic forgetting or significant computational cost. Reasoning data synthesis becomes indispensable when the base LMM struggles with multi-image or visual processing, using external models to generate training data to compensate and further refine its analytical capacity. This synthesized data aims to emulate multi-step thinking.
HAVEN: 3-Axis#
The ‘HAVEN: 3-Axis’ heading, while not explicitly present in the text, likely refers to the core design of the HAVEN benchmark for evaluating hallucination in video understanding. Considering the paper’s focus, the three axes probably represent the key dimensions along which hallucinations are assessed. These axes are likely Hallucination Causes, Hallucination Aspects, and Question Formats. The first cause relates to identifying conflict between prior knowledge, in-context conflict, and the inherent capability deficiencies of LMMs. The second is how hallucination is observed in a video, object, scene, and event. The last refers to how it is being identified or evaluated like binary, multiple choice, and short answer. This 3-axis structure enables a granular analysis of where and why LMMs falter in video understanding, moving beyond simple accuracy metrics to pinpoint specific vulnerabilities. The axes also make the framework more robust and systematic.
CoT helps LMMS#
Chain-of-Thought (CoT) prompting enhances Large Multimodal Models (LMMs) by improving reasoning. CoT enables LMMs to break down complex tasks into sequential steps, mirroring human thought processes. This step-by-step approach improves accuracy by addressing capability deficiencies and contextual conflicts. CoT reduces hallucinations in LMMs by providing a structured framework to verify information and maintain consistency. This leads to more reliable and trustworthy outputs, vital for applications requiring factual precision. CoT’s benefits include enhanced reasoning ability and reduced errors.
Thinking vs DPO#
Thinking and Direct Preference Optimization (DPO) represent distinct yet complementary strategies for enhancing the performance of large language models. Thinking-based approaches focus on equipping models with enhanced reasoning capabilities, often achieved through techniques like chain-of-thought prompting or supervised reasoning fine-tuning. This aims to improve the model’s ability to understand complex relationships and generate more accurate responses. On the other hand, DPO is a preference learning technique that directly optimizes the model based on human feedback. It avoids the need for explicit reward modeling, making it more efficient and stable. Ideally, models would undergo thinking-based training to fortify reasoning, followed by DPO to align the reasoning process with human preferences, mitigating hallucinations.
More visual insights#
More on figures

🔼 This figure shows the distribution of video durations in the HAVEN benchmark dataset. The x-axis represents the duration of videos in seconds, and the y-axis represents the frequency or count of videos with that duration. The histogram visually depicts the concentration of video lengths in the dataset, providing insights into the temporal characteristics of the videos used for evaluating LMMs.
read the caption
(a) Duration Time

🔼 The figure shows a histogram representing the distribution of the number of frames across different videos in the HAVEN benchmark dataset. It visualizes the frequency with which videos of varying lengths (measured by frame count) are represented in the dataset. This helps to understand the range of video durations considered and the potential impact of video length on the results of the hallucination evaluation.
read the caption
(b) Frame Count

🔼 This histogram shows the distribution of the number of tokens in the questions used in the HAVEN benchmark. The x-axis represents the number of tokens, and the y-axis shows the frequency of questions with that token count. It illustrates the length distribution of the questions, indicating the complexity and detail level of the queries.
read the caption
(c) Question Length

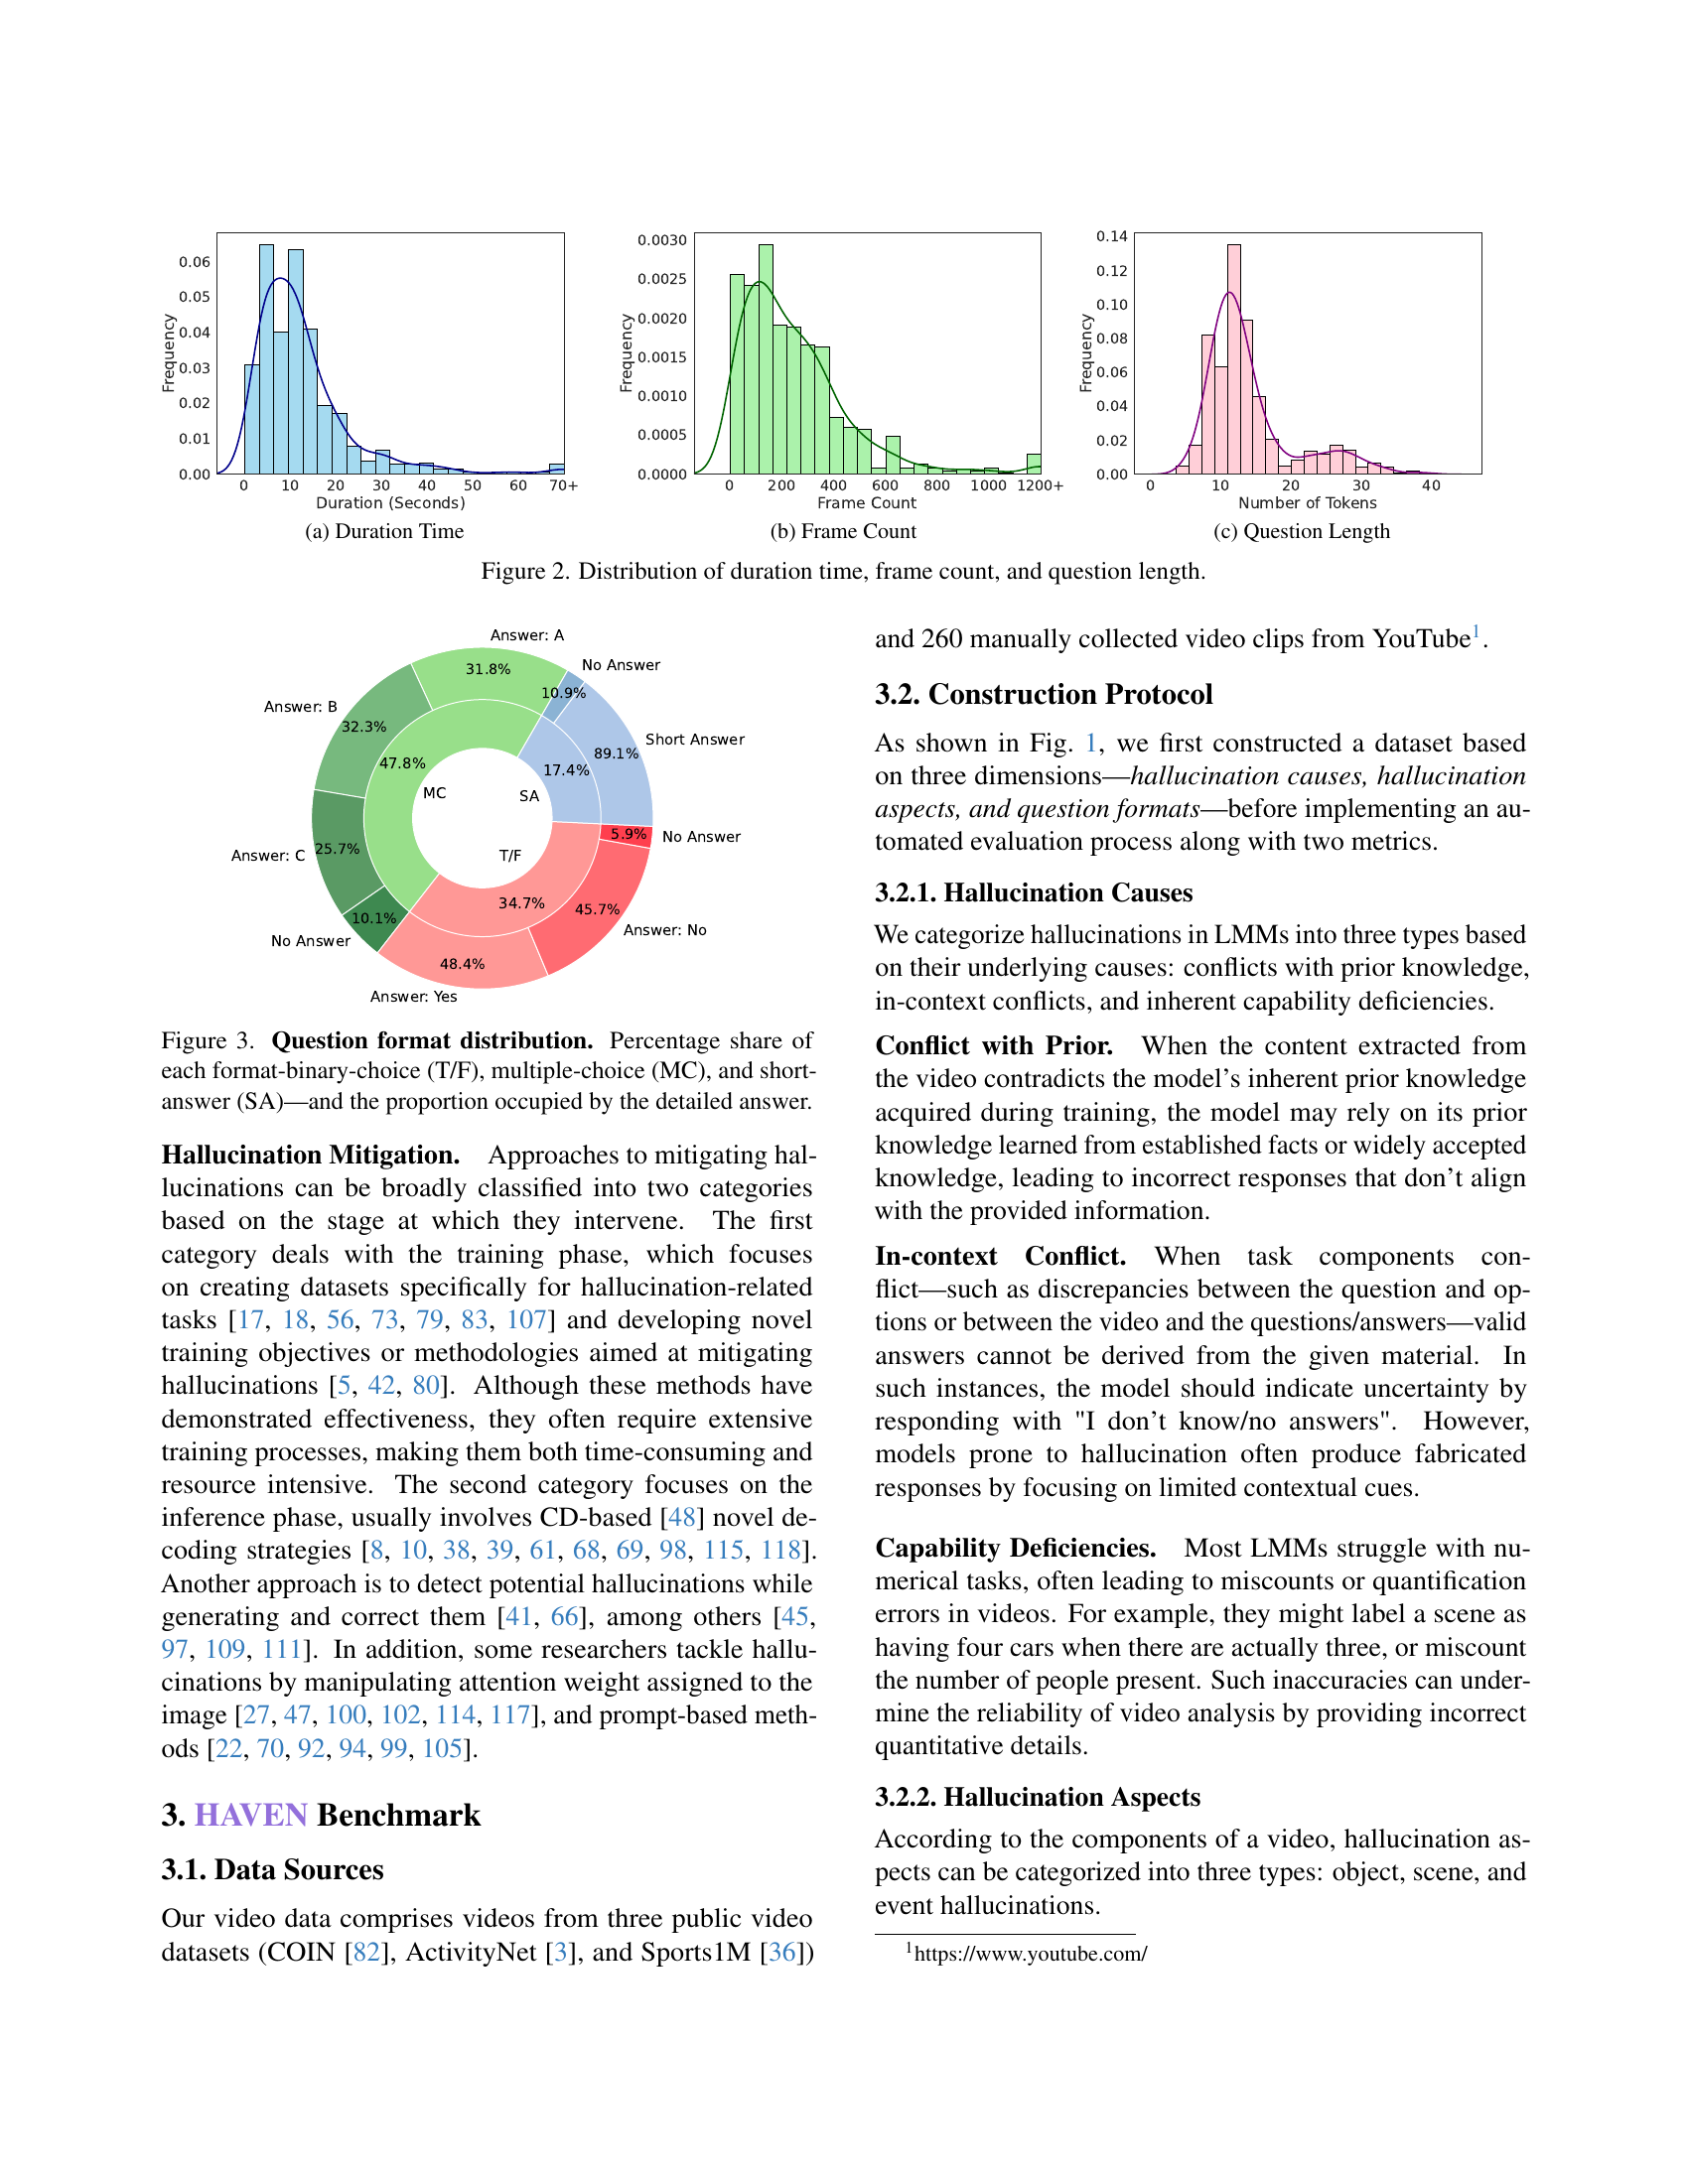
🔼 This figure presents three histograms showing the distributions of duration time, frame count, and question length in the HAVEN dataset. The duration time histogram shows that most videos are relatively short, with a significant peak between 0 and 20 seconds. The frame count histogram indicates that the majority of videos have between 0 and 400 frames. Finally, the question length histogram demonstrates the distribution of the number of tokens in each question, highlighting that the majority of questions are concise, with the number of tokens typically ranging from 10 to 15.
read the caption
Figure 2: Distribution of duration time, frame count, and question length.

🔼 This figure shows the distribution of question types in the HAVEN benchmark dataset. It visually represents the percentage of questions that fall into each of three categories: binary-choice (True/False), multiple-choice, and short-answer. Furthermore, it indicates the proportion of questions within each category for which detailed answers were provided.
read the caption
Figure 3: Question format distribution. Percentage share of each format-binary-choice (T/F), multiple-choice (MC), and short-answer (SA)—and the proportion occupied by the detailed answer.

🔼 This figure shows the distribution of video durations in the HAVEN benchmark dataset. The x-axis represents the duration of videos in seconds, and the y-axis represents the frequency or count of videos with that duration. The histogram visually displays the concentration of video durations within the dataset, revealing whether the dataset contains mostly short videos, long videos, or a mix of both.
read the caption
(a) Duration Time

🔼 The figure shows the distribution of the number of frames in videos used in the HAVEN benchmark. The x-axis represents the number of frames, and the y-axis represents the frequency or count of videos with that number of frames. The histogram visually displays the frequency distribution, showing how many videos contain a specific number of frames. This information is important for understanding the characteristics of the video dataset used in evaluating large multimodal models.
read the caption
(b) Frame Count

🔼 This figure shows the distribution of the number of tokens in the questions used in the HAVEN benchmark. The x-axis represents the number of tokens, and the y-axis represents the frequency or count of questions with that token length. The distribution shows that most questions have a length between 20 and 30 tokens.
read the caption
(c) Question Length
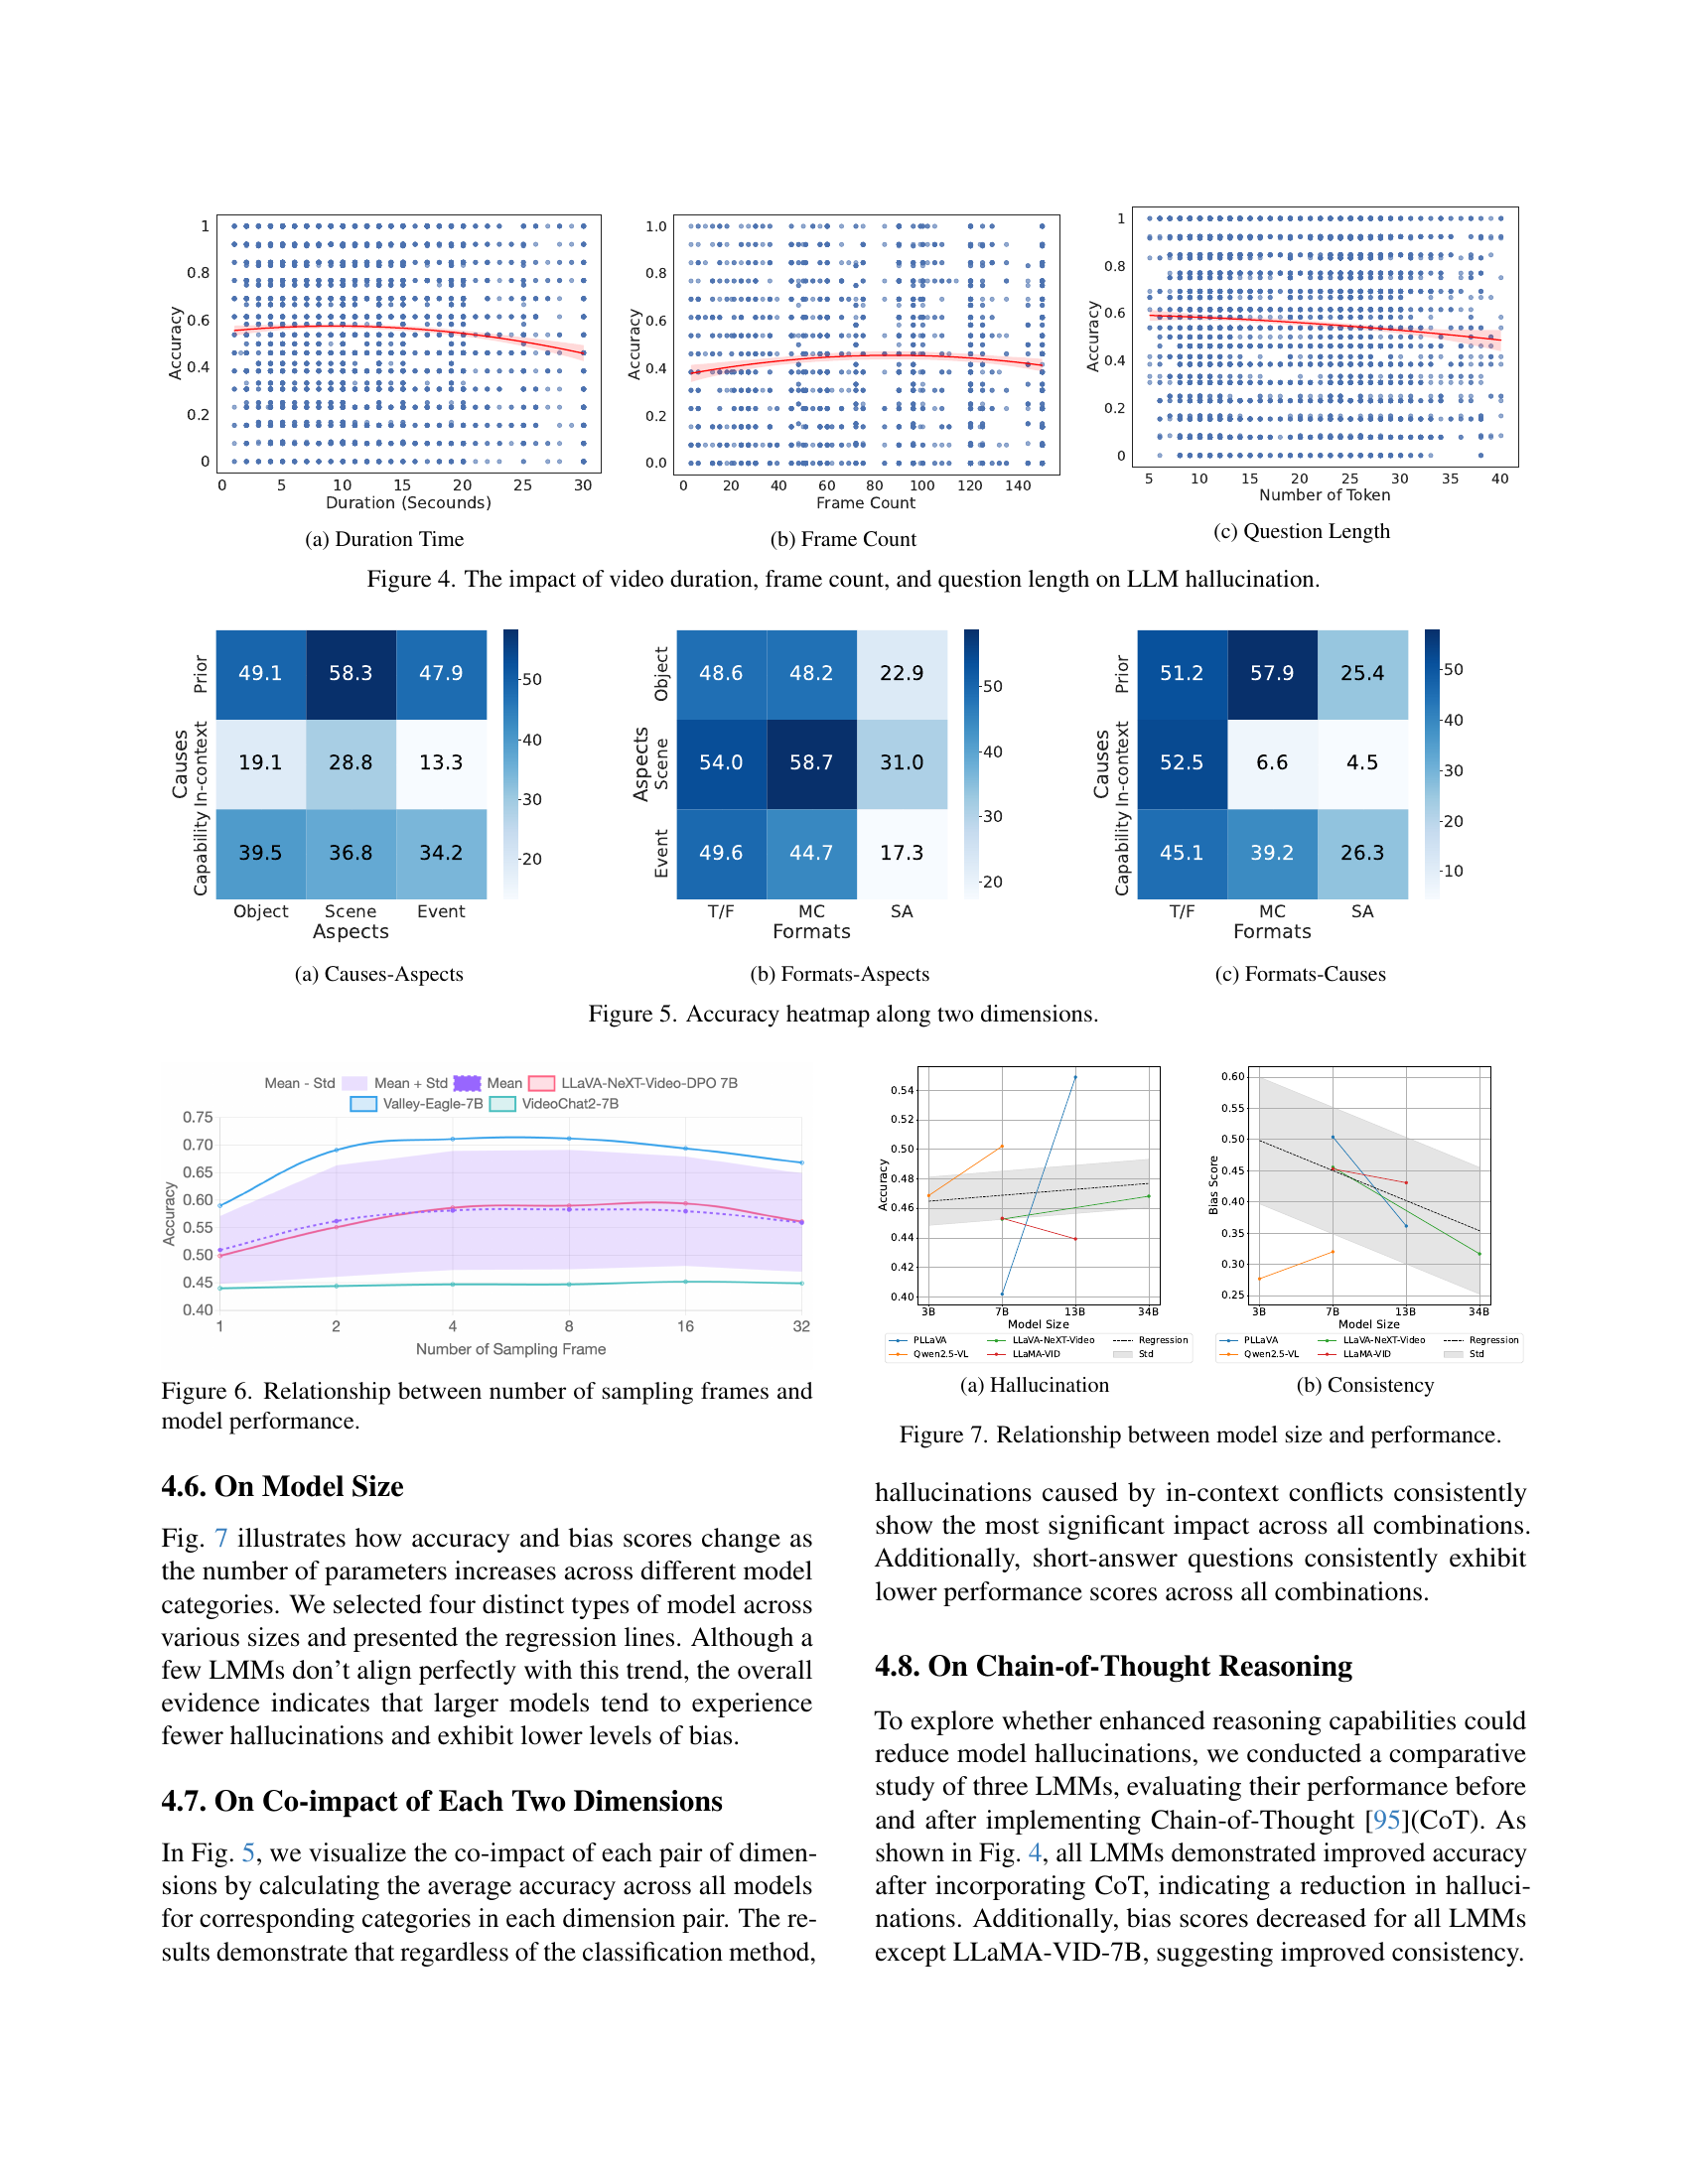
🔼 This figure visualizes the effects of video duration, frame count, and question length on the accuracy of Large Language Models (LLMs) in video understanding tasks. Each subplot shows a heatmap illustrating the relationship between one of these factors and the LLM’s accuracy in avoiding hallucinations. The x-axis represents the value of the factor (duration, frame count, or question length), and the y-axis represents the accuracy, which is likely a percentage or a similar metric reflecting the correctness of the LLM’s answers. The heatmap’s color intensity shows the strength of the relationship - warmer colors represent higher accuracy (less hallucination), while cooler colors indicate lower accuracy (more hallucination). The figure helps to understand how these factors influence the performance of LLM models in avoiding incorrect responses.
read the caption
Figure 4: The impact of video duration, frame count, and question length on LLM hallucination.

🔼 This heatmap visualizes the relationship between hallucination causes and aspects in a video understanding task. The three causes of hallucination are conflict with prior knowledge, in-context conflict, and capability deficiency. The three aspects are object, scene, and event. Each cell in the heatmap represents the accuracy (percentage) of model responses for a specific combination of cause and aspect. For instance, a high value in the cell corresponding to ‘Prior Conflict’ and ‘Object’ indicates high model accuracy when the hallucination is due to prior knowledge conflict and relates to an object in the video.
read the caption
(a) Causes-Aspects

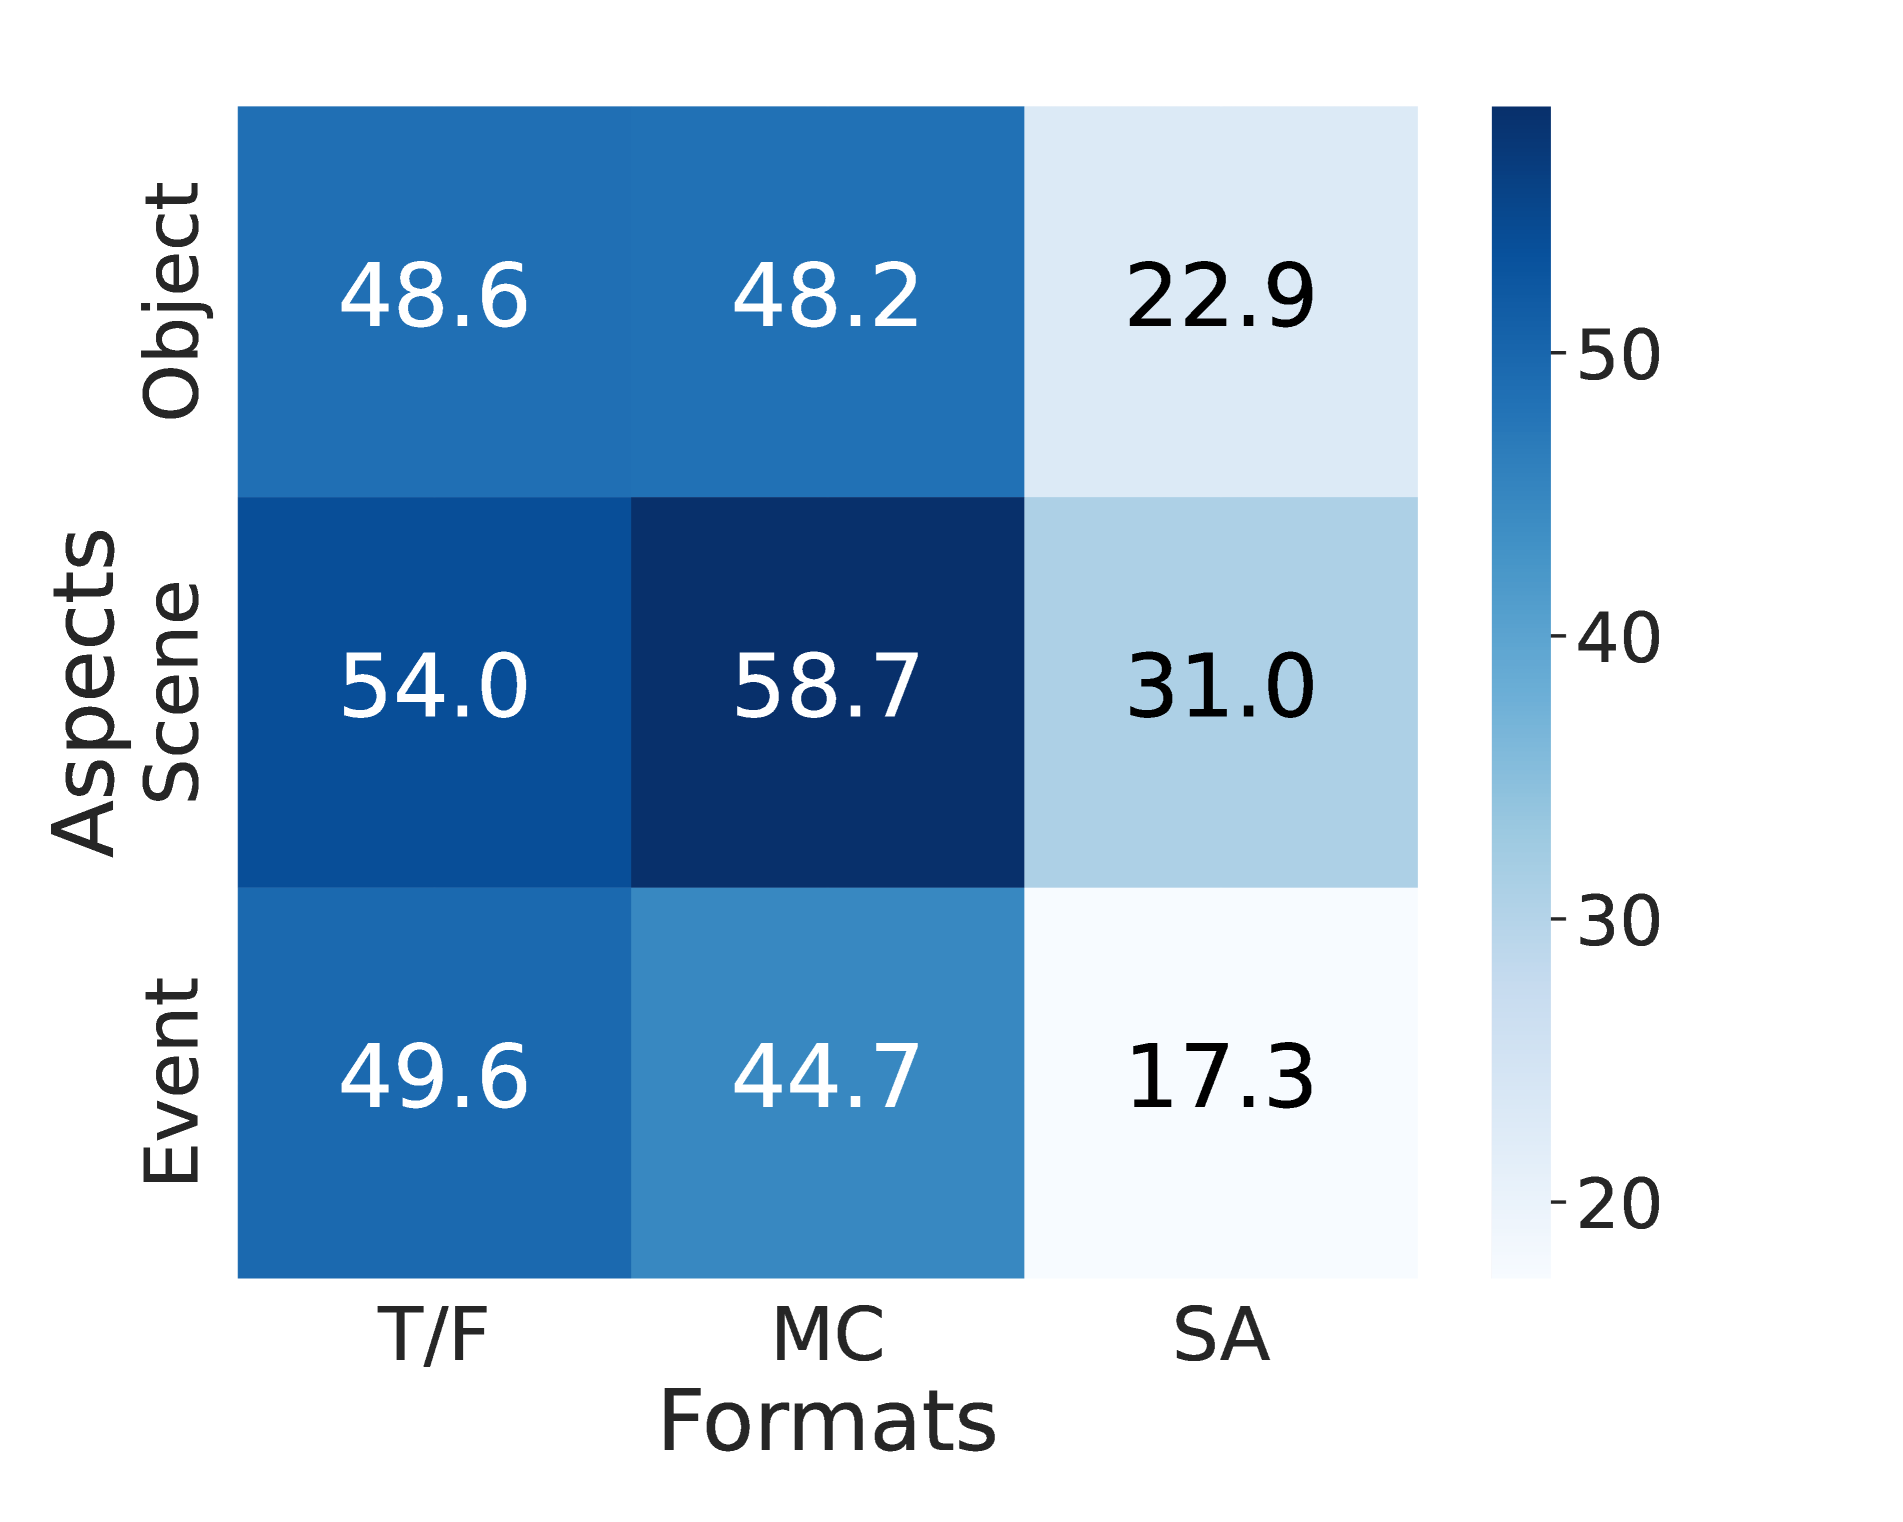
🔼 This heatmap visualizes the accuracy of Large Multimodal Models (LMMs) in video understanding tasks, broken down by question format and hallucination aspect. The x-axis represents the three question formats used in the HAVEN benchmark: True/False (T/F), Multiple Choice (MC), and Short Answer (SA). The y-axis represents the three hallucination aspects: Object, Scene, and Event. Each cell in the heatmap shows the average accuracy across all models for that specific combination of question format and hallucination aspect. This allows for a detailed analysis of model performance across different question types and the types of hallucinations they struggle with.
read the caption
(b) Formats-Aspects

🔼 This heatmap visualizes the relationship between question formats (binary-choice, multiple-choice, short-answer) and hallucination causes (prior knowledge conflict, in-context conflict, capability deficiency) in terms of model accuracy. Each cell represents the average accuracy across all models for a specific combination of question format and hallucination cause. It provides a concise overview of how different question types and hallucination sources affect model performance, allowing for a comparison of accuracy across different scenarios. Warmer colors indicate higher accuracy.
read the caption
(c) Formats-Causes

🔼 This figure presents three heatmaps, each visualizing the accuracy of Large Multimodal Models (LMMs) across two dimensions. The first heatmap shows accuracy based on the cause of hallucination (Prior Conflict, In-context Conflict, Capability Deficiency) and the aspect of hallucination (Object, Scene, Event). The second heatmap shows accuracy based on question format (True/False, Multiple-Choice, Short-Answer) and the aspect of hallucination. The third heatmap shows accuracy based on question format and the cause of hallucination. The heatmaps use color intensity to represent accuracy, with warmer colors indicating higher accuracy.
read the caption
Figure 5: Accuracy heatmap along two dimensions.

🔼 This figure visualizes the impact of the number of sampled frames on the performance of various large multimodal models (LMMs) in video understanding tasks. It shows that increasing the number of sampled frames initially improves model accuracy, but beyond a certain point, the performance starts to decline. The figure also displays the bias score for each model, showing the consistency of responses across different variants of the same question. The x-axis represents the number of sampled frames, and the y-axis shows the accuracy and bias scores for each model.
read the caption
Figure 6: Relationship between number of sampling frames and model performance.

🔼 This figure visualizes the relationship between model size and the performance of different models on two metrics: hallucination and consistency. The x-axis represents the model size, categorized into 3B, 7B, 13B, and 34B parameter models. The y-axis for the left graph shows accuracy, while the y-axis for the right graph shows bias score (a measure of consistency). For each model size category, multiple models are included, and the graph displays their mean accuracy and bias scores, along with standard deviation error bars. This visualization helps assess how model size impacts both hallucination rates (higher accuracy means lower hallucination) and consistency (lower bias score indicates higher consistency) in multimodal video understanding tasks.
read the caption
(a) Hallucination

🔼 The figure visualizes the consistency evaluation results, specifically showcasing bias scores for different models across various sizes. Lower bias scores indicate better consistency in model responses. It compares performance across different model sizes (3B, 7B, 13B, 34B parameters) for multiple model types, highlighting the relationship between model size and response consistency.
read the caption
(b) Consistency

🔼 This figure visualizes the correlation between the size of large multimodal models (LMMs) and their performance on video understanding tasks, specifically focusing on reducing hallucinations. It shows how accuracy and bias scores (indicating consistency of responses) change as the number of model parameters increases. The plot includes regression lines for different model categories, highlighting overall trends despite some individual model variations. Larger models generally exhibit higher accuracy and lower bias, suggesting a positive relationship between model scale and performance in mitigating hallucinations.
read the caption
Figure 7: Relationship between model size and performance.
More on tables
| Model/Type | Prior | In-context | Capability | Total | ||||||
|---|---|---|---|---|---|---|---|---|---|---|
| Object | Scene | Event | Object | Scene | Event | Object | Scene | Event | ||
| VideoChatGPT-7B[64] | 34.78 | 43.88 | 38.00 | 17.02 | 13.41 | 17.57 | 32.52 | 47.11 | 20.51 | 34.69 |
| Valley-Eagle-7B [101] | 68.55 | 75.95 | 63.52 | 24.47 | 43.90 | 15.10 | \ul57.36 | 55.37 | \ul47.43 | 61.29 |
| VideoLLaVA-7B [52] | 47.55 | 57.29 | 50.59 | 14.89 | 12.19 | 10.15 | 35.68 | 33.88 | 34.61 | 43.73 |
| VideoChat2-7B [44] | 43.20 | 48.98 | 43.00 | \ul30.85 | 26.83 | \ul26.00 | 26.74 | 28.92 | 33.33 | 39.11 |
| ShareGPT4Video [6] | 51.48 | 62.24 | 48.27 | 17.02 | 19.51 | 8.91 | 43.00 | 38.84 | 32.05 | 46.28 |
| LLaVA-v1.5-7B [59] | 52.03 | 62.24 | 49.85 | 20.21 | 36.58 | 17.33 | 45.35 | 42.98 | 46.15 | 48.33 |
| LLaMA-VID-7B [51] | 48.75 | 56.71 | 50.09 | 20.21 | 21.95 | 21.78 | 37.76 | 42.98 | 29.49 | 45.31 |
| LLaMA-VID-13B [51] | 47.82 | 54.23 | 49.29 | 12.76 | 29.26 | 5.20 | 40.65 | 38.01 | 32.05 | 43.91 |
| PLLaVA-7B [103] | 44.26 | 60.93 | 41.41 | 20.21 | 37.80 | 9.90 | 43.63 | 15.70 | 32.05 | 40.17 |
| PLLaVA-13B [103] | \ul62.02 | \ul69.39 | \ul56.55 | 21.28 | \ul50.00 | 15.10 | 48.60 | 46.28 | 44.87 | 54.87 |
| Qwen2.5-VL-3B-Instruct [86] | 52.36 | 65.31 | 49.12 | 20.21 | 37.80 | 5.20 | 43.63 | 15.70 | 32.05 | 46.85 |
| Qwen2.5-VL-7B-Instruct [86] | 55.97 | 60.05 | 50.25 | 20.21 | 32.93 | 8.66 | 53.39 | 44.63 | 34.61 | 50.19 |
| LLaVA-NeXT-Video-DPO-7B [113] | 49.35 | 57.58 | 49.86 | 15.96 | 31.71 | 12.62 | 38.12 | 43.80 | 41.03 | 45.25 |
| LLaVA-NeXT-Video-DPO-34B [113] | 52.59 | 60.79 | 47.42 | 22.34 | 34.15 | 7.67 | 45.17 | 41.32 | 26.92 | 46.81 |
| Video-LLaMA-2-13B [9] | 28.95 | 40.96 | 30.80 | 11.70 | 9.76 | 12.62 | 16.71 | 21.49 | 26.92 | 26.97 |
| GPT-4o-mini [28] | 52.87 | 59.47 | 54.79 | 58.51 | 64.63 | 62.13 | 63.50 | \ul52.89 | 60.26 | \ul56.80 |
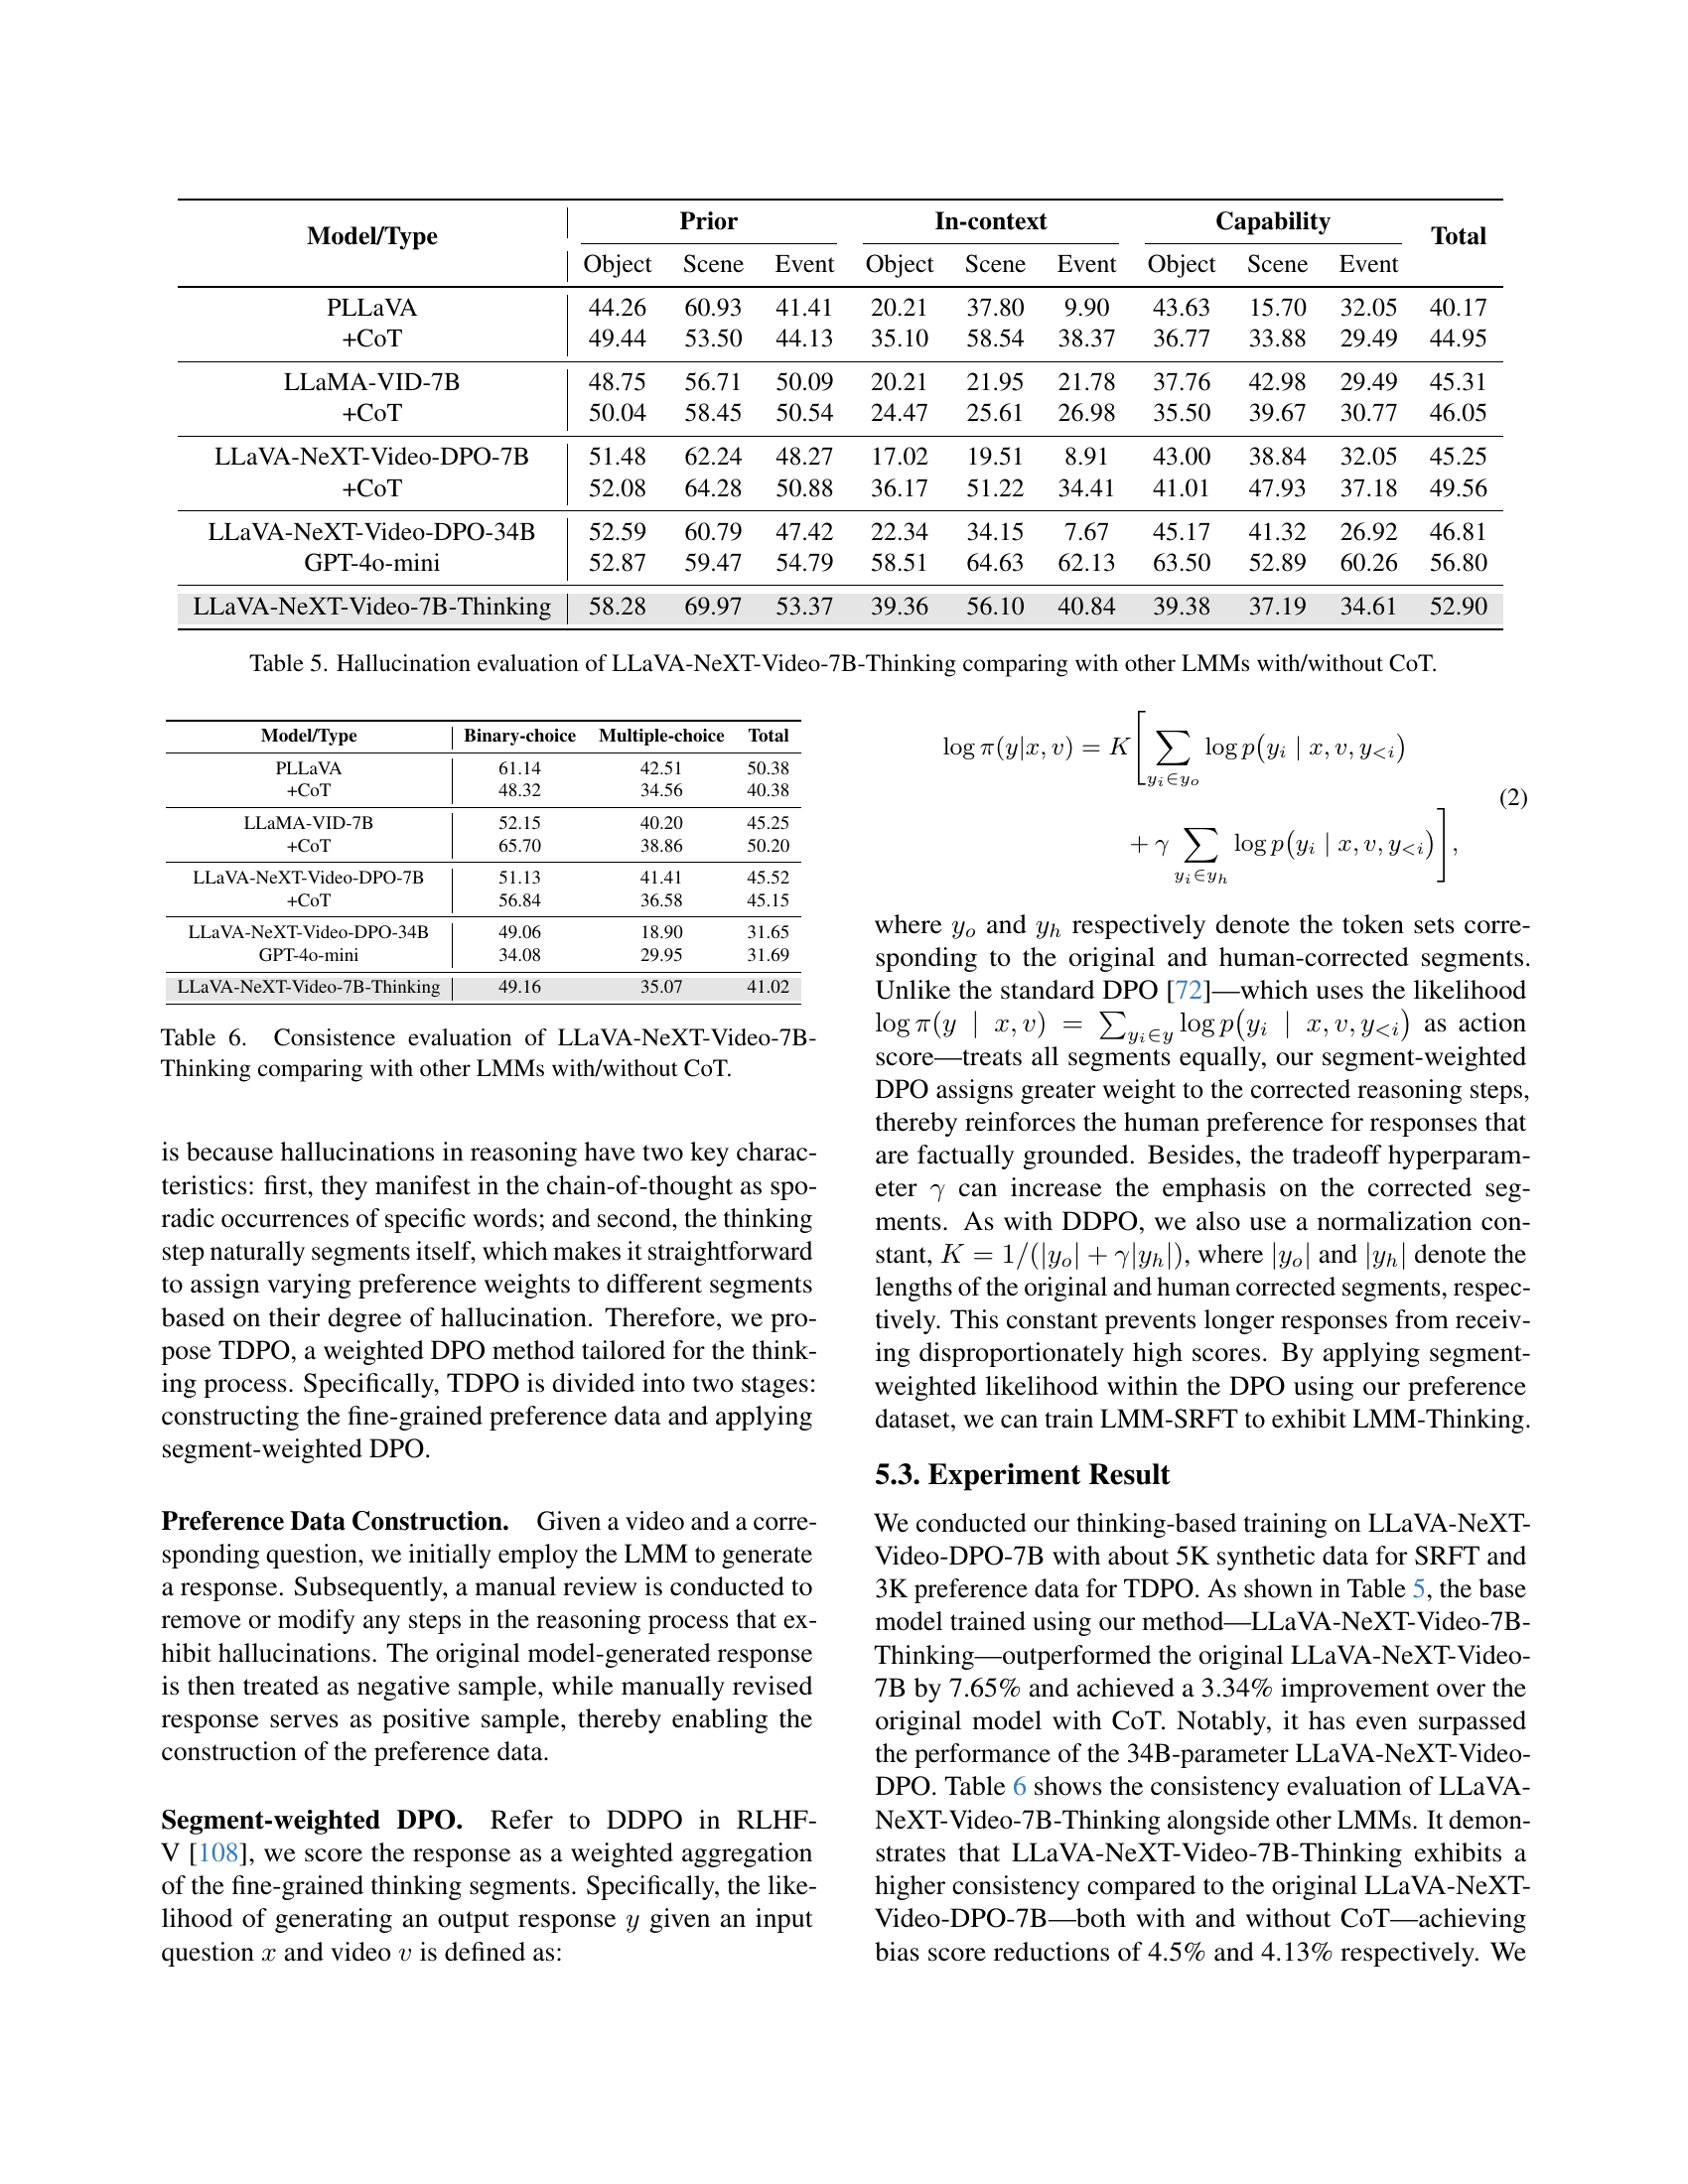
🔼 This table presents a comprehensive evaluation of 16 Large Multimodal Models (LMMs) on their ability to accurately answer questions about videos. The evaluation is broken down by three categories of hallucination causes (prior knowledge conflict, in-context conflict, capability deficiency) and three aspects of video content (object, scene, event). For each LMM, the table shows the accuracy of its answers for each combination of cause and aspect. The highest accuracy for each row is bolded, while the second highest is underlined. This provides a detailed comparison of the models’ strengths and weaknesses in handling different types of video understanding tasks and allows for analysis of the relationship between model performance and the type of hallucination present.
read the caption
Table 2: Hallucination Evaluation. Accuracy of LMMs on questions of different types of hallucination targets across three causes. The bold font indicates the best performance, and the \ulunderline mark indicates the second-best.
| Model/Type | Prior | In-context | Capability | Total | ||||||
|---|---|---|---|---|---|---|---|---|---|---|
| Object | Scene | Event | Object | Scene | Event | Object | Scene | Event | ||
| PLLaVA | 44.26 | 60.93 | 41.41 | 20.21 | 37.80 | 9.90 | 43.63 | 15.70 | 32.05 | 40.17 |
| +CoT | 49.44 | 53.50 | 44.13 | 35.10 | 58.54 | 38.37 | 36.77 | 33.88 | 29.49 | 44.95 |
| LLaMA-VID-7B | 48.75 | 56.71 | 50.09 | 20.21 | 21.95 | 21.78 | 37.76 | 42.98 | 29.49 | 45.31 |
| +CoT | 50.04 | 58.45 | 50.54 | 24.47 | 25.61 | 26.98 | 35.50 | 39.67 | 30.77 | 46.05 |
| LLaVA-NeXT-Video-DPO-7B | 51.48 | 62.24 | 48.27 | 17.02 | 19.51 | 8.91 | 43.00 | 38.84 | 32.05 | 45.25 |
| +CoT | 52.08 | 64.28 | 50.88 | 36.17 | 51.22 | 34.41 | 41.01 | 47.93 | 37.18 | 49.56 |
| LLaVA-NeXT-Video-DPO-34B | 52.59 | 60.79 | 47.42 | 22.34 | 34.15 | 7.67 | 45.17 | 41.32 | 26.92 | 46.81 |
| GPT-4o-mini | 52.87 | 59.47 | 54.79 | 58.51 | 64.63 | 62.13 | 63.50 | 52.89 | 60.26 | 56.80 |
| LLaVA-NeXT-Video-7B-Thinking | 58.28 | 69.97 | 53.37 | 39.36 | 56.10 | 40.84 | 39.38 | 37.19 | 34.61 | 52.90 |
🔼 This table presents the consistency evaluation results for 16 different Large Multimodal Models (LMMs). The evaluation focuses on how consistent the models’ responses are across various question formats and versions designed to test for response biases. Lower bias scores indicate higher consistency, meaning the model provides similar answers even when the question is slightly rephrased or its options are reordered. The table breaks down the bias scores by question type (binary-choice, multiple-choice), providing a comprehensive view of model consistency.
read the caption
Table 3: Consistence Evaluation
Full paper#