TL;DR#
Current vision pre-training is limited to low resolutions due to the high computational cost of processing larger images. This limitation hinders the perception of visual details crucial for many real-world tasks. To address this, the paper introduces PS3, a new approach that scales CLIP-style vision pre-training to 4K resolution while maintaining a near-constant cost. The key idea is to selectively process local regions and contrasting them with detailed captions, reducing the computational overhead significantly.
PS3 enables the development of VILA-HD, an MLLM. Experiments show VILA-HD achieves better high-resolution visual perception using fewer tokens. PS3 enables scaling properties of VILA-HD, including free resolution scaling & test-time compute scaling for better performance. The paper also introduces 4KPro, a new benchmark of image QA at 4K resolution, where VILA-HD outperforms existing MLLMs.
Key Takeaways#
Why does it matter?#
This paper introduces PS3 to achieve high-resolution perception with near-constant cost, scales CLIP-style pre-training to 4K, and achieves better performance & efficiency, which can inspire future research about MLLMs.
Visual Insights#

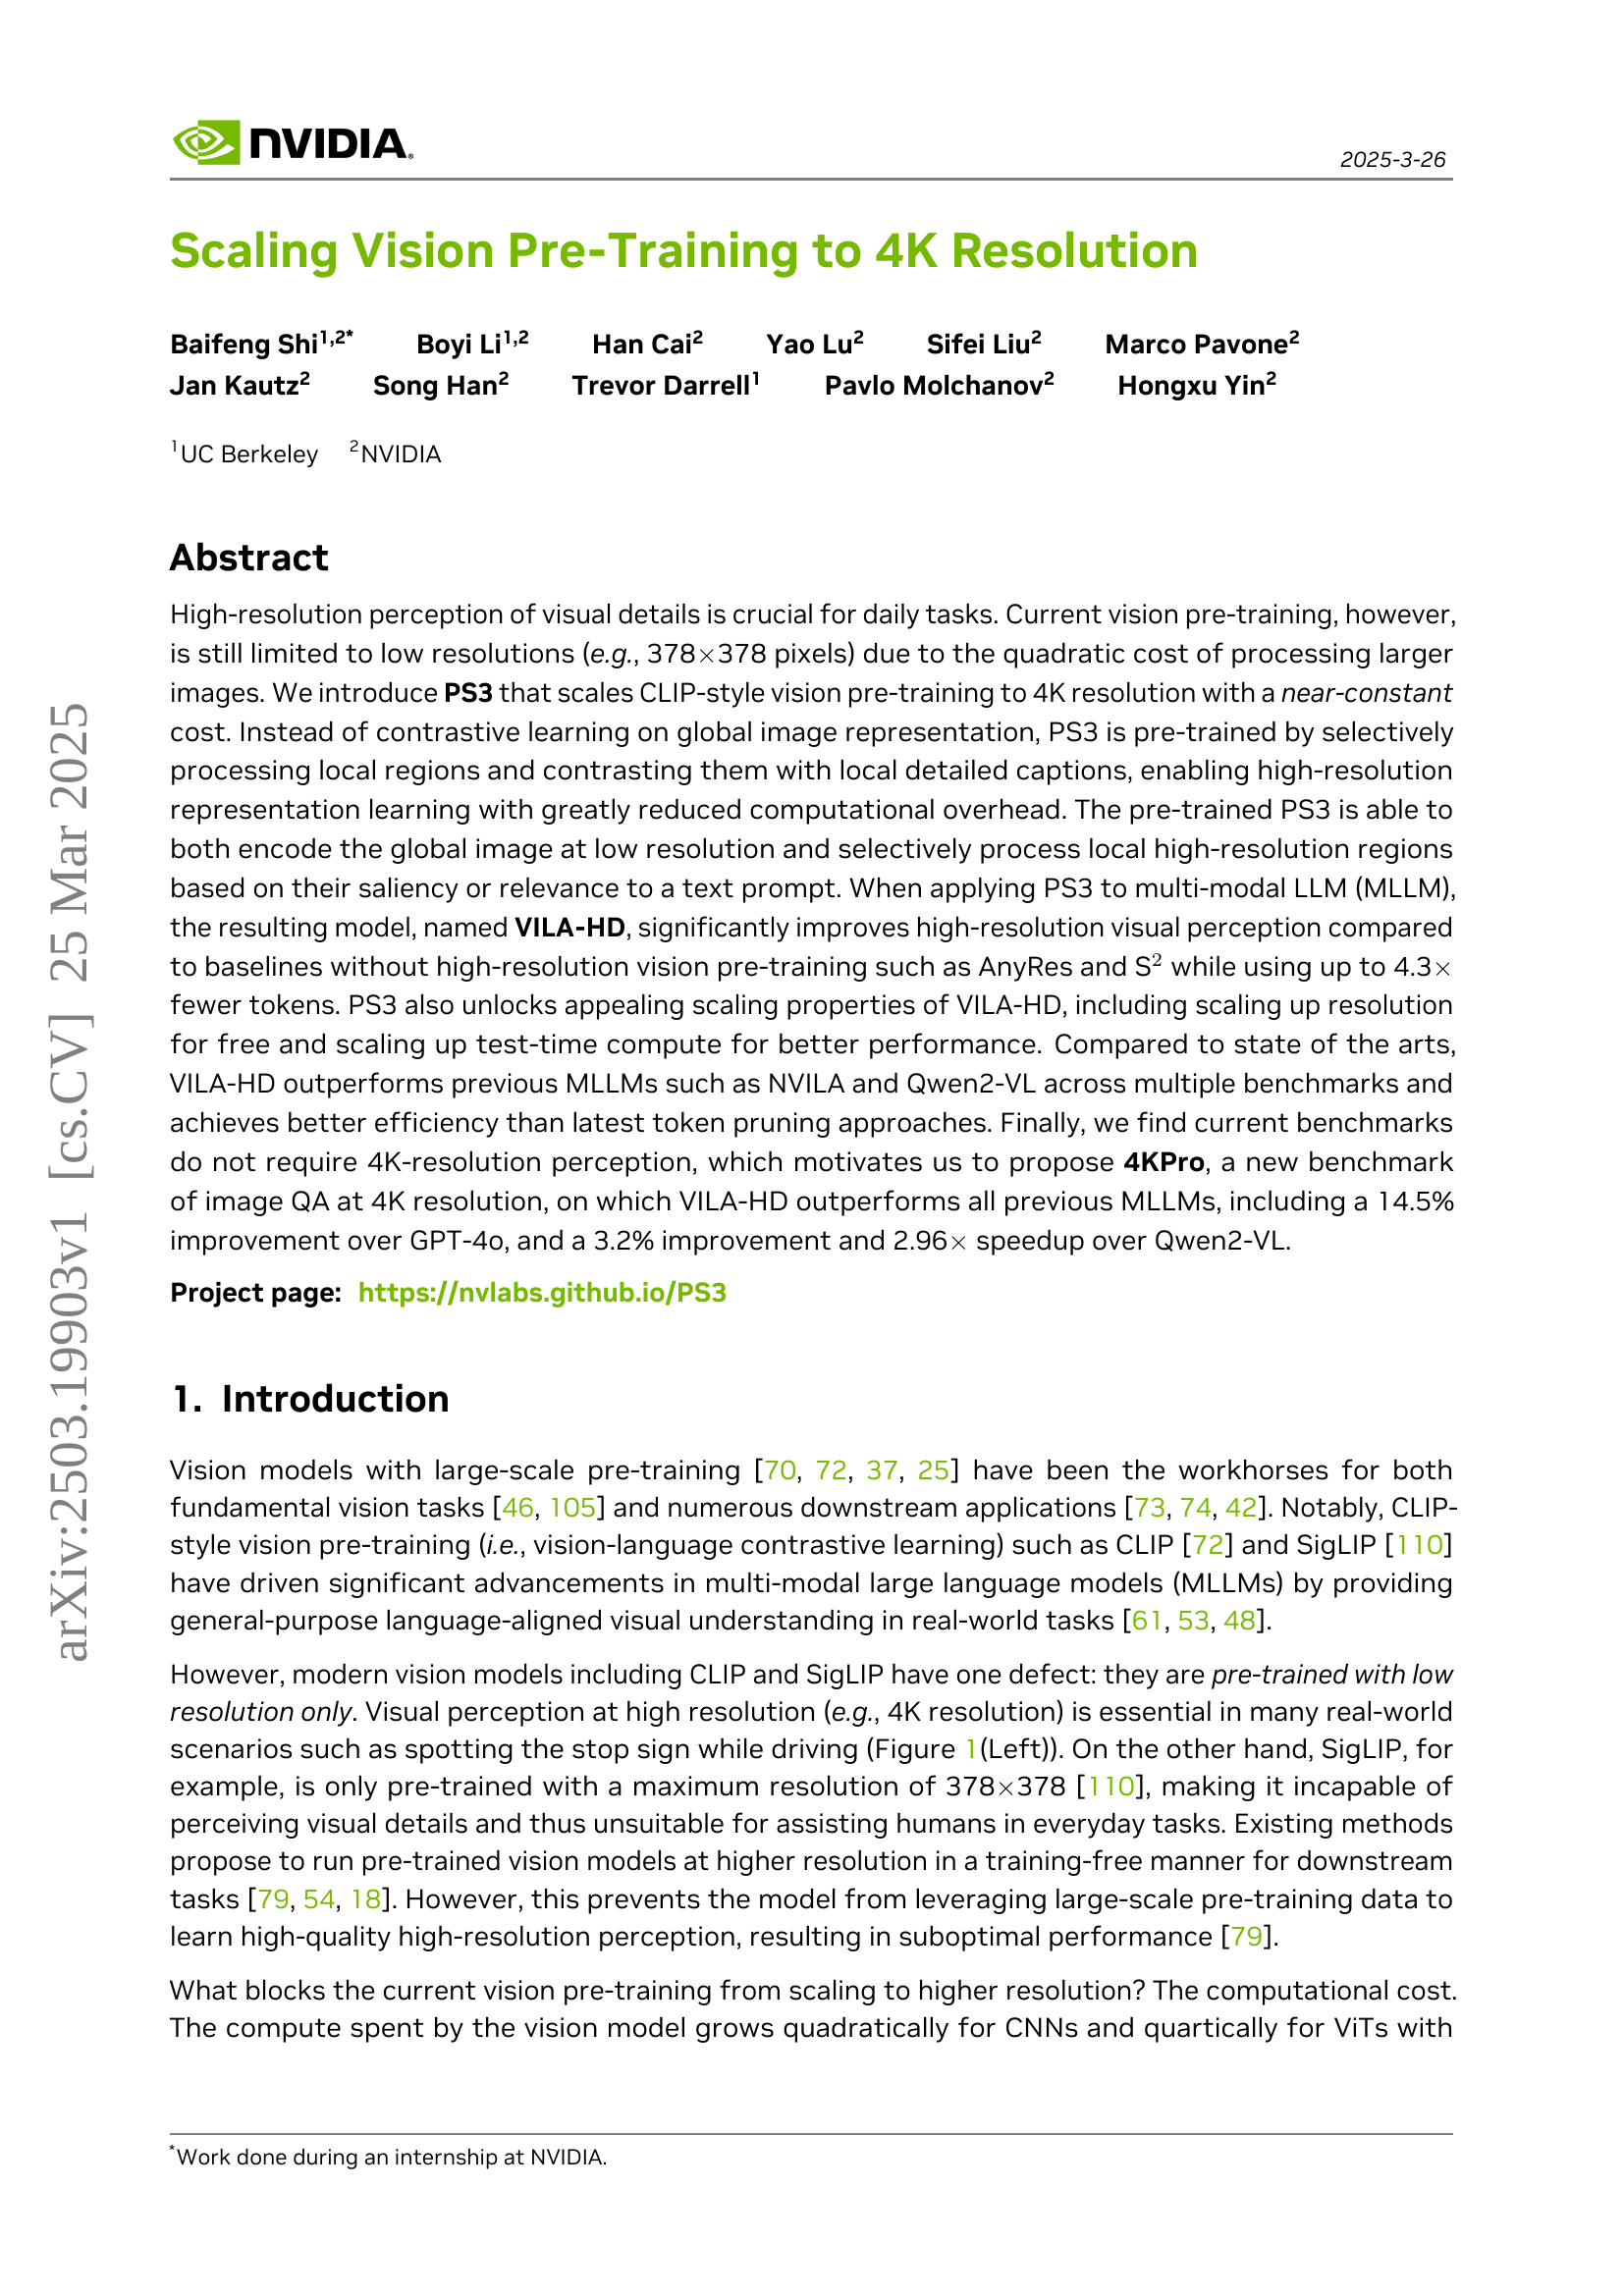
🔼 Figure 1 illustrates the core concept of PS3 and its application in VILA-HD, highlighting its advantages over existing methods. The left panel contrasts regular vision models (e.g. SigLIP), which process images at low resolution (378x378 pixels) insufficient for tasks like stop sign detection, with PS3’s ability to process high-resolution (4K) images efficiently. PS3 achieves this via top-down patch selection, focusing only on relevant regions as specified by a text prompt. The top-right panel shows the difference in training approach. SigLIP uses costly global image-caption contrasting, while PS3 leverages local region-caption contrasting at high-resolution, resulting in a 79x reduction in computational cost. Finally, the bottom-right panel showcases VILA-HD (using PS3 as the vision encoder), demonstrating superior performance and 2.96x speedup over Qwen2-VL on the 4KPro benchmark by selectively processing high-resolution image regions as determined by user prompts.
read the caption
Figure 1: Left: Regular vision models such as SigLIP processes images at a low resolution (e.g., 378 ×\times× 378 pixels), which is not enough for many daily tasks such as spotting the stop sign while driving. In contrast, \modelis able to both encode low-res features and efficiently process high-res information of 4K-resolution images via top-down patch selection, i.e., selectively processing relevant patches based on any text prompt. Top Right: SigLIP is pre-trained by contrasting global vision features and global captions, which is costly for high-resolution images. \modelis pre-trained with additional contrast between local high-res features with local captions, enabling pre-training at 4K resolution with 79×\times× less cost than SigLIP. Bottom Right: VILA-HD with \modelas the vision encoder is able to select high-res regions to process based on the user prompt. VILA-HD outperforms state-of-the-art MLLMs such as Qwen2-VL [93] on the proposed 4KPro benchmark while achieving 2.96×\times× speedup.
| Vision Encoder | Max Res. | #HR Token | Select (Train) | Select (Test) | Text VQA | Chart QA | Doc VQA | Info VQA | OCR Bench | V∗ Bench | Real World | Avg |
| SigLIP [110] | 378 | 0 | - | - | 62.3 | 56.6 | 51.9 | 30.7 | 387 | 51.8 | 57.1 | 49.9 |
| AnyRes [54] | 756 | 784† | - | - | 65.3 | 58.0 | 60.6 | 32.7 | 416 | 59.2 | 59.1 | 53.8 |
| \stwo [79] | 756 | 729 | - | - | 65.9 | 65.5 | 63.0 | 32.3 | 471 | 53.1 | 59.6 | 55.2 |
| 756 | 320 | 44% | 44% | 66.7 | 62.8 | 62.6 | 33.1 | 460 | 56.3 | 61.7 | 55.6 | |
| \model | 756 | 729 | 100% | 100% | 66.8 | 63.5 | 64.6 | 33.9 | 462 | 56.5 | 61.7 | 56.2 |
| AnyRes [54] | 1512 | 3136† | - | - | 67.4 | 58.4 | 67.9 | 34.1 | 468 | 60.2 | 59.0 | 56.3 |
| \stwo [79] | 1512 | 2916 | - | - | 66.1 | 71.0 | 78.3 | 41.1 | 526 | 55.2 | 61.0 | 60.8 |
| 1512 | 729 | 20% | 20% | 67.3 | 64.7 | 66.5 | 34.8 | 505 | 60.7 | 62.6 | 58.2 | |
| 1512 | 1600 | 20% | 44% | 67.7 | 65.9 | 70.7 | 35.7 | 515 | 62.0 | 62.6 | 59.4 | |
| 1512 | 1600 | 44% | 44% | 68.4 | 68.0 | 74.5 | 37.3 | 509 | 63.1 | 65.0 | 61.0 | |
| 1512 | 3645 | 44% | 100% | 68.4 | 68.0 | 76.5 | 39.4 | 522 | 66.7 | 62.0 | 61.9 | |
| \model | 1512 | 3645 | 100% | 100% | 69.3 | 71.1 | 79.4 | 41.3 | 534 | 64.0 | 63.8 | 63.2 |
| AnyRes [54] | 3780 | 19600† | - | - | OOM | |||||||
| \stwo [79] | 3780 | 18225 | - | - | OOM | |||||||
| \model | 3780 | 3840 | 18% | 18% | 69.8 | 70.9 | 79.1 | 40.5 | 543 | 67.8 | 64.7 | 63.9 |
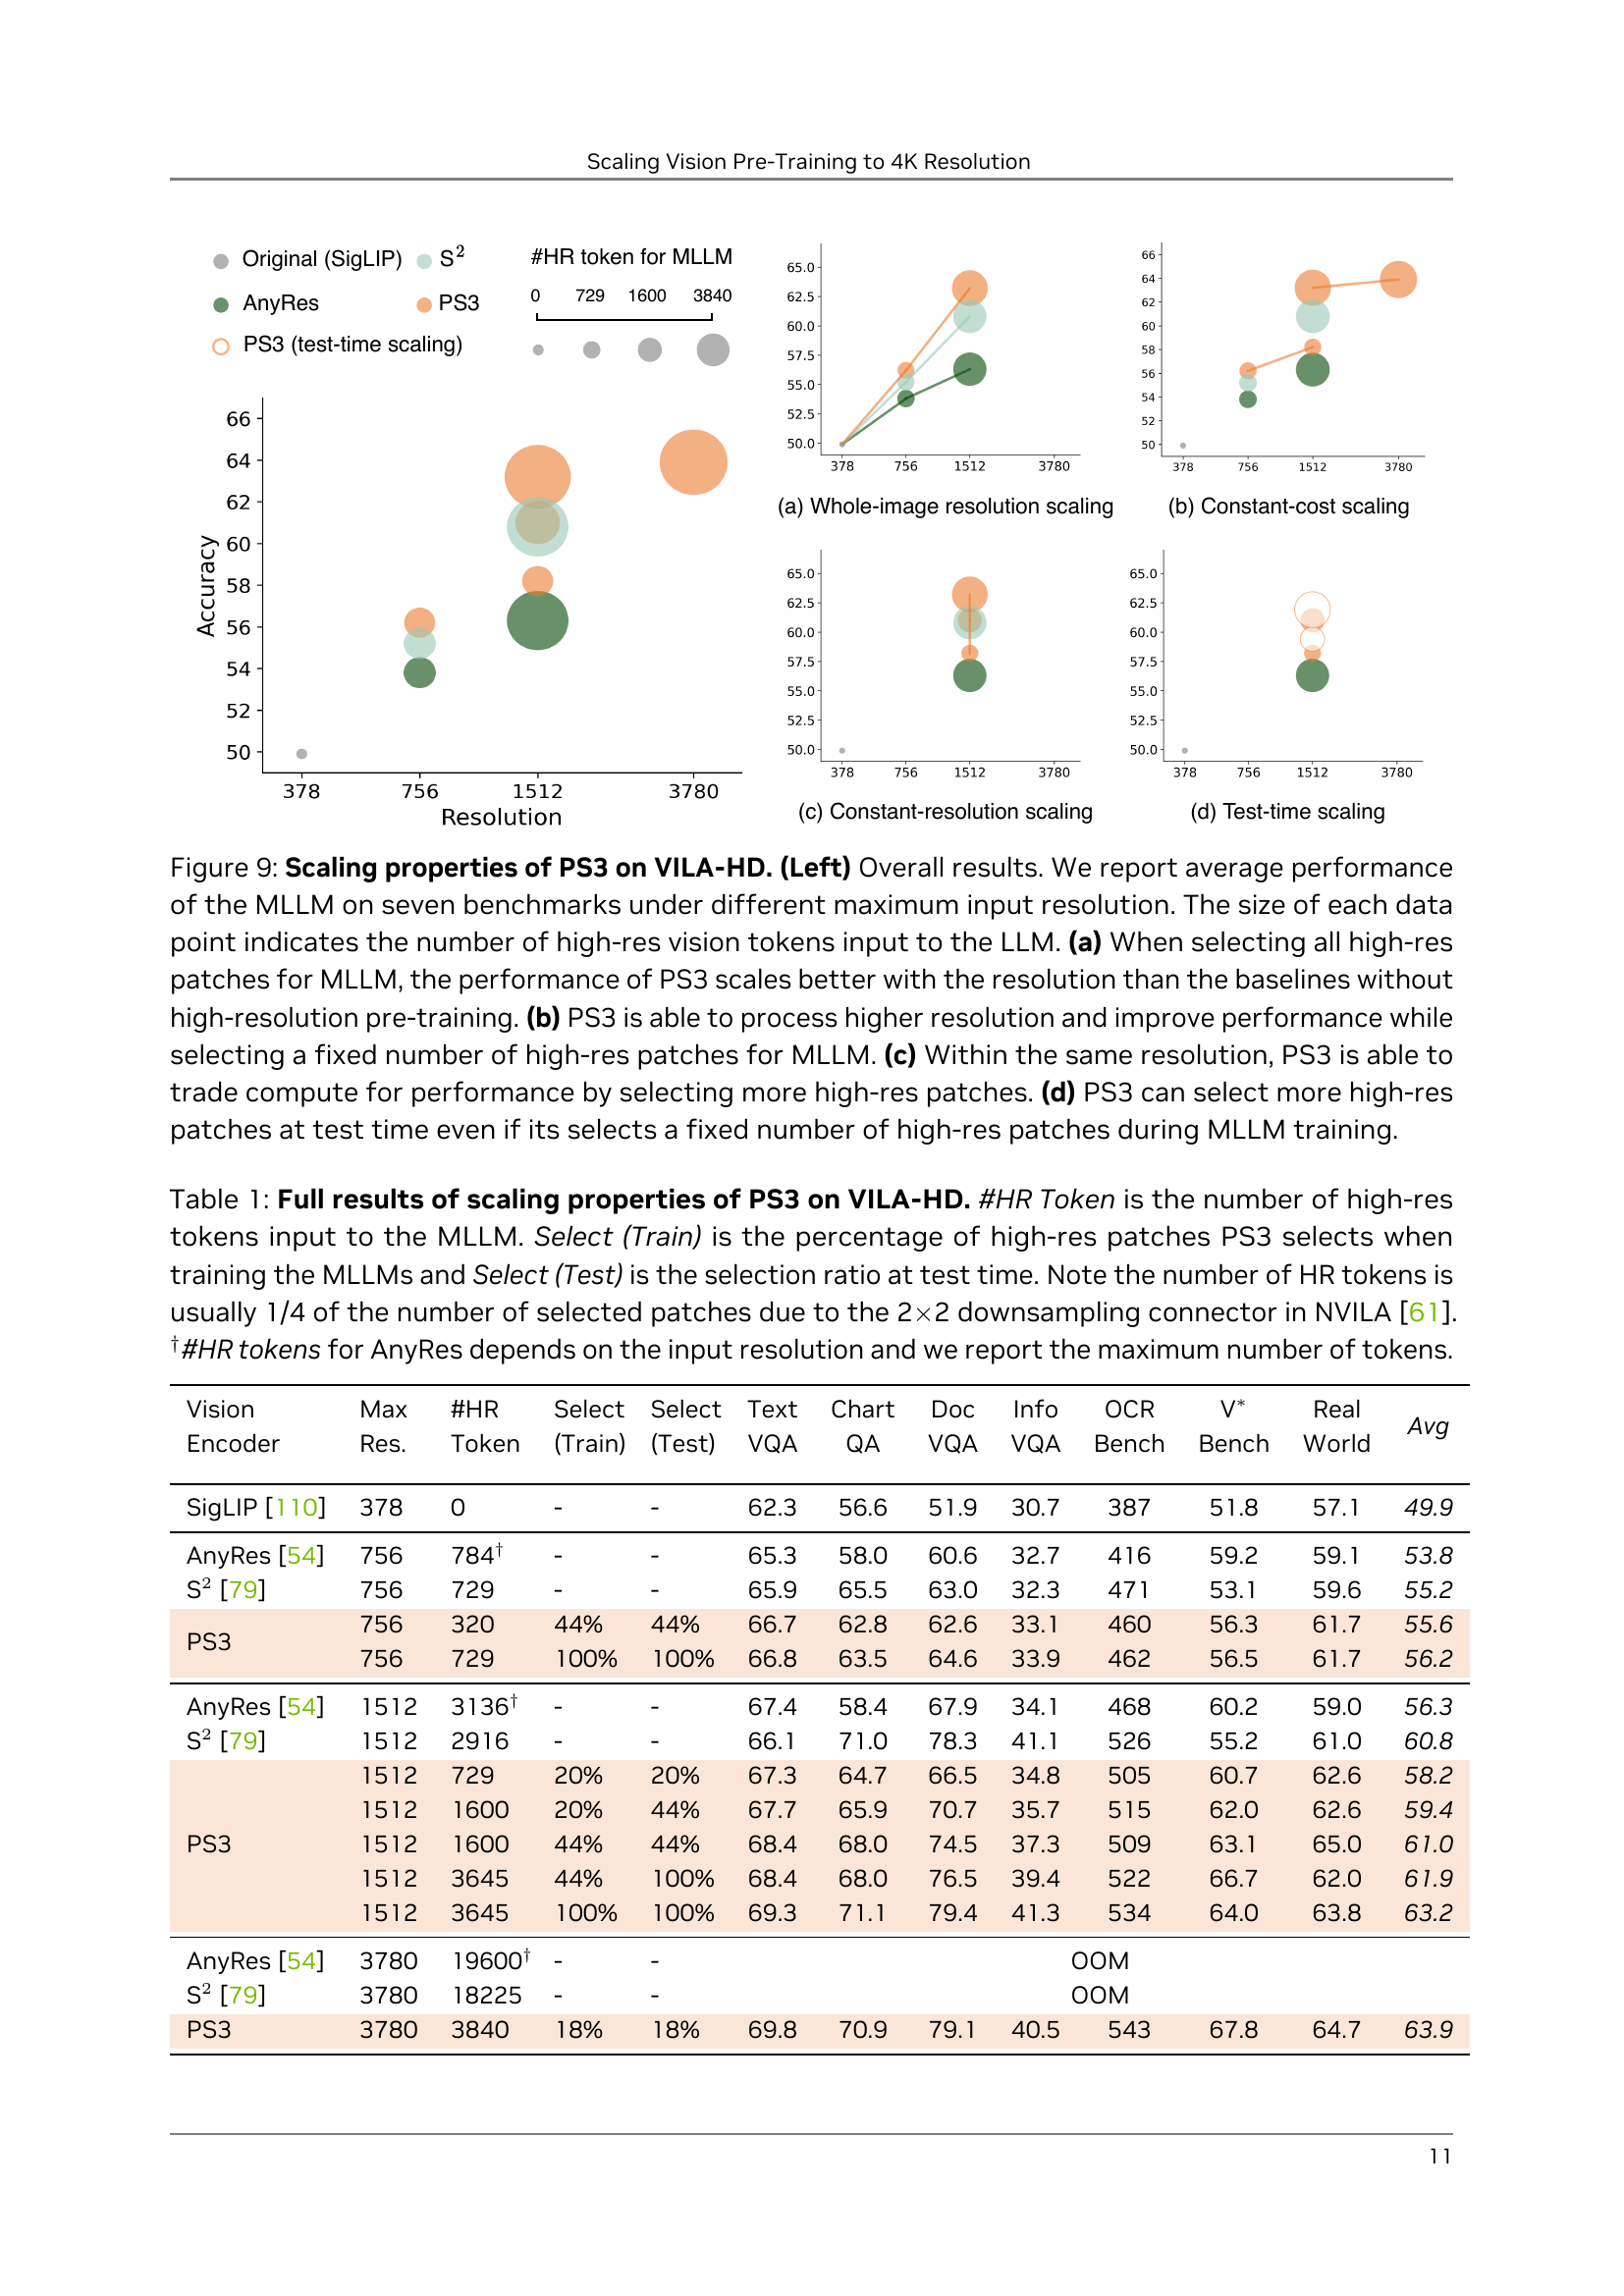
🔼 This table presents a comprehensive analysis of the scaling properties of the PS3 model within the VILA-HD framework. It examines various scaling scenarios by varying the pre-training resolution and the number of high-resolution patches selected during training and testing. Key metrics include the number of high-resolution tokens fed into the multi-modal large language model (MLLM), the percentage of high-resolution patches selected during training and testing, and the average accuracy across multiple benchmarks. The impact of different scaling strategies on overall performance and efficiency is evaluated, considering the trade-offs between resolution, compute cost, and accuracy. Note that due to the downsampling process in NVILA, the number of high-resolution tokens usually represents only a quarter of the selected patches.
read the caption
Table 1: Full results of scaling properties of \modelon \vilamodel. #HR Token is the number of high-res tokens input to the MLLM. Select (Train) is the percentage of high-res patches \modelselects when training the MLLMs and Select (Test) is the selection ratio at test time. Note the number of HR tokens is usually 1/4 of the number of selected patches due to the 2×\times×2 downsampling connector in NVILA [61]. †#HR tokens for AnyRes depends on the input resolution and we report the maximum number of tokens.
In-depth insights#
4K Vision Unlock#
4K Vision Unlock signifies a pivotal advancement in computer vision, potentially mirroring the transformative impact of high-resolution displays on human perception.** Unlocking 4K vision** for AI models could revolutionize fields requiring detailed visual analysis, such as medical imaging, autonomous driving, and remote sensing. Models could discern finer patterns, leading to more accurate diagnoses, safer navigation, and more precise environmental monitoring. This leap necessitates overcoming significant computational hurdles, primarily the quadratic or quartic increase in processing cost for CNNs and ViTs respectively. Efficient architectures, selective processing, and novel training paradigms are crucial to realizing the full potential of 4K vision in AI, promising enhanced capabilities and broadened applications. The challenge lies not only in achieving 4K resolution but also in ensuring the extracted information is relevant and efficiently utilized for downstream tasks, maximizing both accuracy and computational efficiency.
Scale-Selective#
Scale-selective processing is crucial for balancing detail and computational cost in vision. The ability to selectively focus on different scales (resolutions) depending on the task is key. A model should discern overall context at lower resolutions while extracting fine-grained details at higher resolutions only when needed. This mimics human visual processing, improving efficiency and enabling the processing of large images at a reasonable cost. The optimal balance varies by task; dense information tasks benefit from lower-resolution, large-scale views, while tasks requiring localized understanding prefer high-resolution details. This adaptive approach is vital for handling complex visual information in real-world applications.
4K Pro Benchmark#
The research introduces “4KPro,” a novel benchmark designed to evaluate visual perception specifically at 4K resolution, addressing a gap in existing benchmarks that don’t fully leverage 4K capabilities. Existing benchmarks contain high-res images, but the resolution needed to answer questions (MRR) is mostly under 1K. 4KPro contains questions solvable at 4K, reflecting real-world tasks in autonomous vehicles, households, gaming, and UI. It is made of multi-choice questions. PS3 outperforms other proprietary or open-source models due to the improved quality brought by the high-res pre-training.
High-Res + Lo-Cost#
The idea of “High-Res + Lo-Cost” is compelling, particularly in the context of visual processing. High-resolution images are data-rich but computationally expensive. Balancing this trade-off is crucial for real-time or resource-constrained applications. A system achieving this could leverage techniques like adaptive sampling, where only salient regions are processed at full resolution. This requires intelligent algorithms to identify and prioritize these areas. Furthermore, efficient compression and encoding schemes would be vital to reduce the overall data footprint. The system may also consider using lower-precision arithmetic for certain processing stages to further reduce costs. Successfully integrating these strategies would unlock many possibilities, allowing for more detailed scene understanding without sacrificing performance.
Localized Vision#
Localized vision is a crucial aspect of visual understanding, particularly in tasks requiring fine-grained detail recognition. It moves beyond simply processing an entire image at a low resolution; instead, it involves strategically focusing on smaller, relevant regions within a high-resolution scene. This approach mirrors human visual attention, where we selectively process areas of interest rather than every pixel. The benefits are twofold: reduced computational cost and improved accuracy in tasks like object detection or text recognition. By disentangling the region size from image resolution, models can scale to handle ultra-high-resolution images without a quadratic increase in compute. Successfully implementing localized vision hinges on effectively selecting which regions to attend to, potentially using mechanisms like saliency detection or prompt-based selection to guide the focus. This is important because not all parts of an image may be relevant, and in order to achieve better efficiency we can selectively choose important regions. Furthermore, training strategies that emphasize contrastive learning between local image regions and corresponding descriptions, while adding mechanisms for reasoning.
More visual insights#
More on figures

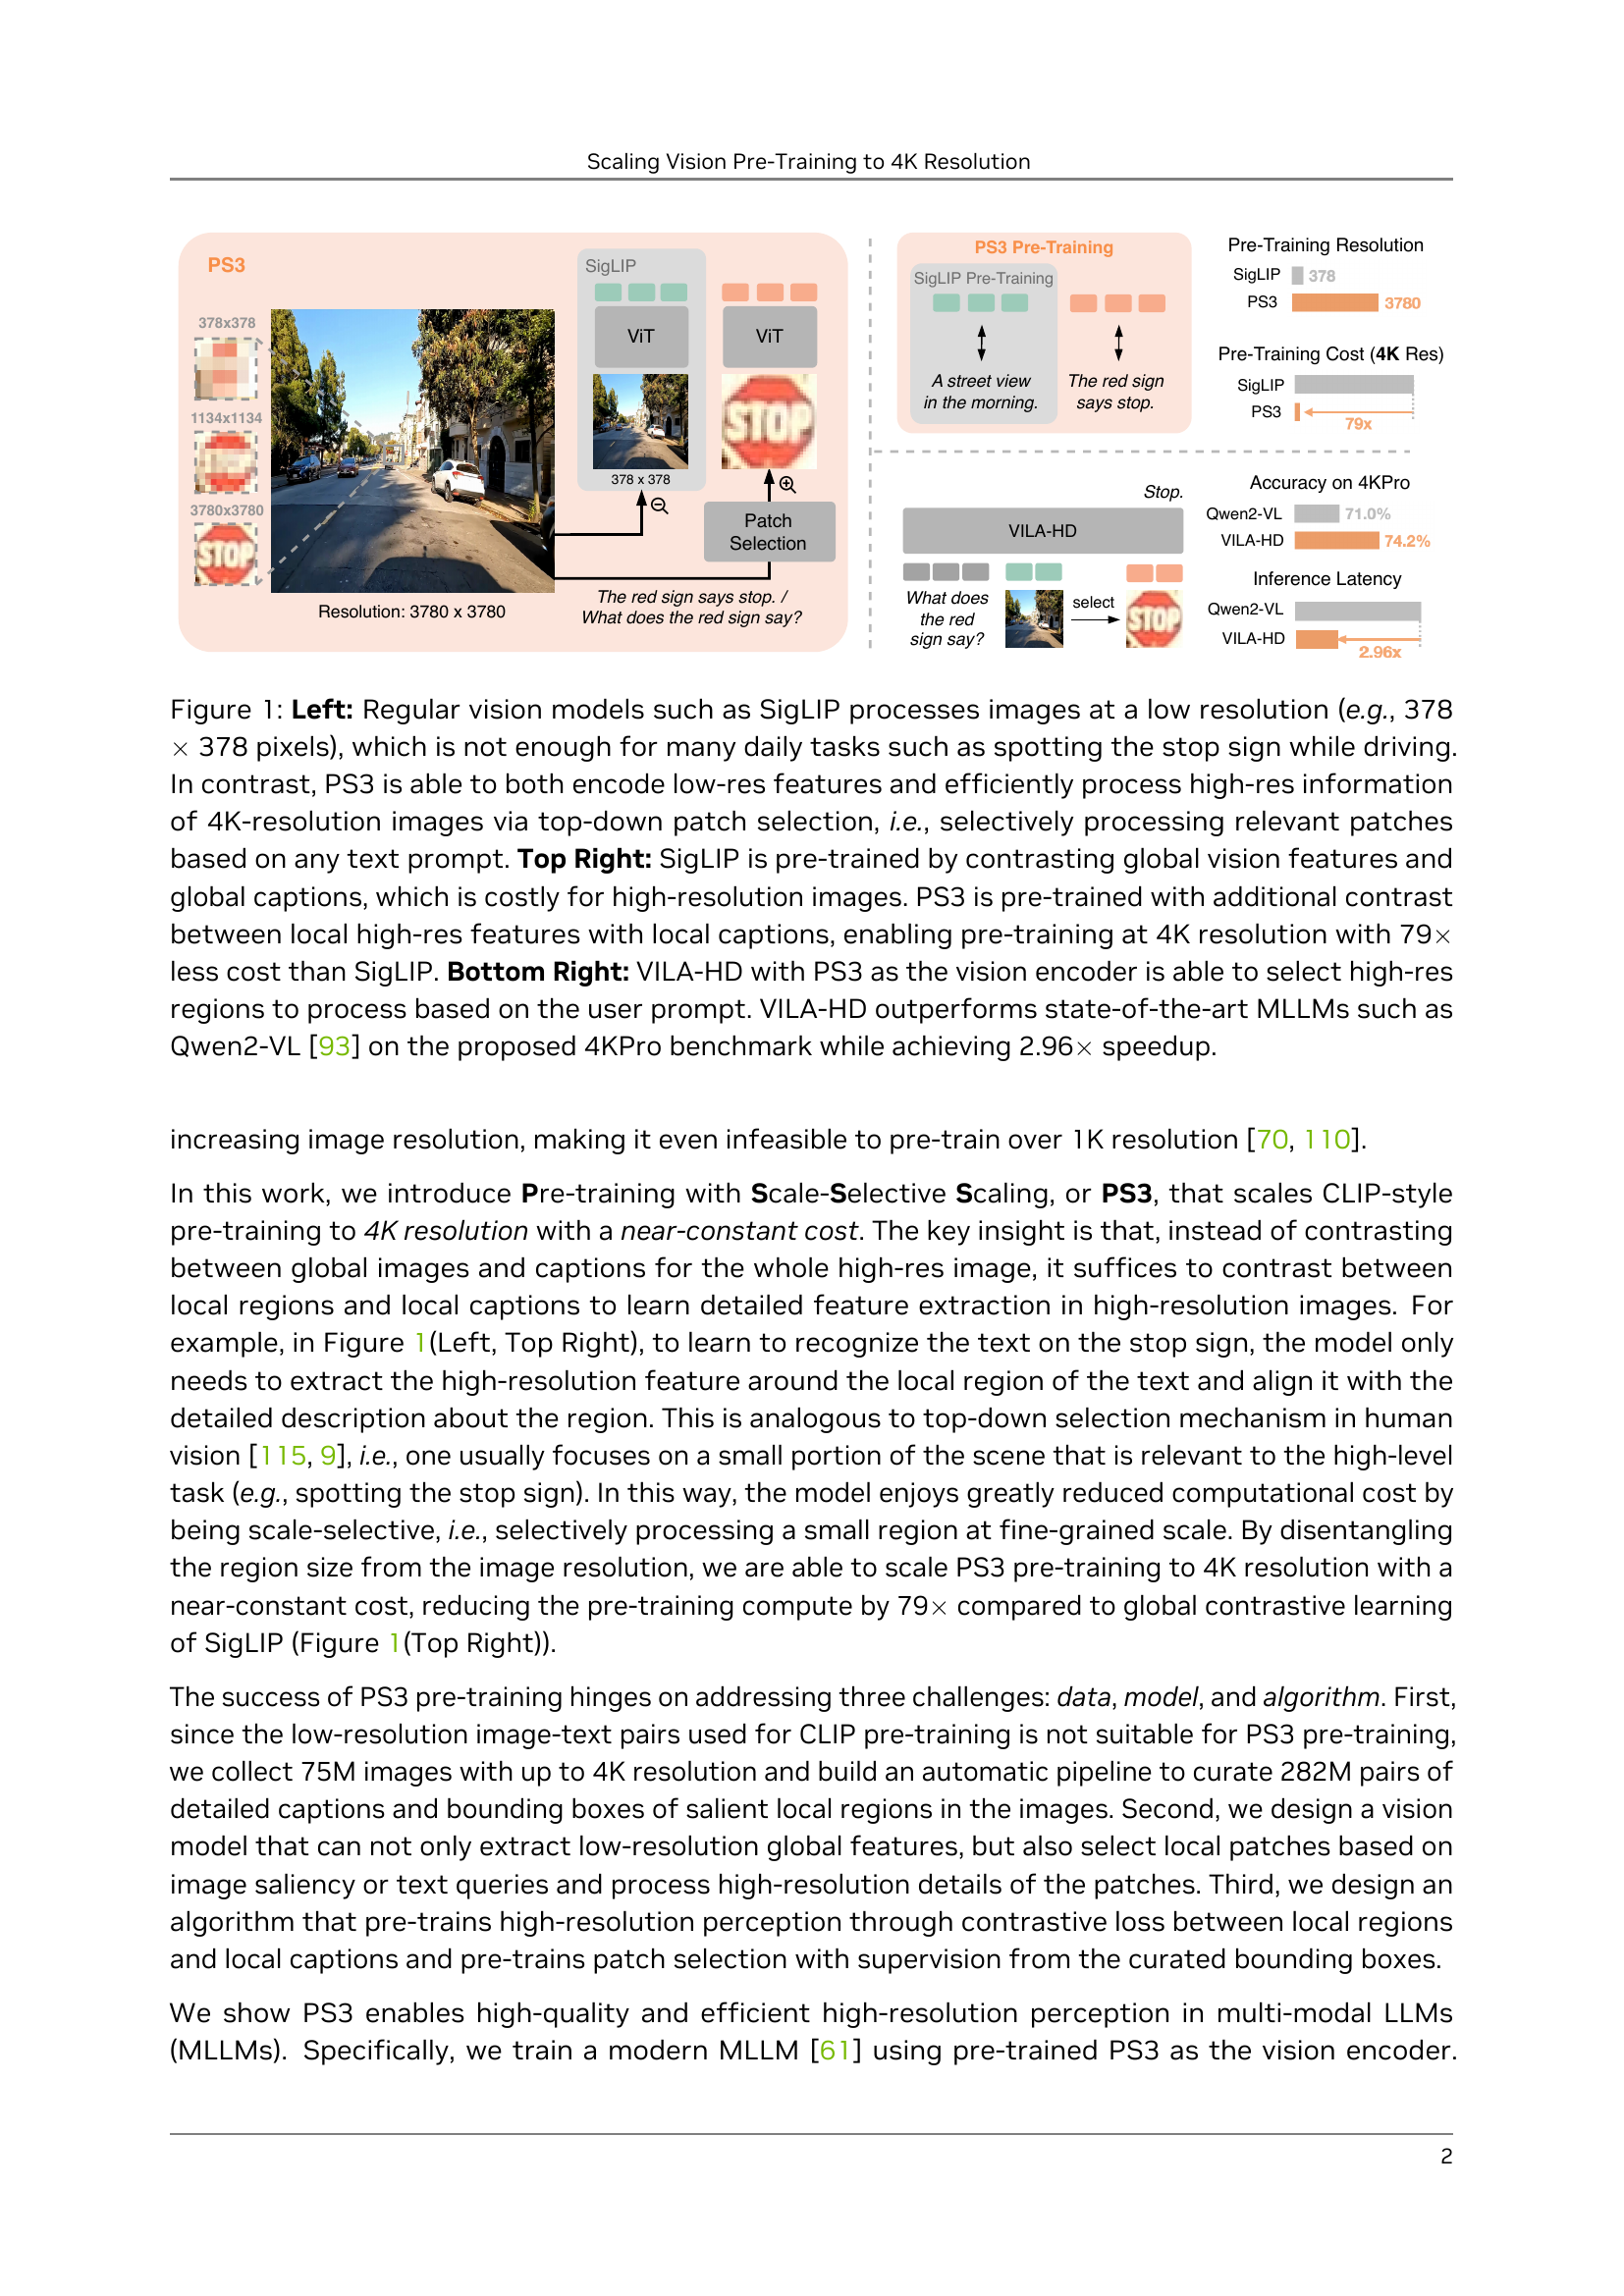
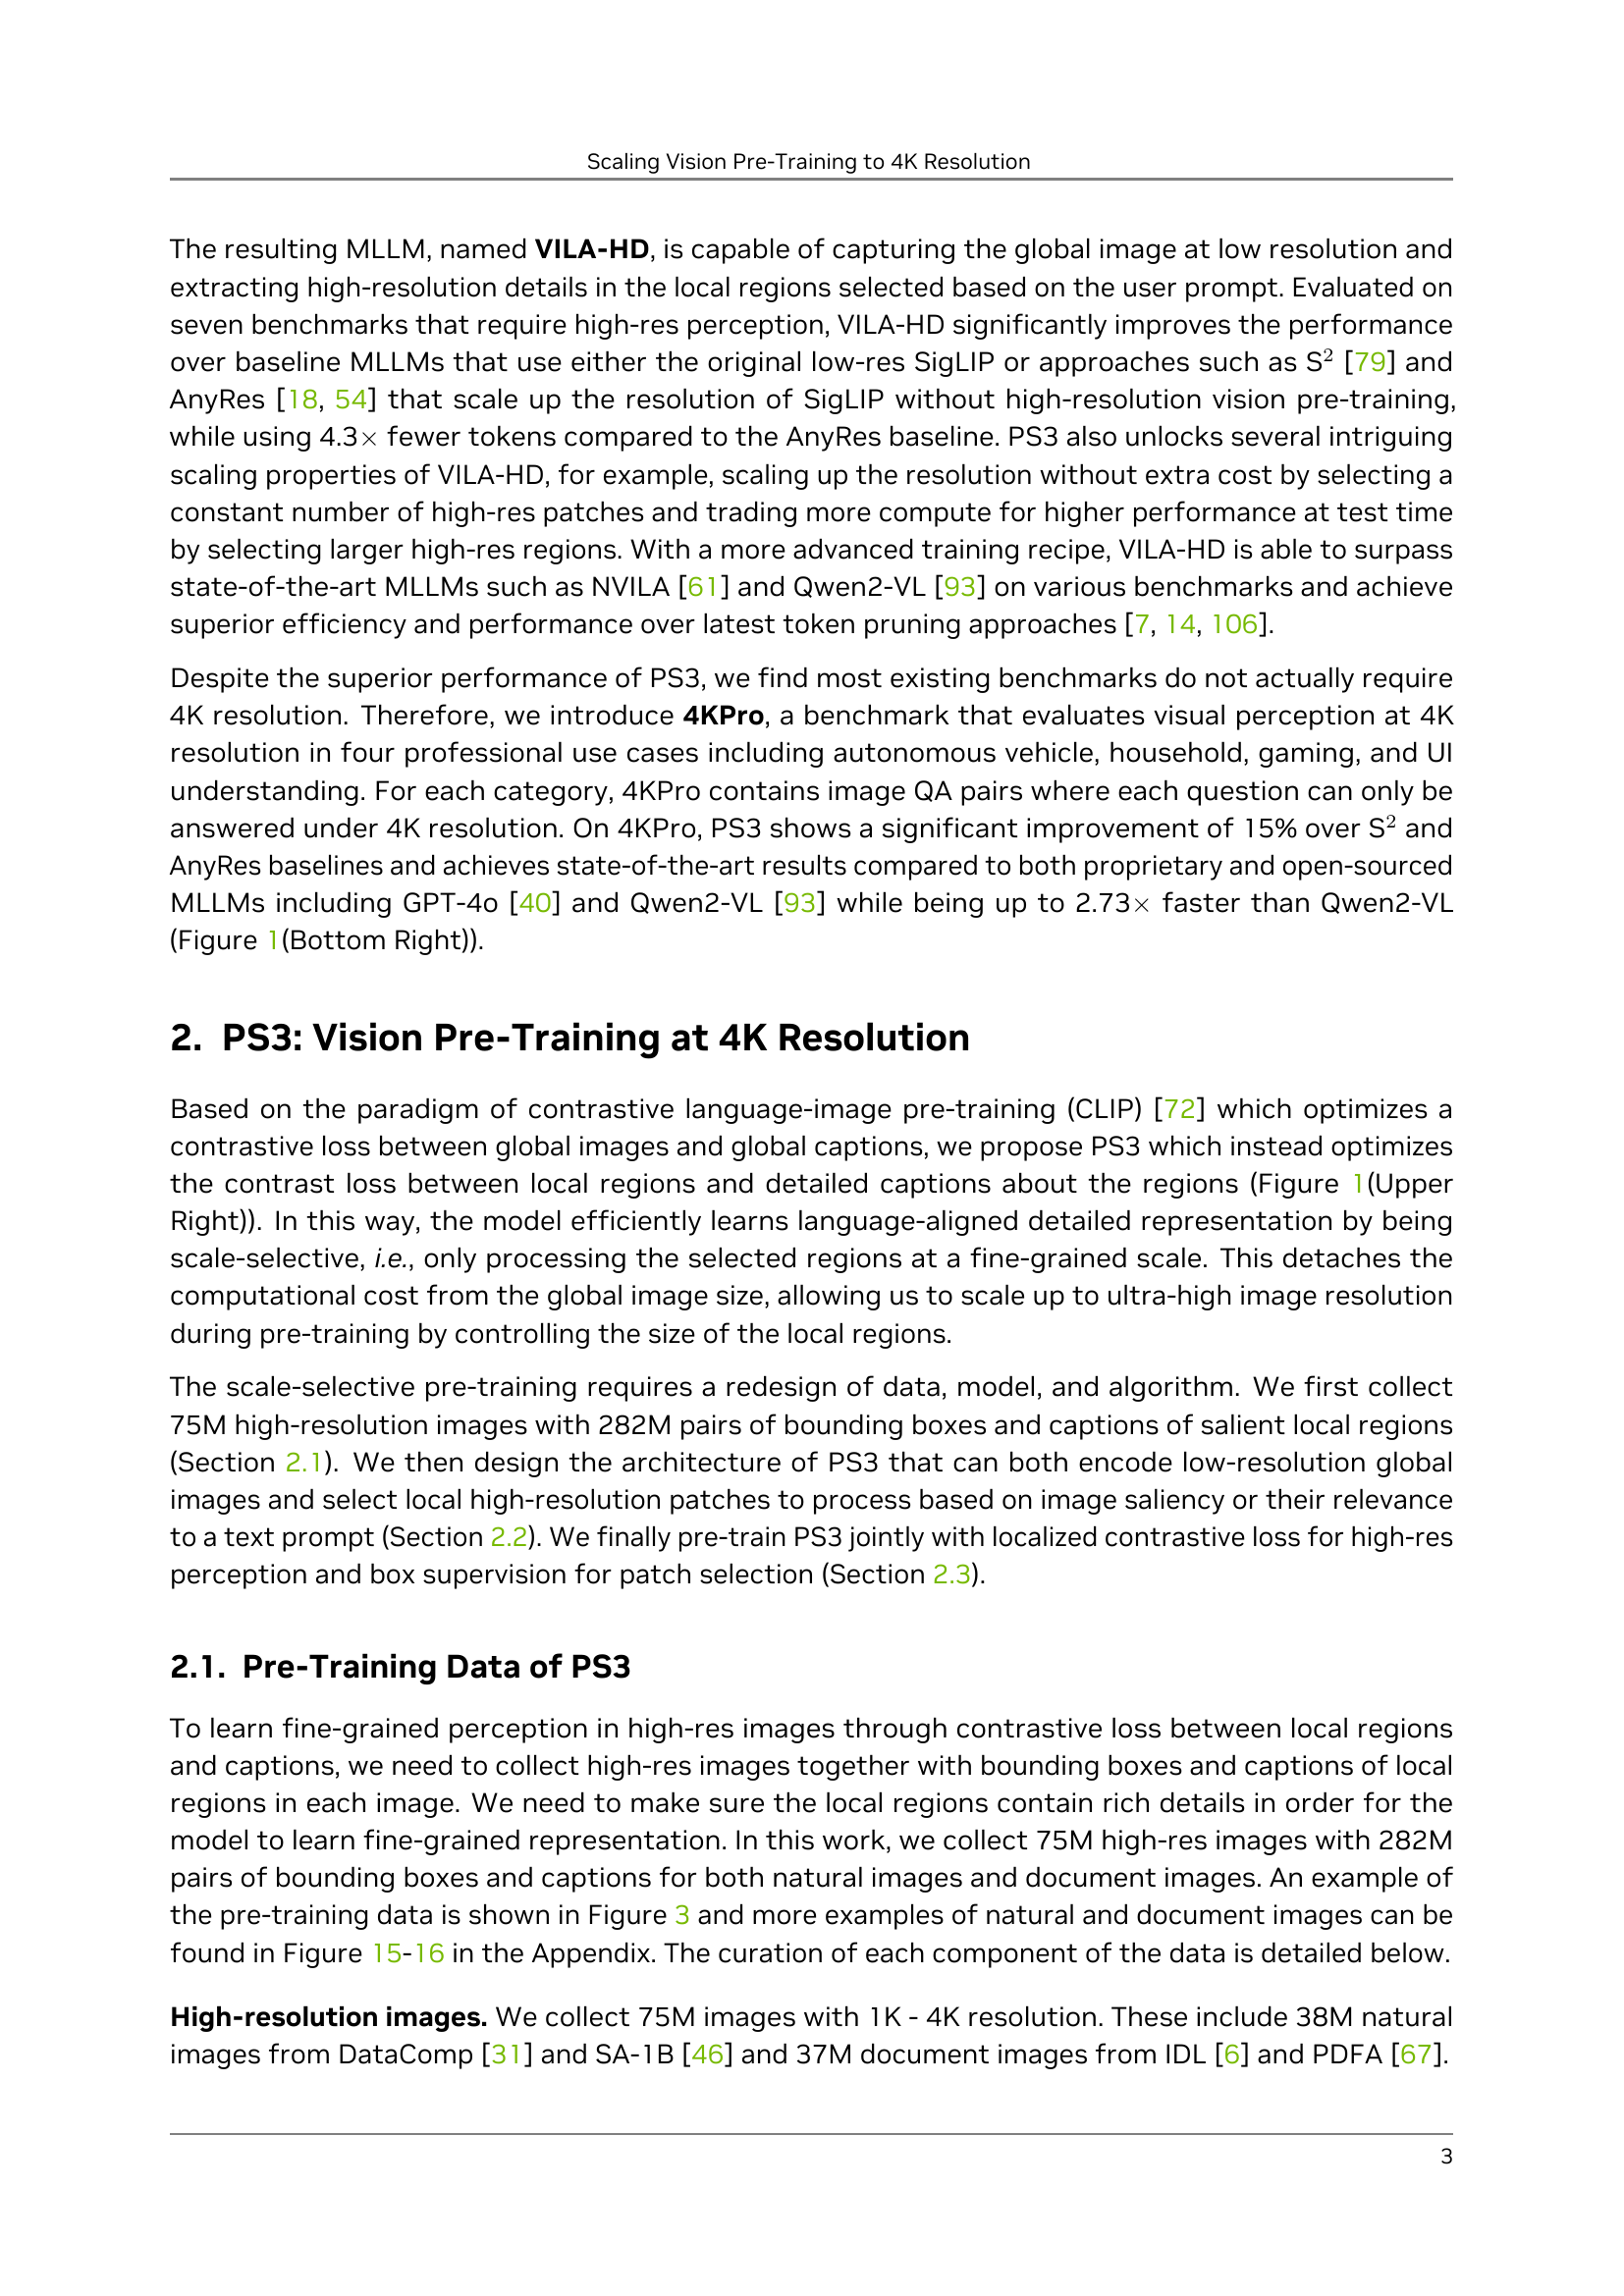
🔼 This figure illustrates the process of creating training data for the PS3 model. It begins with a high-resolution image. The image is first segmented into various regions using a segmentation model. Salient regions, identified as areas with small or densely packed segments, are then selected. Finally, a multi-modal language model (MLLM) generates a caption describing each of these salient regions. This process of segmentation, selection, and captioning creates training pairs of high-resolution image regions and their corresponding textual descriptions.
read the caption
Figure 2: Curation of bounding boxes and captions of salient regions in the pre-training data. For each high-resolution image, we segment all the masks, detect salient regions with small or dense masks, and use an MLLM to generate captions about the local regions.

🔼 Figure 3 shows an example of the pre-training data used for PS3. Each instance in the dataset contains a high-resolution image (up to 4K resolution), bounding boxes highlighting the salient regions within the image, and detailed captions describing the contents of those specific regions. The captions focus on the details present within the identified regions, such as text or small objects, rather than a general description of the entire image. This illustrates the core principle of PS3: focusing on relevant local details rather than processing the whole image, even at high resolutions, to reduce computational cost.
read the caption
Figure 3: Pre-training data example. Each instance contains an image with resolution up to 4K, bounding boxes of the salient regions in the image, and captions about details in the regions such as text or small objects.

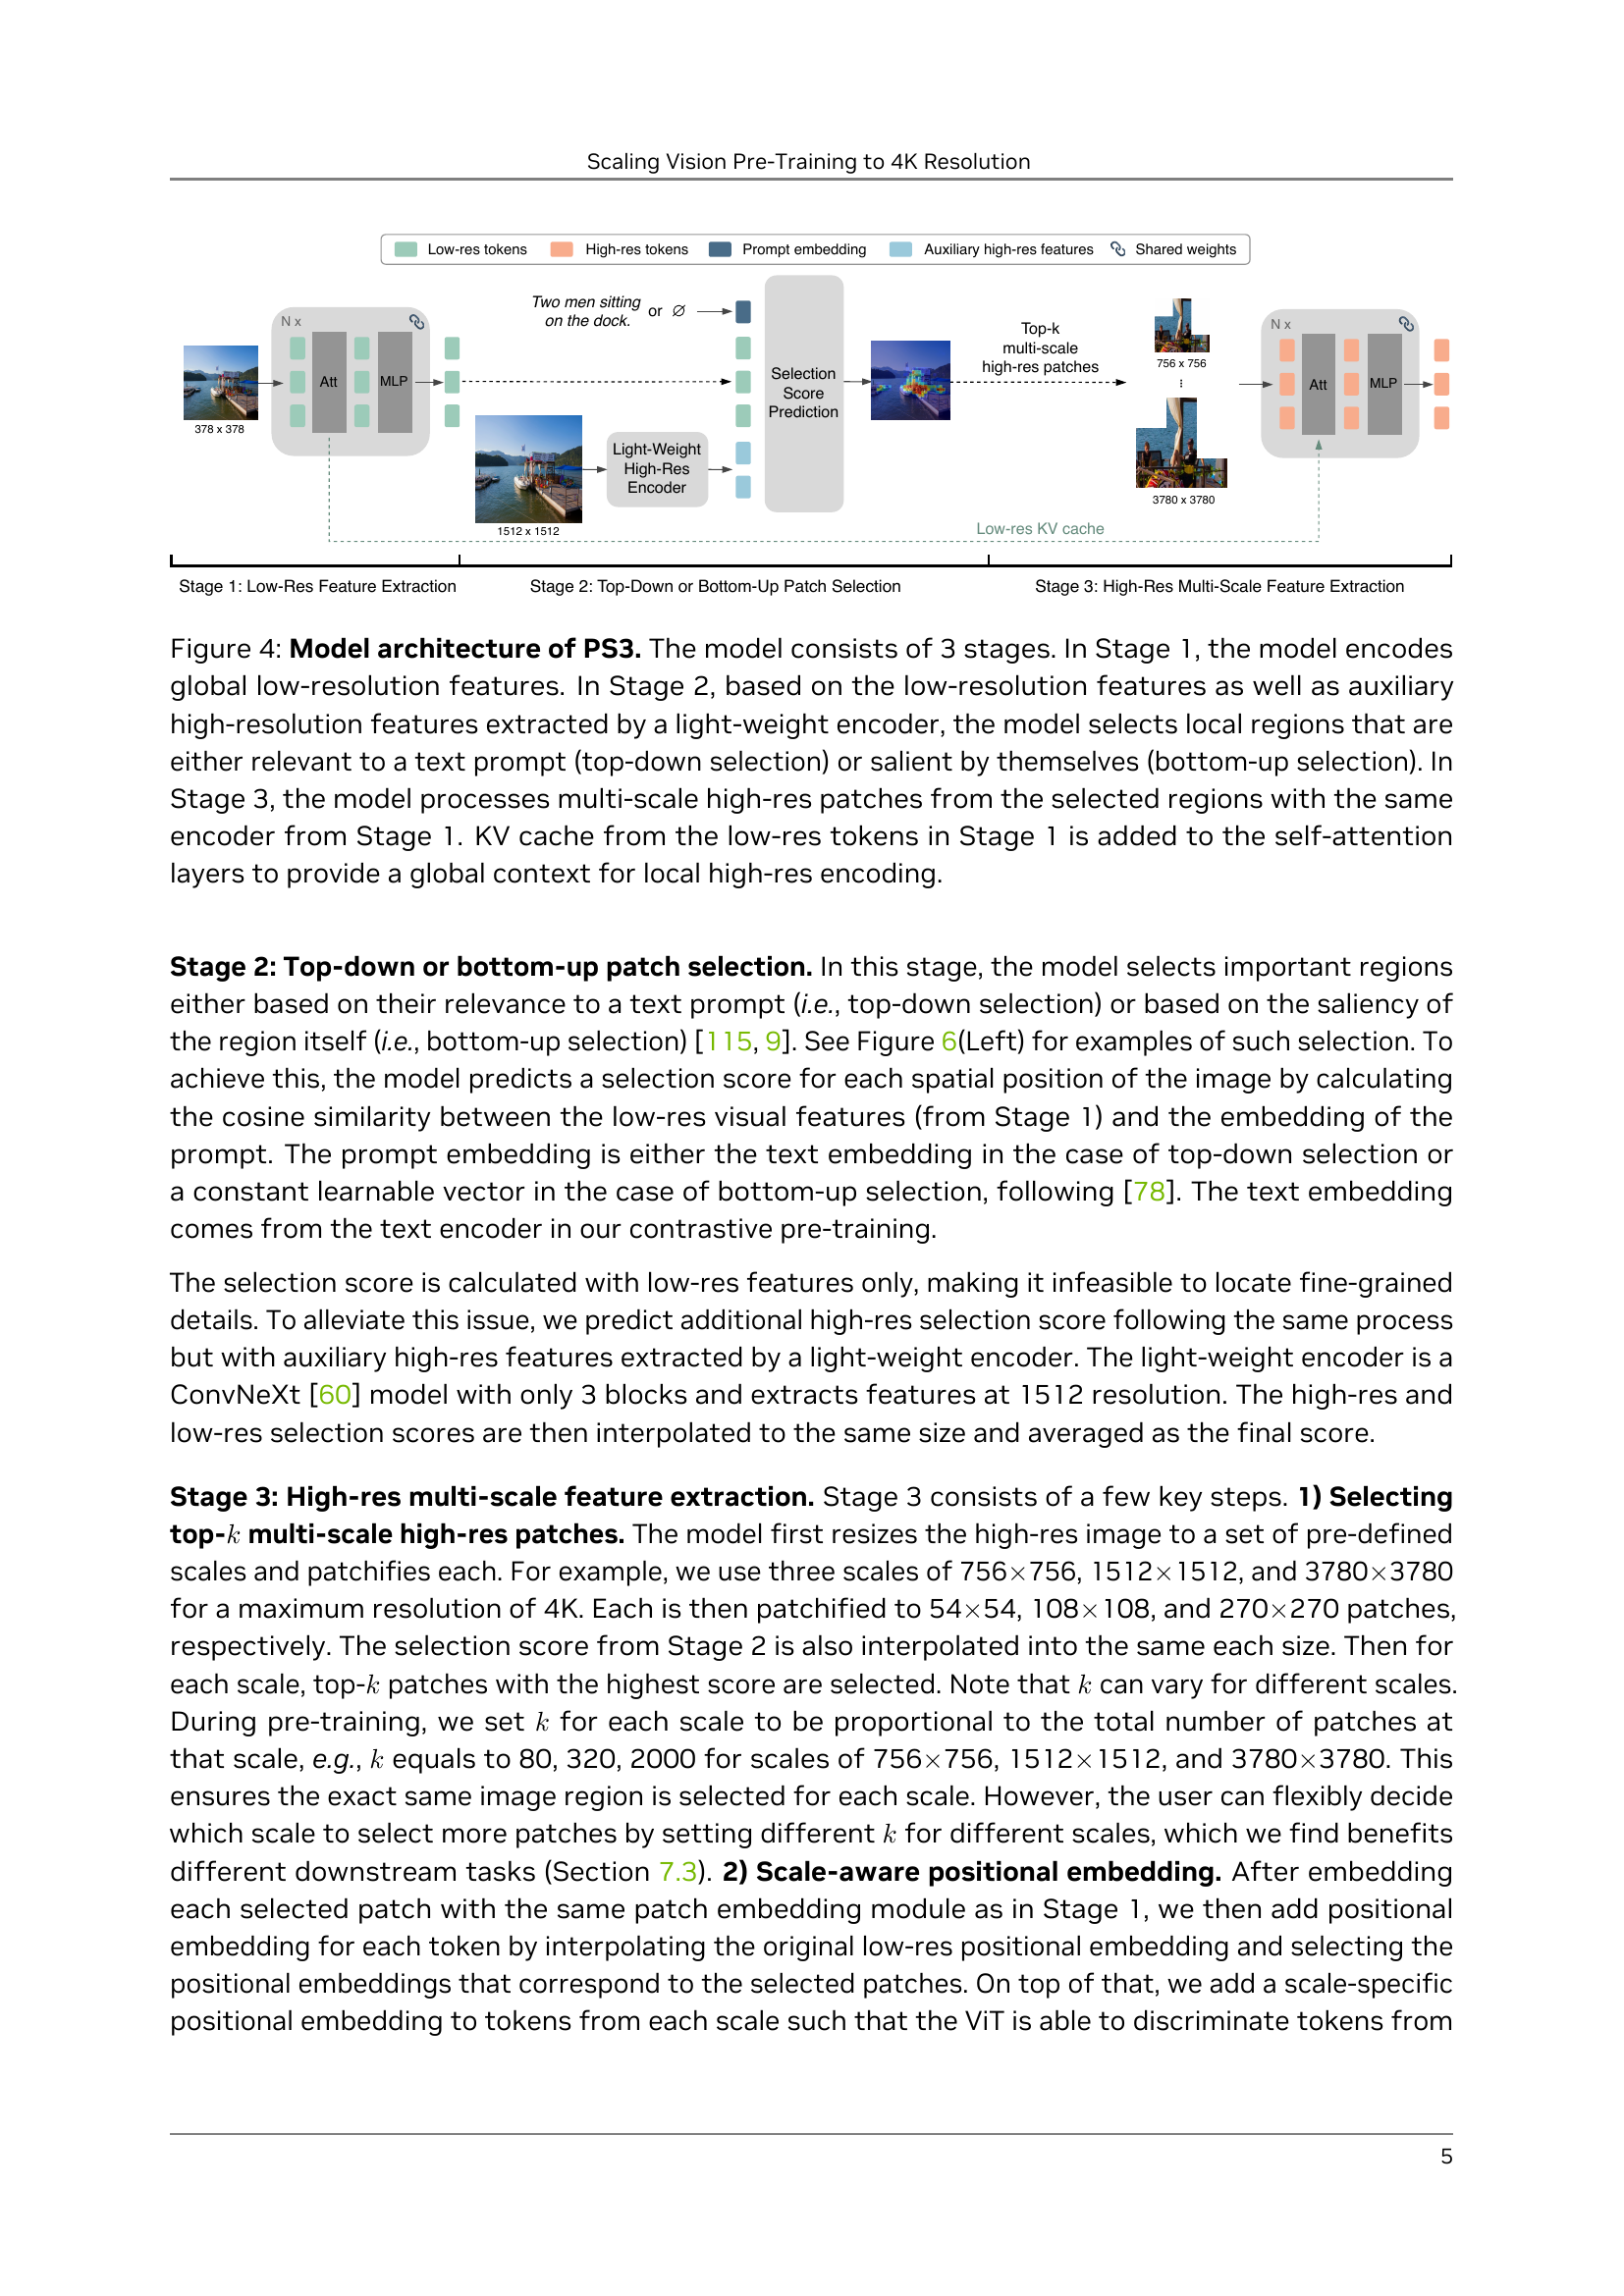
🔼 This figure illustrates the architecture of the PS3 model, which consists of three stages. Stage 1 involves encoding global low-resolution image features using a vision transformer (ViT). Stage 2 performs patch selection. It uses both the low-resolution features from Stage 1 and auxiliary high-resolution features (extracted by a lightweight encoder) to identify important regions. These regions are selected based on either their relevance to a text prompt (top-down selection) or their inherent saliency (bottom-up selection). Stage 3 processes multi-scale high-resolution patches from the selected regions using the same ViT encoder as in Stage 1. Key-Value (KV) cache from the low-resolution tokens in Stage 1 is incorporated into the self-attention layers to provide a global context for encoding the local high-resolution details.
read the caption
Figure 4: Model architecture of \model. The model consists of 3 stages. In Stage 1, the model encodes global low-resolution features. In Stage 2, based on the low-resolution features as well as auxiliary high-resolution features extracted by a light-weight encoder, the model selects local regions that are either relevant to a text prompt (top-down selection) or salient by themselves (bottom-up selection). In Stage 3, the model processes multi-scale high-res patches from the selected regions with the same encoder from Stage 1. KV cache from the low-res tokens in Stage 1 is added to the self-attention layers to provide a global context for local high-res encoding.

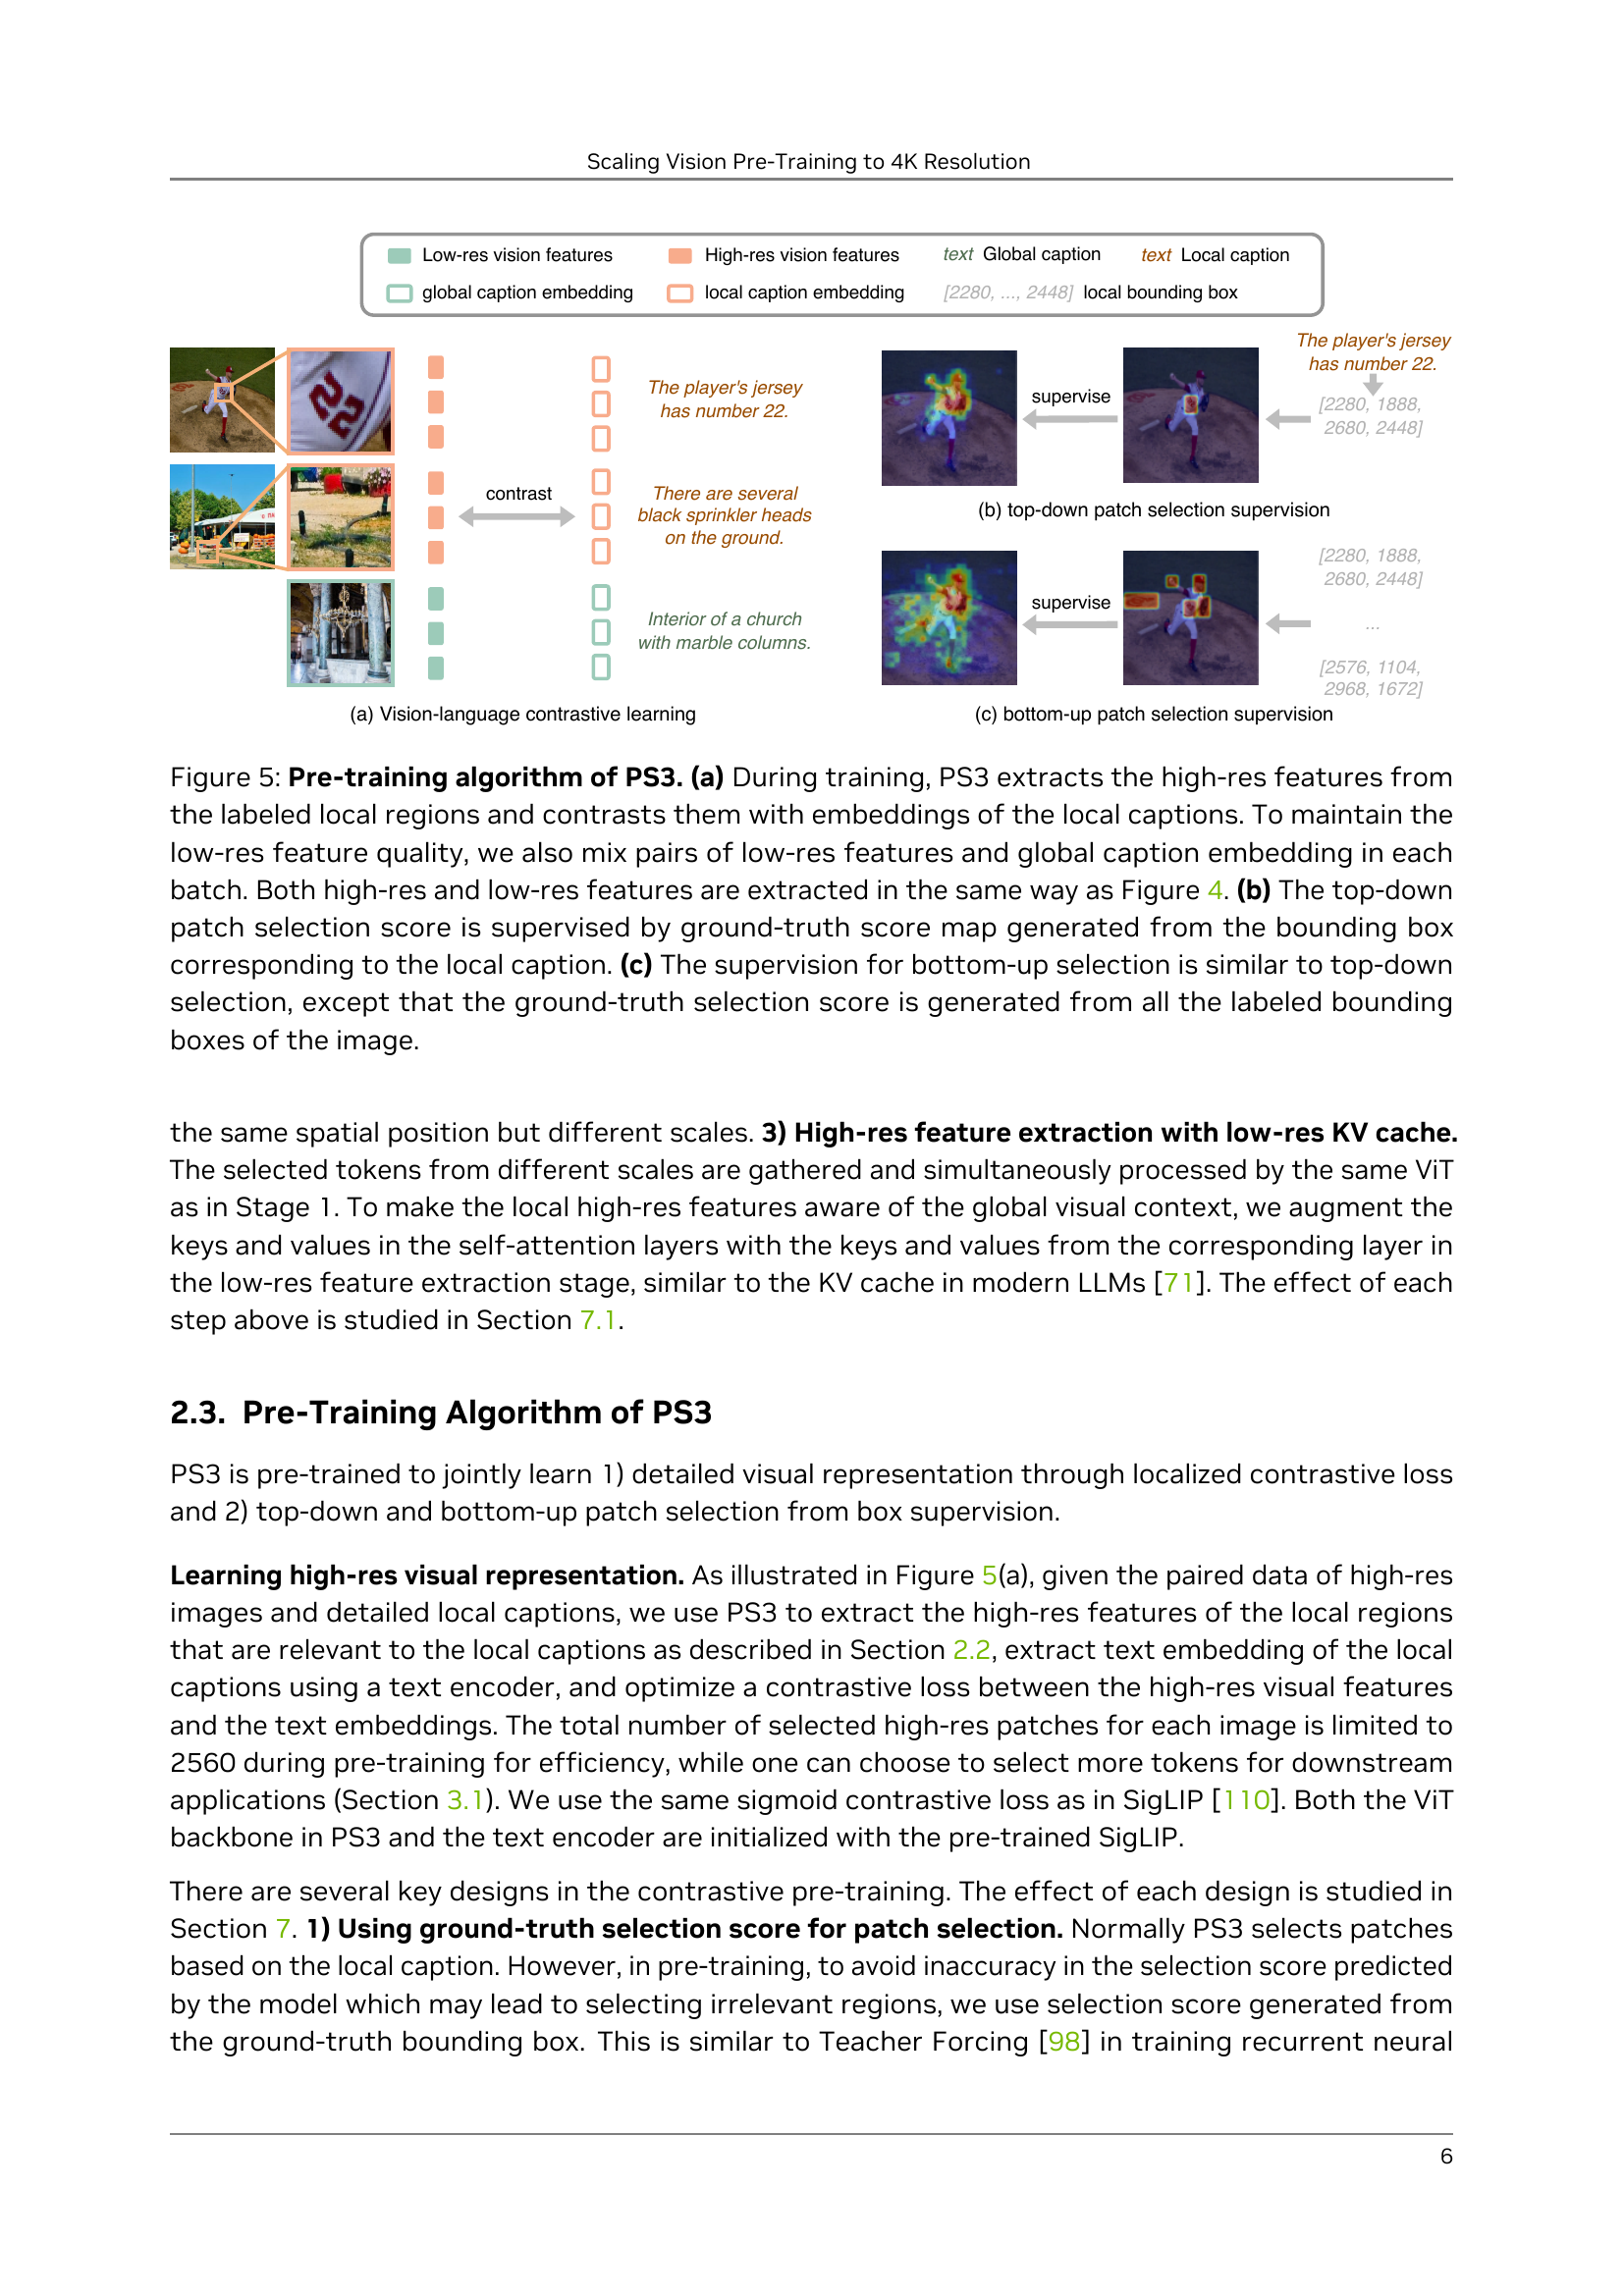
🔼 Figure 5 illustrates the pre-training algorithm of the PS3 model. Panel (a) shows the contrastive learning process where high-resolution features from selected local image regions are contrasted against their corresponding local captions. To maintain the quality of low-resolution features, the model also incorporates pairs of low-resolution features and global captions within each batch. Both high-resolution and low-resolution feature extractions follow the architecture depicted in Figure 4. Panel (b) details the supervision method for top-down patch selection, which uses ground truth score maps derived from bounding boxes to guide the selection process. Panel (c) shows the supervision mechanism for bottom-up patch selection; this is similar to top-down selection, but the ground truth selection score is derived from all labeled bounding boxes within the image.
read the caption
Figure 5: Pre-training algorithm of \model. (a) During training, \modelextracts the high-res features from the labeled local regions and contrasts them with embeddings of the local captions. To maintain the low-res feature quality, we also mix pairs of low-res features and global caption embedding in each batch. Both high-res and low-res features are extracted in the same way as Figure 4. (b) The top-down patch selection score is supervised by ground-truth score map generated from the bounding box corresponding to the local caption. (c) The supervision for bottom-up selection is similar to top-down selection, except that the ground-truth selection score is generated from all the labeled bounding boxes of the image.
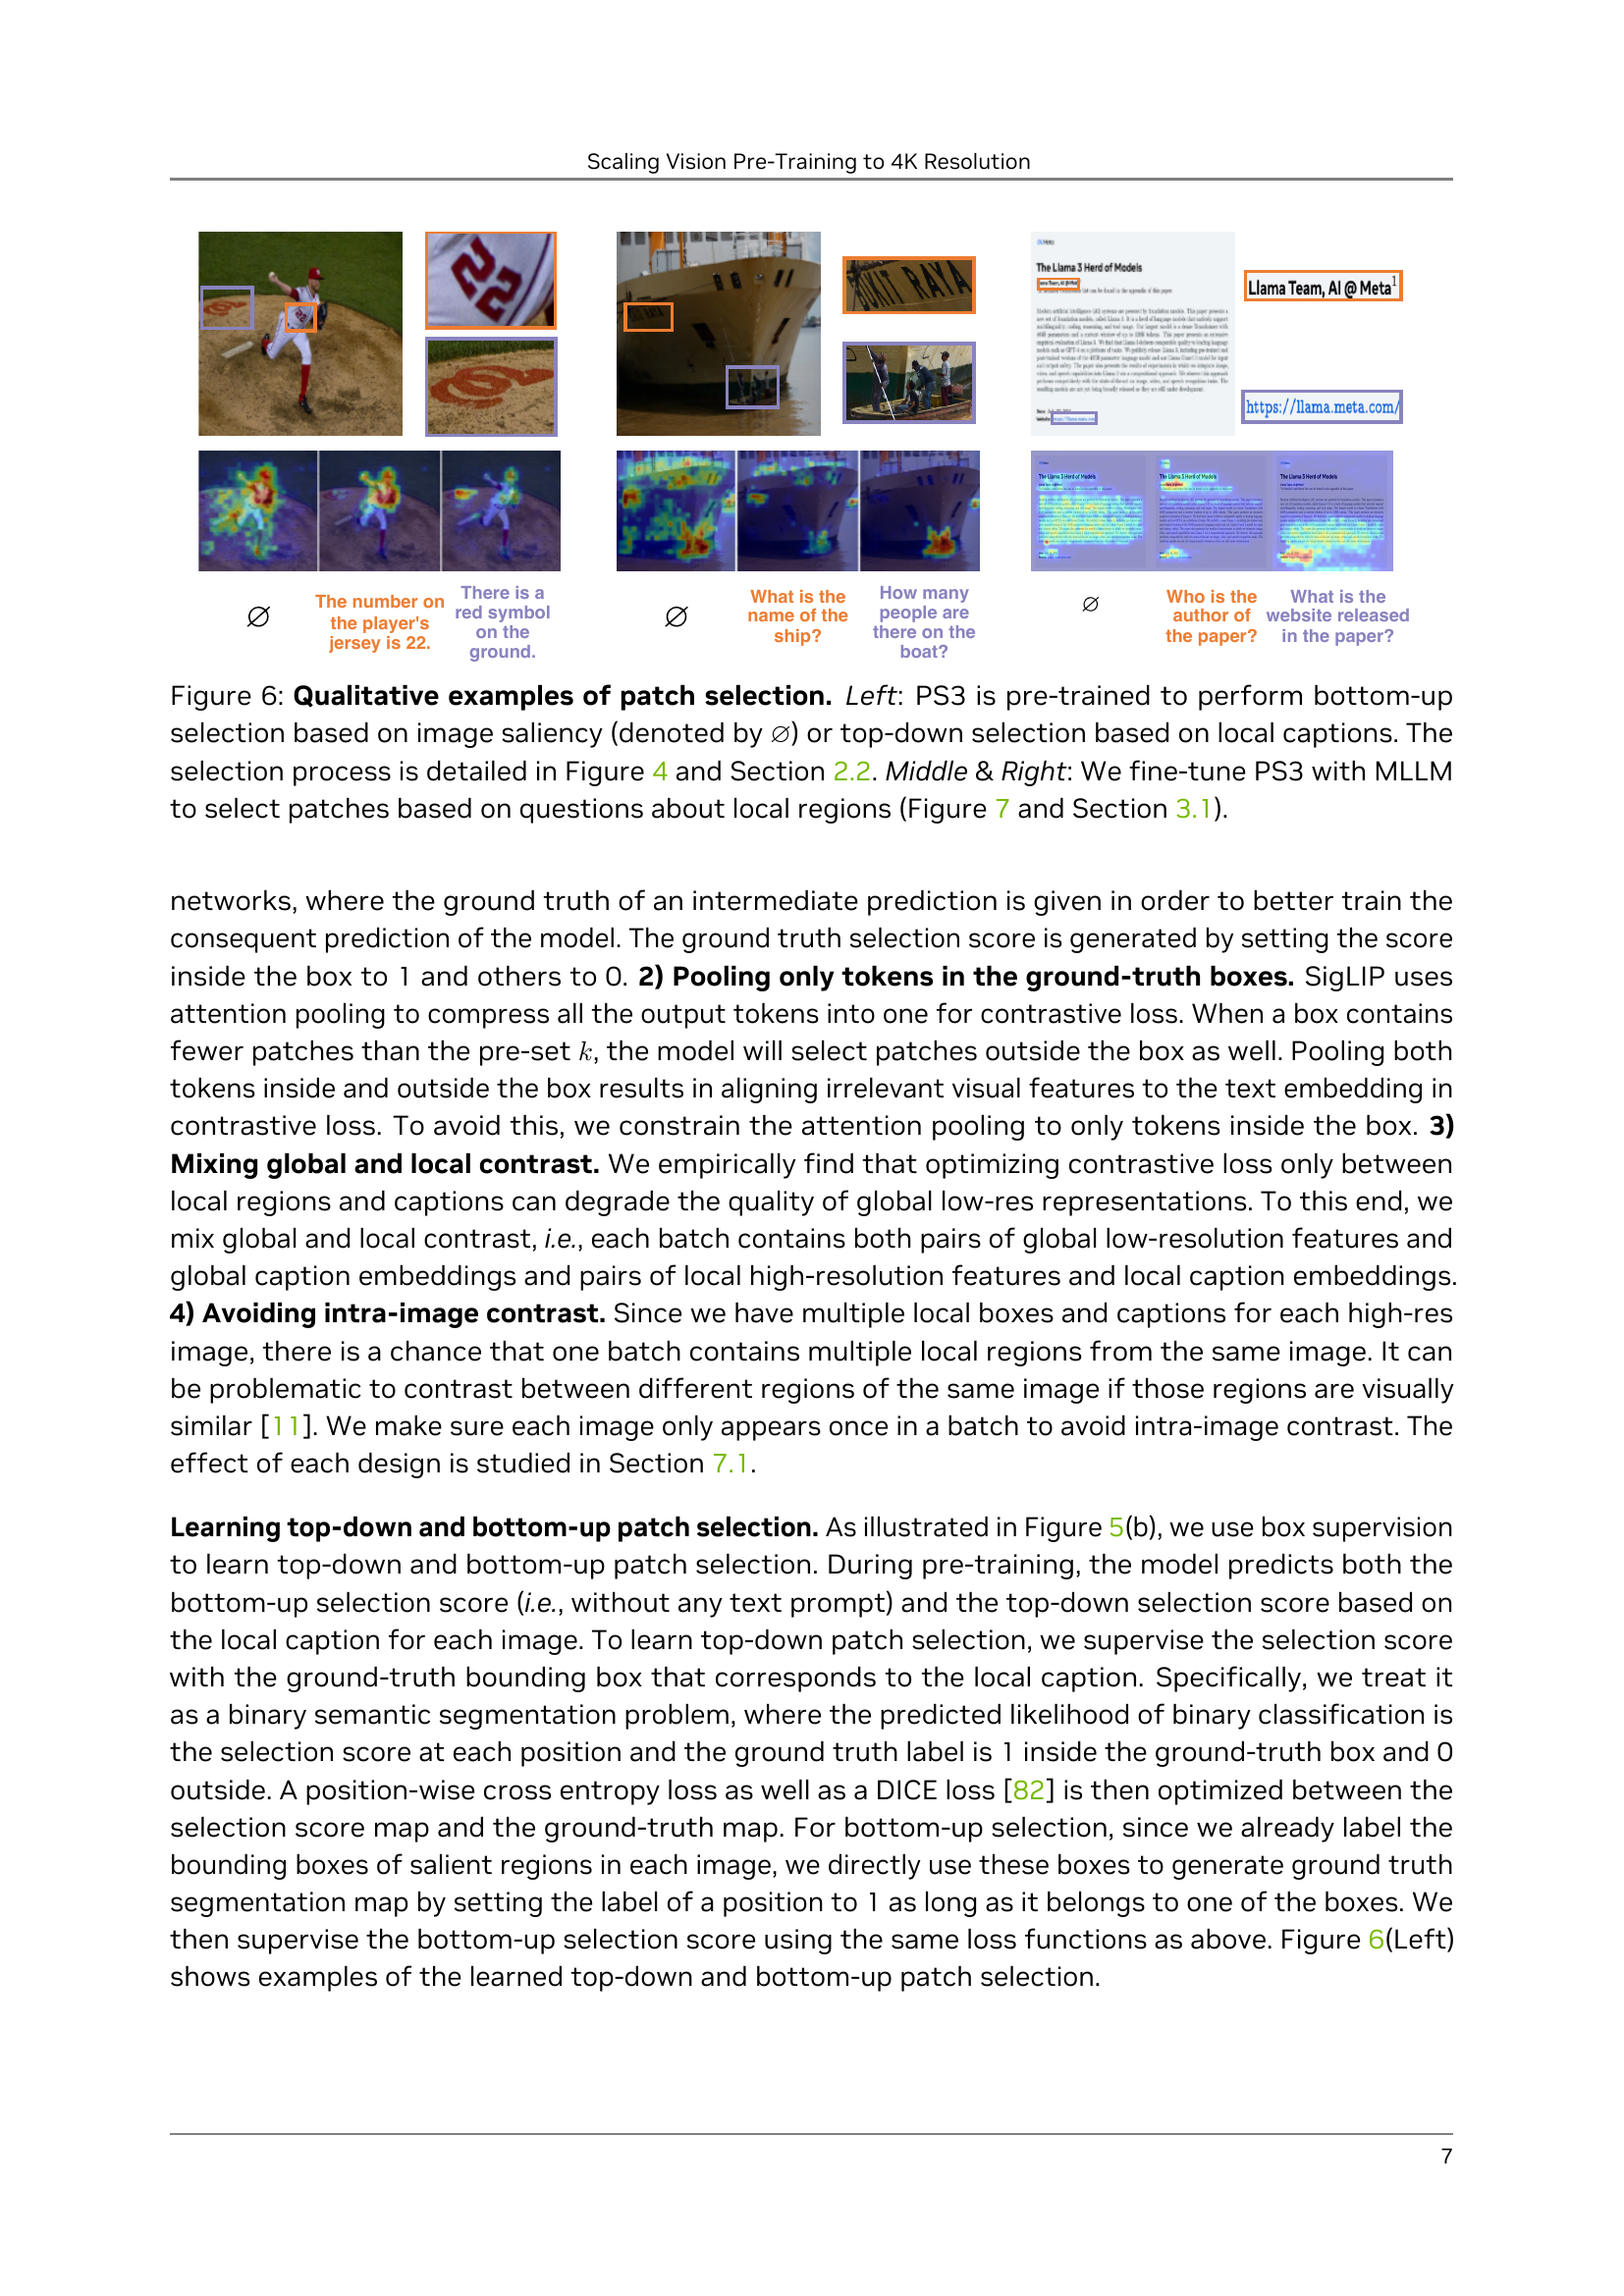
🔼 Figure 6 showcases the patch selection mechanism of the PS3 model. The left panel demonstrates both bottom-up and top-down selection methods. Bottom-up selection identifies salient regions within an image without any textual guidance, while top-down selection focuses on regions relevant to a given caption. The middle and right panels illustrate how the model’s patch selection capabilities are fine-tuned when integrated with a multi-modal large language model (MLLM). Here, the model selects patches based on specific questions pertaining to localized image regions.
read the caption
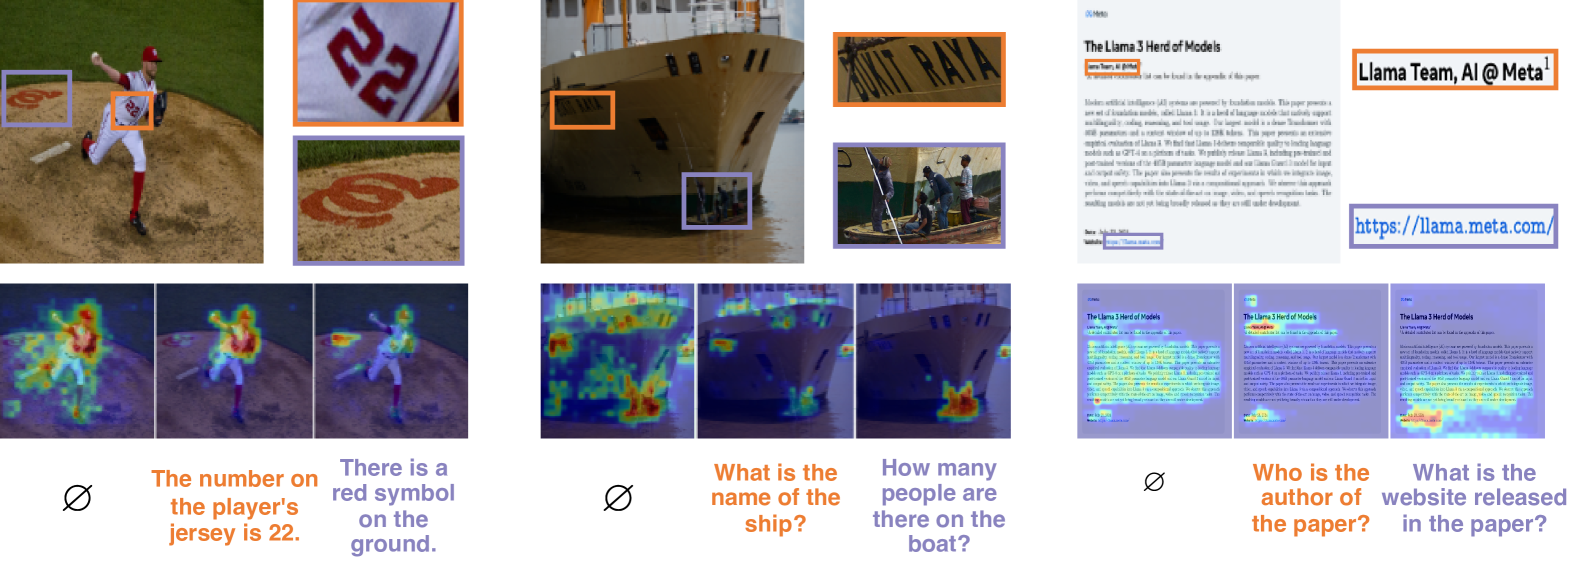
Figure 6: Qualitative examples of patch selection. Left: \modelis pre-trained to perform bottom-up selection based on image saliency (denoted by ∅\varnothing∅) or top-down selection based on local captions. The selection process is detailed in Figure 4 and Section 2.2. Middle & Right: We fine-tune \modelwith MLLM to select patches based on questions about local regions (Figure 7 and Section 3.1).

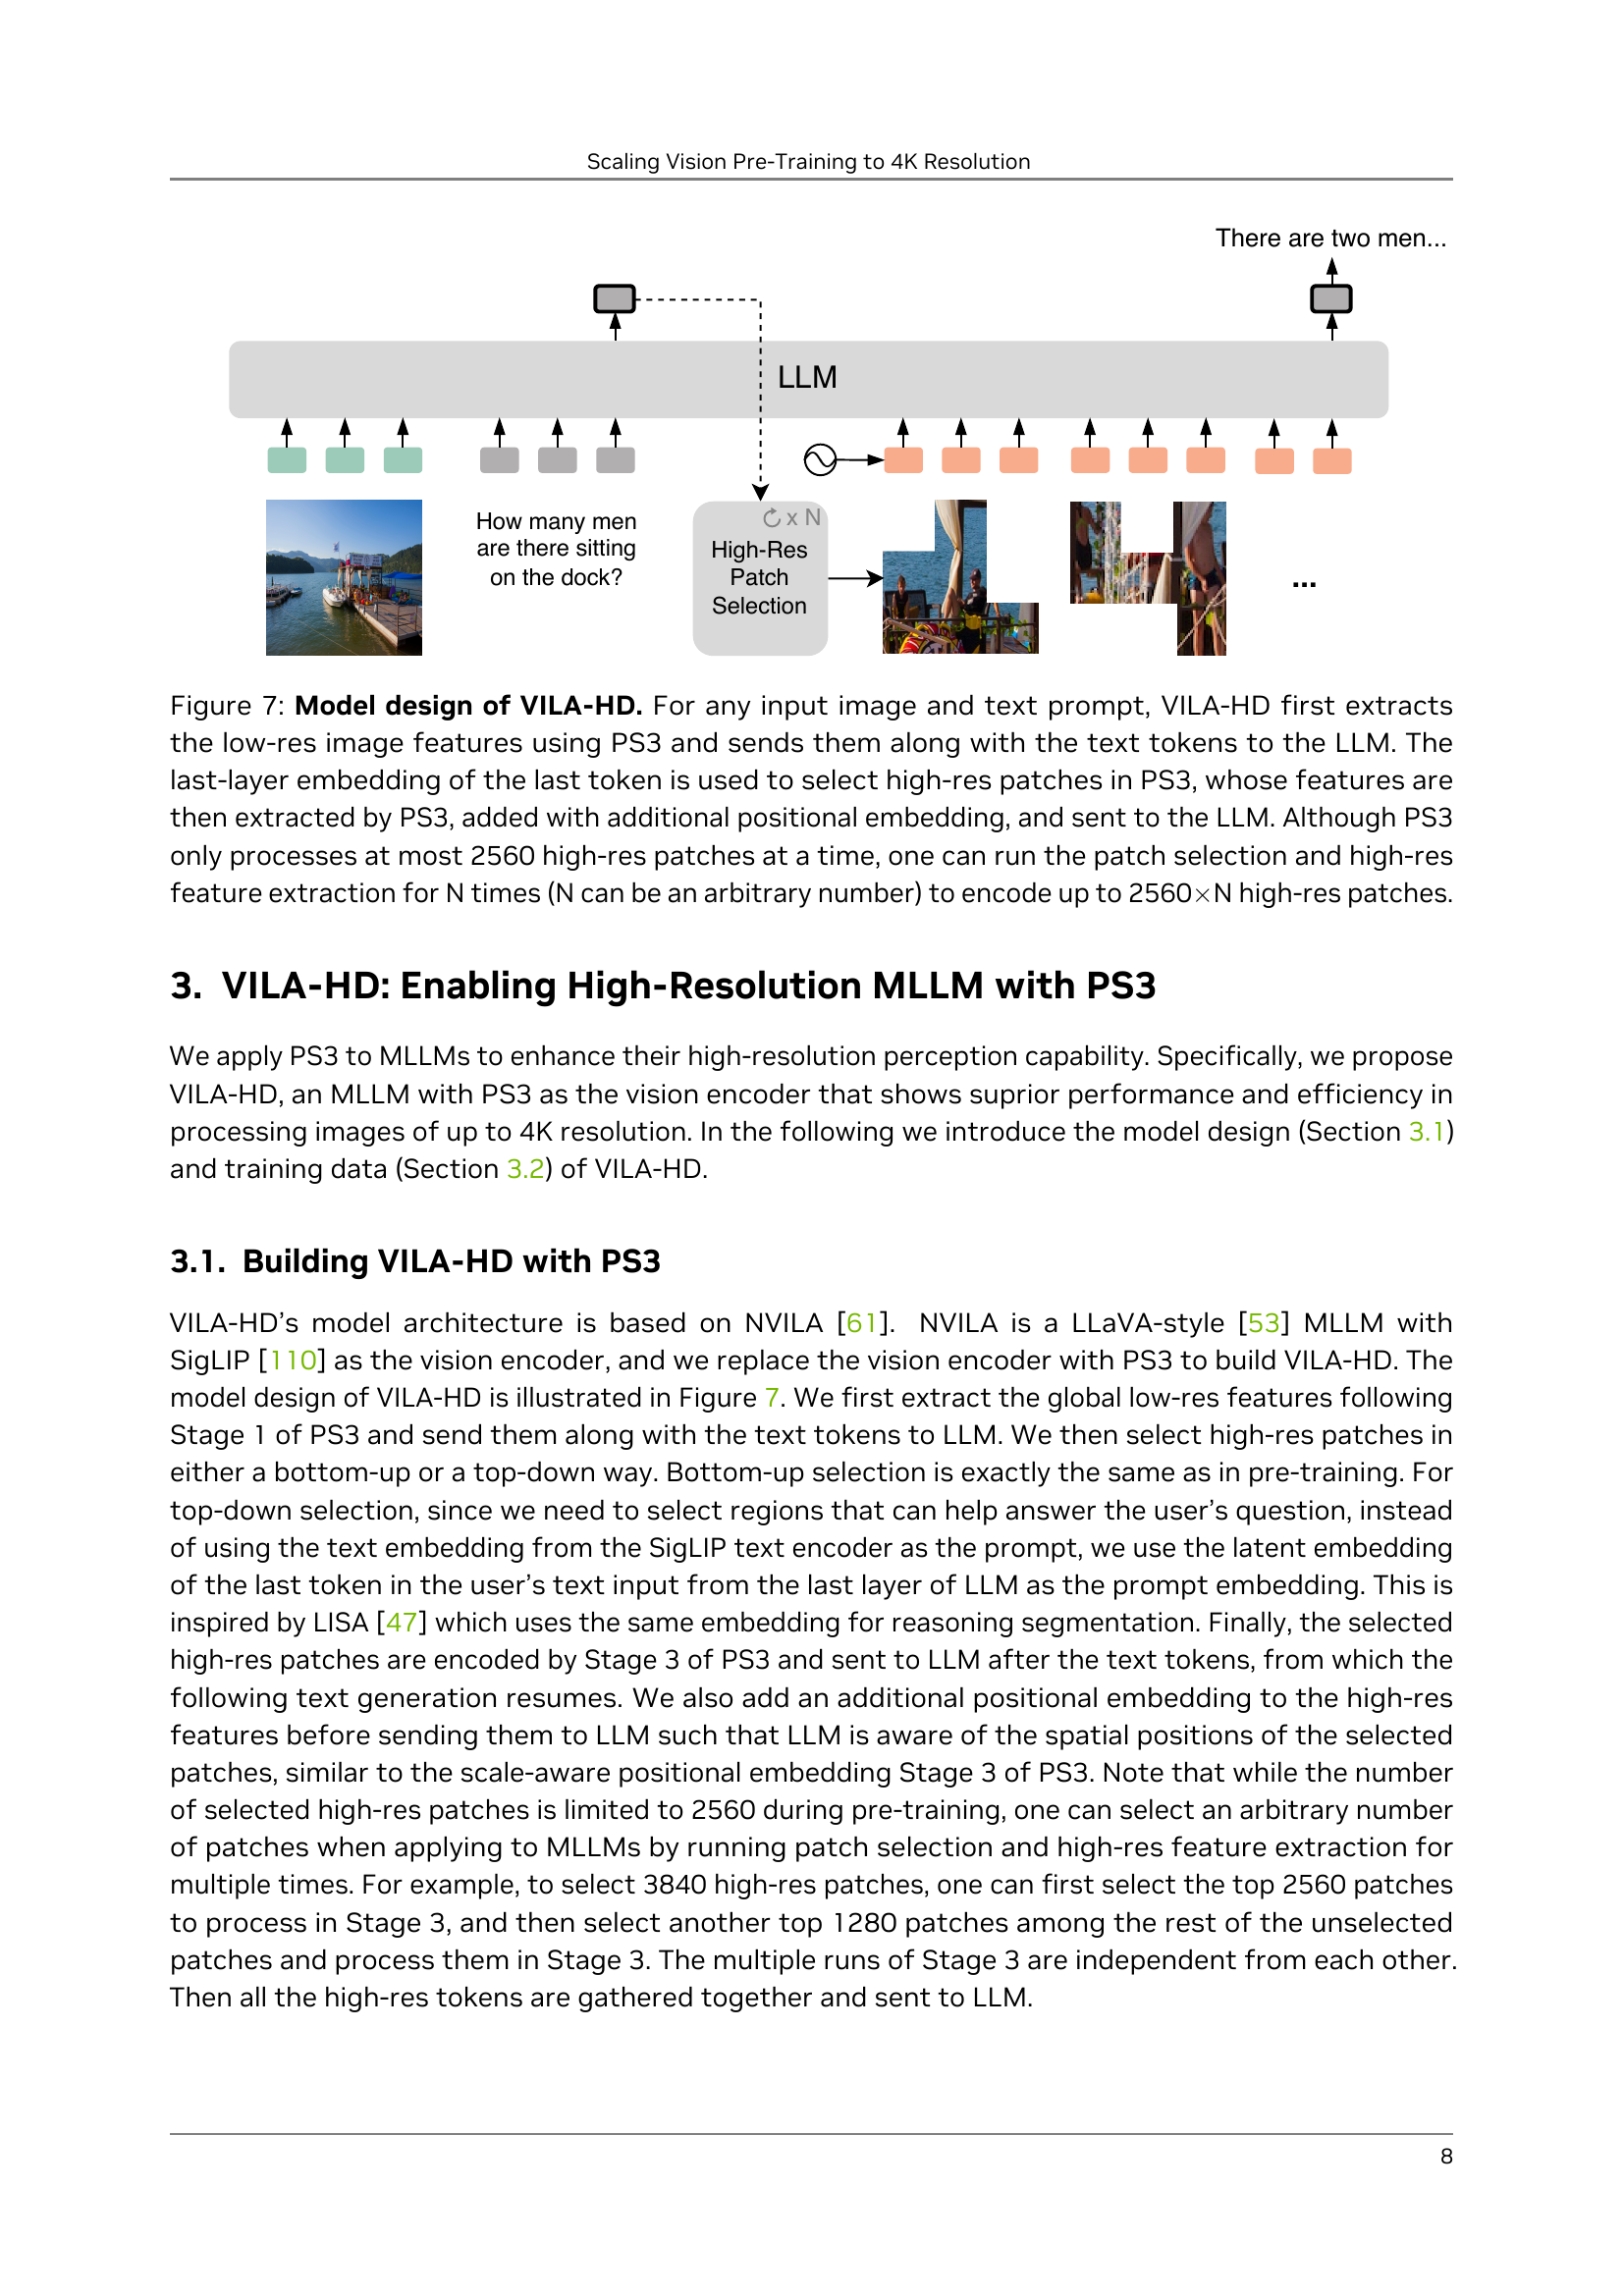
🔼 The figure illustrates the architecture of the VILA-HD model, which enhances high-resolution visual perception in multi-modal LLMs. VILA-HD uses PS3 as its vision encoder. First, it extracts low-resolution global image features using PS3 and sends these features, along with text tokens from the user’s prompt, to the LLM. The LLM’s final-layer embedding from the last token guides PS3 in selecting high-resolution image patches. PS3 then extracts features from these selected patches, adds positional embeddings, and sends them to the LLM for further processing. Importantly, while PS3’s processing is limited to 2560 high-resolution patches at once, the patch selection and feature extraction can be repeated multiple times (N) to incorporate a larger number of patches—up to 2560N.
read the caption
Figure 7: Model design of \vilamodel. For any input image and text prompt, \vilamodelfirst extracts the low-res image features using \modeland sends them along with the text tokens to the LLM. The last-layer embedding of the last token is used to select high-res patches in \model, whose features are then extracted by \model, added with additional positional embedding, and sent to the LLM. Although \modelonly processes at most 2560 high-res patches at a time, one can run the patch selection and high-res feature extraction for N times (N can be an arbitrary number) to encode up to 2560×\times×N high-res patches.

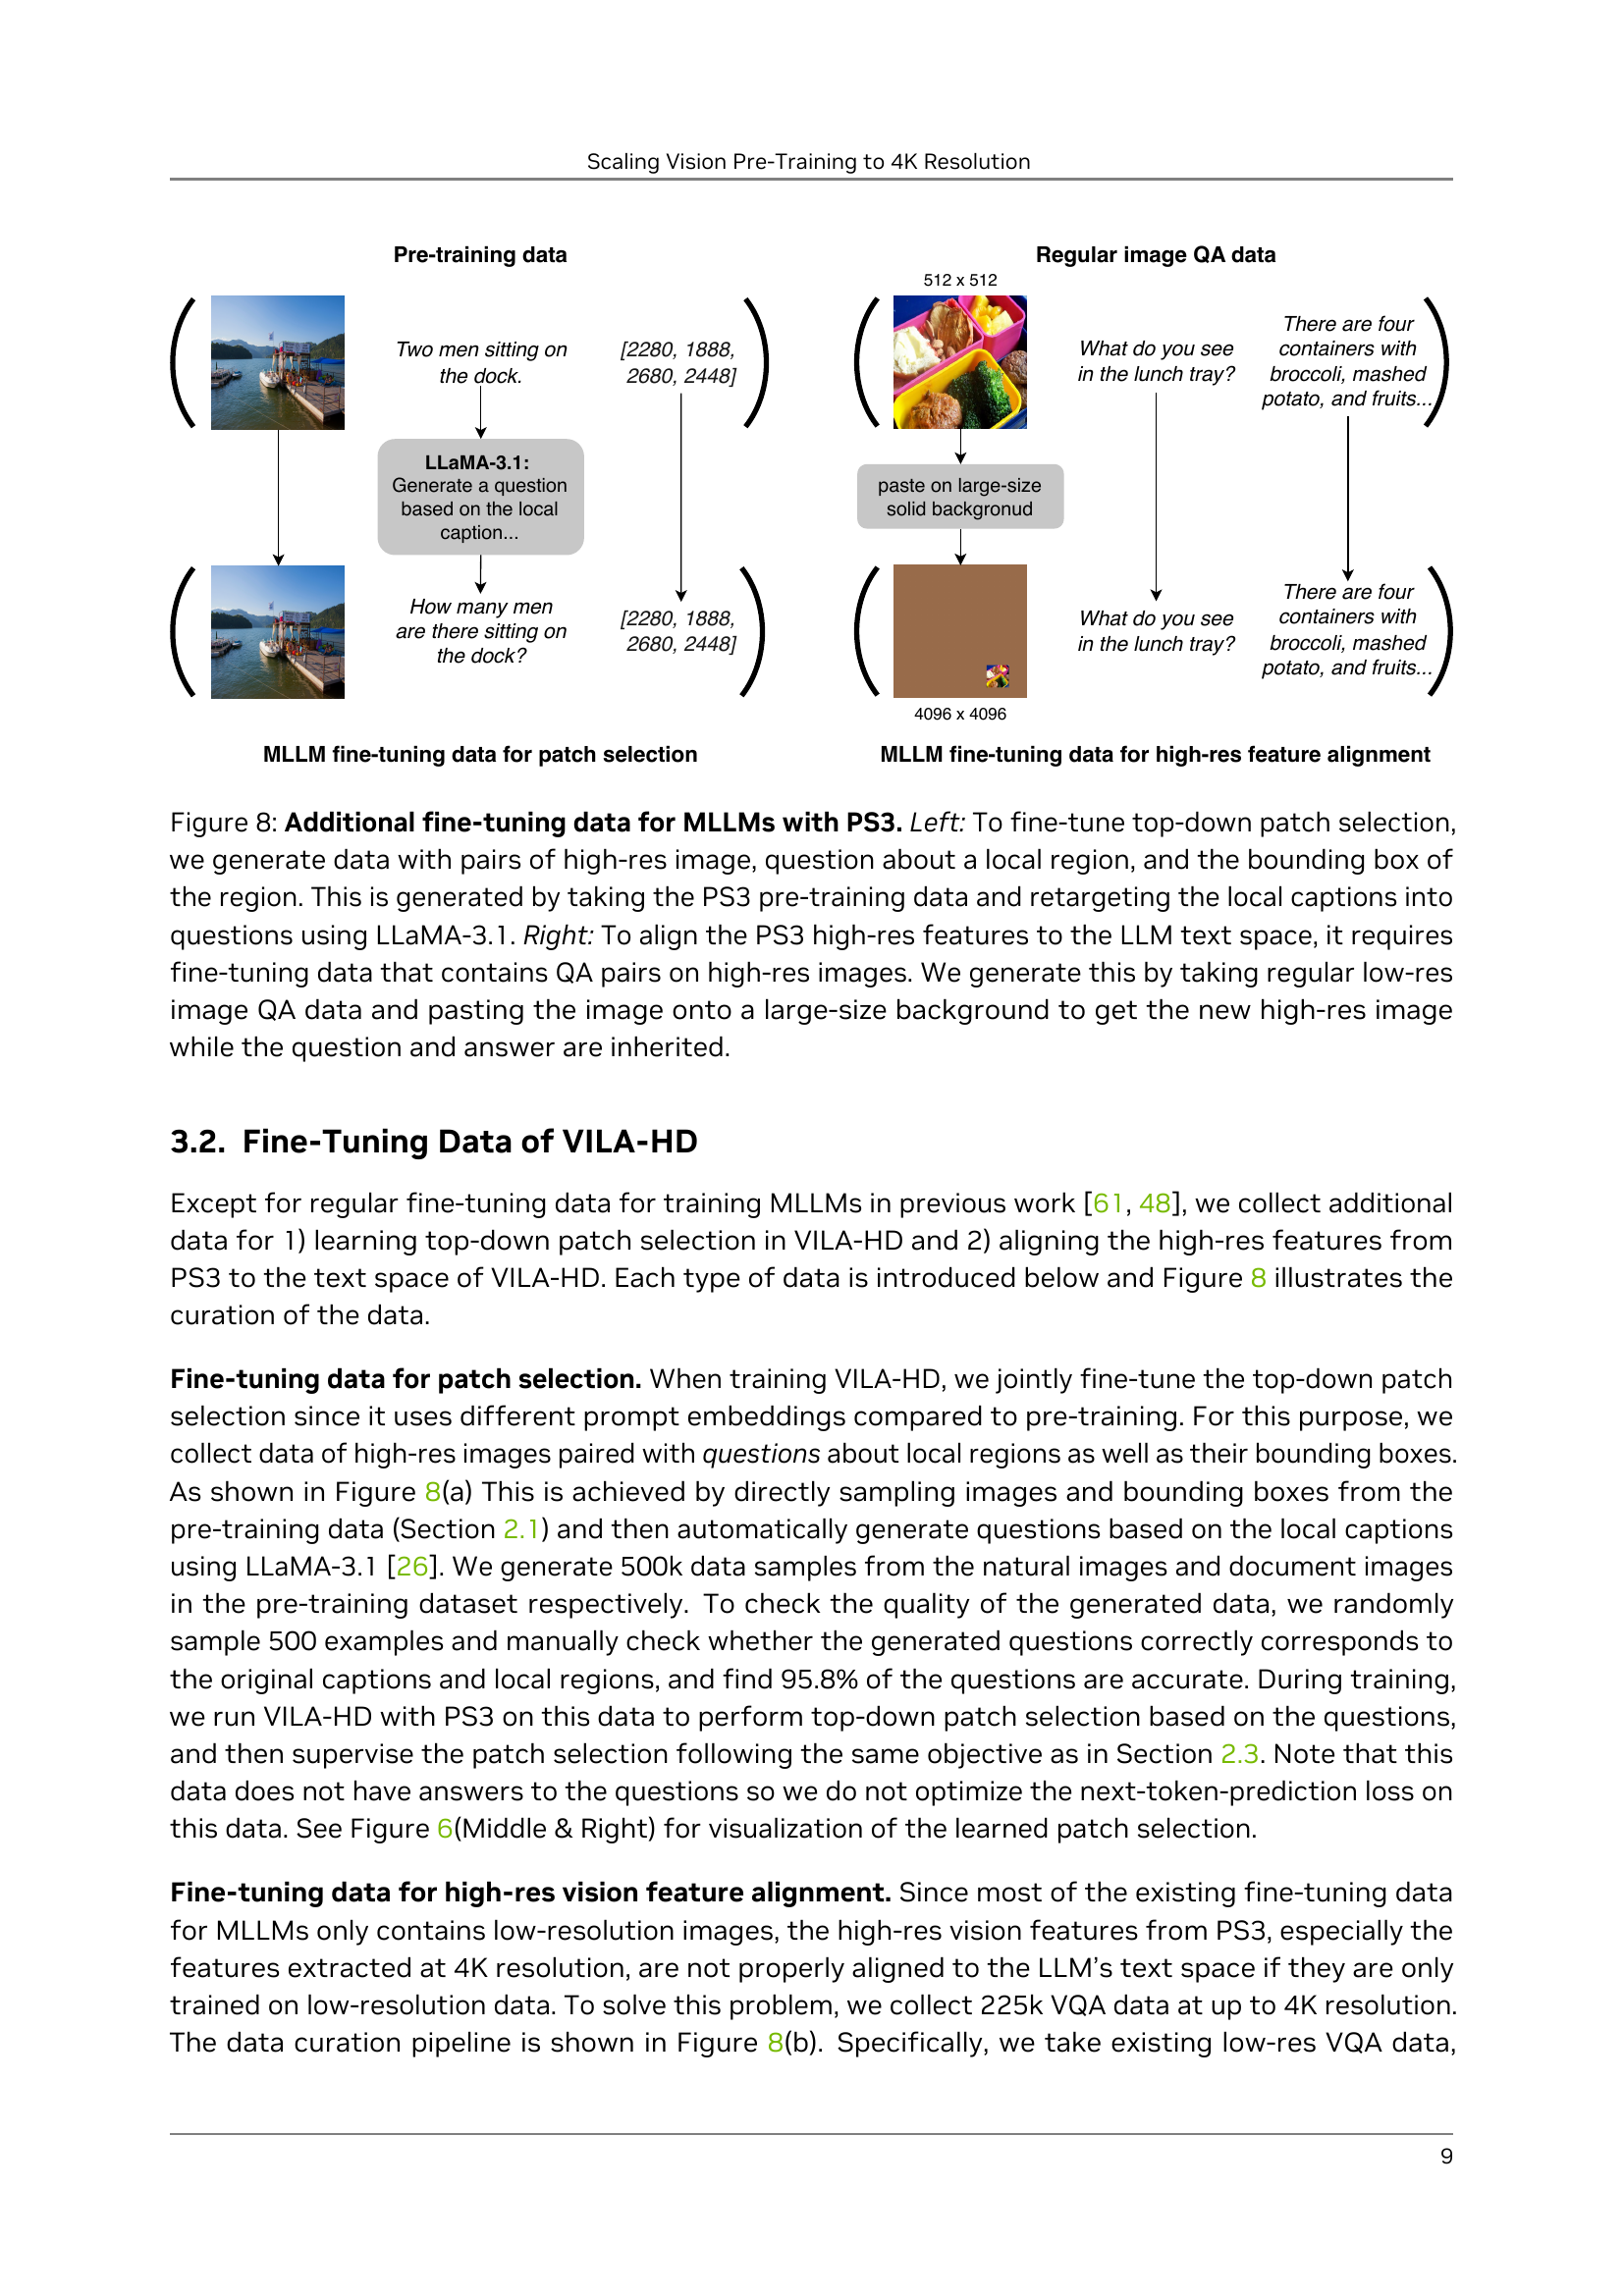
🔼 Figure 8 illustrates the two types of additional fine-tuning data used to improve the performance of multi-modal large language models (MLLMs) incorporating the PS3 vision encoder. The left panel shows data for fine-tuning the top-down patch selection mechanism. This data consists of high-resolution images, a question specifically targeting a local region within the image, and the bounding box coordinates of that region. This data is created by converting the local captions from the PS3 pre-training data into questions using the LLaMA-3.1 language model. The right panel details the data used for aligning the high-resolution visual features extracted by PS3 with the textual representations within the LLM. This involves taking existing low-resolution image question-answering (QA) pairs and enlarging the image by pasting it onto a larger background canvas, creating a new high-resolution image while keeping the original question and answer unchanged. This process ensures that the model learns to leverage high-resolution details for accurate answers.
read the caption
Figure 8: Additional fine-tuning data for MLLMs with \model. Left: To fine-tune top-down patch selection, we generate data with pairs of high-res image, question about a local region, and the bounding box of the region. This is generated by taking the \modelpre-training data and retargeting the local captions into questions using LLaMA-3.1. Right: To align the \modelhigh-res features to the LLM text space, it requires fine-tuning data that contains QA pairs on high-res images. We generate this by taking regular low-res image QA data and pasting the image onto a large-size background to get the new high-res image while the question and answer are inherited.

🔼 Figure 9 demonstrates the scaling properties of the PS3 model when integrated with the VILA-HD multi-modal large language model. It showcases how performance changes across several factors related to resolution and computational cost. Panel (a) shows performance scaling with the increase of the input image resolution when all high-resolution patches are used. A comparison with baselines highlights PS3’s superiority. Panel (b) examines performance when a fixed number of high-resolution patches are used, regardless of resolution, demonstrating PS3’s ability to maintain or even improve performance at higher resolutions with similar compute. Panel (c) illustrates a trade-off between compute and performance at a fixed resolution: using more high-resolution patches increases performance but demands more computation. Finally, panel (d) shows that increasing the number of high-resolution patches at test time, even after training with fewer patches, further boosts performance.
read the caption
Figure 9: Scaling properties of \modelon \vilamodel. (Left) Overall results. We report average performance of the MLLM on seven benchmarks under different maximum input resolution. The size of each data point indicates the number of high-res vision tokens input to the LLM. (a) When selecting all high-res patches for MLLM, the performance of \modelscales better with the resolution than the baselines without high-resolution pre-training. (b) \modelis able to process higher resolution and improve performance while selecting a fixed number of high-res patches for MLLM. (c) Within the same resolution, \modelis able to trade compute for performance by selecting more high-res patches. (d) \modelcan select more high-res patches at test time even if its selects a fixed number of high-res patches during MLLM training.

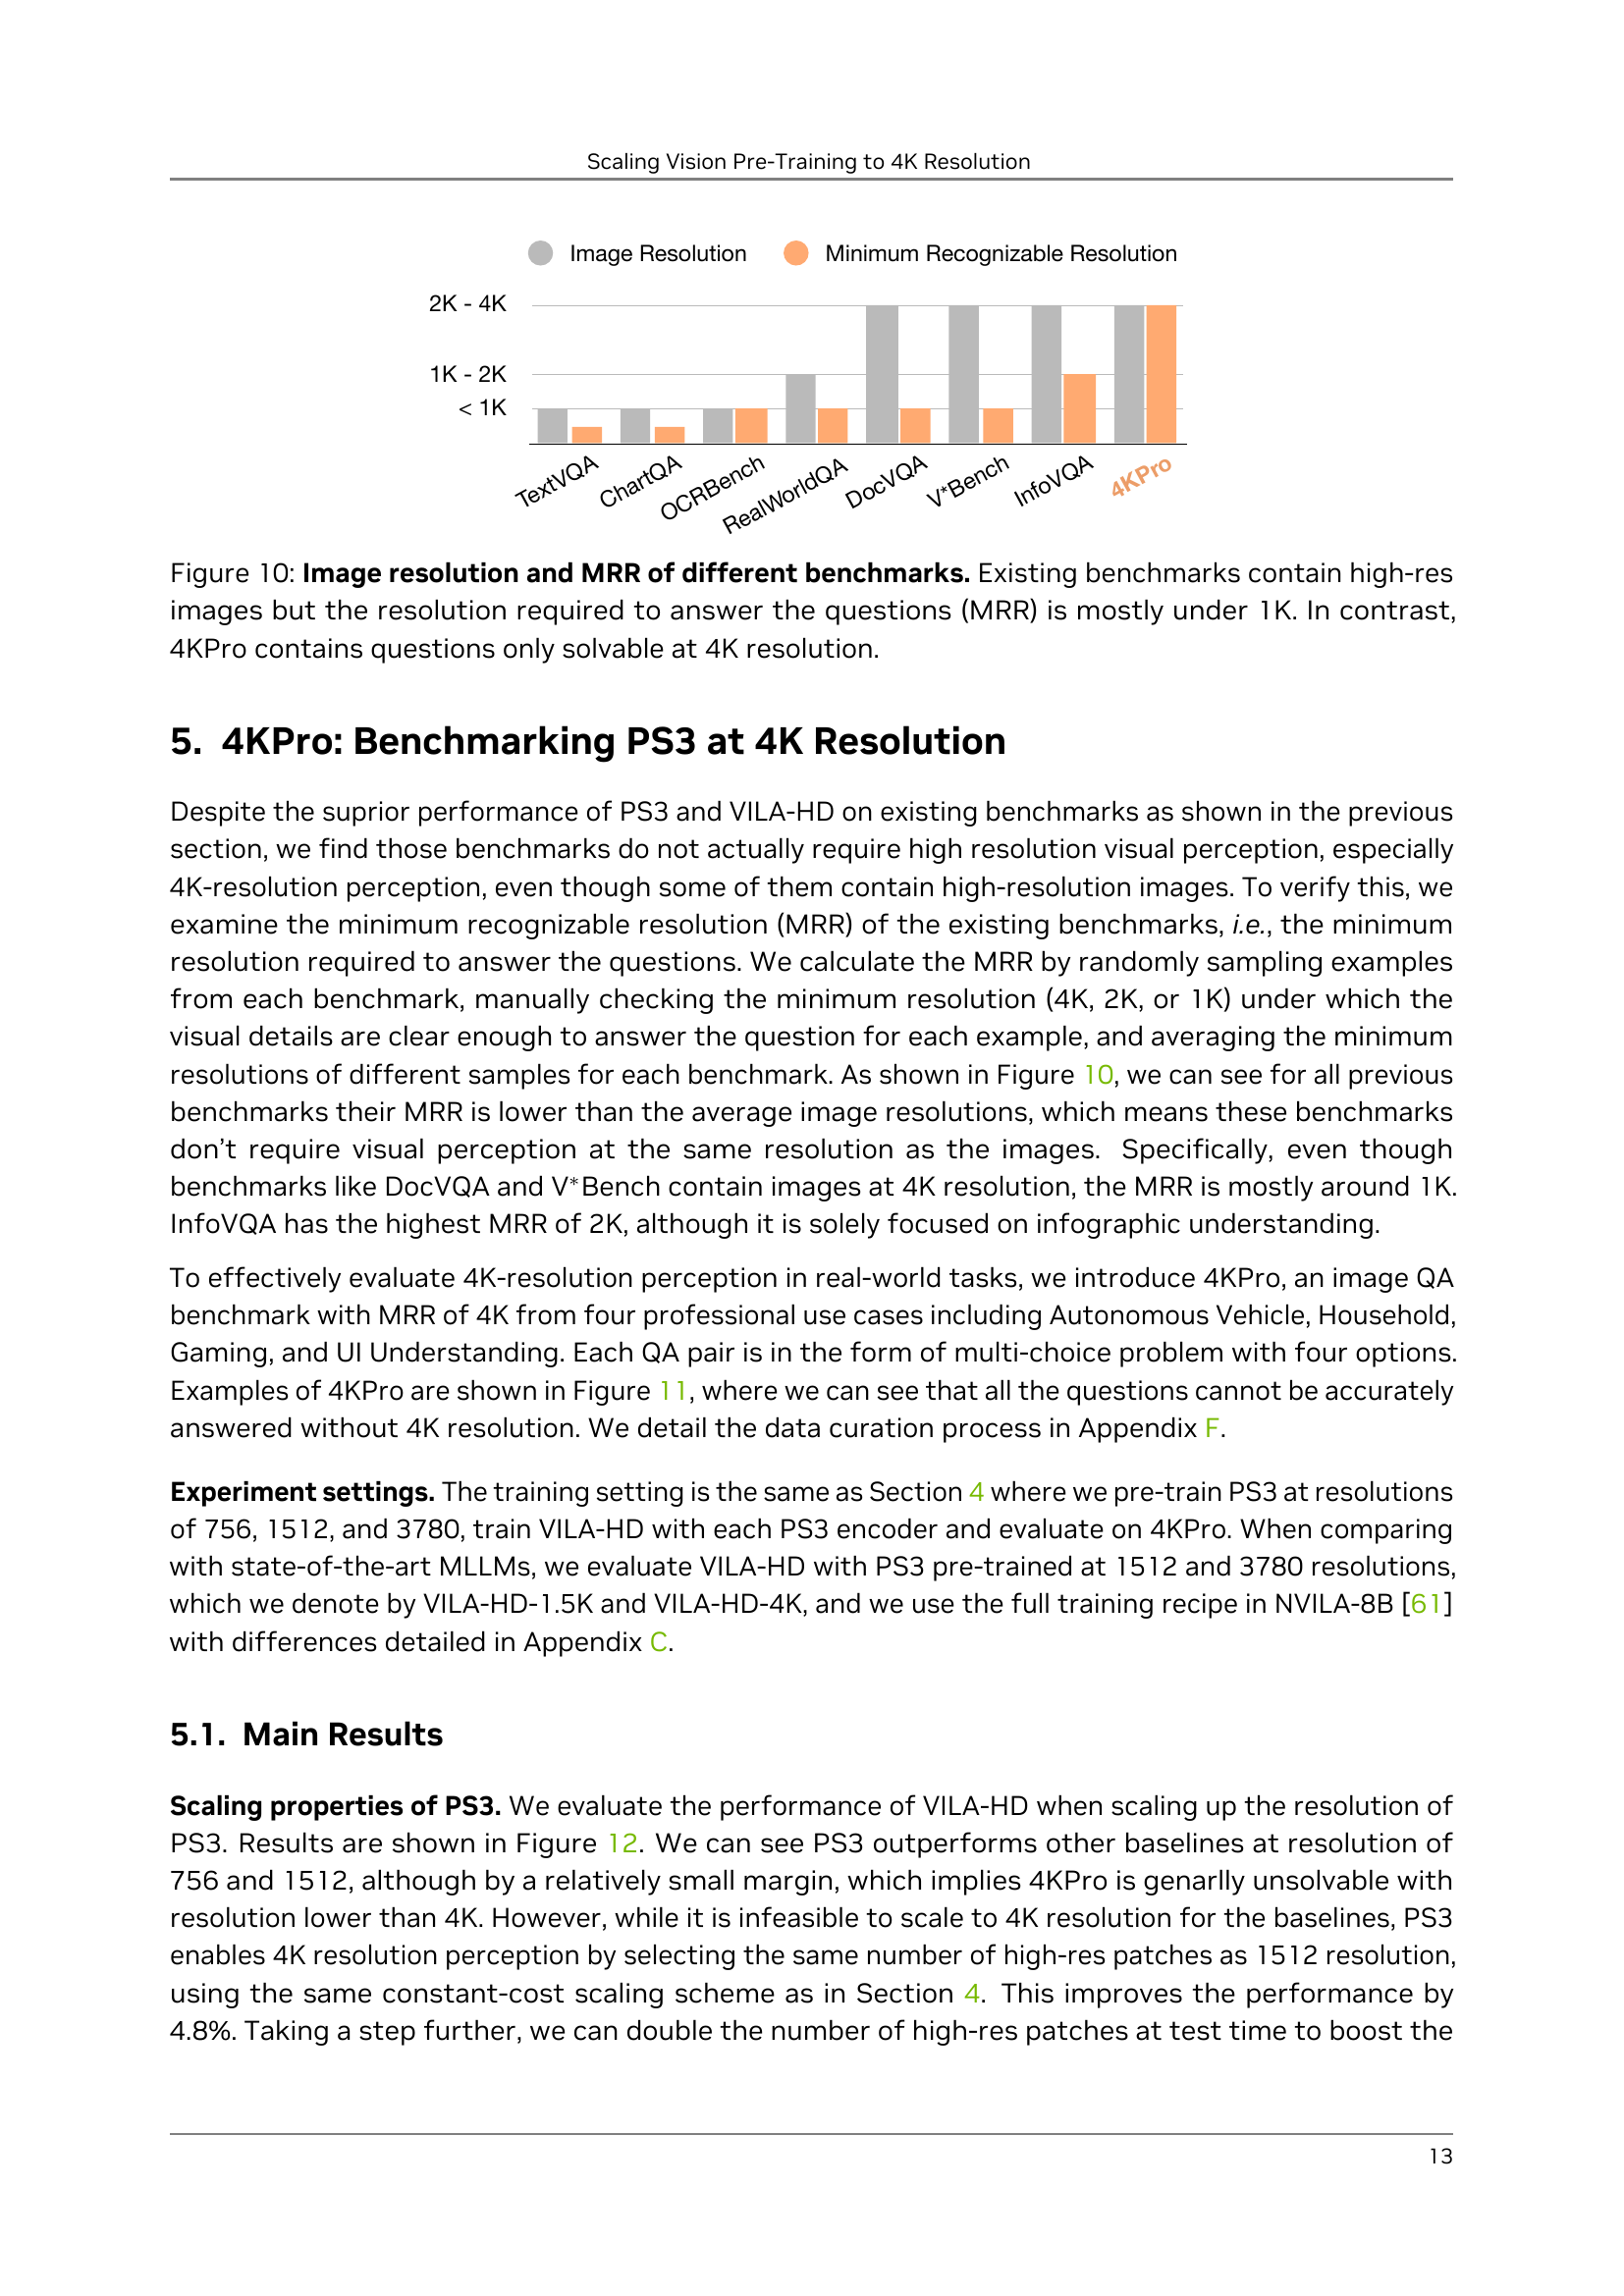
🔼 Figure 10 illustrates the relationship between image resolution and the minimum resolution required to accurately answer associated questions (MRR) across various benchmark datasets. Existing vision-language benchmarks, while employing high-resolution images, often have questions answerable at resolutions significantly lower than 4K (mostly under 1K). This is in stark contrast to the proposed 4KPro benchmark, where questions are specifically designed to be answerable only at a 4K resolution. This highlights the fact that many existing benchmarks do not truly test high-resolution visual perception capabilities.
read the caption
Figure 10: Image resolution and MRR of different benchmarks. Existing benchmarks contain high-res images but the resolution required to answer the questions (MRR) is mostly under 1K. In contrast, 4KPro contains questions only solvable at 4K resolution.

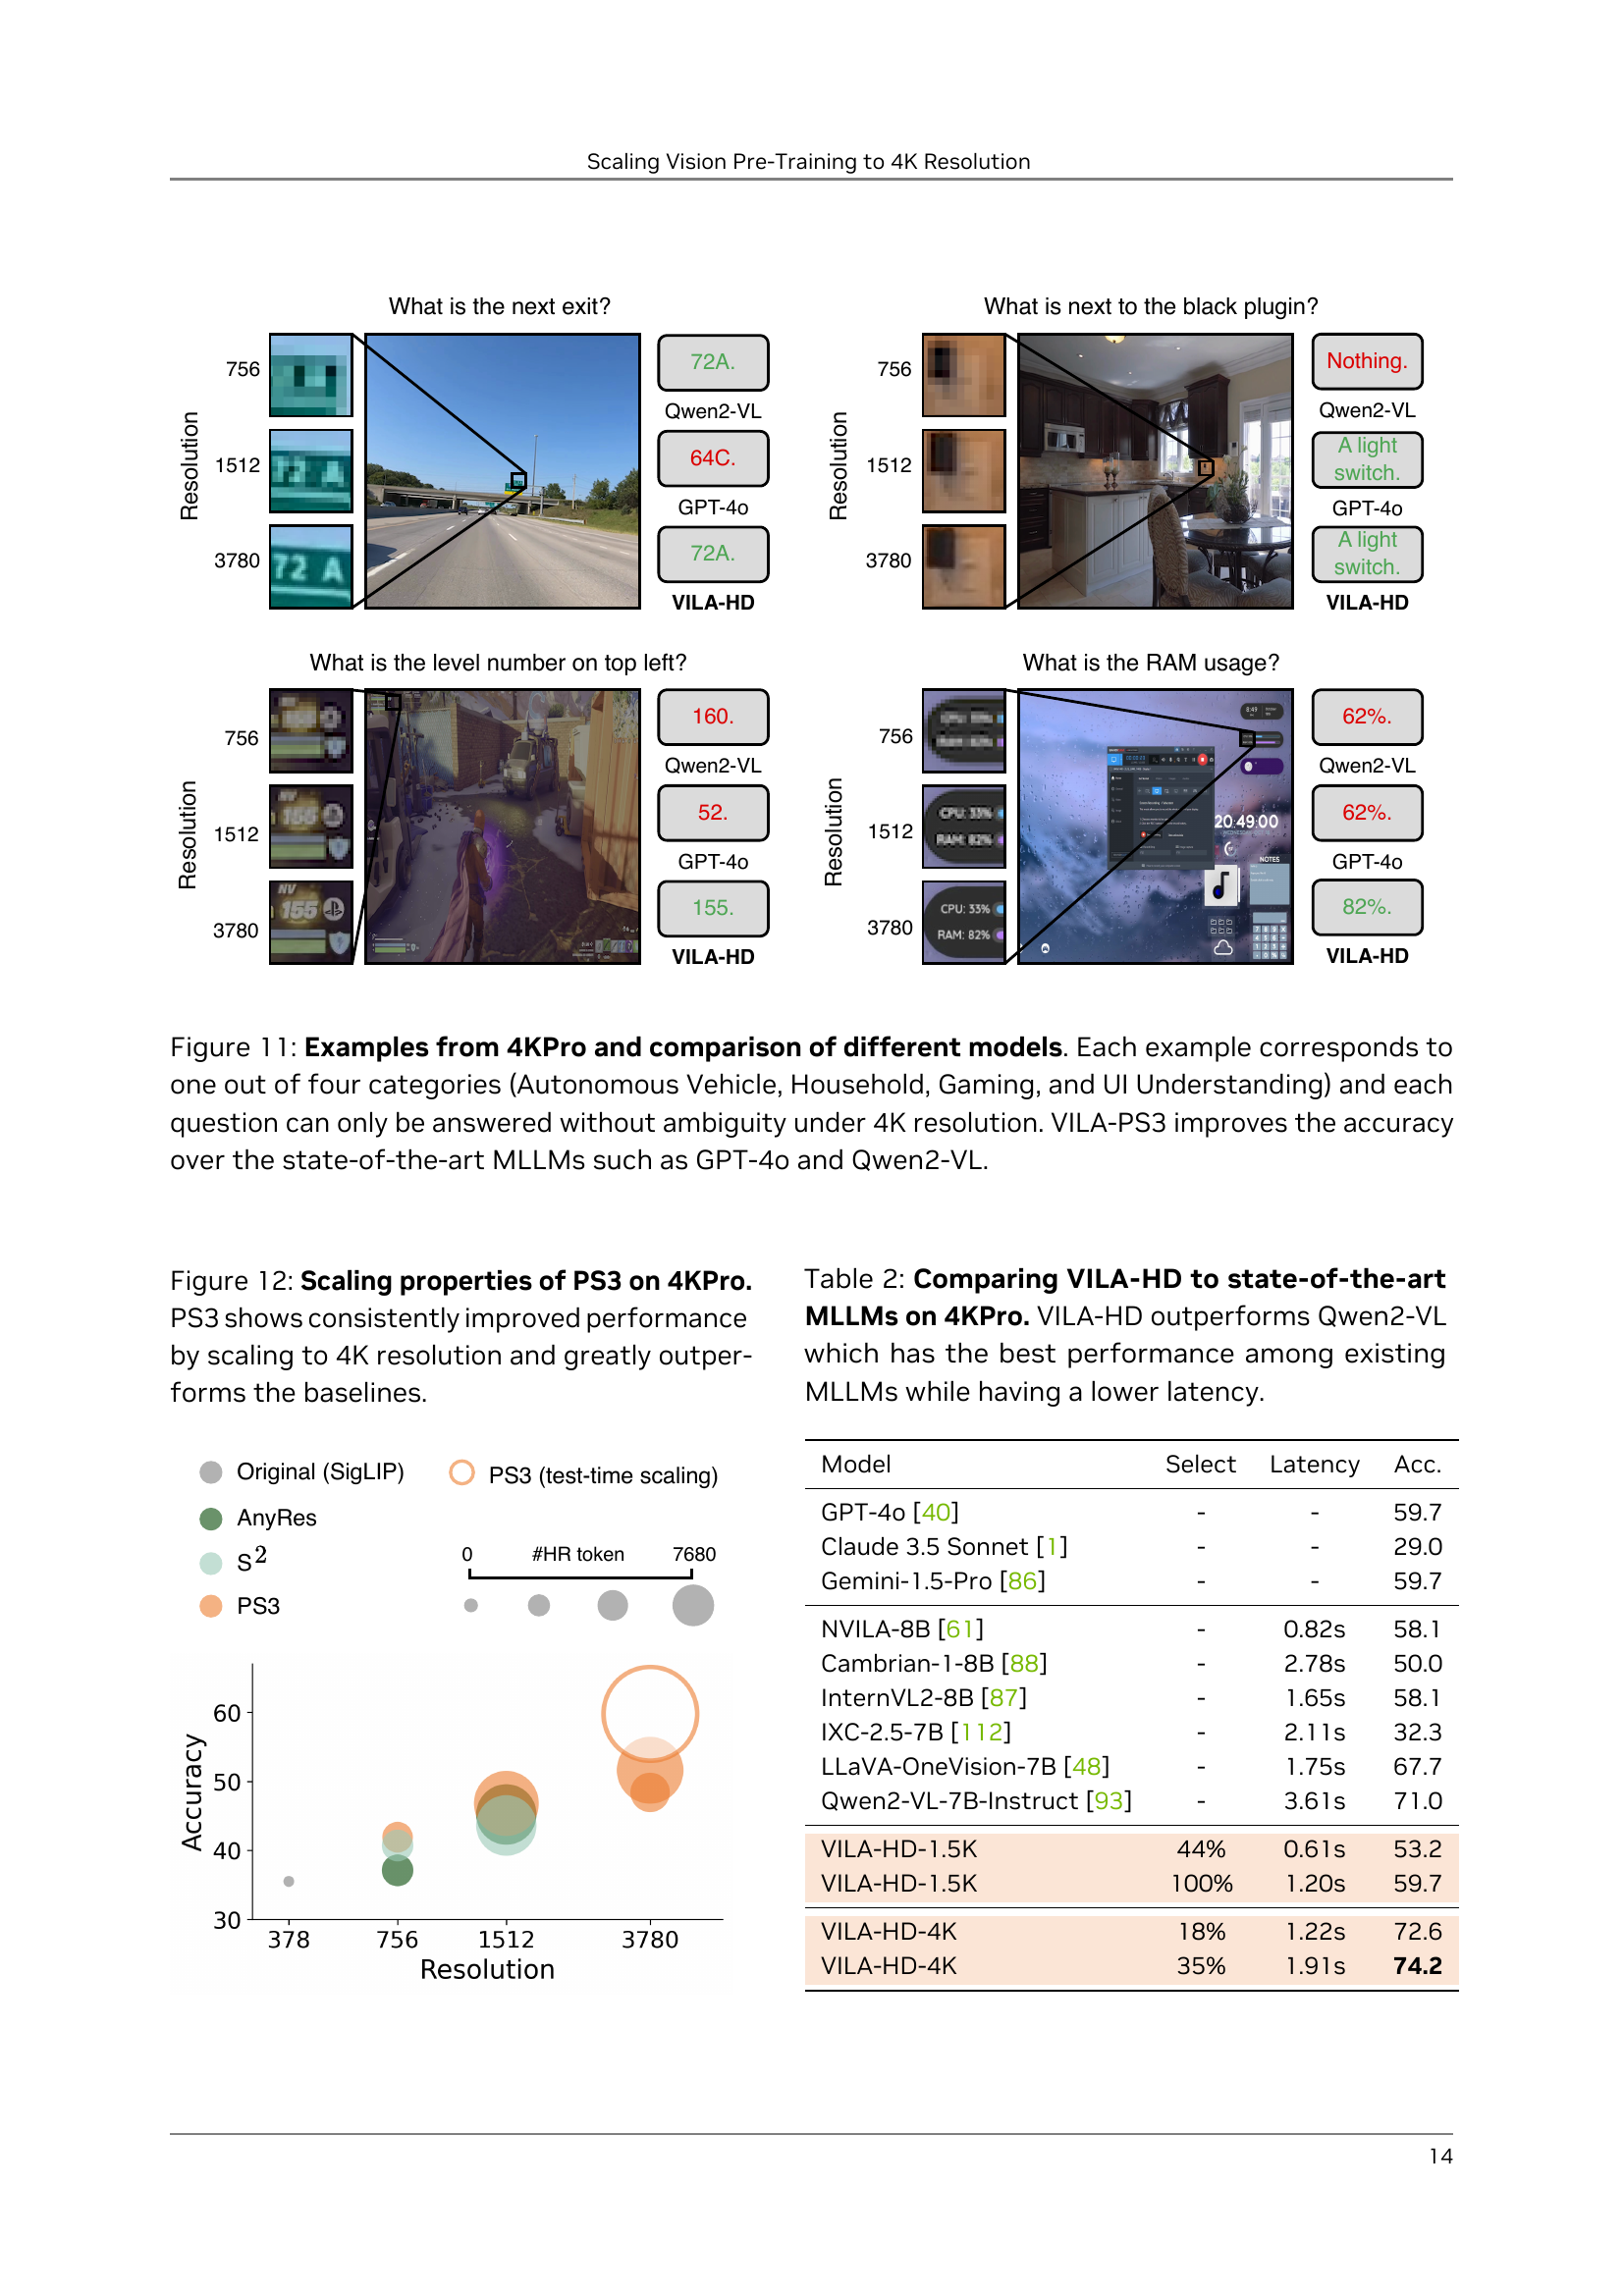
🔼 Figure 11 presents four examples from the 4KPro benchmark dataset, each representing one of four categories: Autonomous Vehicle, Household, Gaming, and UI Understanding. Each example shows a high-resolution image (4K) and a multiple-choice question that requires a high level of visual detail to answer accurately. The figure compares the performance of the VILA-HD model (with PS3 as the vision encoder) against other state-of-the-art large language models (LLMs), such as GPT-4 and Qwen2-VL, demonstrating that VILA-HD achieves significantly higher accuracy in answering the 4KPro questions that demand high-resolution visual understanding. The results highlight the effectiveness of PS3 in enabling LLMs to handle high-resolution image data and achieve superior performance compared to baselines that do not utilize this approach.
read the caption
Figure 11: Examples from 4KPro and comparison of different models. Each example corresponds to one out of four categories (Autonomous Vehicle, Household, Gaming, and UI Understanding) and each question can only be answered without ambiguity under 4K resolution. VILA-\modelimproves the accuracy over the state-of-the-art MLLMs such as GPT-4o and Qwen2-VL.

🔼 Figure 12 presents a graph illustrating the scaling properties of the VILA-HD model, specifically its performance on the 4KPro benchmark as the resolution of the PS3 vision encoder increases. The graph shows VILA-HD’s accuracy consistently improves as the resolution scales up to 4K, significantly surpassing the performance of baselines that lack high-resolution vision pre-training. This visualization demonstrates the effectiveness of PS3 in achieving superior performance at high resolution.
read the caption
Figure 12: Scaling properties of \modelon 4KPro. \modelshows consistently improved performance by scaling to 4K resolution and greatly outperforms the baselines.

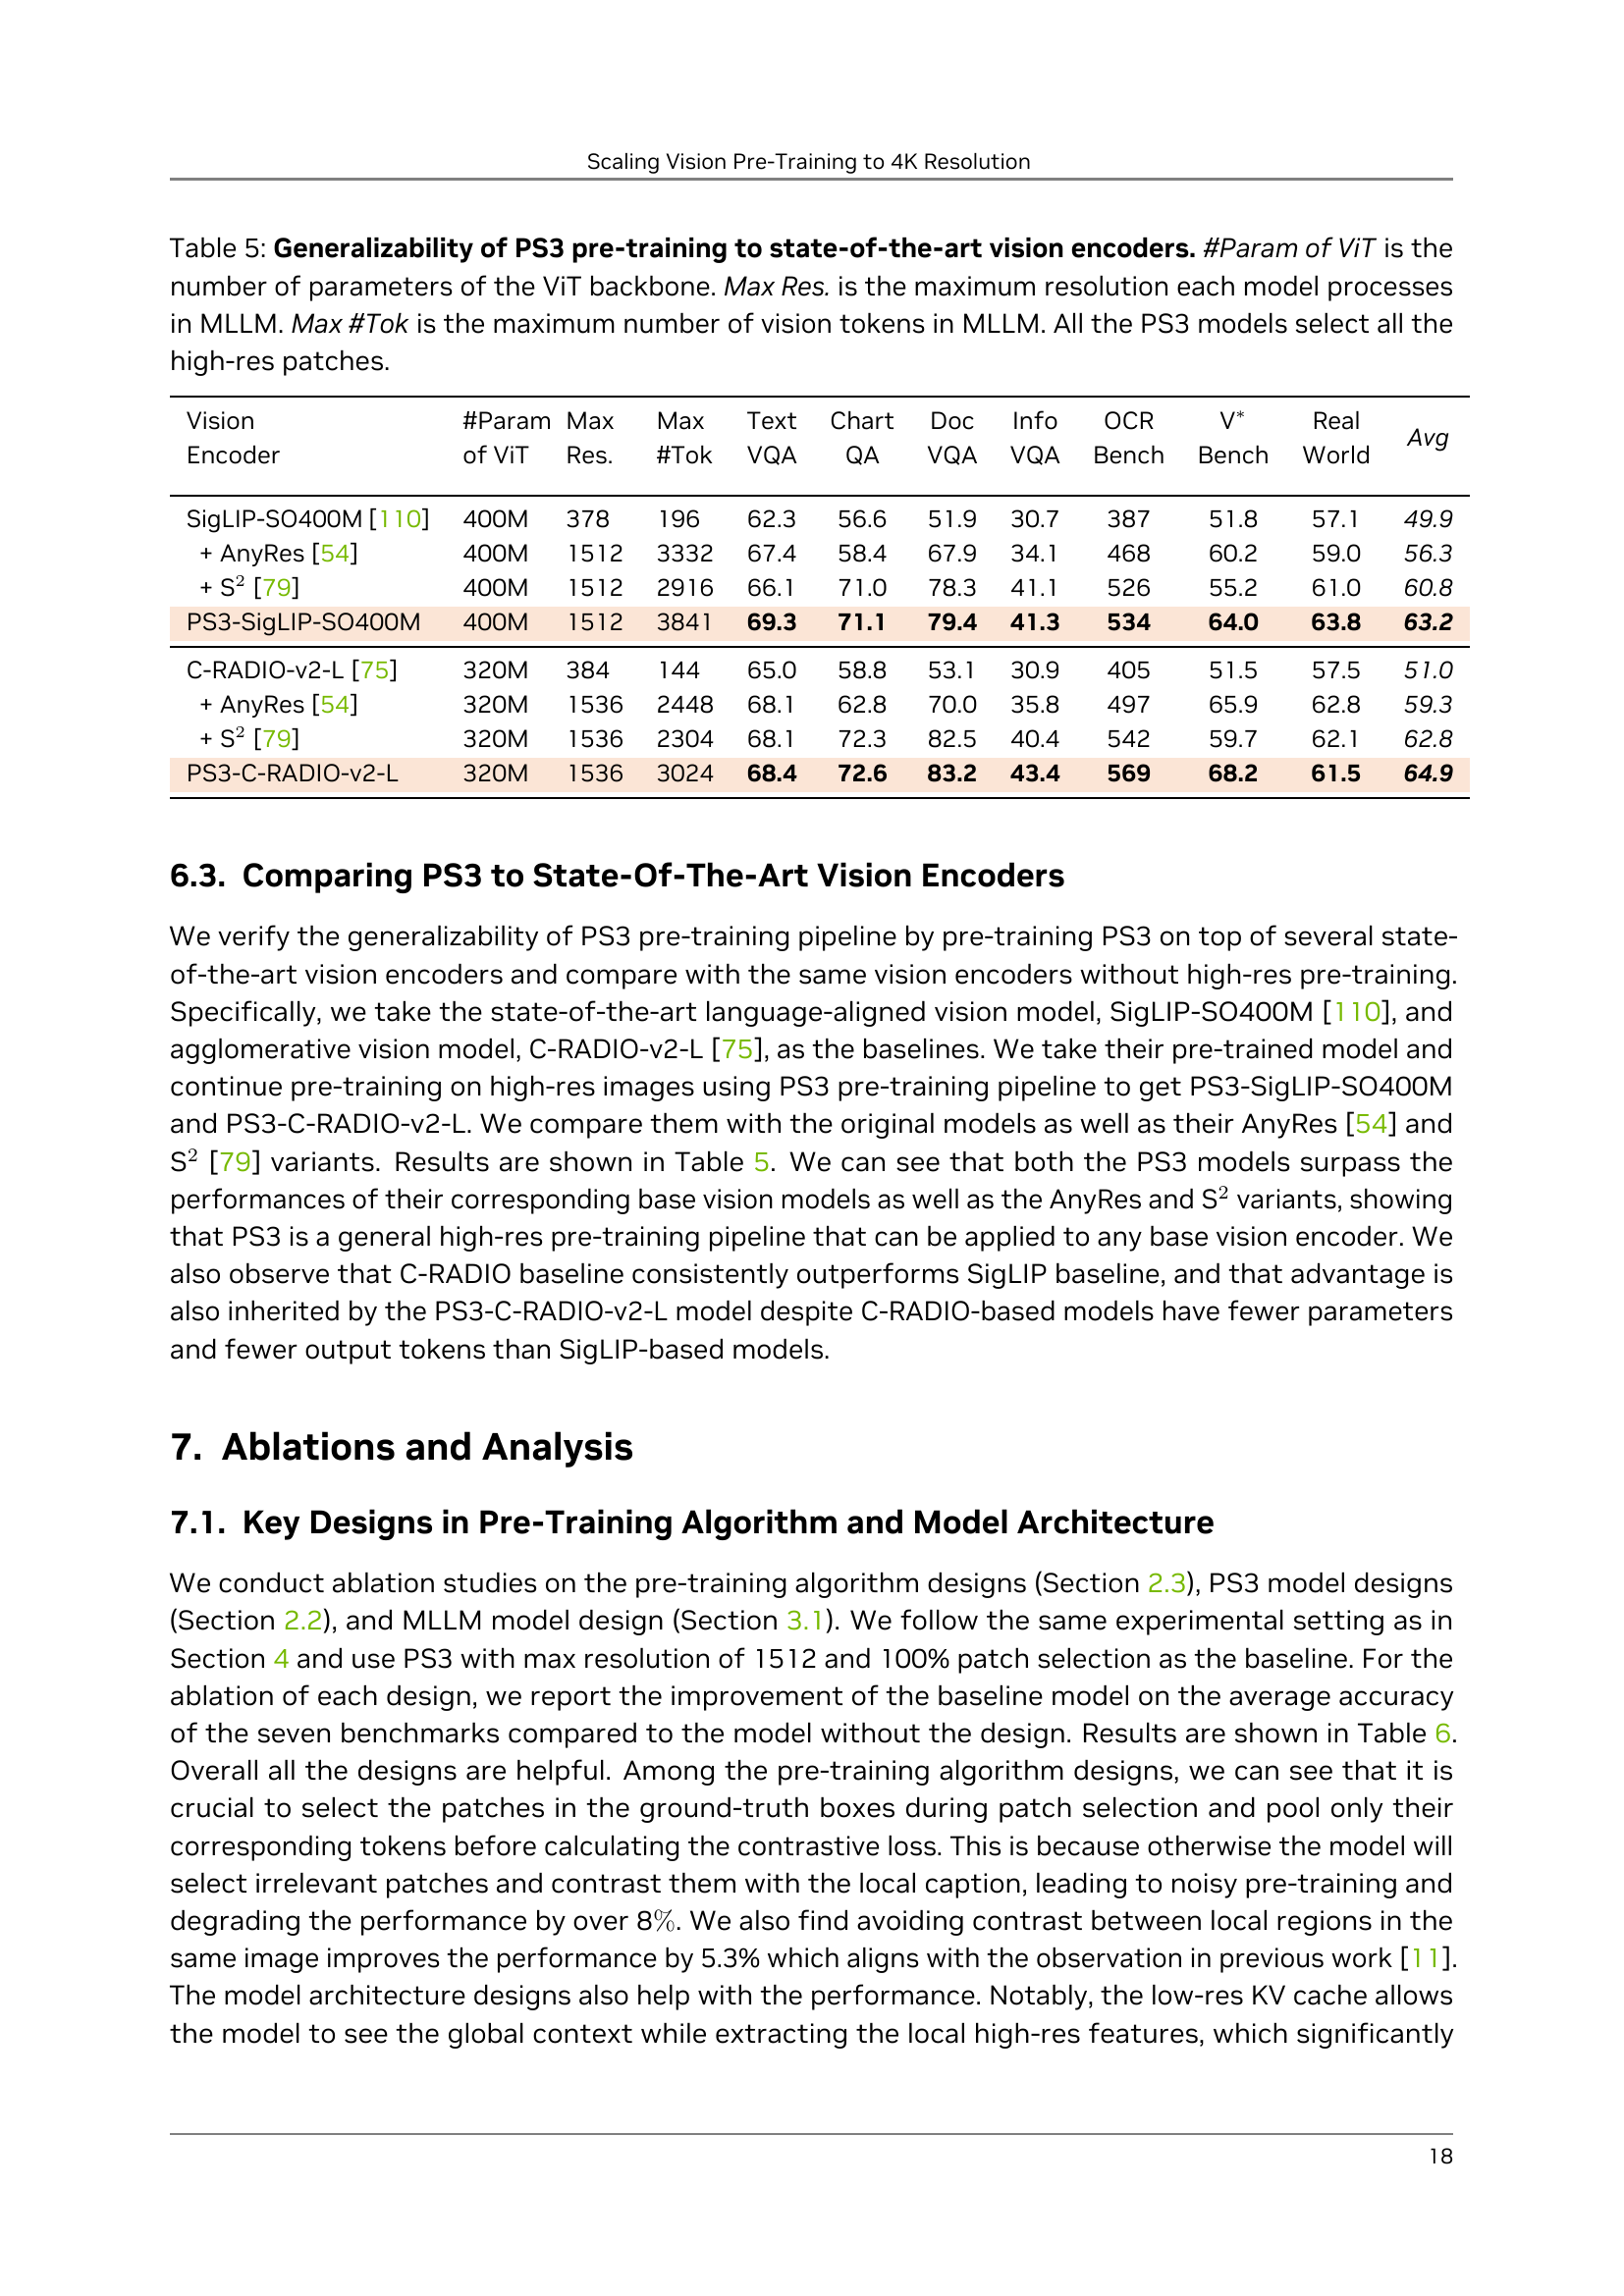
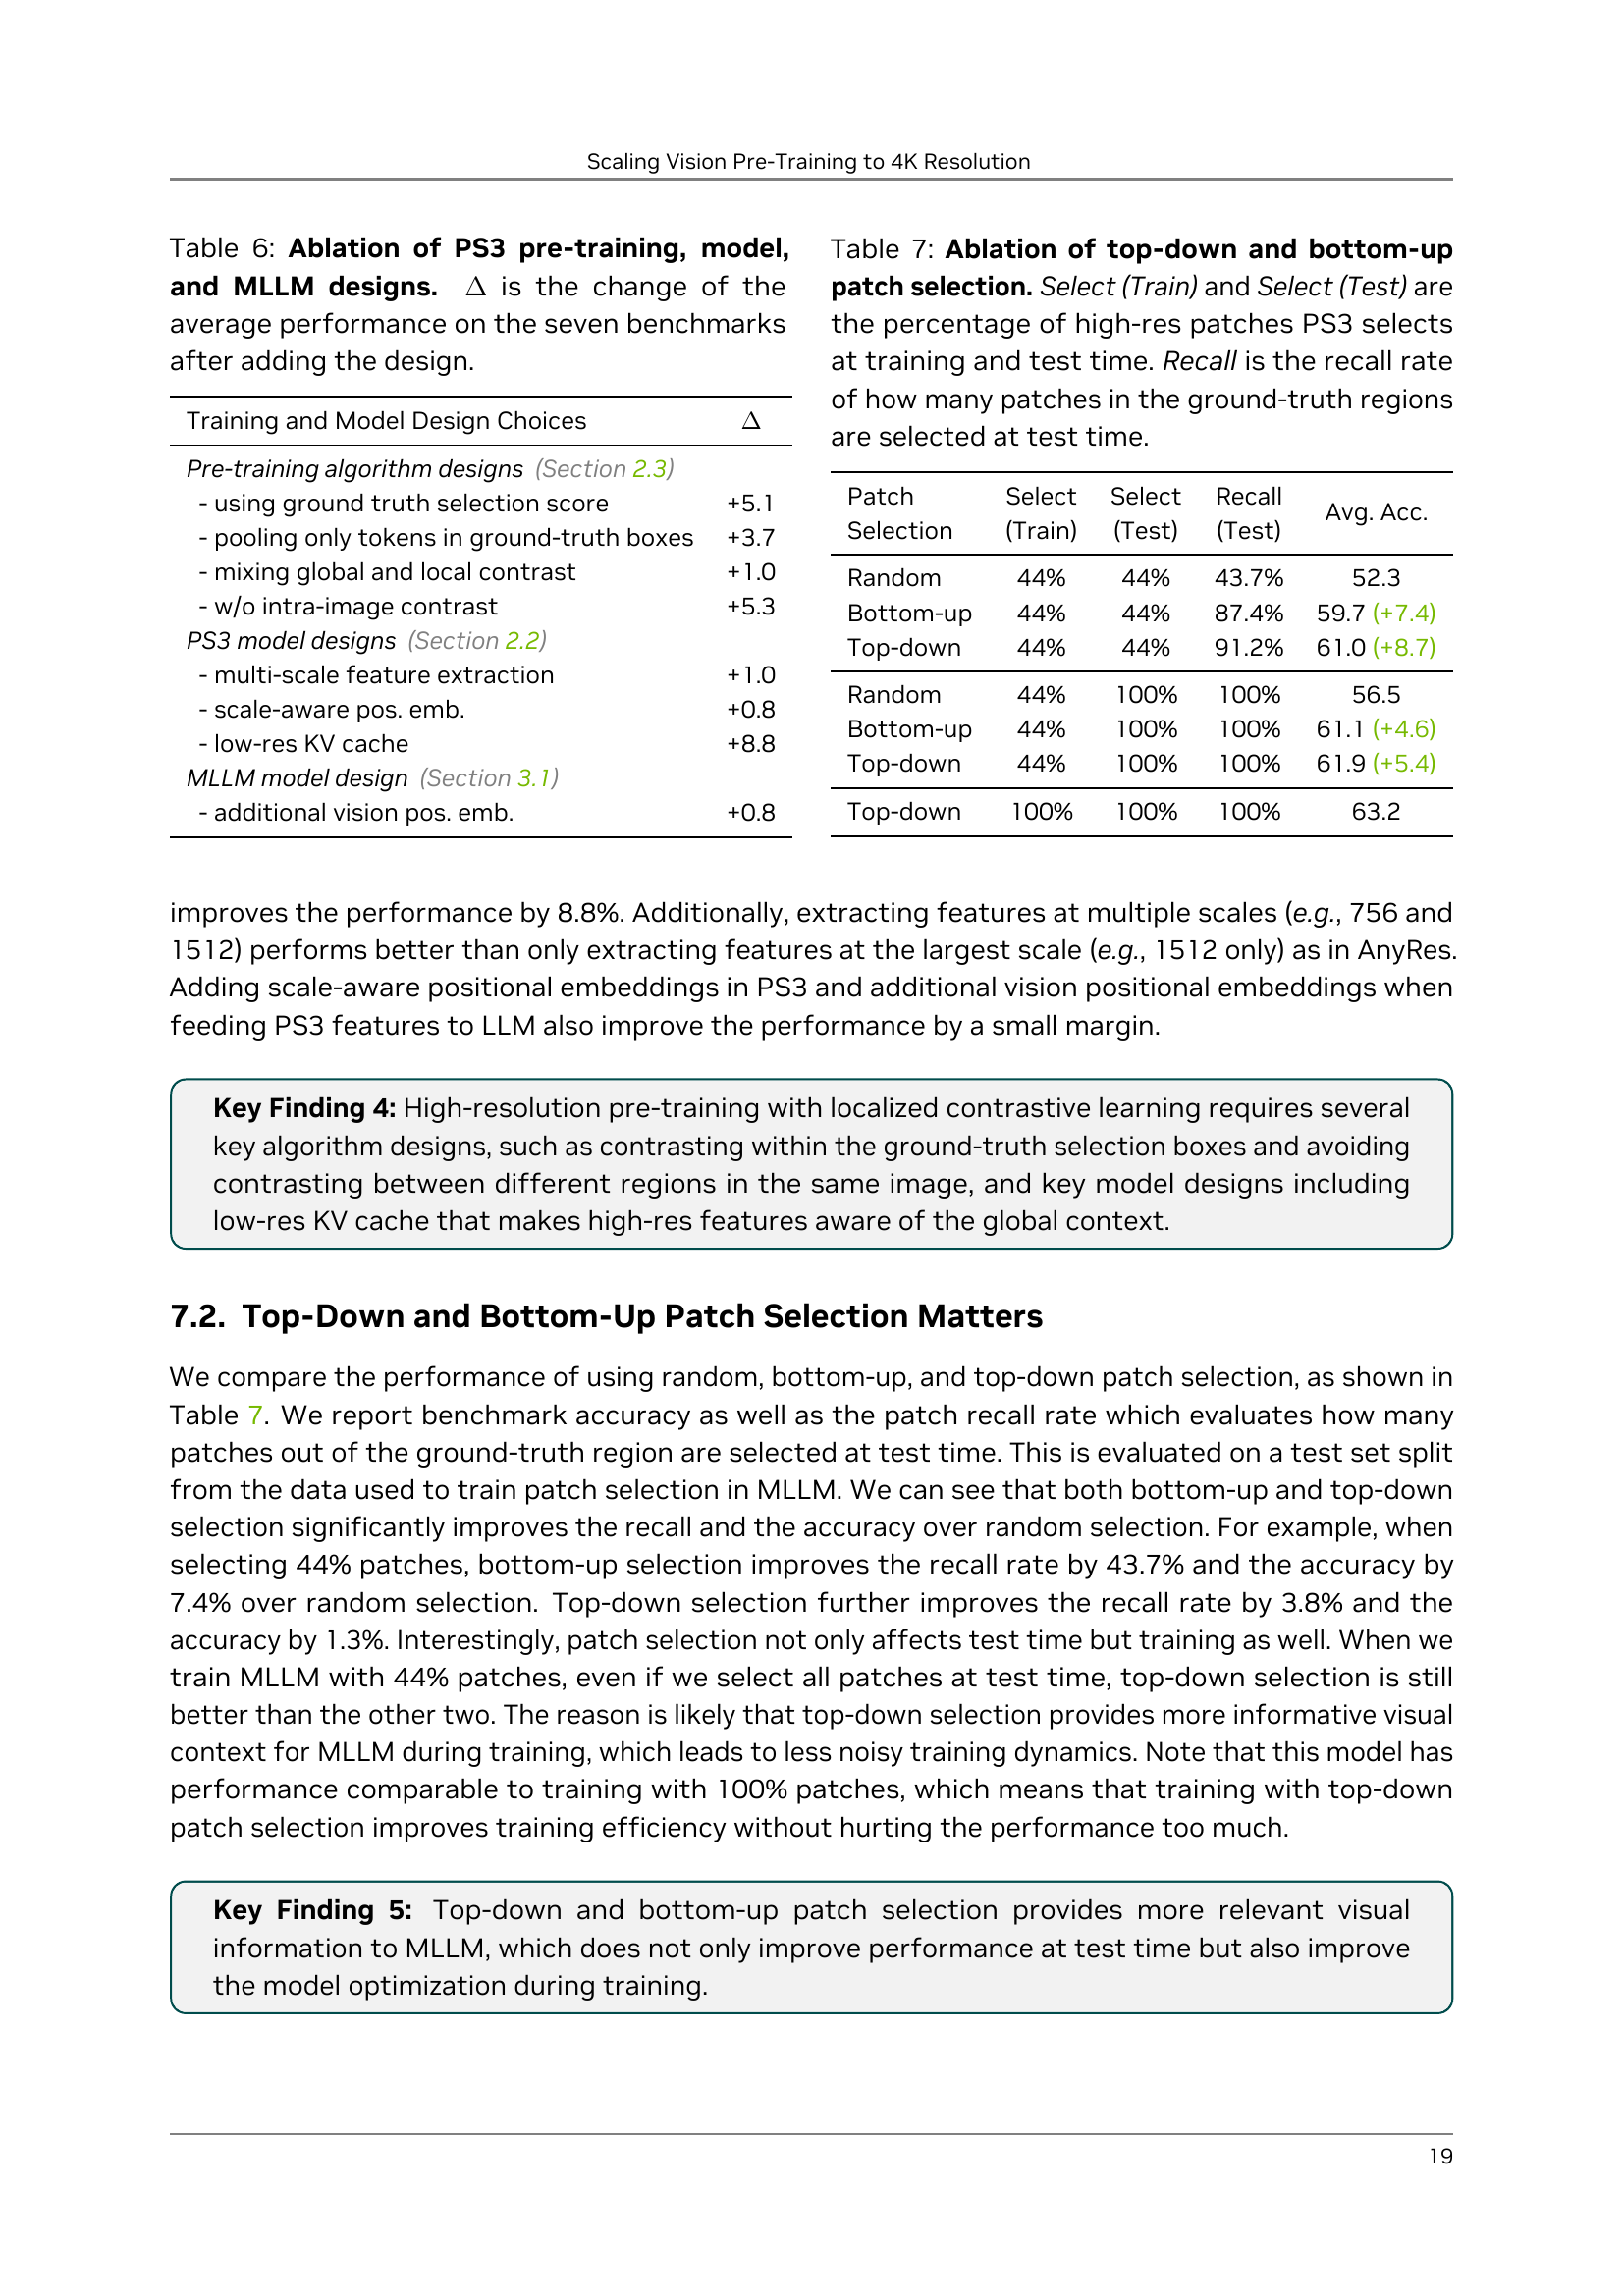
🔼 This table presents an ablation study analyzing the impact of various design choices on the performance of the PS3 model and its integration within the MLLM. It shows the average performance change (ΔΔ Δ) across seven benchmark datasets after including or excluding specific design elements. These elements cover PS3’s pre-training algorithm, model architecture, and the MLLM’s design. The results quantify the contribution of each component, enabling a better understanding of their individual importance to the overall model effectiveness.
read the caption
Table 6: Ablation of PS3 pre-training, model, and MLLM designs. ΔΔ\Deltaroman_Δ is the change of the average performance on the seven benchmarks after adding the design.

🔼 This table presents an ablation study on the effects of different patch selection methods on the performance of a vision model. Specifically, it compares the performance using random, bottom-up (saliency-based), and top-down (prompt-guided) patch selection approaches. The table shows the percentage of high-resolution patches selected during training and testing, along with the recall rate (the proportion of ground truth patches successfully selected). This analysis helps determine the impact of different selection strategies on both training efficiency and the model’s ability to accurately identify relevant image regions.
read the caption
Table 7: Ablation of top-down and bottom-up patch selection. Select (Train) and Select (Test) are the percentage of high-res patches \modelselects at training and test time. Recall is the recall rate of how many patches in the ground-truth regions are selected at test time.

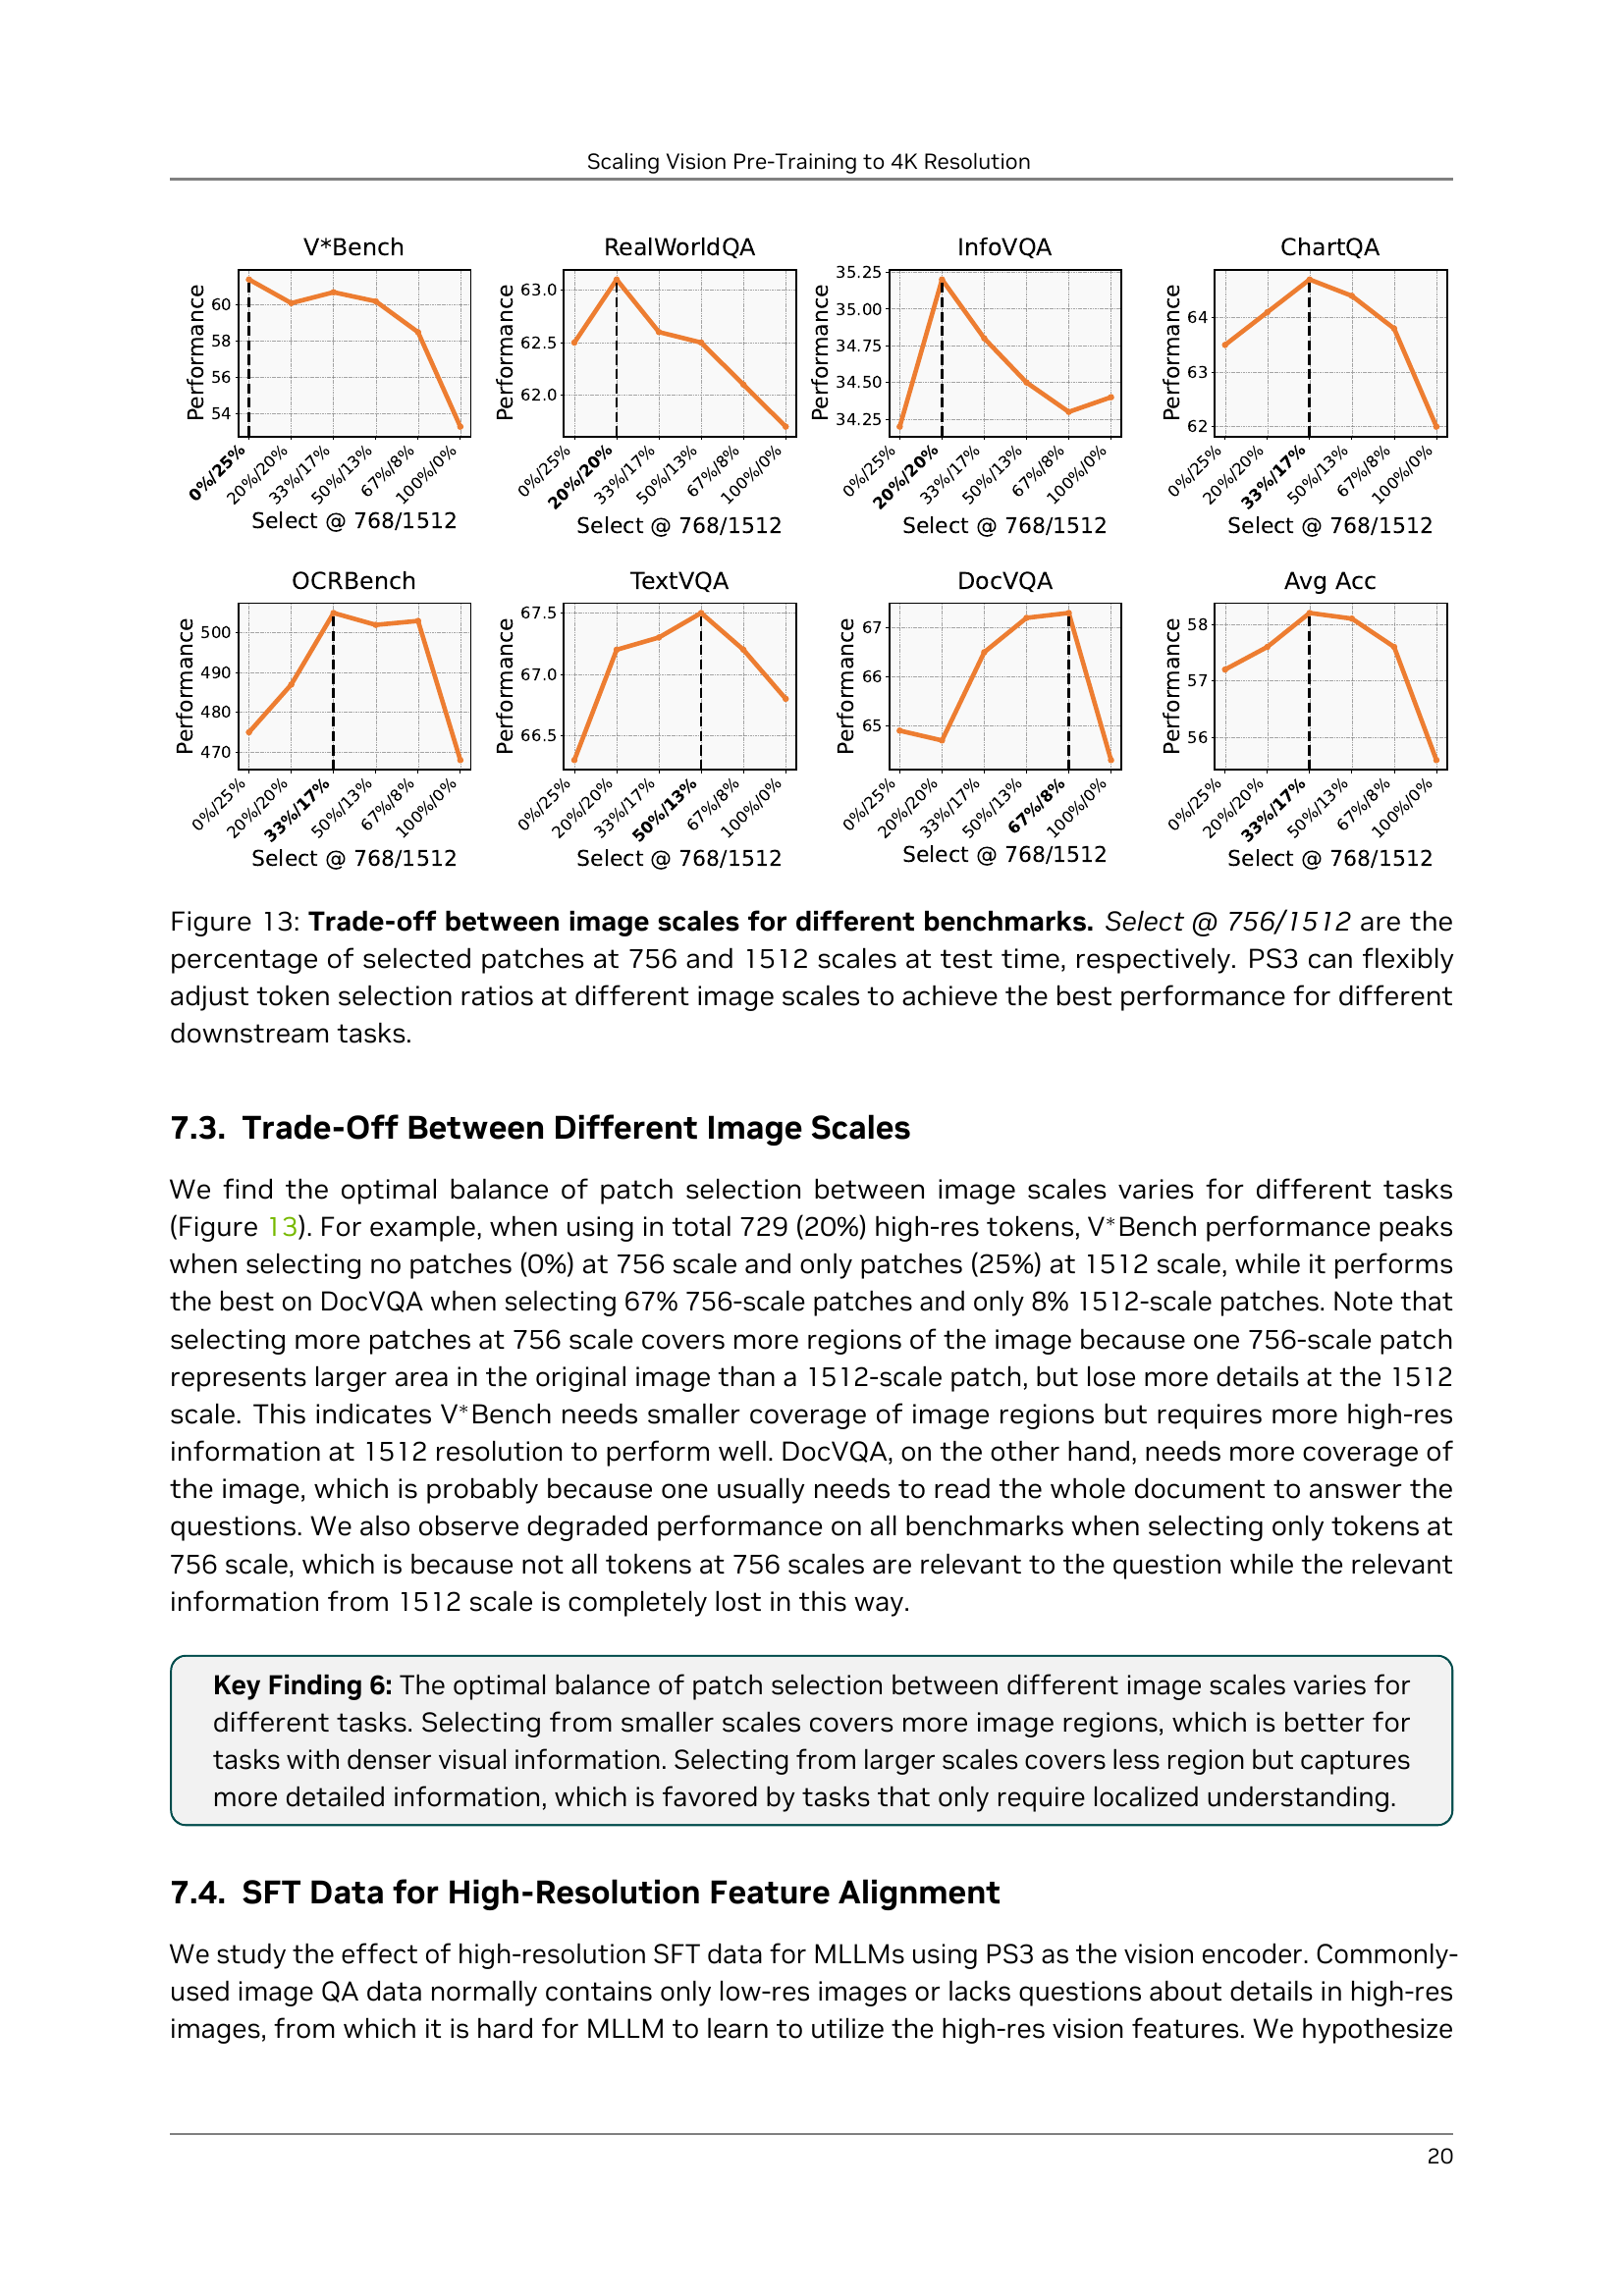
🔼 Figure 13 illustrates the flexible approach of PS3 in handling different image resolutions for various downstream tasks. It demonstrates the trade-off between using different image scales (756 and 1512 pixels) to achieve optimal performance. The x-axis represents the percentage of patches selected at each resolution during testing, showing different optimal ratios for various tasks. The y-axis shows the resulting accuracy on each benchmark. This highlights PS3’s adaptability to balance the need for detailed information (higher resolution) with computational efficiency (fewer patches).
read the caption
Figure 13: Trade-off between image scales for different benchmarks. Select @ 756/1512 are the percentage of selected patches at 756 and 1512 scales at test time, respectively. \modelcan flexibly adjust token selection ratios at different image scales to achieve the best performance for different downstream tasks.

🔼 Figure 14 presents a Principal Component Analysis (PCA) visualization comparing the visual features extracted by PS3 and two baseline methods (S2 and AnyRes) at 4K resolution. The PCA reduces the dimensionality of the high-dimensional feature vectors, allowing for a visual comparison of the feature representations. The image shows that the baselines, S2 and AnyRes, produce either noisy or blurry features at this high resolution, hindering their ability to capture fine details. In contrast, PS3 generates extremely fine-grained features, showcasing a remarkable capacity to extract and represent even subtle details, such as small text on banners, illustrating its superior performance in high-resolution visual perception.
read the caption
Figure 14: PCA visualization of visual features. The baselines, \stwoand AnyRes, have either noisy or blurry features at 4K resolution, while \modelshows extremely fine-grained features that highlight details such as small texts on the banners.

🔼 Figure 15 presents examples from the PS3 pre-training dataset. Each image showcases four salient regions, outlined with different colored bounding boxes. Accompanying each box is a detailed caption generated by the Qwen2-VL model, which describes the contents of the respective cropped image region. While these captions are generally accurate, they occasionally exhibit hallucinations (i.e., descriptions of things that are not actually present in the image). The figure highlights the type of data used to train PS3 to perceive and understand high-resolution visual details.
read the caption
Figure 15: Examples of pre-training data with natural images. Here each image is labeled with bounding boxes of four salient regions (highlighted by different colors), together with the local captions of each region. The local captions, generated by Qwen2-VL, contains details in the crops although there are still occasional hallucinations.

🔼 Figure 16 showcases examples from the PS3 pre-training dataset that includes document images. Each document image has four regions highlighted with different colors, and each region is accompanied by a caption extracted via OCR (Optical Character Recognition). This demonstrates PS3’s ability to handle and label text within various regions of a document image to create localized image-text pairs for training.
read the caption
Figure 16: Examples of pre-training data with document images. Here each image is labeled with four bounding boxes (highlighted by different colors), together with the OCR results as the captions of each region.

🔼 Figure 17 showcases qualitative examples illustrating the model’s patch selection capabilities on natural images. For each example, a question is posed, and the model highlights the specific image regions most relevant to answering the question. This demonstrates the model’s ability to focus on the most pertinent details within the image rather than processing the entire image, thus enhancing efficiency and accuracy. The highlighted areas visually represent the patches selected by the model, showing its selective attention mechanism in action.
read the caption
Figure 17: Qualitative examples of patch selection on natural images. \modelis able to locate different parts of the image that are relevant to the question.
More on tables
| Model | Select | Latency | Acc. |
| GPT-4o [40] | - | - | 59.7 |
| Claude 3.5 Sonnet [1] | - | - | 29.0 |
| Gemini-1.5-Pro [86] | - | - | 59.7 |
| NVILA-8B [61] | - | 0.82s | 58.1 |
| Cambrian-1-8B [88] | - | 2.78s | 50.0 |
| InternVL2-8B [87] | - | 1.65s | 58.1 |
| IXC-2.5-7B [112] | - | 2.11s | 32.3 |
| LLaVA-OneVision-7B [48] | - | 1.75s | 67.7 |
| Qwen2-VL-7B-Instruct [93] | - | 3.61s | 71.0 |
| \vilamodel-1.5K | 44% | 0.61s | 53.2 |
| \vilamodel-1.5K | 100% | 1.20s | 59.7 |
| \vilamodel-4K | 18% | 1.22s | 72.6 |
| \vilamodel-4K | 35% | 1.91s | 74.2 |
🔼 Table 2 presents a comparison of the performance of the VILA-HD model (which uses the PS3 vision pre-training approach) against other state-of-the-art Multimodal Large Language Models (MLLMs) on the 4KPro benchmark. The 4KPro benchmark is specifically designed to evaluate high-resolution visual perception capabilities. The table highlights VILA-HD’s superior accuracy compared to the previously best-performing model (Qwen2-VL) while also demonstrating a lower inference latency.
read the caption
Table 2: Comparing \vilamodelto state-of-the-art MLLMs on 4KPro. \vilamodeloutperforms Qwen2-VL which has the best performance among existing MLLMs while having a lower latency.
| Res. | Select | #Token | ChartQA (test) | DocVQA (test) | InfoVQA (test) | MathVista (testmini) | MMBench (en-dev) | MMMU-Pro (standard) | OCRBench (test) | V∗Bench (test) | RealWorldQA (test) | TextVQA (val) | 4KPro (test) | |
| Proprietary | ||||||||||||||
| GPT-4o [40] | - | - | - | 85.7 | 92.8 | - | 63.8 | - | 54.0 | 736 | 53.7 | 58.6 | - | 59.7 |
| Claude 3.5 Sonnet [1] | - | - | - | 90.8 | 95.2 | 49.7 | 67.7 | - | 55.0 | 788 | 23.0 | 59.9 | - | 29.0 |
| Gemini-1.5-Pro [86] | - | - | - | 87.2 | 93.1 | 81.0 | 63.9 | - | 49.4 | 754 | 60.3 | 70.4 | 78.7 | 59.7 |
| Open-source | ||||||||||||||
| VILA-1.5-8B [51] | 336 | - | 576 | 52.7 | 40.6 | 25.9 | 36.7 | 68.9 | - | - | - | 52.7 | 68.5 | 33.9 |
| Cambrian-1-8B [88] | 1024 | - | - | 73.3 | 77.8 | - | 49.0 | 75.9 | - | 624 | 59.2 | 64.2 | 71.7 | 50.0 |
| NVILA-8B [61] | 1552 | - | 3072 | 86.1 | 93.7 | 70.7 | 65.4 | 87.6 | 33.6 | 794 | 67.2 | 66.4 | 80.1 | 58.1 |
| MM1.5-7B [111] | 2016 | - | 5184 | 78.6 | 88.1 | 59.5 | 47.6 | - | - | 635 | - | 62.5 | 76.5 | - |
| LLaVA-OV-7B [48] | 2304 | - | 7252 | 80.0 | 87.5 | 68.8 | 63.2 | 80.8 | 29.5 | - | 69.2 | 66.3 | - | 67.7 |
| IXC2-4KHD [24] | 2479 | - | 7920 | 81.0 | 90.0 | 68.6 | 57.8 | 80.2 | - | 675 | - | - | 77.2 | 42.8 |
| IXC-2.5-7B [112] | 2743 | - | 10000 | 82.2 | 90.9 | 70.0 | 59.6 | 82.2 | - | 690 | 45.6 | 67.8 | 78.2 | 32.3 |
| InternVL2-8B [87] | 2833 | - | 10496 | 83.3 | 91.6 | 74.8 | 58.3 | 81.7 | 32.5 | 794 | 65.8 | 64.4 | 77.4 | 58.1 |
| Qwen2-VL-7B [93] | 3584 | - | 16384 | 83.0 | 94.5 | 76.5 | 58.2 | - | - | 866 | 71.0 | 70.1 | 84.3 | 71.0 |
| 1512 | 33% | 1411 | 81.3 | 88.4 | 58.2 | 65.3 | 91.8 | 35.0 | 768 | 67.3 | 68.4 | 77.3 | 50.0 | |
| 1512 | 67% | 2626 | 84.2 | 91.9 | 65.3 | 66.0 | 91.8 | 35.1 | 776 | 67.5 | 68.6 | 78.0 | 53.2 | |
| \vilamodel-1.5K-8B | 1512 | 100% | 3841 | 84.3 | 92.0 | 67.4 | 64.6 | 92.6 | 35.0 | 782 | 68.1 | 68.9 | 78.4 | 59.7 |
| 3780 | 6% | 1476 | 82.2 | 87.1 | 57.9 | 63.9 | 90.8 | 34.6 | 753 | 68.2 | 66.5 | 72.2 | 62.9 | |
| 3780 | 12% | 2756 | 83.8 | 91.5 | 64.5 | 64.6 | 91.8 | 34.7 | 773 | 68.8 | 66.9 | 77.9 | 68.8 | |
| \vilamodel-4K-8B | 3780 | 18% | 4036 | 84.3 | 91.7 | 65.3 | 64.5 | 91.8 | 33.5 | 774 | 71.2 | 70.3 | 77.9 | 72.6 |
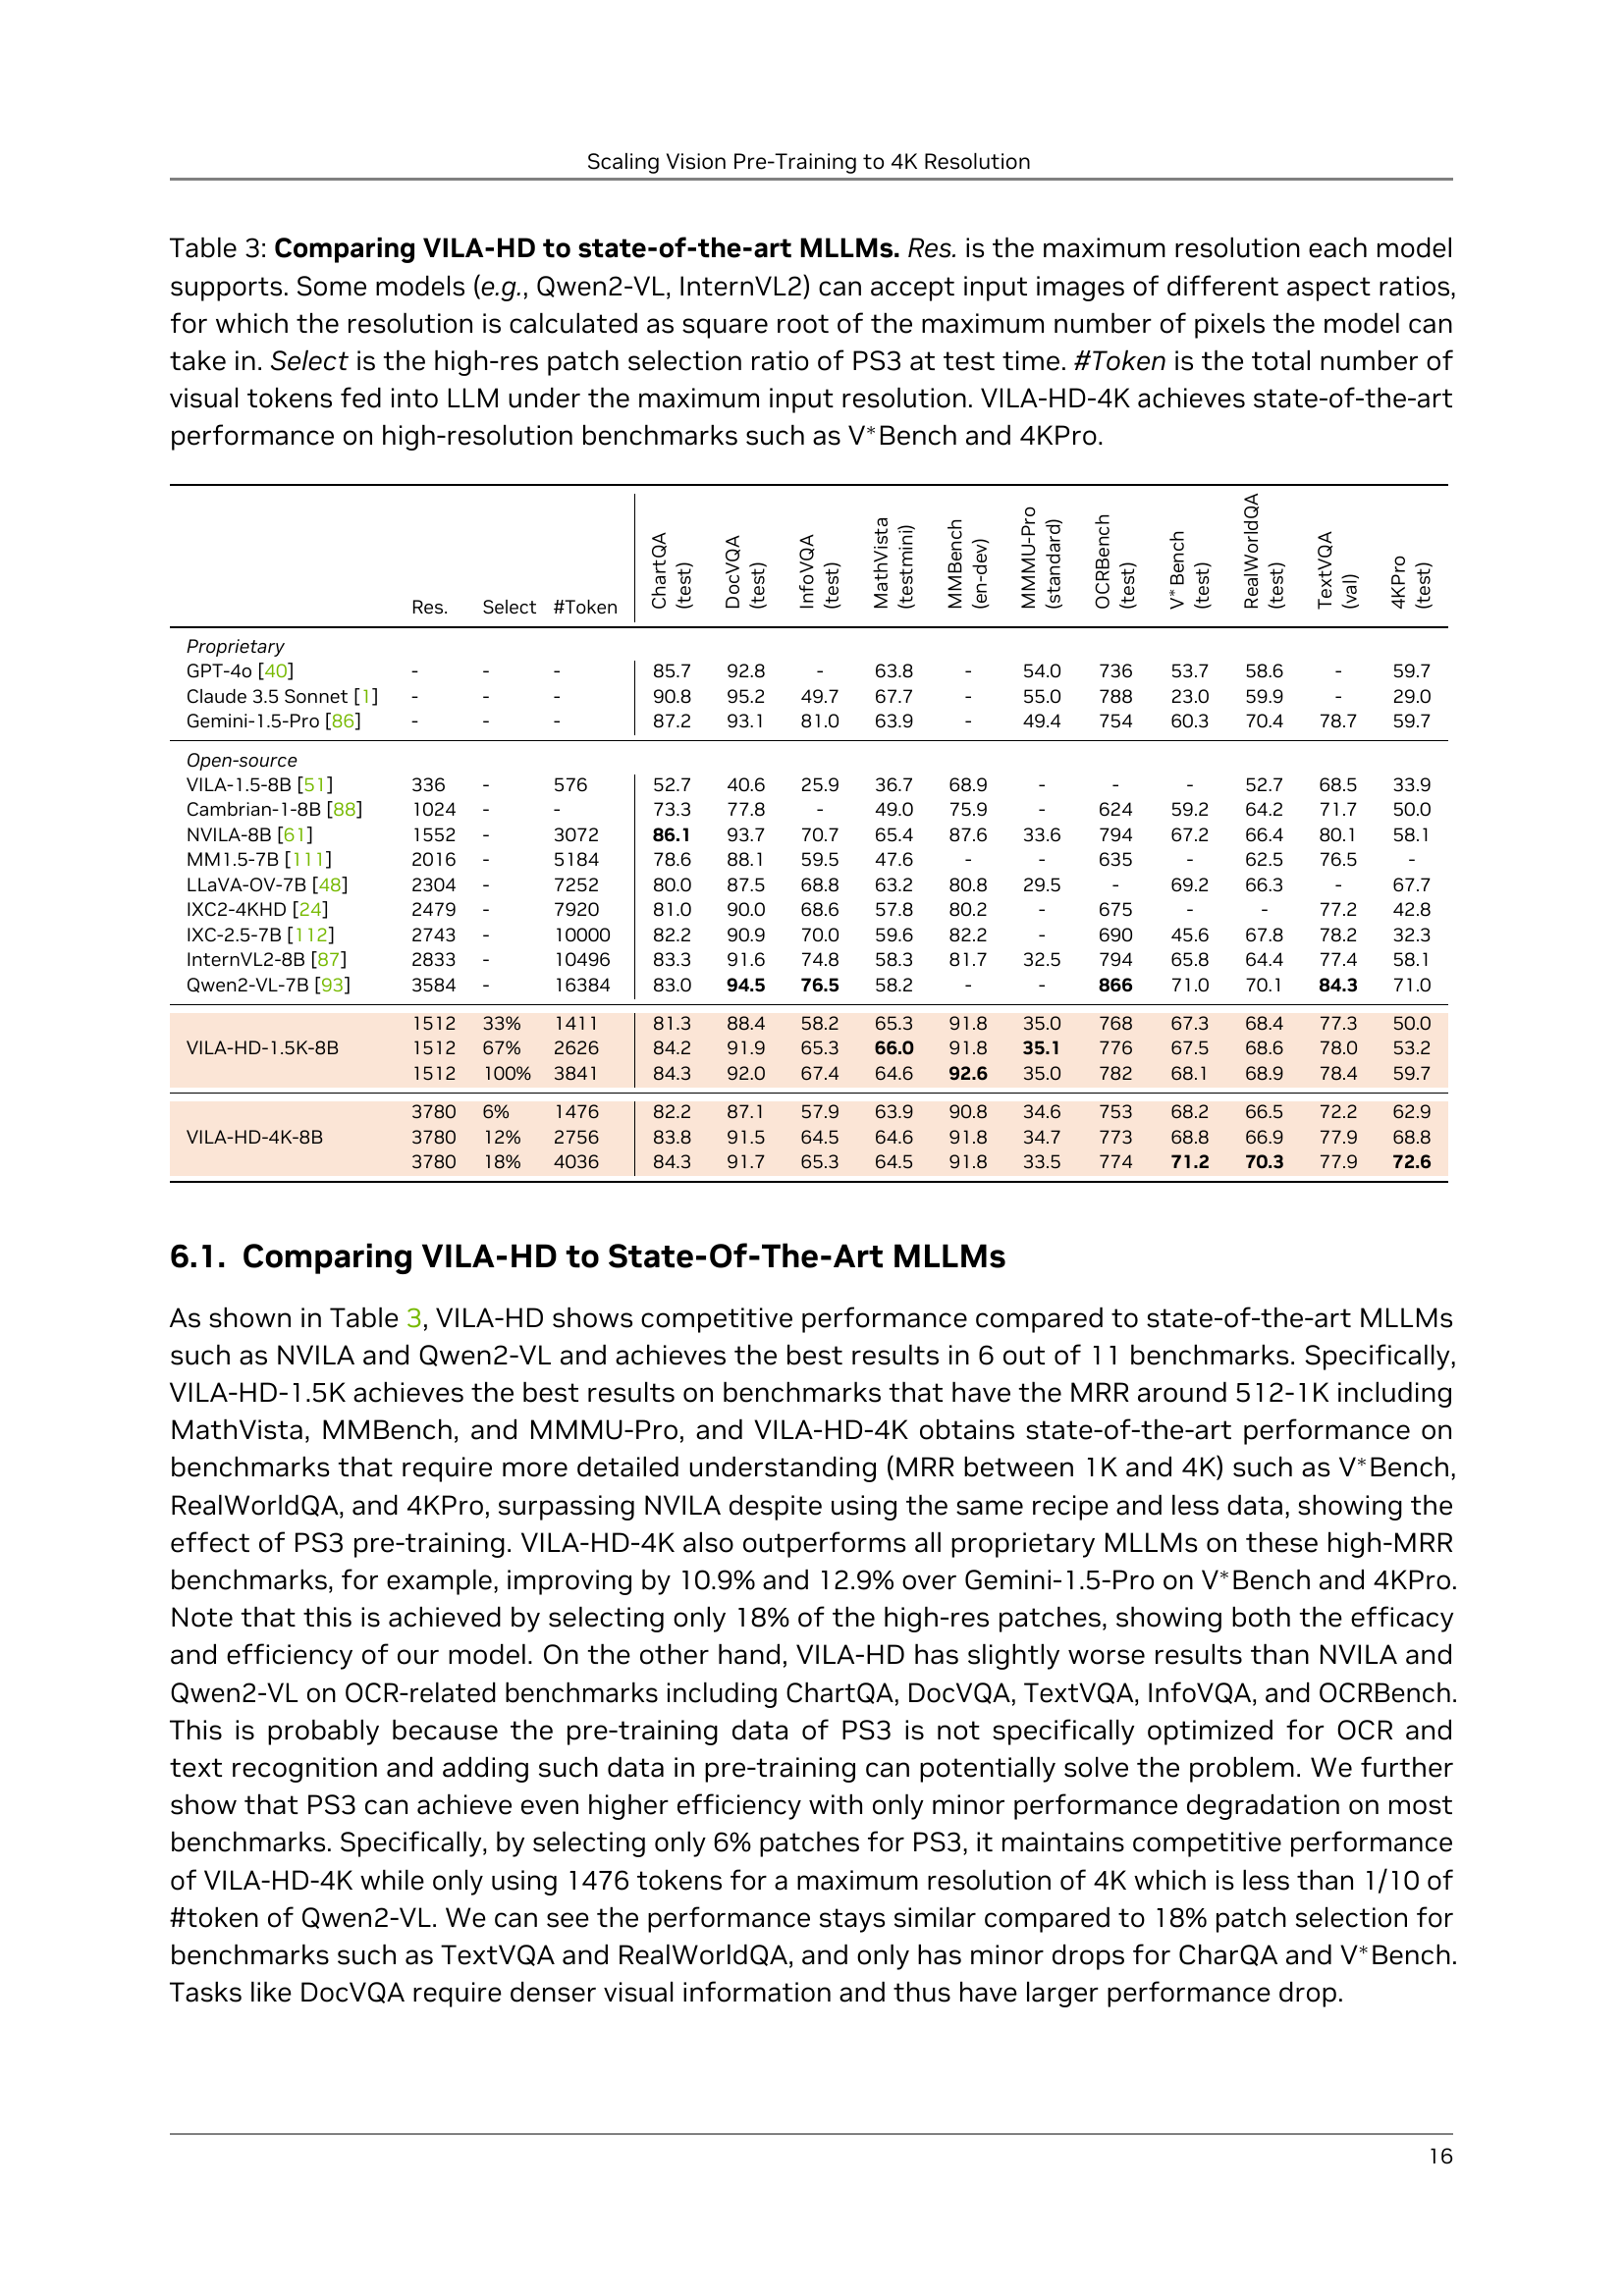
🔼 This table compares the performance of the VILA-HD model to other state-of-the-art Multimodal Large Language Models (MLLMs) on various benchmarks. It provides key details for each model, including its maximum supported image resolution (considering models that handle various aspect ratios), the percentage of high-resolution patches selected by the PS3 model at test time, the total number of visual tokens used, and finally, the performance of each model on several benchmarks. The table highlights that the VILA-HD-4K model achieves top performance on high-resolution benchmarks such as the V*Bench and 4KPro.
read the caption
Table 3: Comparing \vilamodelto state-of-the-art MLLMs. Res. is the maximum resolution each model supports. Some models (e.g., Qwen2-VL, InternVL2) can accept input images of different aspect ratios, for which the resolution is calculated as square root of the maximum number of pixels the model can take in. Select is the high-res patch selection ratio of \modelat test time. #Token is the total number of visual tokens fed into LLM under the maximum input resolution. \vilamodel-4K achieves state-of-the-art performance on high-resolution benchmarks such as V∗Bench and 4KPro.
| Method | Select (Test) | ViT Latency | LLM Latency | Text VQA | Chart QA | Doc VQA | Info VQA | OCR Bench | V∗ Bench | Real World | Avg |
| 1512 Resolution | |||||||||||
| Full | 100% | 0.286s | 0.375s | 78.6 | 84.1 | 92.2 | 68.1 | 787 | 67.9 | 69.8 | 77.1 |
| ToMe [7] | 50% | 0.286s | 0.260s | 74.1 | 70.2 | 59.7 | 47.3 | 622 | 66.8 | 67.2 | 63.9 |
| FastV [14] | 50% | 0.286s | 0.264s | 78.2 | 81.2 | 90.0 | 60.4 | 769 | 66.2 | 69.0 | 74.6 |
| VisionZip [106] | 50% | 0.286s | 0.260s | 75.2 | 77.2 | 79.8 | 55.7 | 722 | 64.0 | 67.1 | 70.2 |
| \model | 50% | 0.167s | 0.260s | 77.7 | 83.4 | 89.8 | 60.8 | 774 | 67.9 | 69.1 | 75.2 |
| ToMe [7] | 25% | 0.286s | 0.180s | 72.5 | 65.5 | 51.7 | 42.8 | 61.1 | 62.2 | 63.4 | 59.9 |
| FastV [14] | 25% | 0.286s | 0.185s | 76.1 | 66.3 | 78.1 | 49.5 | 651 | 64.6 | 65.2 | 66.6 |
| VisionZip [106] | 25% | 0.286s | 0.180s | 74.6 | 76.0 | 72.8 | 51.5 | 694 | 62.7 | 64.6 | 67.4 |
| \model | 25% | 0.096s | 0.180s | 76.8 | 80.4 | 84.4 | 54.6 | 738 | 65.7 | 67.8 | 71.9 |
| 3780 Resolution | |||||||||||
| Full | 100% | 1.812s | OOM | - | - | - | - | - | - | - | - |
| ToMe [7] | 20% | 1.812s | OOM | - | - | - | - | - | - | - | - |
| FastV [14] | 20% | 1.812s | OOM | - | - | - | - | - | - | - | - |
| VisionZip [106] | 20% | 1.812s | OOM | - | - | - | - | - | - | - | - |
| \model | 20% | 0.417s | 0.383s | 77.8 | 83.9 | 91.6 | 65.0 | 773 | 72.8 | 70.1 | 76.9 |
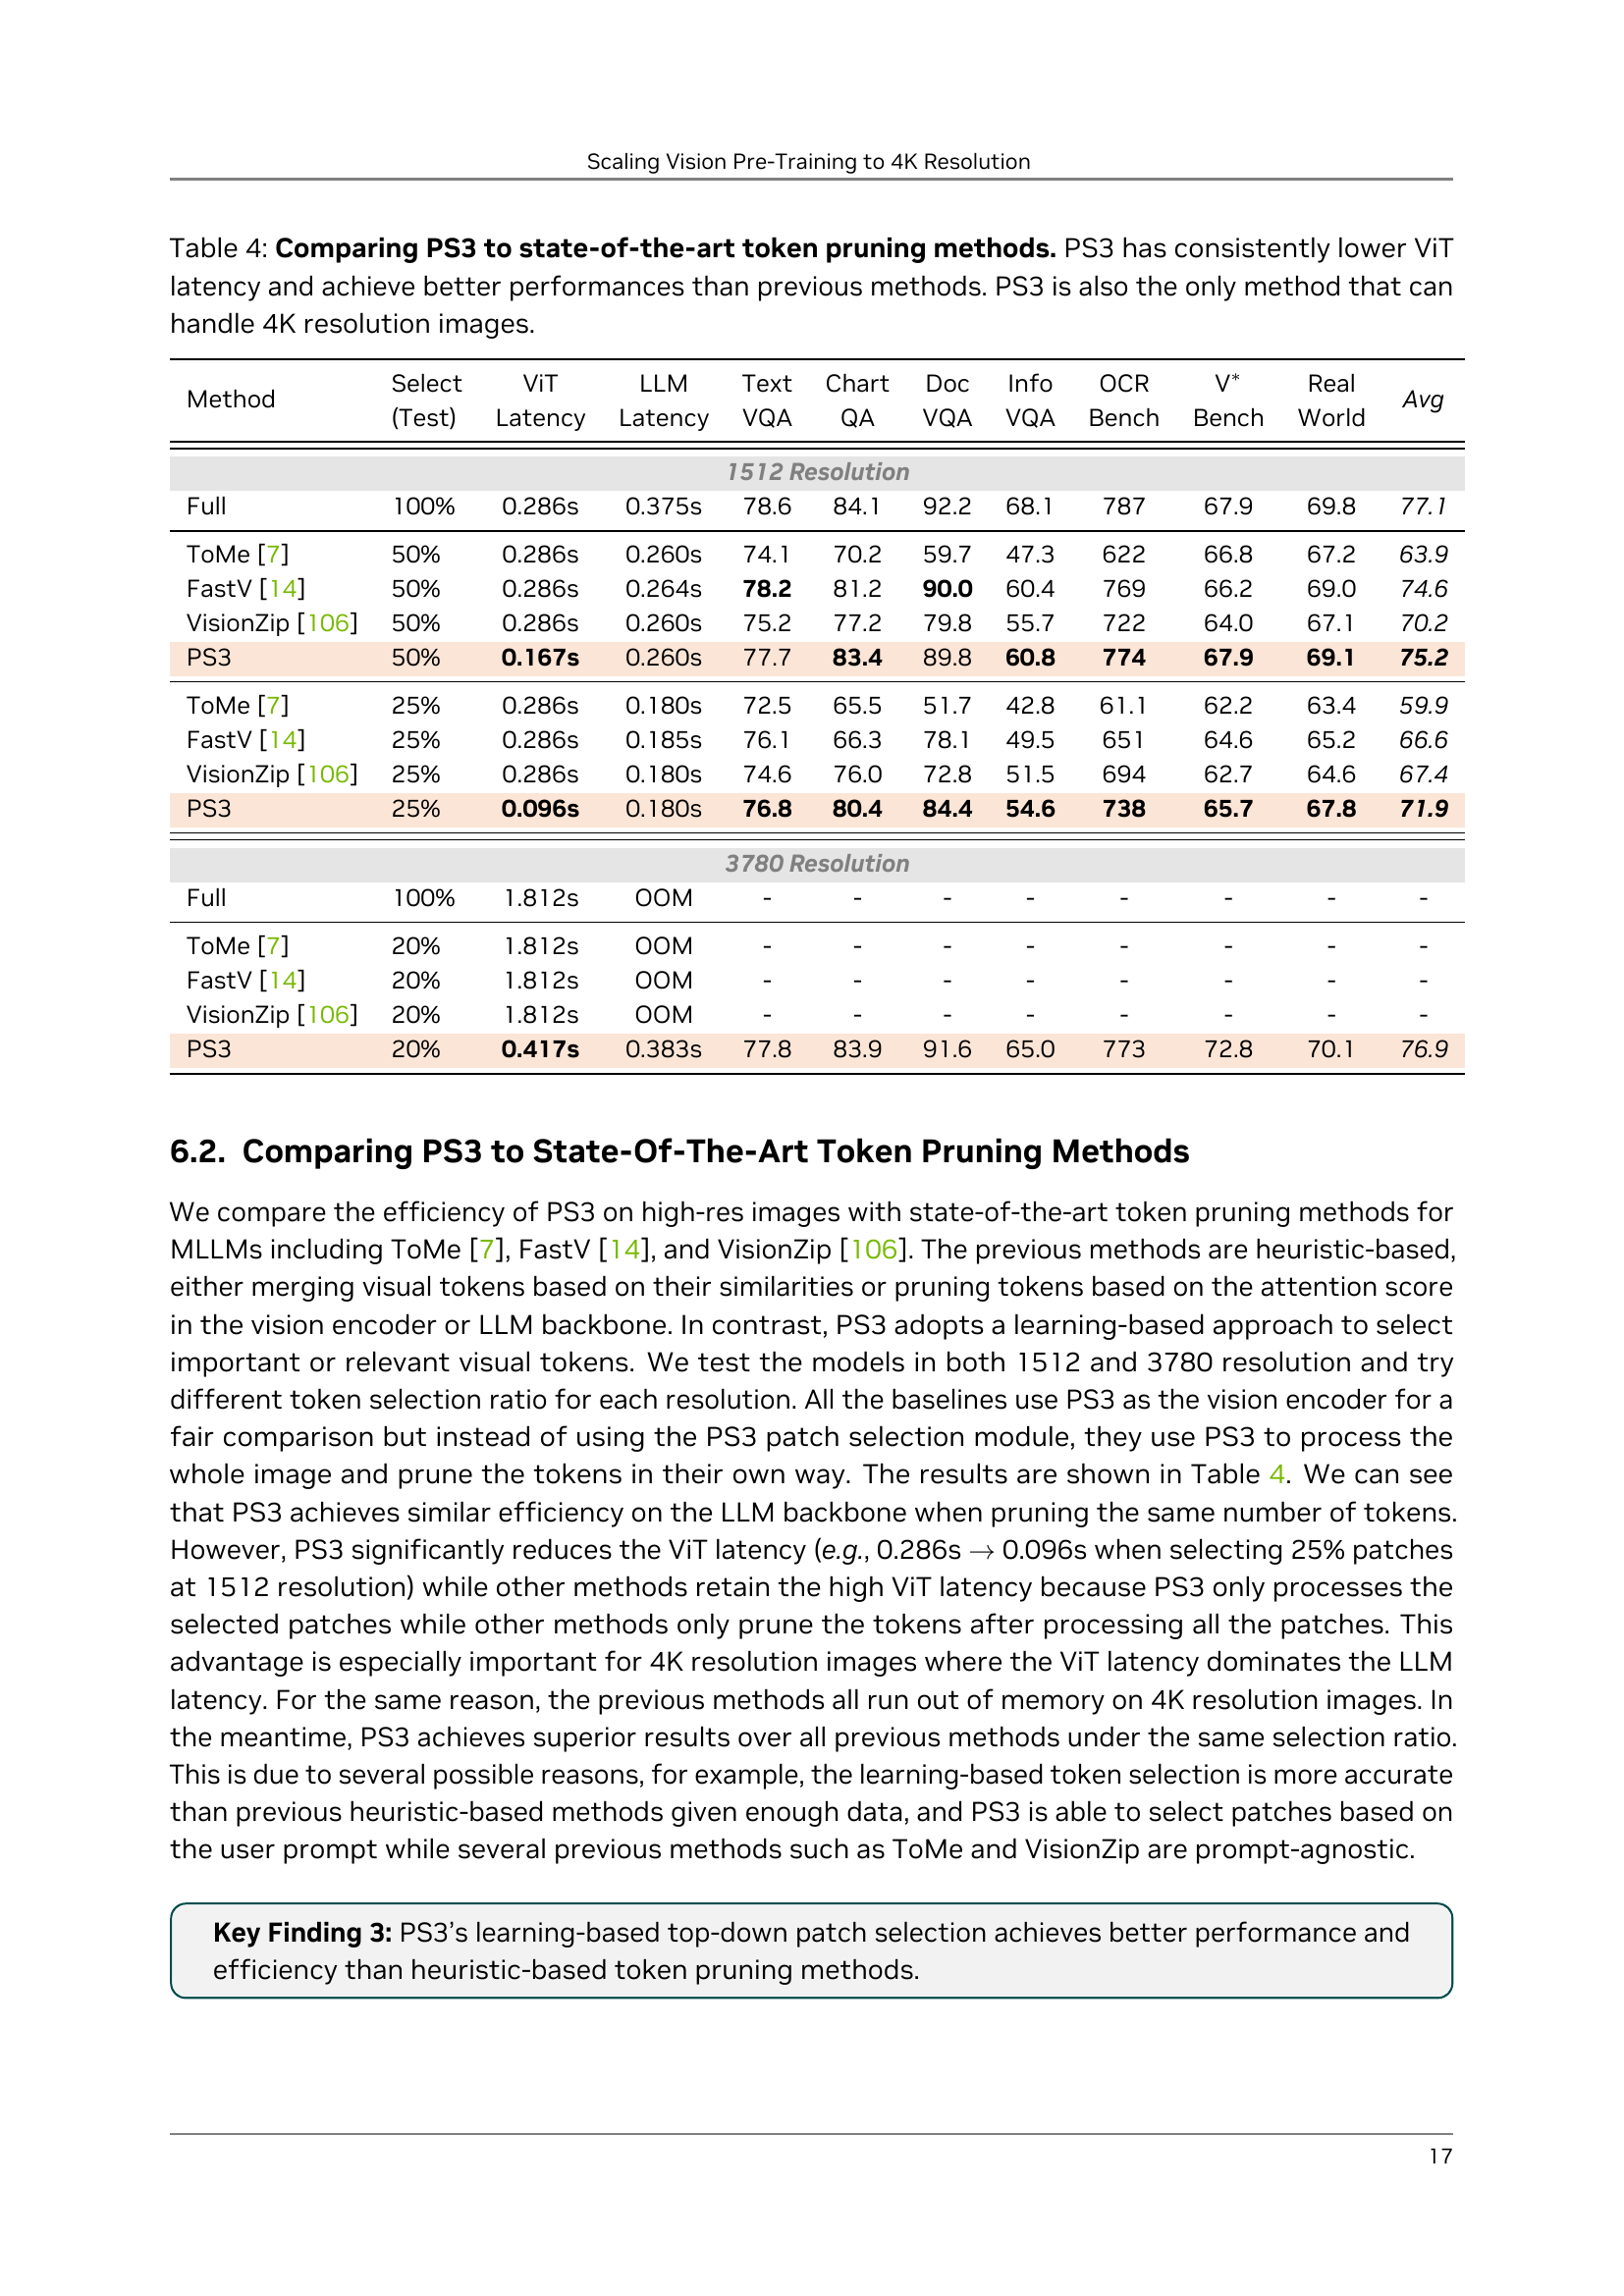
🔼 Table 4 presents a comparison of the proposed PS3 model against existing state-of-the-art token pruning methods for Multimodal Large Language Models (MLLMs). The comparison focuses on two key aspects: the latency of the Vision Transformer (ViT) component and the overall performance of the MLLM on several benchmark datasets. A notable advantage of PS3 is its significantly lower ViT latency compared to the other methods. Furthermore, PS3 uniquely supports processing images with 4K resolution, a capability not shared by any of the other models.
read the caption
Table 4: Comparing \modelto state-of-the-art token pruning methods. \modelhas consistently lower ViT latency and achieve better performances than previous methods. \modelis also the only method that can handle 4K resolution images.
| Vision Encoder | #Param of ViT | Max Res. | Max #Tok | Text VQA | Chart QA | Doc VQA | Info VQA | OCR Bench | V∗ Bench | Real World | Avg |
| SigLIP-SO400M [110] | 400M | 378 | 196 | 62.3 | 56.6 | 51.9 | 30.7 | 387 | 51.8 | 57.1 | 49.9 |
| + AnyRes [54] | 400M | 1512 | 3332 | 67.4 | 58.4 | 67.9 | 34.1 | 468 | 60.2 | 59.0 | 56.3 |
| + \stwo [79] | 400M | 1512 | 2916 | 66.1 | 71.0 | 78.3 | 41.1 | 526 | 55.2 | 61.0 | 60.8 |
| \model-SigLIP-SO400M | 400M | 1512 | 3841 | 69.3 | 71.1 | 79.4 | 41.3 | 534 | 64.0 | 63.8 | 63.2 |
| C-RADIO-v2-L [75] | 320M | 384 | 144 | 65.0 | 58.8 | 53.1 | 30.9 | 405 | 51.5 | 57.5 | 51.0 |
| + AnyRes [54] | 320M | 1536 | 2448 | 68.1 | 62.8 | 70.0 | 35.8 | 497 | 65.9 | 62.8 | 59.3 |
| + \stwo [79] | 320M | 1536 | 2304 | 68.1 | 72.3 | 82.5 | 40.4 | 542 | 59.7 | 62.1 | 62.8 |
| \model-C-RADIO-v2-L | 320M | 1536 | 3024 | 68.4 | 72.6 | 83.2 | 43.4 | 569 | 68.2 | 61.5 | 64.9 |
🔼 This table demonstrates the generalizability of the PS3 pre-training method by showing its performance when applied to various state-of-the-art vision encoders. It compares the results of using PS3 pre-training with the baseline performance of these encoders (without PS3) as well as two other high-resolution scaling approaches (AnyRes and S2). The table highlights key metrics such as the number of parameters in the ViT backbone (#Param), the maximum resolution processed by each model in the multi-modal large language model (MLLM) (Max Res.), the maximum number of vision tokens used in the MLLM (Max #Tok), and the average accuracy across various benchmark datasets. All model configurations using PS3 in this table are set to use all of the available high-resolution patches.
read the caption
Table 5: Generalizability of \modelpre-training to state-of-the-art vision encoders. #Param of ViT is the number of parameters of the ViT backbone. Max Res. is the maximum resolution each model processes in MLLM. Max #Tok is the maximum number of vision tokens in MLLM. All the \modelmodels select all the high-res patches.
| Training and Model Design Choices | |
| Pre-training algorithm designs (Section 2.3) | |
| - using ground truth selection score | +5.1 |
| - pooling only tokens in ground-truth boxes | +3.7 |
| - mixing global and local contrast | +1.0 |
| - w/o intra-image contrast | +5.3 |
| \modelmodel designs (Section 2.2) | |
| - multi-scale feature extraction | +1.0 |
| - scale-aware pos. emb. | +0.8 |
| - low-res KV cache | +8.8 |
| MLLM model design (Section 3.1) | |
| - additional vision pos. emb. | +0.8 |
🔼 This table presents an ablation study evaluating the impact of high-resolution, self-supervised fine-tuning (SFT) data on the performance of multi-modal large language models (MLLMs). The study specifically investigates the effect of adding high-resolution data on the MLLMs’ ability to perceive and understand high-resolution visual details, particularly in natural images. By comparing MLLMs trained with and without this supplemental high-resolution data, the table quantifies the performance improvements across various benchmark tasks. It shows that incorporating high-resolution SFT data leads to improved performance across many evaluation metrics, most notably in scenarios involving natural images where high-resolution detail is crucial.
read the caption
Table 8: Ablation of MLLM SFT data for high-resolution feature alignment. The high-resolution SFT data (HR Data) generally improves high-resolution perception, especially on natural images.
| Patch Selection | Select (Train) | Select (Test) | Recall (Test) | Avg. Acc. |
| Random | 44% | 44% | 43.7% | 52.3 |
| Bottom-up | 44% | 44% | 87.4% | 59.7 (+7.4) |
| Top-down | 44% | 44% | 91.2% | 61.0 (+8.7) |
| Random | 44% | 100% | 100% | 56.5 |
| Bottom-up | 44% | 100% | 100% | 61.1 (+4.6) |
| Top-down | 44% | 100% | 100% | 61.9 (+5.4) |
| Top-down | 100% | 100% | 100% | 63.2 |
🔼 Table 9 provides a detailed breakdown of the data used for pre-training the PS3 model. It shows the sources of the 75 million high-resolution images (1K to 4K resolution) used, along with the number of images and bounding boxes from each source. Furthermore, it indicates the total number of bounding boxes (282 million) and detailed captions associated with salient local regions within those images. This table is crucial in understanding the scale and composition of the training data used for the high-resolution vision pre-training.
read the caption
Table 9: Data sources and statistics. We collect in total 75M images with 1K - 4K resolution and 282M pairs of bounding boxes and detailed captions about salient local regions in the images.
| Vision Encoder | Max Res. | HR Data | Text VQA | Chart QA | Doc VQA | Info VQA | OCR Bench | V∗ Bench | Real World | Avg |
| \model | 1512 | ✗ | 68.8 | 71.2 | 79.6 | 39.6 | 535 | 60.9 | 62.9 | 62.4 |
| \model | 1512 | ✓ | 69.3 | 71.1 | 79.4 | 41.3 | 534 | 64.0 | 63.8 | 63.2 |
| (+0.5) | (-0.1) | (-0.2) | (+1.7) | (-0.1) | (+3.1) | (+0.9) | (+0.8) |
🔼 This table lists the hyperparameters used in the EfficientViT-SAM model for generating segmentation masks during the PS3 pre-training data curation. These parameters control aspects of the mask generation process, such as the number of points sampled per side and batch, the number of layers in the cropping process, the downscaling factor for points, and the thresholds for prediction IOU and stability scores. These settings influence the density and detail of the generated masks, ultimately impacting the quality and effectiveness of the PS3 pre-training data.
read the caption
Table 10: Arguments for EfficientViT-SAM mask generation.
| Data Source | 1K - 2K Res. | 2K - 4K Res. | ||||
| #Img | #Box | Avg. Box size | #Img | #Box | Avg. Box size | |
| Natural images | ||||||
| DataComp [31] | 18M | 54M | 424438 | 9M | 36M | 562578 |
| SA-1B [46] | - | - | - | 11M | 44M | 302312 |
| Documents | ||||||
| IDL [6] | 12M | 48M | 28286 | 7M | 28M | 30330 |
| PDFA [67] | 12M | 48M | 80461 | 6M | 24M | 84569 |
| Agg. | 42M | 150M | - | 33M | 132M | - |
🔼 This table lists the hyperparameters used during the pre-training phase of the PS3 model. It details the values set for various parameters influencing the training process, such as the number of epochs, batch size, learning rate, and optimization settings.
read the caption
Table 11: Hyperparameters of \modelpre-training.
| Argument | Value |
| points_per_side | 24 |
| points_per_batch | 128 |
| crop_n_layers | 1 |
| crop_n_points_downscale_factor | 1 |
| pred_iou_thresh | 0.6 |
| stability_score_thresh | 0.85 |
| min_mask_region_area | 0 |
🔼 This table presents a comprehensive analysis of PS3’s scaling properties when evaluated on the 4KPro benchmark. It details the performance of VILA-HD (a multi-modal large language model using PS3 as its vision encoder) across various resolutions (756, 1512, and 3780 pixels) and with different numbers of high-resolution (HR) tokens used. The results showcase how performance changes when scaling the resolution while maintaining a constant cost, modifying the number of patches at a fixed resolution, or adjusting the number of patches during testing. This table provides key insights into the efficiency and effectiveness of PS3 in handling high-resolution images.
read the caption
Table 12: Full results of scaling properties of PS3 on 4KPro.
Full paper#