TL;DR#
LLMs show promise in aiding scientific research, but their ability to discover high-quality research hypotheses remains unexamined. To address this, the paper introduces a benchmark for evaluating LLMs, which covers inspiration retrieval, hypothesis composition, and hypothesis ranking. Critical components are extracted from scientific papers across 12 disciplines using an automated framework. The benchmark helps understand how LLMs perform in scientific discovery sub-tasks.
The paper develops ResearchBench, which collects papers from 12 disciplines and develops an LLM-based framework to extract research questions, background surveys, inspirations, and hypotheses from scientific papers. It finds that current LLMs perform well in retrieving inspirations across disciplines. The paper highlights LLMs’ potential as research hypothesis mines, capable of generating novel scientific insights with minimal human involvement.
Key Takeaways#
Why does it matter?#
This paper is vital for researchers as it introduces the ResearchBench benchmark to assess LLMs’ scientific discovery potential. By decomposing the discovery process and evaluating LLMs, it offers insights into how to improve these models for research, especially in out-of-distribution inspiration retrieval. It enables researchers to better leverage LLMs for automated scientific exploration and future research.
Visual Insights#
| Discipline | Cell | Chem | ETS | MS | Phys | EGS | EVS | BL | BS | Law | Math | AT | Overall |
|---|---|---|---|---|---|---|---|---|---|---|---|---|---|
| Paper Number | 152 | 113 | 114 | 116 | 132 | 117 | 116 | 115 | 115 | 97 | 113 | 86 | 1386 |
🔼 Table 1 presents the distribution of scientific papers across twelve different disciplines used in the ResearchBench benchmark. The disciplines included are Chemistry (Chem), Earth Science (ETS), Material Science (MS), Physics (Phys), Energy Science (EGS), Environmental Science (EVS), Biology (BL), Business (BS), Law (Law), Mathematics (Math), and Astronomy (AT). The table shows the number of papers sampled from each discipline, totaling 1386 papers overall. This distribution is crucial for ensuring the benchmark’s diversity and representativeness across scientific fields.
read the caption
Table 1: Disciplines and paper number distribution. Chem=Chemistry, ETS=Earth Science, MS=Material Science, Phys=Physics, EGS=Energy Science, EVS=Environmental Science, BL=Biology, BS=Business, AT=Astronomy.
In-depth insights#
LLMs as Hypothesis Mines#
LLMs as Hypothesis Mines explores the potential of large language models to accelerate scientific discovery. The core idea is that LLMs can be used to generate novel research hypotheses by uncovering hidden connections between existing knowledge. This involves a three-step process: (1) retrieving relevant inspirations from a vast corpus of scientific literature, (2) composing these inspirations with existing research background information, and (3) ranking the generated hypotheses to identify the most promising candidates. The authors find that LLMs are surprisingly effective at the inspiration retrieval step, suggesting that they can capture unknown associations between different areas of knowledge. This supports the idea that LLMs can act as ‘hypothesis mines,’ capable of generating innovative hypotheses at scale. However, the hypothesis composition and ranking steps are more challenging, indicating that further research is needed to improve the LLMs’ ability to synthesize and evaluate the generated hypotheses. This is a promising approach for automated scientific exploration by identifying those LLMs capable of generating new research insights with minimal human intervention. Stronger LLMs represent richer mines, and compute corresponds to miners.
Inspiration Bottleneck#
The bottleneck towards automated discovery, as discussed, highlights the inspiration retrieval sub-task as particularly challenging. While model performance improves with smaller models (8B parameters), it plateaus quickly, suggesting diminishing returns with scale and pre-training enhancements. This is attributed to the task’s reliance on deep domain understanding, acquired during pre-training through ingesting numerous papers. Success is less about reasoning (refined post-training) and more about intuition developed during pre-training. Addressing this bottleneck requires understanding how LLMs retrieve inspirations, potentially paving the way for advancements in fully automated scientific discovery. Future investigation should focus on improving knowledge association.
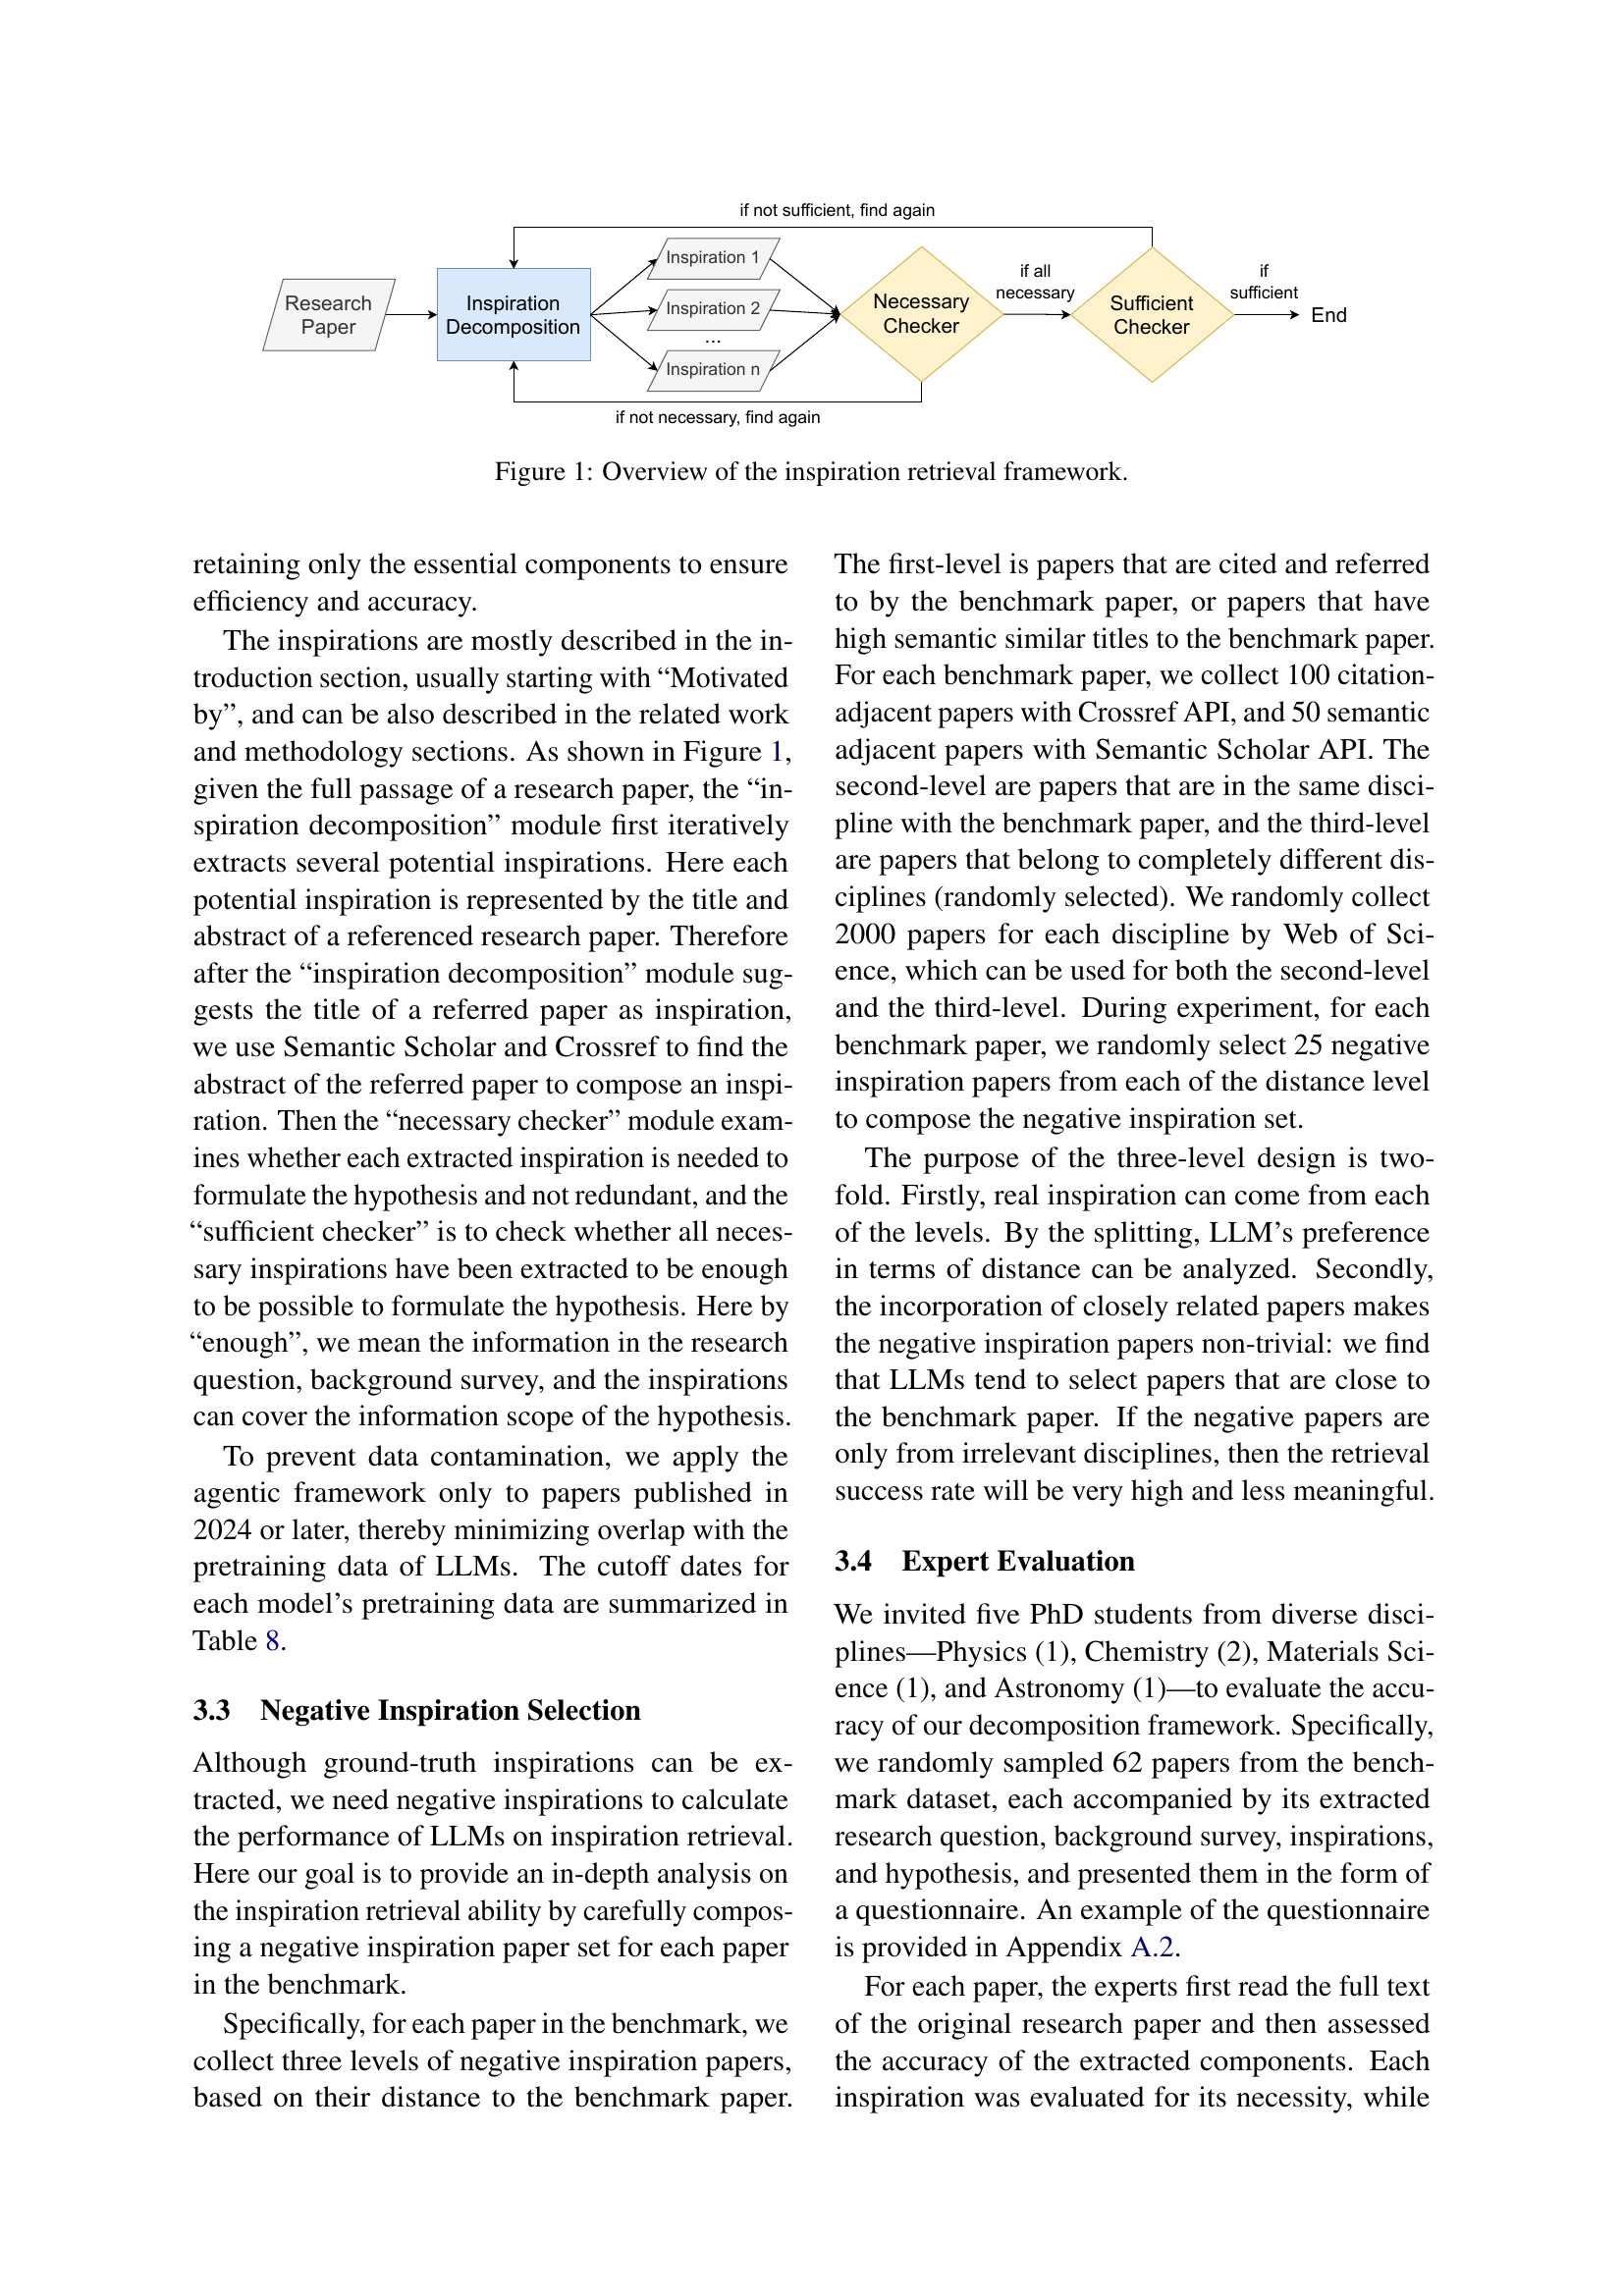
Agentic Framework#
The ‘Agentic Framework’ is pivotal for automating scientific discovery tasks. Its design likely involves leveraging LLMs to autonomously extract key components from research papers, such as research questions, background surveys, inspirations, and hypotheses. The framework’s effectiveness hinges on the LLM’s ability to accurately parse and understand scientific text, identifying the underlying structure and relationships between different elements. A significant challenge lies in the ‘Inspiration Extraction’. To mitigate data contamination, the framework focuses on papers published in 2024, which minimizes overlap with LLM pretraining data. The agentic approach ensures scalability and reduces human intervention, allowing for continuous learning and adaptation as new research emerges. This design facilitates the creation of benchmarks and datasets, driving further innovation in automated scientific research.
OOD Inspiration Retrieval#
The paper addresses the task of Out-of-Distribution (OOD) inspiration retrieval within scientific discovery, a challenging task. The goal is to identify relevant but non-obvious knowledge pieces that can spark new hypotheses. This contrasts with typical information retrieval, where relevance is often based on semantic similarity. The finding that LLMs can perform well in this OOD setting is significant. It indicates that LLMs possess a capability to connect seemingly unrelated concepts, potentially due to knowledge associations learned during pre-training. However, the paper notes that this is challenging, as performance plateaus despite scaling model size and pre-training, which suggests it may require deeper domain understanding.
Benchmark: Sci Discovery#
ResearchBench presents a novel benchmark for evaluating Large Language Models (LLMs) in scientific discovery. It addresses a critical gap by focusing on how well LLMs can perform the sub-tasks inherent in discovering high-quality research hypotheses. This benchmark includes tasks like inspiration retrieval, hypothesis composition, and hypothesis ranking, offering a more granular evaluation than general-purpose benchmarks. The approach involves extracting critical components from scientific papers, allowing for automated assessment and reducing data contamination by focusing on recently published research. ResearchBench promises to advance the development and evaluation of LLMs tailored for scientific research, facilitating automated scientific discovery.
More visual insights#
More on tables
| Model | Cell | Chem | ETS | MS | Phys | EGS | EVS | BL | BS | Law | Math | A | Overall |
|---|---|---|---|---|---|---|---|---|---|---|---|---|---|
| Llama-3.2-1B | 34.65 | 34.80 | 32.57 | 30.26 | 30.25 | 34.75 | 35.43 | 33.21 | 41.09 | 29.74 | 36.22 | 30.10 | 33.68 |
| Llama-3.1-8B | 74.08 | 78.00 | 79.69 | 74.54 | 76.75 | 84.56 | 75.20 | 75.81 | 80.00 | 65.95 | 75.59 | 68.37 | 75.92 |
| Qwen Turbo | 74.37 | 77.20 | 80.08 | 72.69 | 75.80 | 88.03 | 78.35 | 74.01 | 82.18 | 67.24 | 74.80 | 66.84 | 76.17 |
| GPT-4o Mini | 76.06 | 83.20 | 82.76 | 77.49 | 81.53 | 89.96 | 79.92 | 70.76 | 84.00 | 70.69 | 74.80 | 71.94 | 78.74 |
| Gemini 2.0 FT | 74.65 | 79.60 | 80.84 | 73.43 | 78.34 | 90.35 | 76.77 | 75.09 | 85.09 | 80.17 | 76.38 | 77.55 | 78.89 |
| Gemini 2.0 Flash | 75.77 | 76.40 | 85.82 | 75.28 | 79.94 | 91.89 | 75.98 | 75.09 | 86.91 | 78.02 | 76.77 | 71.94 | 79.24 |
| Qwen Plus | 79.15 | 82.00 | 82.76 | 75.28 | 80.57 | 91.12 | 81.10 | 76.53 | 84.73 | 75.00 | 79.53 | 73.98 | 80.27 |
| DeepSeek-V3 | 80.00 | 83.60 | 85.44 | 76.01 | 79.94 | 91.51 | 79.53 | 76.90 | 86.91 | 75.86 | 77.56 | 73.98 | 80.74 |
| Claude 3.5 Haiku | 80.56 | 85.20 | 85.06 | 77.86 | 79.94 | 90.35 | 83.07 | 75.81 | 87.27 | 70.69 | 77.56 | 75.51 | 80.89 |
| Llama-3.1-70B | 78.31 | 84.00 | 84.67 | 80.07 | 80.25 | 89.58 | 81.10 | 79.42 | 86.91 | 75.43 | 77.95 | 75.51 | 81.18 |
| Claude 3.5 Sonnet | 78.31 | 78.40 | 85.06 | 76.75 | 81.53 | 91.51 | 85.04 | 77.62 | 88.00 | 77.59 | 79.53 | 77.55 | 81.43 |
| GPT-4o | 80.00 | 87.20 | 89.27 | 80.81 | 84.39 | 93.05 | 81.89 | 77.98 | 87.64 | 79.74 | 83.07 | 75.00 | 83.43 |
🔼 This table presents the accuracy of various Large Language Models (LLMs) in retrieving ground truth inspirations. The experiment was conducted by providing the LLMs with a research question and a set of 75 candidate inspirations (including ground truth and negative examples), and only allowing the LLMs to select the top 20% (15 candidates). The accuracy is calculated as the percentage of times the ground truth inspirations were successfully retrieved among the selected 15 candidates. The results are broken down by LLM and by scientific discipline (Cell, Chem, etc.), providing a comprehensive evaluation across various models and disciplines.
read the caption
(a) The accuracy (%) of LLMs in retrieving the groundtruth inspiration while only 20% of inspiration candidates are selected.
| Model | Cell | Chem | ETS | MS | Phys | EGS | EVS | BL | BS | Law | Math | A | Overall |
|---|---|---|---|---|---|---|---|---|---|---|---|---|---|
| Llama-3.2-1B | 10.70 | 11.60 | 12.26 | 9.59 | 11.15 | 8.49 | 14.57 | 13.00 | 17.09 | 12.50 | 11.42 | 10.71 | 11.91 |
| Llama-3.1-8B | 32.39 | 38.00 | 40.61 | 31.37 | 32.80 | 59.85 | 36.61 | 28.52 | 55.64 | 28.88 | 36.22 | 34.69 | 37.87 |
| Gemini 2.0 FT | 31.27 | 41.20 | 40.61 | 30.63 | 32.48 | 71.04 | 39.37 | 33.57 | 59.64 | 37.07 | 34.65 | 33.16 | 40.18 |
| GPT-4o Mini | 30.42 | 43.60 | 41.00 | 34.69 | 33.44 | 66.80 | 40.16 | 28.88 | 64.73 | 32.76 | 37.80 | 35.71 | 40.59 |
| Qwen Turbo | 35.49 | 42.40 | 42.15 | 33.95 | 35.03 | 66.80 | 43.31 | 33.21 | 61.45 | 29.74 | 36.61 | 34.69 | 41.21 |
| Gemini 2.0 Flash | 31.55 | 38.80 | 44.06 | 34.32 | 34.39 | 74.52 | 37.40 | 32.49 | 64.00 | 37.50 | 37.80 | 32.65 | 41.46 |
| Claude 3.5 Sonnet | 36.34 | 41.20 | 42.91 | 30.63 | 36.31 | 67.57 | 40.55 | 34.30 | 63.64 | 34.91 | 37.40 | 33.67 | 41.62 |
| Qwen Plus | 36.06 | 47.20 | 45.21 | 33.58 | 34.39 | 72.97 | 43.31 | 35.38 | 64.36 | 34.91 | 39.37 | 36.22 | 43.43 |
| Claude 3.5 Haiku | 41.13 | 48.40 | 45.98 | 34.69 | 33.44 | 69.88 | 44.09 | 34.30 | 64.00 | 37.93 | 38.19 | 41.33 | 44.28 |
| DeepSeek-V3 | 38.87 | 46.00 | 44.06 | 36.90 | 36.62 | 75.29 | 41.73 | 40.07 | 65.45 | 36.64 | 38.58 | 37.76 | 44.78 |
| Llama-3.1-70B | 41.41 | 44.00 | 47.51 | 36.90 | 34.39 | 70.66 | 45.28 | 37.18 | 65.45 | 39.22 | 38.19 | 39.29 | 44.87 |
| GPT-4o | 39.44 | 46.40 | 47.13 | 38.38 | 35.35 | 75.29 | 44.88 | 38.63 | 65.82 | 39.22 | 40.16 | 38.78 | 45.65 |
🔼 This table presents the accuracy of various Large Language Models (LLMs) in retrieving ground truth inspirations. Only the top 4% of inspiration candidates are considered for each LLM. The accuracy is calculated across 12 scientific disciplines (Cell, Chem, ETS, MS, Phys, EGS, EVS, BL, BS, Law, Math, AT) and presented as a percentage for each LLM and discipline. The overall average accuracy across all disciplines is also provided.
read the caption
(b) The accuracy (%) of LLMs in retrieving the groundtruth inspiration while only 4% of inspiration candidates are selected.
| Model | Distance Level 1 | Distance Level 2 | Distance Level 3 | |||
|---|---|---|---|---|---|---|
| (top 20%) | (top 4%) | (top 20%) | (top 4%) | (top 20%) | (top 4%) | |
| Llama-3.2-1B | 23.57% | 6.33% | 15.52% | 2.93% | 14.46% | 2.85% |
| Qwen Turbo | 52.72% | 12.05% | 9.45% | 1.11% | 4.46% | 0.34% |
| Claude 3.5 Sonnet | 53.96% | 10.15% | 10.16% | 0.70% | 2.40% | 0.13% |
| Llama-3.1-8B | 53.69% | 11.17% | 10.65% | 0.77% | 2.94% | 0.14% |
| Gemini 2.0 Flash Thinking | 54.49% | 10.59% | 10.34% | 0.58% | 2.24% | 0.11% |
| GPT-4o | 54.90% | 10.02% | 9.84% | 0.47% | 2.09% | 0.09% |
| Llama-3.1-70B | 55.32% | 10.04% | 9.82% | 0.55% | 2.16% | 0.09% |
| DeepSeek-V3 | 55.74% | 10.22% | 9.80% | 0.43% | 1.79% | 0.07% |
| GPT-4o Mini | 55.90% | 10.67% | 9.54% | 0.47% | 2.12% | 0.09% |
| Claude 3.5 Haiku | 55.70% | 10.19% | 9.51% | 0.49% | 2.00% | 0.07% |
| Gemini 2.0 Flash | 55.91% | 10.63% | 9.63% | 0.42% | 2.03% | 0.09% |
| Qwen Plus | 56.11% | 10.57% | 9.52% | 0.50% | 2.16% | 0.16% |
🔼 This table presents the performance of various Large Language Models (LLMs) on an information retrieval task focused on scientific hypothesis generation. The accuracy of each LLM is evaluated across twelve scientific disciplines (Chemistry, Earth Science, Materials Science, Physics, Energy Science, Environmental Science, Biology, Business, Law, Mathematics, and Astronomy), showing the percentage of ground truth inspirations correctly retrieved. Two scenarios are shown: one where only the top 20% of inspiration candidates are considered, and another where only the top 4% are considered. The table helps to assess the relative strengths and weaknesses of different LLMs in this specific task, and how performance varies across disciplines.
read the caption
Table 2: Performance of LLMs in hypothesis retrieve task. Gemini 2.0 FT=Gemini 2.0 Flash Thinking; Chem=Chemistry, ETS=Earth Science, MS=Material Science, Phys=Physics, EGS=Energy Science, EVS=Environmental Science, BL=Biology, BS=Business, A=Astronomy.
| Model | Cell | Chem | ETS | MS | Phys | EGS | EVS | BL | BS | Law | Math | A | Overall |
|---|---|---|---|---|---|---|---|---|---|---|---|---|---|
| Claude 3.5 Haiku | 40.42 | 40.87 | 38.71 | 46.75 | 45.00 | 45.34 | 48.00 | 46.15 | 35.14 | 37.85 | 43.59 | 34.29 | 42.56 |
| Llama-3.1-8B | 44.58 | 47.83 | 42.78 | 46.04 | 45.05 | 44.30 | 46.47 | 47.37 | 44.21 | 47.58 | 48.21 | 45.14 | 45.68 |
| Gemini 2.0 FT | 45.67 | 39.79 | 48.48 | 47.22 | 48.77 | 49.24 | 48.57 | 48.02 | 41.47 | 47.03 | 42.81 | 40.00 | 46.30 |
| Gemini 2.0 Flash | 46.25 | 45.63 | 48.64 | 51.63 | 47.97 | 51.47 | 49.41 | 48.77 | 47.03 | 55.91 | 56.24 | 49.71 | 50.15 |
| Llama-3.1-70B | 46.67 | 49.86 | 50.83 | 51.53 | 50.60 | 50.61 | 52.10 | 54.36 | 49.47 | 53.94 | 51.11 | 49.14 | 50.92 |
| GPT-4o Mini | 46.67 | 49.42 | 50.91 | 52.63 | 53.82 | 53.33 | 54.86 | 54.36 | 46.92 | 56.97 | 52.48 | 53.14 | 52.47 |
| Qwen Turbo | 52.92 | 51.45 | 49.55 | 51.06 | 52.64 | 50.97 | 52.57 | 56.92 | 53.16 | 55.76 | 55.38 | 53.14 | 52.71 |
| GPT-4o | 55.00 | 53.04 | 54.09 | 53.95 | 53.82 | 52.97 | 53.14 | 55.38 | 46.15 | 53.99 | 54.53 | 52.57 | 53.37 |
| DeepSeek-V3 | 52.78 | 52.27 | 53.18 | 54.25 | 54.91 | 53.91 | 53.71 | 56.32 | 50.27 | 55.15 | 52.14 | 53.71 | 53.79 |
| Qwen Plus | 60.00 | 53.72 | 57.27 | 56.63 | 58.14 | 56.63 | 60.57 | 58.97 | 51.05 | 62.19 | 55.90 | 56.57 | 57.46 |
🔼 This table presents the results of negative inspiration retrieval in the inspiration retrieval task. The experiment evaluated the performance of LLMs in identifying irrelevant papers as potential inspirations for a given research question. The average percentage of incorrectly identified negative inspirations is shown for three different levels of relatedness to the target paper, and for two conditions: where only the top 20% and the top 4% of candidate inspirations were considered. This allows analysis of how LLM performance is affected by the relatedness of the irrelevant papers and the stringency of the selection process.
read the caption
Table 3: Analysis of negative inspiration retrieval in the inspiration retrieval task. Each value represents the average percentage of negative inspirations retrieved across three distance levels, under two settings where only 20% and 4% of the candidate inspirations are selected, respectively.
| Model | Cell | Chem | ETS | MS | Phys | EGS | EVS | BL | BS | Law | Math | A | Overall |
|---|---|---|---|---|---|---|---|---|---|---|---|---|---|
| Llama-3.1-70B | 36.94 | 35.57 | 30.57 | 37.71 | 43.35 | 47.18 | 36.02 | 43.11 | 41.63 | 46.09 | 30.73 | 25.40 | 38.06 |
| GPT-4o Mini | 42.25 | 39.94 | 34.39 | 42.98 | 39.78 | 43.78 | 40.63 | 43.72 | 45.03 | 42.24 | 32.67 | 31.50 | 40.13 |
| Gemini 2.0 Flash | 43.73 | 44.38 | 35.95 | 51.86 | 54.63 | 55.16 | 40.98 | 44.00 | 46.88 | 48.31 | 38.24 | 35.75 | 45.11 |
| Qwen Turbo | 46.42 | 45.11 | 42.88 | 48.74 | 45.61 | 46.40 | 45.26 | 49.20 | 50.92 | 49.27 | 37.15 | 37.62 | 45.48 |
| Gemini 2.0 FT | 43.52 | 44.96 | 36.88 | 52.81 | 54.08 | 54.95 | 42.27 | 44.53 | 46.15 | 48.09 | 37.80 | 38.40 | 45.49 |
| Qwen Plus | 46.00 | 46.00 | 41.72 | 49.35 | 50.64 | 49.11 | 44.80 | 46.93 | 43.36 | 45.43 | 40.16 | 41.97 | 45.56 |
| Claude 3.5 Haiku | 48.15 | 46.88 | 45.55 | 52.45 | 54.10 | 52.48 | 48.83 | 48.06 | 51.23 | 52.93 | 44.49 | 40.27 | 48.86 |
| Llama-3.1-8B | 55.48 | 54.20 | 55.90 | 56.60 | 54.35 | 55.48 | 55.91 | 56.71 | 54.69 | 55.55 | 55.60 | 55.49 | 55.65 |
| GPT-4o | 60.75 | 60.99 | 53.24 | 61.69 | 61.34 | 61.20 | 60.52 | 64.11 | 64.67 | 61.14 | 52.60 | 51.80 | 59.60 |
| DeepSeek-V3 | 80.88 | 82.03 | 78.85 | 83.63 | 80.82 | 81.47 | 83.98 | 81.77 | 83.48 | 80.69 | 76.78 | 75.88 | 80.99 |
| Claude 3.5 Sonnet | 80.23 | 80.83 | 80.93 | 83.20 | 84.33 | 84.72 | 82.63 | 82.48 | 84.87 | 81.81 | 76.20 | 76.51 | 81.59 |
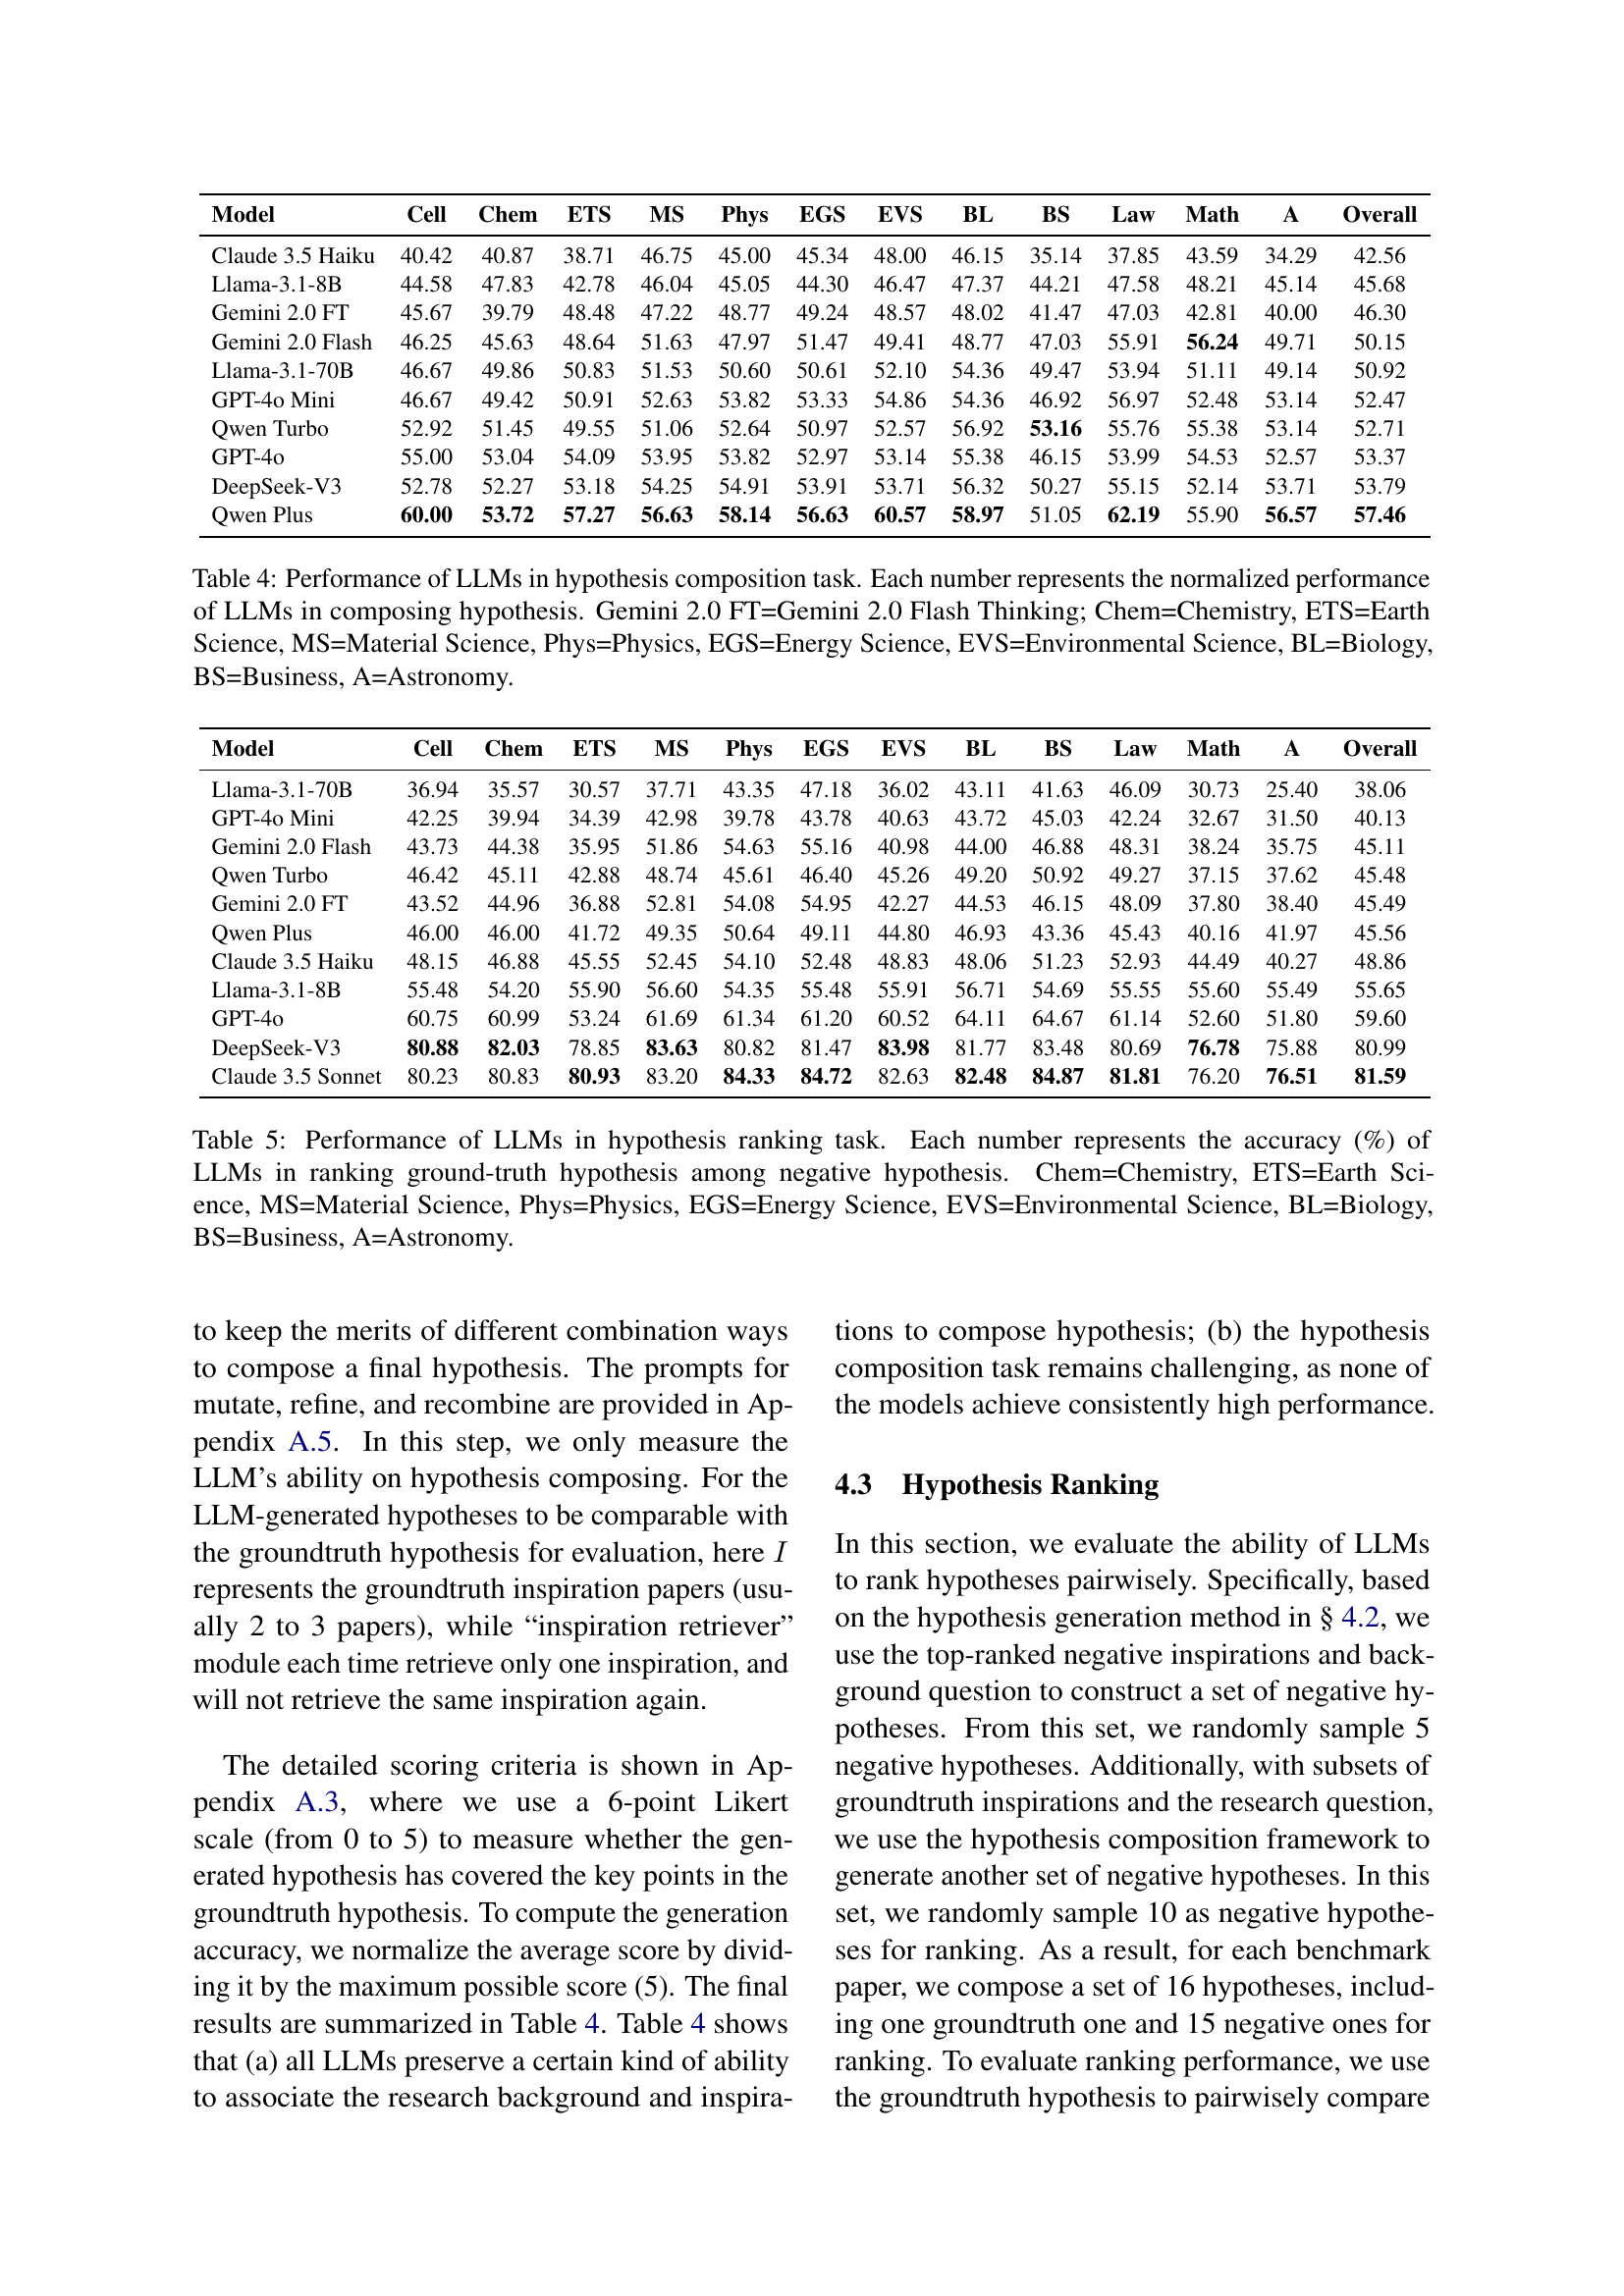
🔼 This table presents the performance of various Large Language Models (LLMs) in the hypothesis composition task. The performance is normalized and shown for each LLM across twelve scientific disciplines: Chemistry (Chem), Earth Science (ETS), Materials Science (MS), Physics (Phys), Energy Science (EGS), Environmental Science (EVS), Biology (BL), Business (BS), Law, Mathematics (Math), and Astronomy (A). Higher values indicate better performance in generating hypotheses. Gemini 2.0 FT refers to Gemini 2.0 Flash Thinking.
read the caption
Table 4: Performance of LLMs in hypothesis composition task. Each number represents the normalized performance of LLMs in composing hypothesis. Gemini 2.0 FT=Gemini 2.0 Flash Thinking; Chem=Chemistry, ETS=Earth Science, MS=Material Science, Phys=Physics, EGS=Energy Science, EVS=Environmental Science, BL=Biology, BS=Business, A=Astronomy.
| Model | ✗ ✗ | ✓ ✗ | ✓ ✓ |
|---|---|---|---|
| GPT-4o Mini | 33.83 | 64.83 | 1.33 |
| Qwen Plus | 25.00 | 69.33 | 5.67 |
| Llama-3.1-8B | 2.50 | 91.67 | 5.83 |
| Llama-3.1-70B | 52.67 | 39.17 | 8.17 |
| Gemini 2.0 Flash | 35.50 | 51.67 | 12.83 |
| Claude 3.5 Haiku | 28.17 | 58.17 | 13.67 |
| Gemini 2.0 FT | 36.50 | 49.67 | 13.83 |
| Qwen Turbo | 39.33 | 45.67 | 15.00 |
| GPT-4o | 11.50 | 61.50 | 27.00 |
| DeepSeek-V3 | 1.74 | 21.83 | 76.44 |
| Claude 3.5 Sonnet | 3.17 | 19.17 | 77.67 |
🔼 This table presents the performance of various Large Language Models (LLMs) on a hypothesis ranking task. The accuracy of each LLM is shown as a percentage, indicating its ability to correctly rank a ground-truth hypothesis against a set of negative hypotheses. The results are broken down by specific scientific discipline (Chemistry, Earth Science, Materials Science, Physics, Energy Science, Environmental Science, Biology, Business, and Astronomy), providing a detailed view of each model’s performance across different scientific fields. The overall accuracy across all disciplines is also provided for each LLM.
read the caption
Table 5: Performance of LLMs in hypothesis ranking task. Each number represents the accuracy (%) of LLMs in ranking ground-truth hypothesis among negative hypothesis. Chem=Chemistry, ETS=Earth Science, MS=Material Science, Phys=Physics, EGS=Energy Science, EVS=Environmental Science, BL=Biology, BS=Business, A=Astronomy.
| Score | Criteria |
|---|---|
| 5 Points | (1) Covers three key points (or all key points) in the ground-truth hypothesis, with each key point leveraged nearly identically to the ground-truth hypothesis. (2) Does not contain any extra key point that is redundant, unnecessary, unhelpful, or harmful. |
| 4 Points | (1) Covers three key points (or all key points) in the ground-truth hypothesis, with each key point leveraged nearly identically to the ground-truth hypothesis. (2) However, it also contains extra key point(s) that are redundant, unnecessary, unhelpful, or harmful. |
| 3 Points | (1) Covers two key points in the ground-truth hypothesis, with each key point leveraged nearly identically to the ground-truth hypothesis. (2) Does not cover all key points in the ground-truth hypothesis. (3) May or may not contain extra key points. |
| 2 Points | (1) Covers one key point in the ground-truth hypothesis and leverages it nearly identically to the ground-truth hypothesis. (2) Does not cover all key points in the ground-truth hypothesis. (3) May or may not contain extra key points. |
| 1 Point | (1) Covers at least one key point in the ground-truth hypothesis, but all the covered key points are used differently from the ground-truth hypothesis. (2) May or may not contain extra key points. |
| 0 Points | The proposed hypothesis does not cover any key point in the ground-truth hypothesis. |
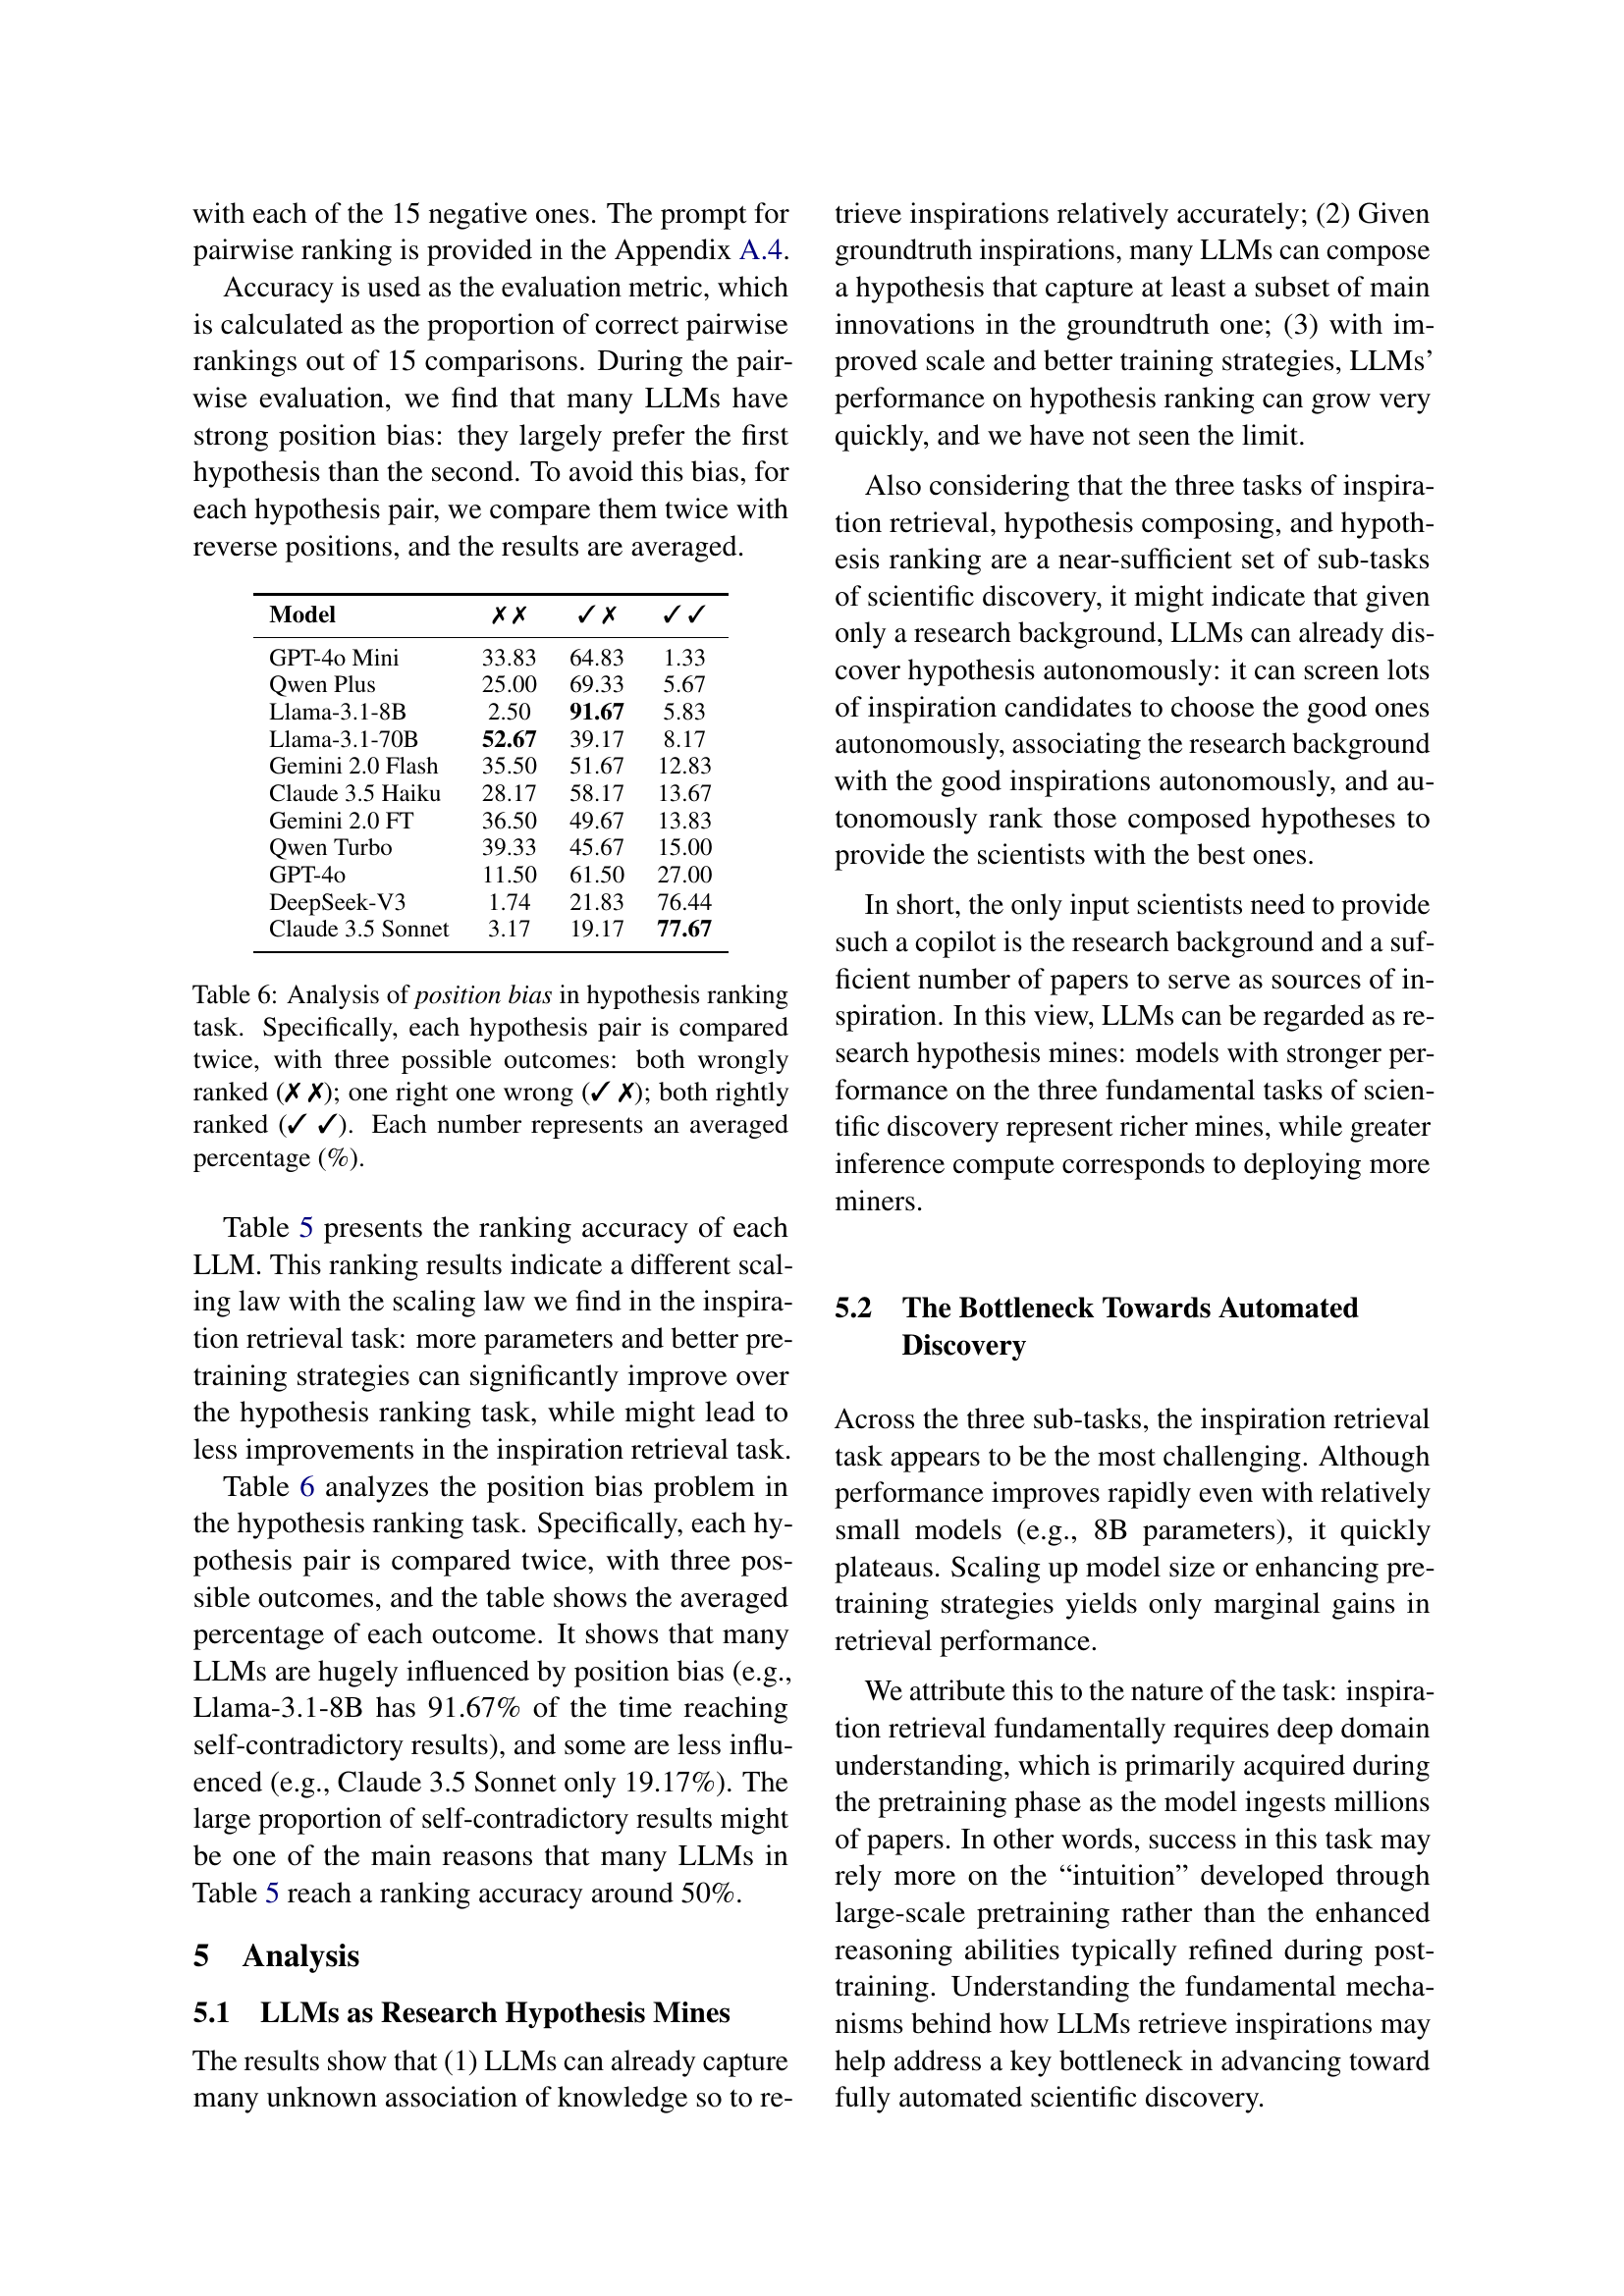
🔼 Table 6 presents the results of an analysis designed to assess position bias in the hypothesis ranking task. The task involved comparing pairs of hypotheses twice—once in their original order and once with their order reversed. Three outcomes were possible for each pair: both hypotheses ranked incorrectly (✗ ✗), one hypothesis correctly and the other incorrectly (✓ ✗), or both hypotheses correctly ranked (✓ ✓). The table shows the average percentage for each outcome across all hypothesis pairs, providing insight into the extent to which the ranking performance is influenced by the order in which hypotheses are presented.
read the caption
Table 6: Analysis of position bias in hypothesis ranking task. Specifically, each hypothesis pair is compared twice, with three possible outcomes: both wrongly ranked (✗ ✗); one right one wrong (✓ ✗); both rightly ranked (✓ ✓). Each number represents an averaged percentage (%).
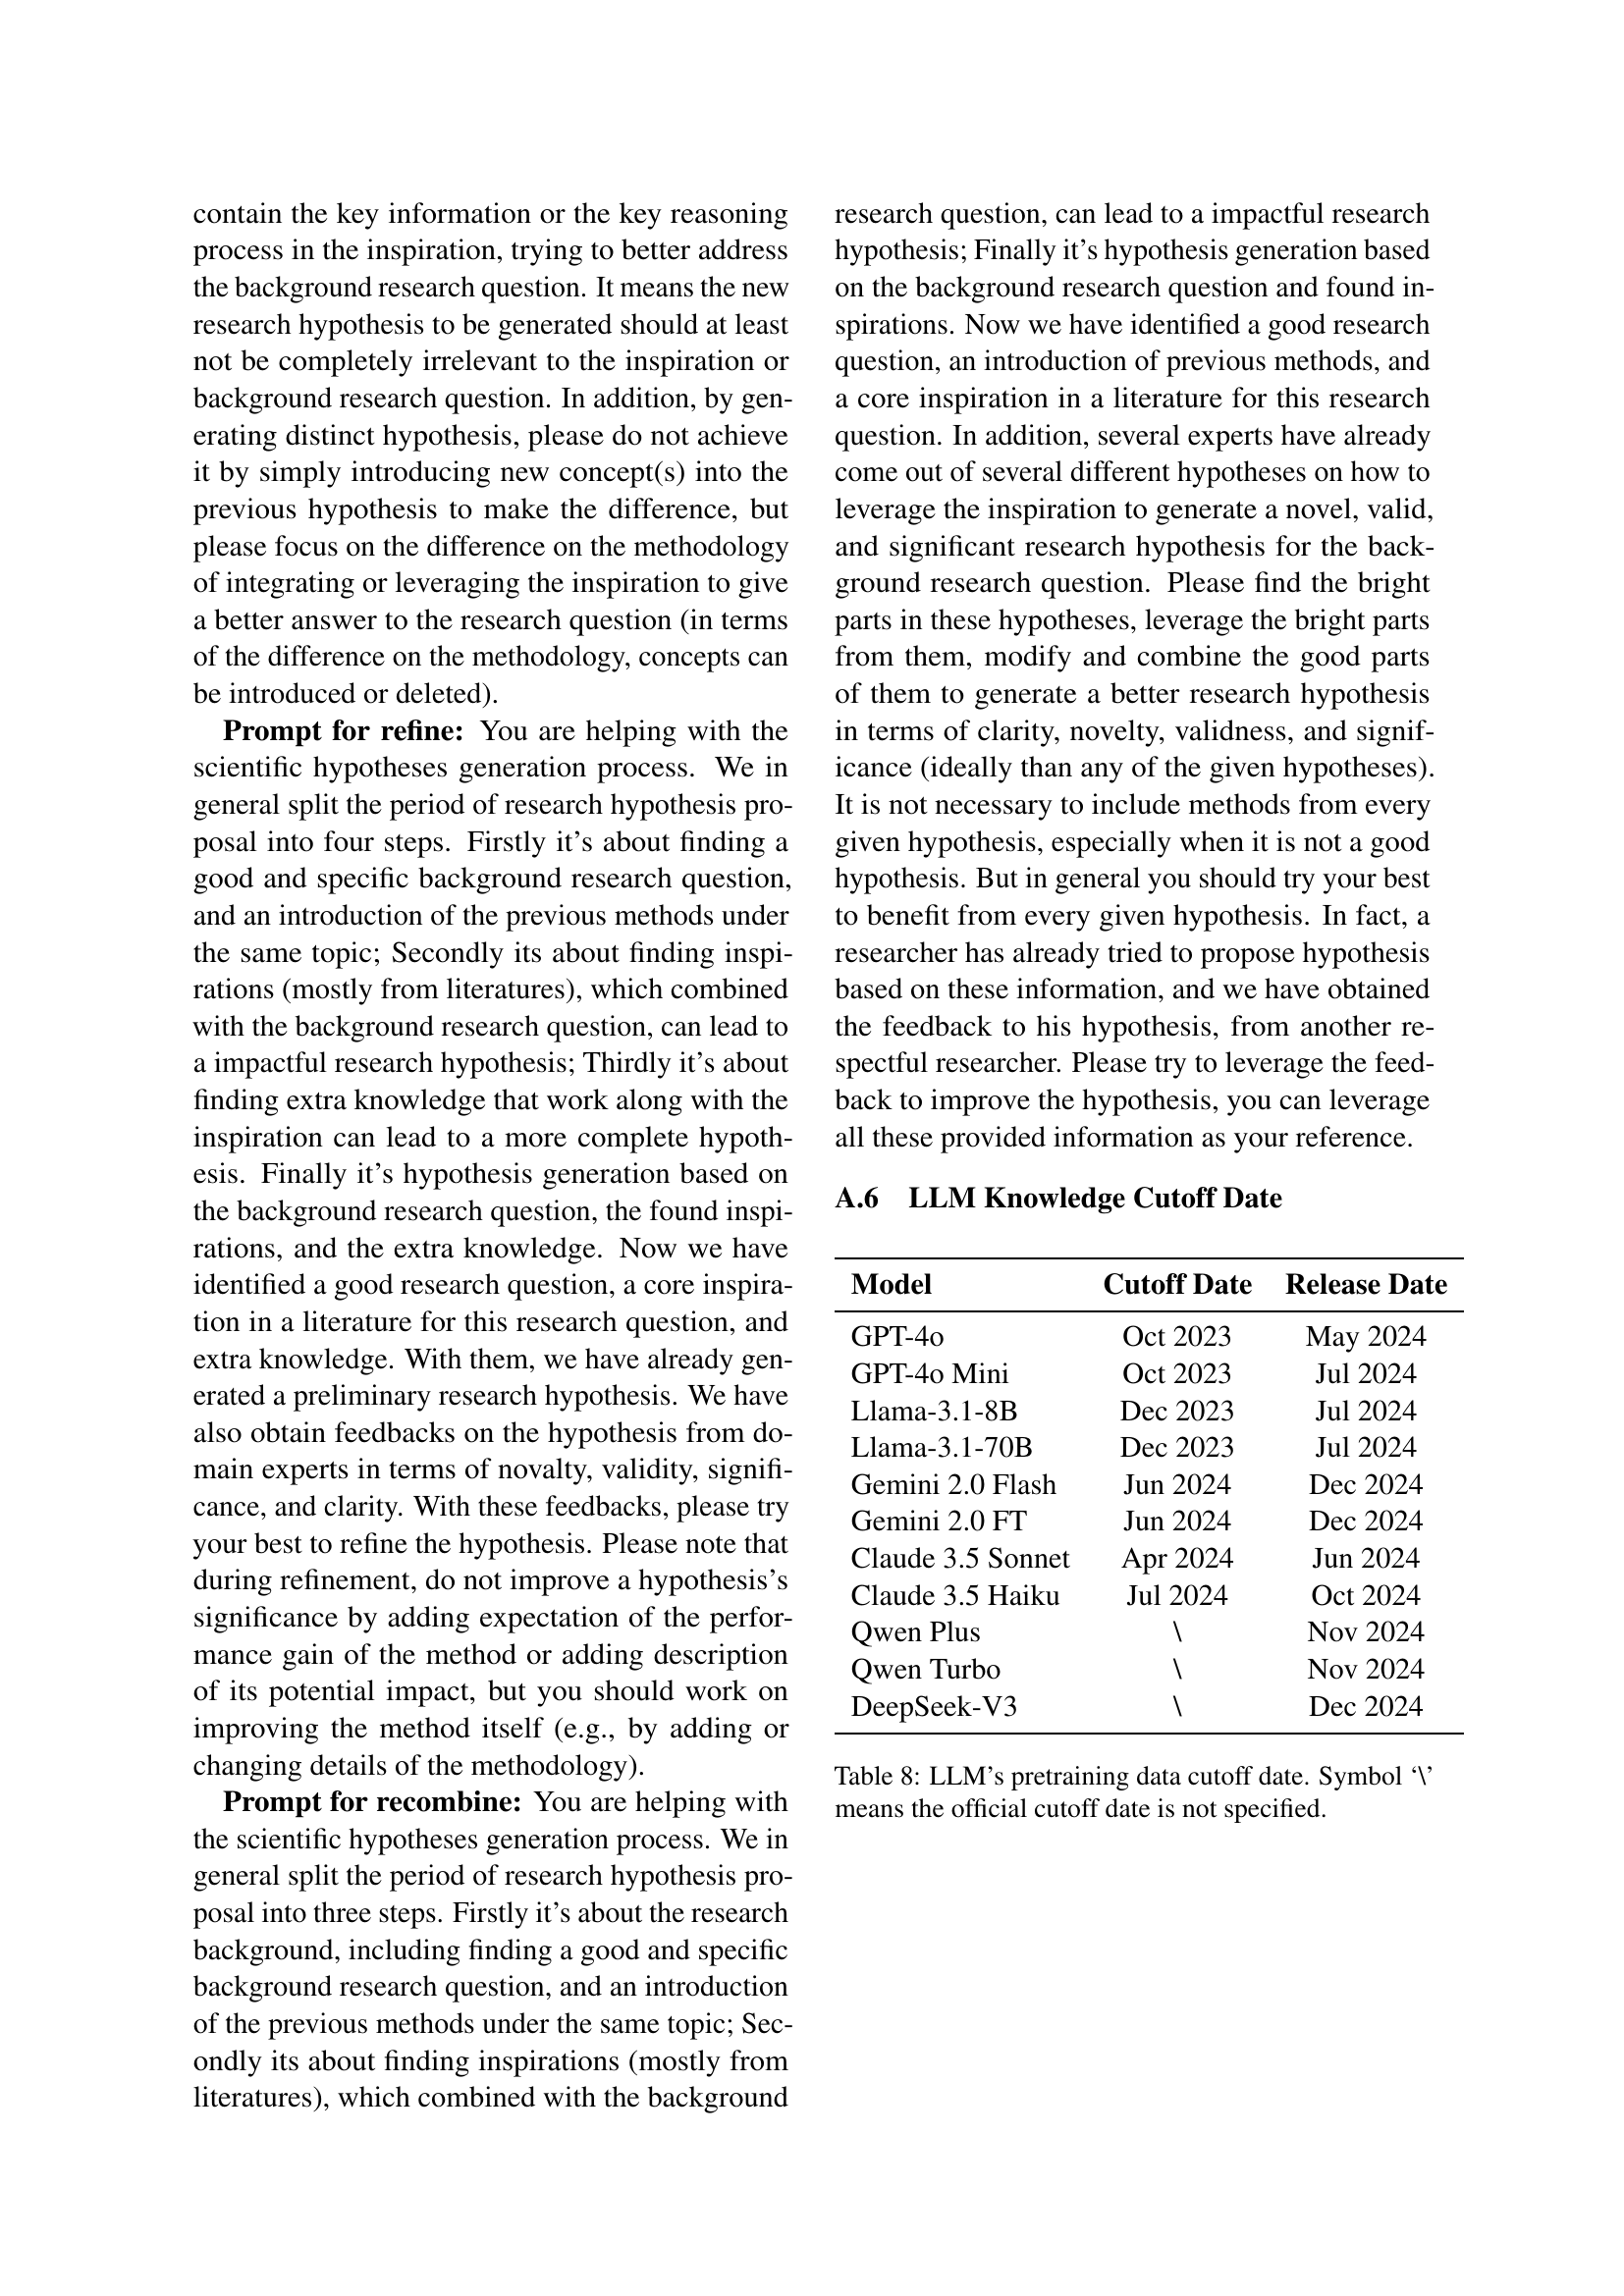
| Model | Cutoff Date | Release Date |
|---|---|---|
| GPT-4o | Oct 2023 | May 2024 |
| GPT-4o Mini | Oct 2023 | Jul 2024 |
| Llama-3.1-8B | Dec 2023 | Jul 2024 |
| Llama-3.1-70B | Dec 2023 | Jul 2024 |
| Gemini 2.0 Flash | Jun 2024 | Dec 2024 |
| Gemini 2.0 FT | Jun 2024 | Dec 2024 |
| Claude 3.5 Sonnet | Apr 2024 | Jun 2024 |
| Claude 3.5 Haiku | Jul 2024 | Oct 2024 |
| Qwen Plus | \ | Nov 2024 |
| Qwen Turbo | \ | Nov 2024 |
| DeepSeek-V3 | \ | Dec 2024 |
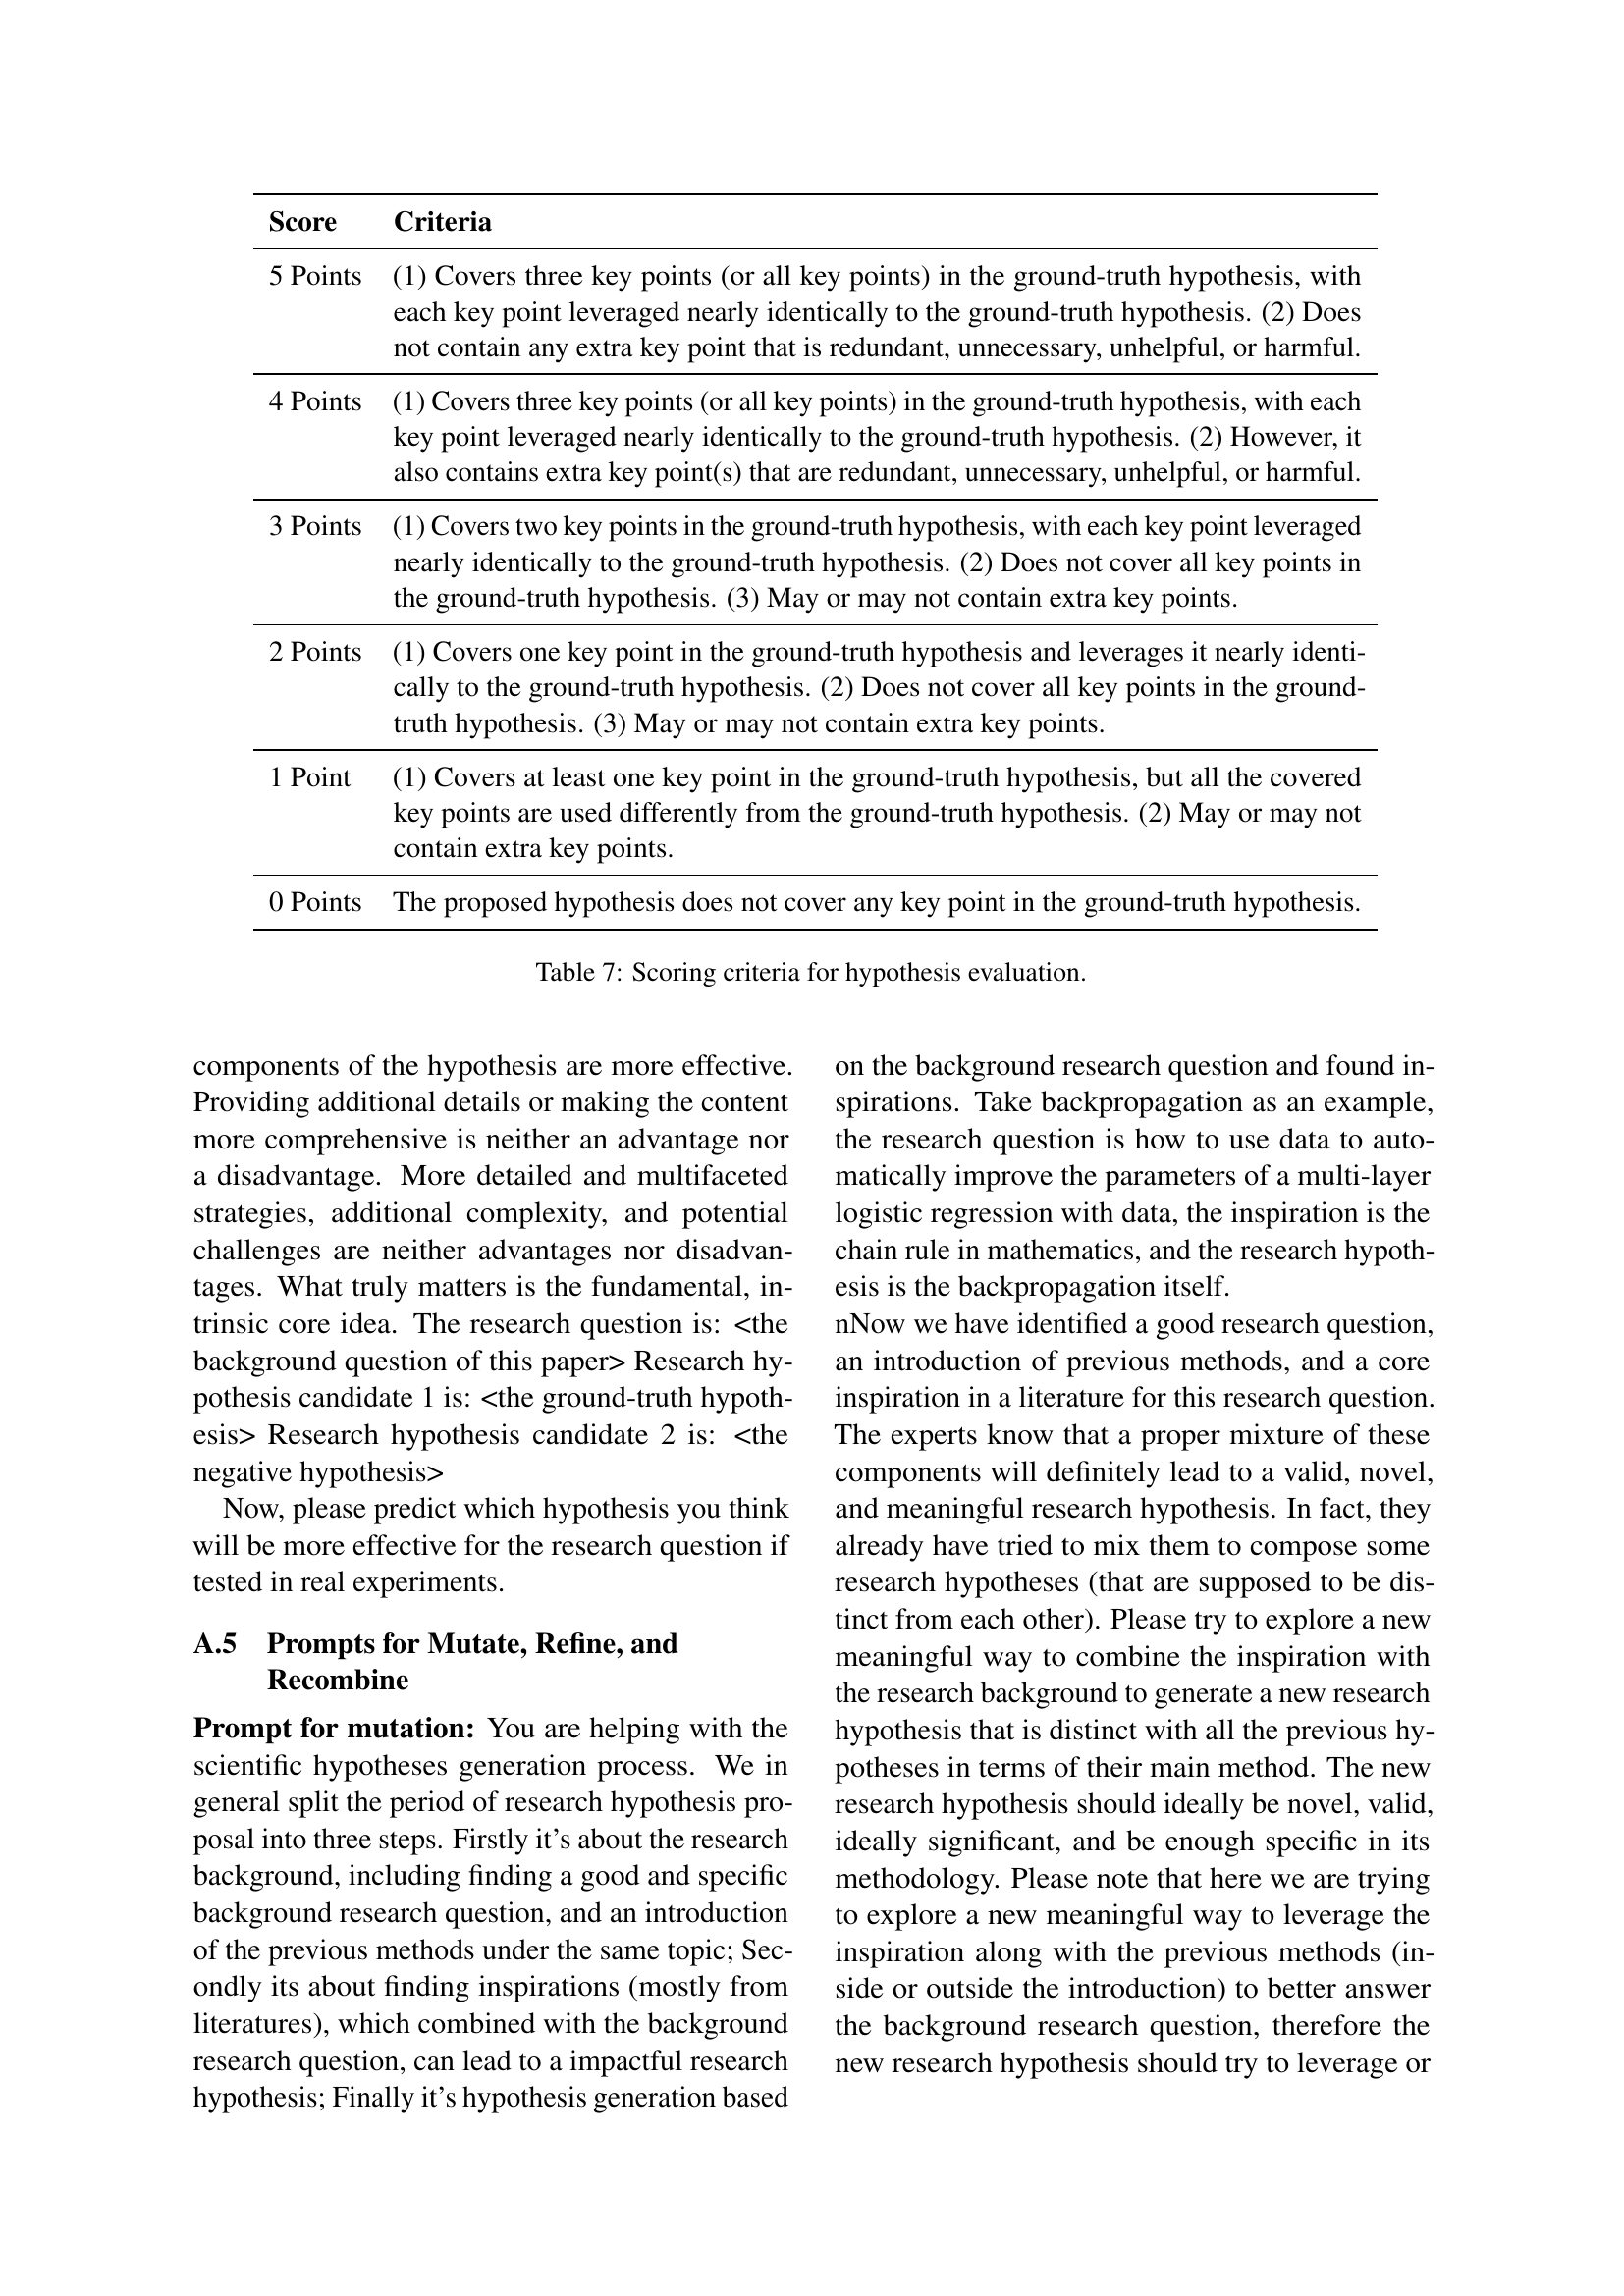
🔼 This table details the scoring rubric used to evaluate the quality of generated research hypotheses. Scores range from 0 to 5, reflecting the extent to which a generated hypothesis aligns with a ground truth hypothesis. Higher scores indicate better alignment, considering factors like the number of key points covered, how accurately these points are represented, and the presence of extraneous or irrelevant information.
read the caption
Table 7: Scoring criteria for hypothesis evaluation.
Full paper#