TL;DR#
DeepSeek-R1 showed that LLMs can reason through RL with rule-based rewards. This paper uses rule-based RL to improve how multimodal large language models (MLLMs) understand graphic user interfaces (GUIs) to predict actions. The authors created a small, high-quality dataset of 136 tricky tasks with five common action types on mobile. They also made a unified rule-based action reward to optimize models using policy-based algorithms.
The authors introduce UI-R1-3B, a data-efficient model that significantly improves both in-domain (ID) and out-of-domain (OOD) tasks. The action type accuracy increases by 15% on the ID benchmark ANDROIDCONTROL, and grounding accuracy goes up by 10.3%, compared to the base model (Qwen2.5-VL-3B). On the OOD GUI grounding benchmark ScreenSpot-Pro, the model outperforms the base model by 6.0%.
Key Takeaways#
Why does it matter?#
This paper pioneers rule-based RL for enhancing GUI agents, offering a scalable, data-efficient alternative to SFT. The UI-R1 framework and novel reward function accelerate GUI understanding and control, paving the way for future research in this domain.
Visual Insights#

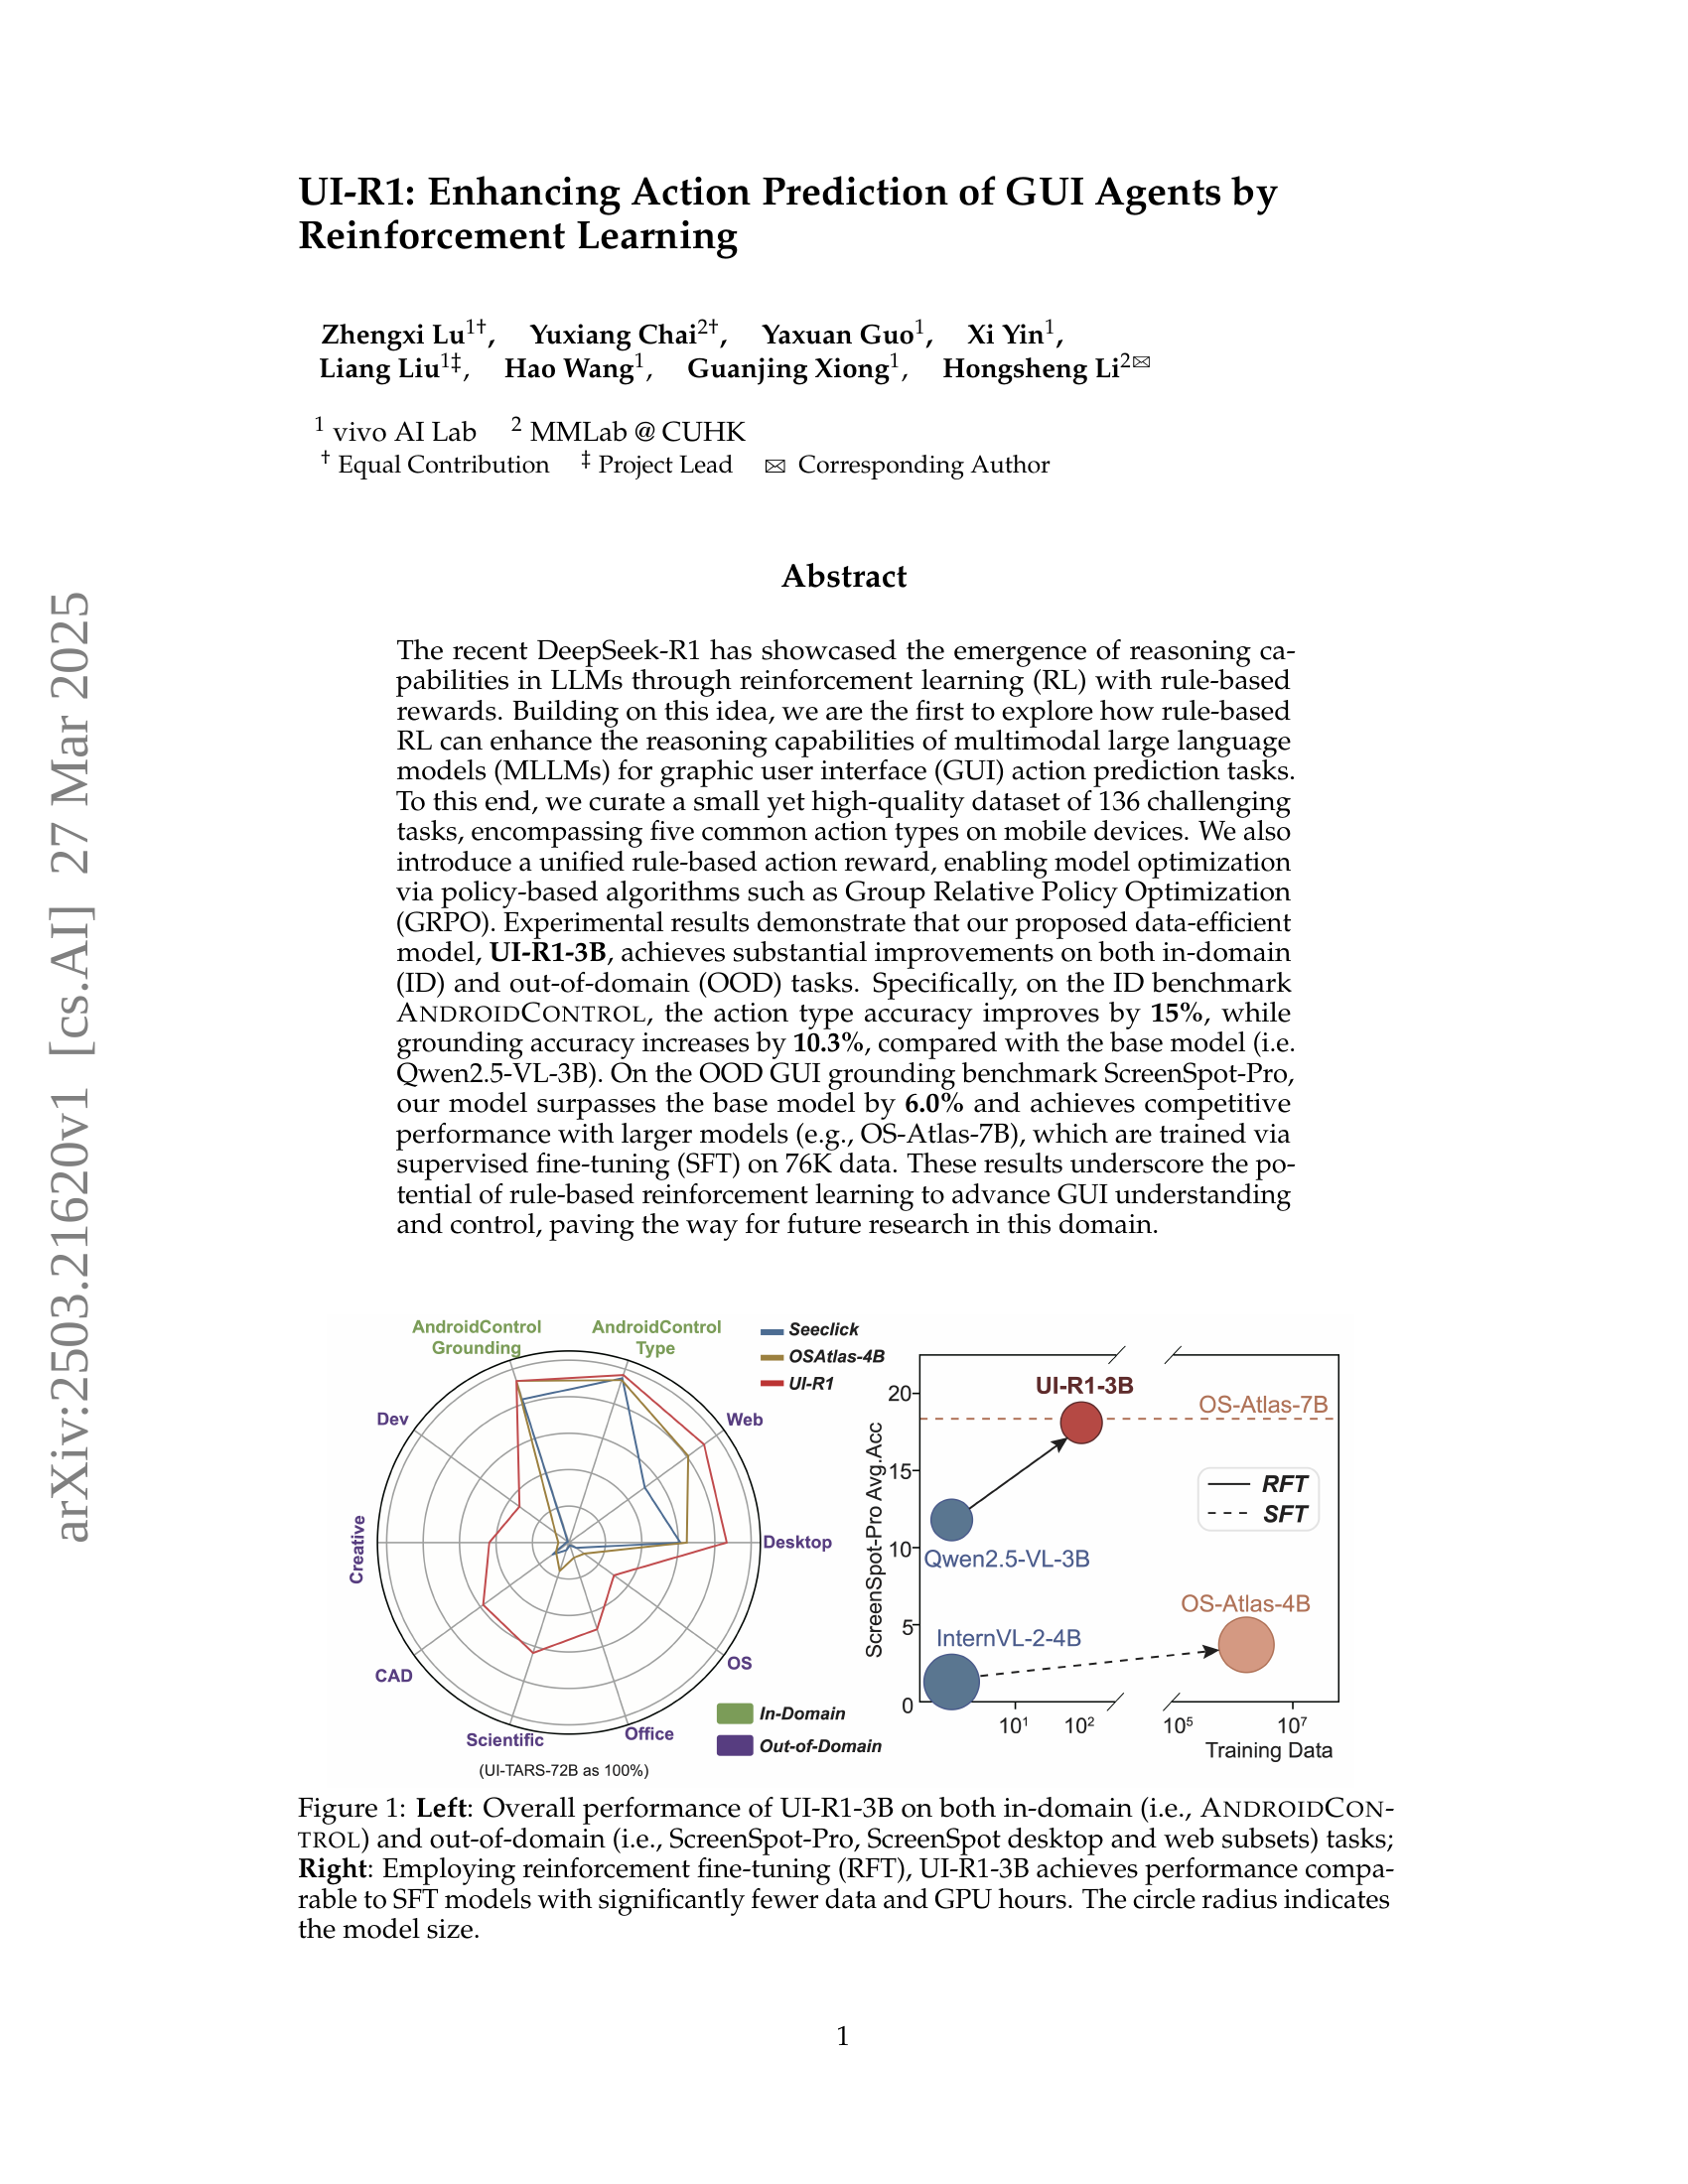
🔼 This figure presents a comparison of the UI-R1-3B model’s performance against other models. The left panel shows a radar chart illustrating the model’s performance across various in-domain (AndroidControl) and out-of-domain (ScreenSpot-Pro, ScreenSpot’s desktop and web subsets) tasks. Each axis represents a different task or aspect of performance, and the distance of the UI-R1-3B point from the center shows the model’s relative performance on that axis. The right panel is a bar chart comparing the performance of UI-R1-3B, trained using reinforcement fine-tuning (RFT) with fewer data points, to larger models trained with supervised fine-tuning (SFT). It highlights that UI-R1-3B achieves comparable or better performance despite using significantly less training data and computational resources (GPU hours). The size of the circles in the bar chart visually represents the size of the models.
read the caption
Figure 1: Left: Overall performance of UI-R1-3B on both in-domain (i.e., AndroidControl) and out-of-domain (i.e., ScreenSpot-Pro, ScreenSpot desktop and web subsets) tasks; Right: Employing reinforcement fine-tuning (RFT), UI-R1-3B achieves performance comparable to SFT models with significantly fewer data and GPU hours. The circle radius indicates the model size.
| Model | Method | Model Size | Data Size | Web | Desktop | Average | ||
| Icon | Text | Icon | Text | |||||
| Supervised Fine-tuning | ||||||||
| SeeClick | SFT | 9.6B | 1M | 32.5 | 55.7 | 30.0 | 72.2 | 49.0 |
| CogAgent | SFT | 18B | - | 28.6 | 70.4 | 20.0 | 74.2 | 51.0 |
| Qwen2.5-VL | SFT | 3B | 500 | 63.1 | 78.3 | 46.4 | 85.0 | 70.1 |
| UGround-V1 | SFT | 7B | 10M | 70.4 | 80.4 | 63.6 | 82.5 | 75.2 |
| AGUVIS | SFT | 7B | 1M | 70.7 | 88.1 | 74.8 | 85.7 | 80.4 |
| Zero Shot / Reinforcement Learning | ||||||||
| Qwen2-VL | ZS | 7B | 0 | 25.7 | 35.2 | 54.3 | 76.3 | 46.5 |
| Qwen2.5-VL | ZS | 3B | 0 | 43.2 | 60.0 | 40.0 | 80.9 | 57.1 |
| UI-R1 | RFT | 3B | 136 | 73.3 | 85.2 | 59.3 | 90.2 | 78.6 |
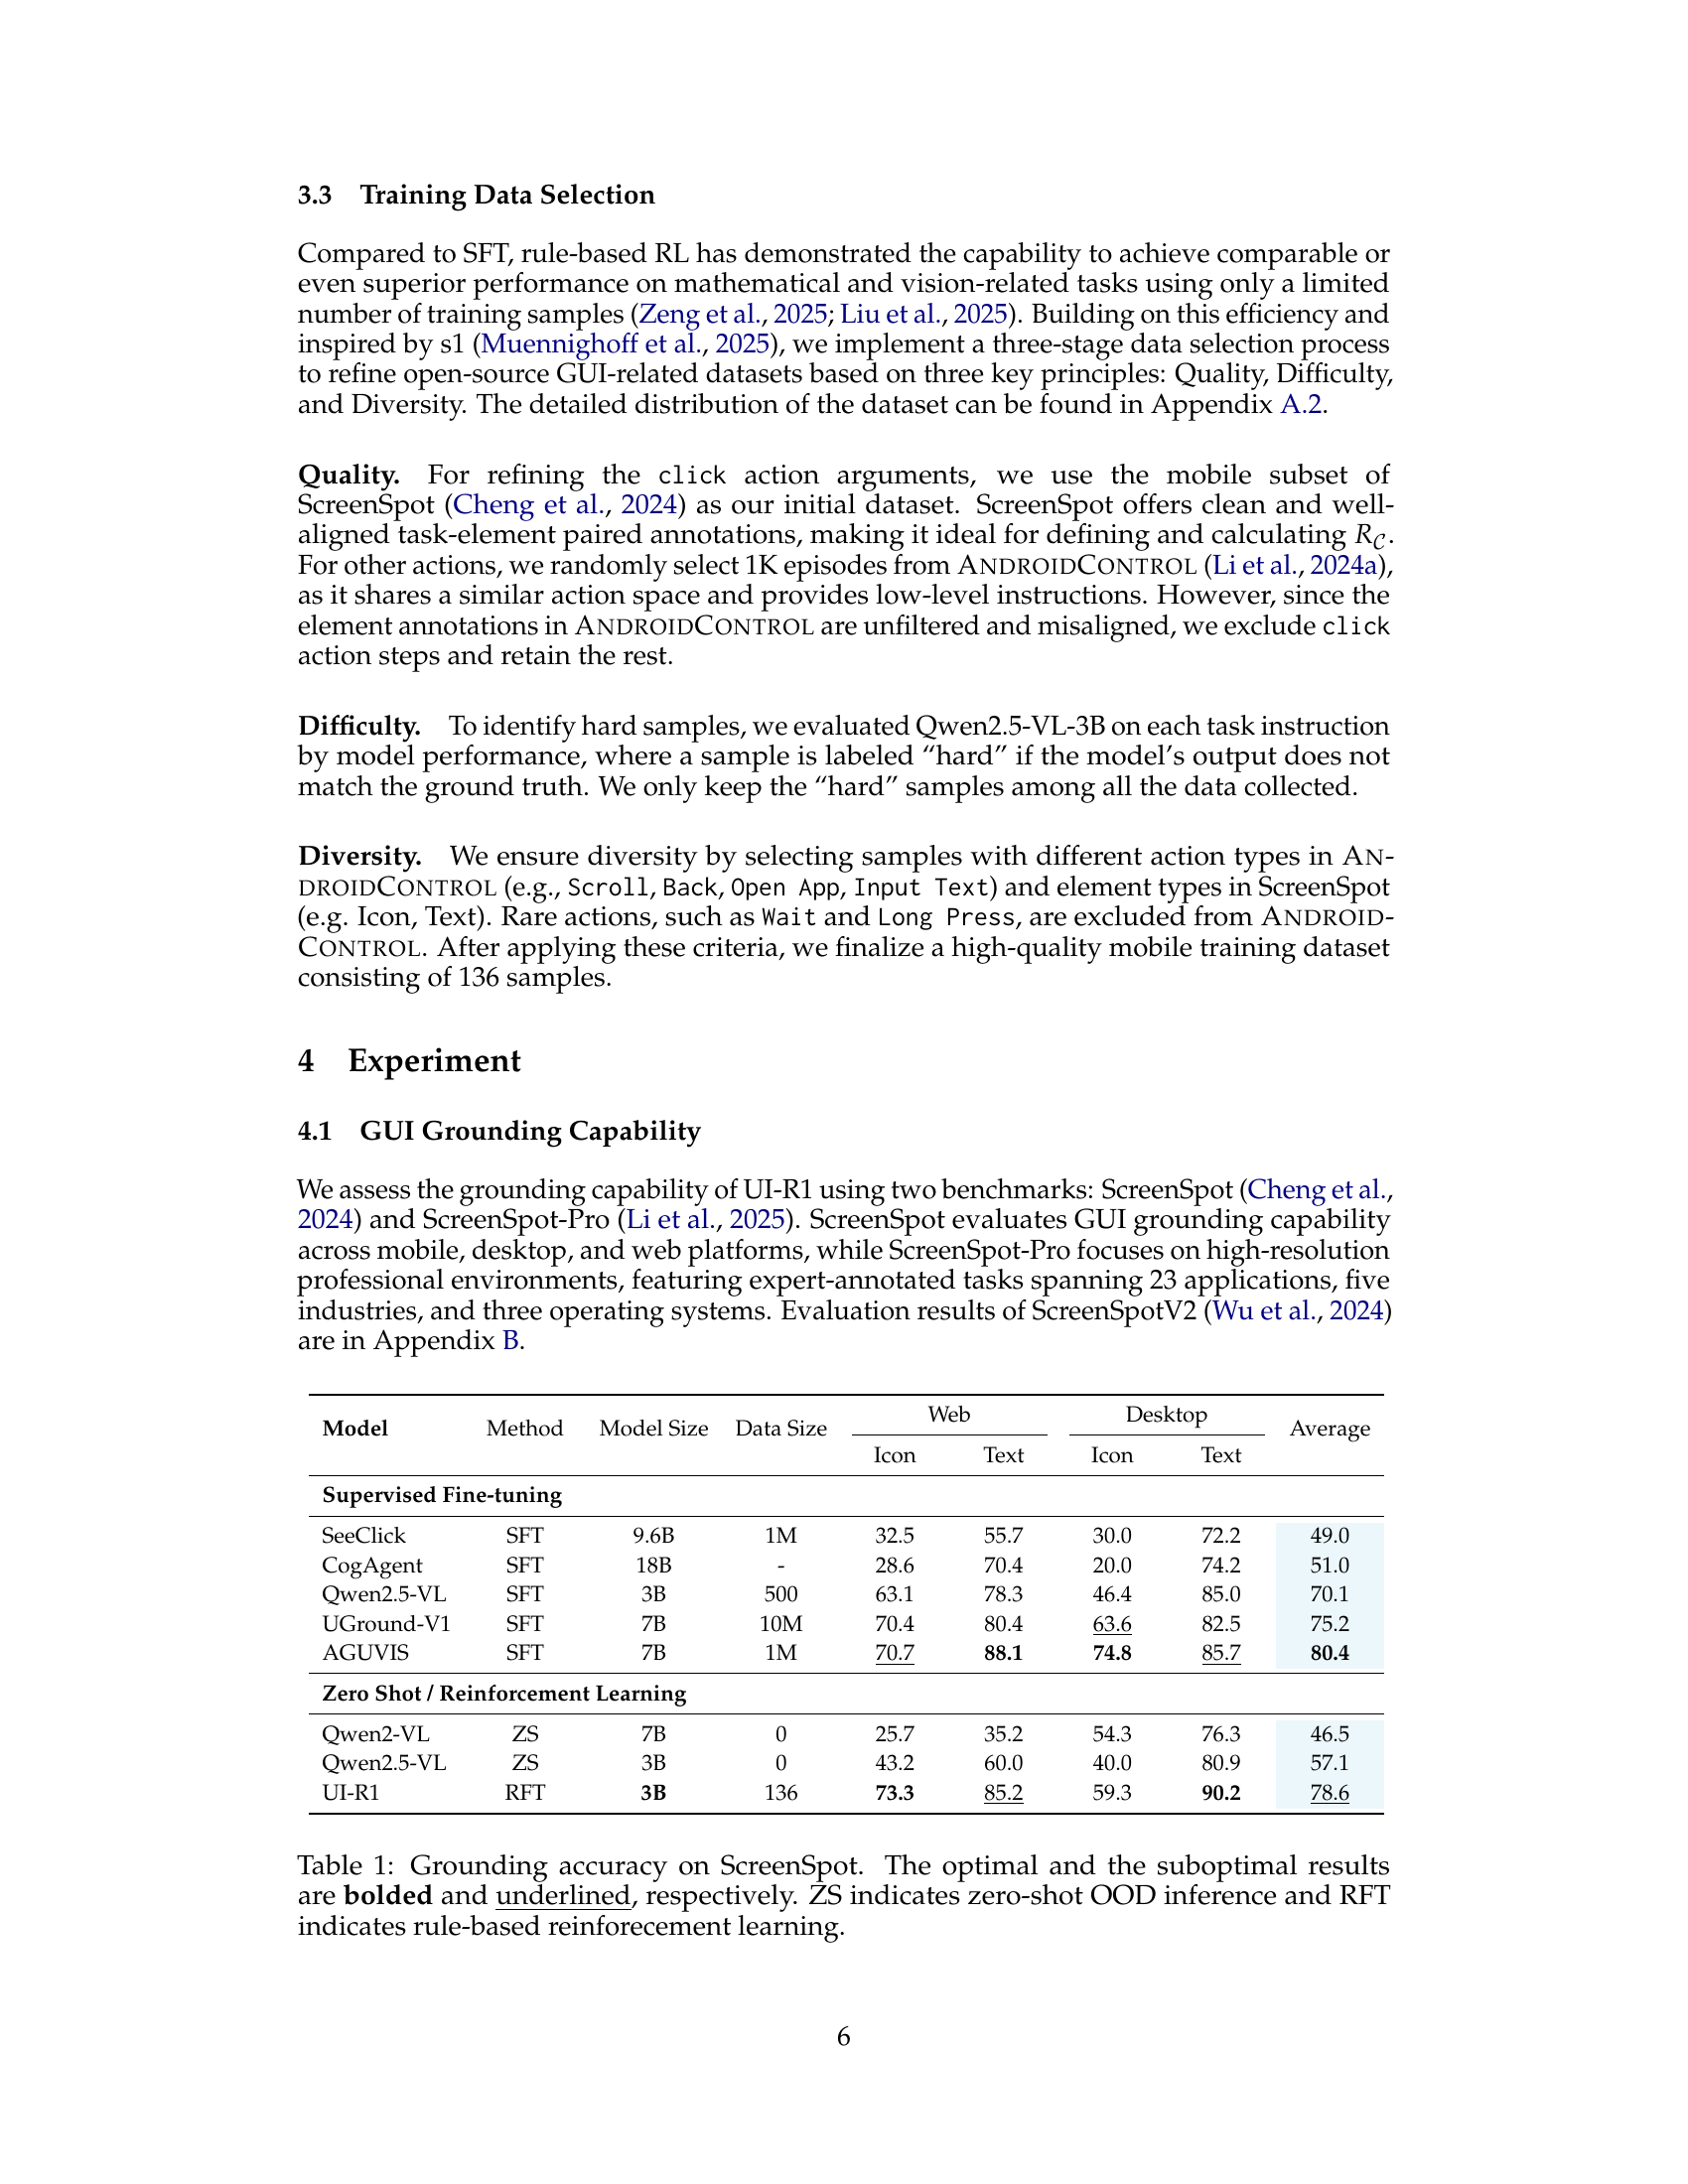
🔼 Table 1 presents the performance comparison of different models on the ScreenSpot benchmark for GUI grounding accuracy. It breaks down the accuracy scores for ‘Icon’ and ‘Text’ elements across Mobile, Web, and Desktop platforms. The table highlights the superior performance of the UI-R1 model, particularly when compared against models trained with supervised fine-tuning (SFT) or zero-shot methods (ZS). The bolded and underlined values signify the best and second-best performing models, offering a clear visualization of the relative strengths of each approach. The abbreviations ‘ZS’ and ‘RFT’ denote zero-shot out-of-domain inference and rule-based reinforcement fine-tuning, respectively, providing crucial context for understanding the training methodology used for each model.
read the caption
Table 1: Grounding accuracy on ScreenSpot. The optimal and the suboptimal results are bolded and underlined, respectively. ZS indicates zero-shot OOD inference and RFT indicates rule-based reinforecement learning.
In-depth insights#
RL for GUI MLLMs#
Applying Reinforcement Learning (RL) to GUI-based Multimodal Large Language Models (MLLMs) presents a significant opportunity to enhance their interactive capabilities. GUI environments are inherently sequential decision-making tasks, fitting well with RL’s framework. RL can refine the MLLM’s action prediction and reasoning by optimizing for long-term rewards tied to successful task completion. Specifically, a well-designed reward function can guide the MLLM to interact more effectively with GUI elements, improving accuracy and generalization. Data efficiency is the key, rule-based RL could enable substantial performance gains with limited data. Furthermore, RL can address the challenge of out-of-domain (OOD) generalization, making the models more robust across diverse GUI platforms.
Rule-Based Rewards#
Rule-based rewards, as explored in the context of GUI agents and reinforcement learning, represent a paradigm shift from traditional, data-intensive supervised learning. The core idea revolves around defining explicit, task-specific reward functions based on predefined rules, eliminating the need for extensive human-annotated datasets. This approach offers several advantages: scalability and efficiency, as models can be trained with significantly fewer examples; interpretability, as the reward structure provides clear signals for optimization; and adaptability, enabling models to generalize better to unseen scenarios. By carefully crafting reward functions that incentivize desired behaviors, such as accurate action prediction and correct GUI element interaction, rule-based RL can unlock the reasoning potential of large language models in complex tasks.
Data-Efficient RFT#
While not explicitly a heading, “Data-Efficient RFT” (Reinforcement Fine-Tuning) encapsulates a critical theme explored in the paper. The research addresses the challenge of training GUI agents, where traditional supervised methods demand extensive labeled datasets. The paper champions rule-based RFT as a solution, enabling effective model training with significantly reduced data requirements. This is achieved through carefully crafted reward functions that guide the learning process. The method achieves significant performance gains with minimal mobile data and exhibits solid generalization. The ability to achieve competitive performance with limited data opens new avenues for research in resource-constrained environments, facilitating faster experimentation and iteration cycles, thus is a data-efficient approach.
OOD Generalization#
The paper demonstrates a compelling case for reinforcement learning (RL) in enhancing out-of-domain (OOD) generalization for GUI agents. Supervised fine-tuning (SFT), while effective for in-domain tasks, often falters when presented with unseen data distributions. The work addresses this limitation by introducing a rule-based RL framework (UI-R1) that focuses on learning fundamental GUI interaction principles rather than memorizing specific data patterns. By optimizing for task-specific rewards, the agent learns to generalize its knowledge to new environments and scenarios. This approach fosters adaptability, enabling the agent to perform well on OOD tasks, even with limited training data. The effectiveness of UI-R1 is attributed to its ability to extract underlying task structures and reasoning capabilities, rather than overfitting to the specifics of the training data. This is a significant departure from SFT, which often relies on massive datasets for reasonable OOD performance. The results highlight the potential of RL as a powerful tool for creating more robust and generalizable GUI agents. The emphasis on a carefully crafted reward function further contributes to the enhanced OOD performance, guiding the agent towards learning meaningful and transferable representations.
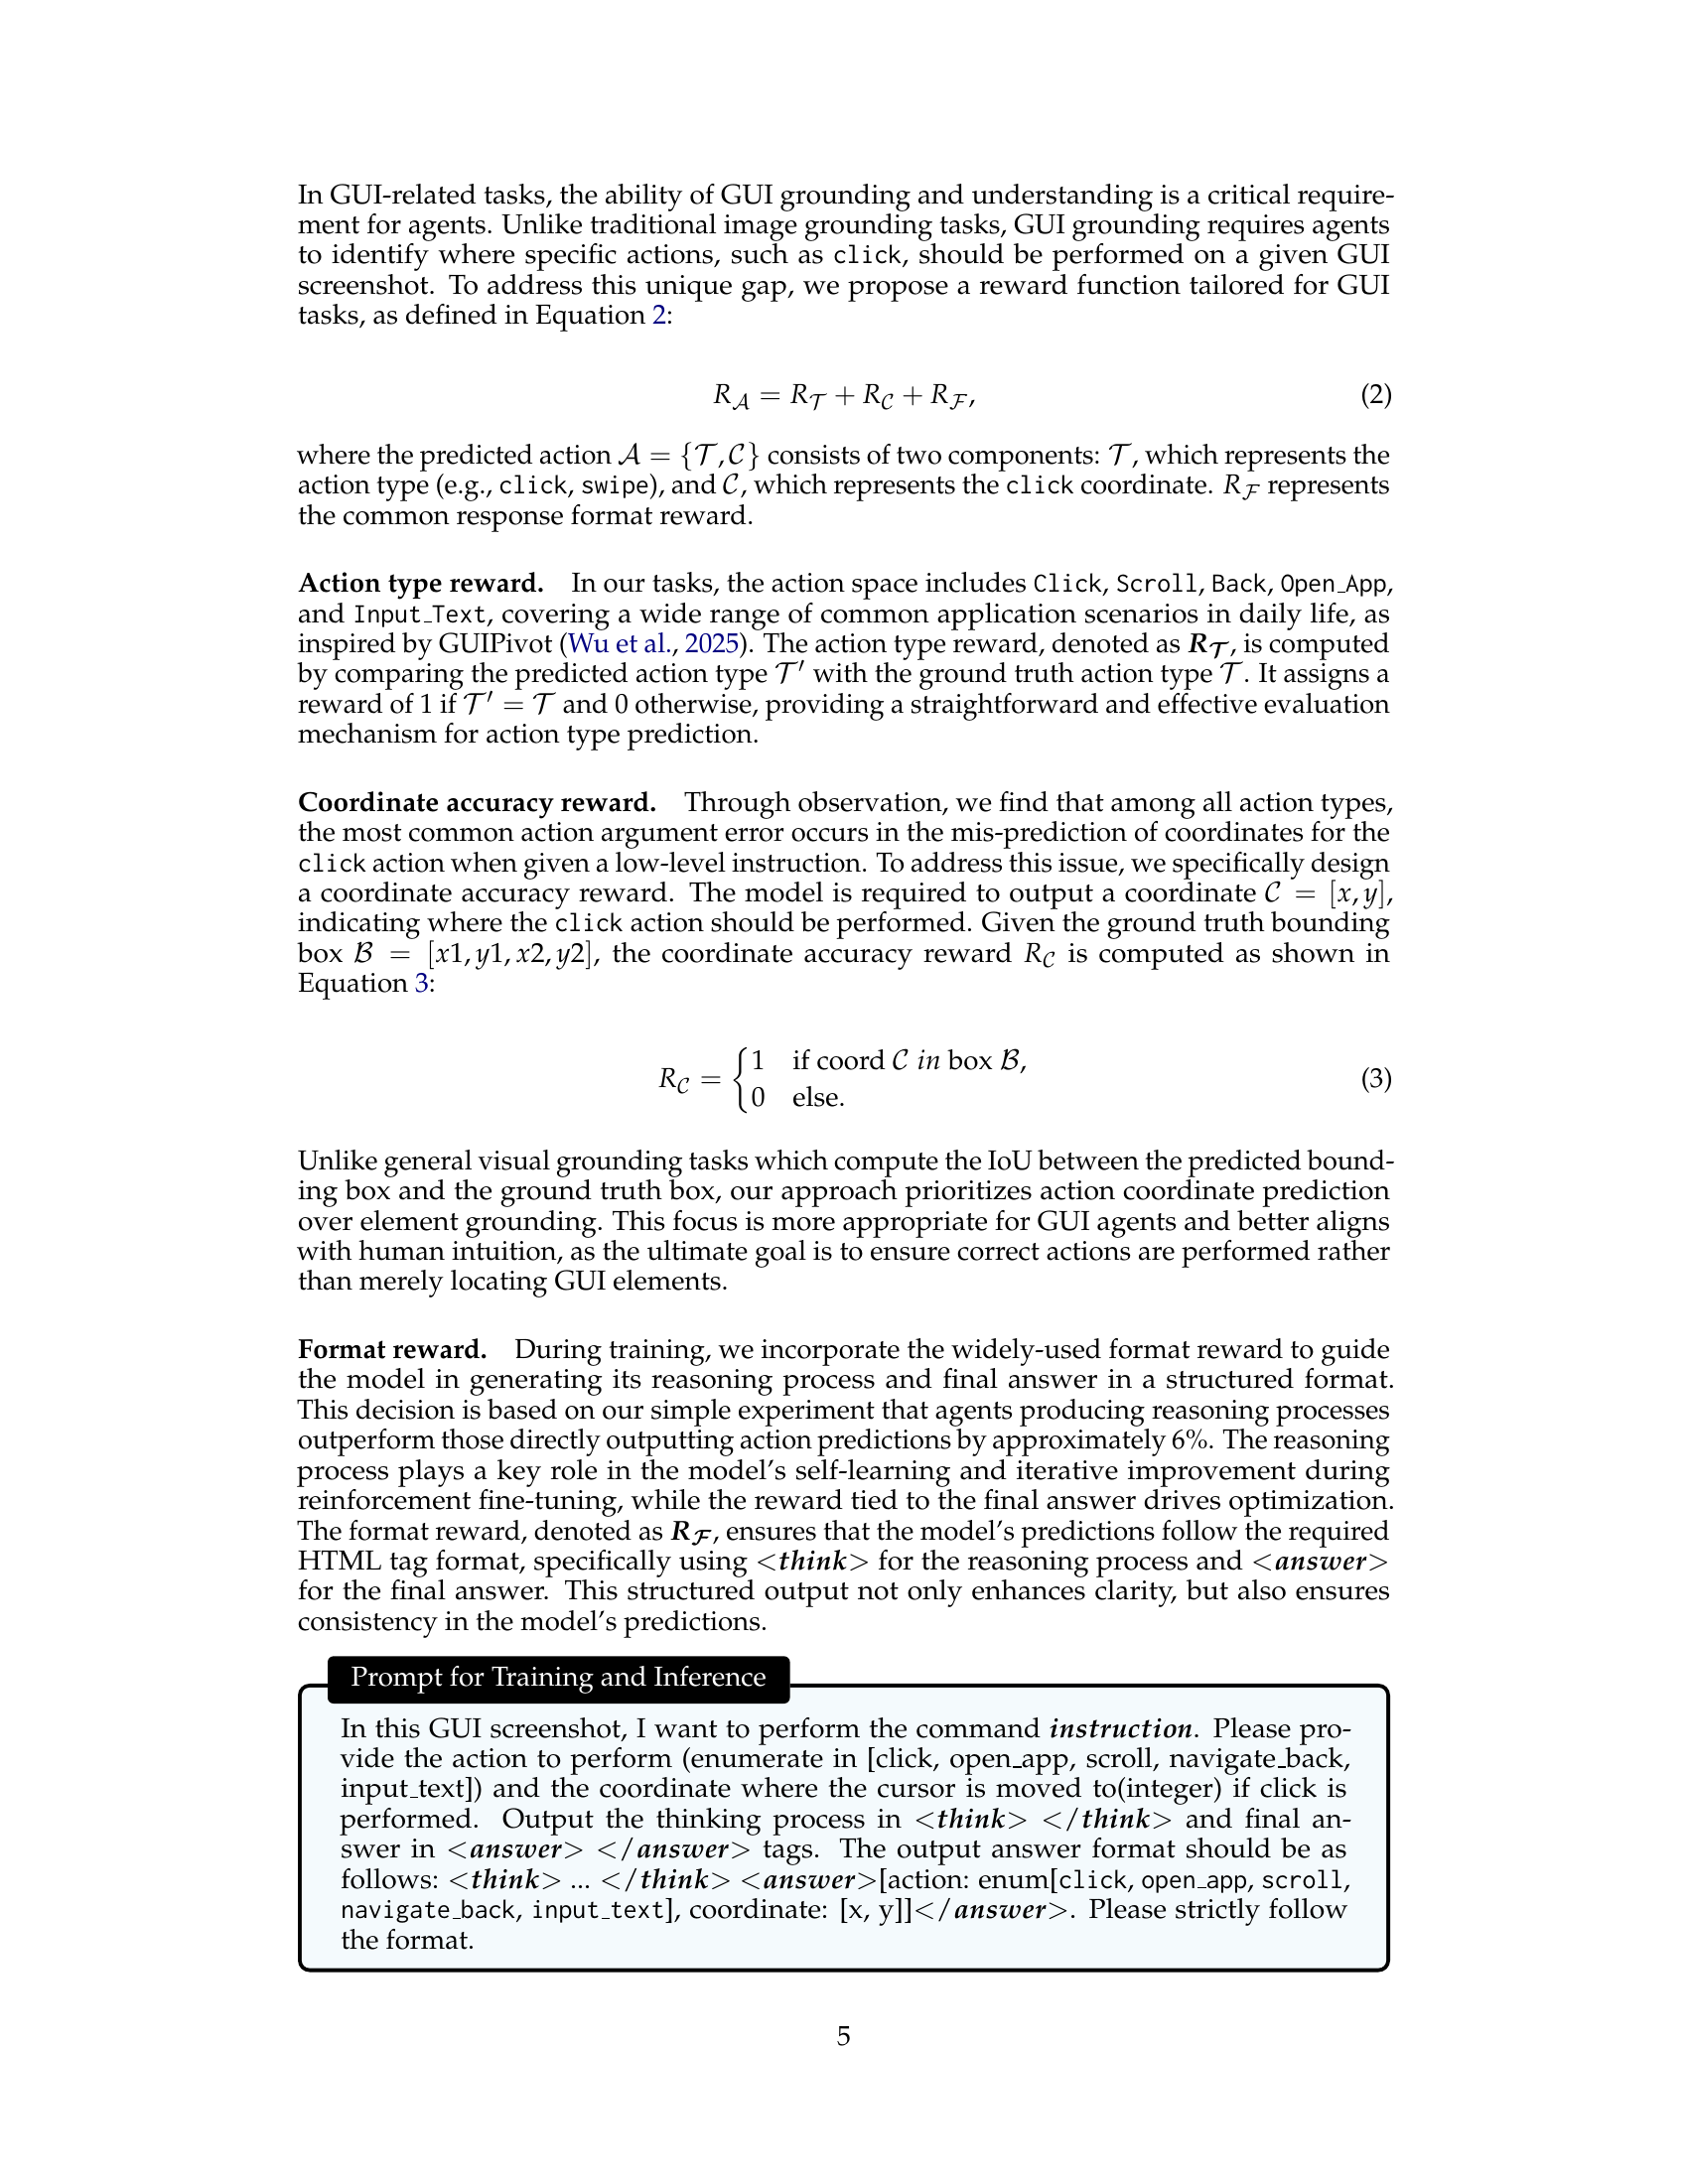
GUI Task Rewards#
GUI task rewards are crucial for training agents to interact effectively with graphical user interfaces. A well-designed reward system should consider various aspects of GUI interactions, including action type accuracy, coordinate precision, and adherence to structured output formats. Action type accuracy ensures the agent selects the correct action (e.g., click, scroll), while coordinate precision focuses on the agent’s ability to pinpoint the exact location for interactions like clicks. Reward the correct formatting and reasoning.
More visual insights#
More on figures

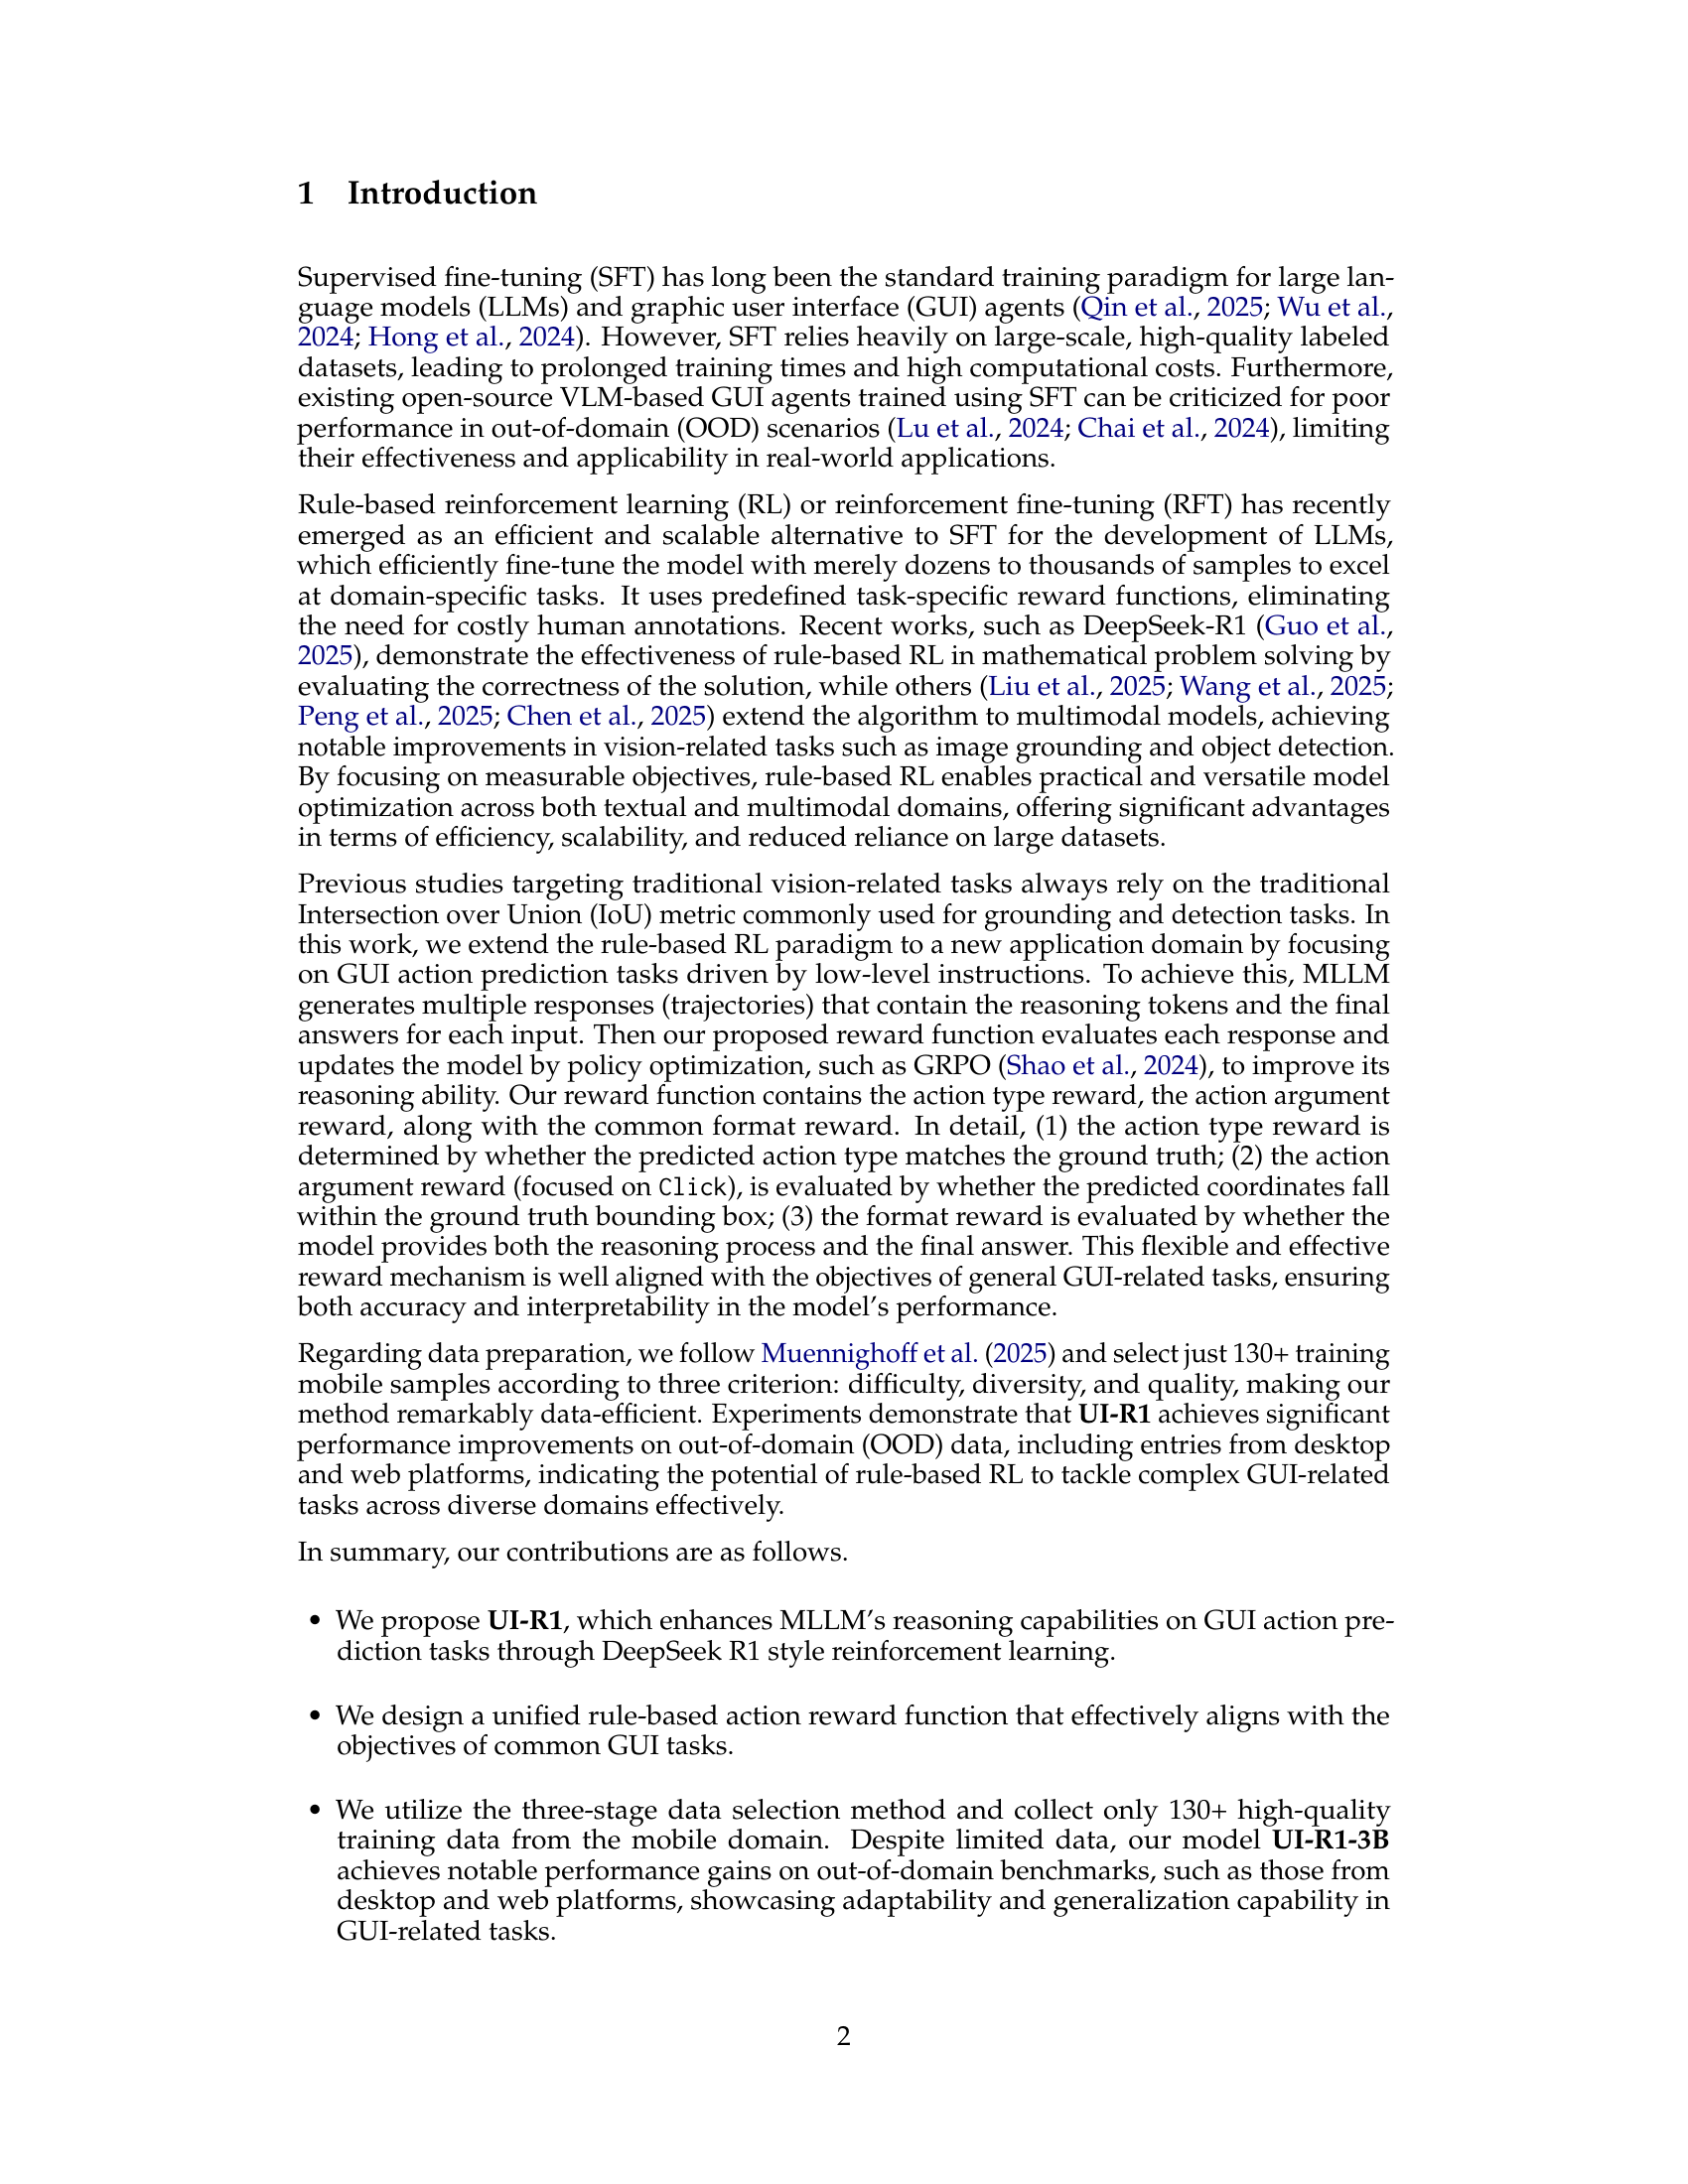
🔼 The UI-R1 training framework starts with a GUI screenshot and a user’s text instruction. The Qwen2.5-VL-3B policy model generates multiple action plans, each including reasoning steps. A custom rule-based reward function assesses these plans. The policy model is then refined using a policy gradient optimization algorithm based on the rewards received.
read the caption
Figure 2: Overview of UI-R1 training framework. Given a GUI screenshot and a text instruction from the user, the policy model (i.e., Qwen2.5-VL-3B) generates multiple action planning responses with reasoning. Our proposed rule-based action reward function is then applied, and the policy model is updated using a policy gradient optimization algorithm.

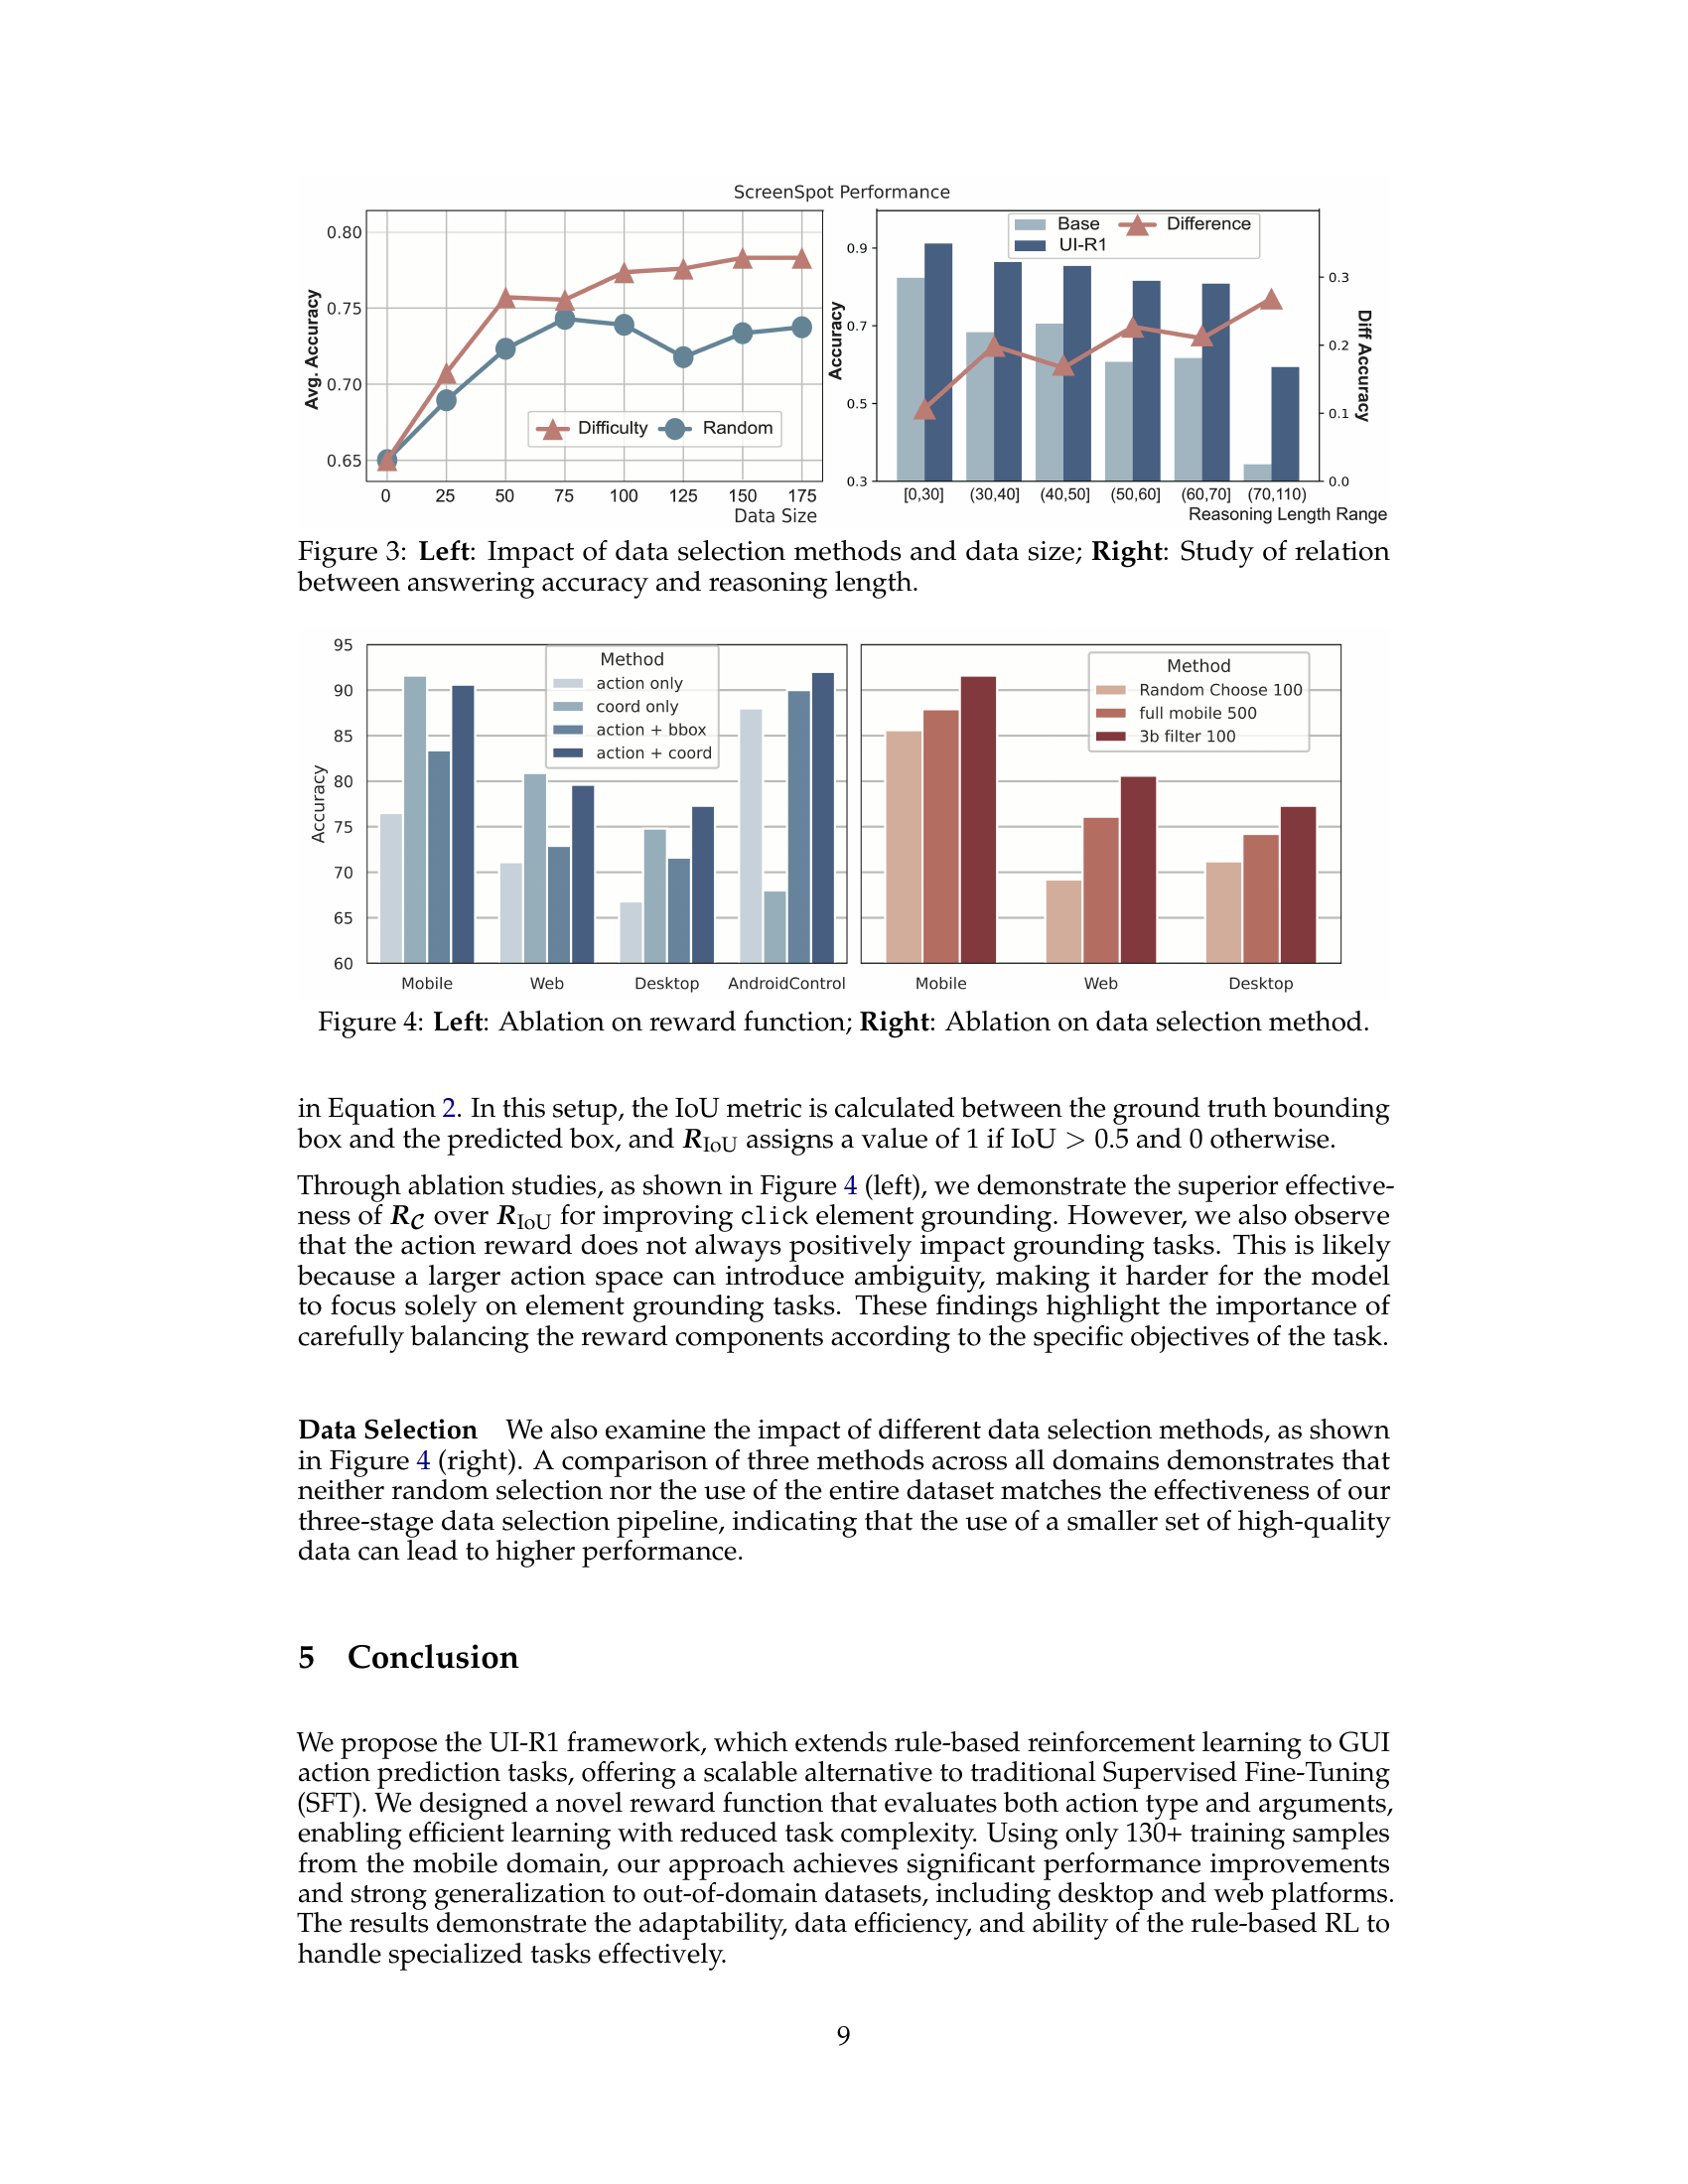
🔼 This figure presents a two-part analysis of the UI-R1 model’s performance. The left panel shows how different data selection strategies and varying training dataset sizes affect the model’s accuracy on the ScreenSpot benchmark. It compares results using randomly selected data versus data specifically chosen for difficulty, revealing the impact of data quality and quantity on performance. The right panel investigates the correlation between the length of the model’s reasoning process and its accuracy in answering the questions. It illustrates how accuracy may decrease as reasoning complexity increases, suggesting that the model faces more difficulty in providing correct answers for more complex tasks.
read the caption
Figure 3: Left: Impact of data selection methods and data size; Right: Study of relation between answering accuracy and reasoning length.

🔼 This figure presents ablation study results, investigating the impact of different reward functions and data selection methods on model performance. The left panel shows a comparison of using only the action reward, only the coordinate reward, both action and bounding box reward, and the combination of both action and coordinate reward. The right panel compares different data selection methods, illustrating the effect of using only randomly chosen data versus using a high-quality subset of data selected by difficulty, demonstrating the quality and efficiency of the proposed data selection method. This analysis is crucial to evaluating the model’s sensitivity and effectiveness to the design choices made for the reward structure and training data.
read the caption
Figure 4: Left: Ablation on reward function; Right: Ablation on data selection method.

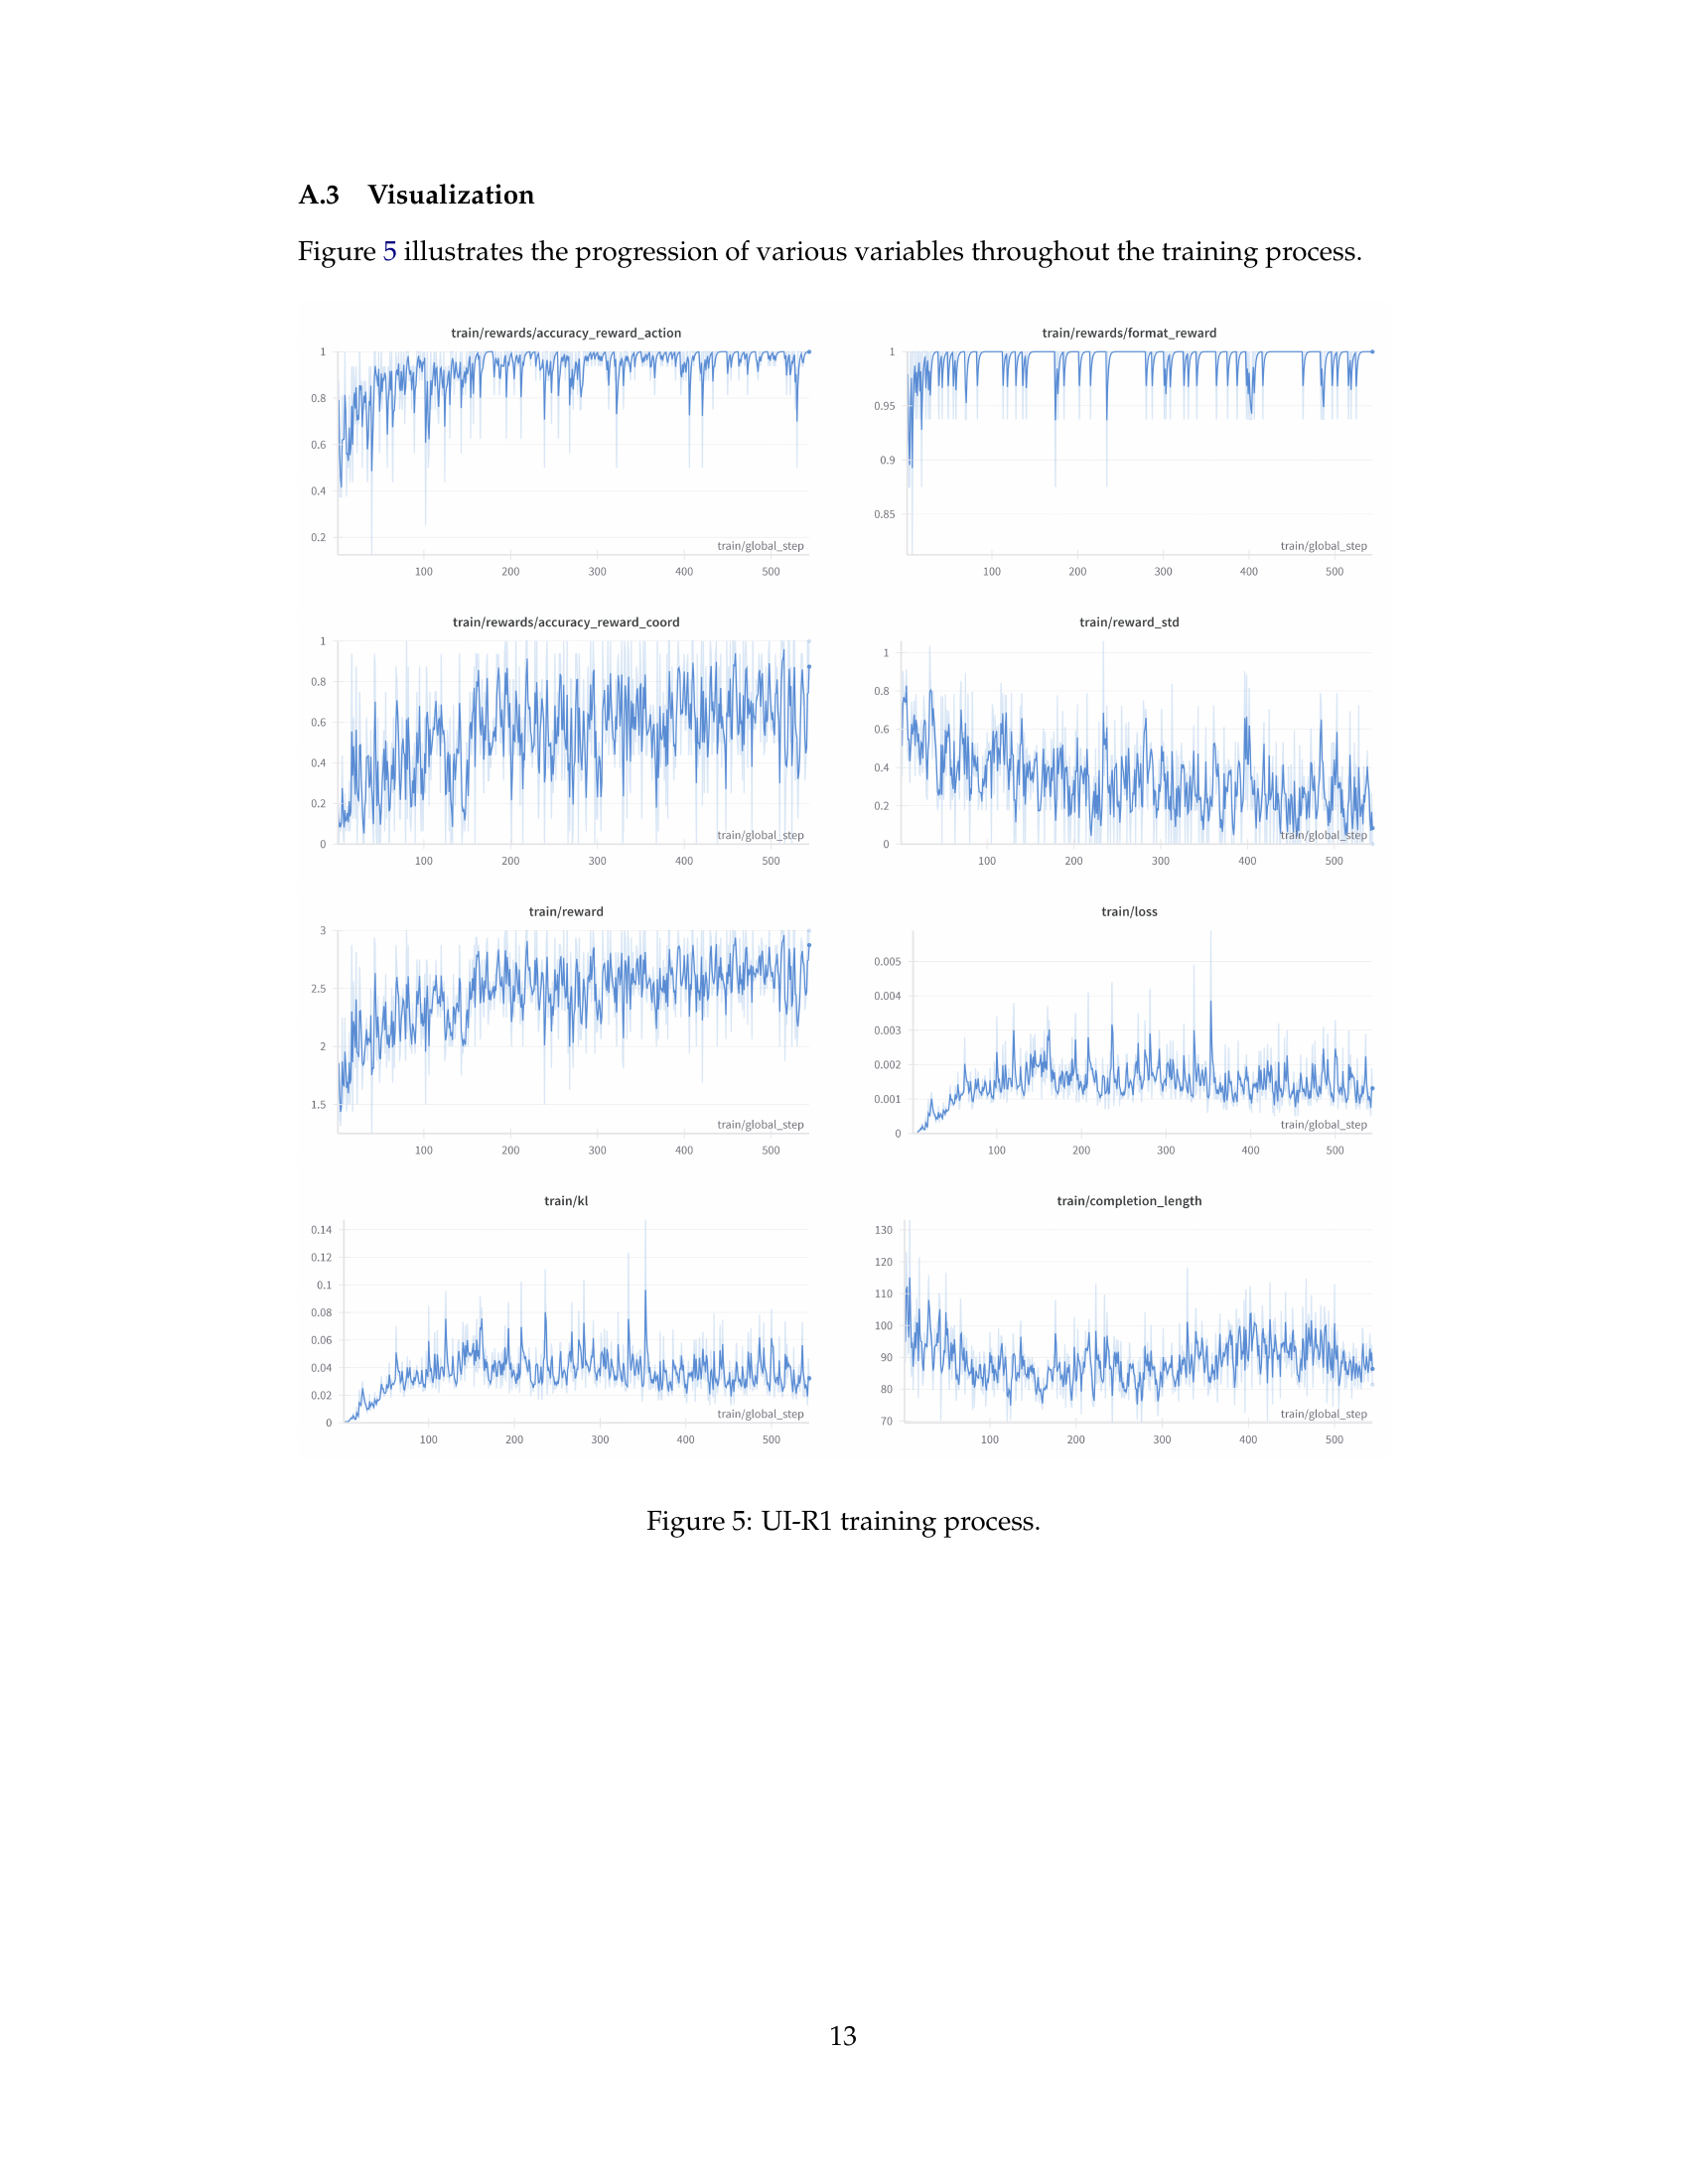
🔼 This figure visualizes the training progress of the UI-R1 model by plotting various metrics over training steps. These metrics include reward-related values (accuracy rewards for action and coordinates, format reward, reward standard deviation, total reward), loss, KL divergence, and completion length. The plots allow for observation of trends in these metrics throughout the training process, giving insights into the model’s learning dynamics.
read the caption
Figure 5: UI-R1 training process.

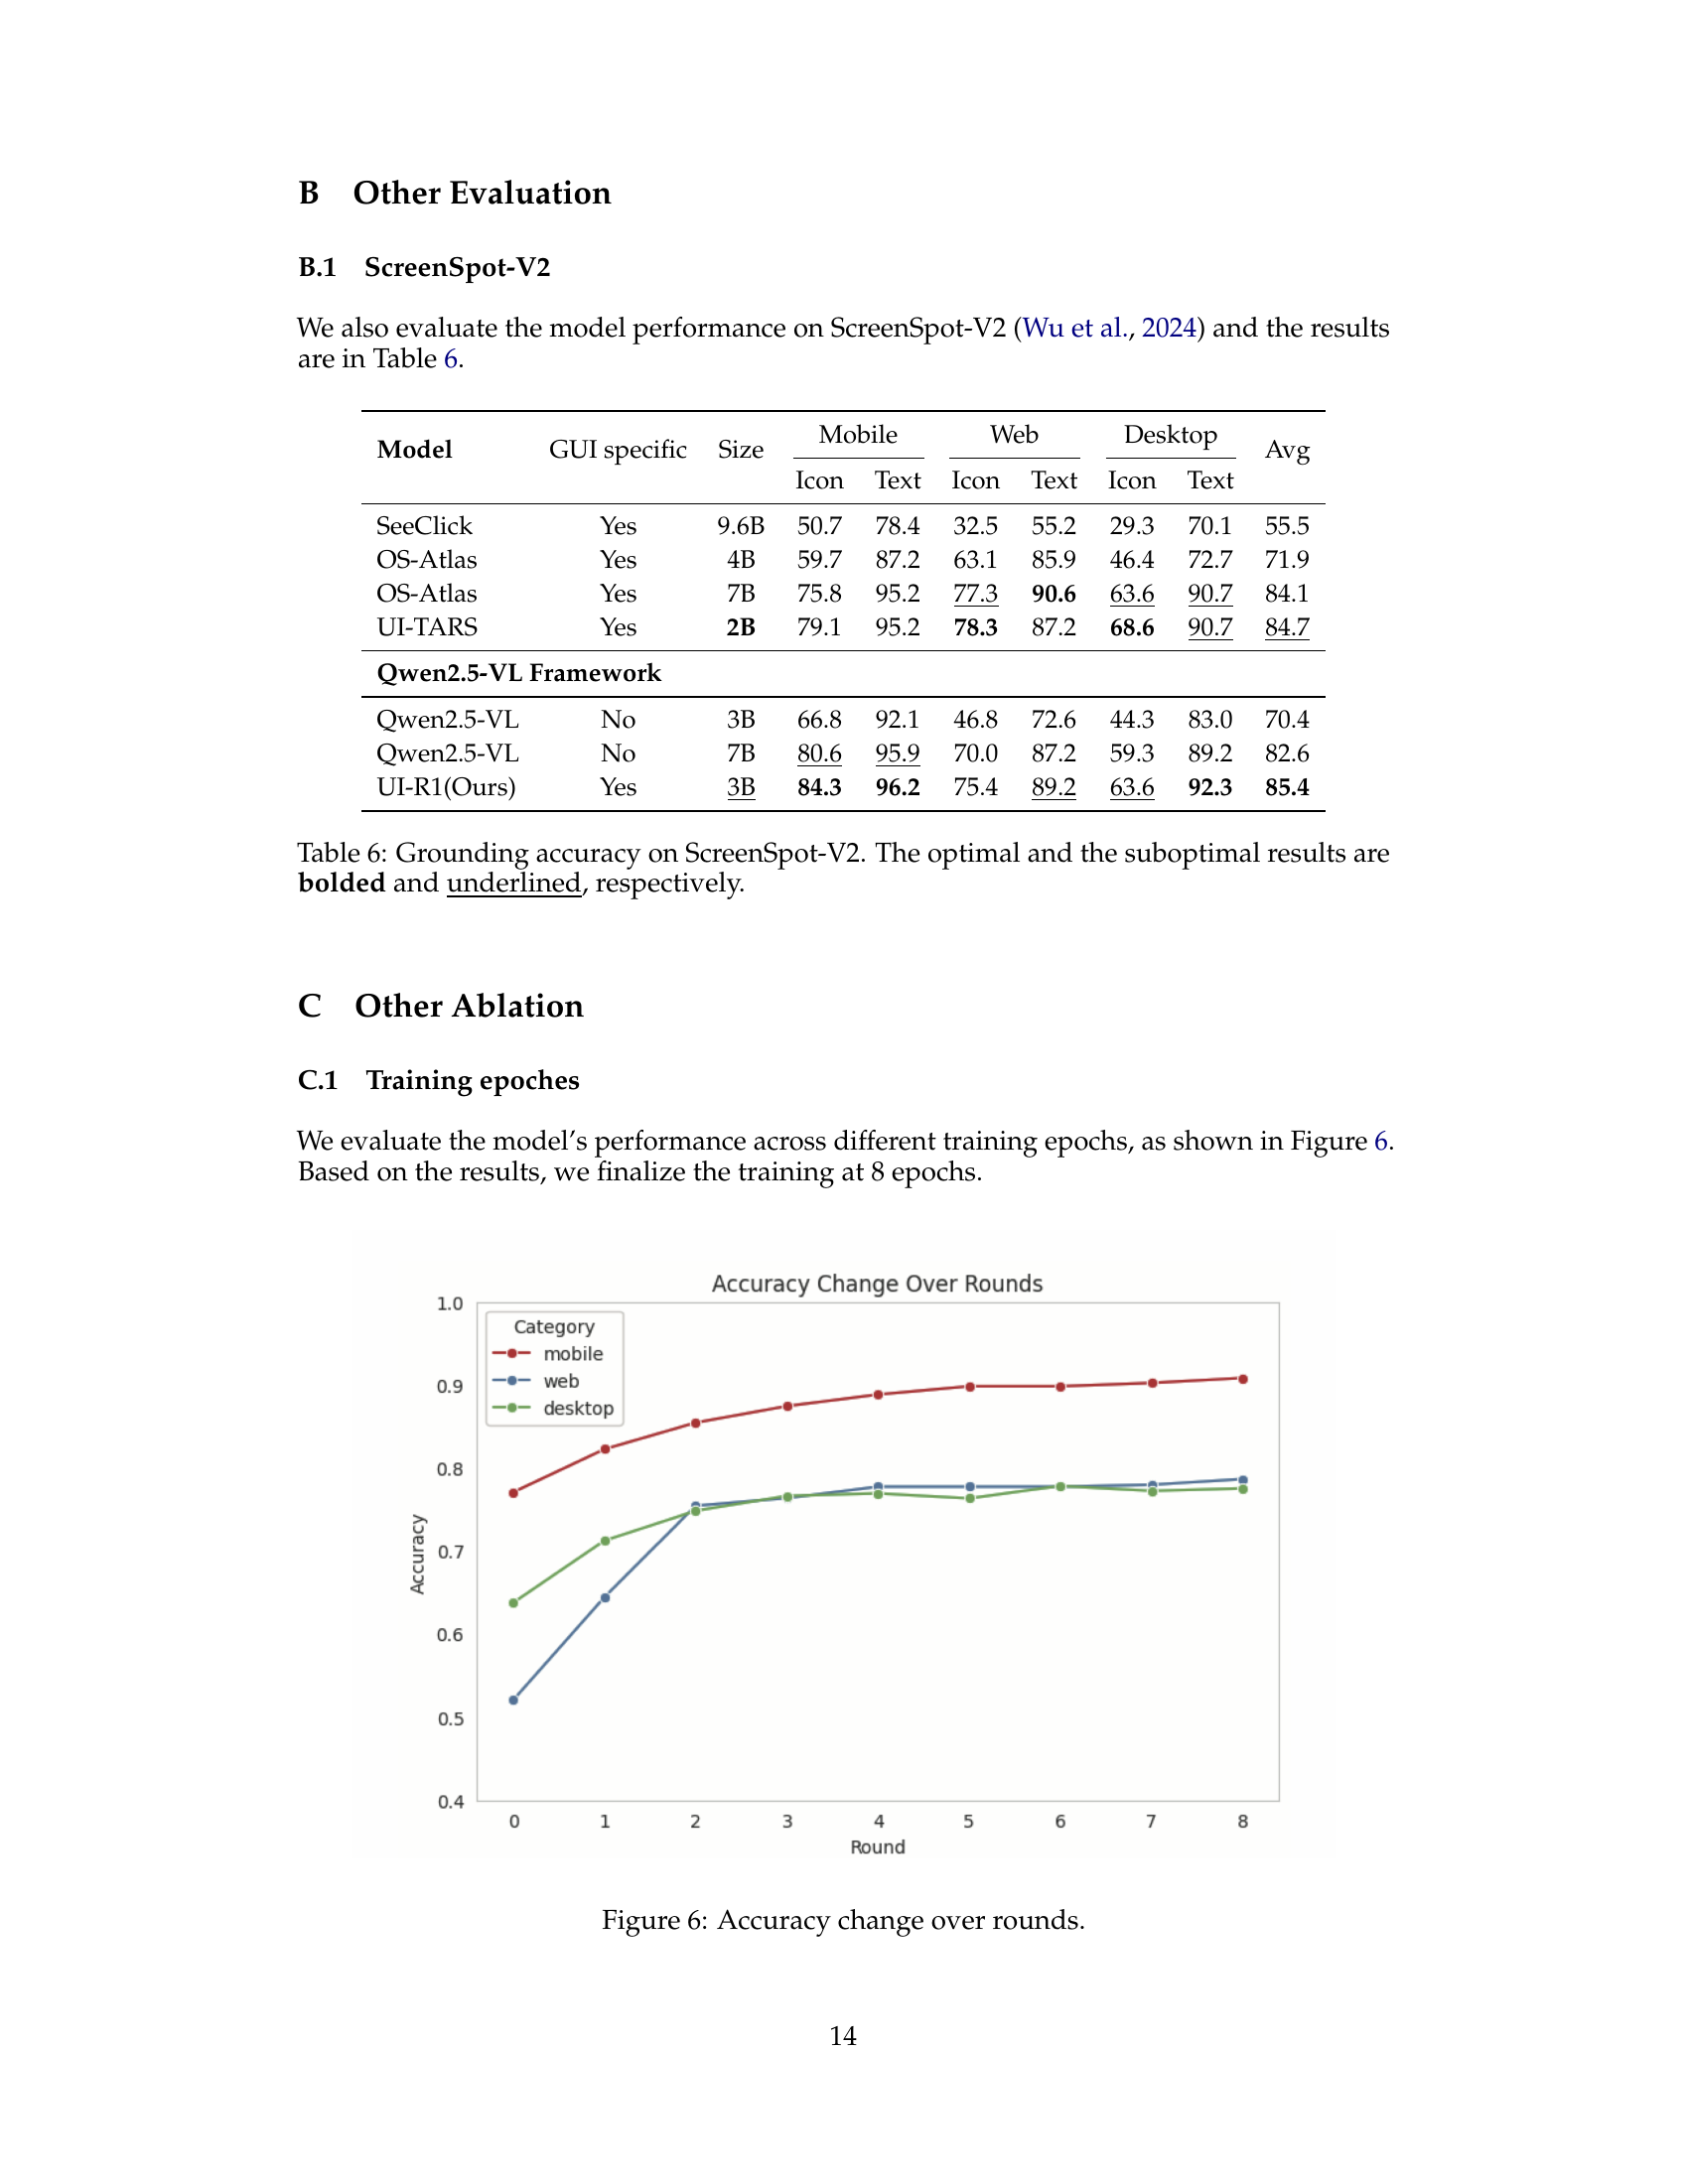
🔼 This figure shows how the accuracy of the model changes over training rounds. Separate lines represent accuracy on different subsets of the data (mobile, web, and desktop). The graph shows the model’s performance improves in all three subsets over eight training rounds, stabilizing by round 7 or 8.
read the caption
Figure 6: Accuracy change over rounds.

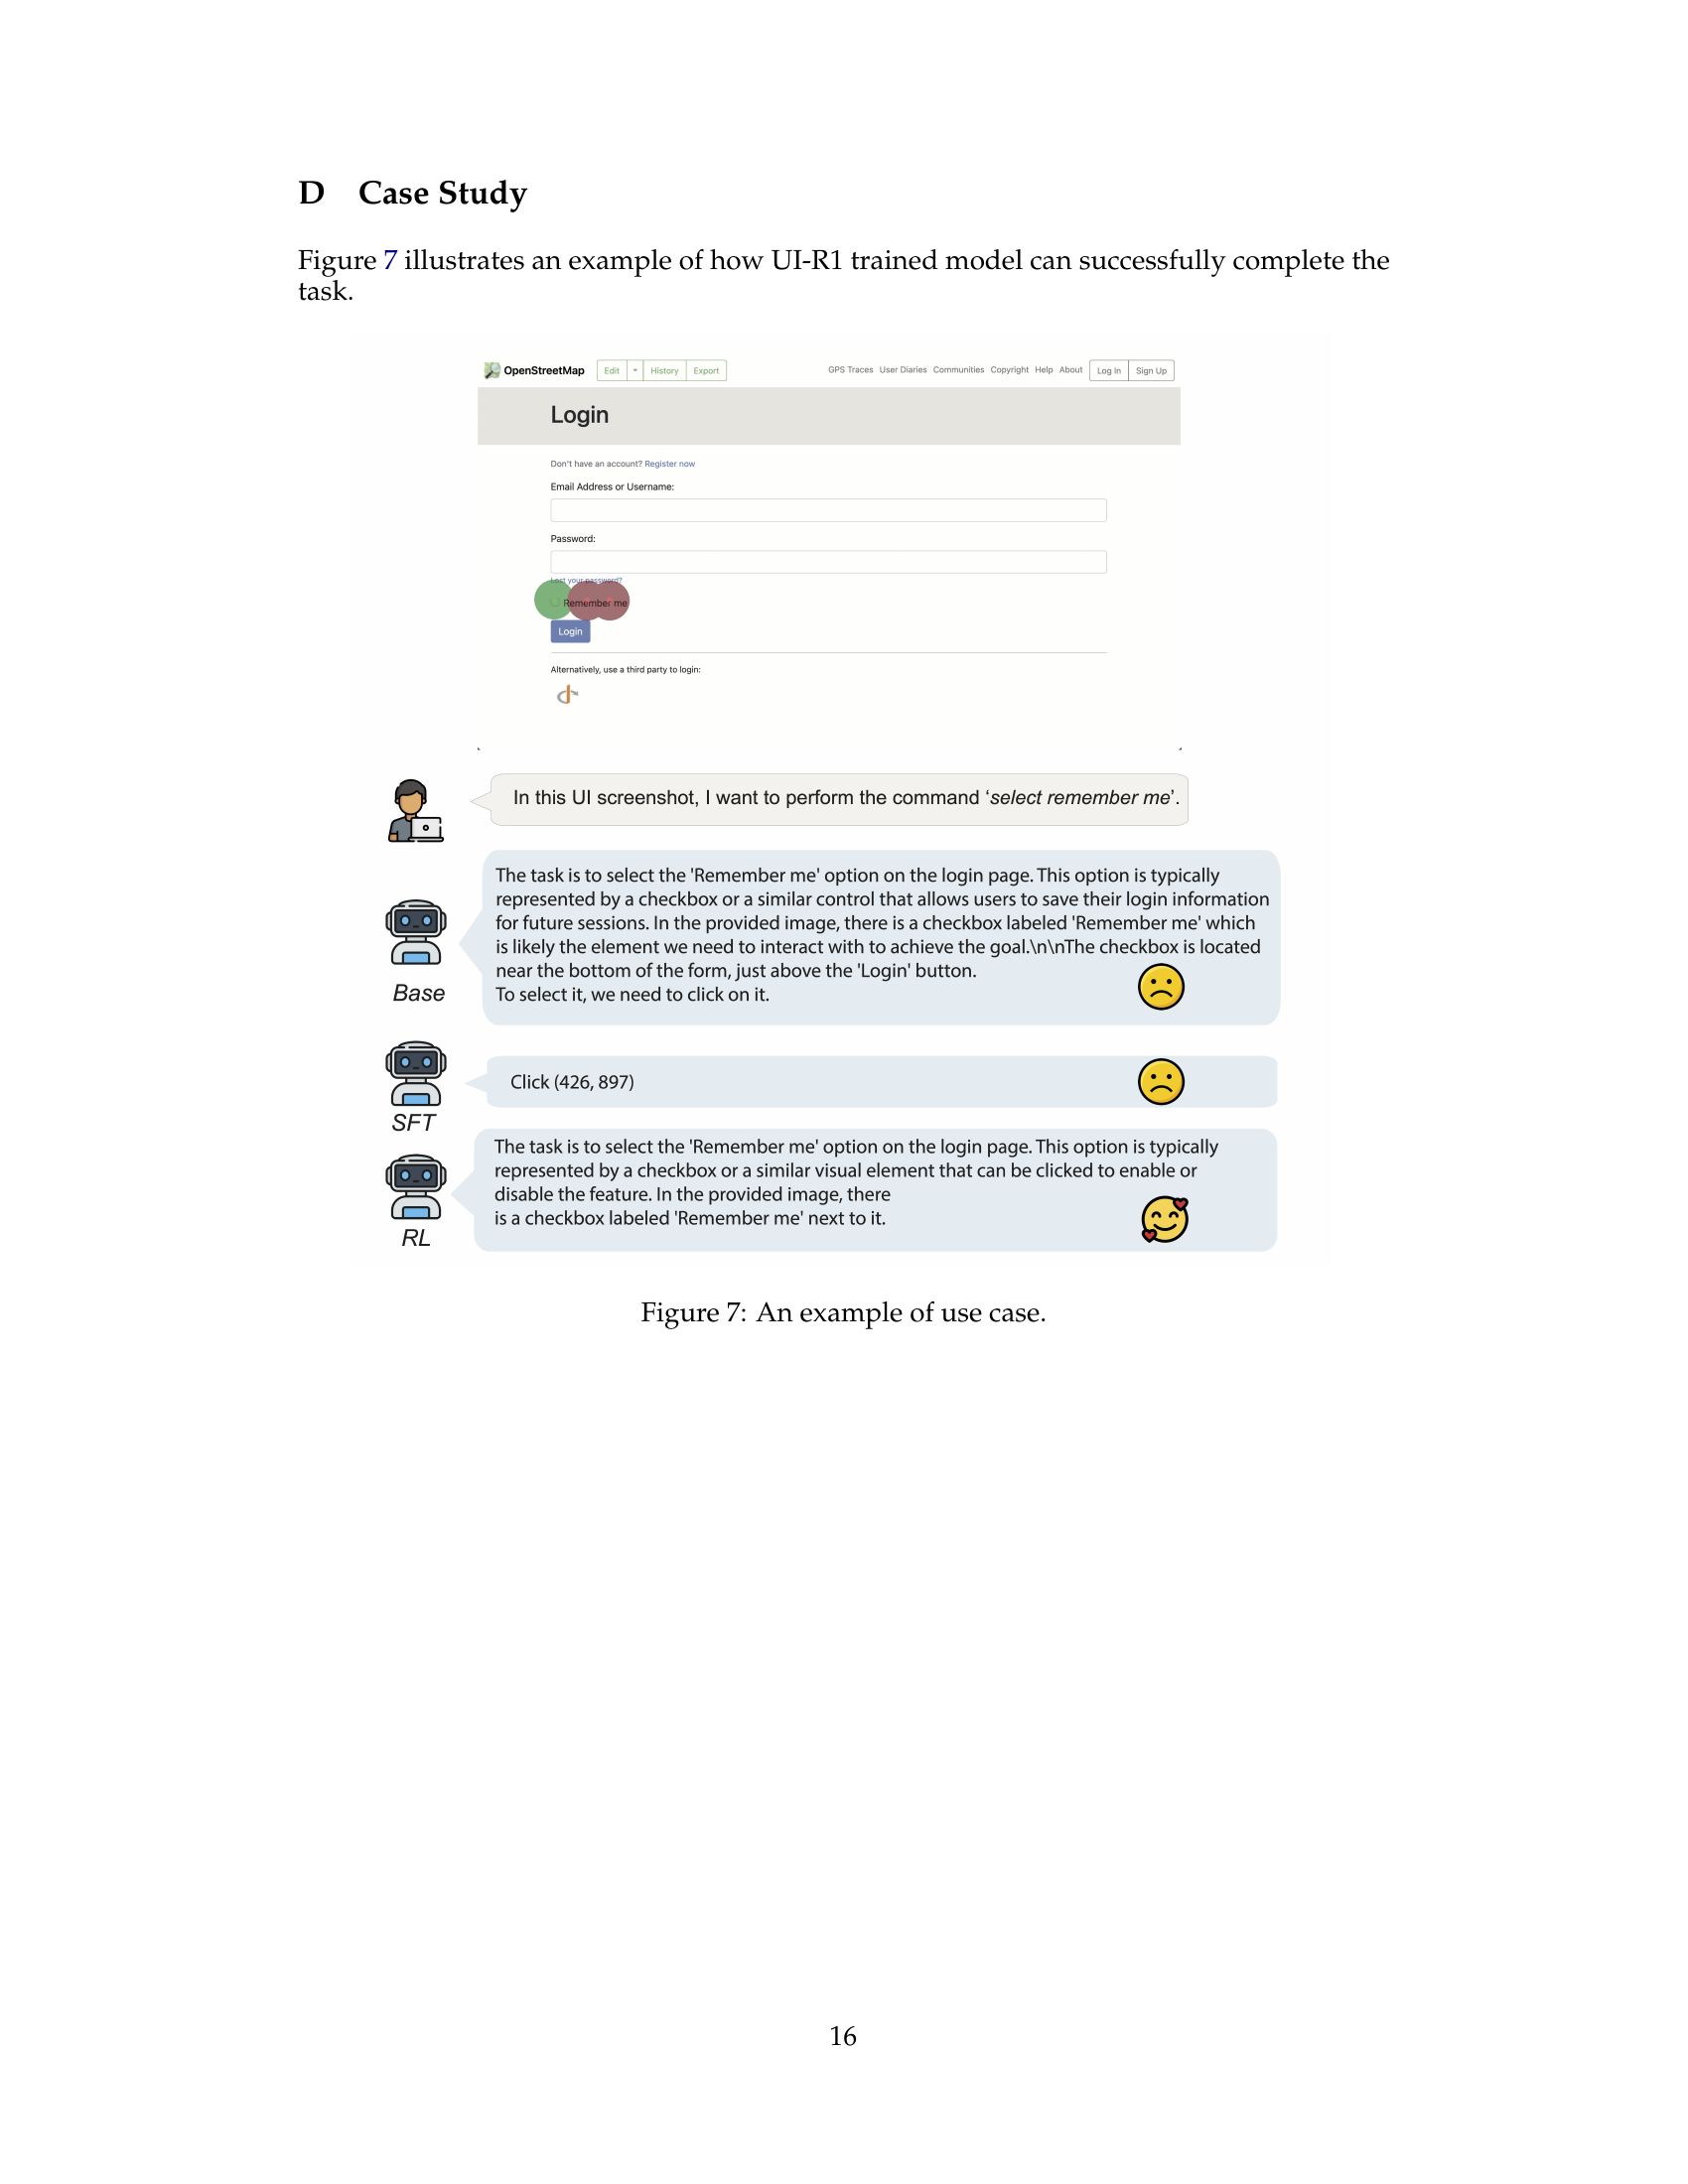
🔼 This figure showcases a practical example of the UI-R1 model’s capabilities. It presents a screenshot of a login page with a ‘Remember me’ checkbox. The text describes the task (selecting the checkbox), the model’s reasoning process (identifying the checkbox and its location), and the resulting action (clicking the checkbox’s coordinates). This demonstrates the model’s ability to understand user instructions, reason about the GUI elements, and execute the corresponding actions accurately.
read the caption
Figure 7: An example of use case.
More on tables
| Model | Development | Creative | CAD | Scientific | Office | OS | Avg | ||||||
| Text | Icon | Text | Icon | Text | Icon | Text | Icon | Text | Icon | Text | Icon | ||
| Supervised Fine-tuning | |||||||||||||
| SeeClick | 1.1 | ||||||||||||
| OS-Atlas-4B | 3.7 | ||||||||||||
| ShowUI-2B | 7.7 | ||||||||||||
| CogAgent-18B | 7.7 | ||||||||||||
| Aria-GUI | 4.7 | 11.3 | |||||||||||
| Qwen2.5-VL-3B* | 15.6 | 0.7 | 13.1 | 2.1 | 5.6 | 3.1 | 27.8 | 8.1 | 20.3 | 5.7 | 14.0 | 0.0 | 10.8 |
| UGround-7B | 26.6 | 14.2 | 17.8 | 16.5 | |||||||||
| Claude** | 3.9 | 3.4 | 14.5 | 15.8 | 4.5 | 17.1 | |||||||
| OS-Atlas-7B | 33.1 | 4.7 | 37.5 | 27.1 | 4.5 | 18.9 | |||||||
| Zero Shot / Reinforcement Fine-tuning | |||||||||||||
| Qwen-VL-7B | 0.1 | ||||||||||||
| GPT-4o | 0.8 | ||||||||||||
| Qwen2-VL-7B | 1.6 | ||||||||||||
| Qwen2.5-VL-3B | 14.9 | 2.1 | 20.2 | 1.4 | 4.1 | 4.7 | 34.0 | 7.3 | 22.0 | 3.8 | 6.5 | 2.2 | 11.8 |
| UI-R1-3B | 22.7 | 4.1 | 27.3 | 3.5 | 11.2 | 6.3 | 42.4 | 11.8 | 32.2 | 11.3 | 13.1 | 4.5 | 17.8 |
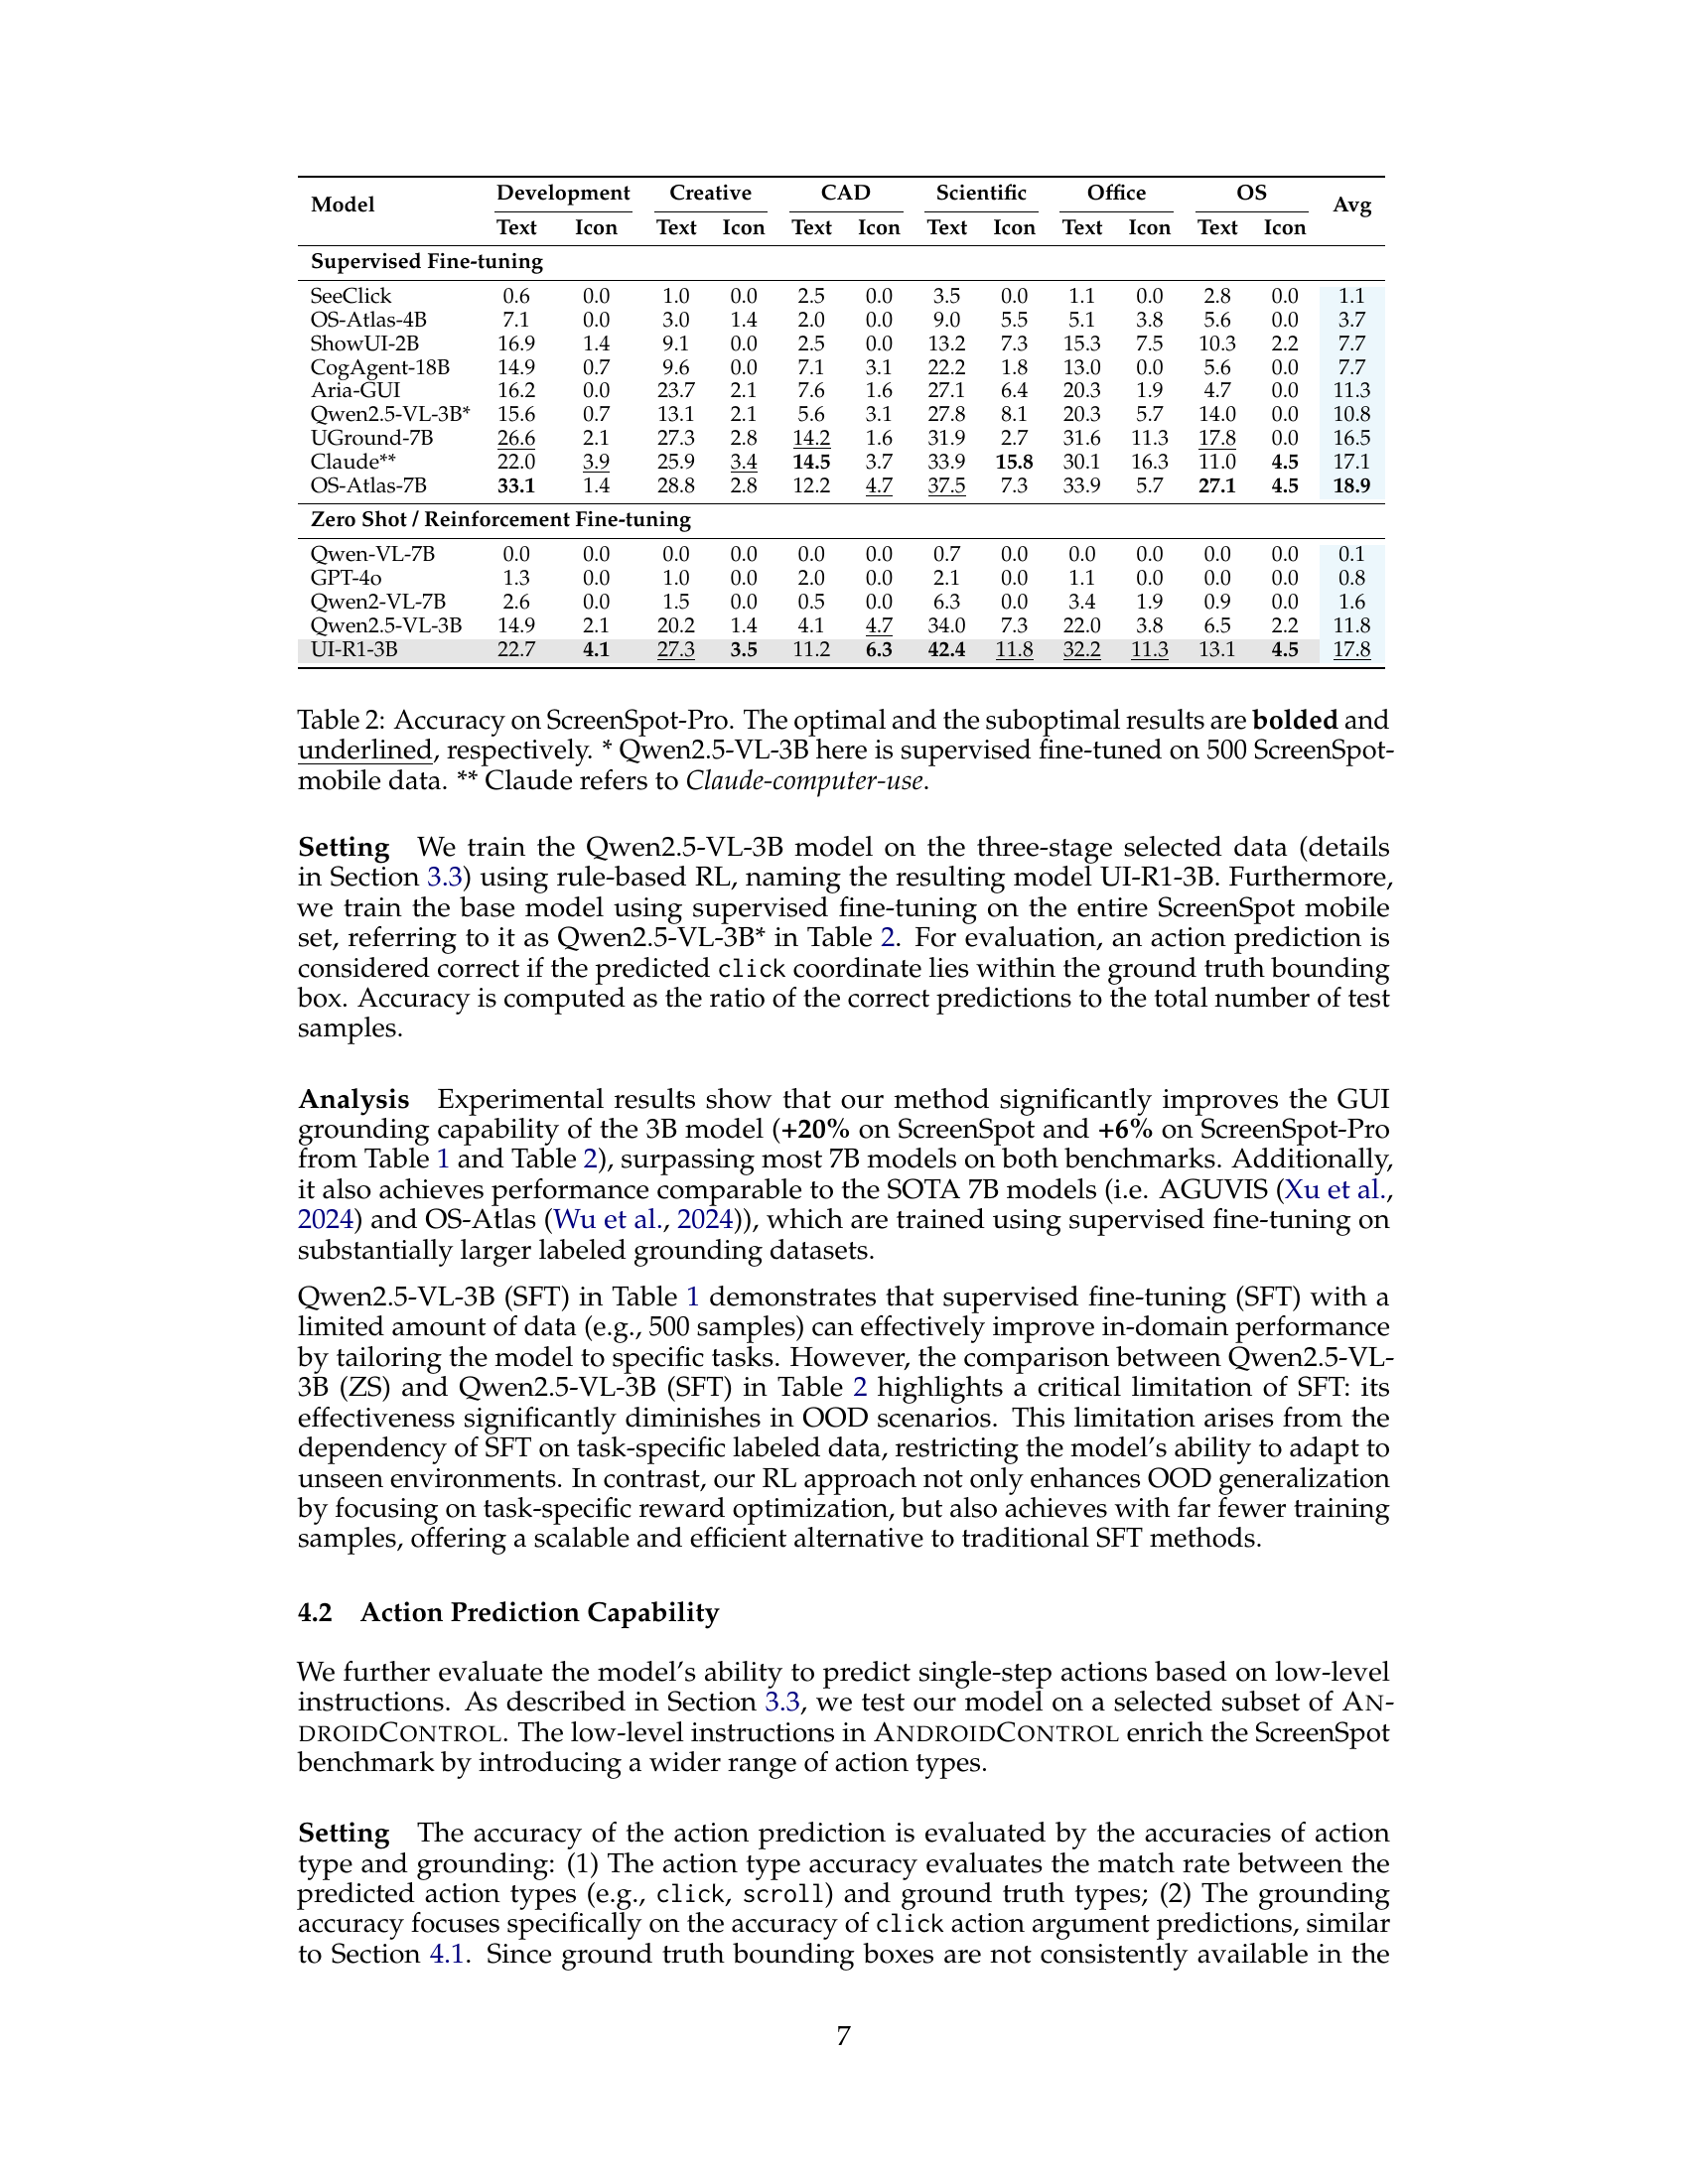
🔼 This table presents the performance comparison of various models on the ScreenSpot-Pro benchmark, focusing on GUI grounding accuracy. It includes models trained using supervised fine-tuning (SFT) and reinforcement learning (RL), indicating the performance of each model across different categories (Development, Creative, CAD, Scientific, Office, OS, and average). The table highlights the superior performance of the UI-R1-3B model, a data-efficient model trained using rule-based reinforcement learning, which surpasses larger models trained with supervised methods. The model Qwen2.5-VL-3B* uses supervised fine-tuning on a subset of the ScreenSpot-mobile data (500 samples). The results are detailed per task category and then averaged. The best and second-best performing models within each category are highlighted.
read the caption
Table 2: Accuracy on ScreenSpot-Pro. The optimal and the suboptimal results are bolded and underlined, respectively. * Qwen2.5-VL-3B here is supervised fine-tuned on 500 ScreenSpot-mobile data. ** Claude refers to Claude-computer-use.
| Model | Method | Model size | Data size | Type | Grounding | Average |
|---|---|---|---|---|---|---|
| Supervised Fine-tuning | ||||||
| SeeClick | SFT | 9.6B | 76K | 93.0 | 73.4 | 83.2 |
| InternVL-2 | SFT | 4B | 76K | 90.9 | 84.1 | 87.5 |
| GUIPivot-Qwen | SFT | 7B | 76K | 96.8 | 75.1 | 86.0 |
| OS-Atlas | SFT | 4B | 76K | 91.9 | 83.8 | 87.8 |
| OS-Atlas | SFT | 7B | 76K | 93.6 | 88.0 | 90.8 |
| Zero Shot / Reinforcement Fine-tuning | ||||||
| GPT-4o | ZS | – | 0 | 74.3 | 38.7 | 56.5 |
| OS-Atlas | ZS | 4B | 0 | 64.6 | 71.2 | 67.9 |
| OS-Atlas | ZS | 7B | 0 | 73.0 | 73.4 | 73.2 |
| Qwen2.5-VL | ZS | 3B | 0 | 79.3 | 72.3 | 75.8 |
| UI-R1 | RFT | 3B | 136 | 94.3 | 82.6 | 88.5 |
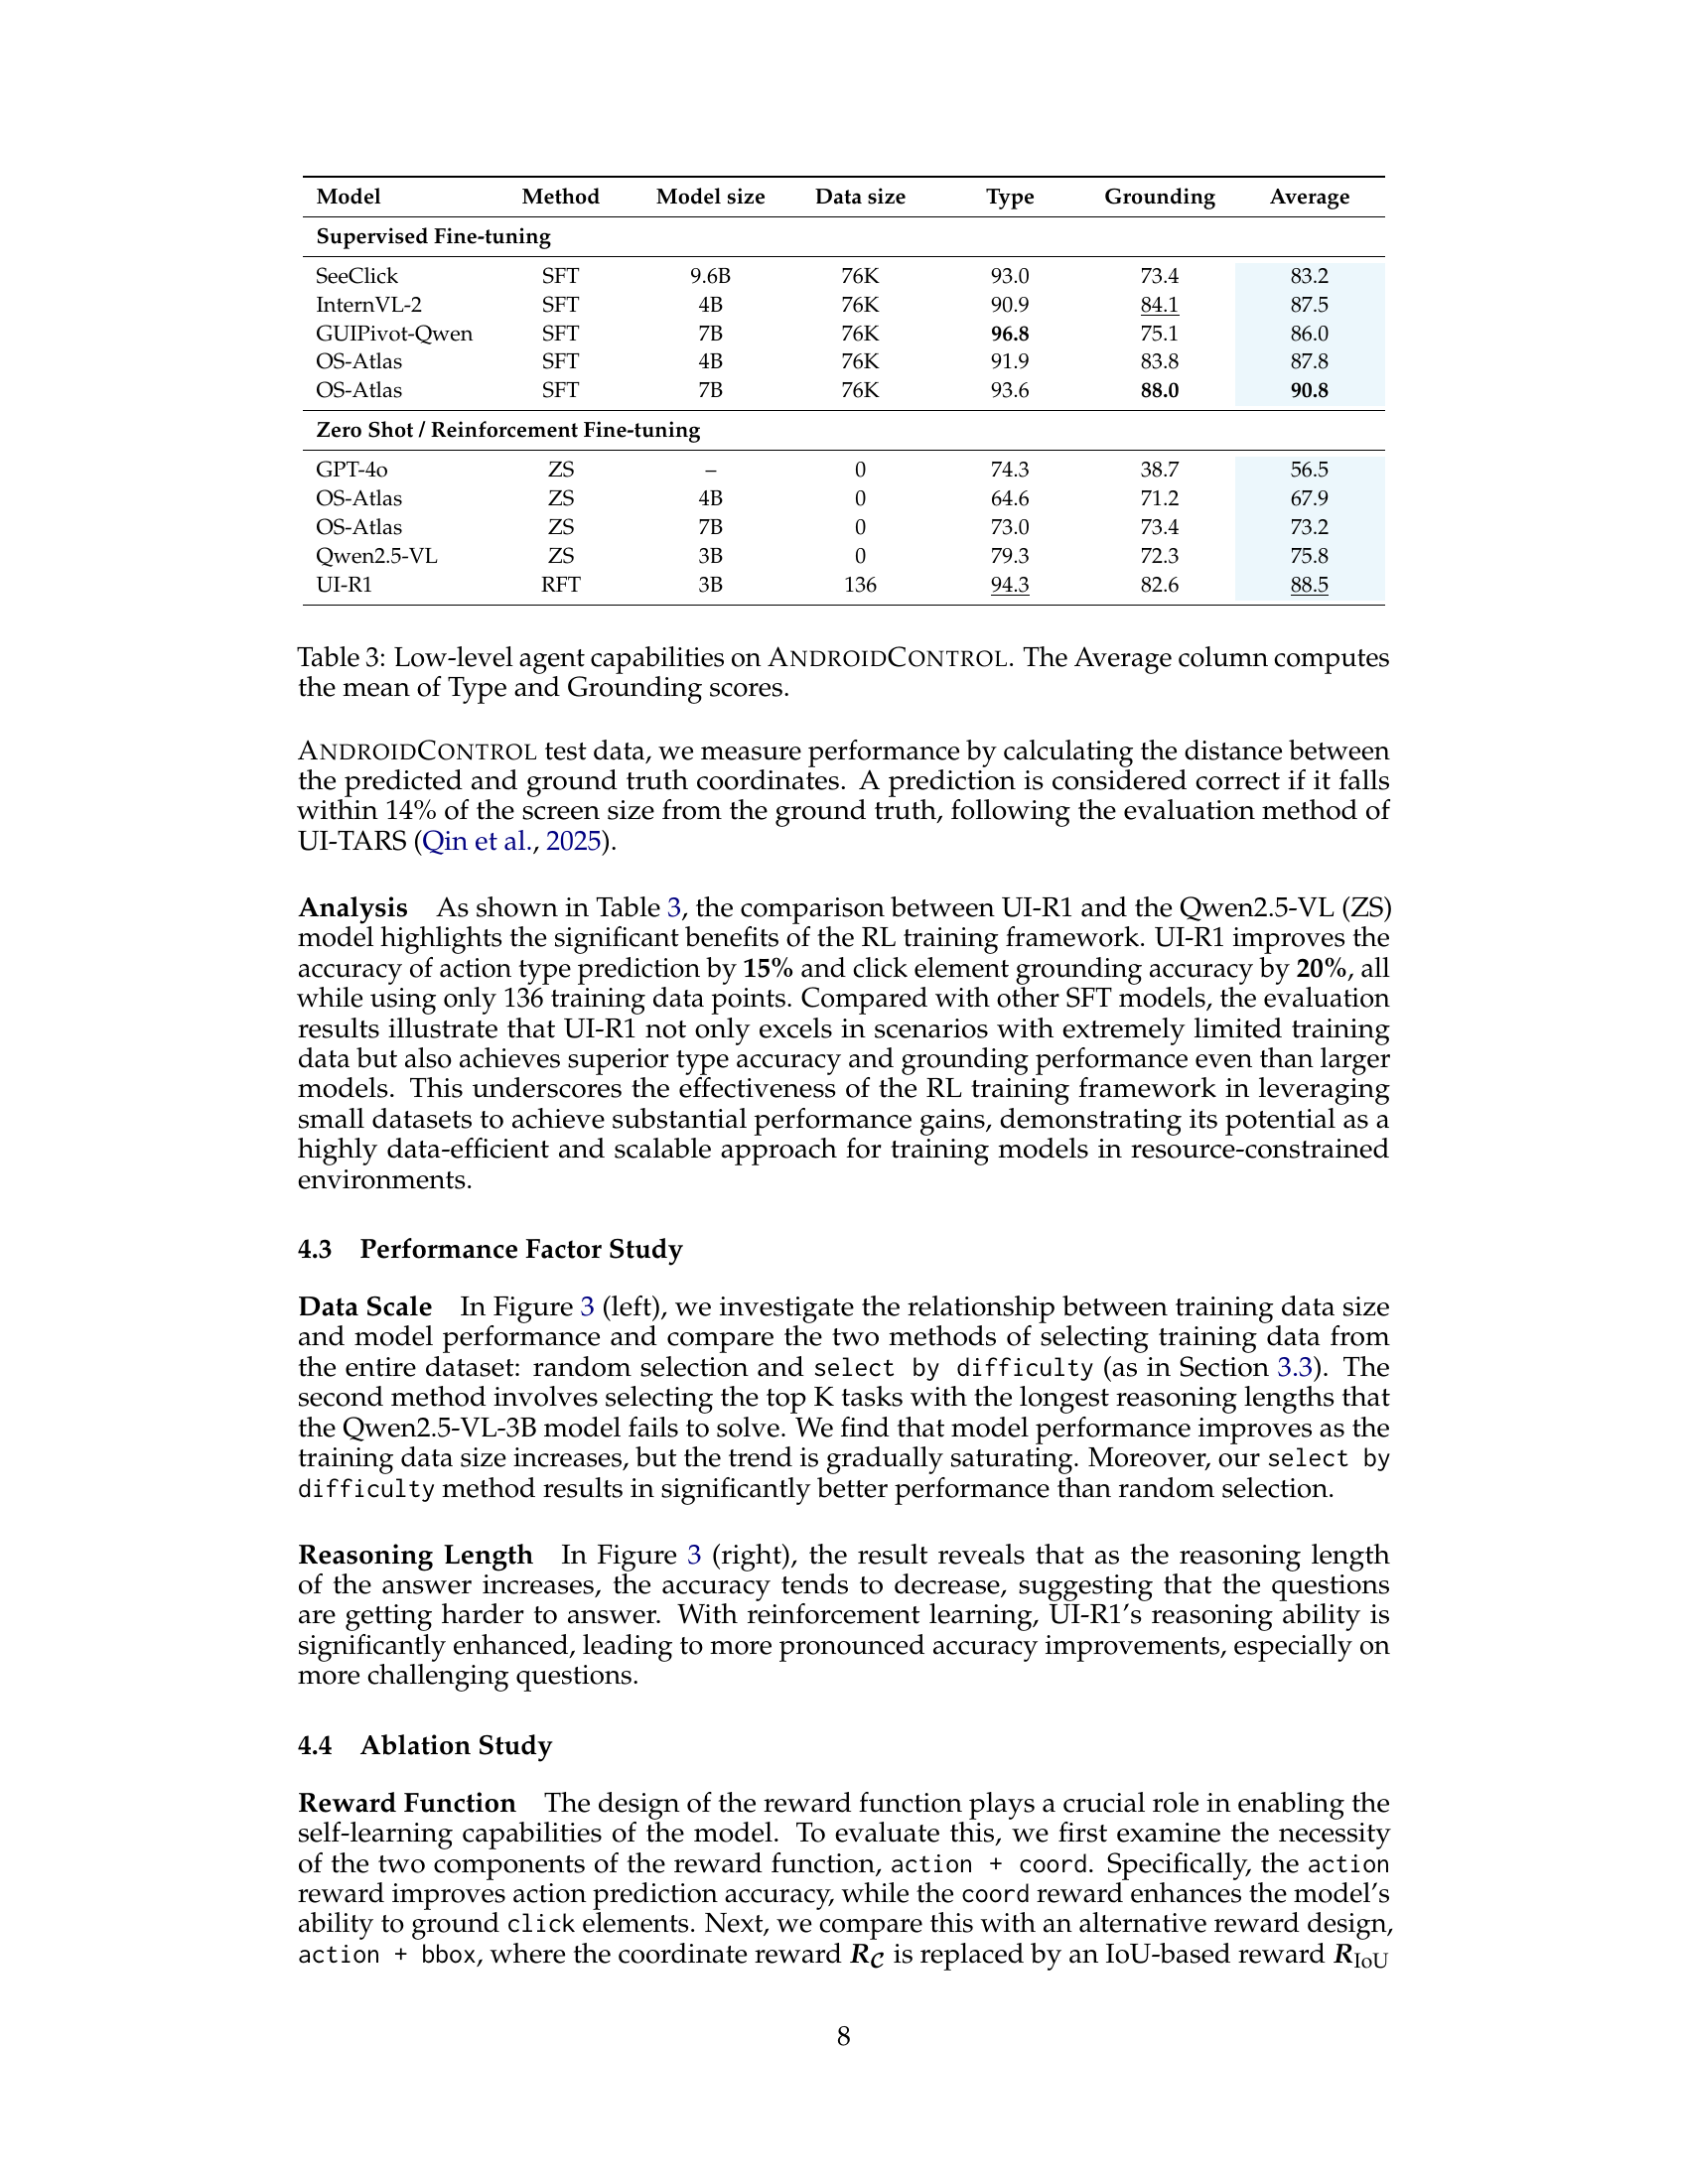
🔼 This table presents a quantitative evaluation of the UI-R1 model’s performance on low-level GUI action prediction tasks within the AndroidControl benchmark. It compares UI-R1’s performance against several other models, both with supervised fine-tuning (SFT) and zero-shot (ZS) approaches. The metrics reported include the accuracy of predicting the action type (e.g., click, scroll) and the accuracy of the grounding (specifically, the location of the click action). The ‘Average’ column provides a combined score representing the overall performance across both metrics. This allows for a comprehensive comparison of the effectiveness of different model training methods on these specific tasks, highlighting UI-R1’s ability in low-level action prediction.
read the caption
Table 3: Low-level agent capabilities on AndroidControl. The Average column computes the mean of Type and Grounding scores.
| Hyperparameter | Value |
|---|---|
| lr | from 9.98e-7 to 0 |
| max_pixels | 12845056 |
| num_generations | 8 |
| num_train_epochs | 8 |
| max_prompt_length | 1024 |
| per_device_train_batch_size | 1 |
| gradient_accumulation_steps | 2 |
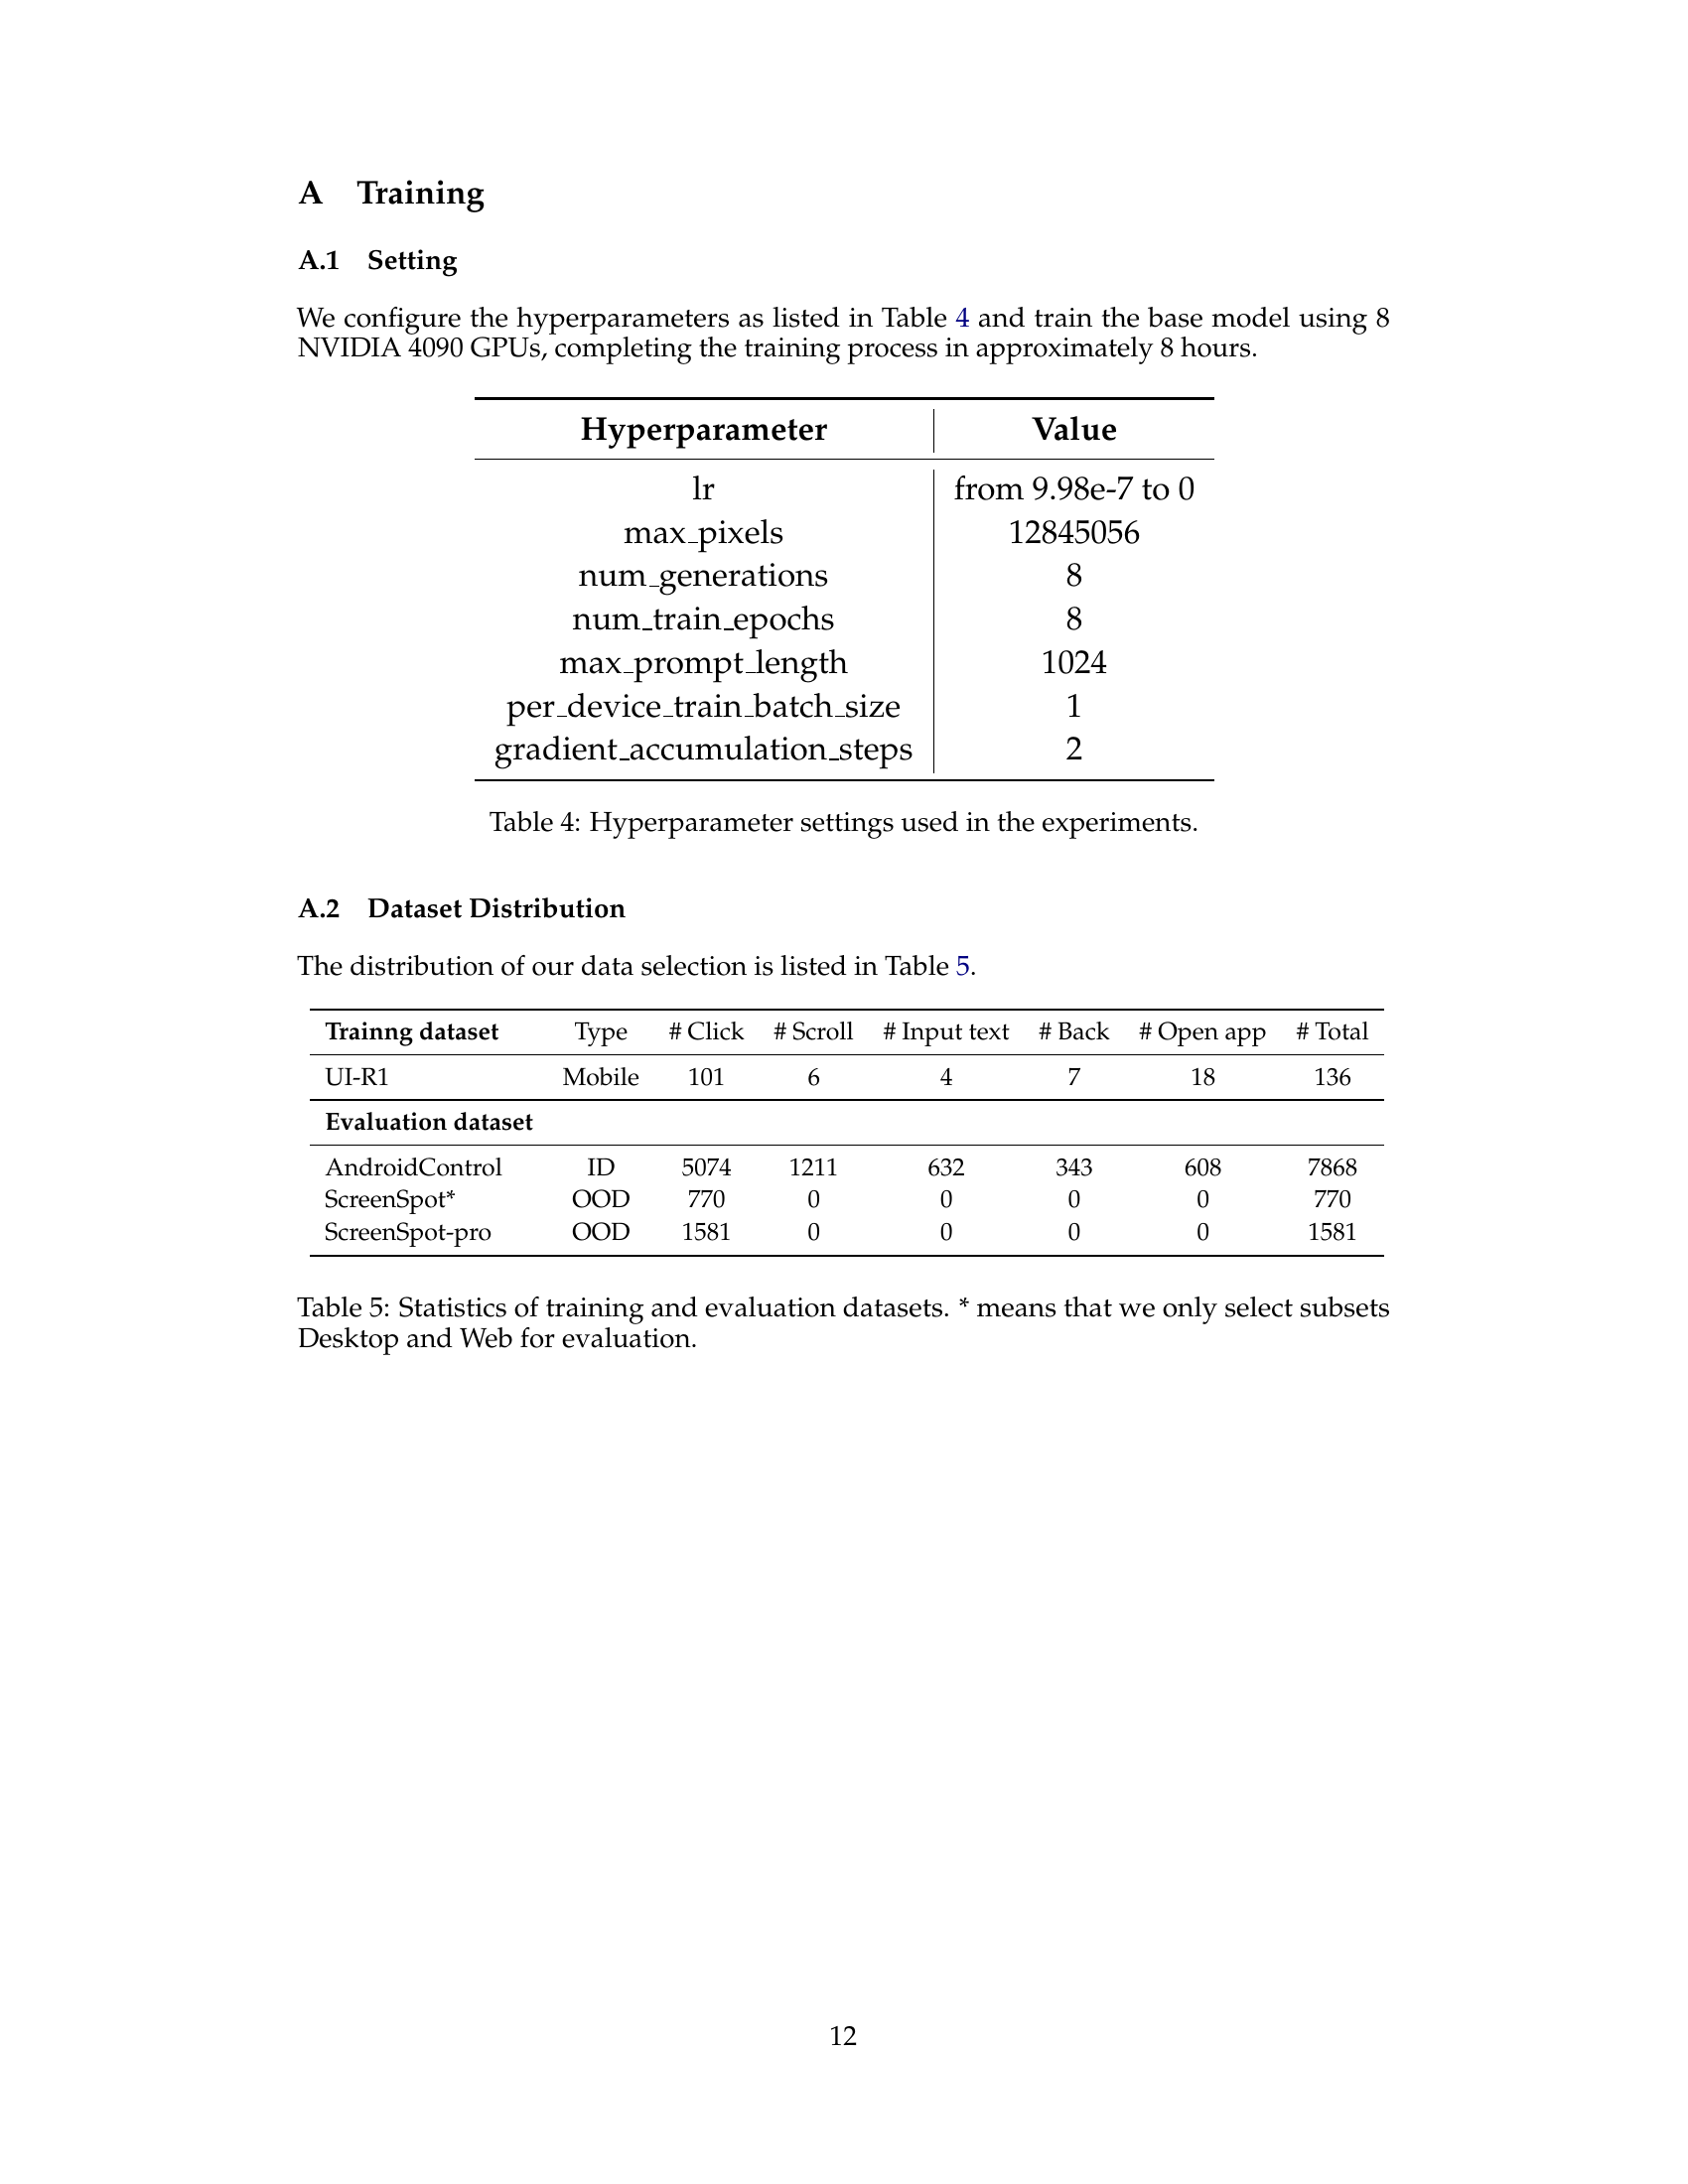
🔼 This table lists the hyperparameters used in training the UI-R1 model and their corresponding values. The hyperparameters control various aspects of the reinforcement learning process, such as the learning rate (lr), the maximum number of pixels considered in images (max_pixels), the number of response generations (num_generations), the number of training epochs (num_train_epochs), the maximum prompt length, and parameters controlling batch size and gradient accumulation.
read the caption
Table 4: Hyperparameter settings used in the experiments.
| Trainng dataset | Type | # Click | # Scroll | # Input text | # Back | # Open app | # Total |
|---|---|---|---|---|---|---|---|
| UI-R1 | Mobile | 101 | 6 | 4 | 7 | 18 | 136 |
| Evaluation dataset | |||||||
| AndroidControl | ID | 5074 | 1211 | 632 | 343 | 608 | 7868 |
| ScreenSpot* | OOD | 770 | 0 | 0 | 0 | 0 | 770 |
| ScreenSpot-pro | OOD | 1581 | 0 | 0 | 0 | 0 | 1581 |
🔼 This table presents a breakdown of the dataset used in the UI-R1 model training and evaluation. It details the number of samples for each action type (Click, Scroll, Input Text, Back, Open App) within the training dataset (UI-R1 Mobile) and the evaluation datasets (AndroidControl ID, ScreenSpot OOD, and ScreenSpot-Pro OOD). Importantly, the asterisk (*) indicates that for the ScreenSpot evaluation, only the Desktop and Web subsets were used, not the complete dataset.
read the caption
Table 5: Statistics of training and evaluation datasets. * means that we only select subsets Desktop and Web for evaluation.
| Model | GUI specific | Size | Mobile | Web | Desktop | Avg | |||
|---|---|---|---|---|---|---|---|---|---|
| Icon | Text | Icon | Text | Icon | Text | ||||
| SeeClick | Yes | 9.6B | 50.7 | 78.4 | 32.5 | 55.2 | 29.3 | 70.1 | 55.5 |
| OS-Atlas | Yes | 4B | 59.7 | 87.2 | 63.1 | 85.9 | 46.4 | 72.7 | 71.9 |
| OS-Atlas | Yes | 7B | 75.8 | 95.2 | 77.3 | 90.6 | 63.6 | 90.7 | 84.1 |
| UI-TARS | Yes | 2B | 79.1 | 95.2 | 78.3 | 87.2 | 68.6 | 90.7 | 84.7 |
| Qwen2.5-VL Framework | |||||||||
| Qwen2.5-VL | No | 3B | 66.8 | 92.1 | 46.8 | 72.6 | 44.3 | 83.0 | 70.4 |
| Qwen2.5-VL | No | 7B | 80.6 | 95.9 | 70.0 | 87.2 | 59.3 | 89.2 | 82.6 |
| UI-R1(Ours) | Yes | 3B | 84.3 | 96.2 | 75.4 | 89.2 | 63.6 | 92.3 | 85.4 |
🔼 Table 6 presents the grounding accuracy results on the ScreenSpot-V2 benchmark. It compares the performance of different models, including SeeClick, OS-Atlas (both 4B and 7B versions), UI-TARS, and the proposed UI-R1 model. The table shows the accuracy for each model on various subsets of the ScreenSpot-V2 dataset (Mobile, Web, and Desktop) and considers two separate metrics: Icon and Text grounding accuracy. The best and second-best performance for each subset are highlighted with bolding and underlining. The ‘GUI Specific’ column indicates whether the model was specifically designed for GUI tasks. The results provide insights into the effectiveness of different model architectures and training paradigms for GUI grounding.
read the caption
Table 6: Grounding accuracy on ScreenSpot-V2. The optimal and the suboptimal results are bolded and underlined, respectively.
| max_pixels | Mobile | Web | Desktop | Avg | |
|---|---|---|---|---|---|
| Train | Test | ||||
| 3211264 | 3211264 | 91.2 | 76.1 | 76.6 | 82.2 |
| 3211264 | 12845056 | 90.8 | 76.8 | 76.6 | 82.3 |
| 12845056 | 3211264 | 89.6 | 78.0 | 77.8 | 82.5 |
| 12845056 | 12845056 | 90.8 | 79.6 | 77.2 | 83.4 |
🔼 This table presents the results of an ablation study on the impact of the
max_pixelshyperparameter on the model’s performance. The study examines different settings formax_pixelsduring both training and inference phases, using four different combinations. The table shows the effect of these settings on the model’s accuracy across three different GUI types (Mobile, Web, Desktop) and provides an average accuracy across all types. This helps determine the optimal configuration for balancing model performance and resource consumption (memory).read the caption
Table 7: Ablation of max pixels in the training and inference.
Full paper#