TL;DR#
Key Takeaways#
Why does it matter?#
This work introduces VBench 2.0, a comprehensive benchmark to evaluate intrinsic video generation faithfulness. It will assist researchers to develop better video generation models. The standardized framework enables objective comparisons, driving advancements in this exciting field and facilitating the creation of more realistic and useful AI systems.
Visual Insights#
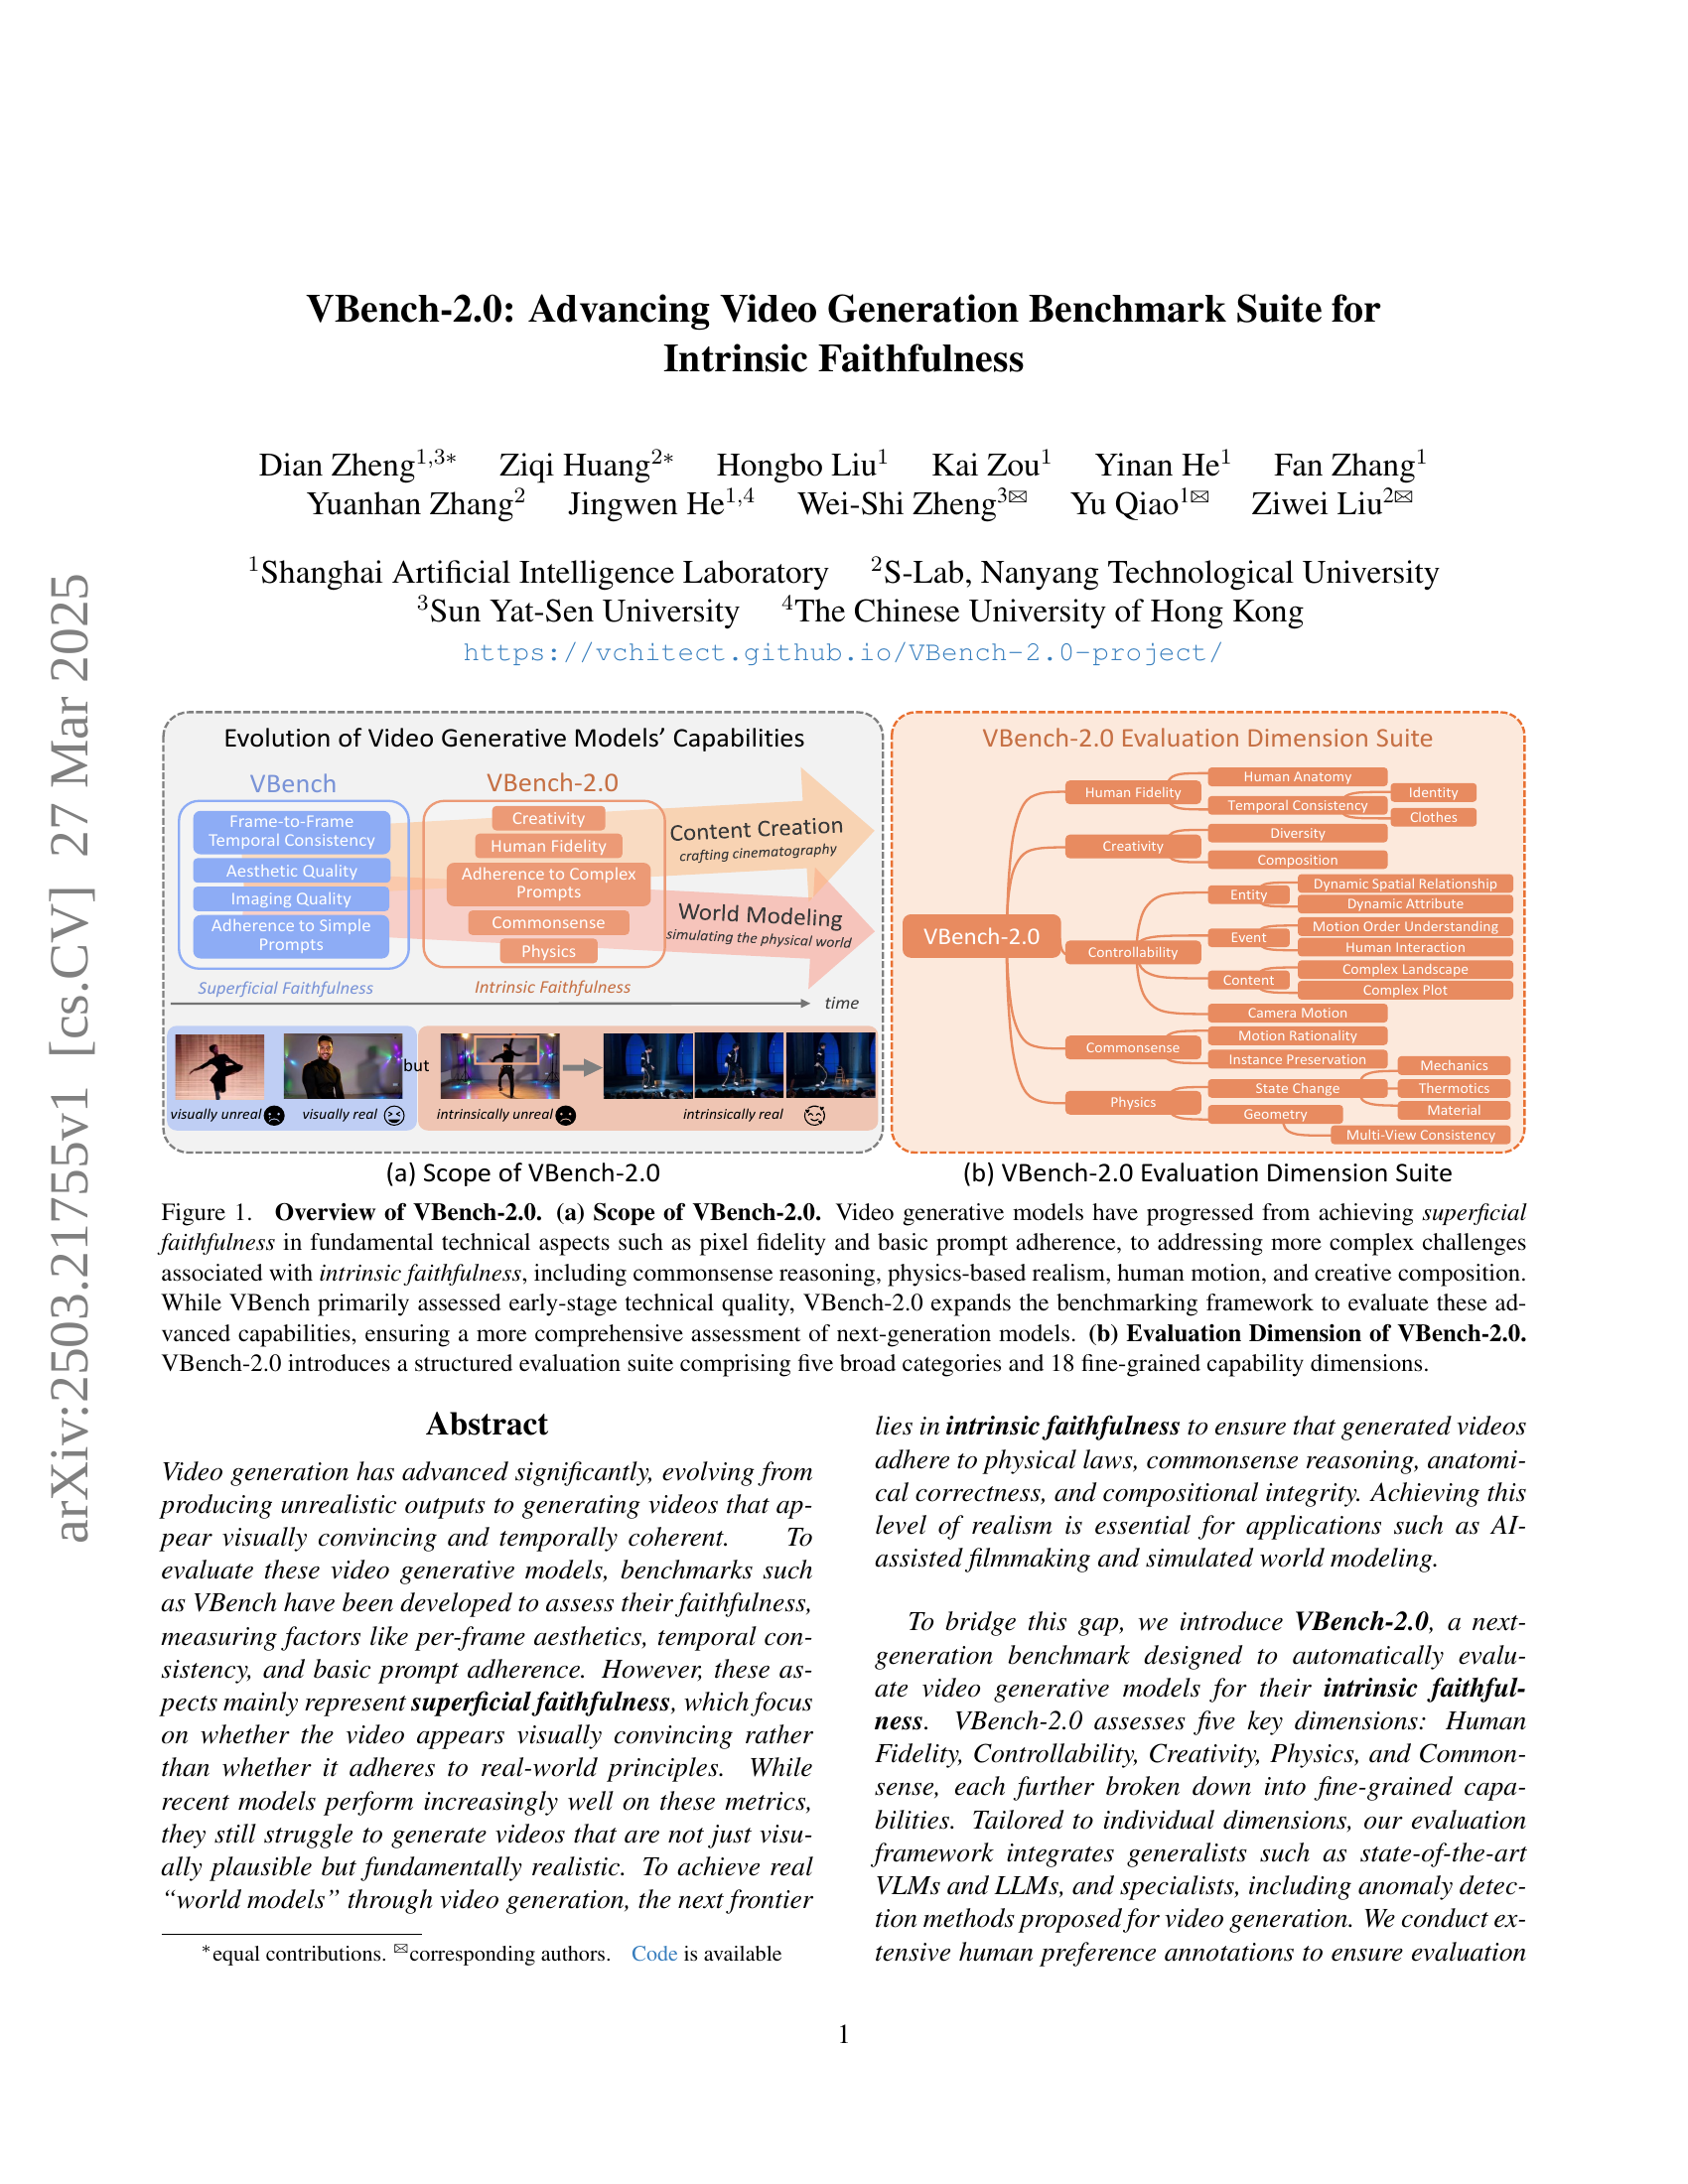
🔼 Figure 1 illustrates the evolution of video generation benchmarks, focusing on VBench-2.0. Panel (a) shows the advancement of video generative models from superficial faithfulness (achieving visual realism without adhering to real-world physics) to intrinsic faithfulness (demonstrating both visual and conceptual realism, encompassing commonsense reasoning and adherence to physical laws). It highlights how VBench-2.0 expands upon its predecessor (VBench) by including more complex criteria. Panel (b) presents the structured evaluation suite of VBench-2.0, which contains 5 high-level categories and 18 fine-grained capability dimensions for a more comprehensive assessment of video generation models.
read the caption
Figure 1: Overview of VBench-2.0. (a) Scope of VBench-2.0. Video generative models have progressed from achieving superficial faithfulness in fundamental technical aspects such as pixel fidelity and basic prompt adherence, to addressing more complex challenges associated with intrinsic faithfulness, including commonsense reasoning, physics-based realism, human motion, and creative composition. While VBench primarily assessed early-stage technical quality, VBench-2.0 expands the benchmarking framework to evaluate these advanced capabilities, ensuring a more comprehensive assessment of next-generation models. (b) Evaluation Dimension of VBench-2.0. VBench-2.0 introduces a structured evaluation suite comprising five broad categories and 18 fine-grained capability dimensions.
| Superficial Faithfulness | Intrinsic Faithfulness | |||||||
| \CenterstackFrame | ||||||||
| \CenterstackTemp | ||||||||
| \CenterstackSimp | ||||||||
| \CenterstackComp | ||||||||
| \CenterstackCom | ||||||||
| \CenterstackPhy | \CenterstackHuman | |||||||
| \CenterstackCplx | Anat | |||||||
| Pmpt | ||||||||
| VBench [32, 33] | ✓ | ✓ | ✓ | |||||
| T2V-CompBench [66] | ✓ | ✓ | ✓ | |||||
| PhyGenBench [49] | ✓ | |||||||
| StoryEval [81] | ✓ | ✓ | ||||||
| VBench-2.0 (Ours) | ✓ | ✓ | ✓ | ✓ | ✓ | ✓ | ||
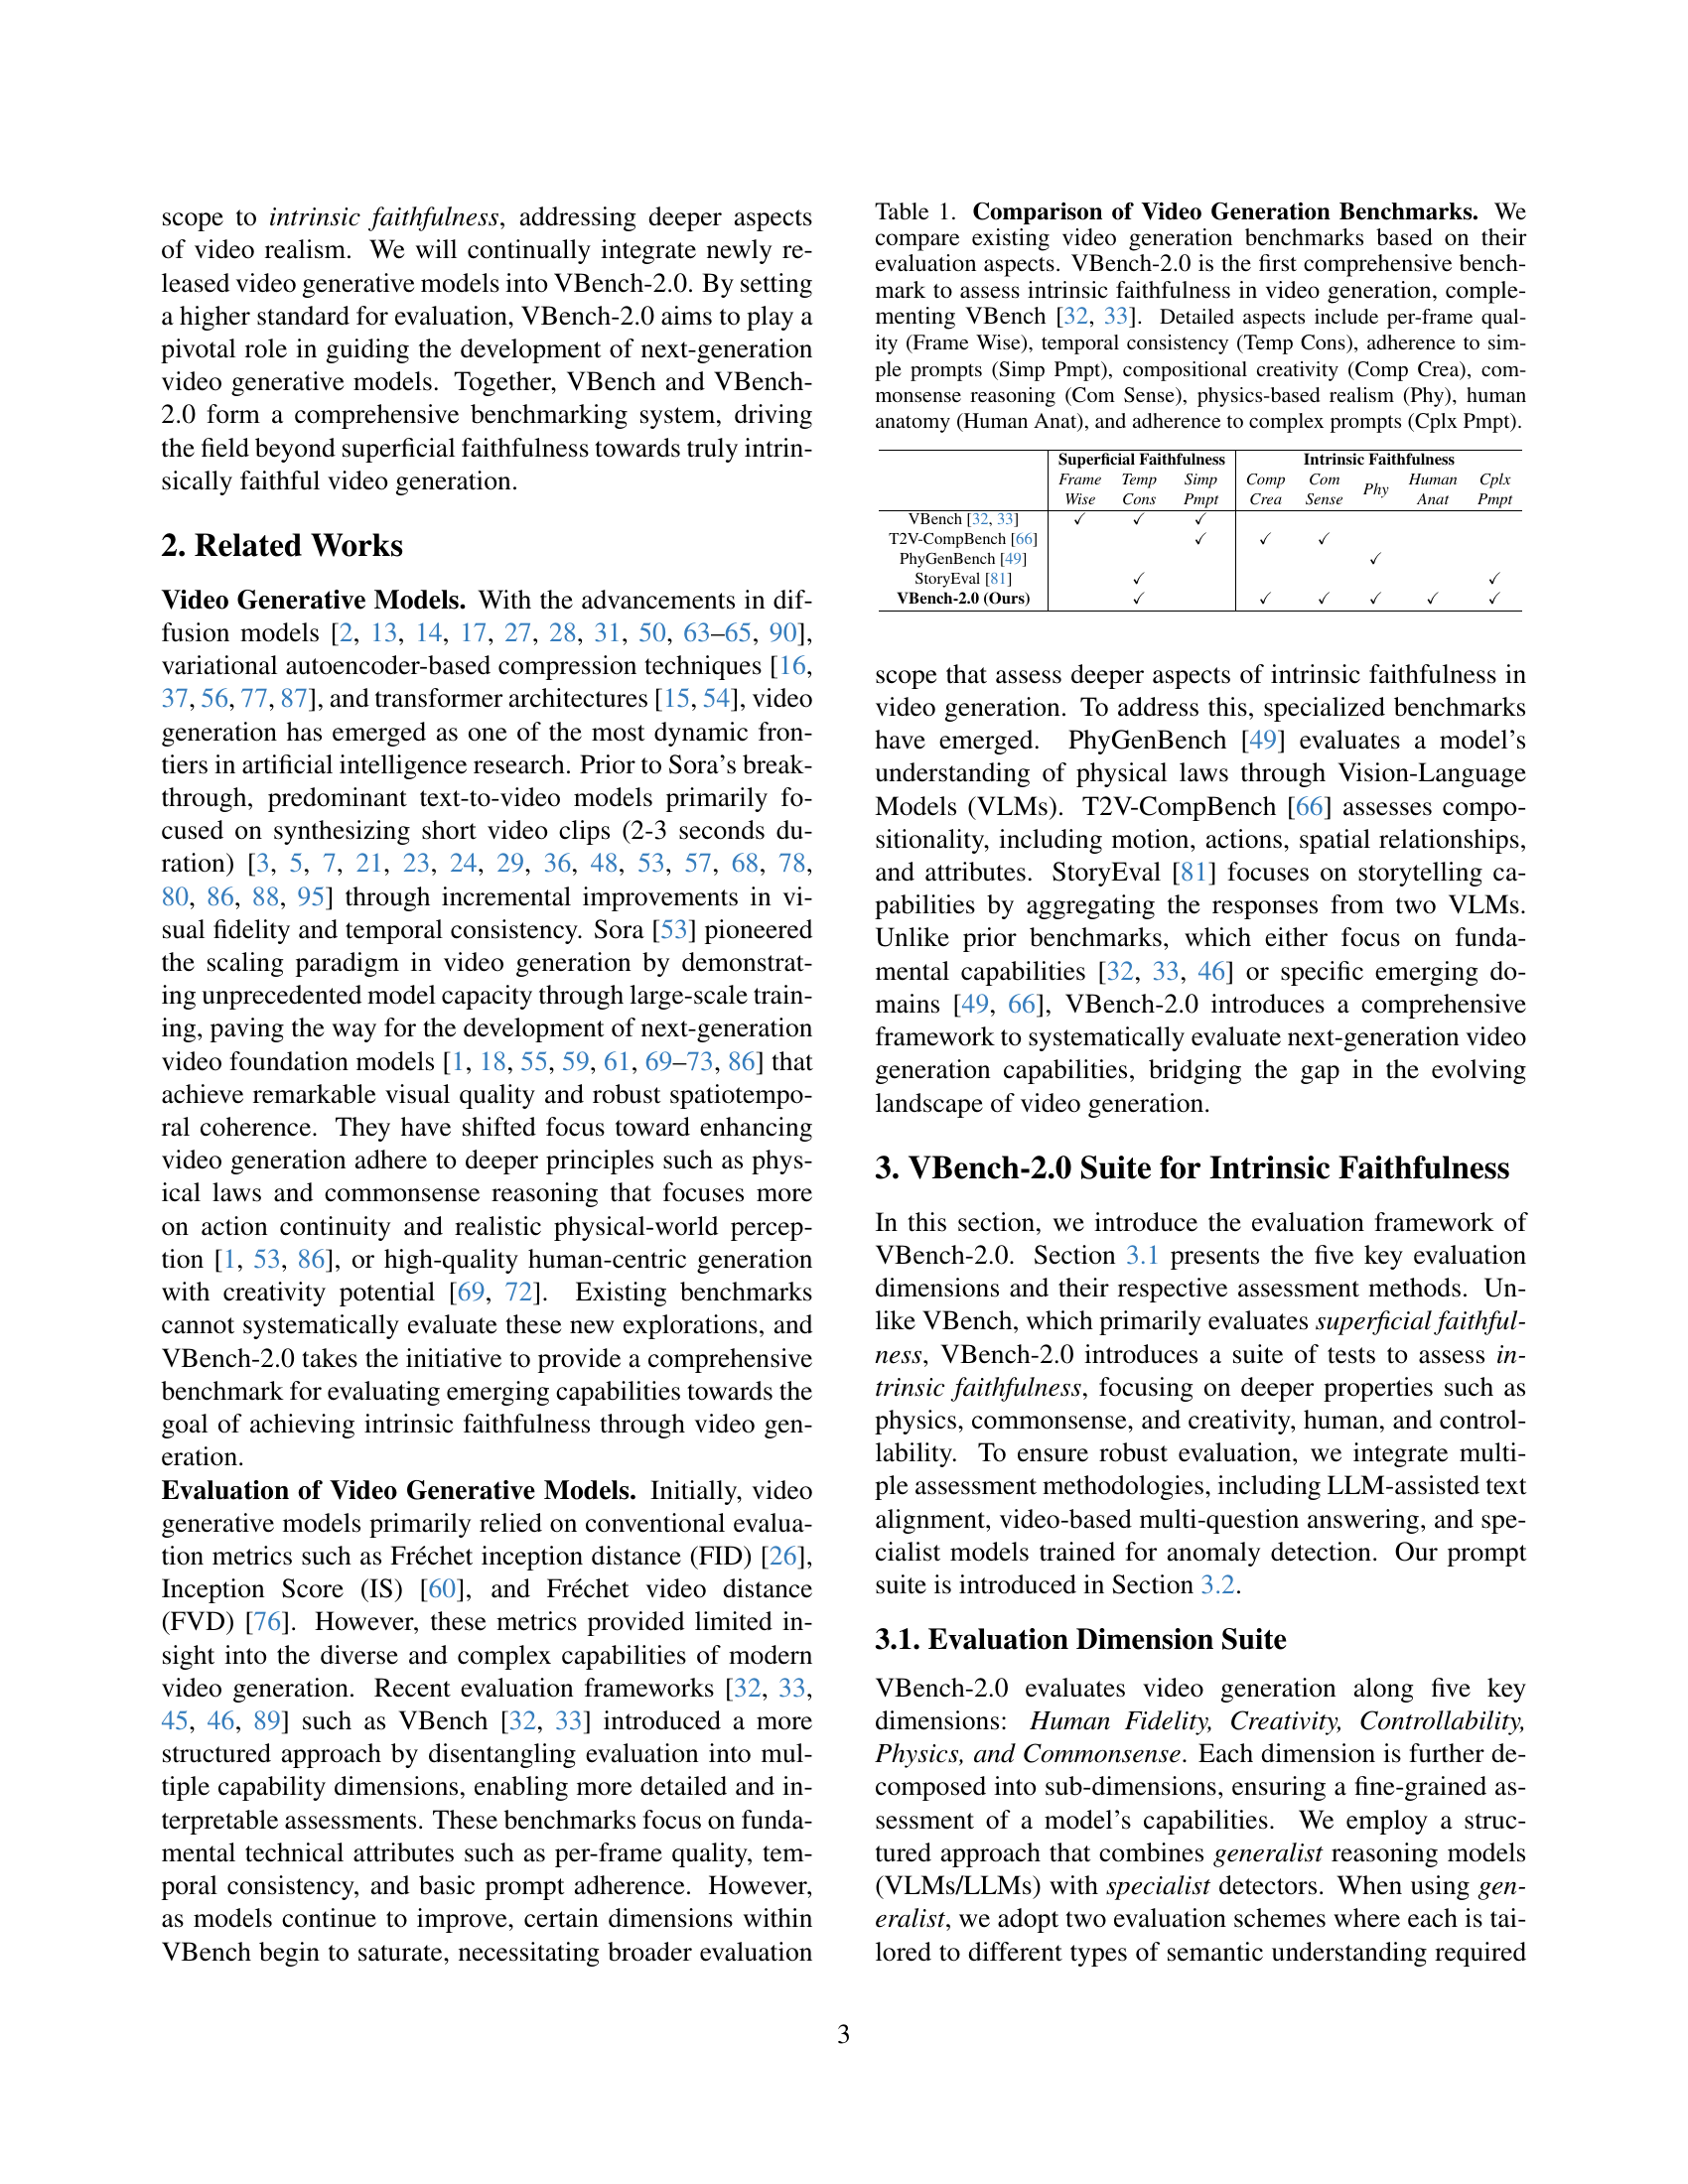
🔼 Table 1 compares several video generation benchmarks based on their evaluation capabilities. It highlights the key differences in the aspects they evaluate, such as per-frame visual quality, temporal coherence, response to simple and complex prompts, creative composition, adherence to commonsense, physics-based realism, and human anatomy. The table emphasizes that VBench-2.0 is unique in its comprehensive assessment of intrinsic faithfulness, a deeper level of realism going beyond the superficial faithfulness assessed by earlier benchmarks like VBench. This makes VBench-2.0 a valuable tool for evaluating next-generation video generation models.
read the caption
Table 1: Comparison of Video Generation Benchmarks. We compare existing video generation benchmarks based on their evaluation aspects. VBench-2.0 is the first comprehensive benchmark to assess intrinsic faithfulness in video generation, complementing VBench [32, 33]. Detailed aspects include per-frame quality (Frame Wise), temporal consistency (Temp Cons), adherence to simple prompts (Simp Pmpt), compositional creativity (Comp Crea), commonsense reasoning (Com Sense), physics-based realism (Phy), human anatomy (Human Anat), and adherence to complex prompts (Cplx Pmpt).
In-depth insights#
Faithfulness Eval#
Evaluating faithfulness in video generation is crucial, moving beyond superficial metrics to assess how well generated content aligns with real-world principles. This requires benchmarks that can automatically assess physical laws, commonsense reasoning, anatomical correctness, and compositional integrity. Addressing this requires integrating generalist models like VLMs and LLMs with specialized anomaly detection methods. Manual assessment is still indispensable for checking physical state change ability like the mechanical thermal and material transition. It is hard to ensure 3D consistency with the absence of 3D truth data. For human-related dimensions, it is critical to determine the anomalies. Instance preservation is needed for keeping the object in generated video
VBench-2.0 Suite#
The VBench-2.0 suite marks a significant advancement in video generation evaluation. Shifting from superficial metrics like aesthetics, it delves into intrinsic faithfulness. This includes human fidelity, controllability, creativity, physics, and commonsense. The suite’s strength lies in its fine-grained assessment, breaking down each dimension into sub-abilities evaluated via diverse methods. Leveraging both generalist VLMs/LLMs and specialist detectors ensures robust results. A key aspect is the human preference alignment, validating automated evaluations. VBench-2.0’s structured approach addresses the limitations of previous benchmarks, fostering more realistic and reliable video generation progress.
Prompt Refinement#
Prompt refinement emerges as a crucial element in modern video generation, showcasing how rewriting or augmenting text prompts significantly impacts video quality. The trade-off between controllability and creativity is highlighted, where models like Sora excel in creative tasks but struggle with precise control, and vice versa. The use of prompt refiners reveals that even without inherent understanding, a well-crafted prompt can guide models towards physically plausible outcomes. Prompt refinement is more than a preprocessing tool; it’s critical for realistic simulation, and future refiners should balance precision with diversity to create open-ended content. Furthermore, the prompt refinement seems to have no or little impact on some dimensions, likely due to limitations in model comprehension or data quality.
SOTA Model Weakness#
Analyzing SOTA models reveals inherent weaknesses despite superficial advancements. Controllability in simple dynamics falters, indicating difficulty in accurate object manipulation and attribute changes. There are also issues in generating complex plots, with models struggling to follow detailed text descriptions involving multiple scenes or logical progressions. Also present is surprising weakness when it comes to accurate object manipulation. These shortcomings reveal limitations in the current modeling approach, necessitating improved strategies to address these inherent issues and enhance model performance beyond superficial achievements. They also showcase a need for more sophisticated instructions.
Future Video AI#
The prospect of ‘Future Video AI’ is exciting. It could revolutionize content creation, making it faster and more accessible. Imagine AI generating realistic, engaging videos from simple text prompts, opening doors for personalized education, immersive entertainment, and efficient marketing. However, we need to address challenges like ensuring factual accuracy, mitigating potential biases, and preventing misuse for malicious purposes. Ethical considerations and robust safety measures are crucial to harness the benefits of future Video AI responsibly. This includes establishing clear guidelines for transparency, accountability, and user control, paving the way for a future where AI-powered video enhances creativity and enriches our lives while upholding ethical standards.
More visual insights#
More on figures

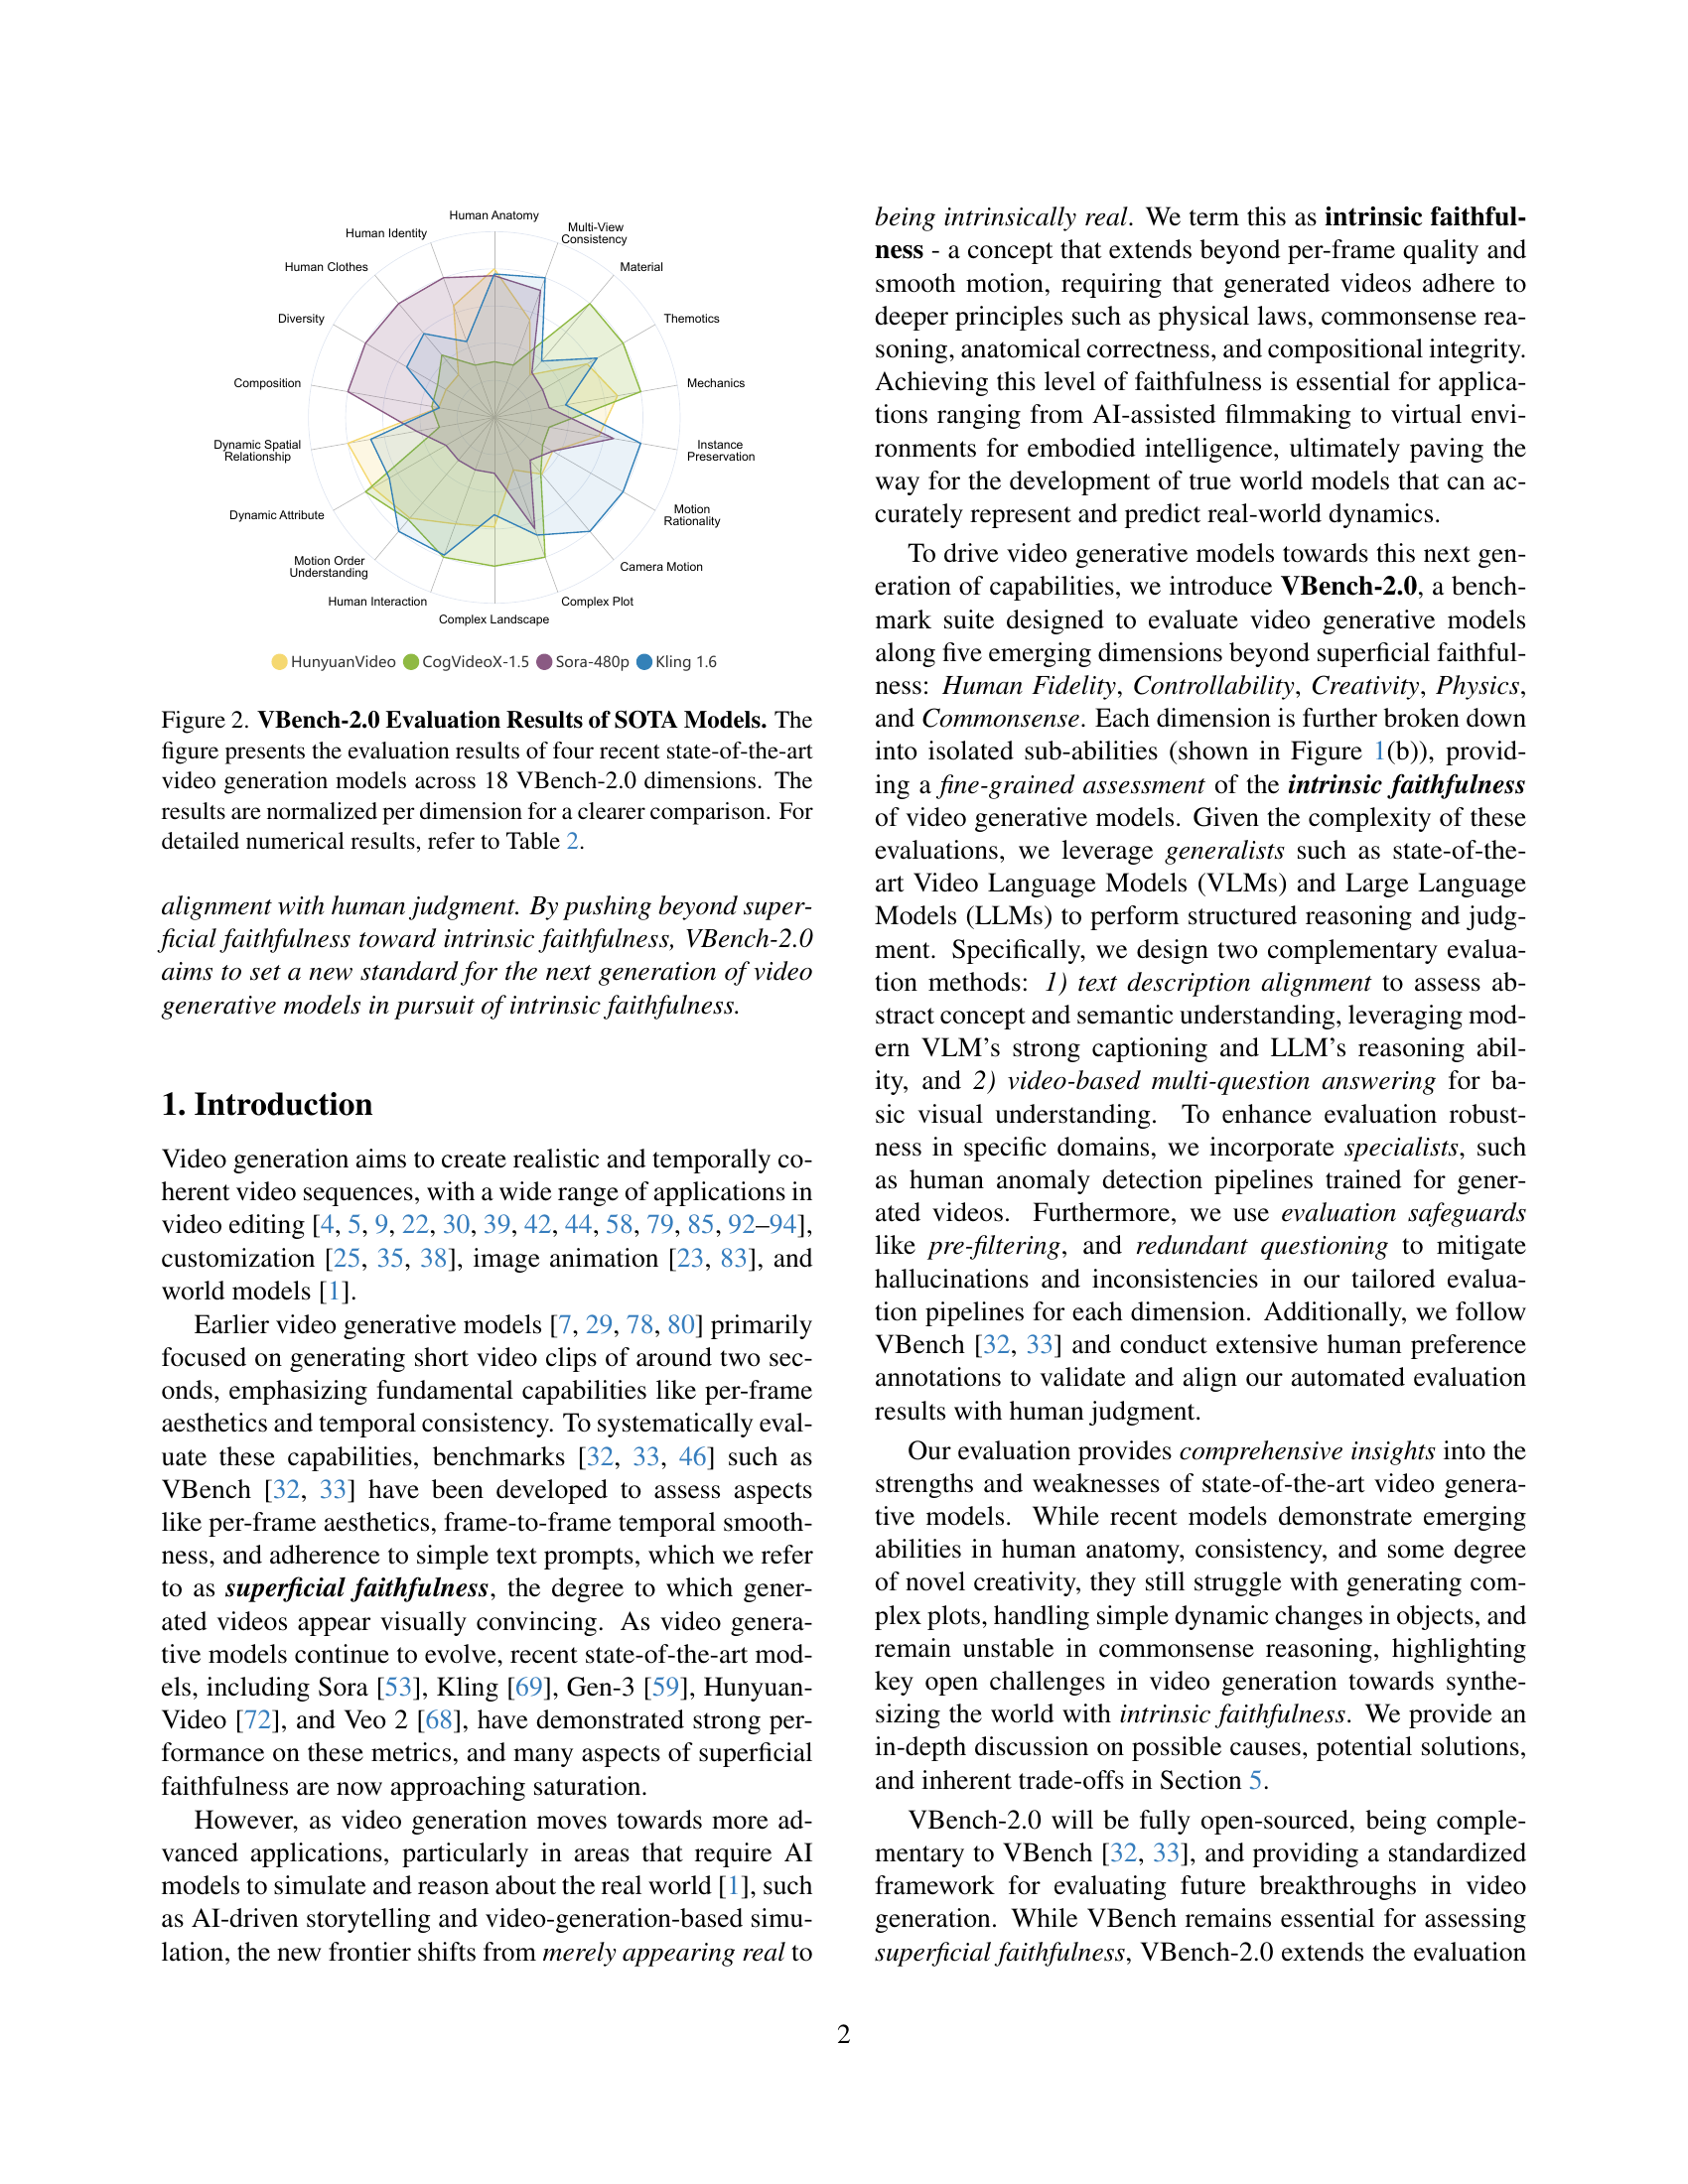
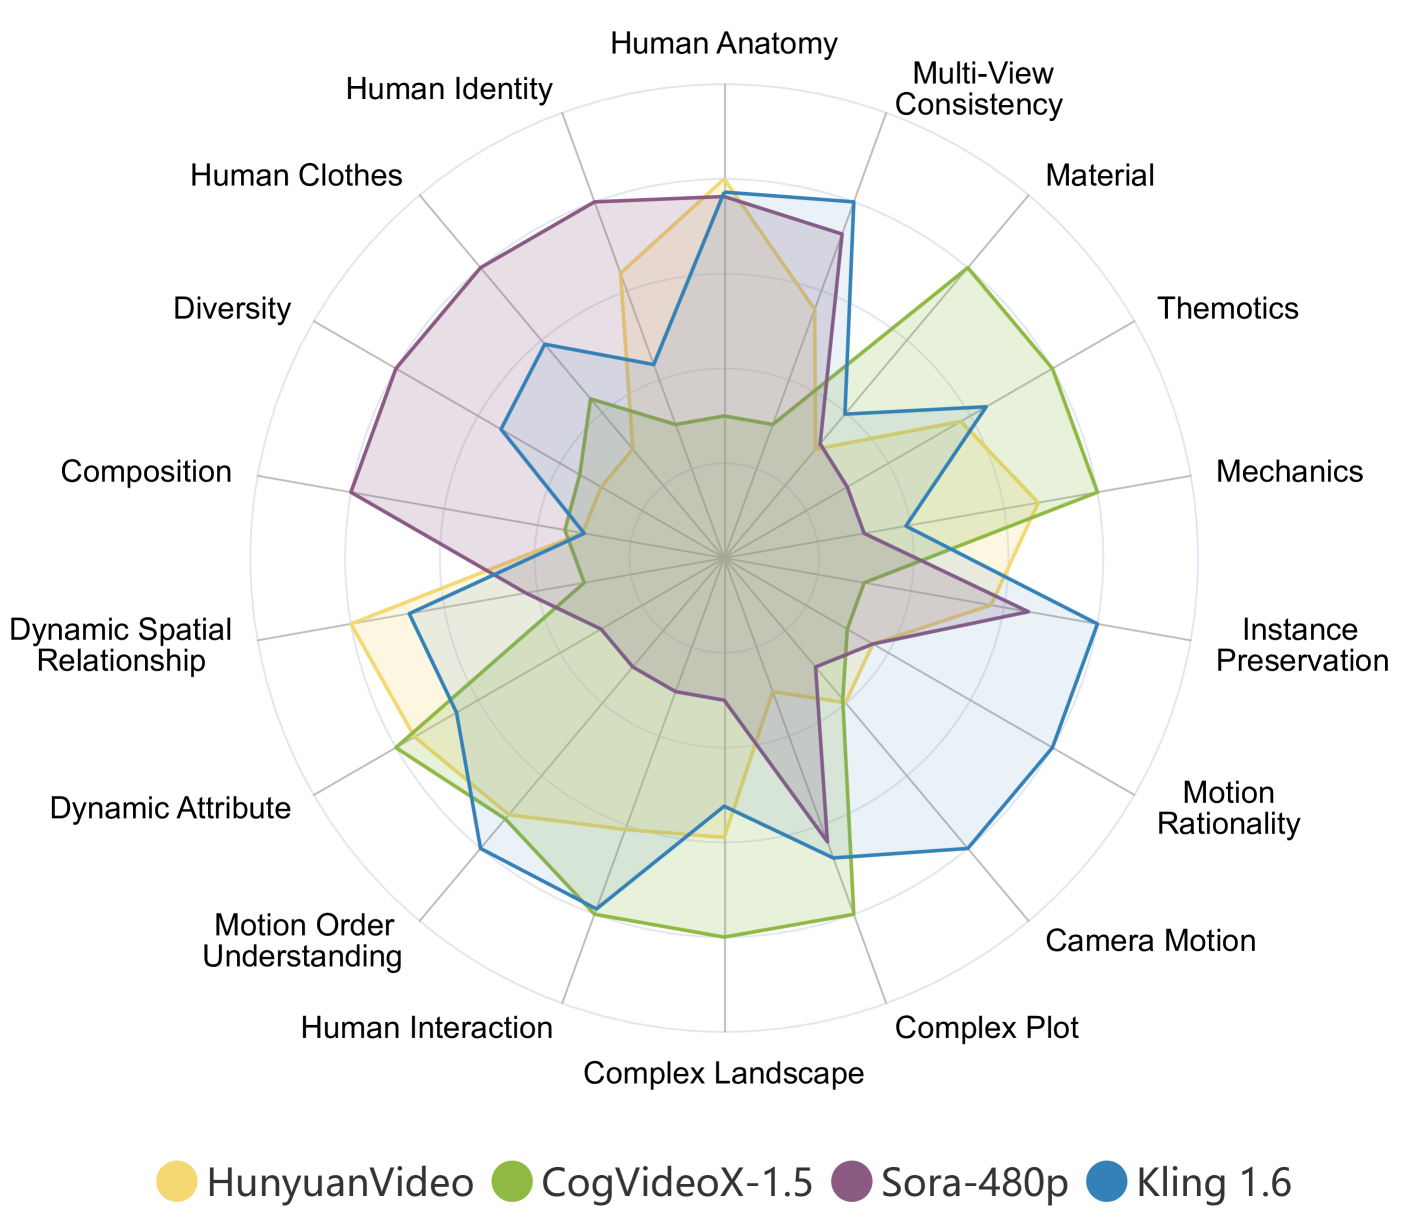
🔼 This figure displays a radar chart visualizing the performance of four state-of-the-art (SOTA) video generation models across 18 distinct dimensions defined by the VBench-2.0 benchmark. Each dimension represents a specific aspect of video generation quality, such as human fidelity, controllability, creativity, physics, and common sense. The radar chart allows for a quick visual comparison of the models’ strengths and weaknesses in each of these areas. The scores are normalized, ensuring a fair comparison despite variations in absolute values between the different dimensions. More detailed numerical results are available in Table 2 of the paper.
read the caption
Figure 2: VBench-2.0 Evaluation Results of SOTA Models. The figure presents the evaluation results of four recent state-of-the-art video generation models across 18 VBench-2.0 dimensions. The results are normalized per dimension for a clearer comparison. For detailed numerical results, refer to Table 2.

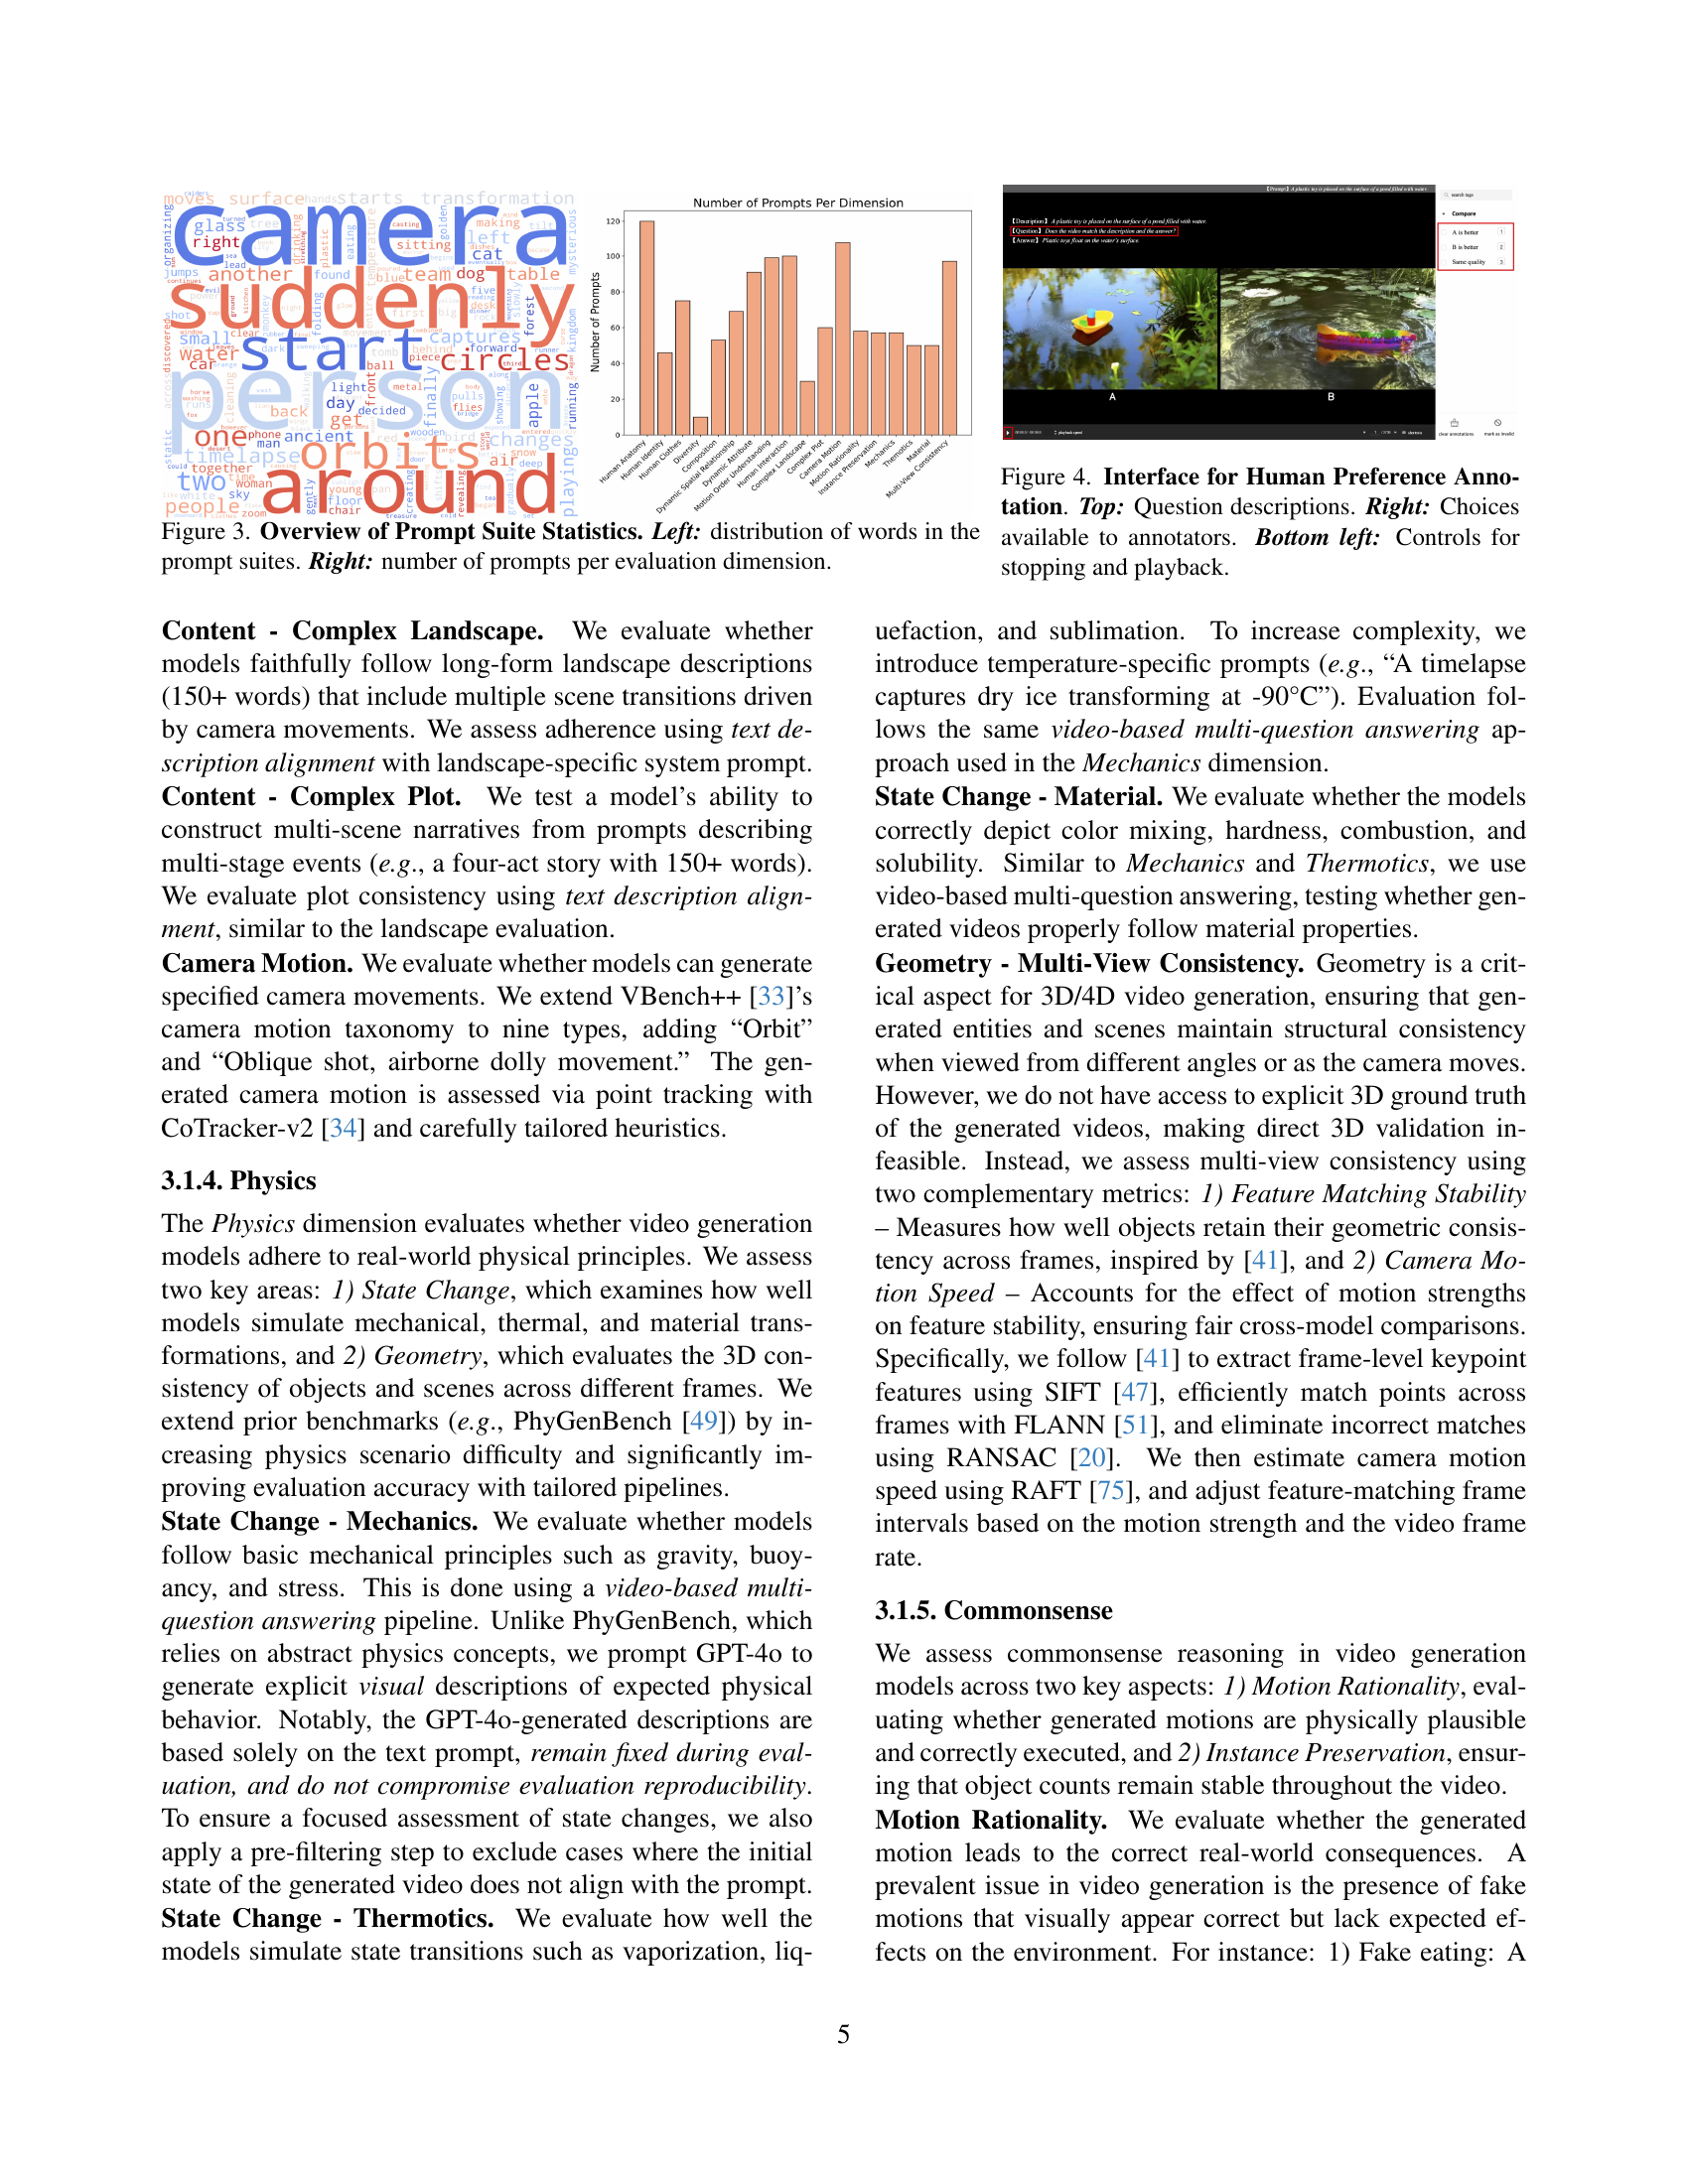
🔼 This figure presents a statistical overview of the prompts used in the VBench-2.0 benchmark suite. The left panel displays a histogram showing the distribution of word counts across all prompts. This reveals the overall length and complexity of the prompts used to evaluate different aspects of video generation. The right panel shows a bar chart illustrating the number of prompts designed for each of the 18 fine-grained evaluation dimensions within the VBench-2.0 framework. This provides insights into the relative emphasis placed on each dimension during the evaluation process.
read the caption
Figure 3: Overview of Prompt Suite Statistics. Left: distribution of words in the prompt suites. Right: number of prompts per evaluation dimension.
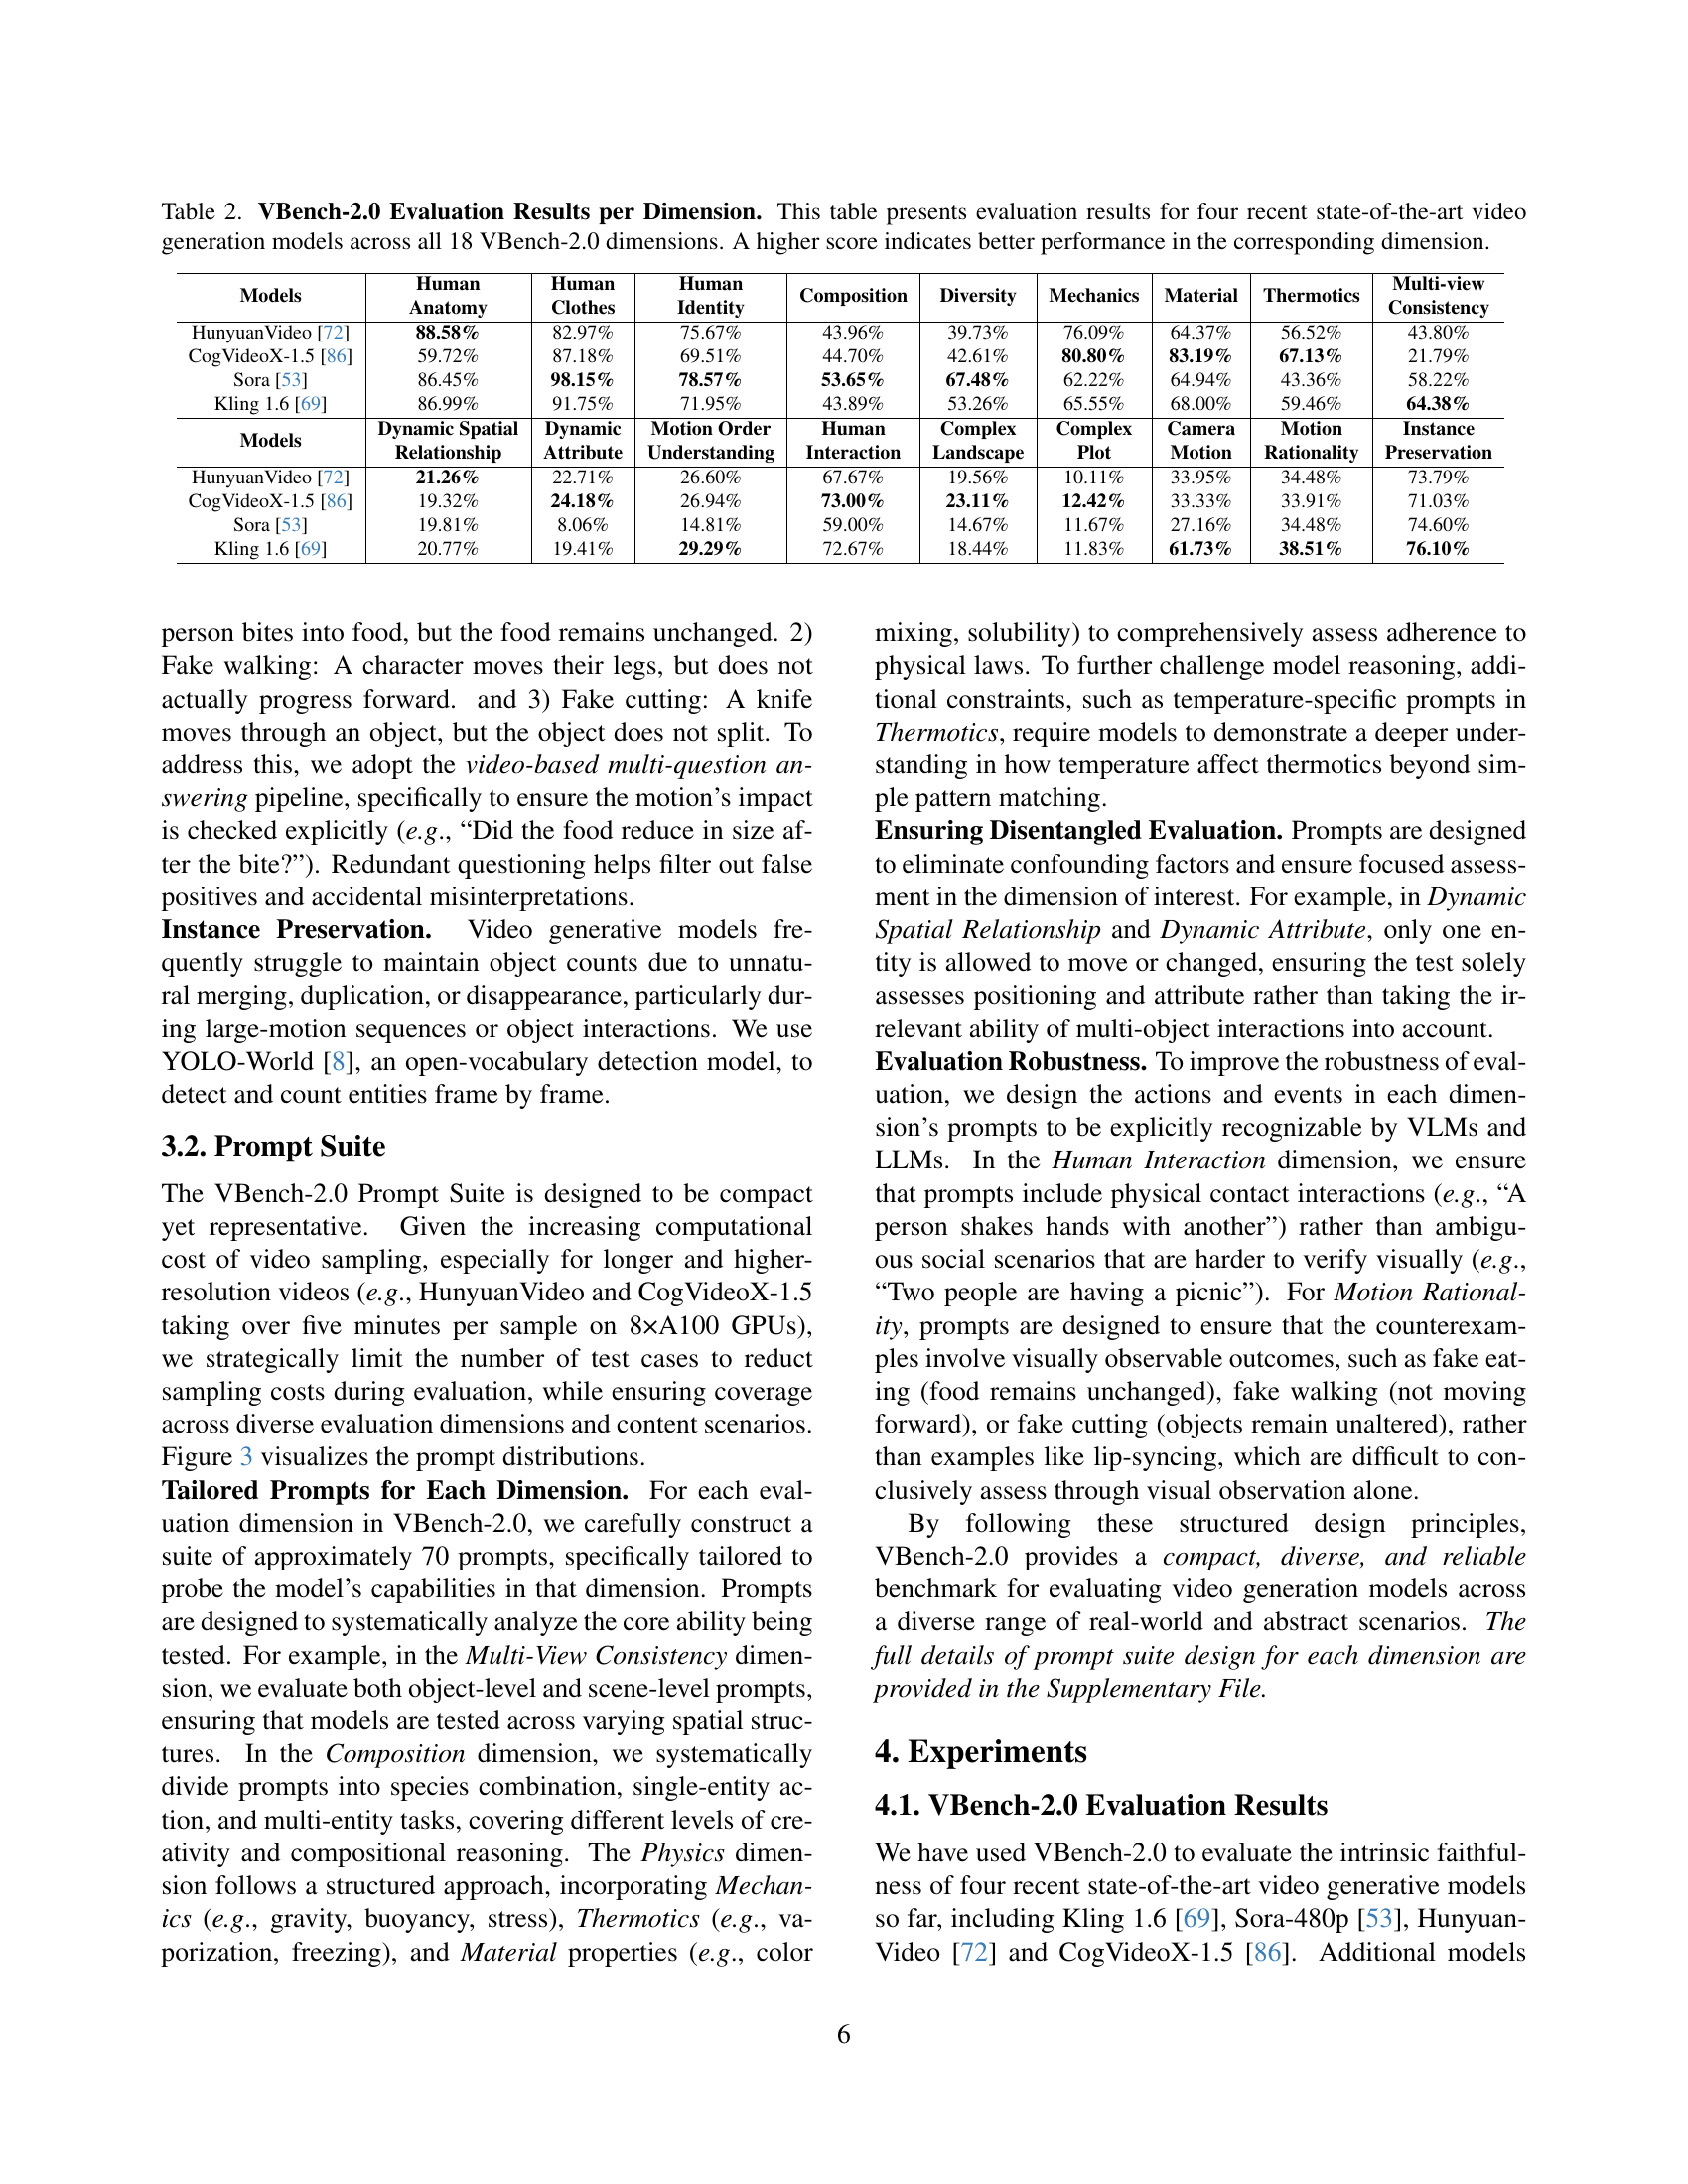
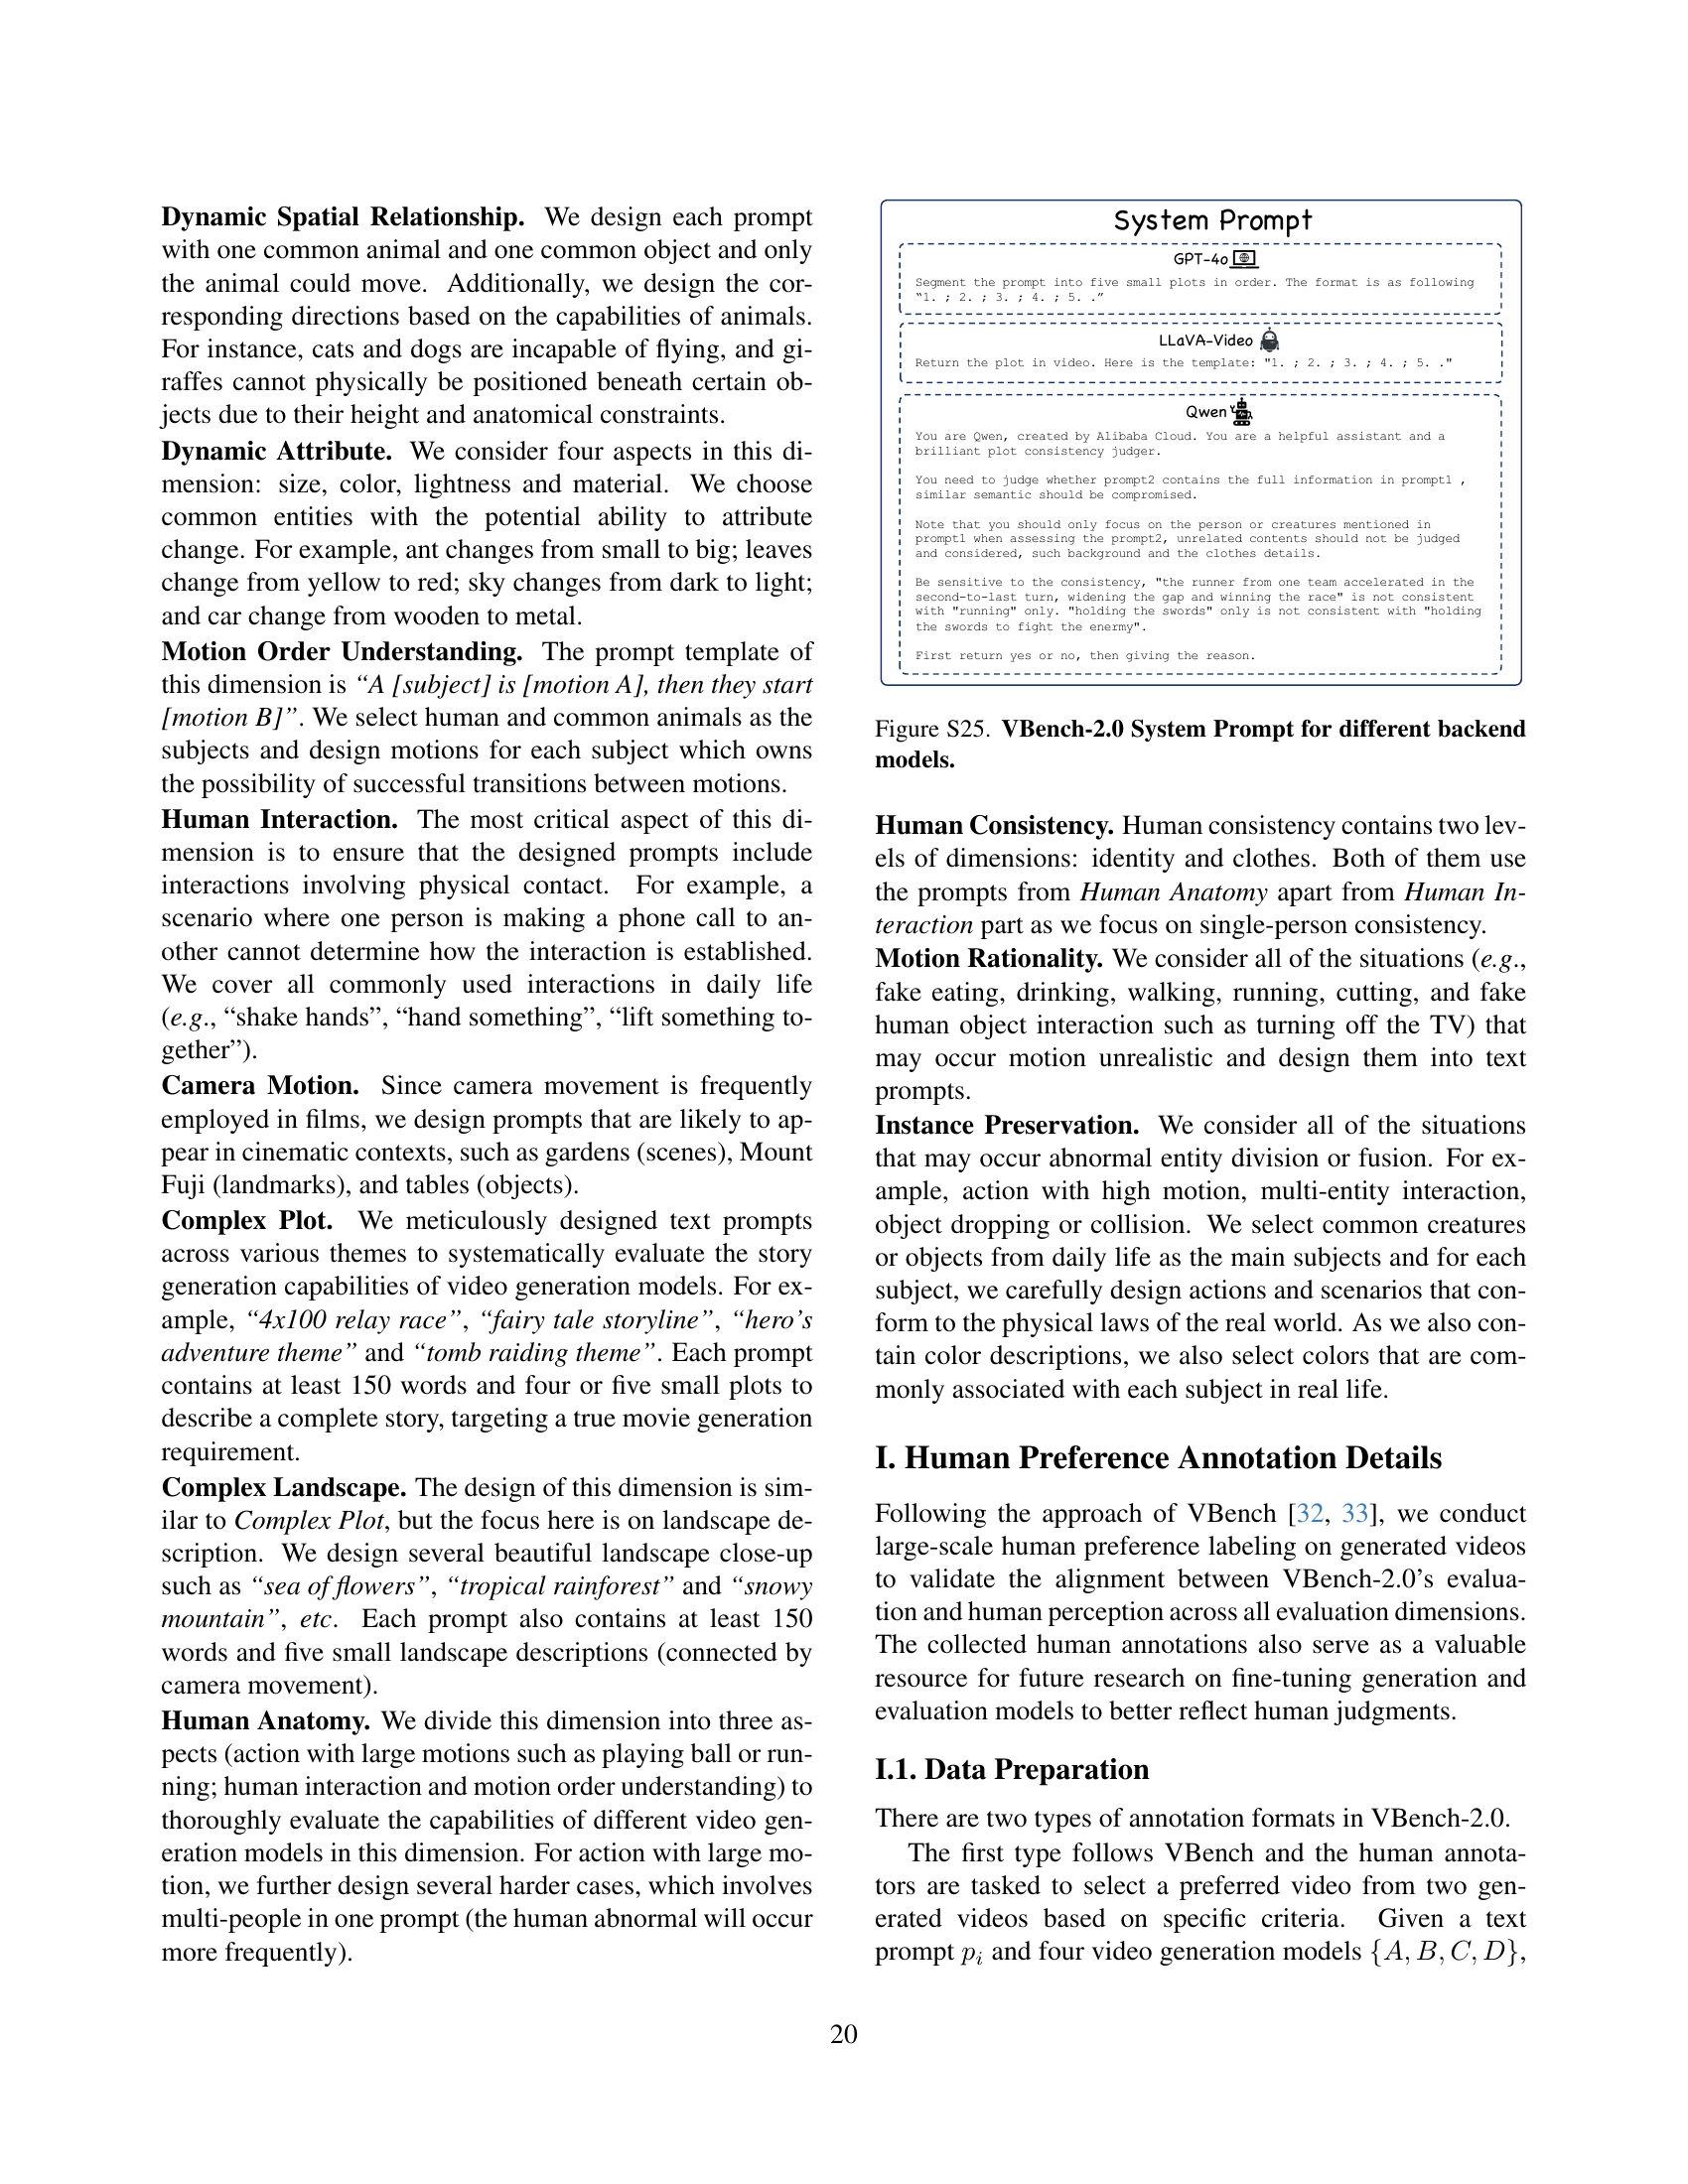
🔼 This figure shows the user interface for human preference annotation in the VBench-2.0 benchmark. The top section displays the question description, the right section lists the choices available for the annotators, and the bottom-left section shows controls for starting, stopping, and playing back the videos.
read the caption
Figure 4: Interface for Human Preference Annotation. Top: Question descriptions. Right: Choices available to annotators. Bottom left: Controls for stopping and playback.

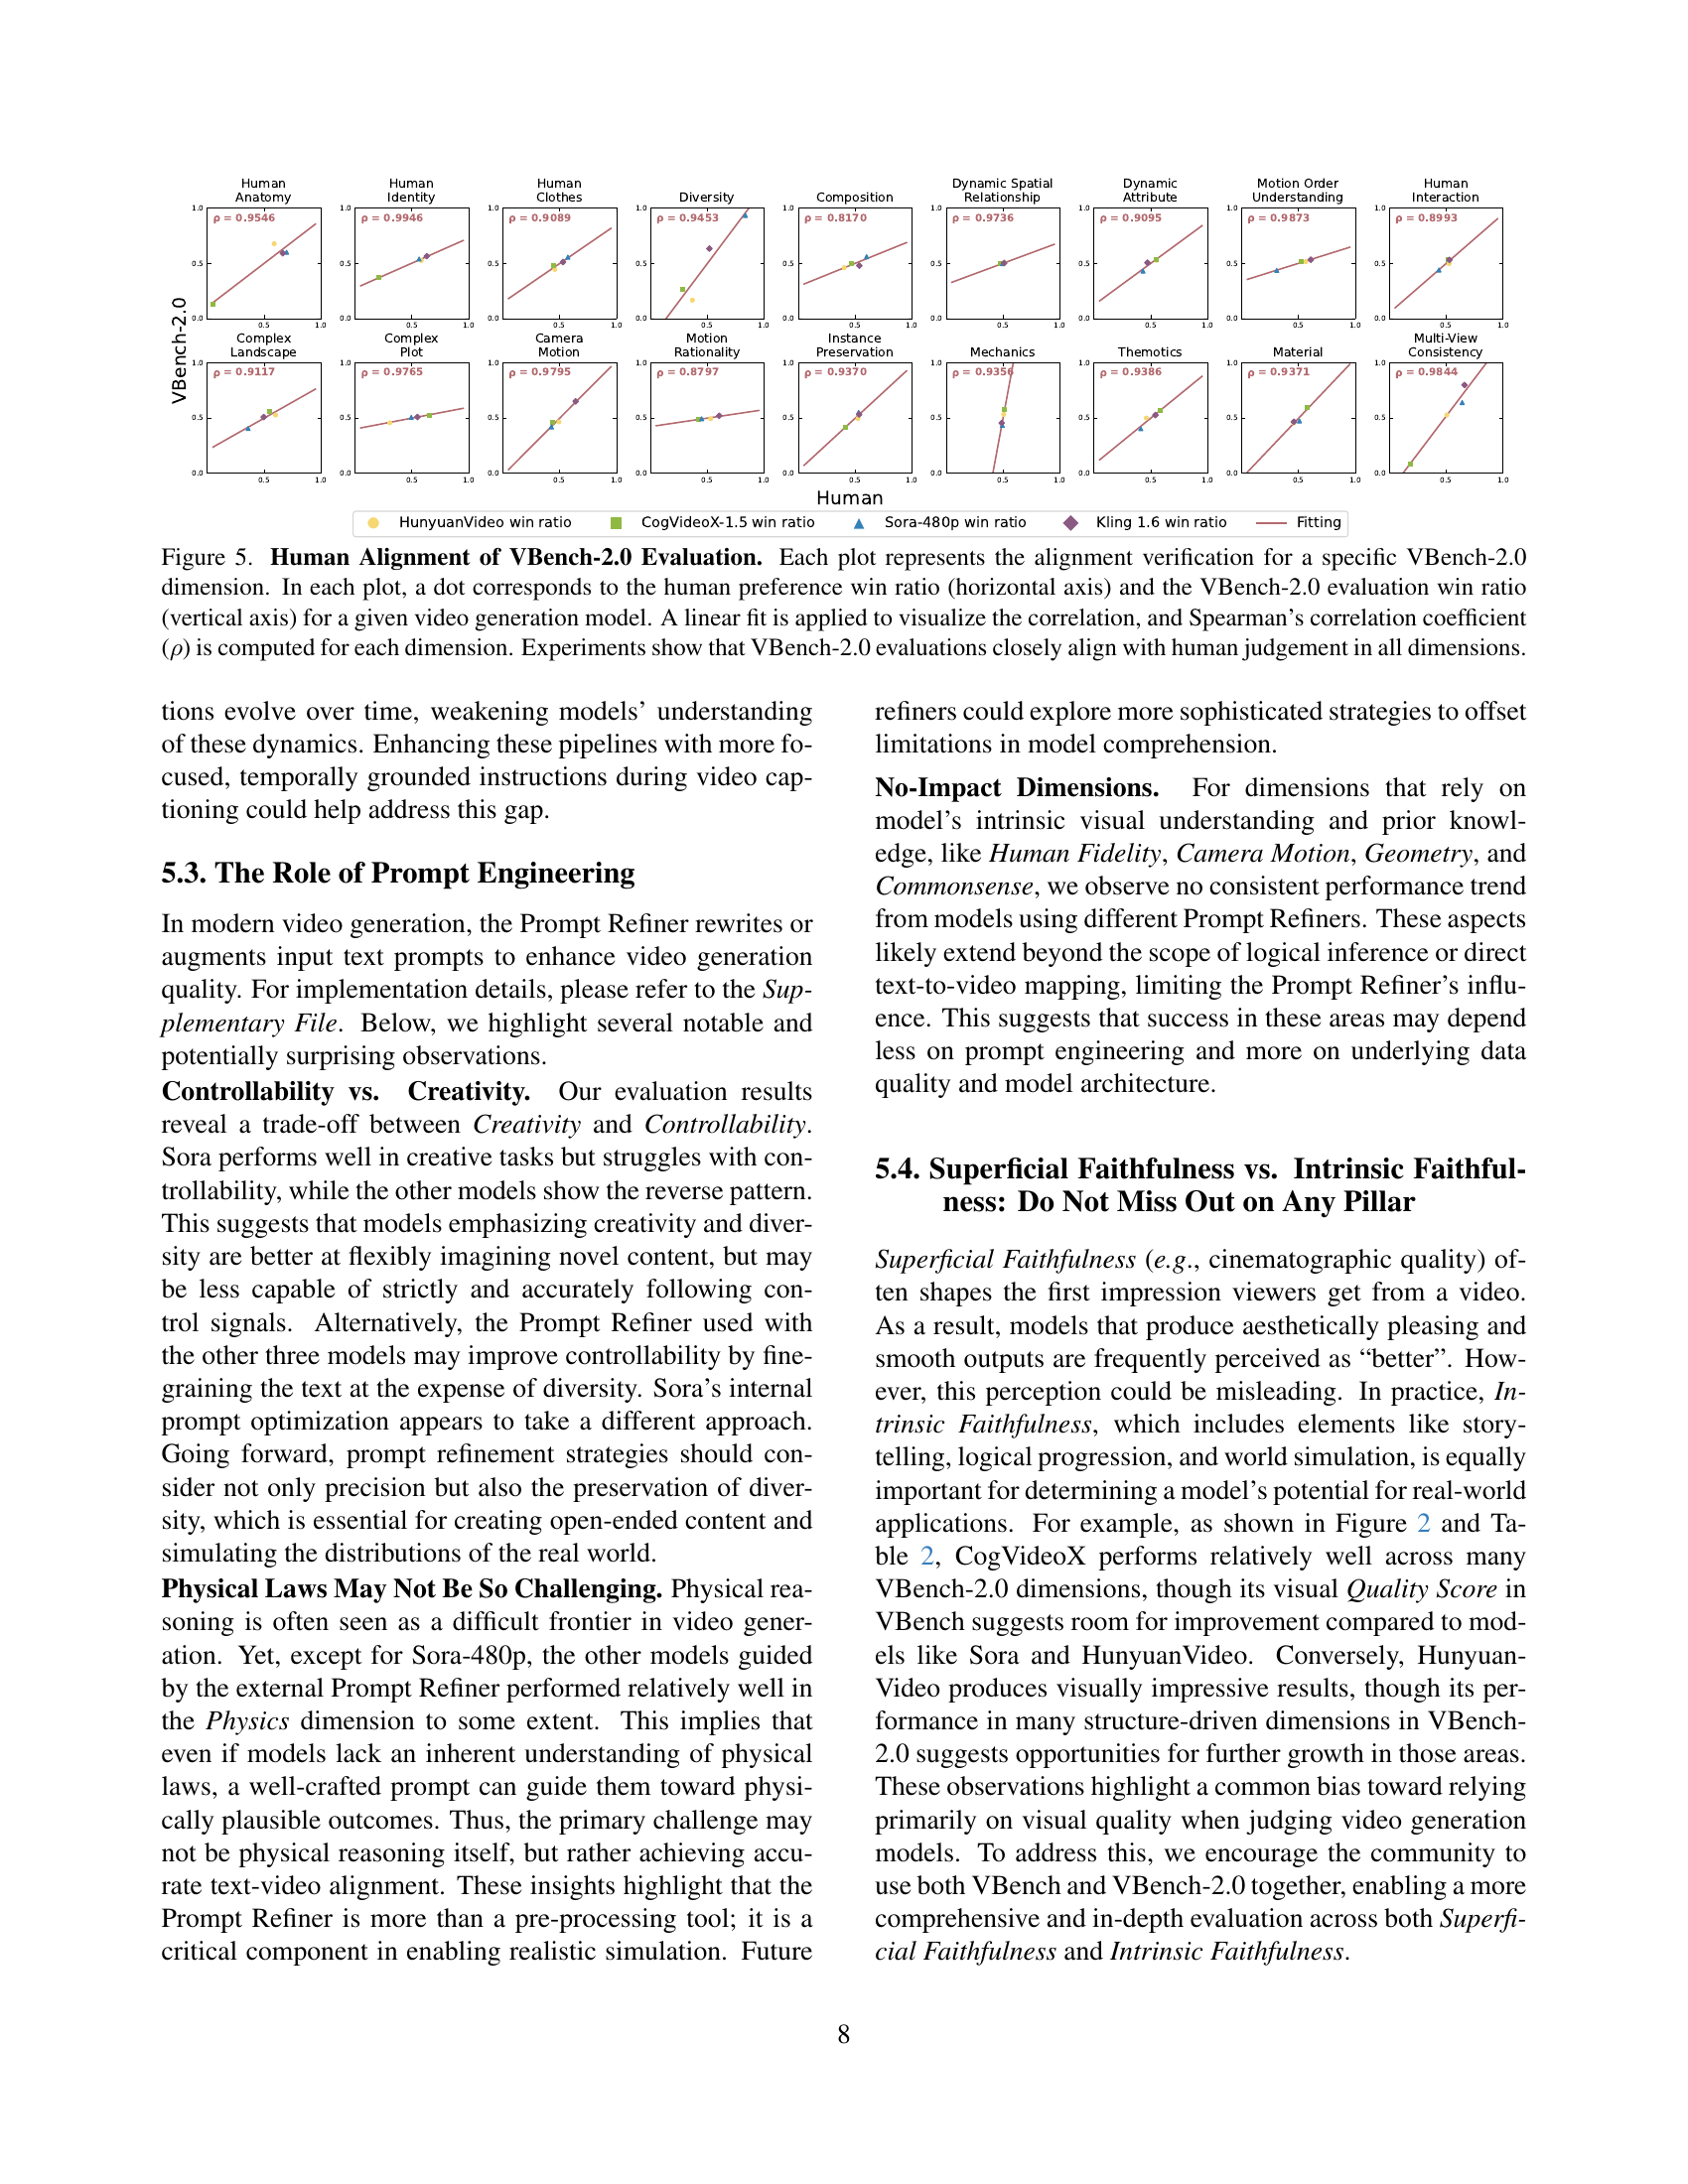
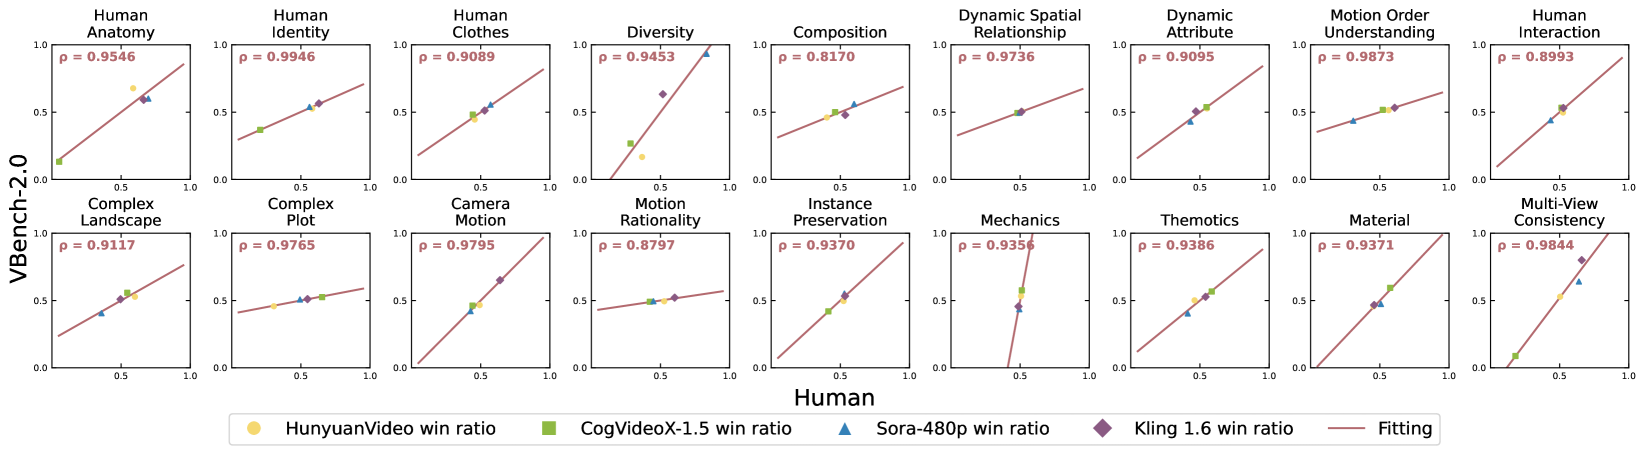
🔼 This figure displays the correlation between human judgment and VBench-2.0 evaluation results across 18 different video generation capabilities. Each plot shows the win ratios from human preference tests (horizontal axis) and VBench-2.0 automated evaluation (vertical axis) for a given video generation model. A linear fit and Spearman’s correlation coefficient (ρ) are calculated for each dimension to quantitatively assess the agreement between human and automated evaluations. The results demonstrate a high correlation, suggesting that VBench-2.0 aligns well with human judgment across all the tested dimensions.
read the caption
Figure 5: Human Alignment of VBench-2.0 Evaluation. Each plot represents the alignment verification for a specific VBench-2.0 dimension. In each plot, a dot corresponds to the human preference win ratio (horizontal axis) and the VBench-2.0 evaluation win ratio (vertical axis) for a given video generation model. A linear fit is applied to visualize the correlation, and Spearman’s correlation coefficient (ρ𝜌\rhoitalic_ρ) is computed for each dimension. Experiments show that VBench-2.0 evaluations closely align with human judgement in all dimensions.

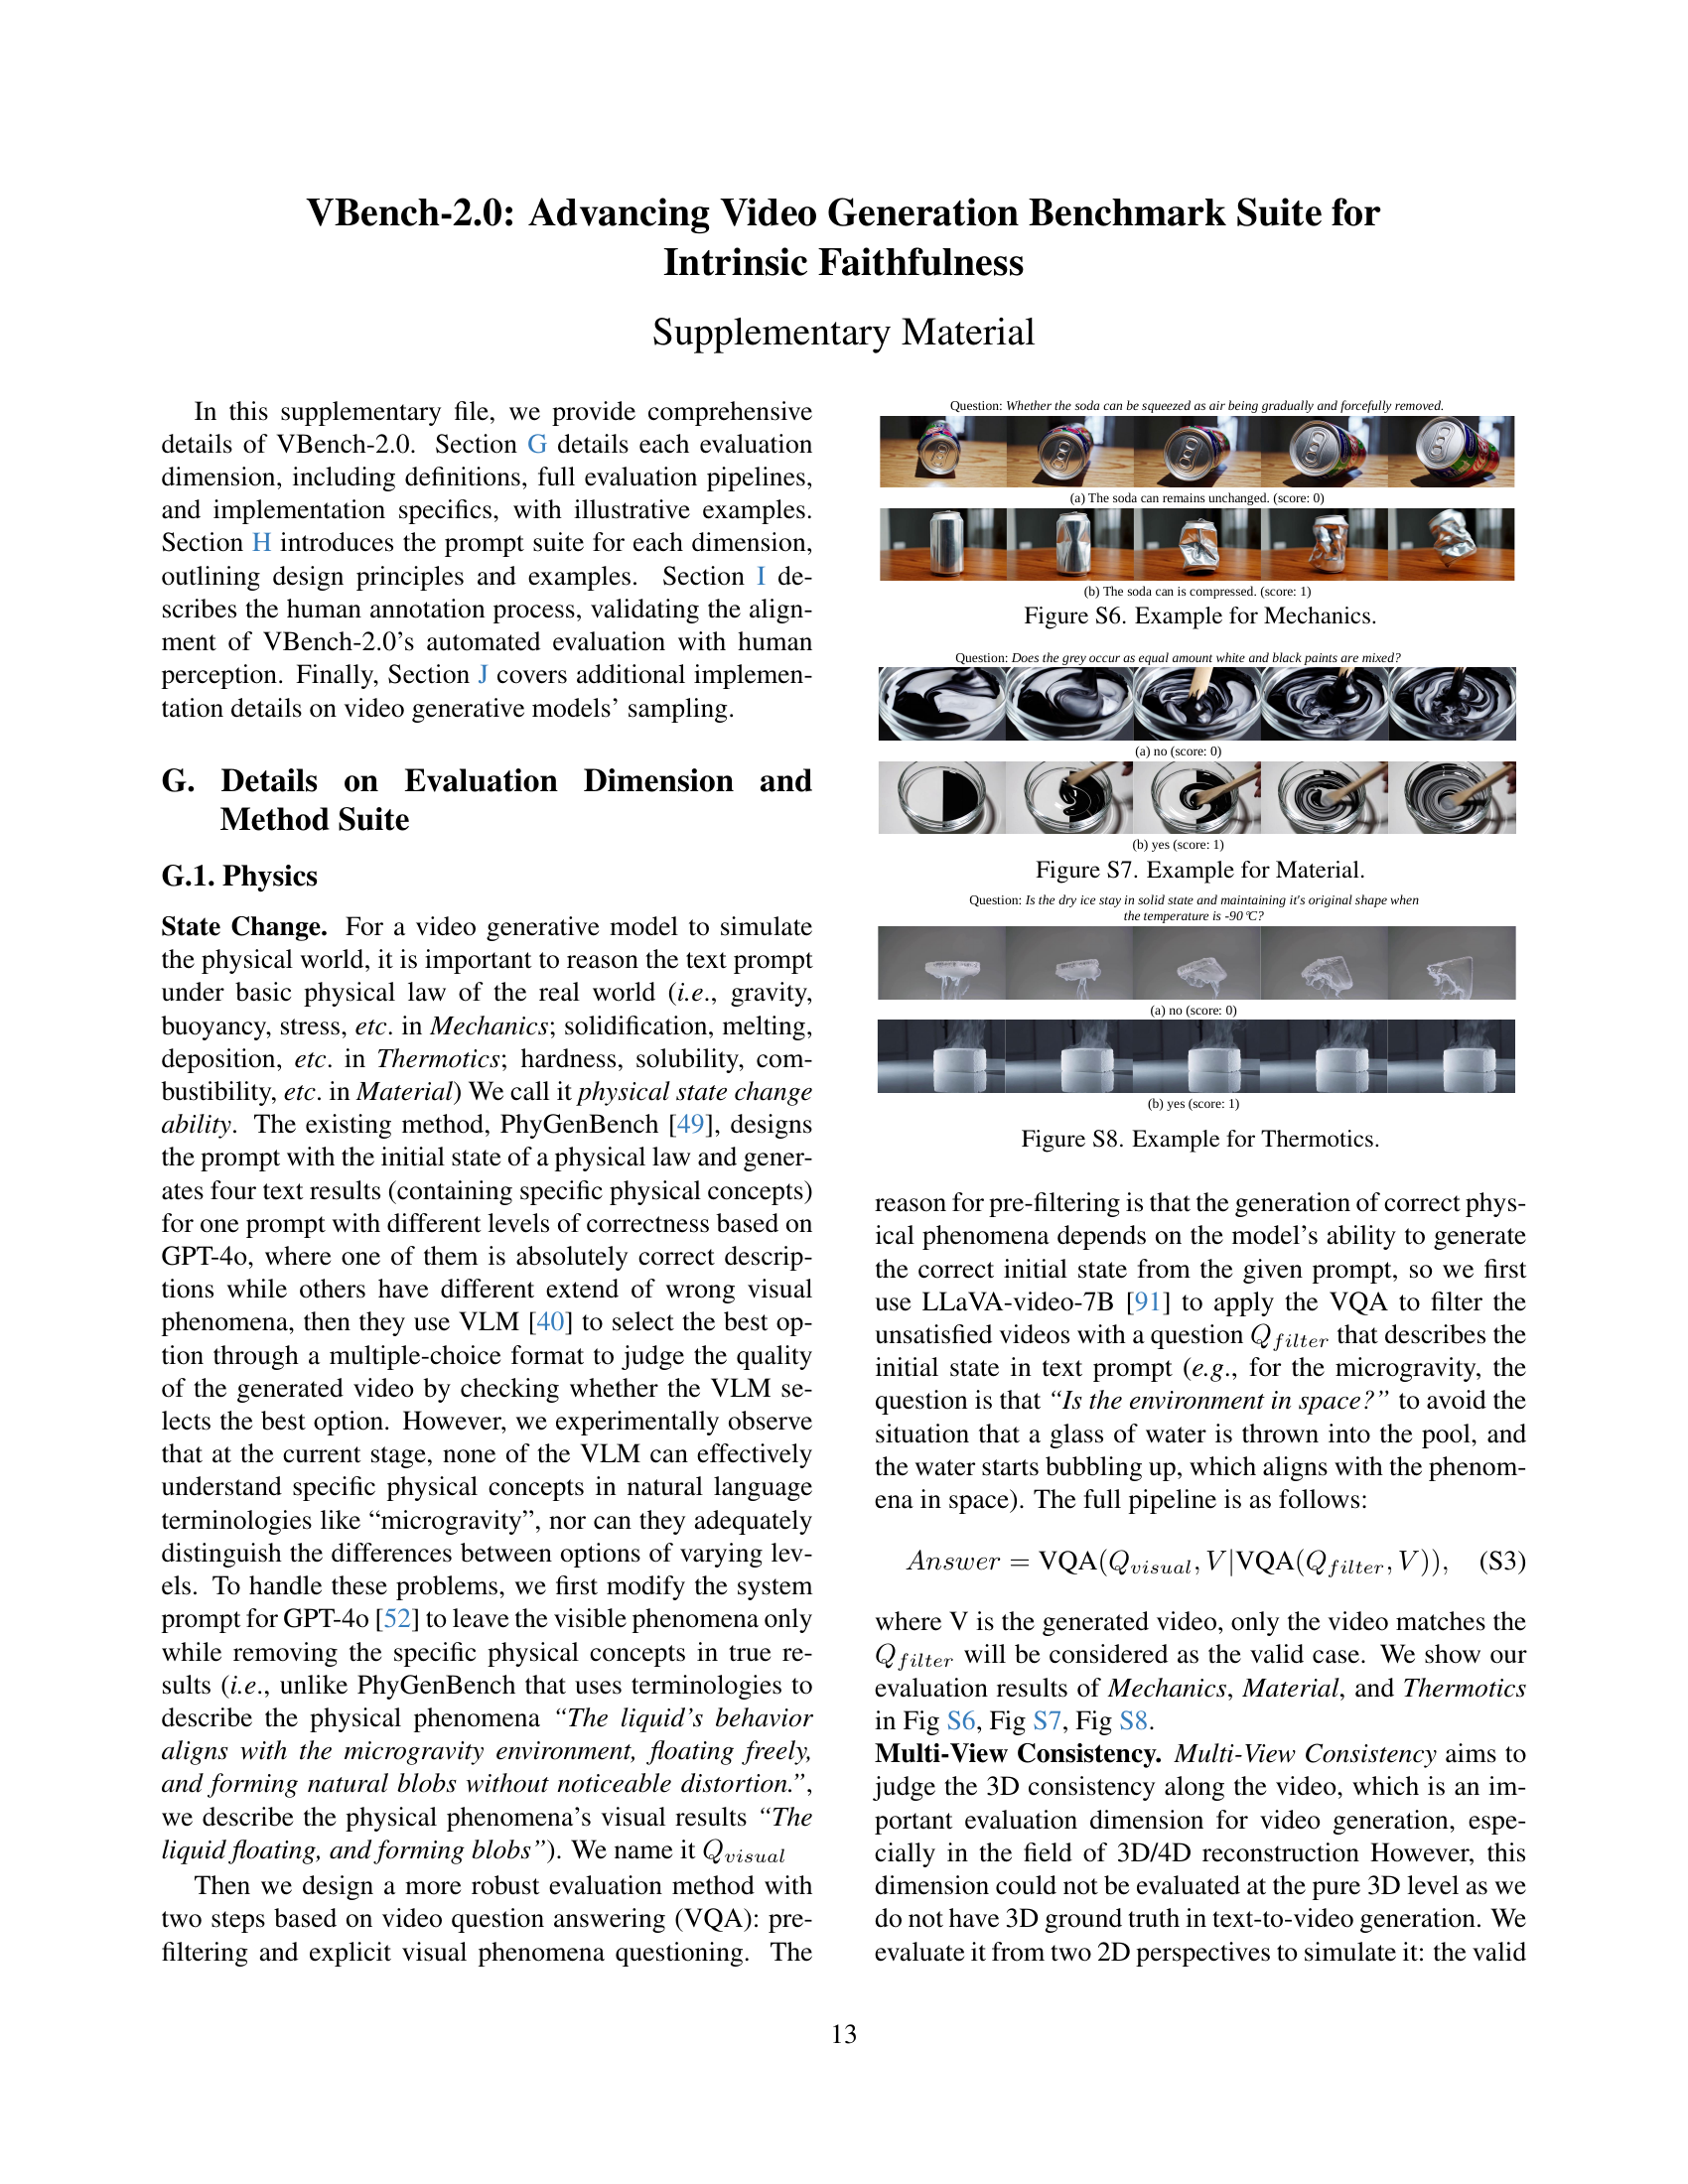
🔼 This figure shows an example of the evaluation for the Mechanics sub-dimension within the Physics dimension of the VBench-2.0 benchmark. It illustrates how the benchmark assesses whether video generation models adhere to basic mechanical principles. The question is posed: ‘Whether the soda can be squeezed as air is gradually and forcefully removed.’ Then it shows two possible video generation results, one where the soda can remains unchanged (score: 0) and one where it is compressed (score: 1), demonstrating the evaluation criteria used to assess the model’s understanding of mechanical properties like compression and force.
read the caption
Figure S6: Example for Mechanics.

🔼 The figure shows an example of the Material evaluation dimension in VBench-2.0. It presents a question and two possible answers to assess a video generation model’s ability to simulate material properties realistically. The question is about whether a grey color results from mixing equal amounts of white and black paint. Option (a) shows the incorrect outcome (no grey), while option (b) displays the correct outcome (yes, grey). This tests the model’s understanding of basic material interactions.
read the caption
Figure S7: Example for Material.

🔼 This figure shows an example of the Thermotics evaluation dimension in VBench-2.0. The prompt asks whether dry ice will remain solid and maintain its original shape at -90°C. Option (a) shows a video where this is not the case, receiving a score of 0. Option (b) illustrates a video where the dry ice behaves correctly, resulting in a score of 1. This highlights the benchmark’s ability to assess a model’s understanding of material properties and their changes under varying temperature conditions.
read the caption
Figure S8: Example for Thermotics.

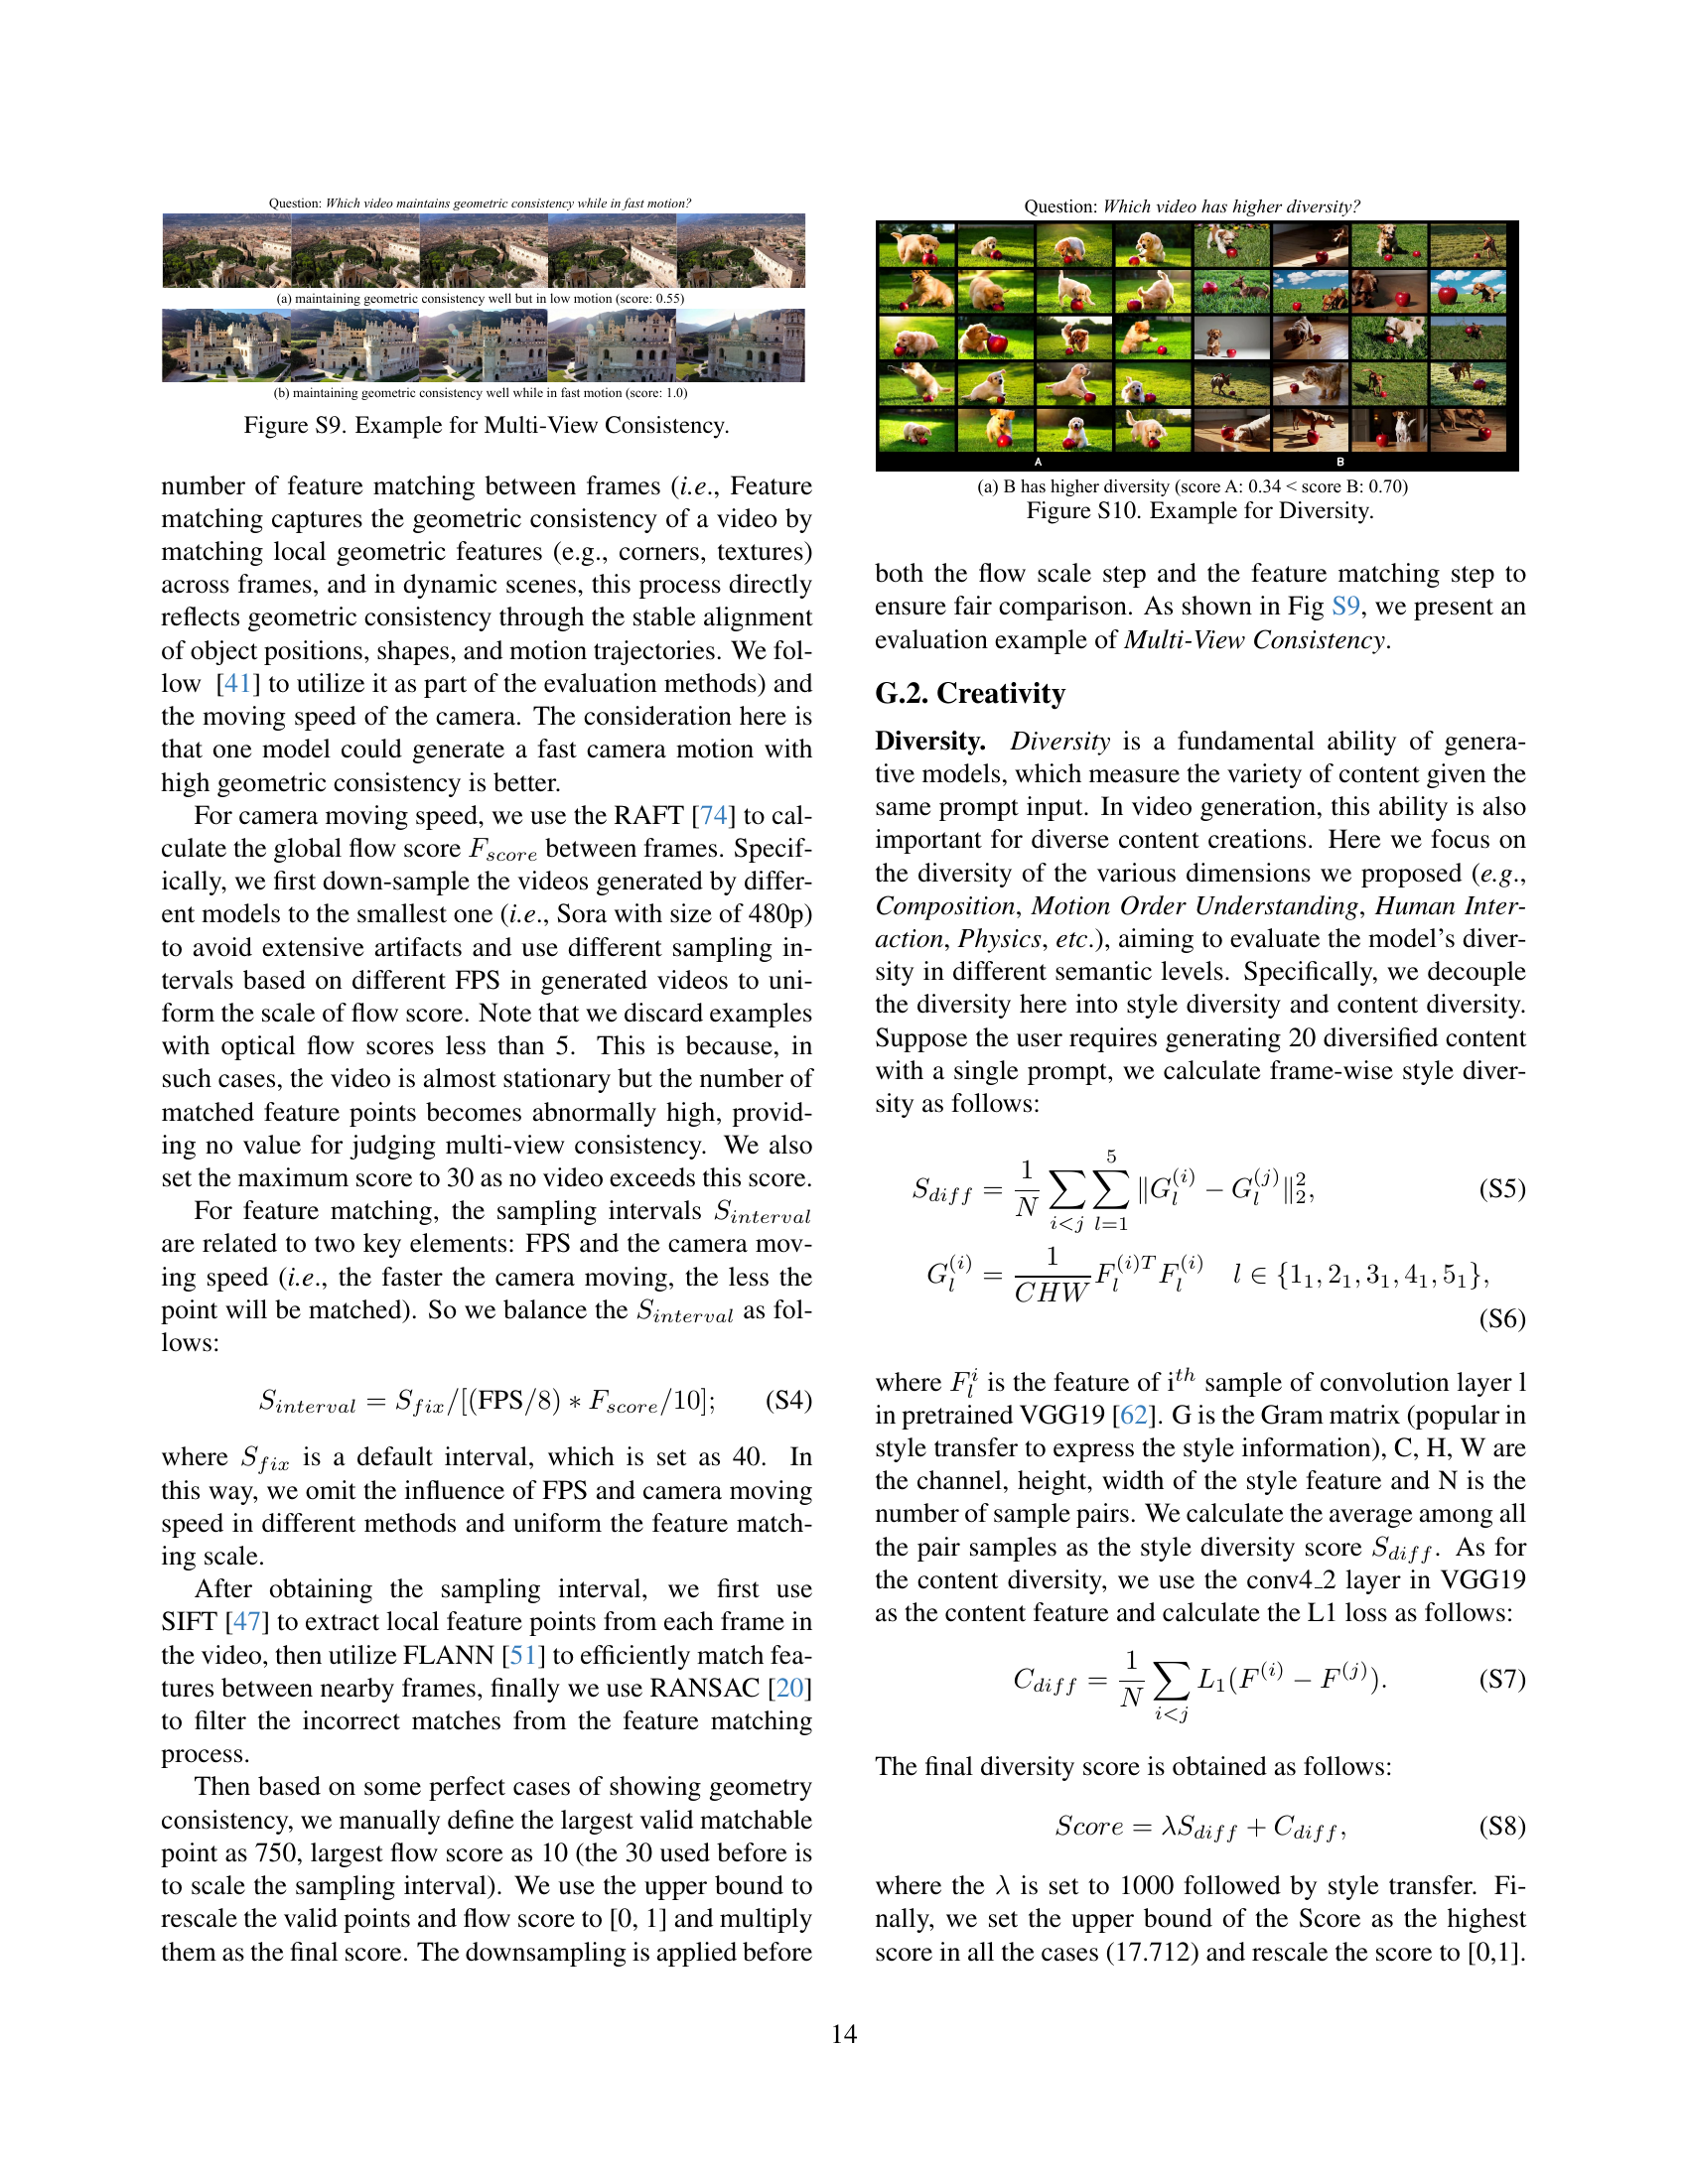
🔼 This figure shows an example of the Multi-View Consistency evaluation from VBench-2.0. It visually demonstrates how the benchmark assesses whether a video maintains geometric consistency, especially when there is fast camera motion. The figure likely contrasts videos where objects maintain their shape and spatial relationships despite camera movement against those where they do not.
read the caption
Figure S9: Example for Multi-View Consistency.

🔼 This figure demonstrates the diversity aspect of the VBench-2.0 benchmark. It shows two example videos generated by different models in response to the same prompt. The goal is to illustrate how diverse the outputs can be when models try to fulfill a prompt, and that diversity is one way to measure creativity in video generation. Visual differences in style and content composition highlight the varying results.
read the caption
Figure S10: Example for Diversity.

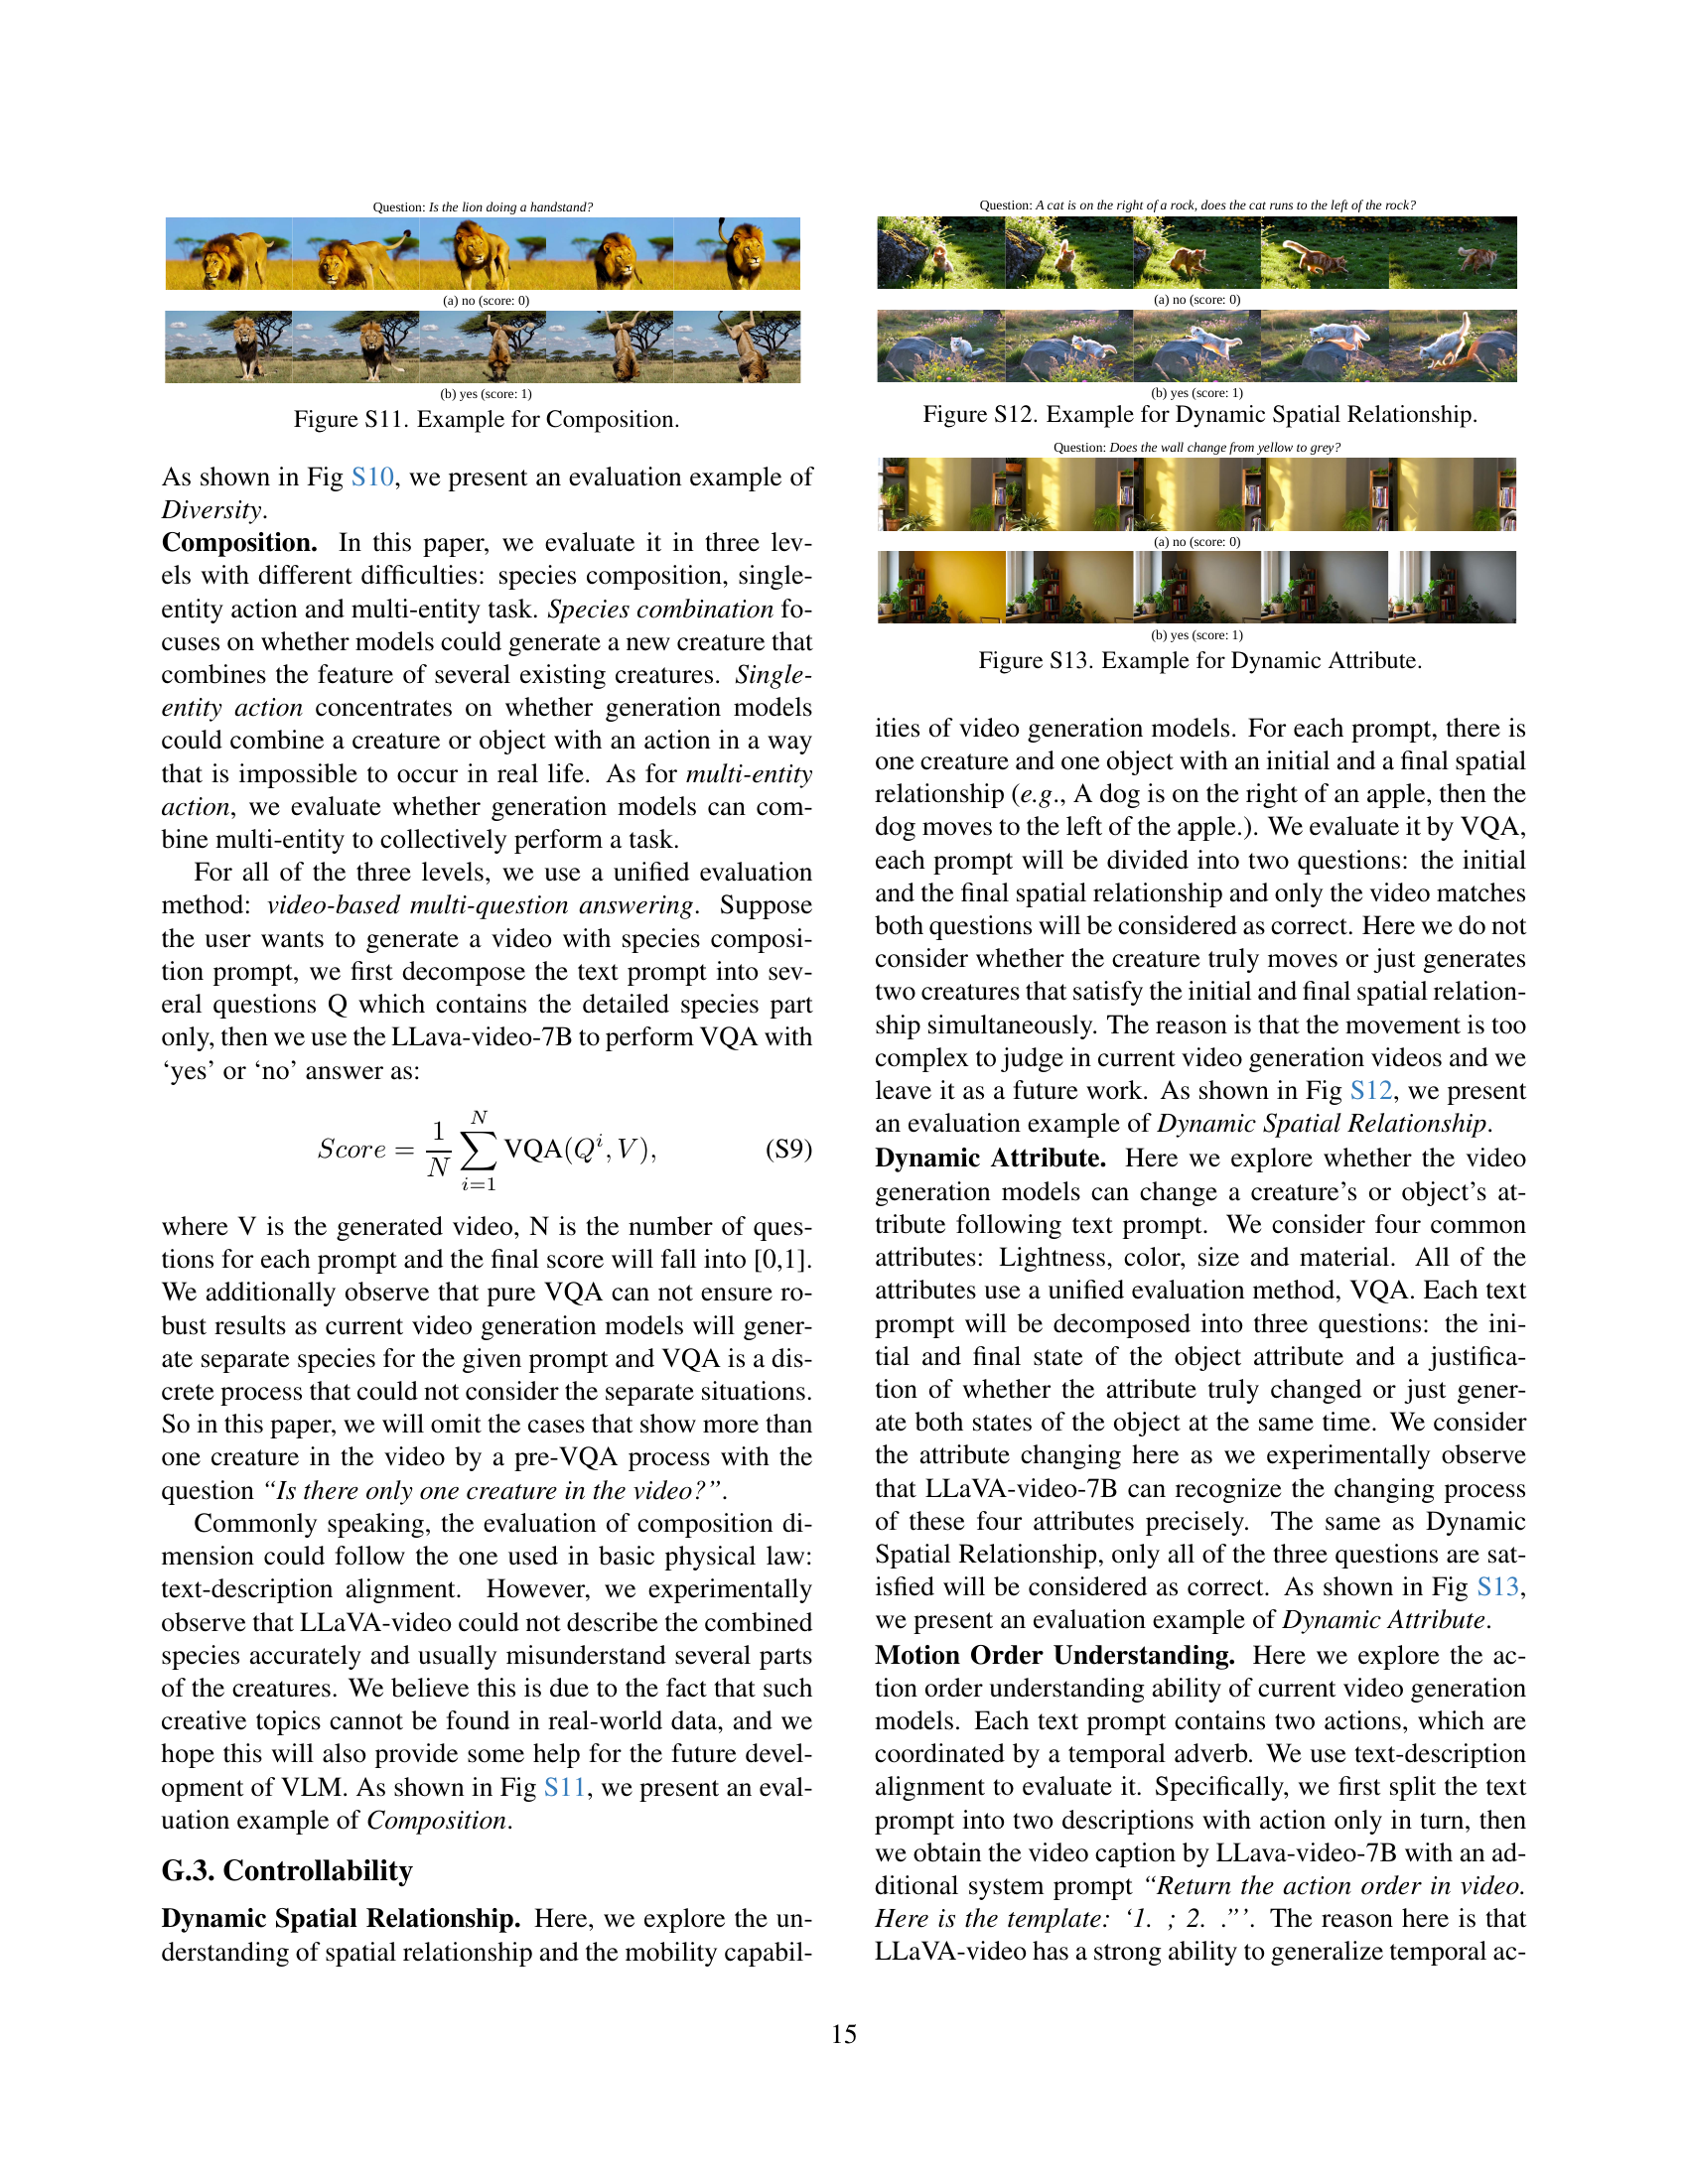
🔼 This figure shows example results for the Composition sub-dimension of the VBench-2.0 benchmark suite. The benchmark evaluates the ability of video generation models to create novel and varied compositions, going beyond simple arrangements. The figure shows examples of video generation model outputs alongside binary evaluations (0 or 1) indicating whether the model succeeded in meeting the specific compositional criteria given in the prompt. These examples illustrate different levels of complexity in composition, such as simple scene arrangements, the combination of multiple entities, and more complex interactions between multiple entities. The goal is to test the model’s ability to create both plausible and novel visual combinations, not just basic arrangements.
read the caption
Figure S11: Example for Composition.

🔼 This figure shows an example of evaluating the Dynamic Spatial Relationship dimension in VBench-2.0. It illustrates a scenario where a dog’s position relative to a sofa changes according to the prompt. The figure displays a sequence of video frames showing the dog initially to the right of the sofa, and then moving to the left of the sofa as instructed by the prompt. This demonstrates the model’s ability to accurately render spatial relationships and object movements in response to detailed textual instructions.
read the caption
Figure S12: Example for Dynamic Spatial Relationship.

🔼 This figure shows an example of evaluating the Dynamic Attribute dimension in VBench-2.0. The Dynamic Attribute dimension assesses whether a model accurately changes the attributes of objects or creatures in a video as specified in a text prompt. The example shown likely illustrates a change in the color of an object. A question is posed: ‘Does the wall change from yellow to grey?’ The image then displays two videos: one where the wall remains yellow (incorrect), and another where the wall changes to grey (correct). This demonstrates the evaluation process; the model’s ability to modify attributes successfully is judged based on whether it reflects the changes described in the prompt.
read the caption
Figure S13: Example for Dynamic Attribute.

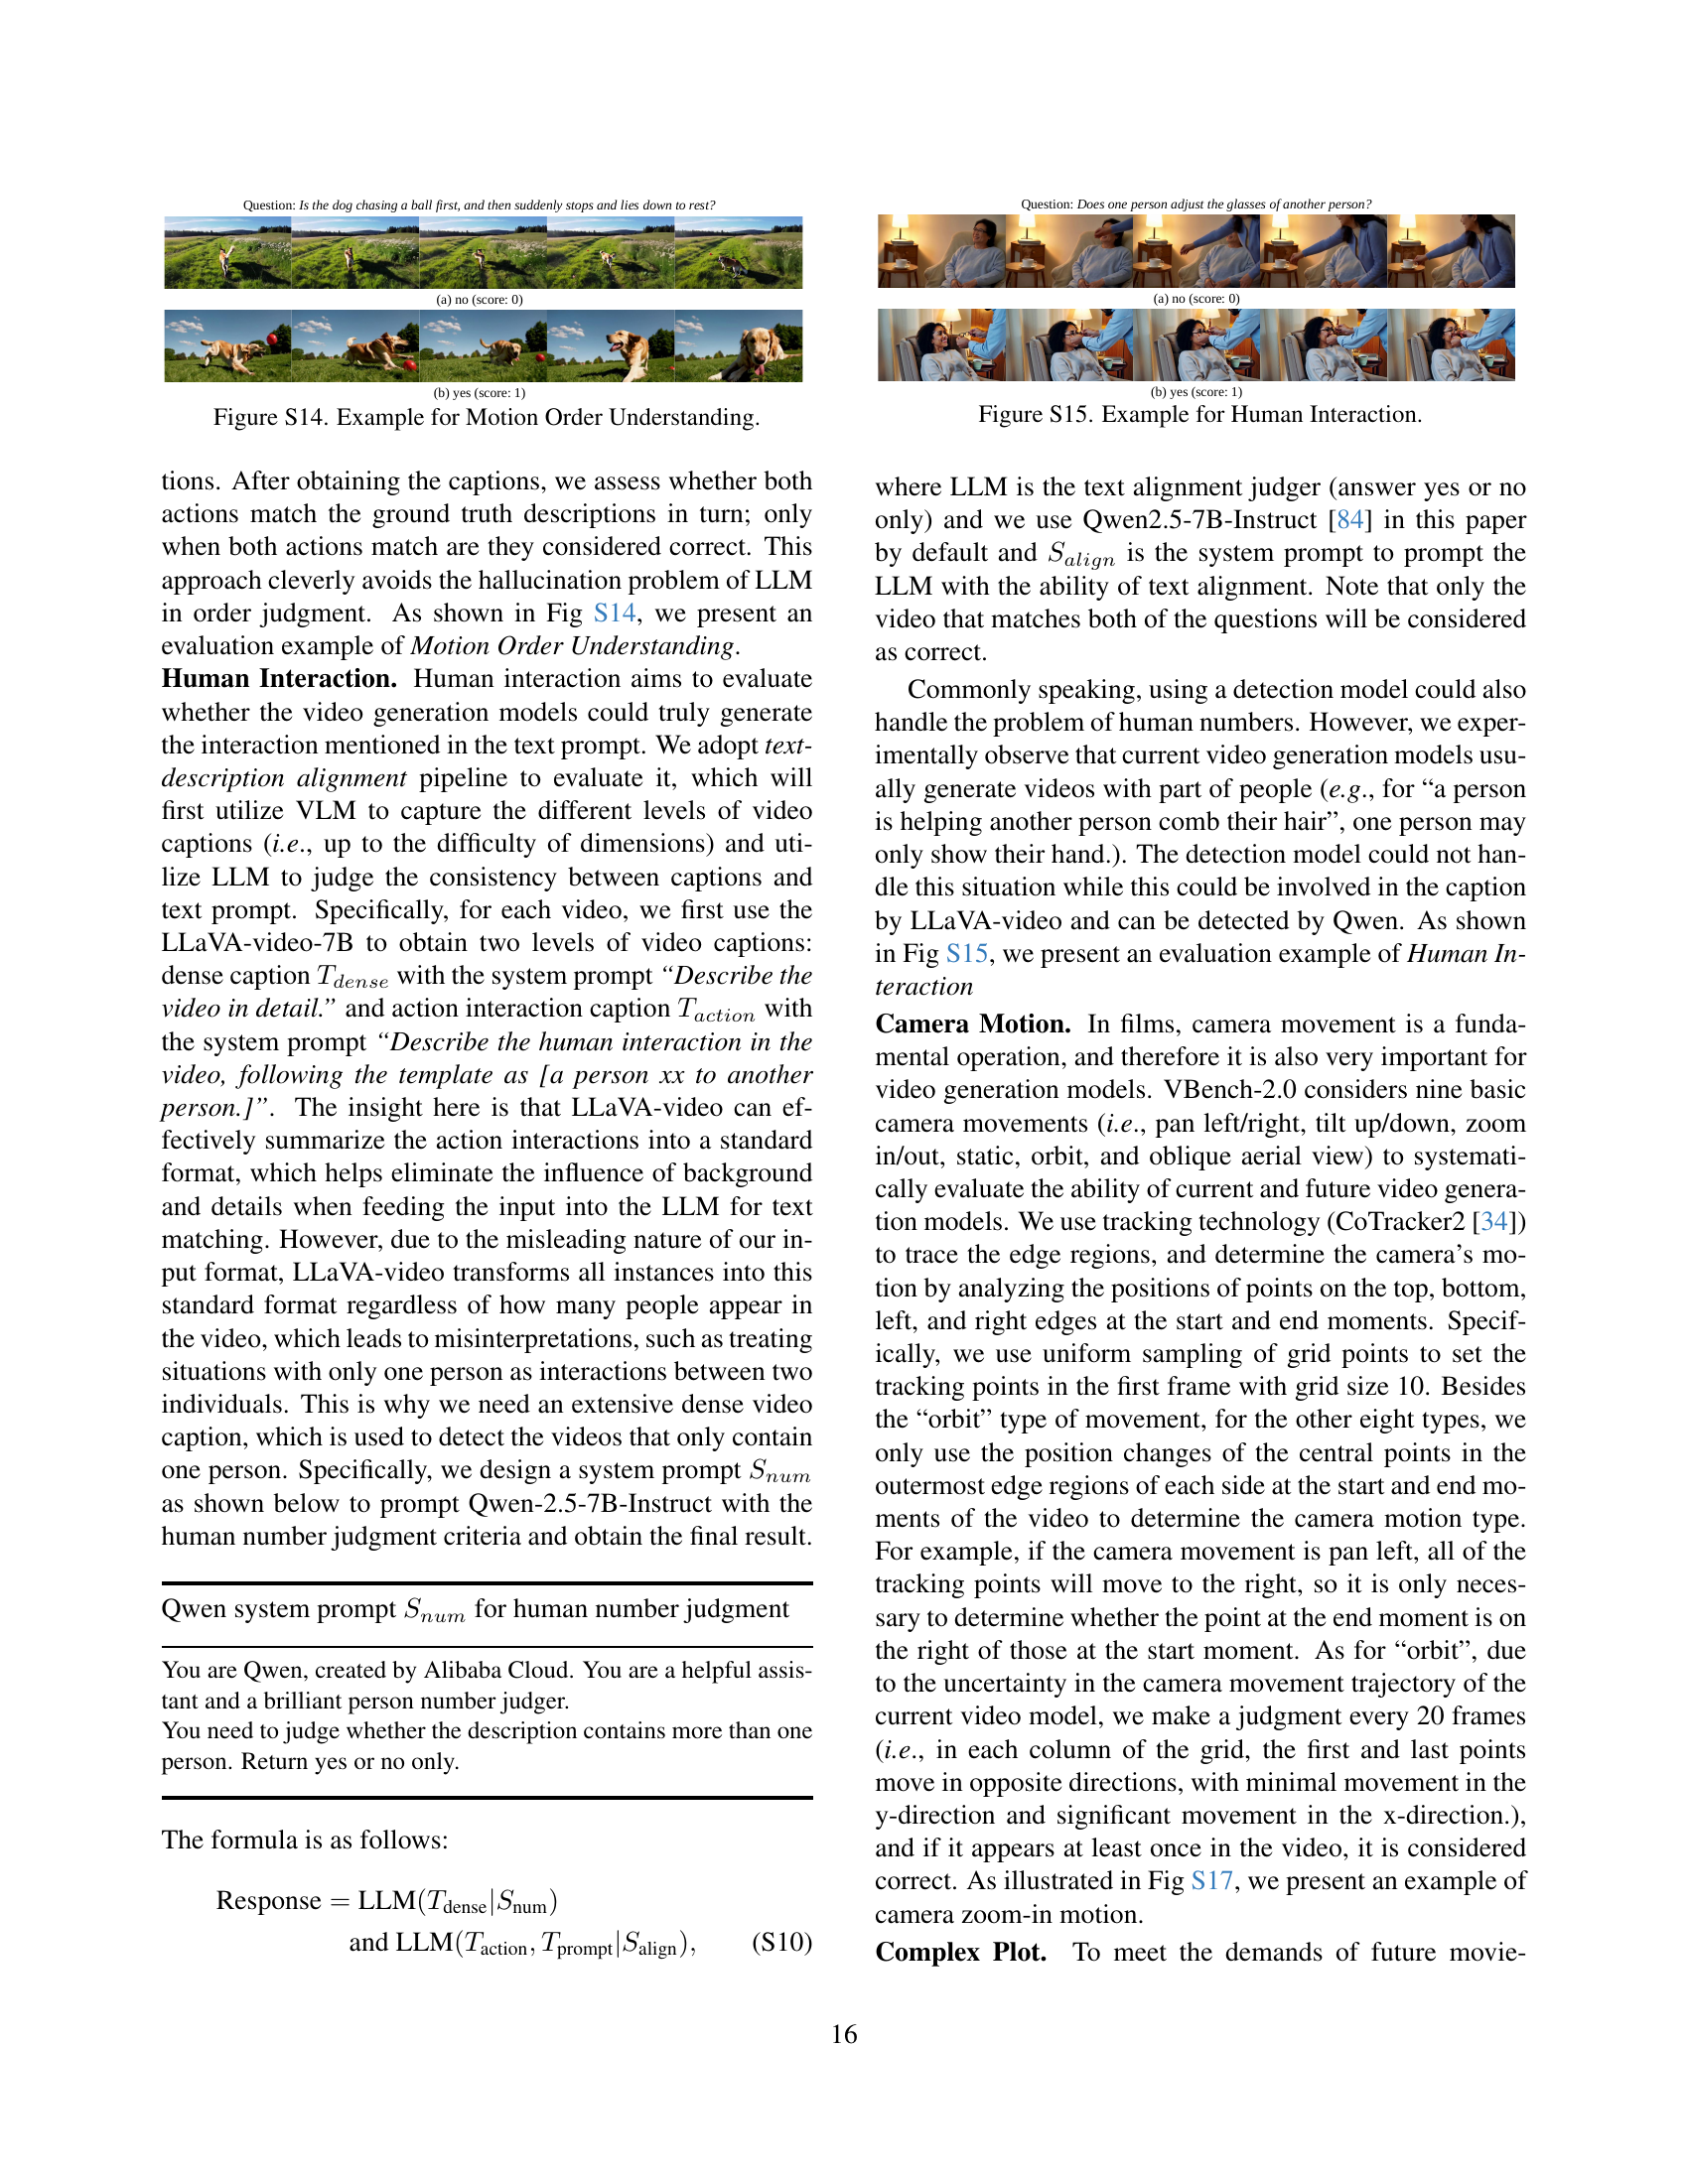
🔼 This figure shows an example of evaluating the ‘Motion Order Understanding’ dimension in VBench-2.0. The evaluation involves a video generated by a model in response to a prompt specifying a sequence of actions. The image displays the prompt question and example video frames, illustrating whether the model correctly generated the actions in the specified order. The caption shows two example prompts and two responses for the assessment.
read the caption
Figure S14: Example for Motion Order Understanding.
🔼 This figure shows an example of evaluating the ‘Human Interaction’ dimension in VBench-2.0. It demonstrates the assessment of whether video generation models correctly depict interactions between humans. The specific scenario shown involves one person adjusting another person’s glasses. This necessitates understanding complex human behavior and the spatial relationships between individuals during the action.
read the caption
Figure S15: Example for Human Interaction.

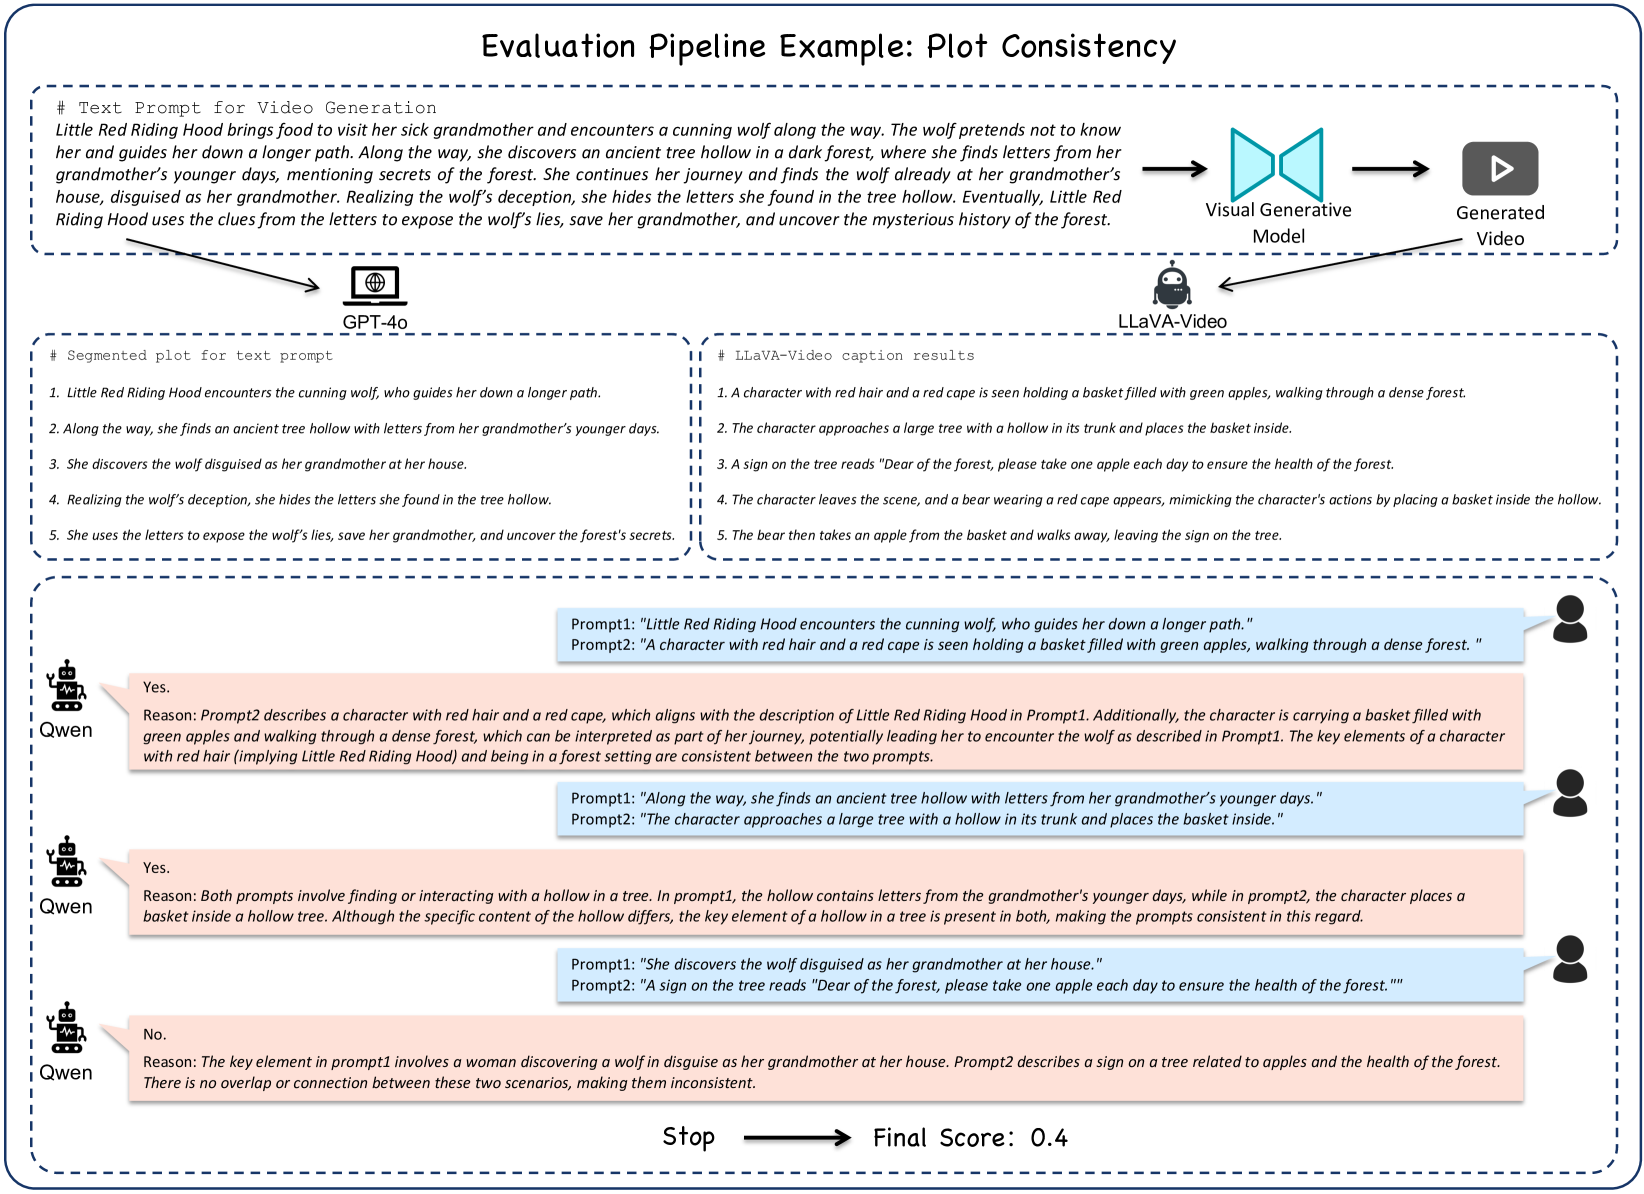
🔼 This figure illustrates the evaluation pipeline and results for the ‘Complex Plot’ dimension of VBench-2.0. It shows how a long, multi-part story prompt is broken down into individual plot points. The video generation model produces a video, and then a Vision-Language Model (VLM) generates a caption describing the video’s content. A Large Language Model (LLM) then compares the VLM’s caption to the original prompt’s plot points to assess how well the video’s narrative matches the intended storyline. The final score reflects the degree of alignment between the generated video and the expected plot progression. The example uses ‘Little Red Riding Hood’ as the story prompt.
read the caption
Figure S16: Example for Complex Plot.

🔼 This figure showcases an example of dynamic camera motion from video generation models. Specifically, it demonstrates how well models can produce specified camera movements, such as zooming in or out. This test is part of the Physics dimension within the VBench-2.0 benchmark suite, which evaluates various aspects of video realism beyond visual aesthetics.
read the caption
Figure S17: Example of Dynamic Camera Motion.

🔼 This figure shows an example of a complex plot evaluation from the VBench-2.0 benchmark. The top shows the prompt used for video generation, detailing a multi-step story of Little Red Riding Hood. Below, the evaluation pipeline is illustrated: the prompt is segmented into five key plot points, a video generative model produces a video, and then LLAVA-video and Qwen models are used to assess how well the video matches each plot point. The final score for plot consistency is displayed.
read the caption
Figure S18: Example for Plot Consistency.

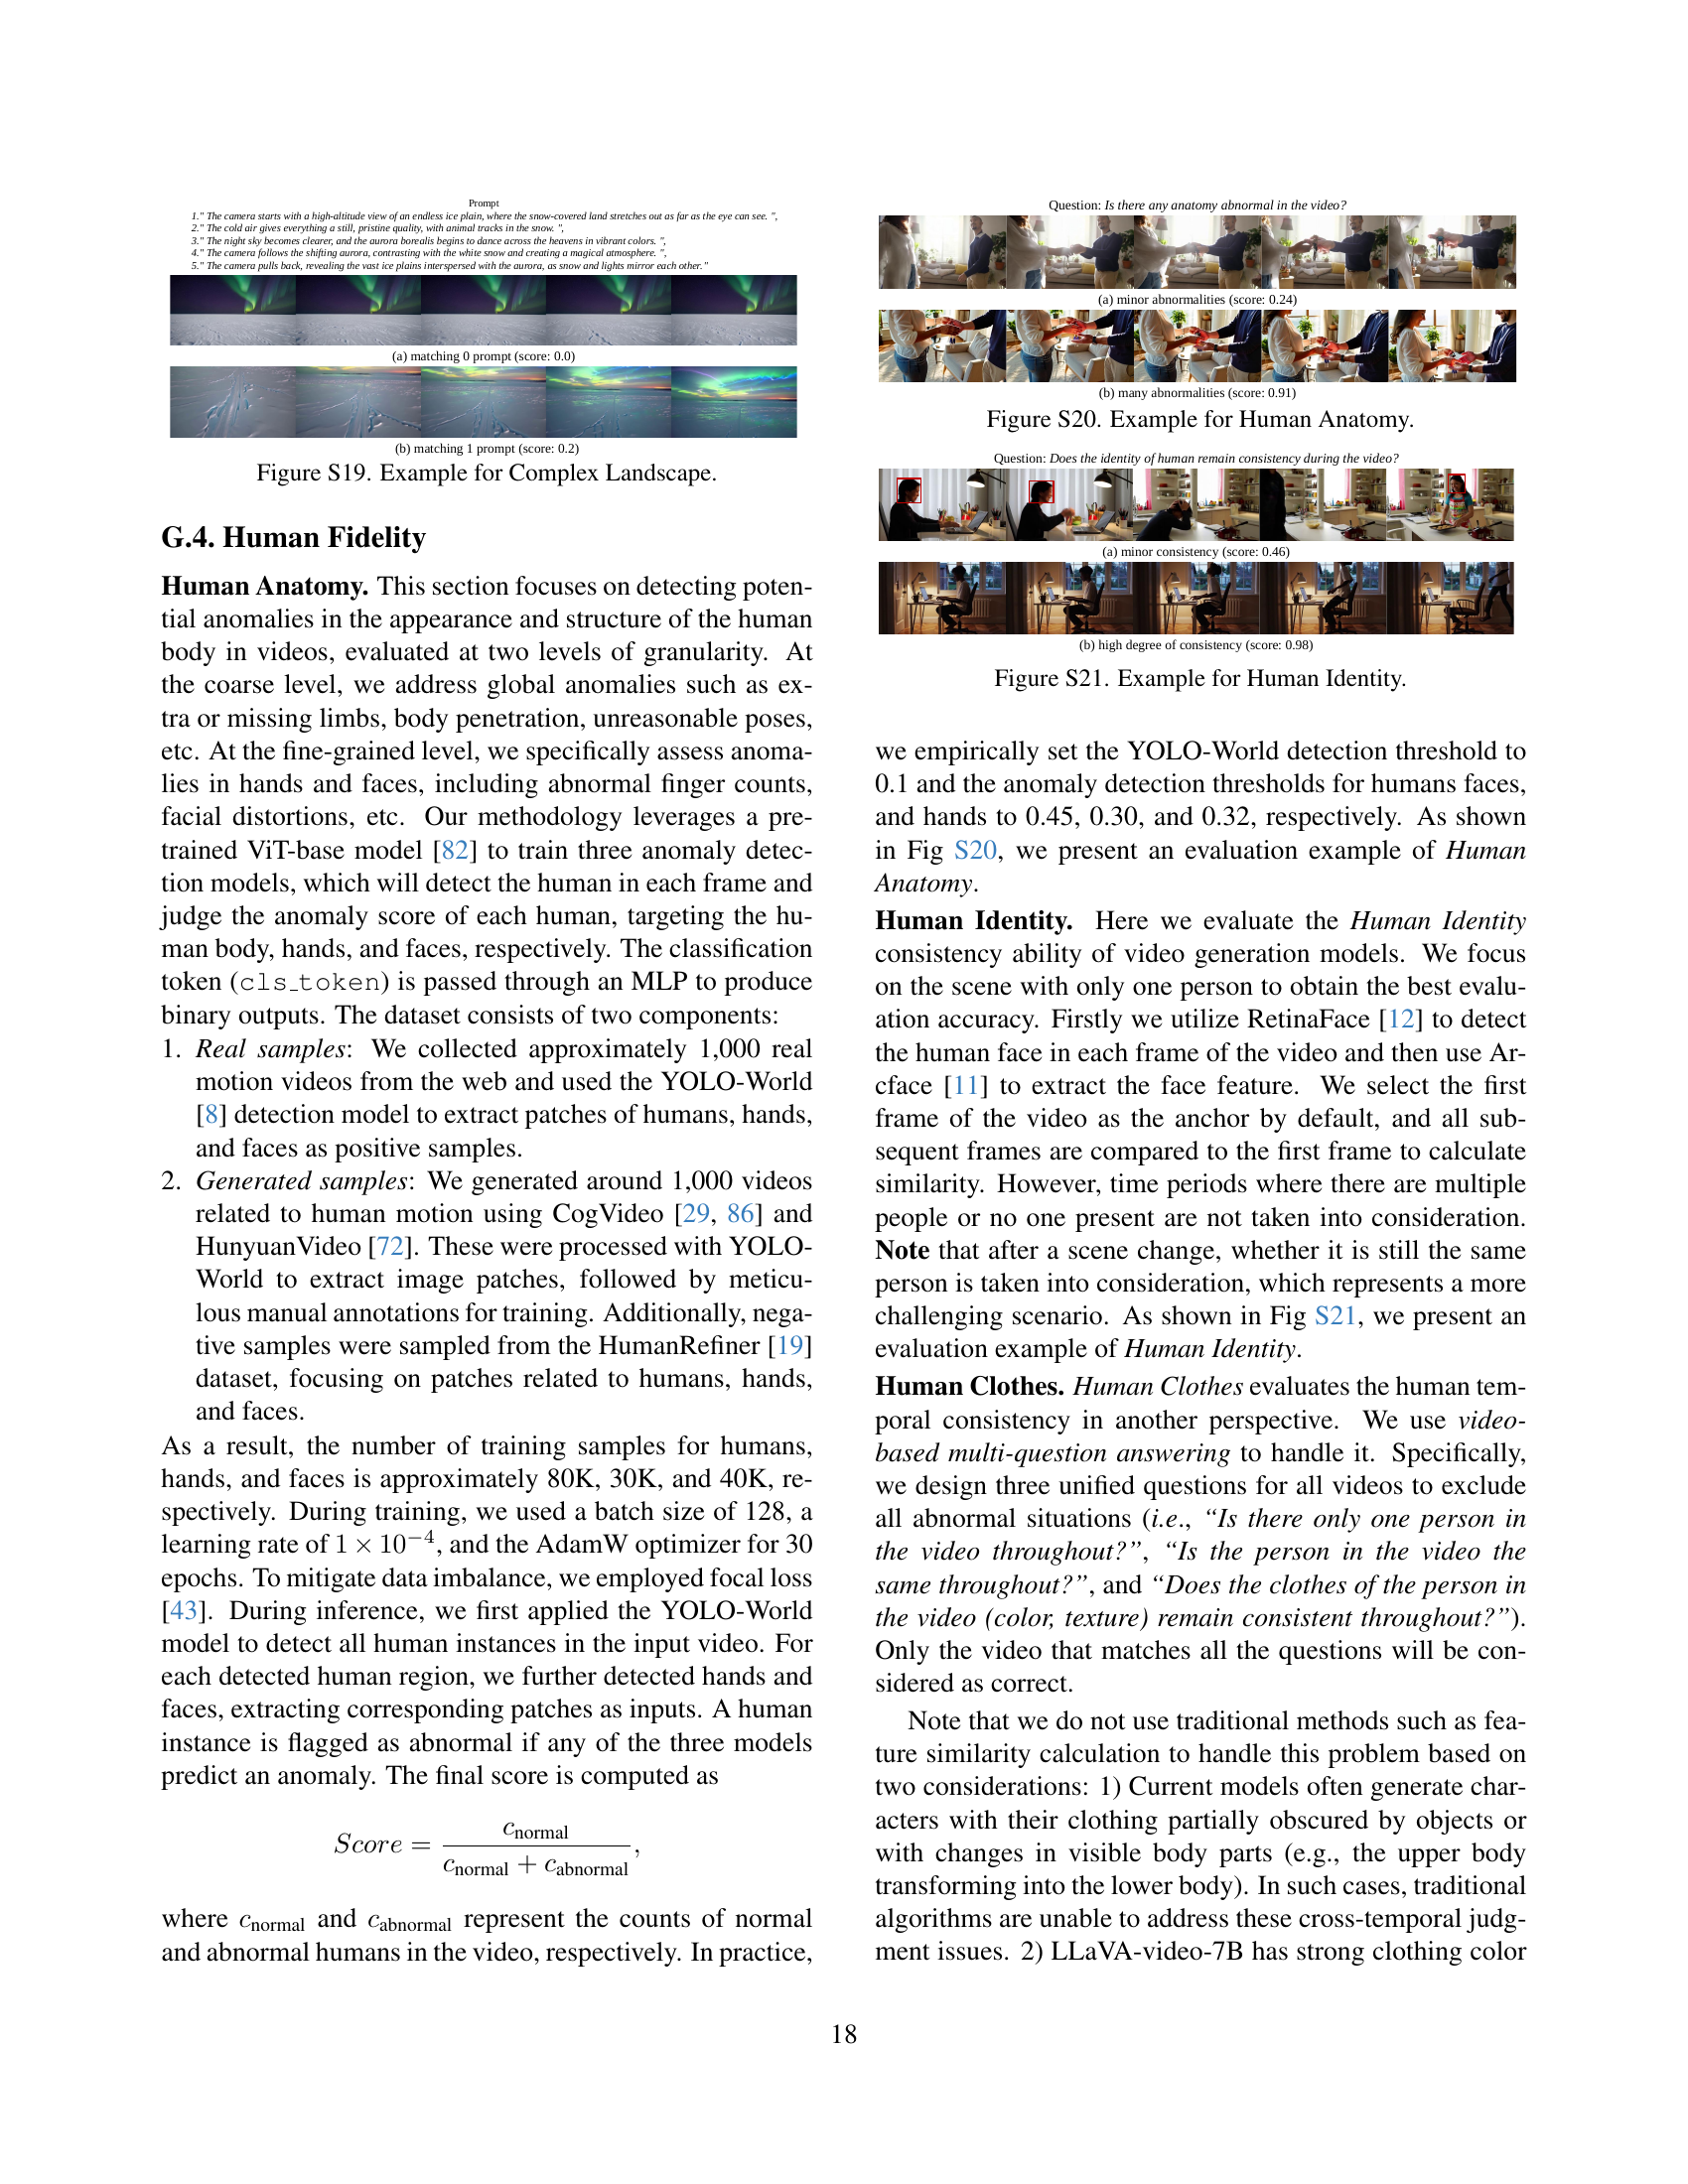
🔼 This figure shows an example of a complex landscape prompt from the VBench-2.0 evaluation suite. It illustrates how well a video generation model can create a long, detailed video that accurately reflects a multi-part description of a landscape. The prompt describes a scene shifting from a high-altitude view of an endless ice plain, progressing through changes in time of day and weather, finally ending with the camera pulling back, revealing the aurora borealis in the vastness of the plains.
read the caption
Figure S19: Example for Complex Landscape.

🔼 This figure shows examples of human anatomy evaluation in VBench-2.0. It visually demonstrates instances where video generation models produce anomalies in human figures, such as missing limbs, distorted body parts, and incorrect hand or face structures. These examples highlight the challenges in achieving high-fidelity human representation in generated videos, a key area assessed by VBench-2.0’s Human Fidelity dimension.
read the caption
Figure S20: Example for Human Anatomy.

🔼 This figure shows an example of evaluating the consistency of human identity in generated videos. Two video clips are presented, one where the identity of the person remains consistent throughout (high score), and another where the identity changes or is inconsistent (low score). This is assessed using the ArcFace model, measuring the similarity of facial features between frames. Inconsistent identity might be indicated by changes in facial appearance, hair style, or other distinguishing features over the duration of the video.
read the caption
Figure S21: Example for Human Identity.

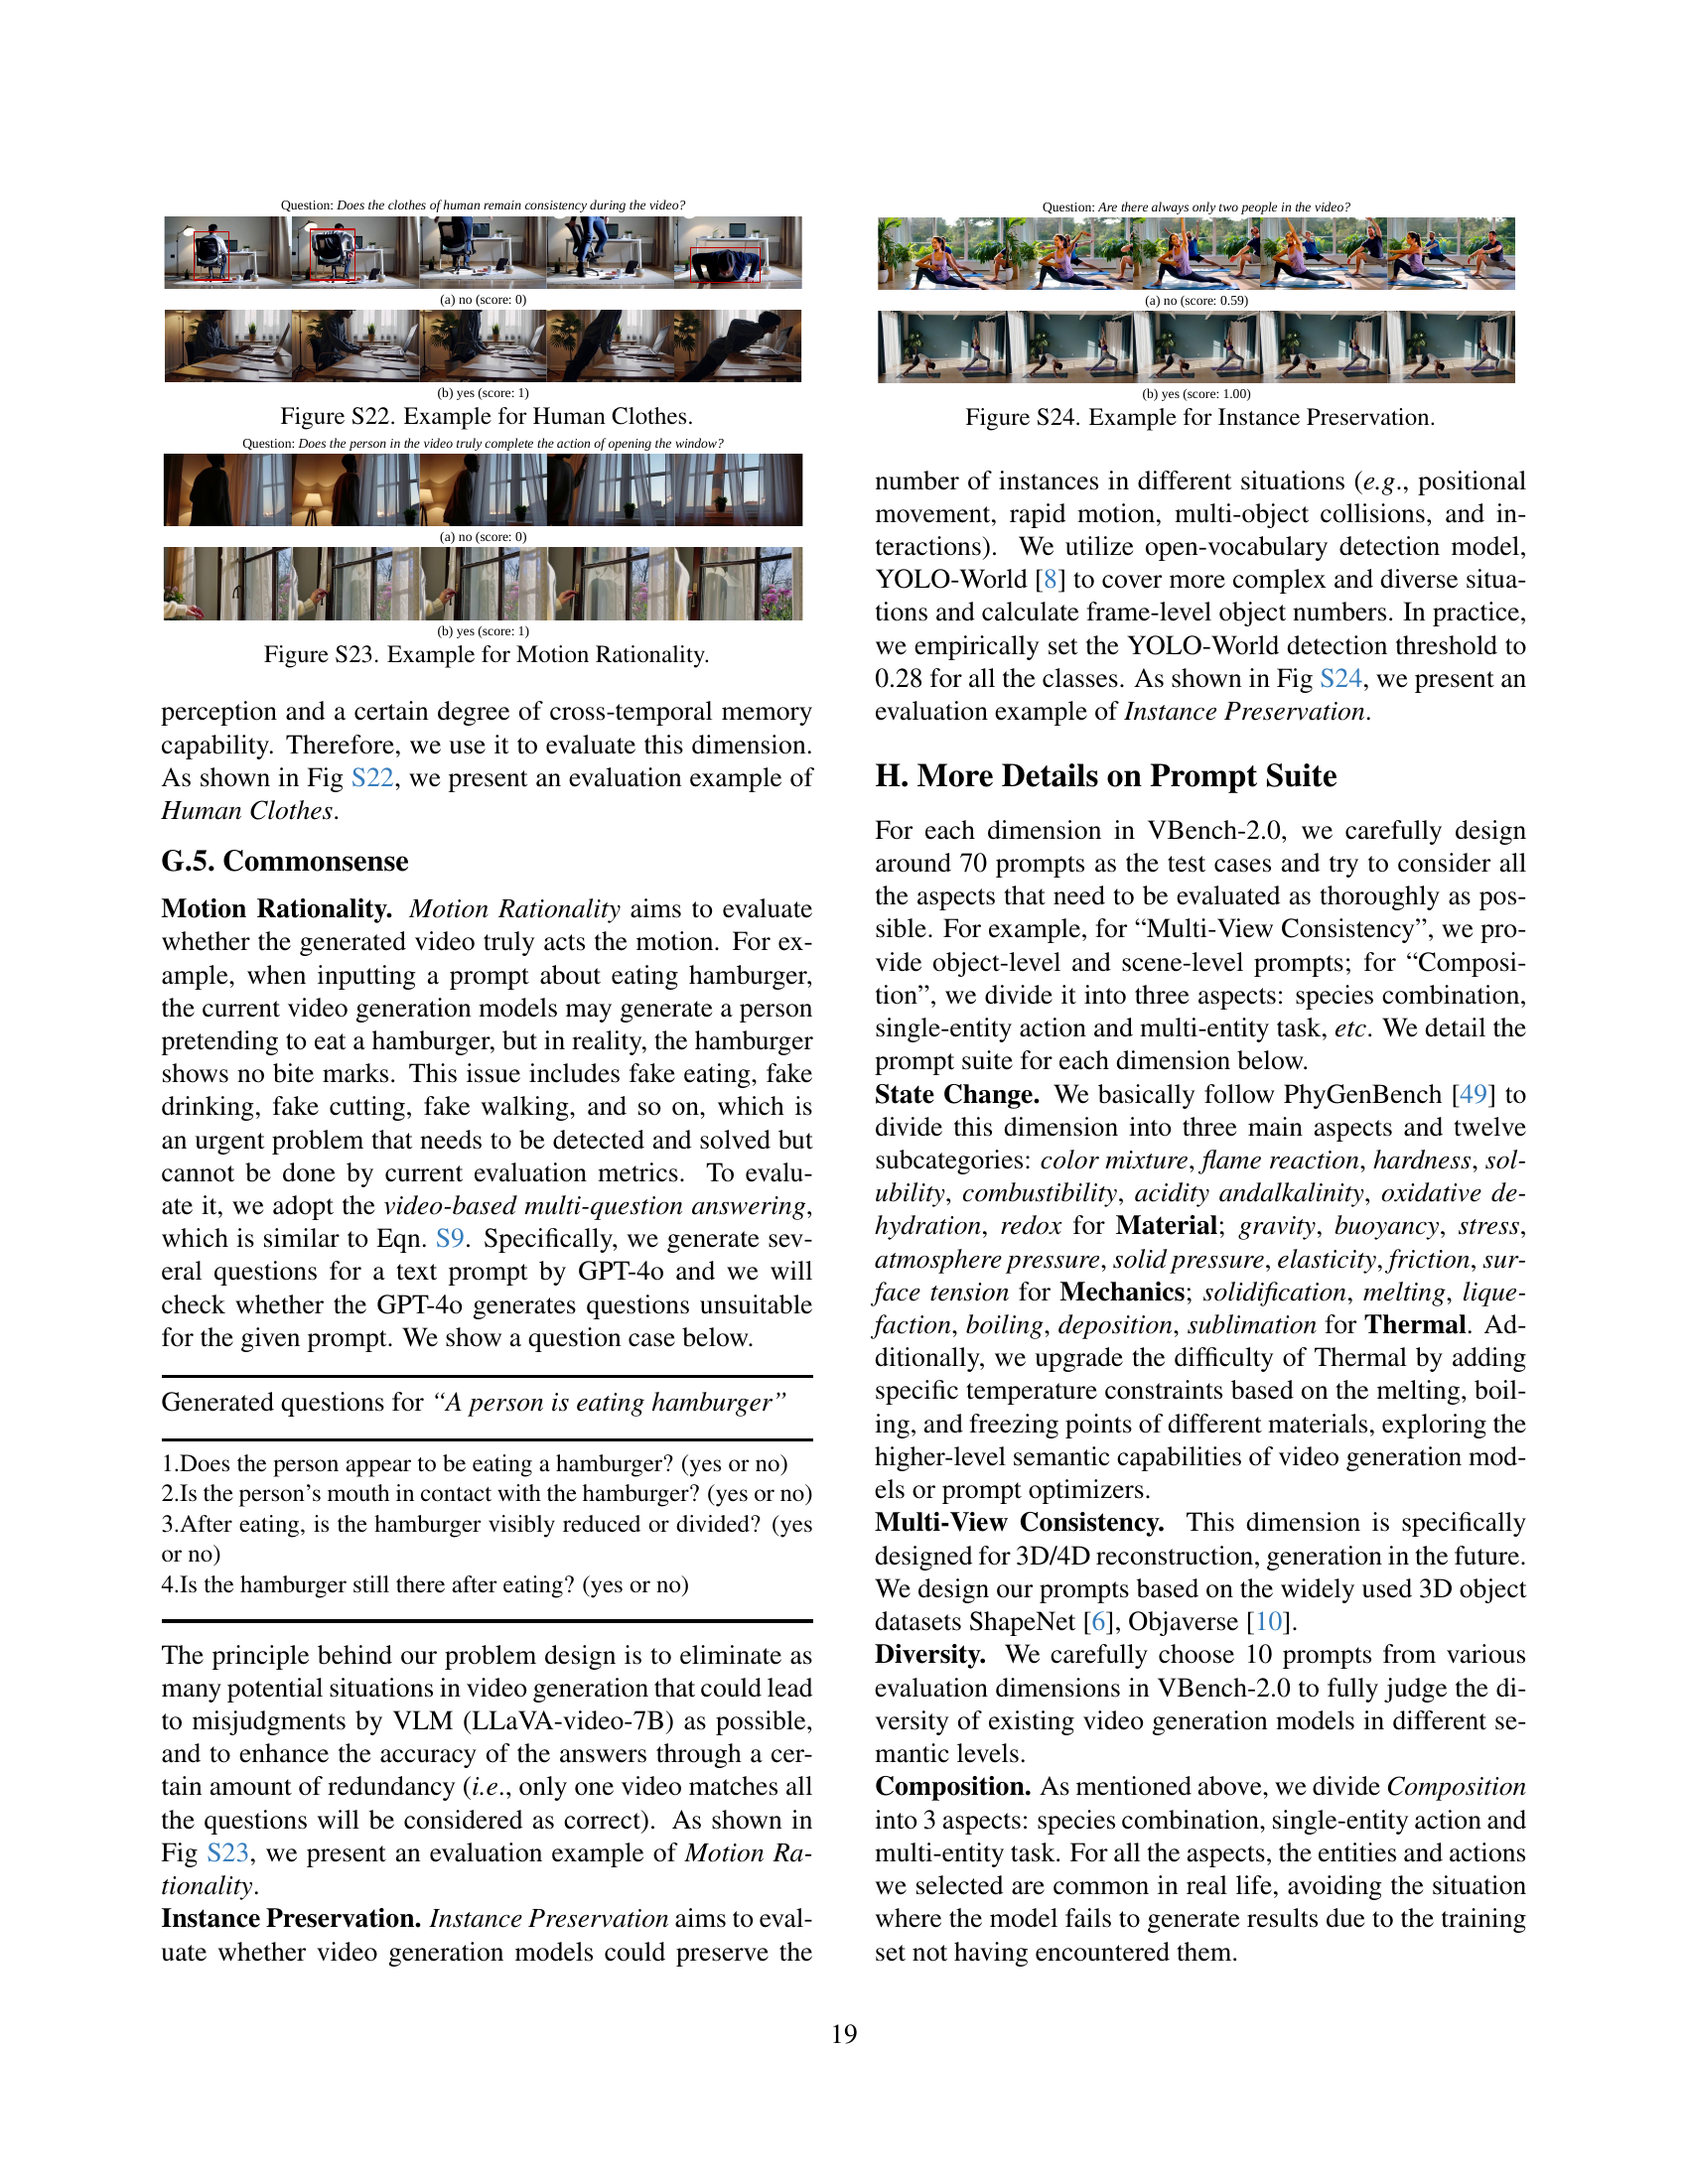
🔼 This figure shows examples of video frames where the human clothes maintain consistency (left) and inconsistency (right) throughout the video. The evaluation assesses if the generated video shows consistent clothing for the human character across all frames, focusing on color, texture, and overall garment. Inconsistent clothing would involve changes in these attributes or instances where the clothing seemingly disappears or changes arbitrarily.
read the caption
Figure S22: Example for Human Clothes.

🔼 This figure shows an example of evaluating the Motion Rationality dimension in VBench-2.0. The image displays a video still where a person is supposedly opening a window. The question posed is whether the person in the video truly completes the action of opening the window, which is a crucial element of assessing intrinsic faithfulness. The ‘yes’ answer implies that the generated video accurately depicts the entire action, demonstrating an understanding of real-world mechanics, while a ’no’ answer indicates a flaw where the motion is incomplete or unrealistic, highlighting a deficiency in the model’s commonsense reasoning or physical simulation capabilities.
read the caption
Figure S23: Example for Motion Rationality.

🔼 This figure demonstrates the evaluation of instance preservation in video generation models. Instance preservation assesses a model’s ability to maintain the correct number of objects throughout a video, even with complex scenarios such as object movement, collisions, and interactions. The figure likely shows example video frames, highlighting instances where a model successfully preserves object counts (correct) and where it fails (incorrect). This allows assessment of the model’s ability to understand and maintain the consistent number of objects within a video scene, even under dynamic changes.
read the caption
Figure S24: Example for Instance Preservation.
More on tables
| Models | \CenterstackHuman | ||||||||
| \CenterstackHuman | |||||||||
| \CenterstackHuman | |||||||||
| \CenterstackComposition | \CenterstackDiversity | Mechanics | Material | Thermotics | \CenterstackMulti-view | ||||
| Consistency | |||||||||
| HunyuanVideo [72] | 88.58% | 82.97% | 75.67% | 43.96% | 39.73% | 76.09% | 64.37% | 56.52% | 43.80% |
| CogVideoX-1.5 [86] | 59.72% | 87.18% | 69.51% | 44.70% | 42.61% | 80.80% | 83.19% | 67.13% | 21.79% |
| Sora [53] | 86.45% | 98.15% | 78.57% | 53.65% | 67.48% | 62.22% | 64.94% | 43.36% | 58.22% |
| Kling 1.6 [69] | 86.99% | 91.75% | 71.95% | 43.89% | 53.26% | 65.55% | 68.00% | 59.46% | 64.38% |
| Models | \CenterstackDynamic Spatial | ||||||||
| \CenterstackDynamic | |||||||||
| \CenterstackMotion Order | |||||||||
| \CenterstackHuman | |||||||||
| \CenterstackComplex | |||||||||
| \CenterstackComplex | |||||||||
| \CenterstackCamera | |||||||||
| \CenterstackMotion | |||||||||
| \CenterstackInstance | |||||||||
| Preservation | |||||||||
| HunyuanVideo [72] | 21.26% | 22.71% | 26.60% | 67.67% | 19.56% | 10.11% | 33.95% | 34.48% | 73.79% |
| CogVideoX-1.5 [86] | 19.32% | 24.18% | 26.94% | 73.00% | 23.11% | 12.42% | 33.33% | 33.91% | 71.03% |
| Sora [53] | 19.81% | 8.06% | 14.81% | 59.00% | 14.67% | 11.67% | 27.16% | 34.48% | 74.60% |
| Kling 1.6 [69] | 20.77% | 19.41% | 29.29% | 72.67% | 18.44% | 11.83% | 61.73% | 38.51% | 76.10% |
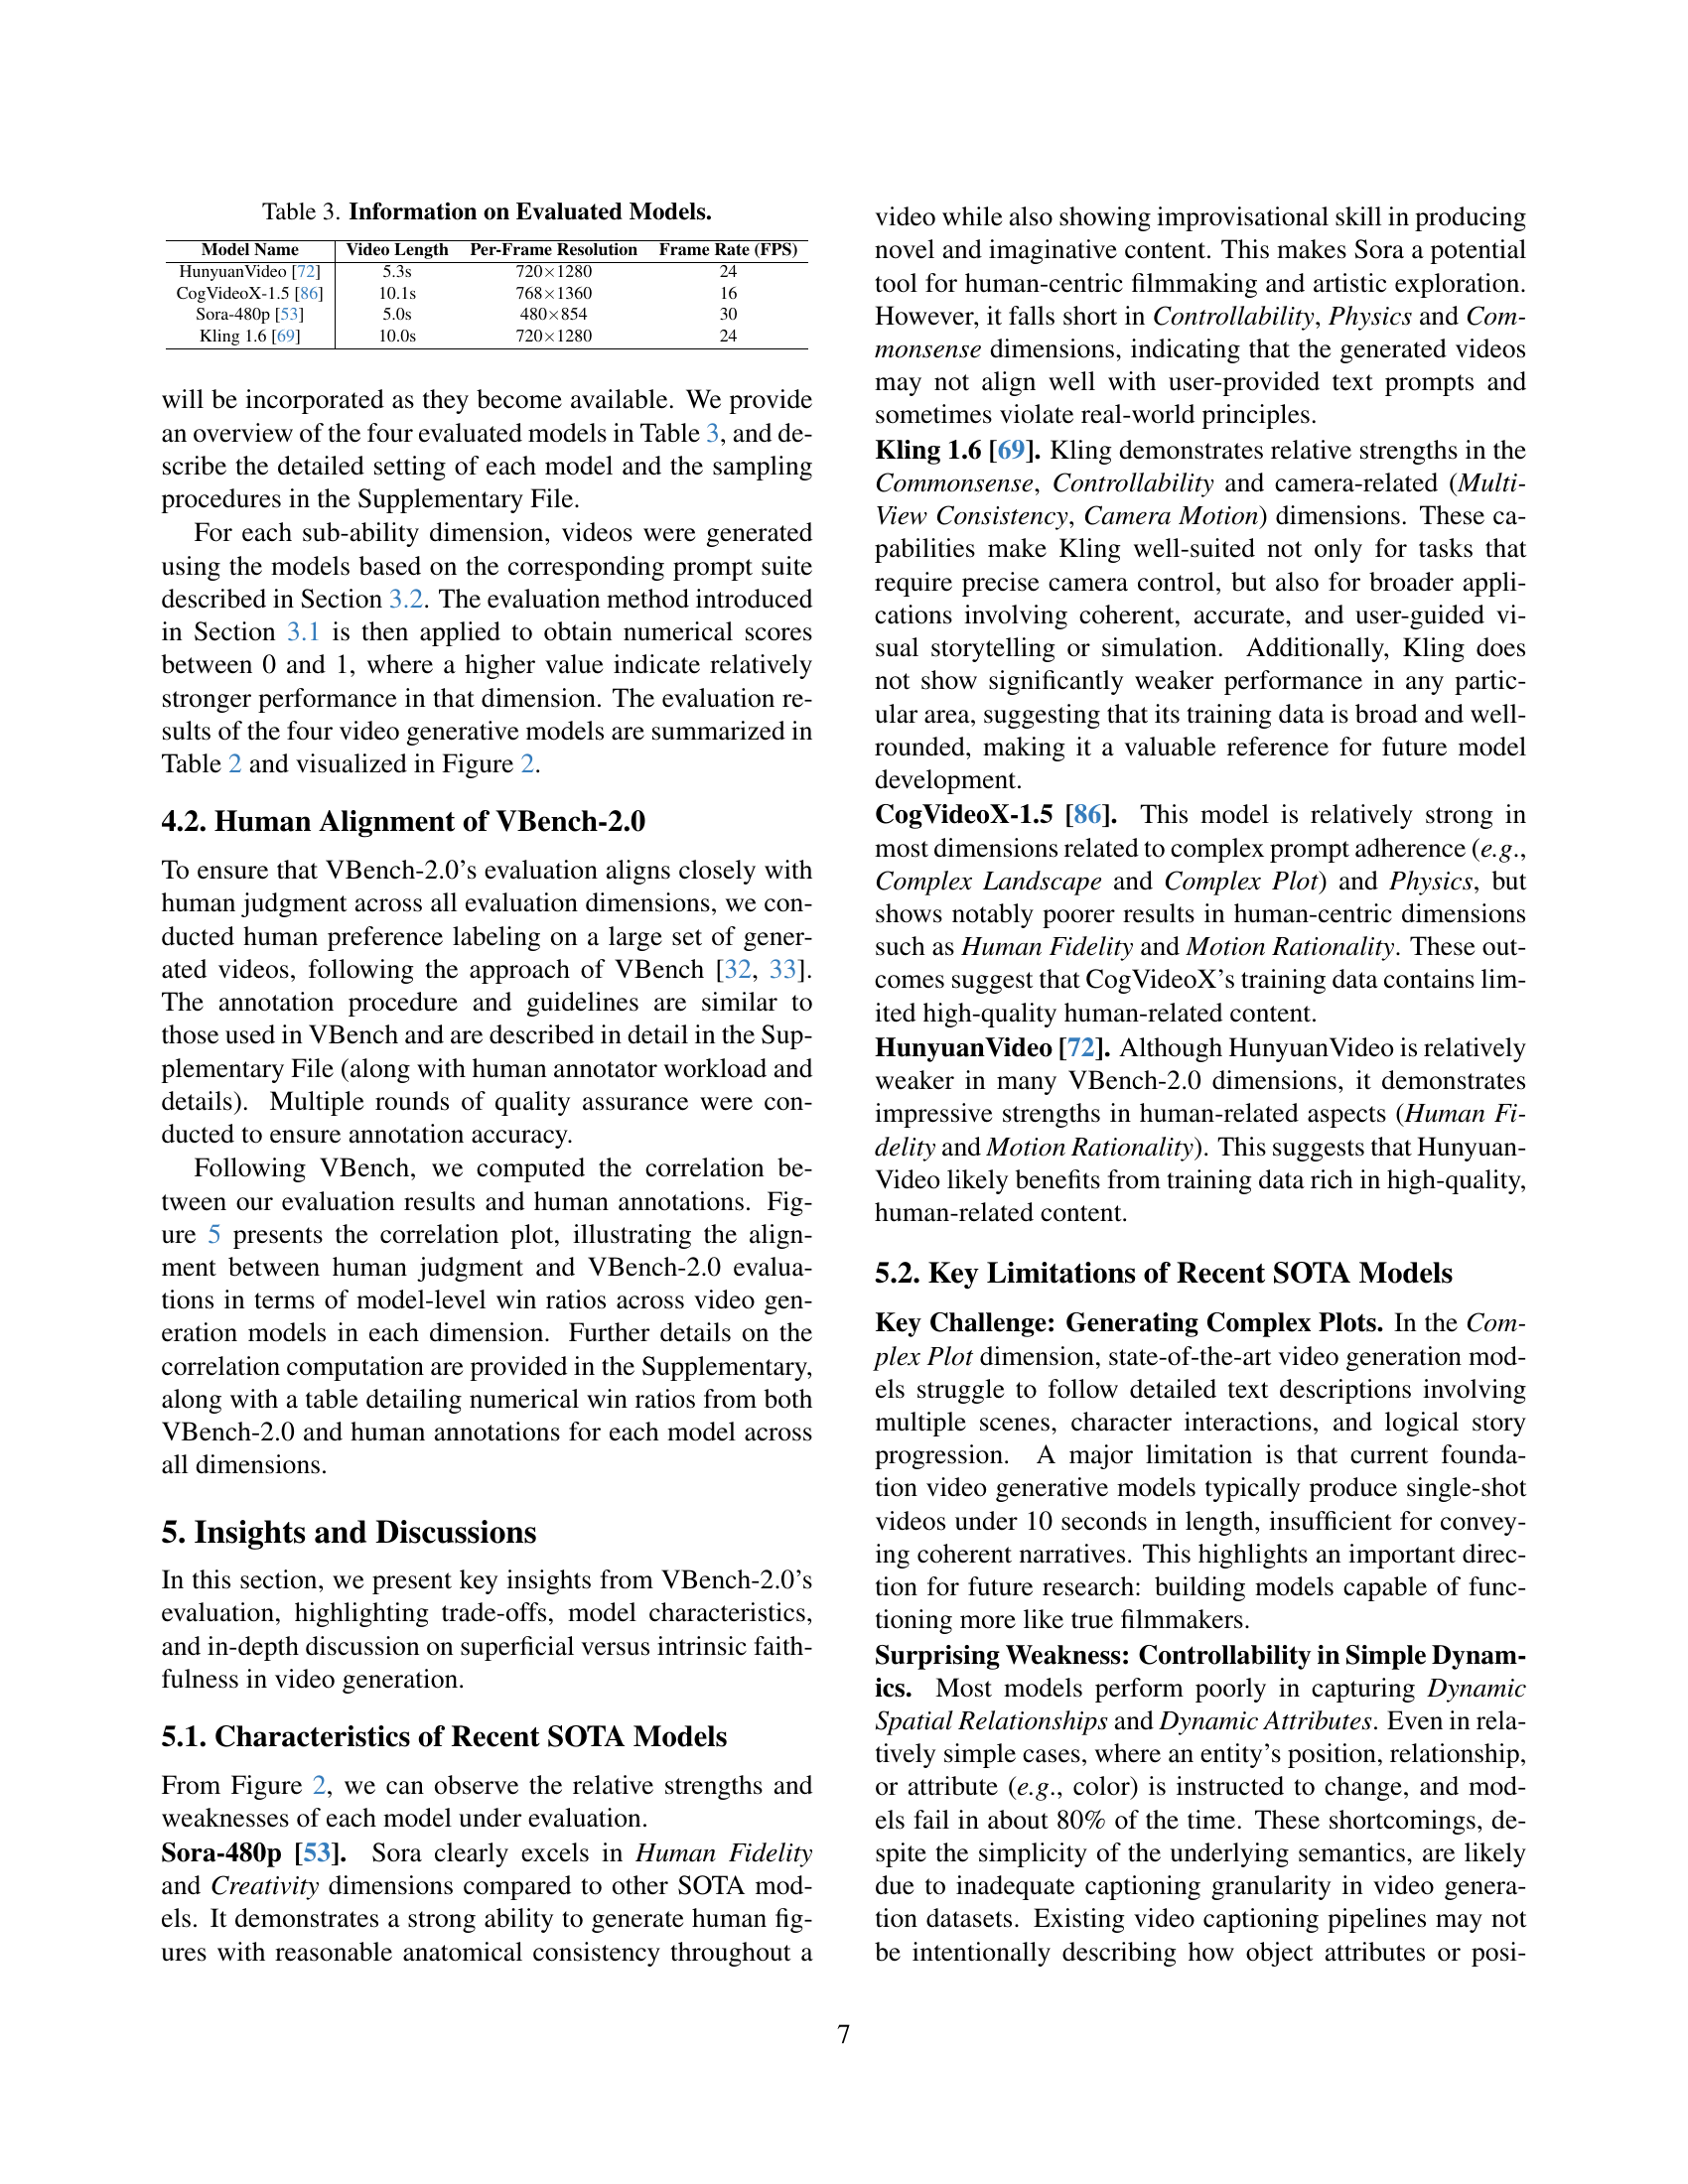
🔼 Table 2 presents a comprehensive evaluation of four state-of-the-art video generation models across 18 distinct dimensions defined by the VBench-2.0 benchmark. Each dimension represents a specific aspect of video generation quality, such as human fidelity, controllability, creativity, physics simulation, and commonsense reasoning. The table shows the performance of each model on each dimension, allowing for a detailed comparison of their strengths and weaknesses. Higher scores indicate better performance within that specific dimension.
read the caption
Table 2: VBench-2.0 Evaluation Results per Dimension. This table presents evaluation results for four recent state-of-the-art video generation models across all 18 VBench-2.0 dimensions. A higher score indicates better performance in the corresponding dimension.
| \CenterstackModel Name | \CenterstackVideo Length | \CenterstackPer-Frame Resolution | \CenterstackFrame Rate (FPS) |
| HunyuanVideo [72] | 5.3s | 7201280 | 24 |
| CogVideoX-1.5 [86] | 10.1s | 7681360 | 16 |
| Sora-480p [53] | 5.0s | 480854 | 30 |
| Kling 1.6 [69] | 10.0s | 7201280 | 24 |
🔼 This table provides detailed information about the four state-of-the-art video generation models used in the VBench-2.0 evaluation. For each model, it lists the video length, per-frame resolution, and frame rate (FPS). This information is crucial for understanding the computational resources and characteristics of the videos generated by each model and how these factors might influence the evaluation results.
read the caption
Table 3: Information on Evaluated Models.
| Models | \CenterstackHuman | ||||||||
| \CenterstackHuman | |||||||||
| \CenterstackHuman | |||||||||
| \CenterstackComposition | \CenterstackDiversity | Mechanics | Material | Thermotics | \CenterstackMulti-View | ||||
| Consistency | |||||||||
| HunyuanVideo [72] | 67.73% / 58.73% | 44.49% / 45.67% | 52.60% / 58.19% | 46.02% / 40.25% | 16.67% / 36.67% | 53.30% / 50.64% | 45.70% / 45.49% | 50.13% / 46.08% | 52.83% / 50.39% |
| CogVideoX-1.5 [86] | 13.10% / 5.28% | 48.12% / 44.28% | 36.81% / 20.62% | 50.00% / 46.23% | 26.67% / 28.33% | 57.57% / 51.20% | 59.43% / 57.49% | 56.69% / 58.51% | 8.77% / 18.07% |
| Sora [53] | 60.05% / 69.71% | 55.61% / 57.15% | 53.88% / 56.25% | 56.08% / 59.96% | 93.33% / 83.33% | 43.47% / 49.39% | 47.38% / 50.79% | 40.37% / 41.19% | 64.10% / 63.94% |
| Kling 1.6 [69] | 59.12% / 66.36% | 51.18% / 52.86% | 56.48% / 63.05% | 47.90% / 53.56% | 63.33% / 51.67% | 45.56% / 48.78% | 46.65% / 45.90% | 52.74% / 54.02% | 80.00% / 65.98% |
| Correlation | 95.46% | 90.89% | 99.46% | 81.70% | 94.53% | 93.56% | 93.71% | 93.86% | 98.44% |
| Models | \CenterstackDynamic Spatial | ||||||||
| \CenterstackDynamic | |||||||||
| \CenterstackMotion Order | |||||||||
| \CenterstackHuman | |||||||||
| \CenterstackComplex | |||||||||
| \CenterstackComplex | |||||||||
| \CenterstackCamera | |||||||||
| \CenterstackMotion | |||||||||
| \CenterstackInstance | |||||||||
| Preservation | |||||||||
| HunyuanVideo [72] | 50.64% / 51.37% | 52.75% / 55.07% | 51.46% / 56.35% | 49.72% / 52.45% | 52.78% / 60.04% | 45.74% / 30.46% | 46.60% / 49.28% | 49.43% / 52.68% | 49.61% / 52.36% |
| CogVideoX-1.5 [86] | 49.36% / 48.07% | 53.72% / 54.70% | 51.68% / 52.13% | 53.28% / 51.34% | 55.74% / 54.46% | 52.50% / 65.37% | 46.19% / 44.08% | 49.04% / 42.24% | 41.91% / 41.32% |
| Sora [53] | 49.68% / 49.60% | 42.98% / 43.16% | 43.60% / 30.81% | 43.94% / 43.49% | 40.56% / 35.87% | 50.74% / 49.35% | 42.08% / 42.64% | 49.43% / 44.83% | 55.17% / 52.94% |
| Kling 1.6 [69] | 50.32% / 50.97% | 50.55% / 47.07% | 53.25% / 60.73% | 53.06% / 52.73% | 50.93% / 49.63% | 51.02% / 54.81% | 65.12% / 63.99% | 52.11% / 60.25% | 53.31% / 53.37% |
| Correlation | 97.36% | 90.95% | 98.73% | 89.93% | 91.17% | 97.65% | 97.95% | 87.97% | 93.70% |
🔼 Table S4 presents a detailed comparison of win ratios between automated VBench-2.0 evaluations and human judgments for various video generation model performance across 18 different dimensions. The ‘VBench-2.0 Win Ratio’ column indicates the percentage of times the VBench-2.0 evaluation correctly predicted the superior model based on human preference. Conversely, the ‘Human Win Ratio’ column shows the percentage of times human annotators preferred the model that VBench-2.0 evaluation identified. High similarity between these two ratios for each dimension demonstrates a strong alignment between the automated evaluation and human perception, validating VBench-2.0’s effectiveness.
read the caption
Table S4: Human Alignment of VBench-2.0 Evaluation Methods. For each evaluation dimension and each video generative model, we report “VBench-2.0 Win Ratios (left) / Human Win Ratios (right)”. The results demonstrate that our evaluation metrics closely align with human perception across all dimensions.
Full paper#