TL;DR#
Text-to-image (T2I) models have seen improvements, yet limitations persist in text injection via cross-attention, limiting multimodal fusion and introducing bias. Existing models lack dedicated captioning systems tailored for T2I, resulting in inaccurate text-image pairs, constraining text and visual representation expressiveness. Thus, this impairs faithful instruction following and high-quality image generation.
The paper introduces Lumina-Image 2.0, a unified and efficient T2I generative framework. It uses a Unified Next-DiT model that generates images aligned with text input, and a Unified Captioner (UniCap) producing high-quality text-image pairs. The model employs efficient training and inference strategies. Unified Next-DiT utilizes a joint self-attention mechanism. UniCap generates comprehensive multilingual descriptions, enhancing model capacity and performance.
Key Takeaways#
Why does it matter?#
This paper is crucial for researchers aiming to improve text-to-image generation. It introduces an efficient, unified framework and offers detailed analysis, code, and models, which can advance future research and development in this rapidly evolving field.
Visual Insights#

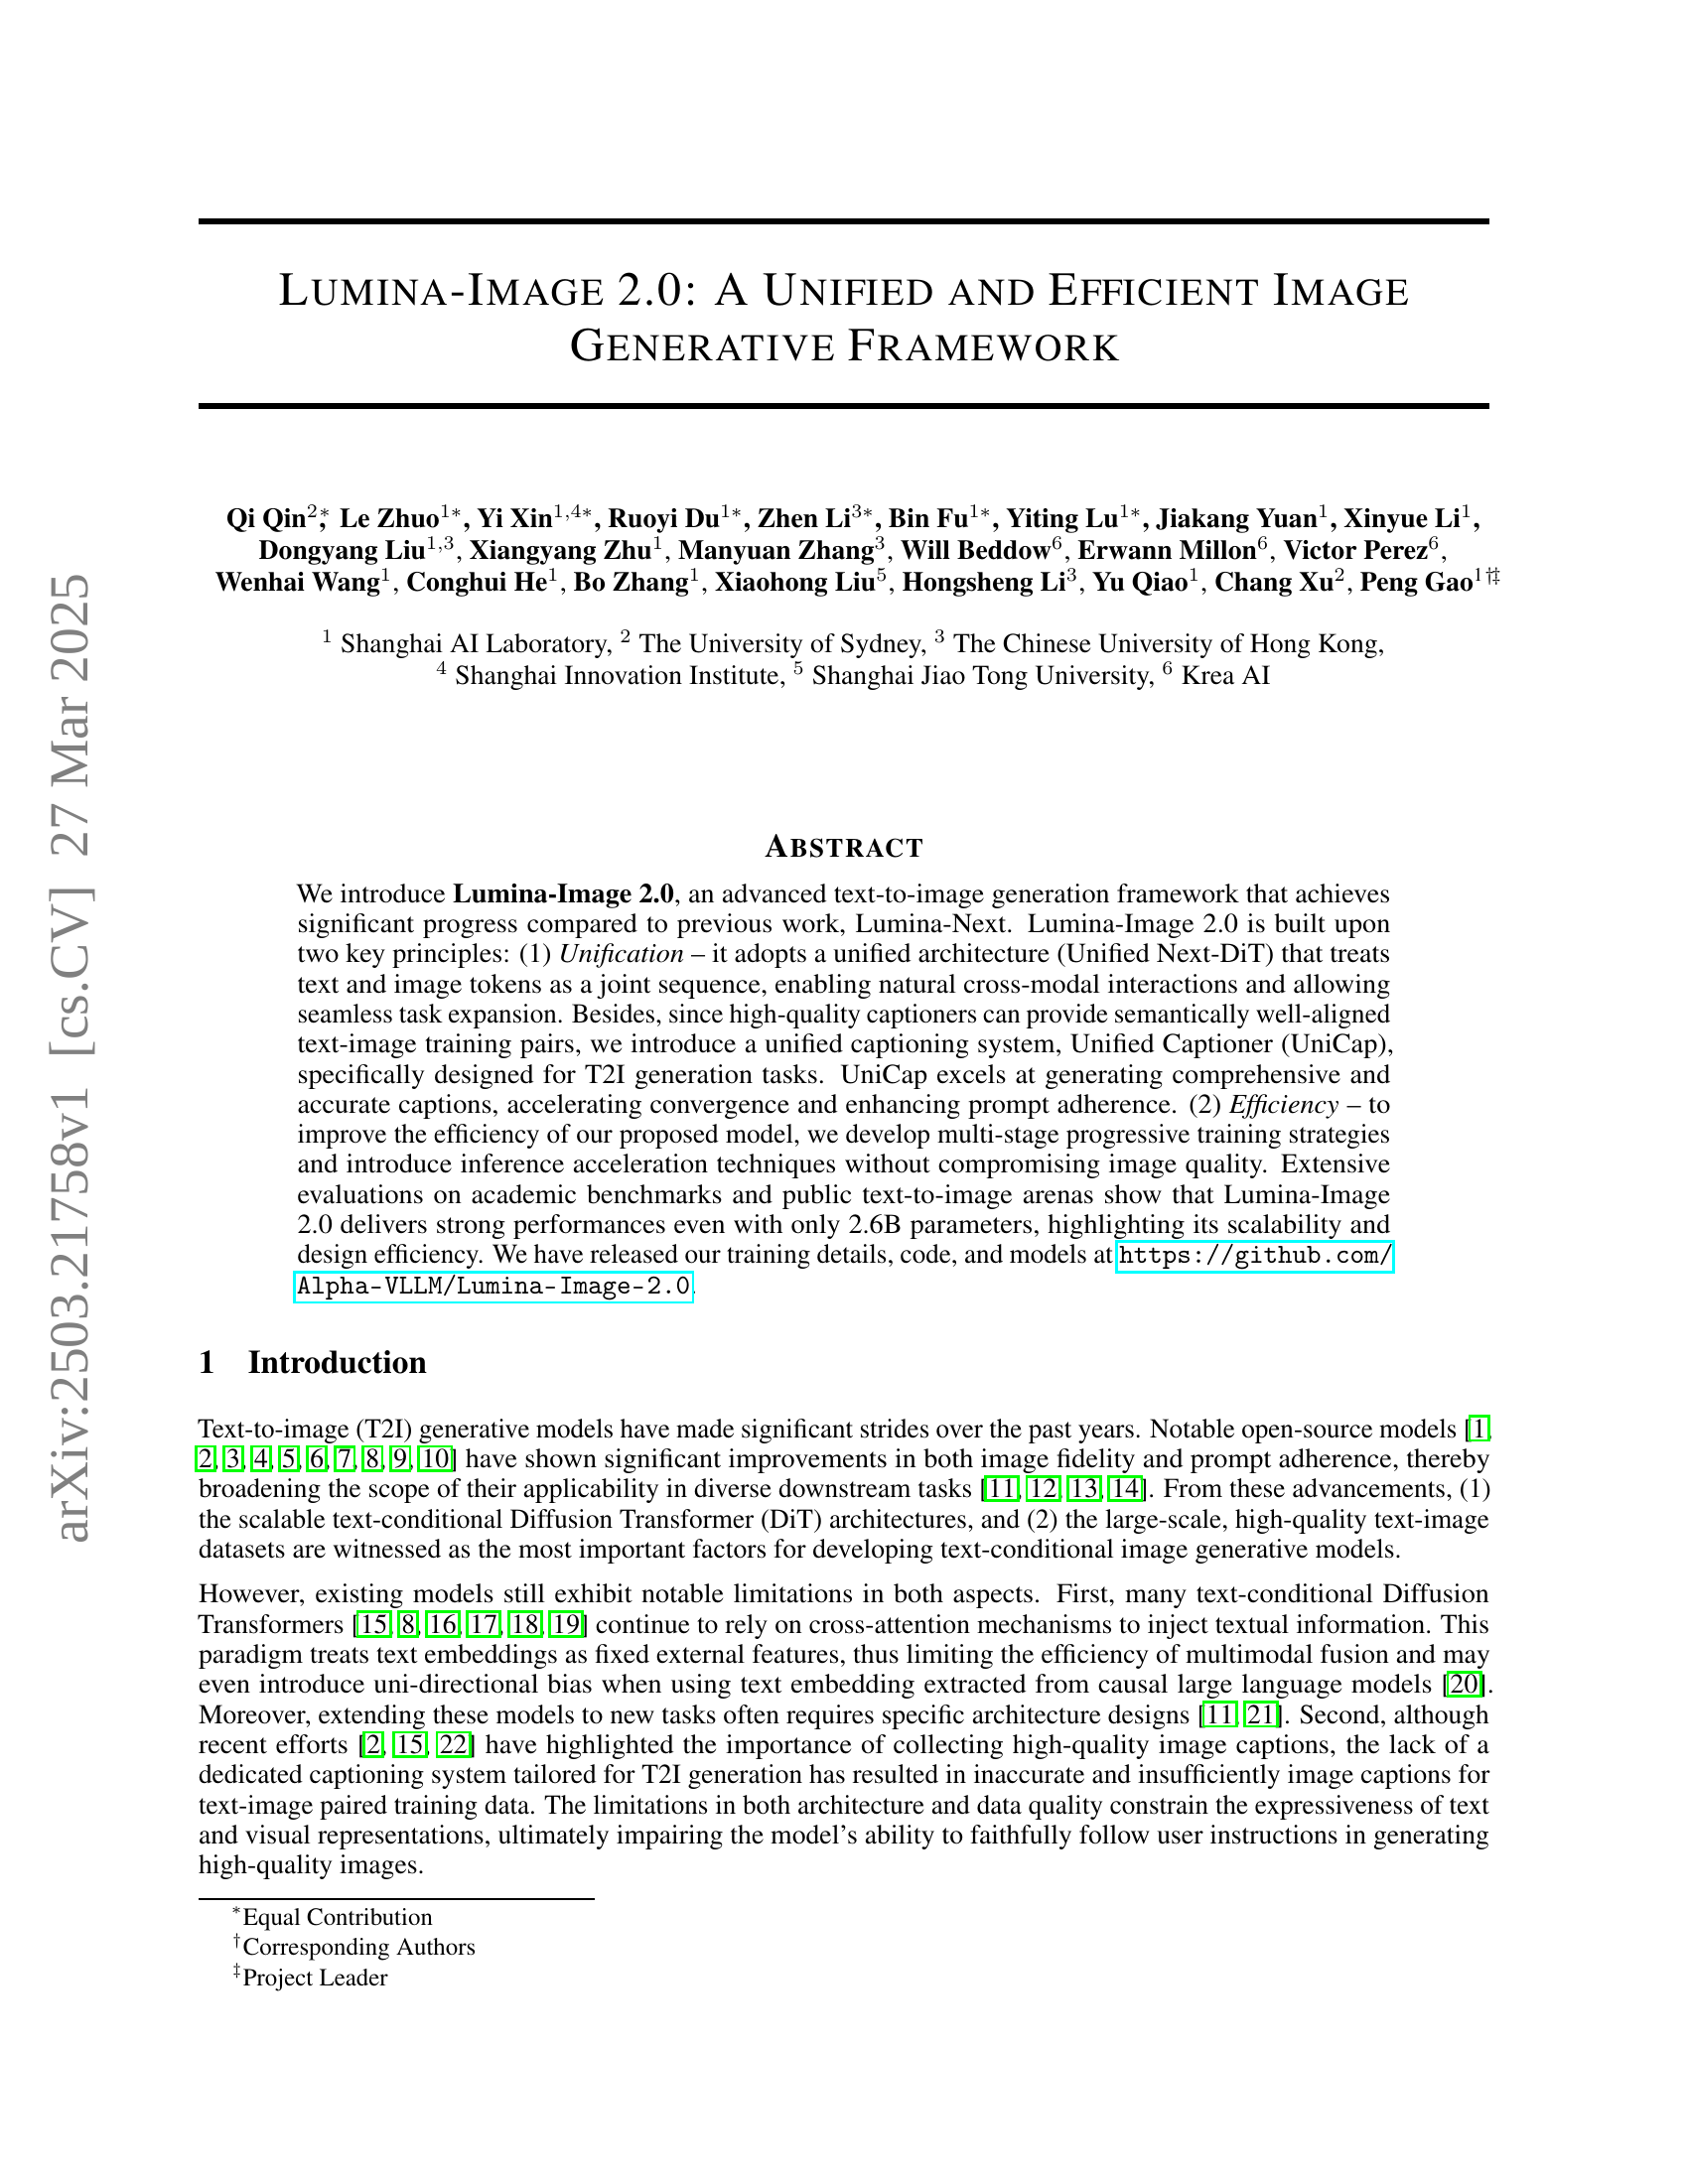
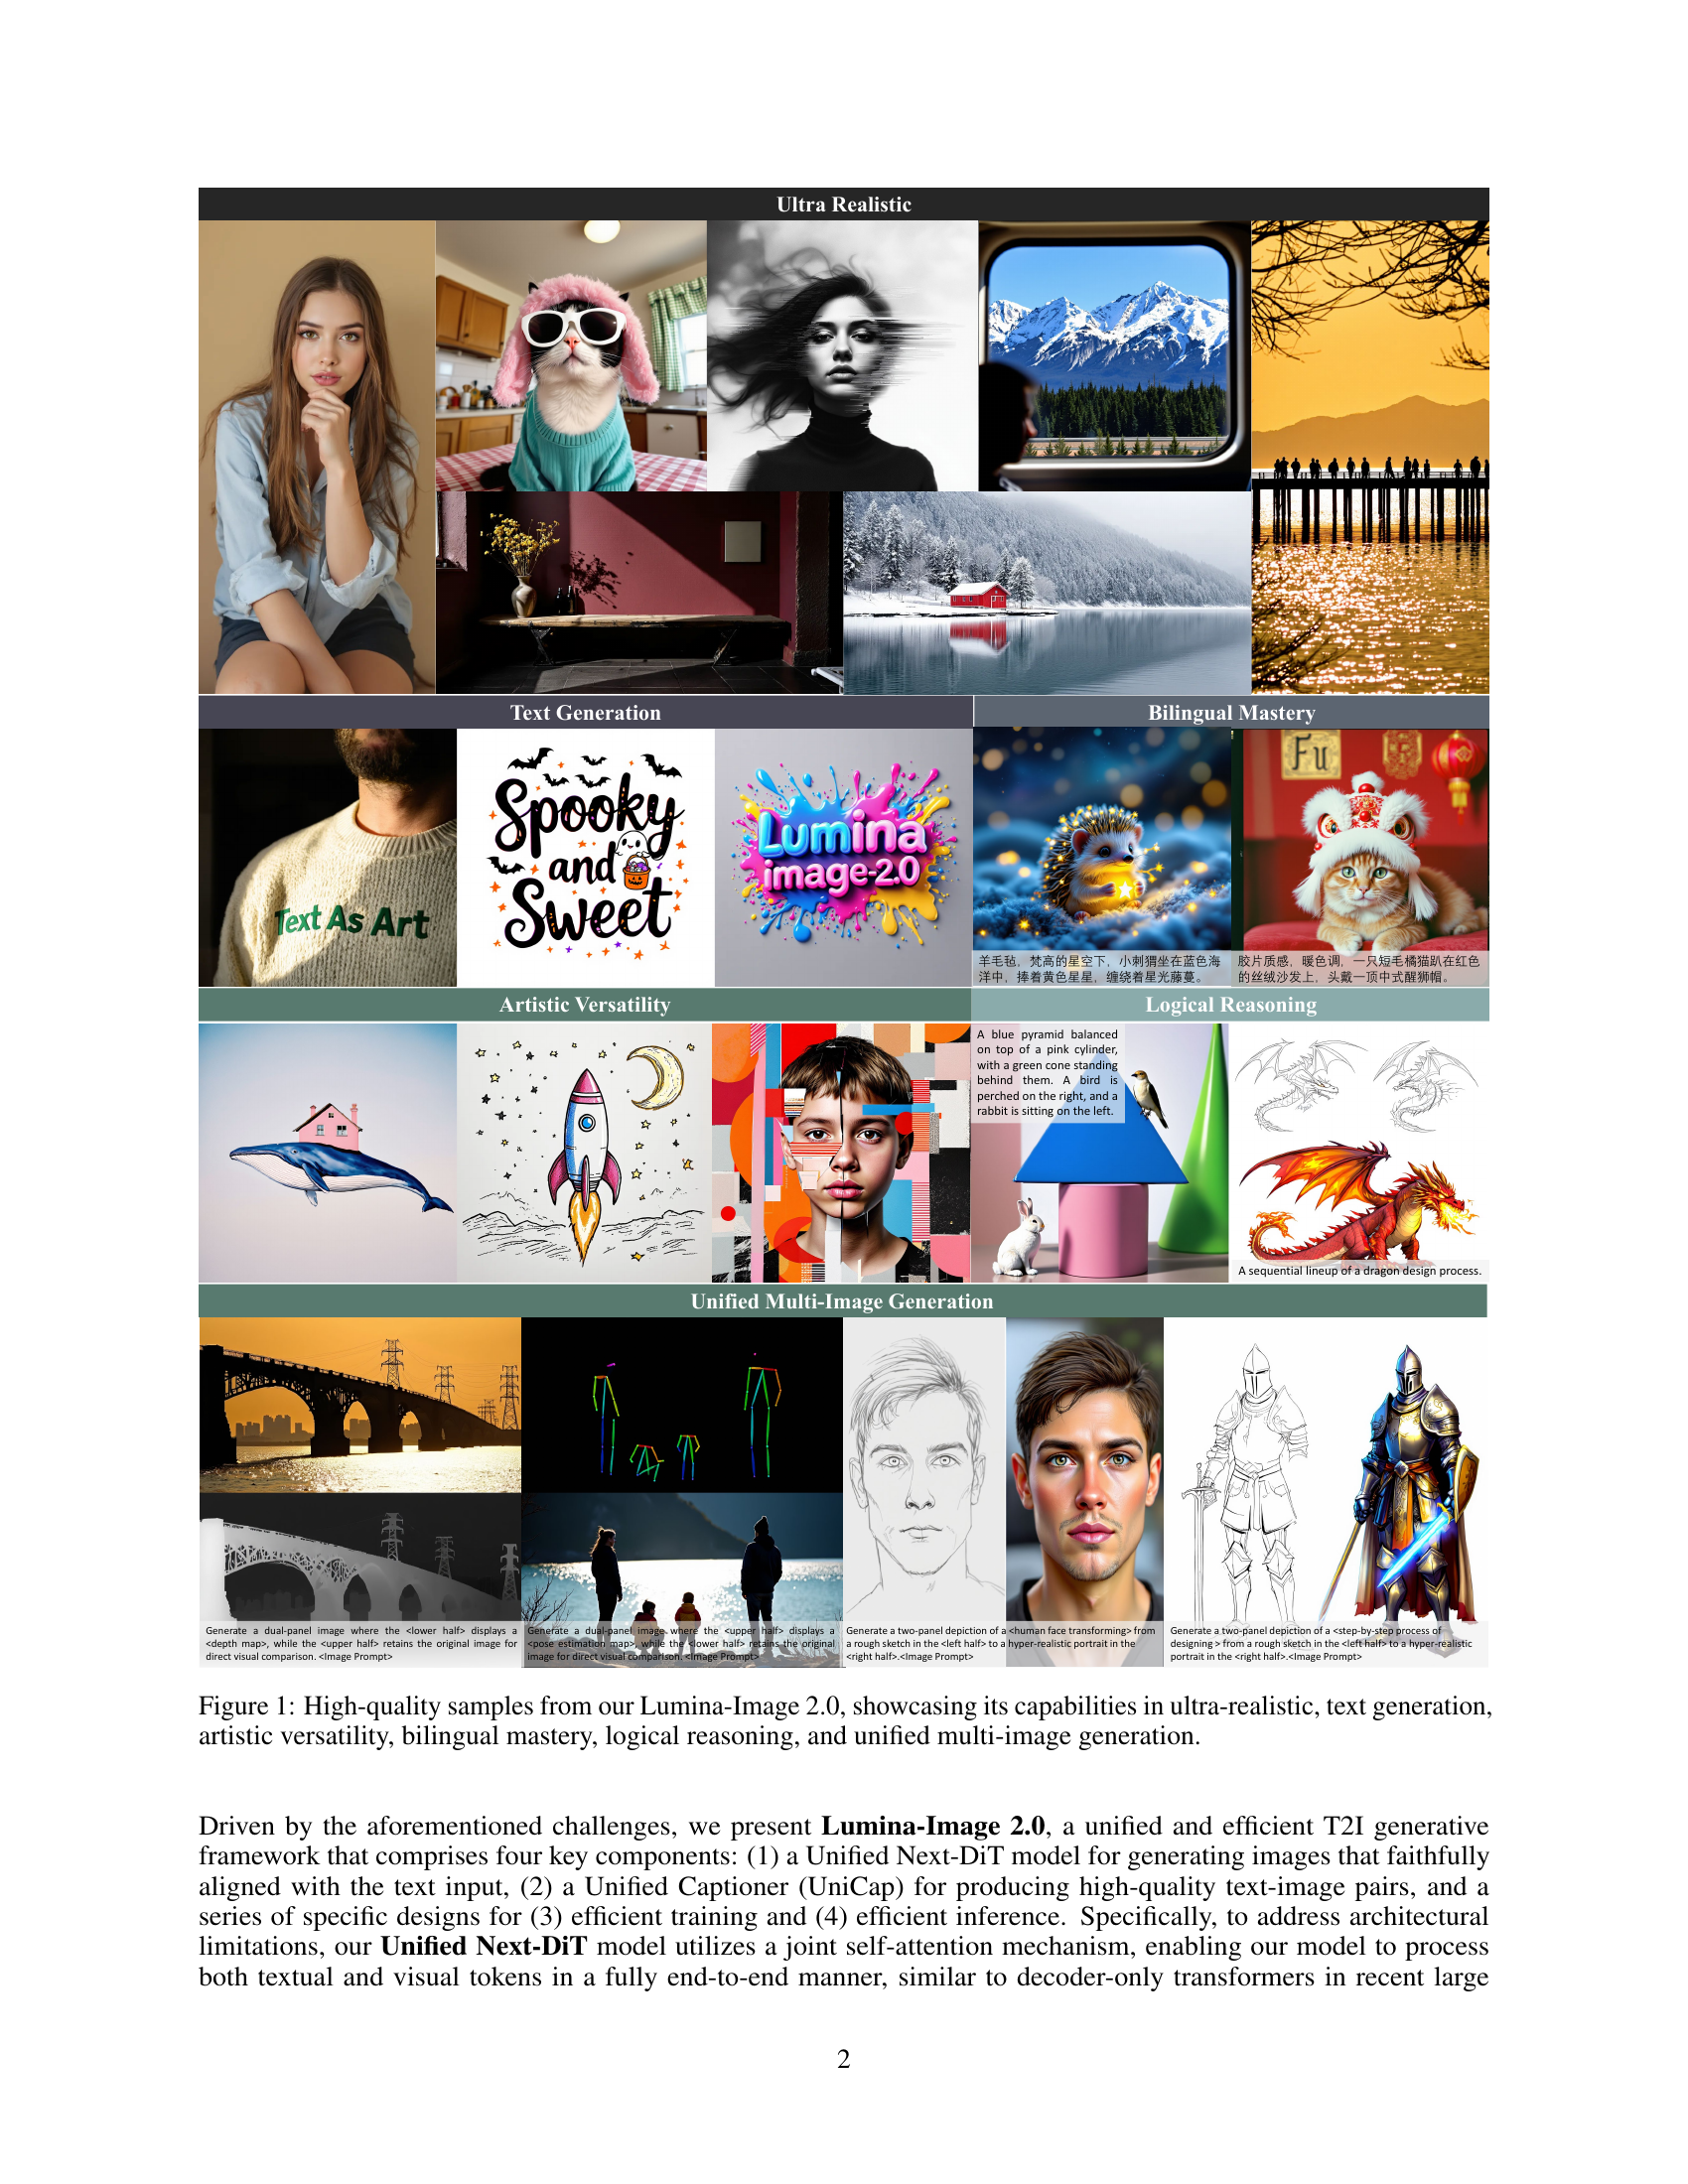
🔼 Figure 1 showcases the high-quality image generation capabilities of Lumina-Image 2.0 across various tasks. The samples demonstrate its ability to produce ultra-realistic images, generate images from text prompts with artistic versatility, handle bilingual prompts with accuracy, perform logical reasoning tasks within image generation, and generate multiple images in a unified sequence.
read the caption
Figure 1: High-quality samples from our Lumina-Image 2.0, showcasing its capabilities in ultra-realistic, text generation, artistic versatility, bilingual mastery, logical reasoning, and unified multi-image generation.
| Template A | You are an assistant designed to generate high-quality images based on user prompts. <Prompt Start> <Image Prompt> |
| Template B | You are an assistant designed to generate superior images with the superior degree of image-text alignment based on textual prompts or user prompts. <Prompt Start> <Image Prompt> |
| Template C | Generate a dual-panel image where the <lower half> displays a <depth map>, while the <upper half> retains the original image for direct visual comparison. <Prompt Start> <Image Prompt> |
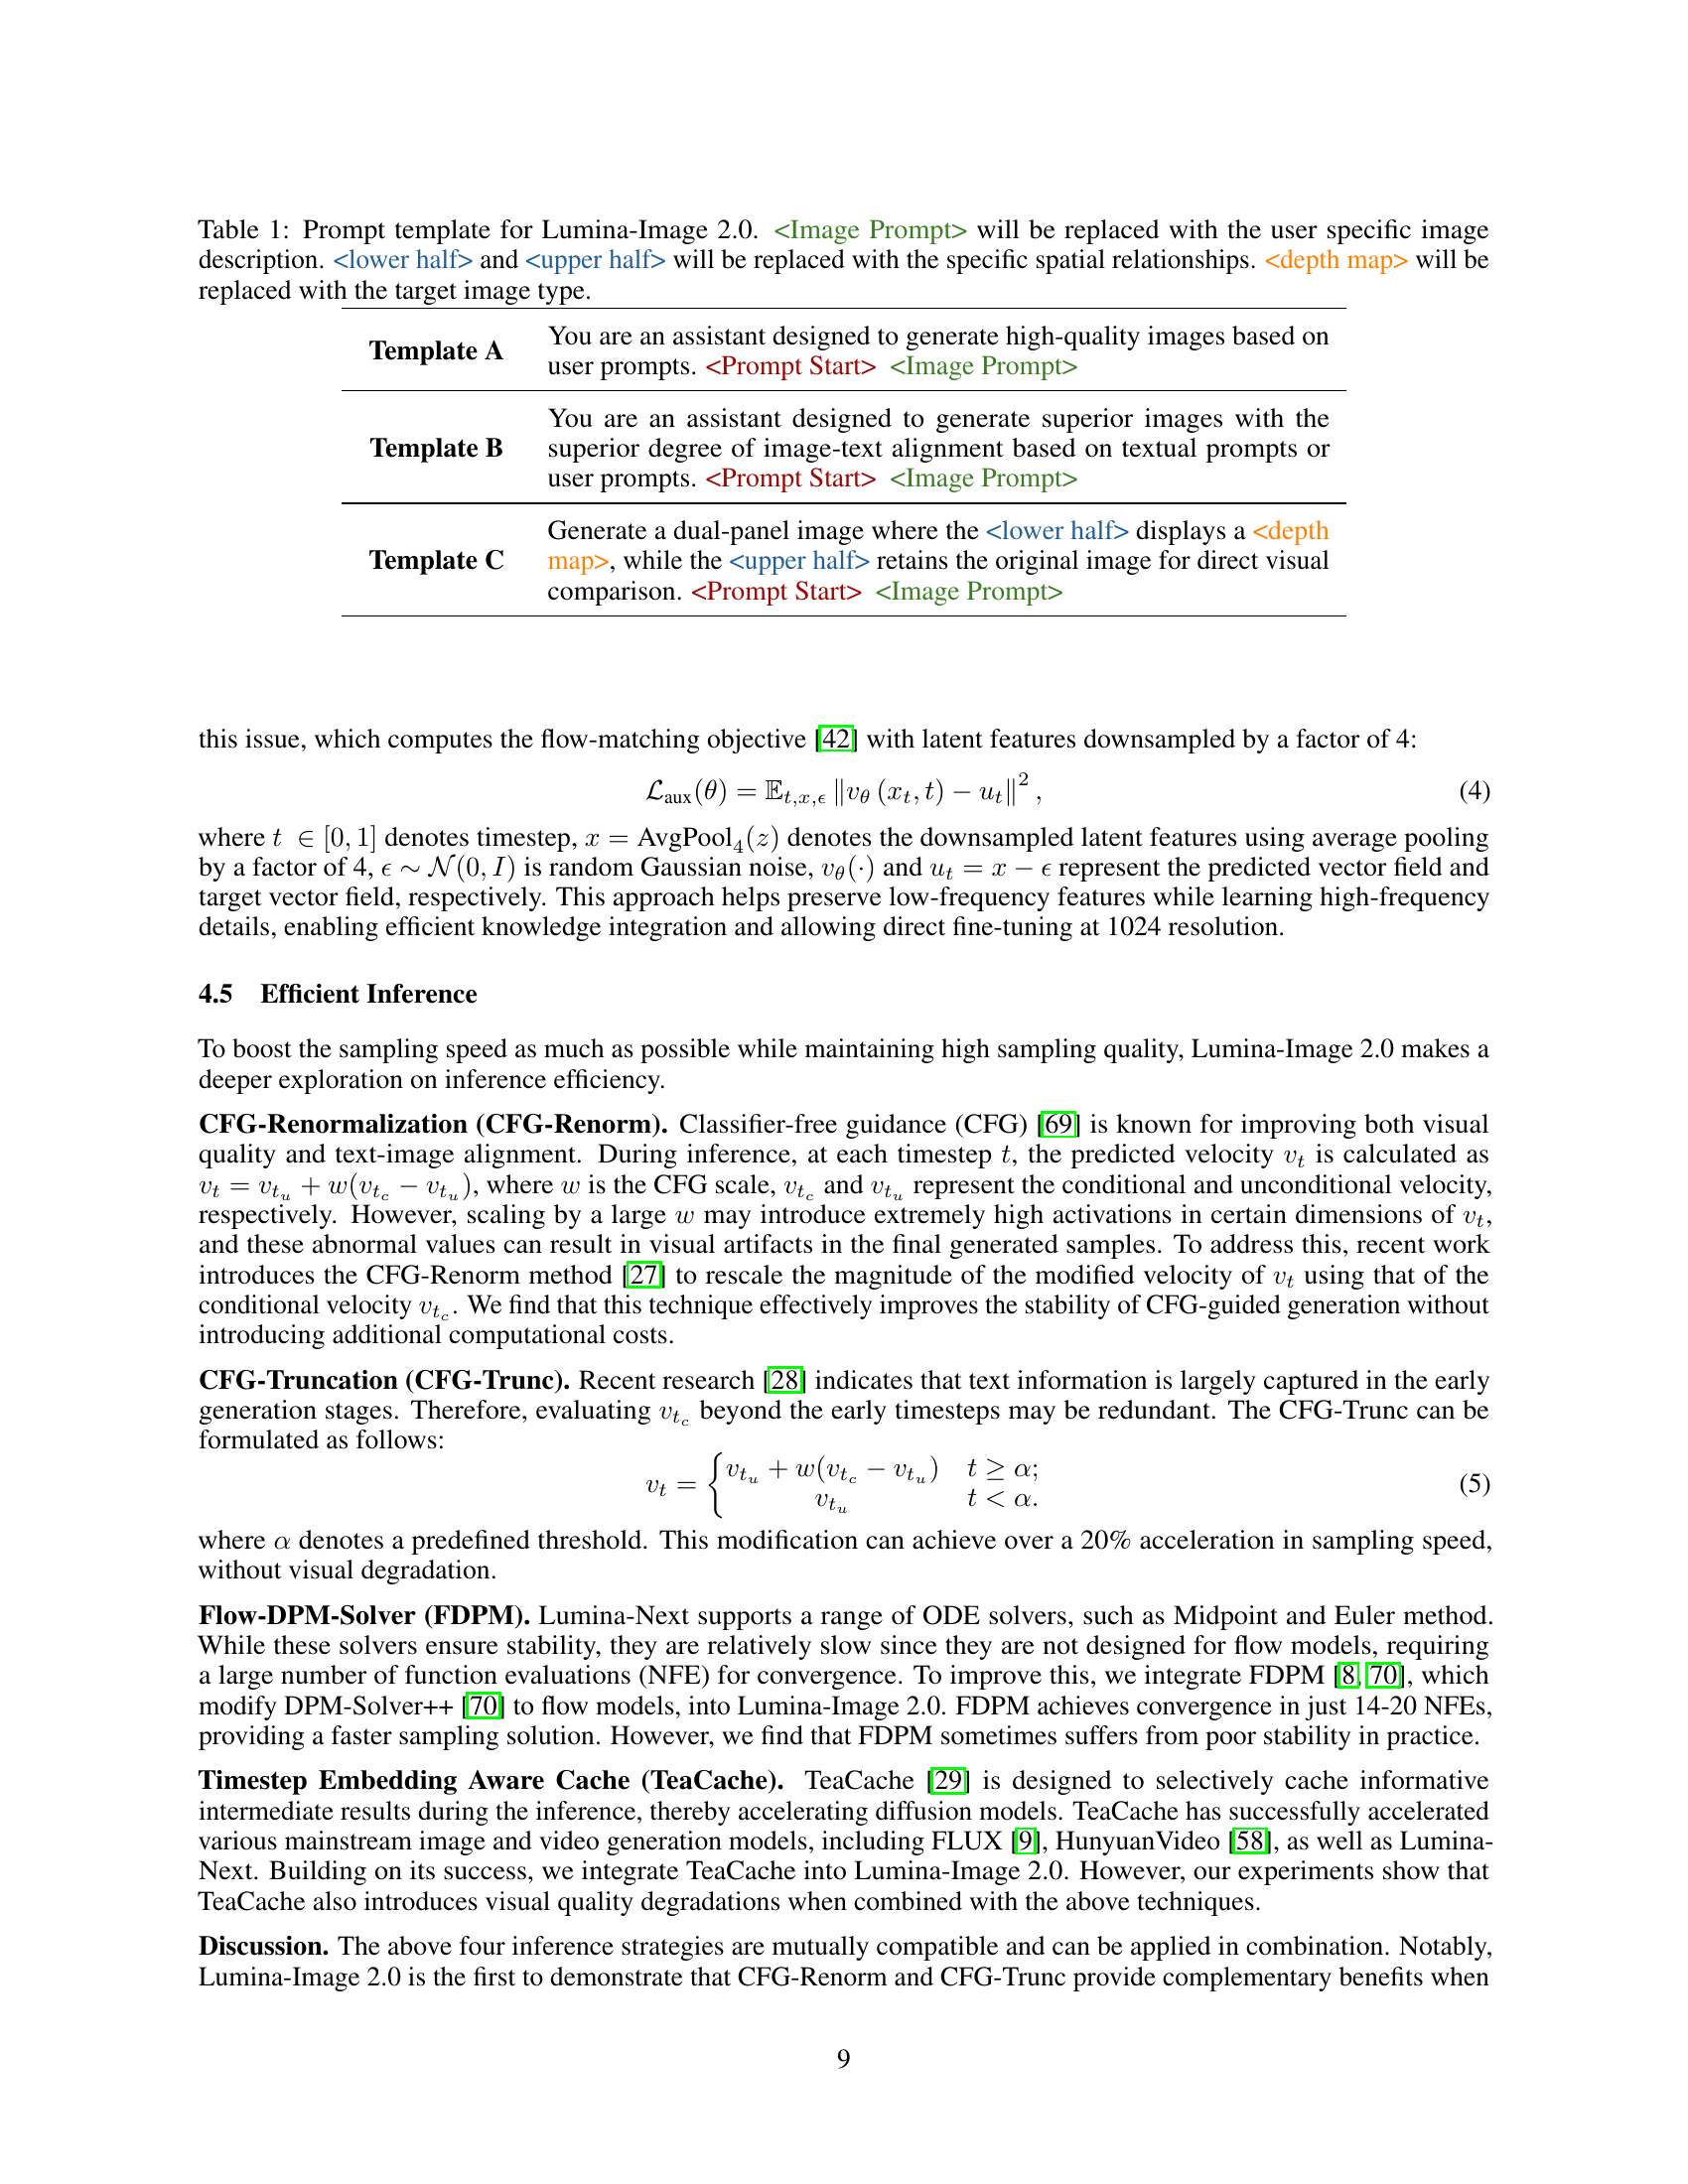
🔼 This table presents the system prompts used in the Lumina-Image 2.0 framework for different image generation tasks. It shows three different prompt templates: Template A is for general image generation, Template B focuses on superior image-text alignment, and Template C is designed for multi-image generation tasks requiring the comparison of a base image with a transformed version (like a depth map or pose estimation). The table highlights how these prompts are constructed to guide the model towards producing high-quality, task-specific results by specifying the image prompt, along with the type of transformation or comparison needed.
read the caption
Table 1: Prompt template for Lumina-Image 2.0.will be replaced with the user specific image description. and will be replaced with the specific spatial relationships. will be replaced with the target image type.
In-depth insights#
Unified T2I DiT#
The idea of a ‘Unified T2I DiT’ or Diffusion Transformer architecture for text-to-image generation is intriguing. It suggests a move away from separate text and image processing pathways towards a more integrated model. The key advantage is the potential for richer cross-modal understanding. By processing text and image data in a shared latent space, the model could learn more nuanced relationships between textual descriptions and visual features. This could lead to improved image quality, better prompt adherence, and the ability to generate images from more complex and abstract prompts. Challenges could involve designing an effective joint representation and scaling the transformer architecture to handle the combined input sequence. The architecture needs to avoid the pitfall of attending each modality individually and force both modalities to interact with each other. Further work would be helpful on understanding the scalability of such a model, considering existing attention mechanism requires quadratic complexity. The integration of specialized components, like a high-quality captioner, could further enhance the unified architecture. Overall, a well-designed Unified T2I DiT holds promise for advancing the state-of-the-art in text-to-image generation.
Efficient UniCap#
While the paper doesn’t explicitly have a section titled “Efficient UniCap,” we can infer that efficiency in UniCap, the Unified Captioner, likely refers to reducing computational costs and time associated with generating high-quality image captions. An efficient UniCap would generate accurate and detailed captions faster, potentially through methods like optimized model architectures, efficient training techniques, or knowledge distillation. Further, efficiency could be achieved through techniques like prompt engineering to guide the captioning process or by using lower-precision arithmetic during inference, balancing quality with speed. Finally, an efficient UniCap would scale effectively to handle large datasets and diverse image content without a significant increase in computational demands.
Multi-stage Train#
Multi-stage training is a common technique used to improve the performance of machine learning models. The general idea is to break down the training process into multiple stages, each with its own objective or data distribution. This can be useful for a variety of reasons, such as preventing overfitting, improving generalization, or accelerating convergence. Each stage might use a different resolution, dataset, or optimization strategy, allowing the model to learn different aspects of the task at hand in a sequential manner. By progressively refining the model in multiple stages, it can achieve better performance compared to training it in a single stage.
Accurate Details#
When discussing “Accurate Details” in the context of a research paper, one can delve into several crucial aspects. It is important to ensure factual precision in any research endeavor. This means data, observations, and measurements are represented with the highest possible fidelity. Methodological rigor dictates that the processes used to collect and analyze information must be transparent, reproducible, and validated. Transparency in reporting is key, with all assumptions, limitations, and potential sources of error being clearly articulated. Comprehensive documentation of data collection, processing, and analysis pipelines ensures that others can verify and build upon the findings. Attention must be given to contextual integrity, maintaining that details are presented within their proper framework to avoid misinterpretations. Addressing potential biases in data collection and interpretation is crucial for maintaining objectivity. Striving for interpretive accuracy ensures that conclusions are directly supported by the evidence, avoiding overgeneralizations or unsupported claims.
Longer Prompts#
The idea of ‘Longer Prompts’ in image generation suggests that more detailed and descriptive text inputs can lead to improved image quality and relevance. This implies a shift from abstract or concise prompts to those that elaborate on the desired scene, objects, style, and overall composition. Longer prompts could provide richer contextual information for generative models, enabling them to capture nuanced details and produce images that more accurately align with the user’s intent. However, the effectiveness of longer prompts also depends on the model’s ability to parse and interpret complex text, as well as the quality and diversity of the training data. Overly verbose or ambiguous prompts could potentially confuse the model or introduce artifacts, highlighting the importance of carefully crafting clear and specific language to guide the image generation process effectively. The exploration of optimal prompt length and structure remains an area of active research.
More visual insights#
More on figures

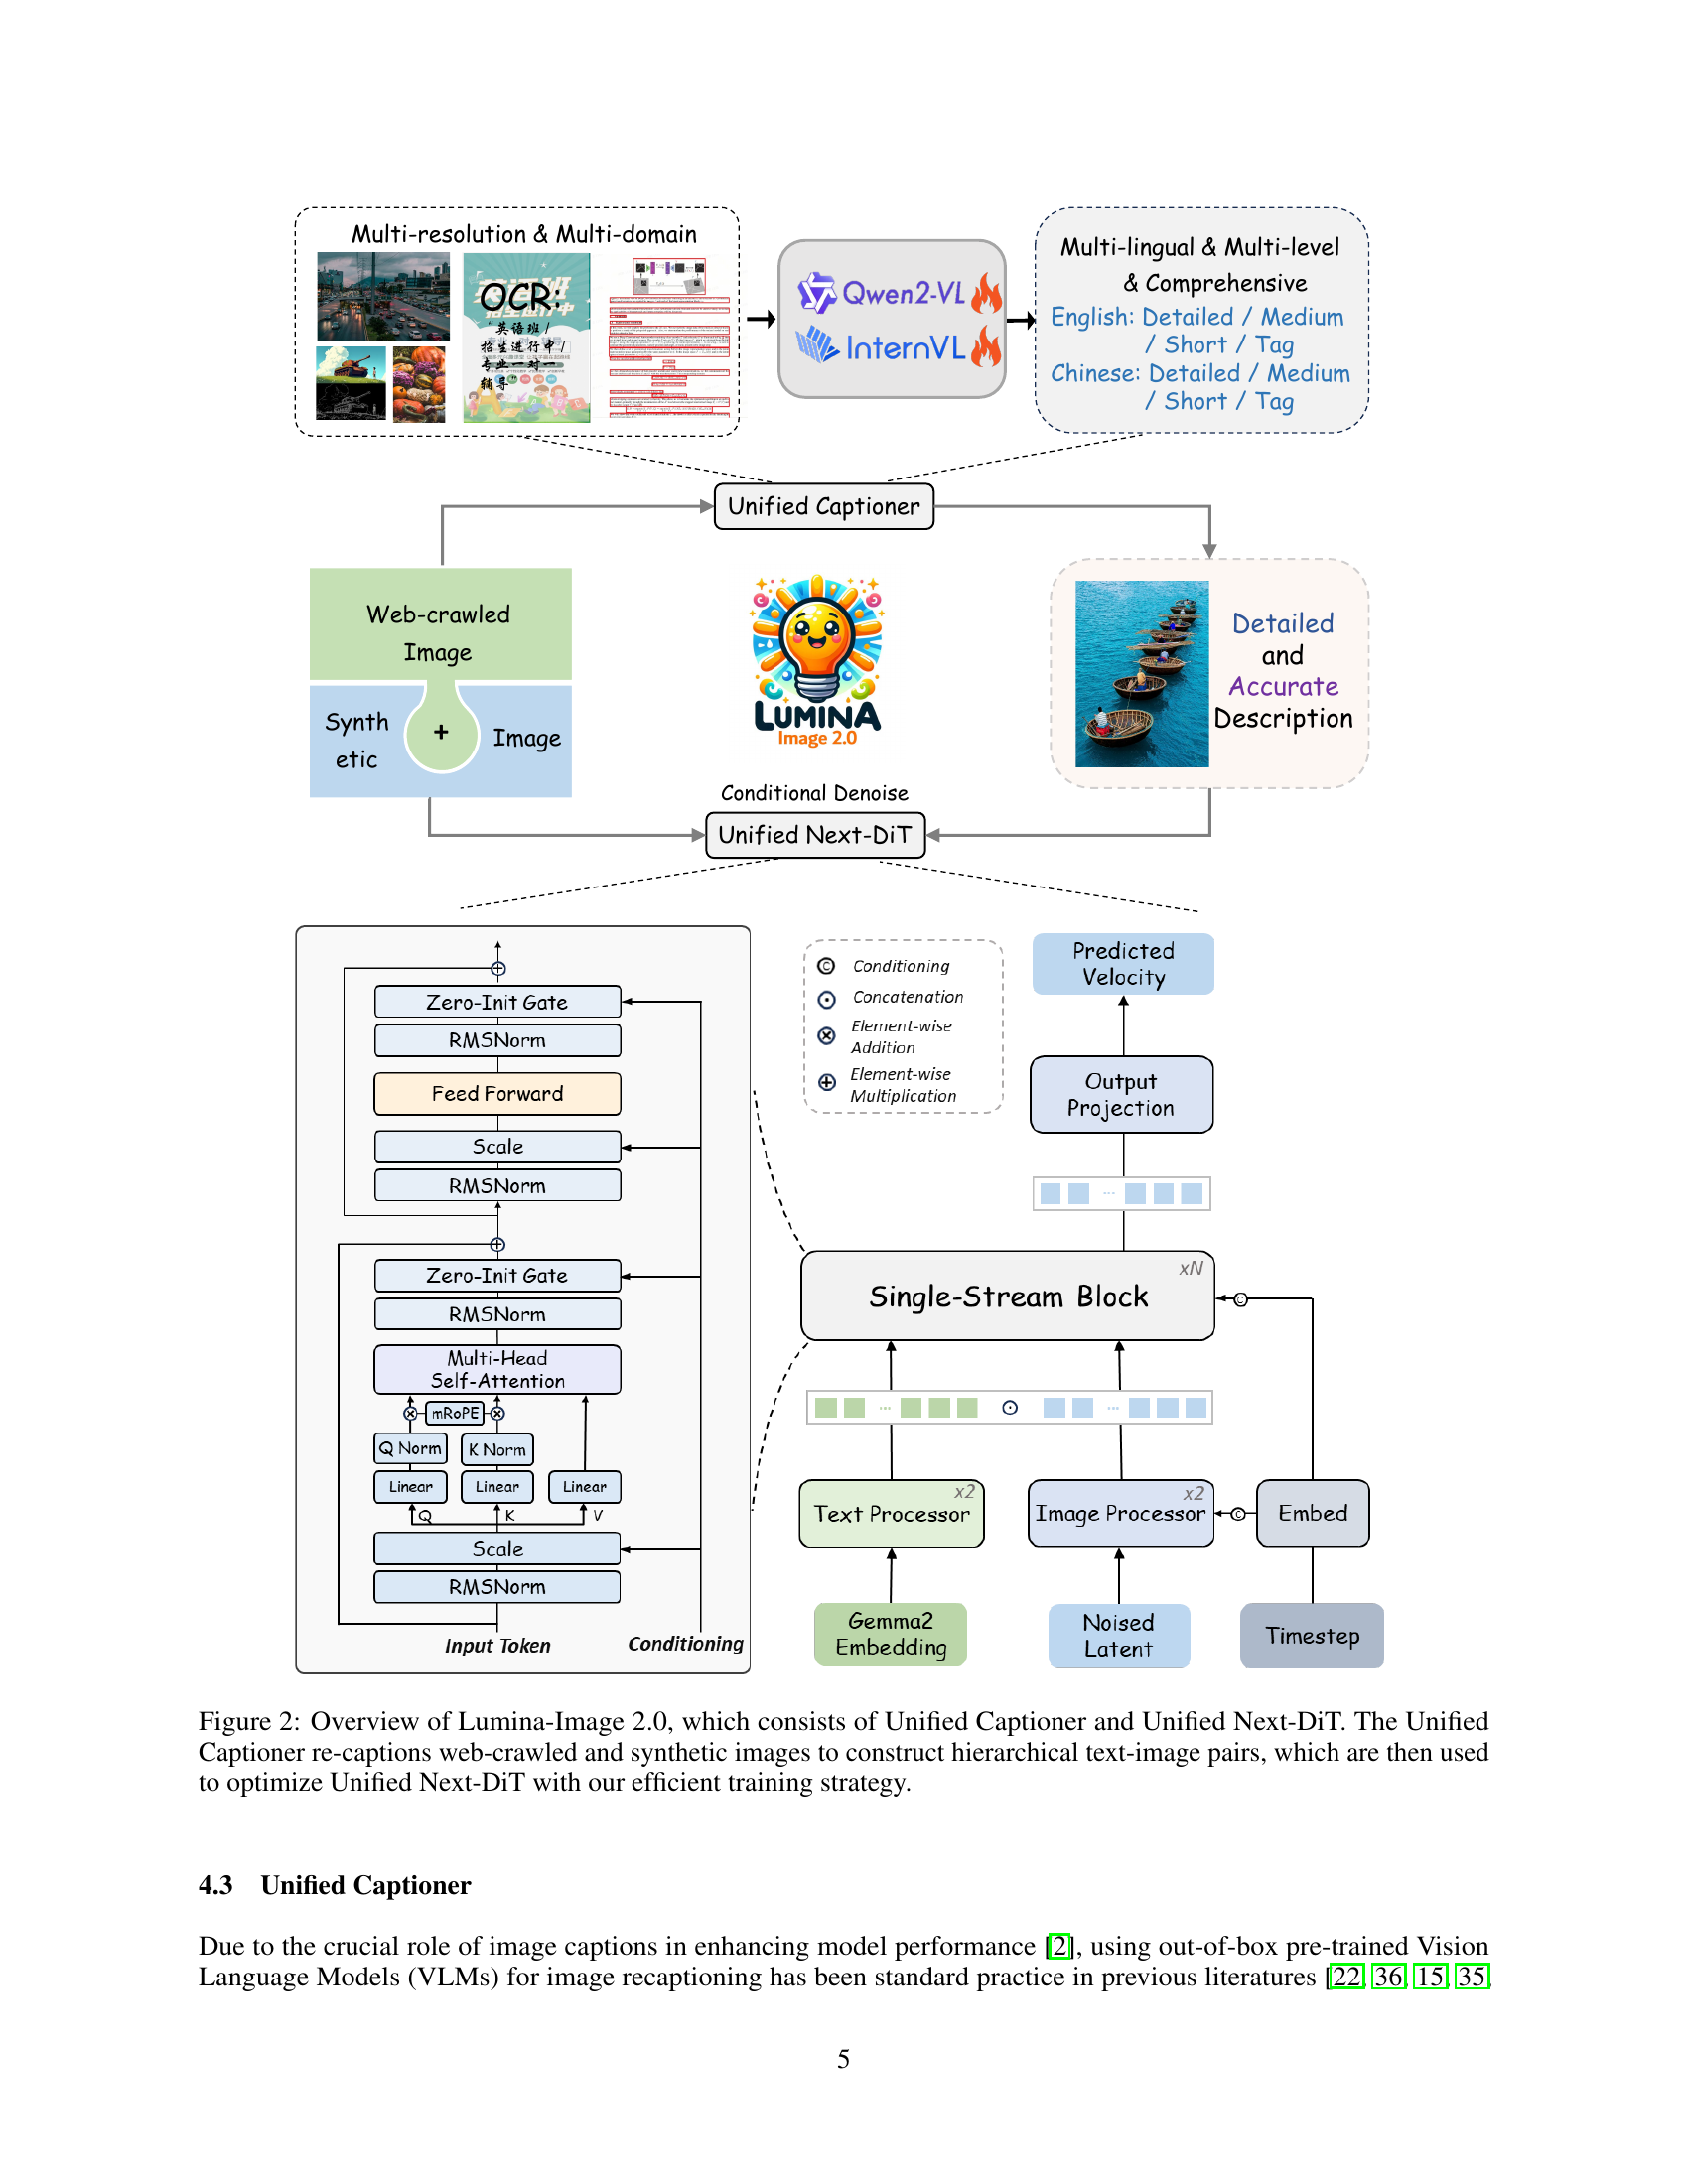
🔼 Lumina-Image 2.0 is composed of two main components: the Unified Captioner and the Unified Next-DiT. The Unified Captioner takes web-crawled and synthetic images as input and generates multi-level, high-quality captions for each image. These captions are then used to create a hierarchical dataset of image-text pairs. This dataset is used to train the Unified Next-DiT model, which is a unified text-to-image generation model. The efficient training strategy helps ensure that the model can generate high-quality images.
read the caption
Figure 2: Overview of Lumina-Image 2.0, which consists of Unified Captioner and Unified Next-DiT. The Unified Captioner re-captions web-crawled and synthetic images to construct hierarchical text-image pairs, which are then used to optimize Unified Next-DiT with our efficient training strategy.

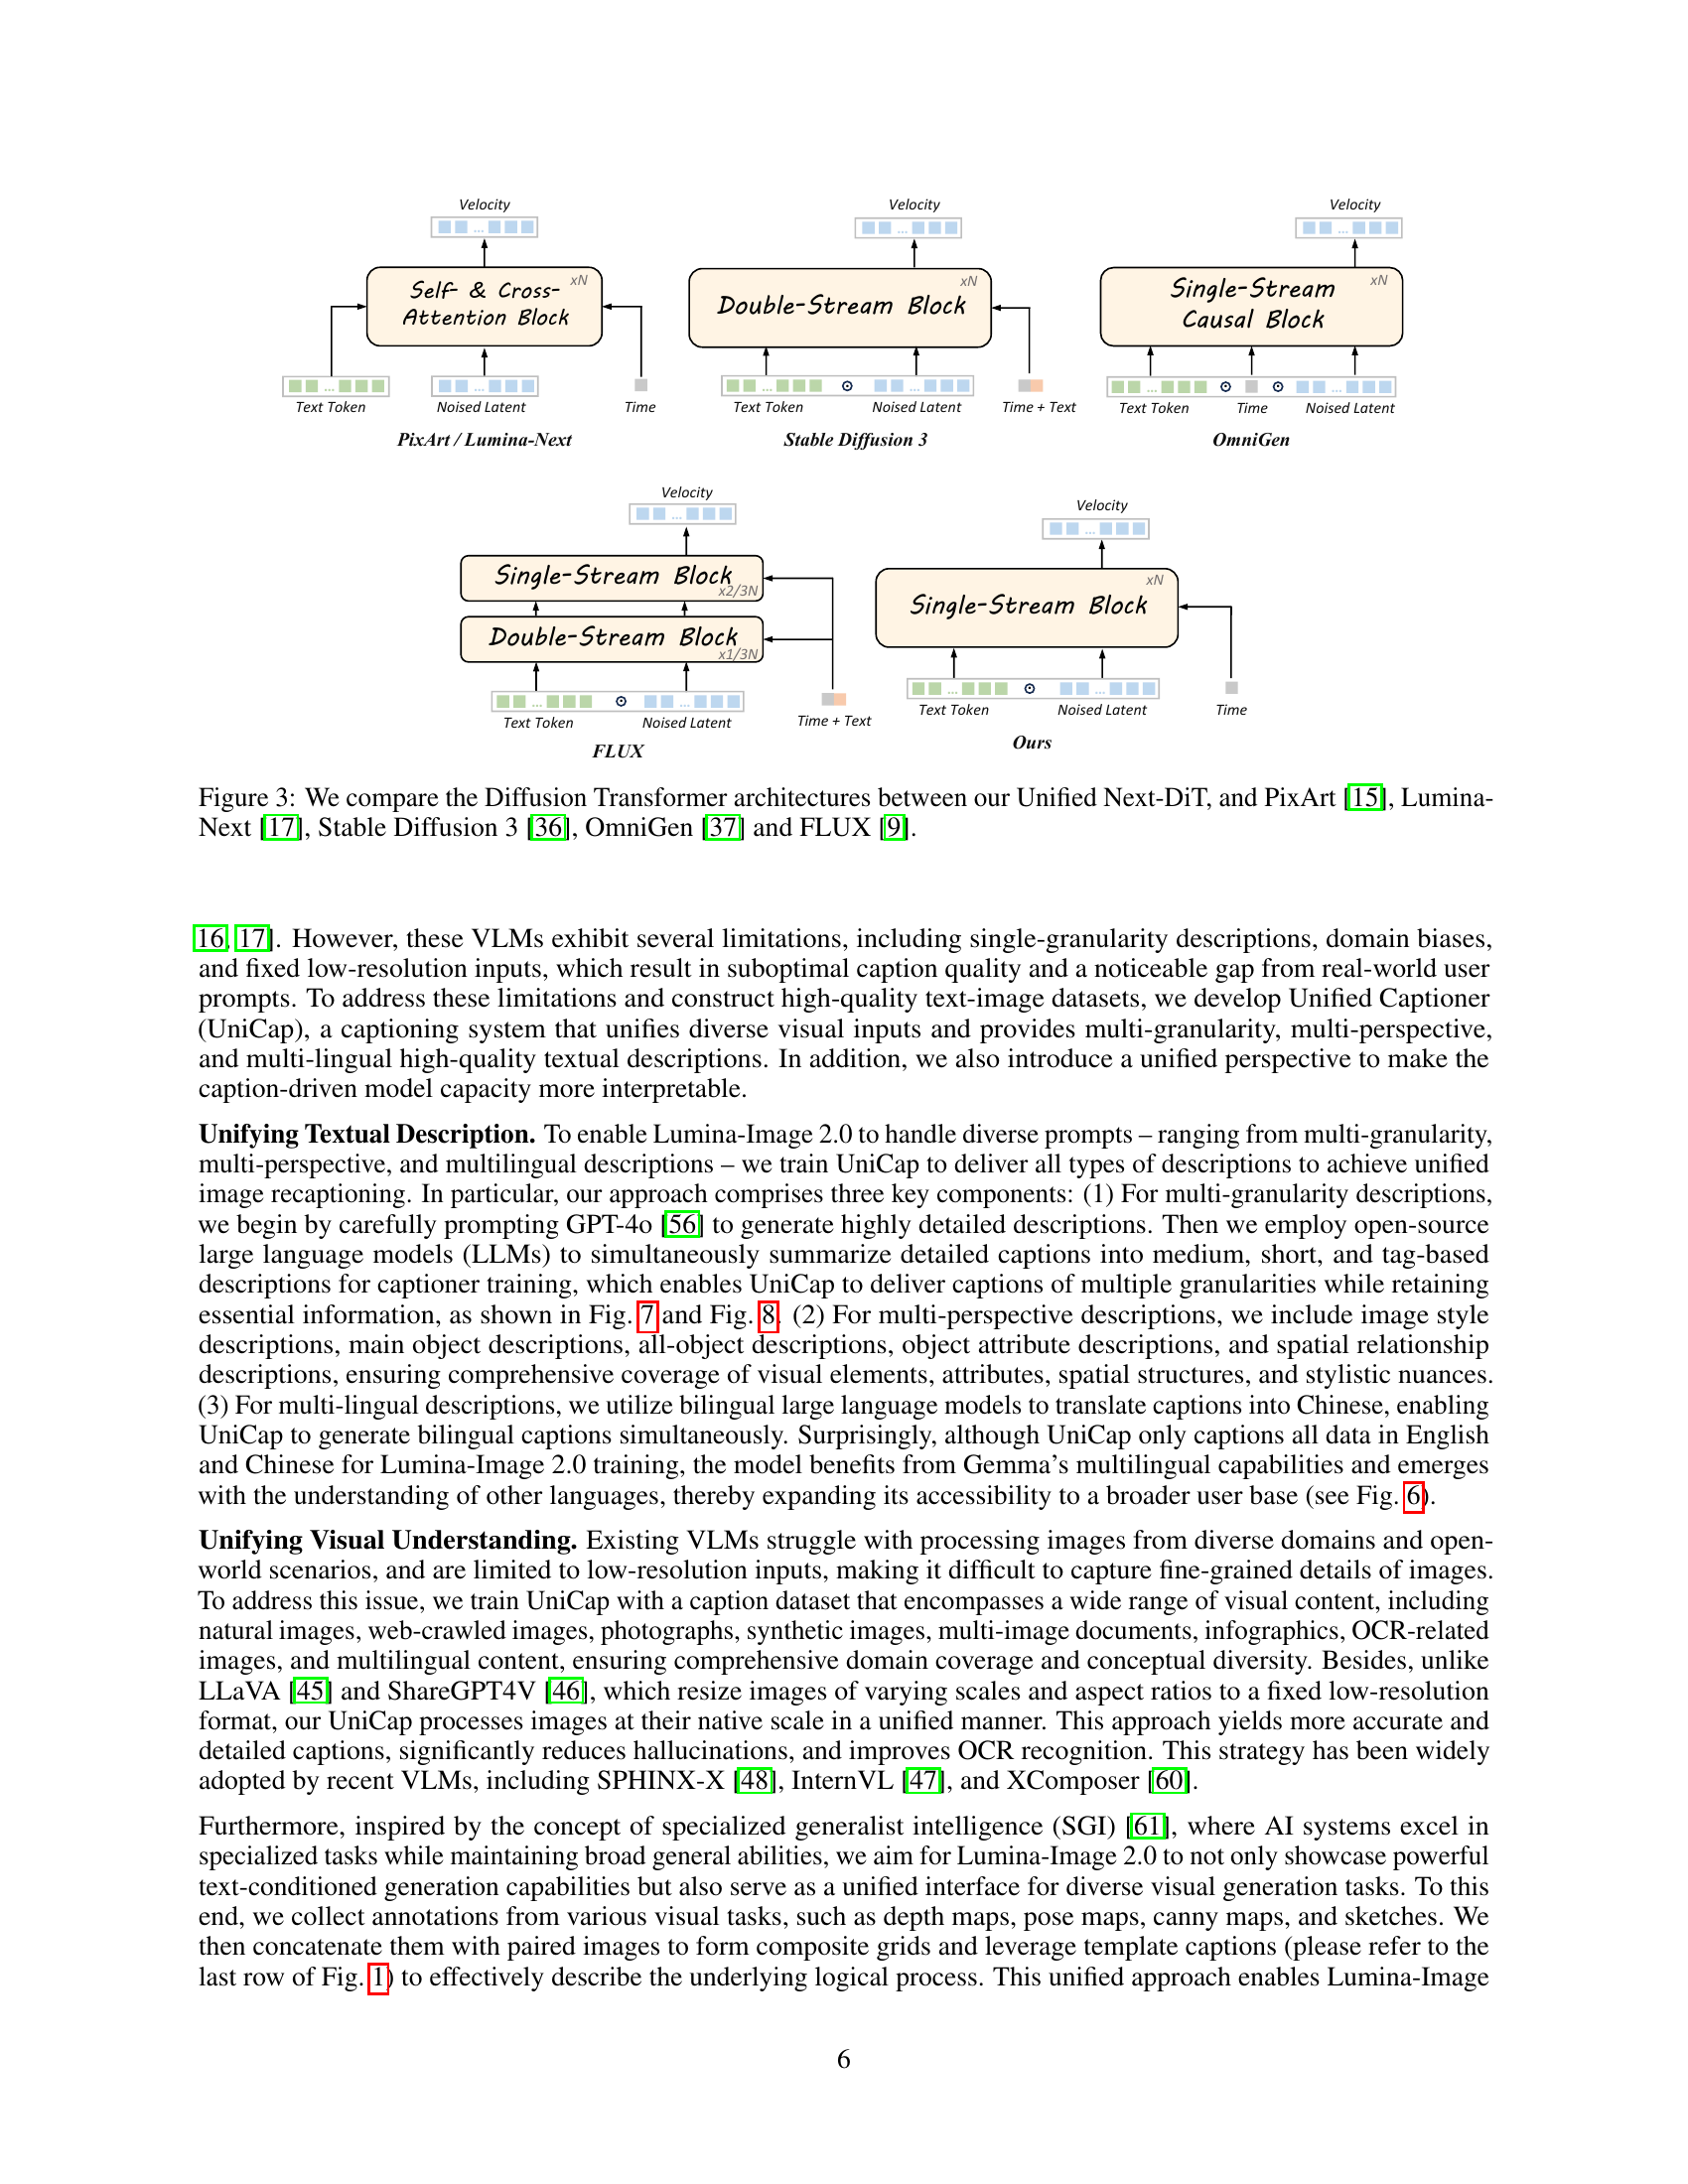
🔼 Figure 3 provides a visual comparison of different Diffusion Transformer architectures. It highlights the key architectural differences between the authors’ proposed Unified Next-DiT model and several other prominent models, including PixArt [15], Lumina-Next [17], Stable Diffusion 3 [36], OmniGen [37], and FLUX [9]. The comparison focuses on the core components and arrangement of the transformer blocks to illustrate the design choices and potential advantages of each architecture. The figure aids in understanding the differences and the design choices behind the Unified Next-DiT architecture.
read the caption
Figure 3: We compare the Diffusion Transformer architectures between our Unified Next-DiT, and PixArt [15], Lumina-Next [17], Stable Diffusion 3 [36], OmniGen [37] and FLUX [9].

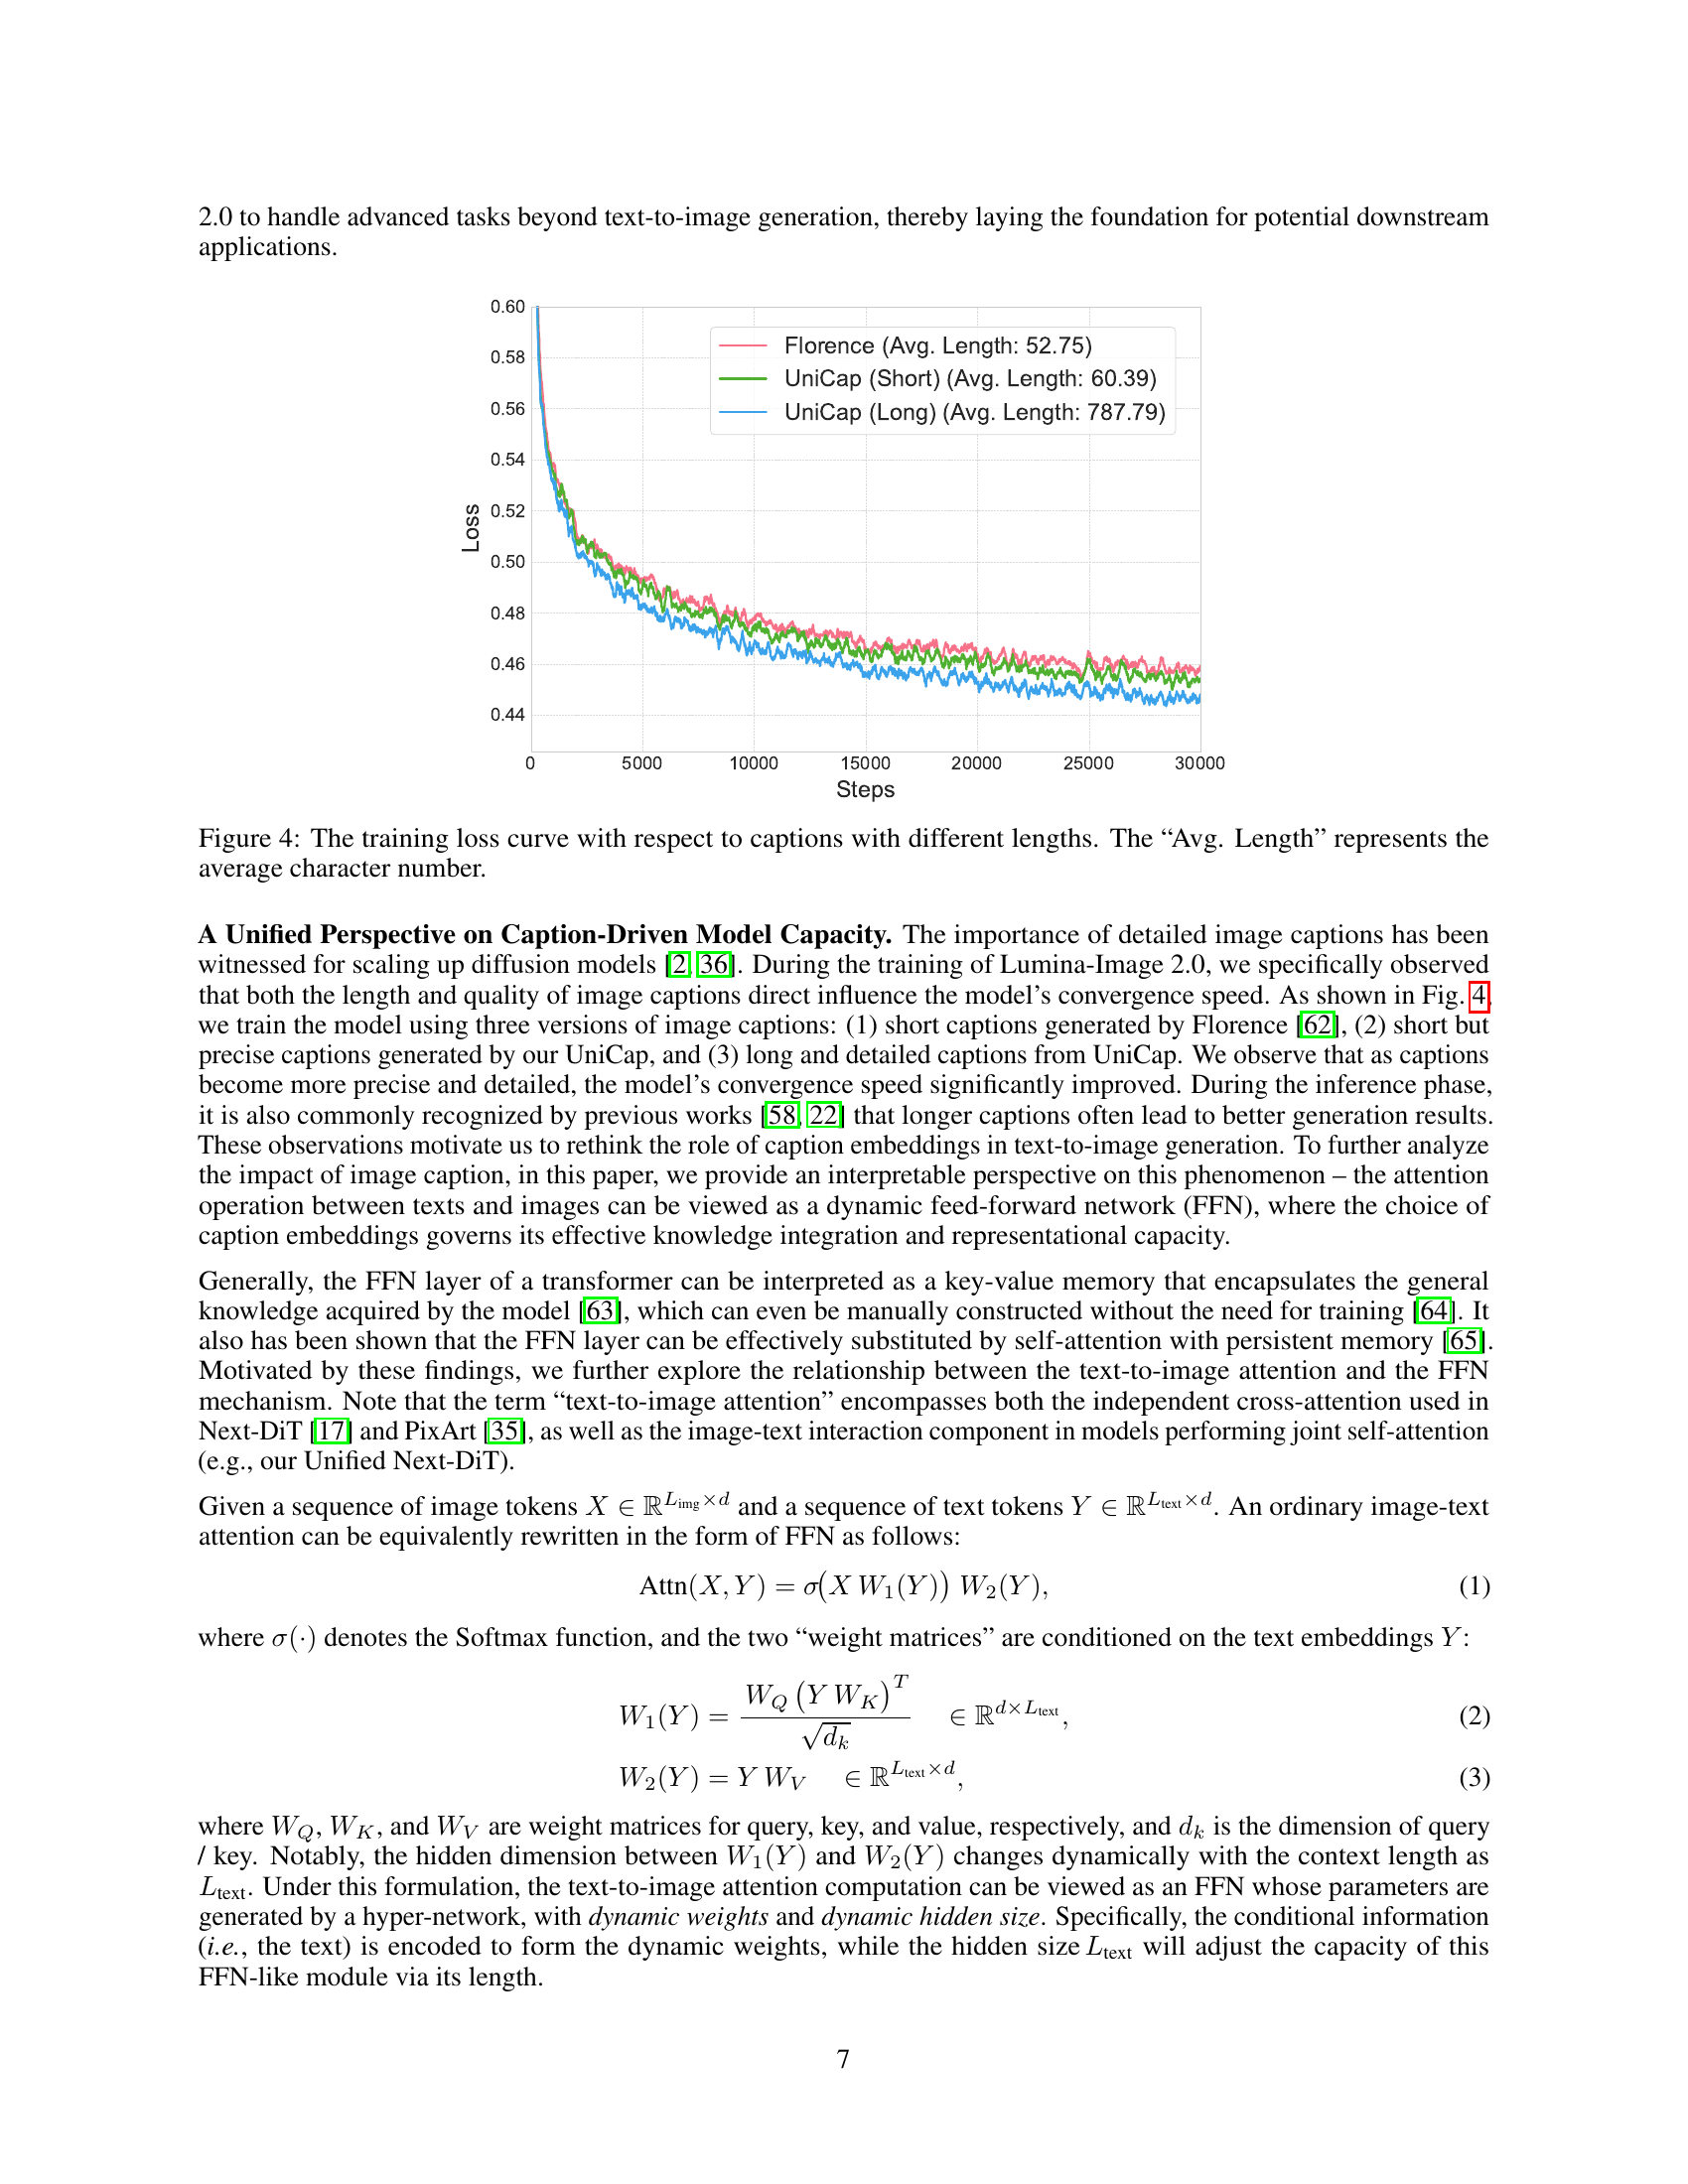
🔼 This figure shows the training loss curves for three different caption lengths: short captions from Florence, relatively short captions from UniCap, and longer, more detailed captions from UniCap. The x-axis represents the number of training steps, and the y-axis represents the training loss. The graph visually demonstrates that the model converges faster and achieves a lower loss when trained with longer, more detailed captions compared to shorter captions. The ‘Avg. Length’ specifies the average number of characters in each caption type.
read the caption
Figure 4: The training loss curve with respect to captions with different lengths. The “Avg. Length” represents the average character number.

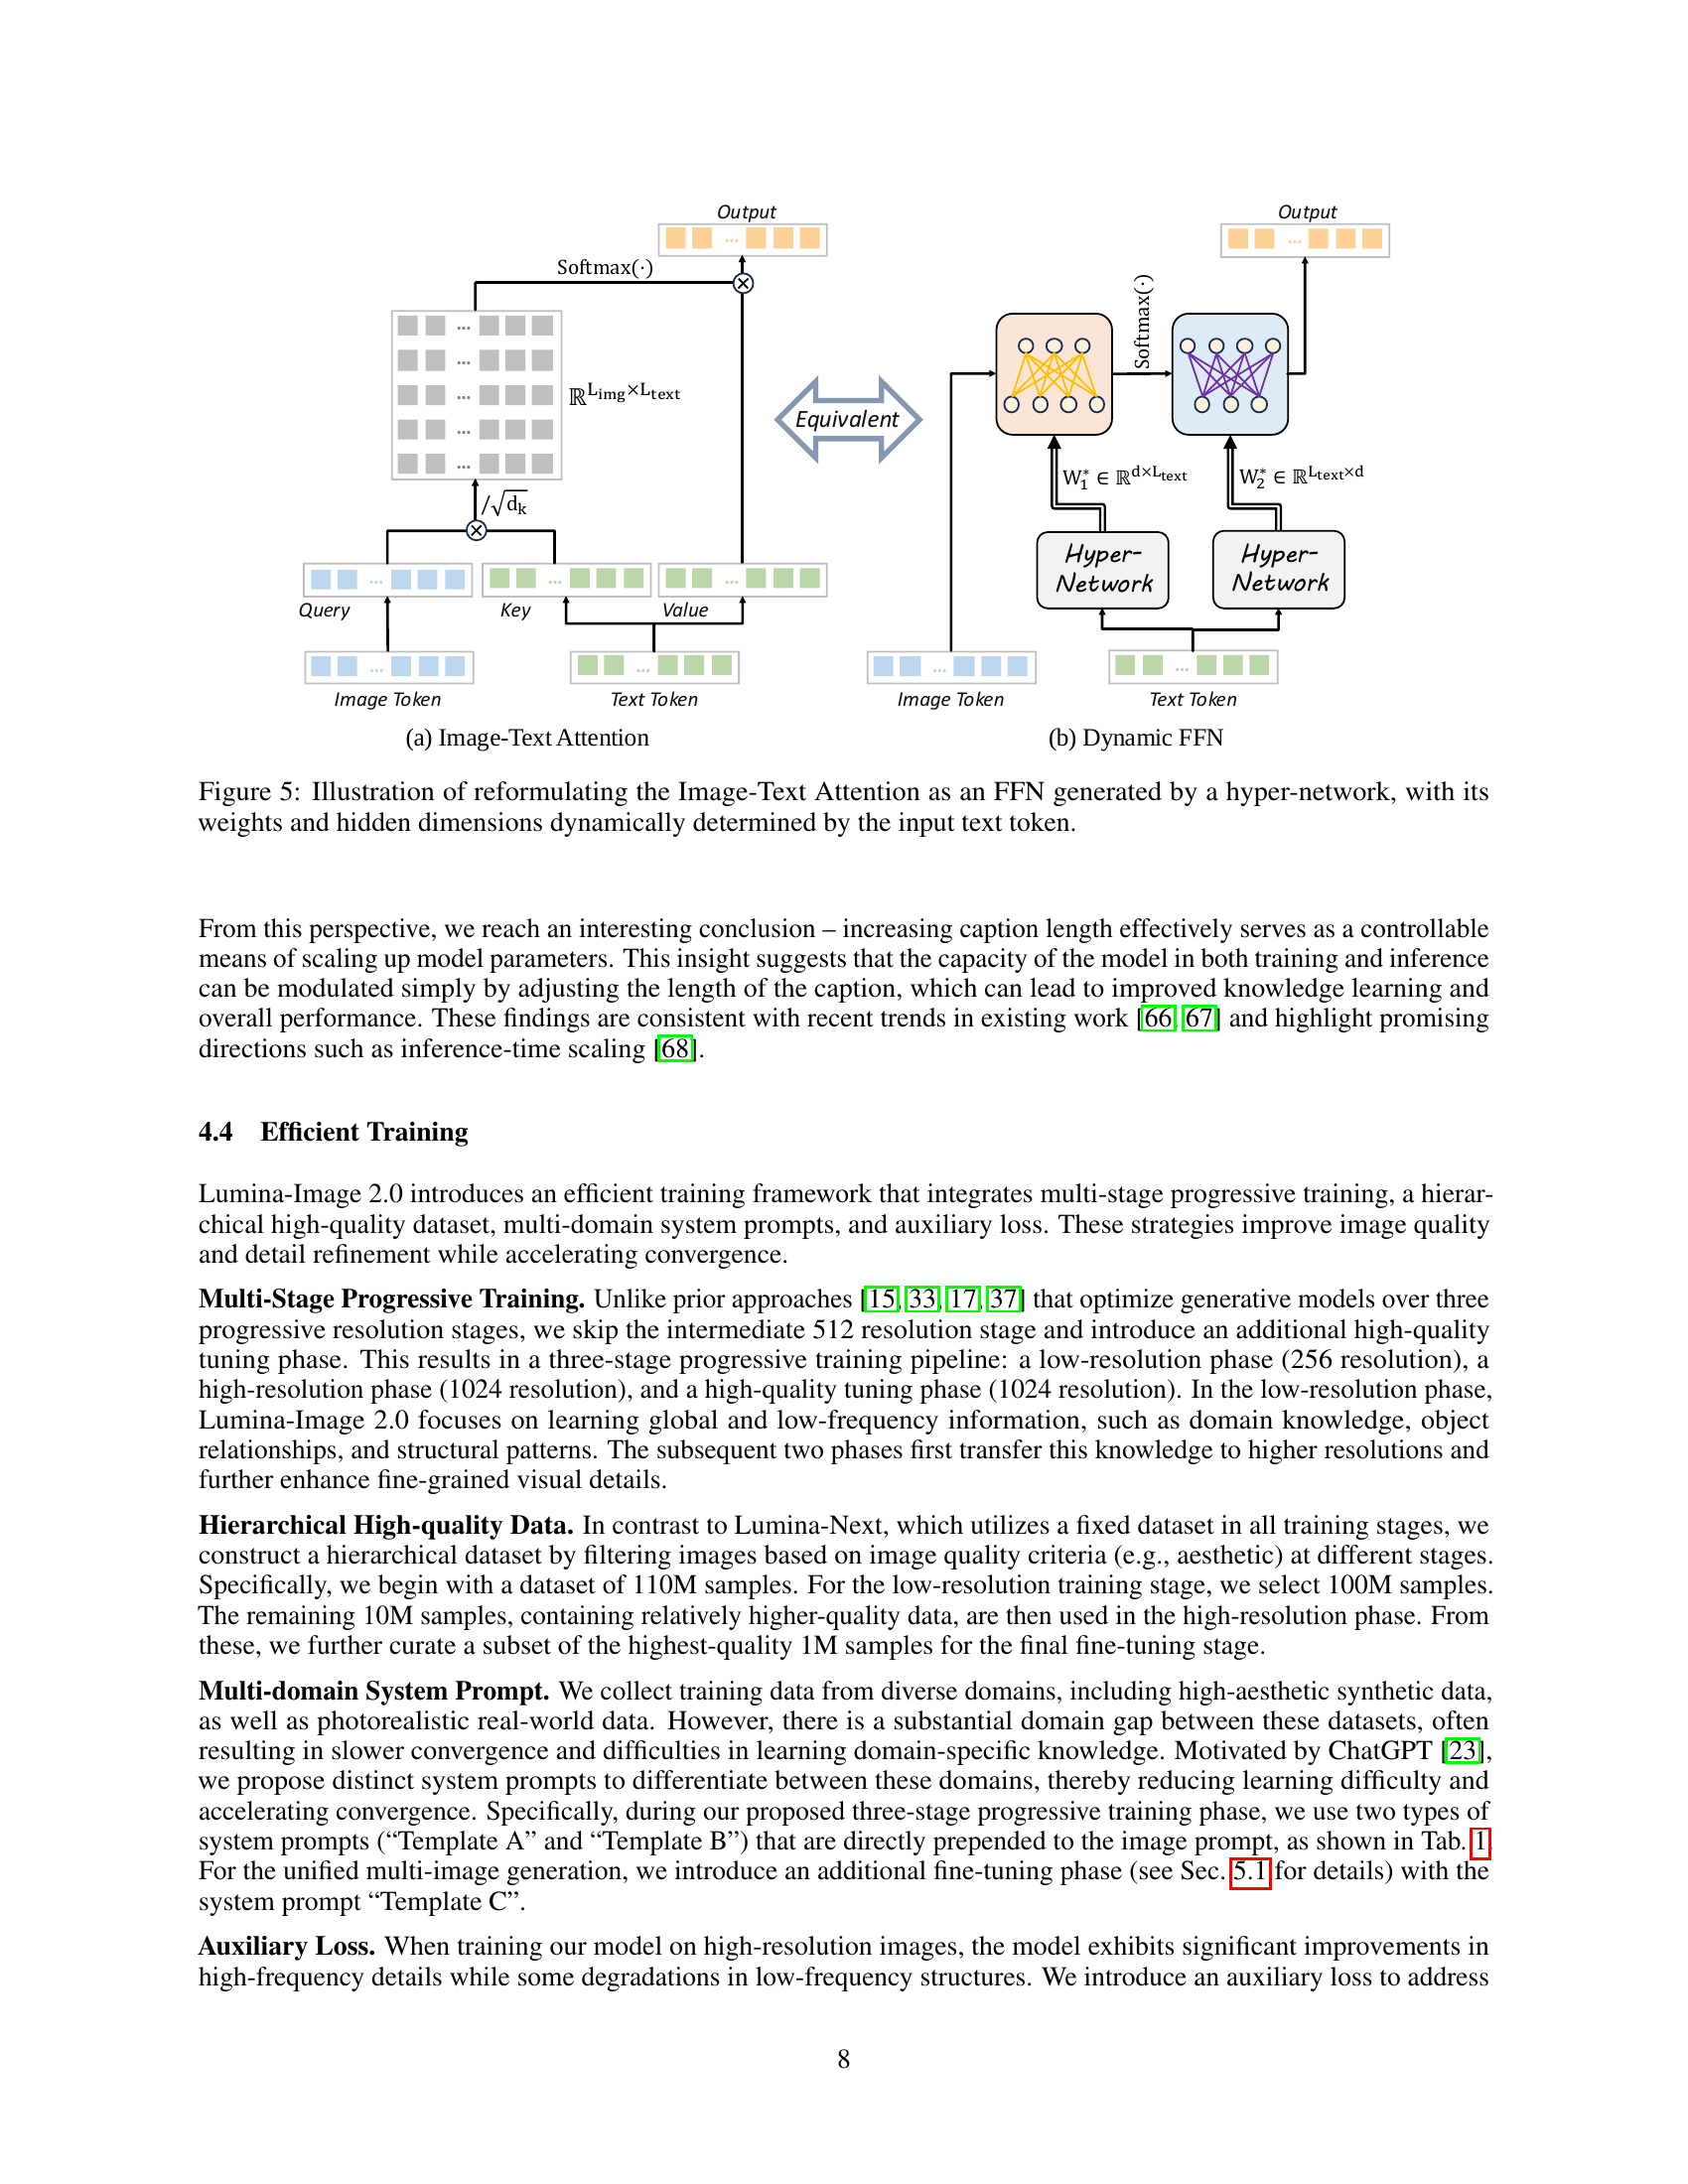
🔼 Figure 5 illustrates how the image-text attention mechanism in a transformer network can be reinterpreted as a feed-forward network (FFN). This FFN is generated by a hyper-network, meaning its weights and the dimensionality of its hidden layer are dynamically adjusted according to the input text tokens. The diagram visually represents this transformation by showing how the input text token influences the hyper-network’s output, which in turn determines the FFN’s structure and parameters. This reformulation helps to explain how the model’s capacity adapts to different text lengths, implying that longer descriptions allow for a richer representation and better integration of textual and visual information.
read the caption
Figure 5: Illustration of reformulating the Image-Text Attention as an FFN generated by a hyper-network, with its weights and hidden dimensions dynamically determined by the input text token.

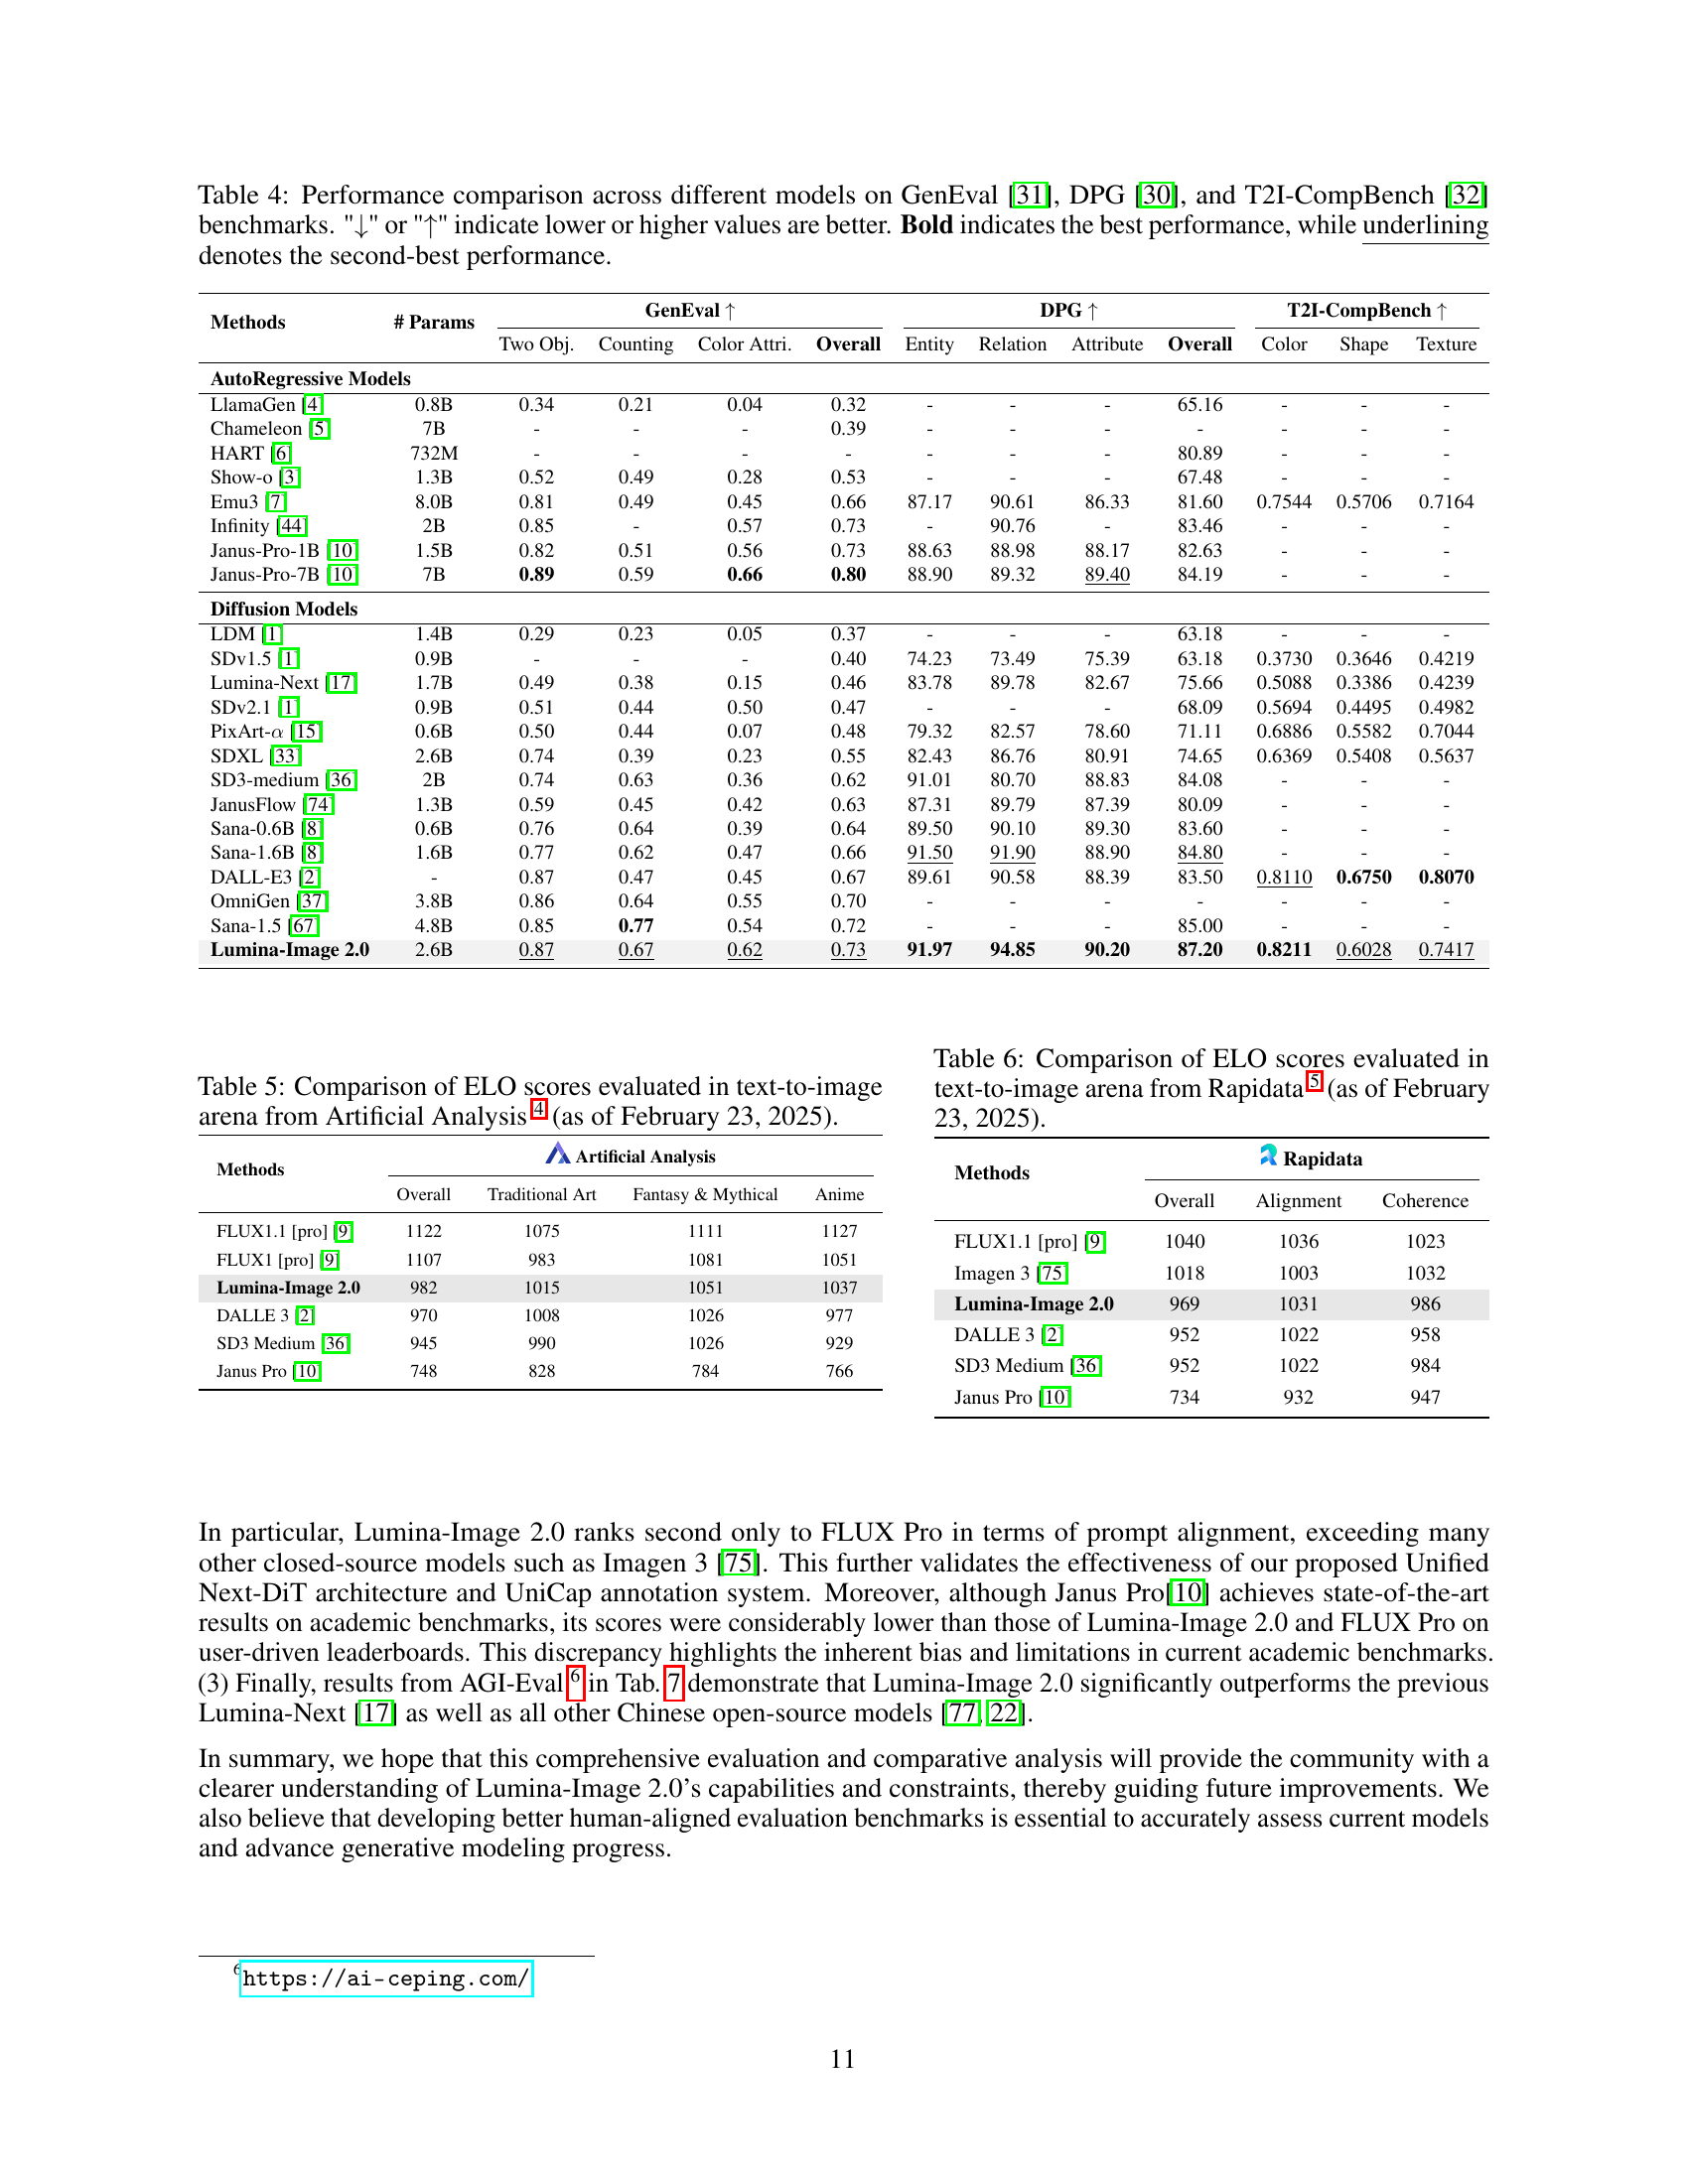
🔼 This table presents a comparison of ELO scores from the Artificial Analysis 1 text-to-image arena as of February 23, 2025. ELO scores are a measure of relative performance, reflecting the results of competition between different models in the arena. The table allows for a direct comparison of the performance of various models, showing their relative strengths and weaknesses in generating images from text prompts.
read the caption
Table 5: Comparison of ELO scores evaluated in text-to-image arena from Artificial Analysis 1 (as of February 23, 2025).

🔼 This table compares the ELO scores of different text-to-image models in the Rapidata 2 arena as of February 23, 2025. The ELO scores reflect the relative performance of each model based on head-to-head comparisons judged by human evaluators. Higher scores indicate better performance.
read the caption
Table 6: Comparison of ELO scores evaluated in text-to-image arena from Rapidata 2 (as of February 23, 2025).
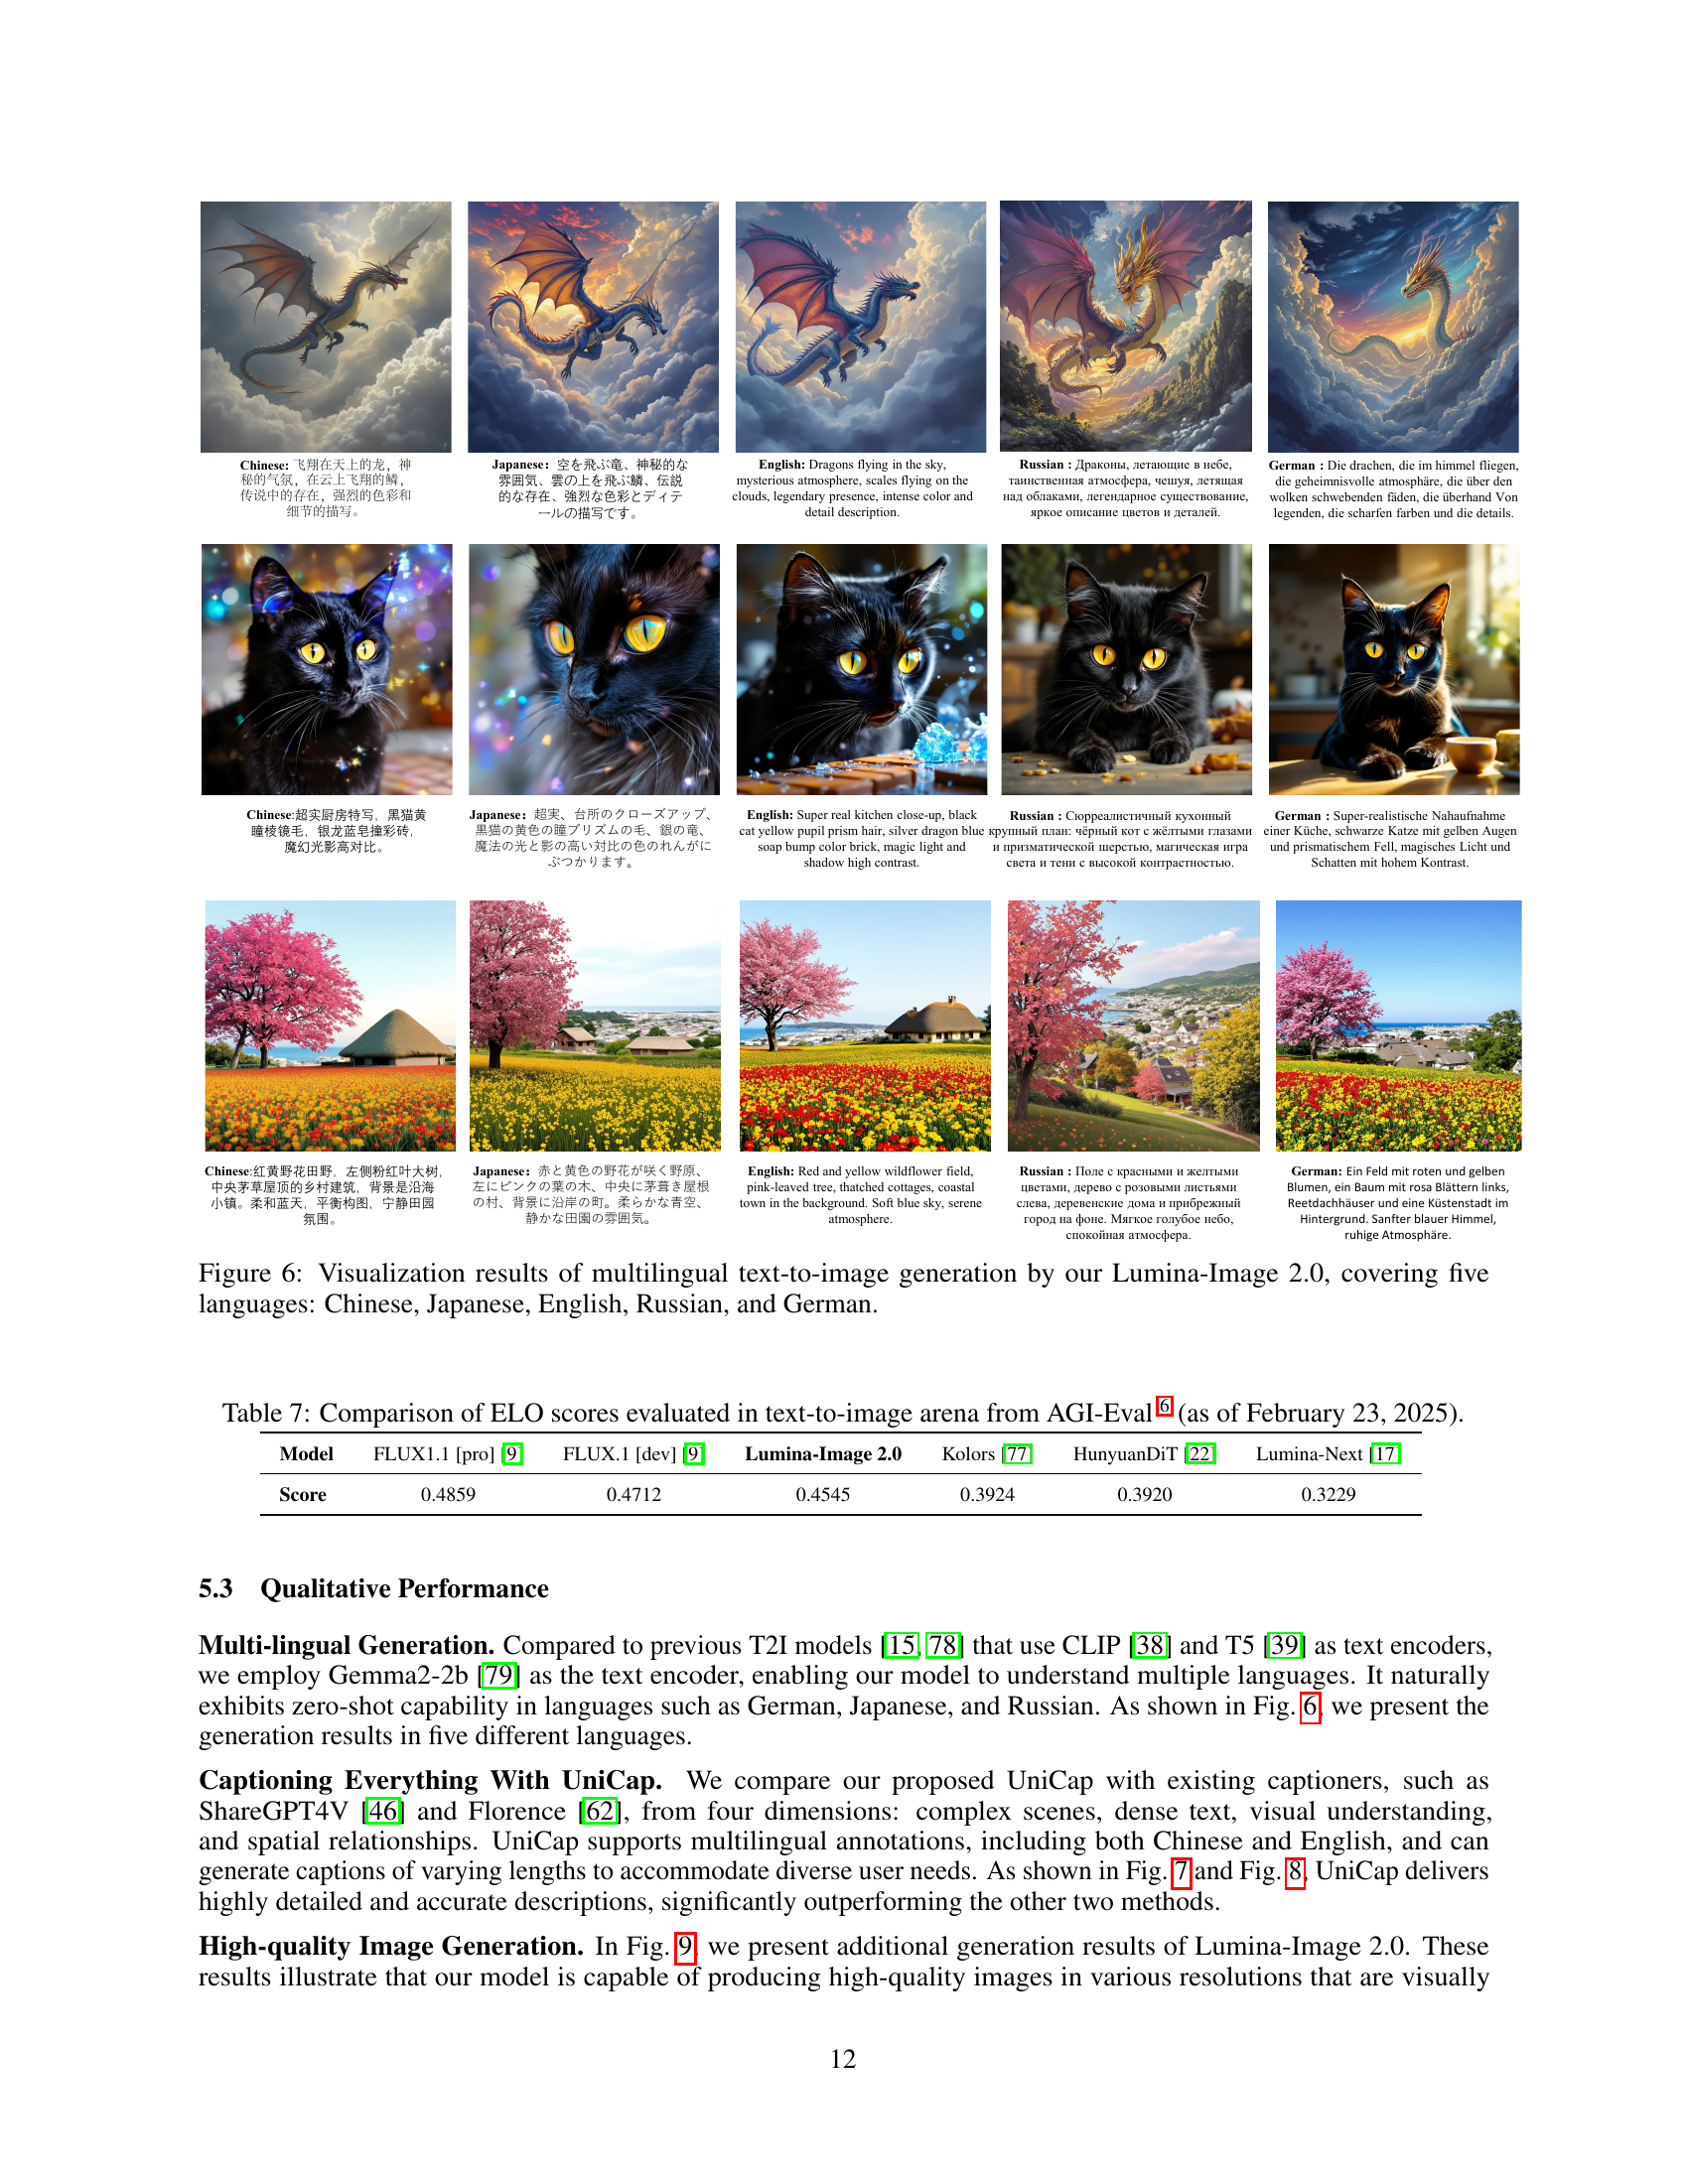
🔼 This figure displays the results of Lumina-Image 2.0’s multilingual text-to-image generation capabilities. It shows examples of images generated from the same prompts translated into five different languages: Chinese, Japanese, English, Russian, and German. This demonstrates the model’s ability to understand and generate images accurately across multiple languages, showcasing its robustness and multilingual capabilities.
read the caption
Figure 6: Visualization results of multilingual text-to-image generation by our Lumina-Image 2.0, covering five languages: Chinese, Japanese, English, Russian, and German.

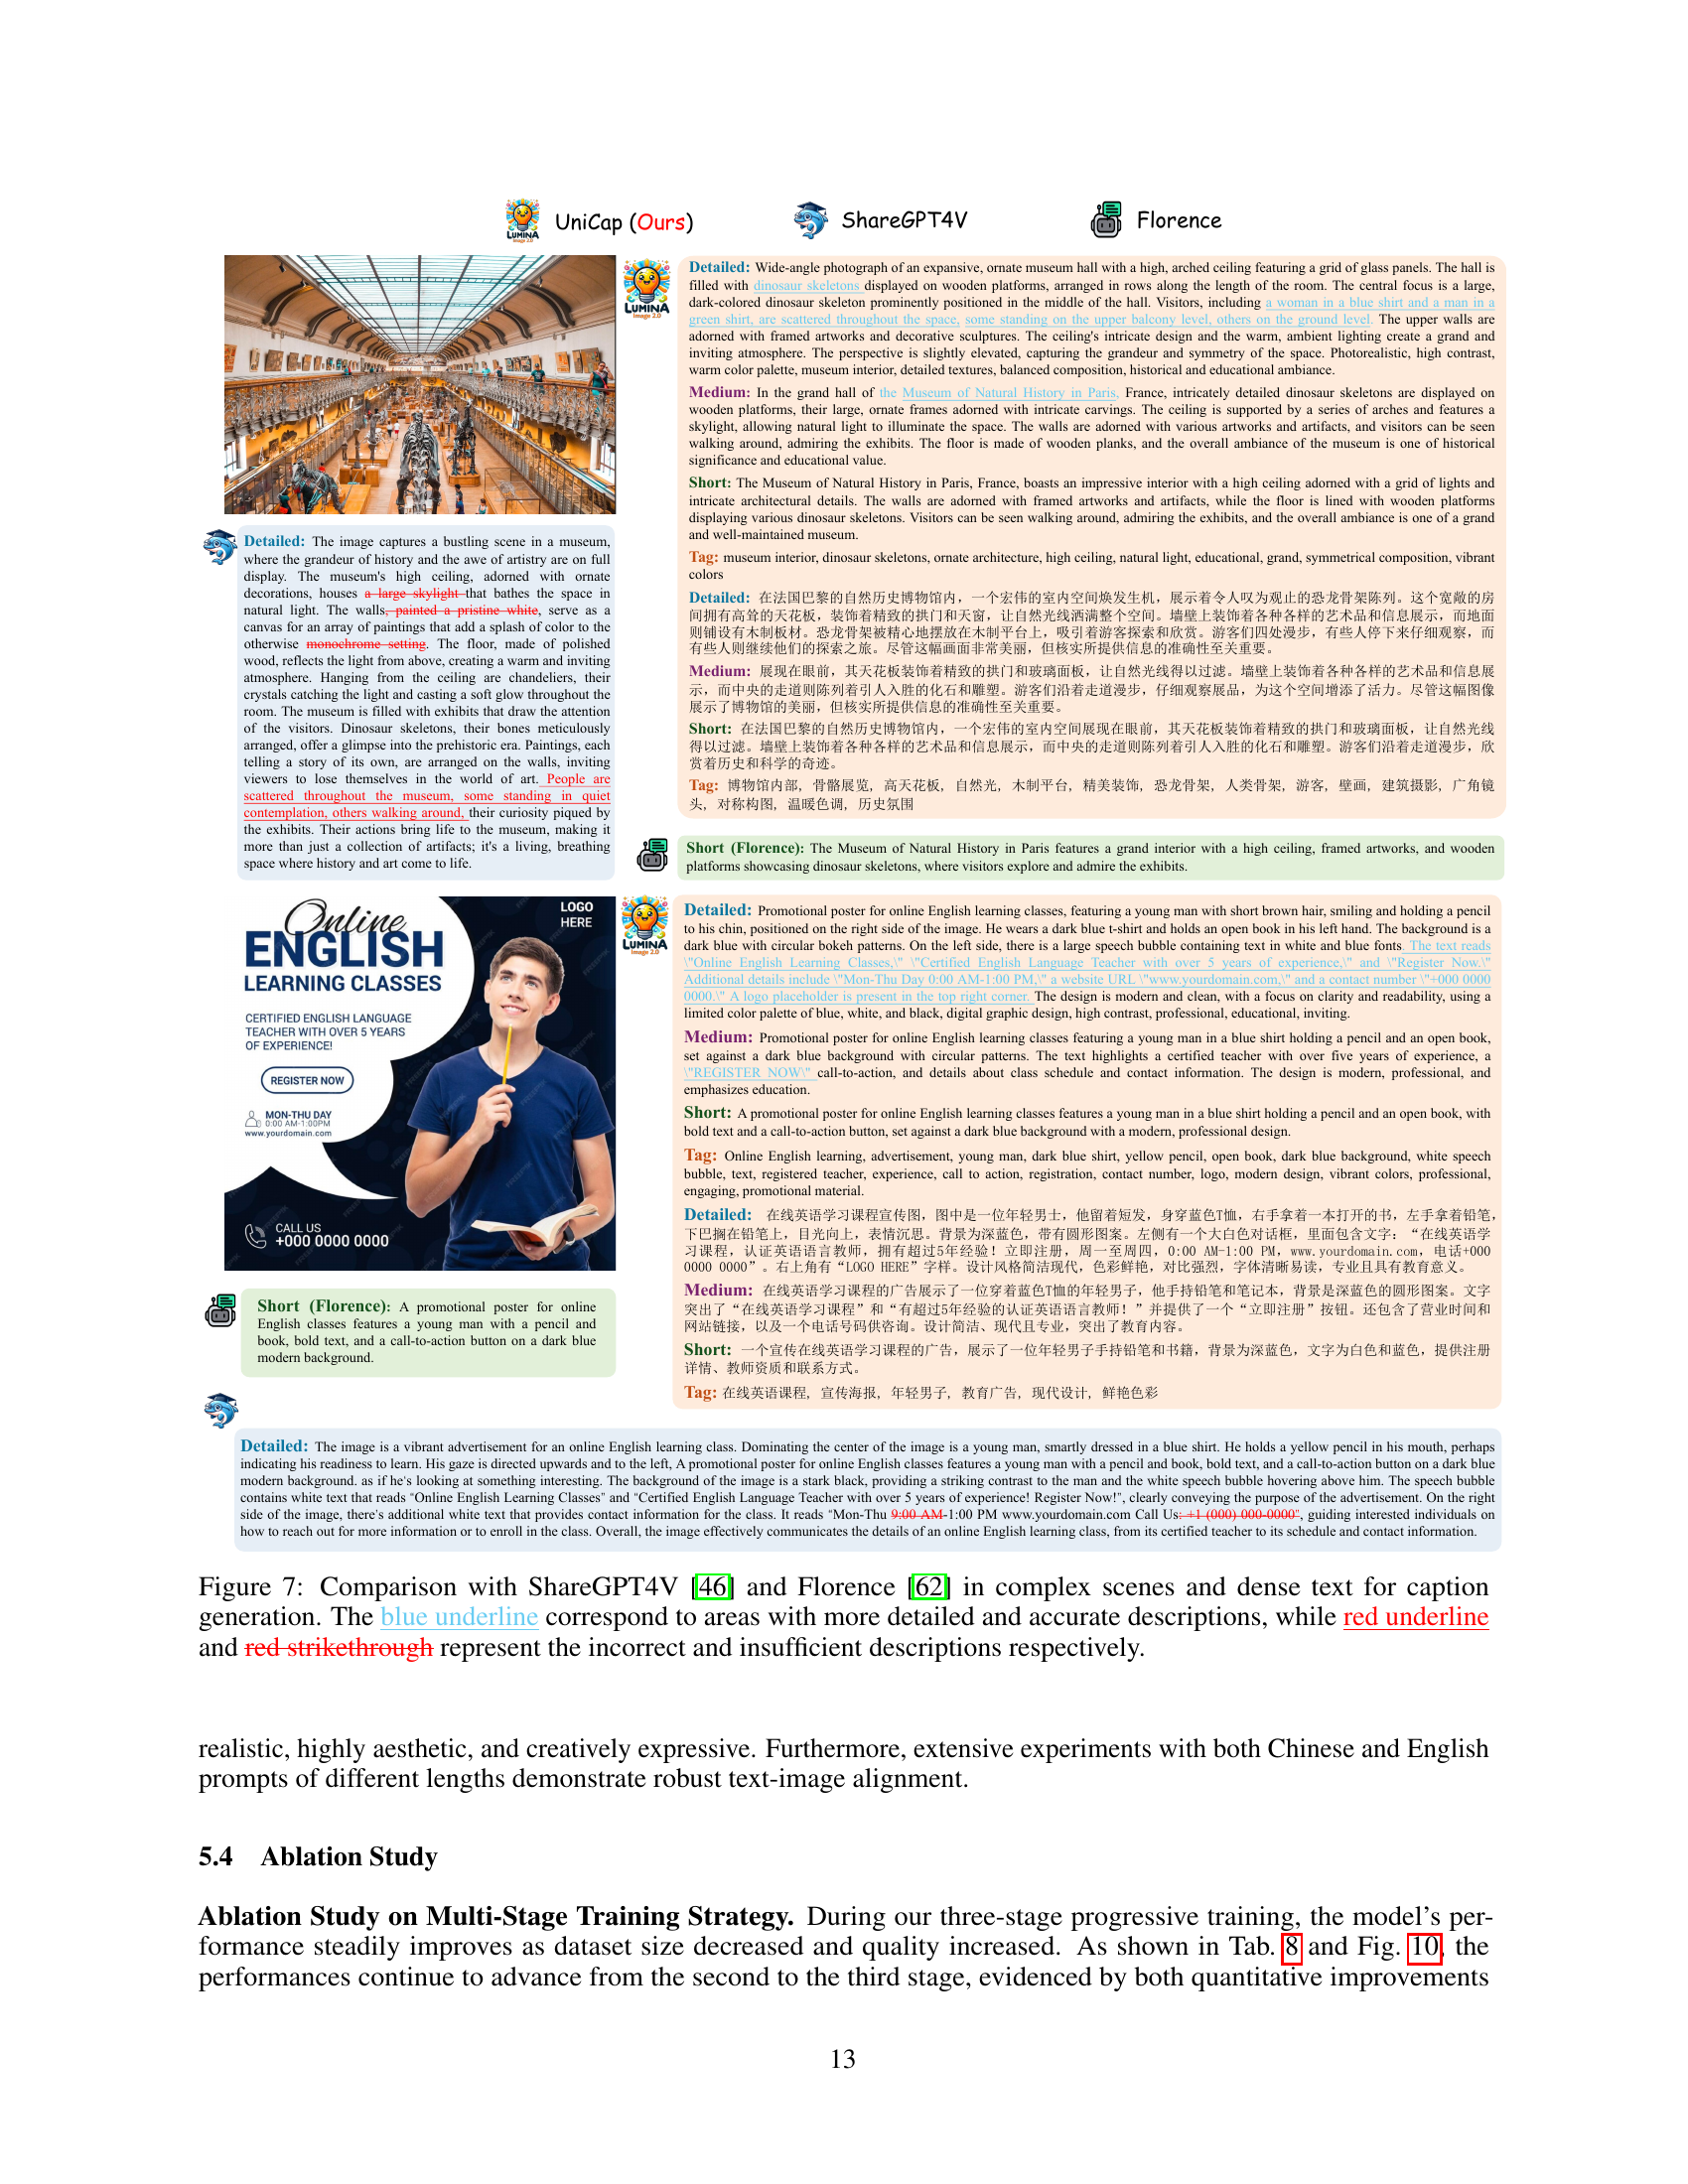
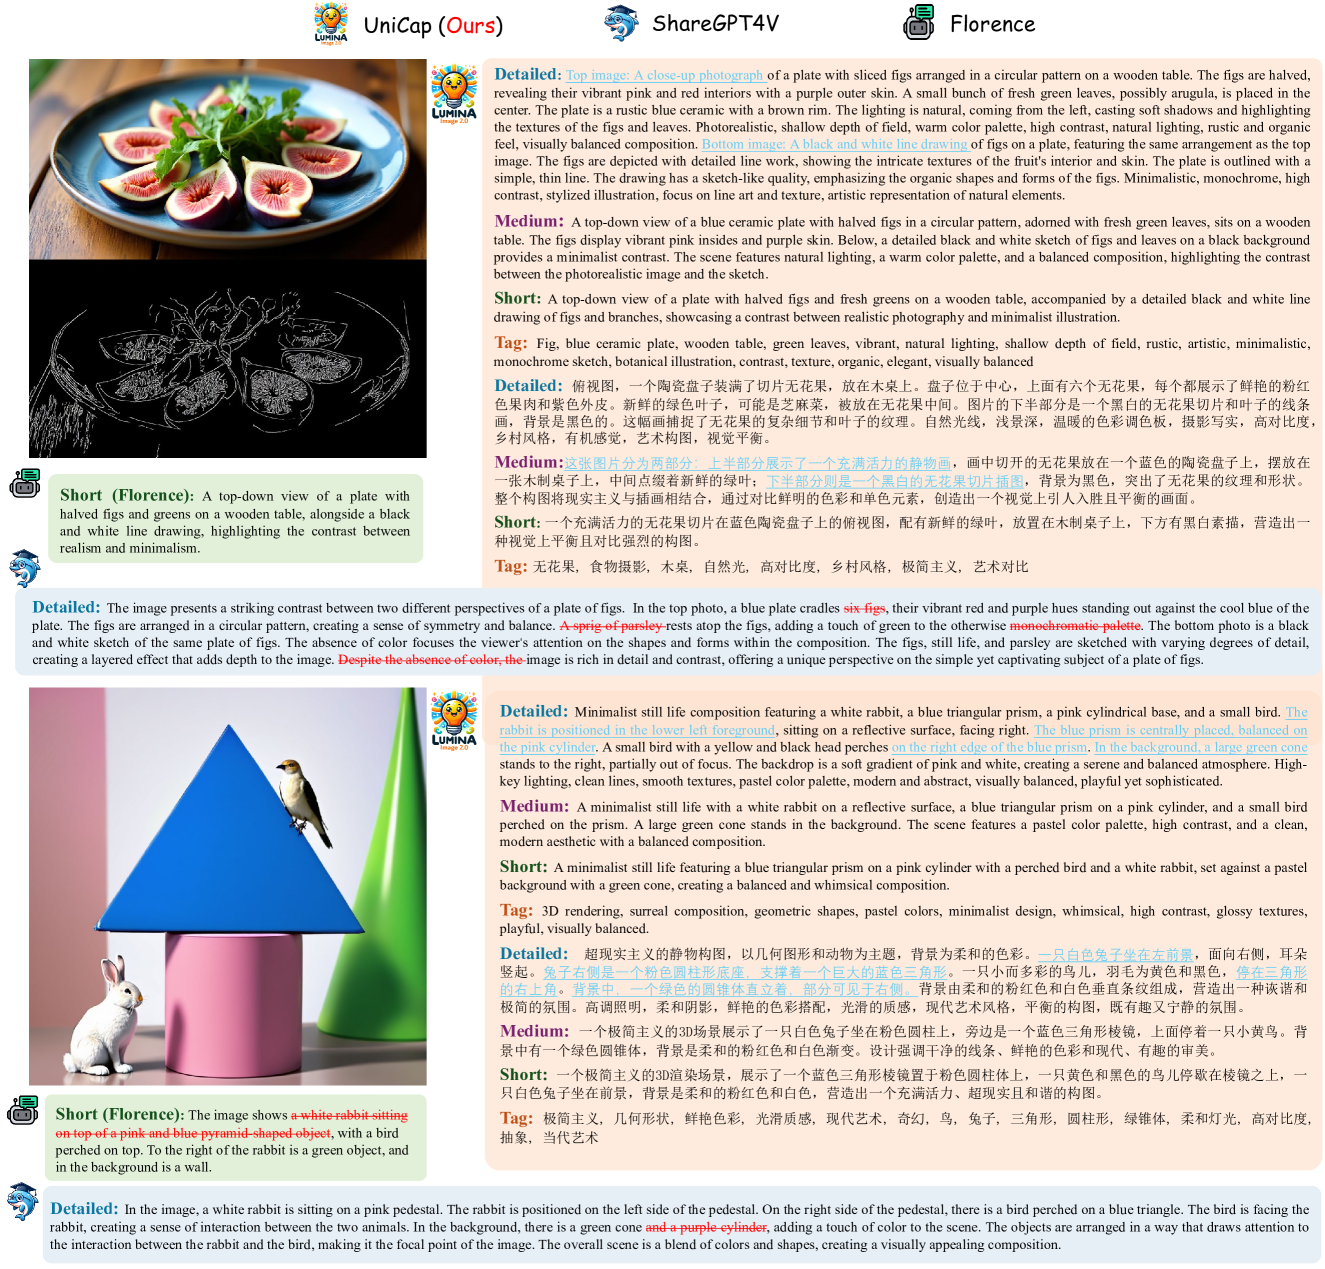
🔼 Figure 7 compares the captioning abilities of three models: UniCap (the model introduced in this paper), ShareGPT4V, and Florence. The figure shows example captions generated by each model for a complex image. Blue underlines highlight areas where UniCap provides significantly more detailed and accurate descriptions than the other models. Conversely, red underlines and strikethroughs show where ShareGPT4V and Florence provide inaccurate or incomplete information compared to UniCap. This illustrates UniCap’s superiority in handling complex scenes and generating comprehensive and precise descriptions.
read the caption
Figure 7: Comparison with ShareGPT4V [46] and Florence [62] in complex scenes and dense text for caption generation. The blue underline correspond to areas with more detailed and accurate descriptions, while red underline and red strikethrough represent the incorrect and insufficient descriptions respectively.

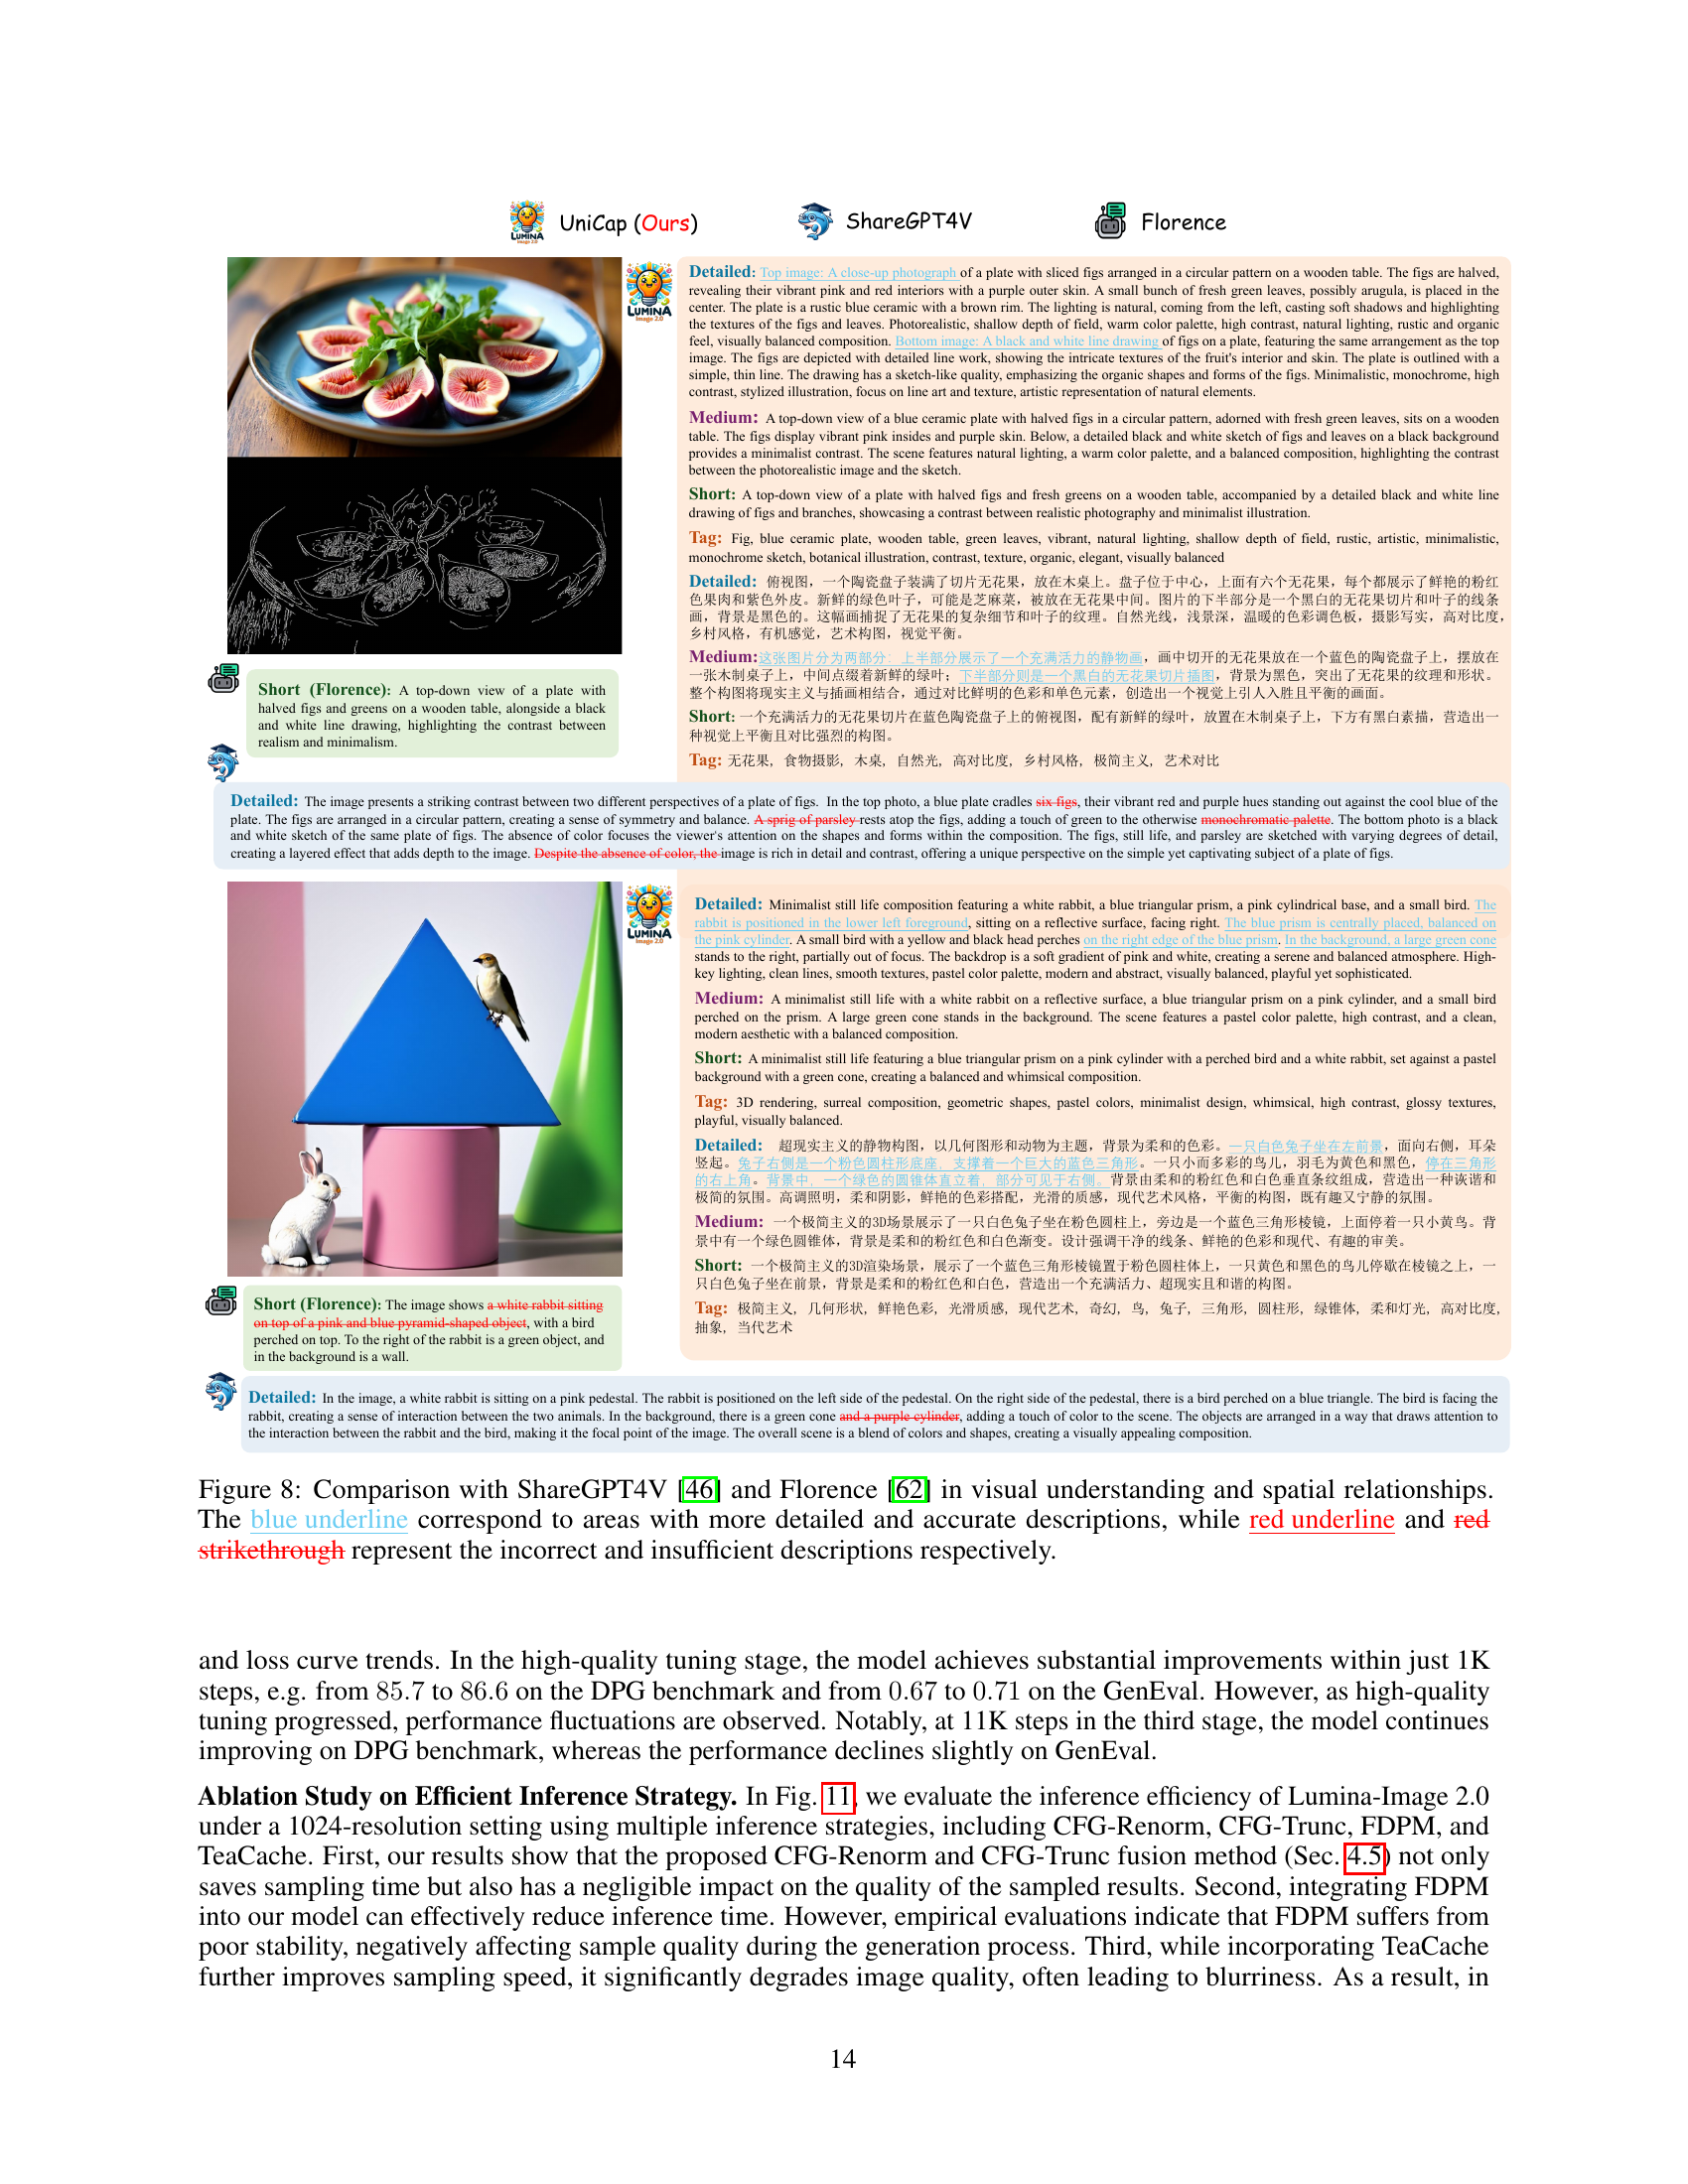
🔼 Figure 8 presents a comparison of captioning results generated by UniCap, ShareGPT4V [46], and Florence [62] for images containing complex visual relationships. UniCap’s superior performance is highlighted by comparing the captions side-by-side; UniCap provides more comprehensive and accurate descriptions of the visual details and spatial relationships within the images. Conversely, ShareGPT4V and Florence show deficiencies in accurately capturing the visual understanding and precise spatial aspects. Blue underlines indicate where UniCap provided superior descriptions; red underlines and strikethroughs indicate where the other models made mistakes or omissions.
read the caption
Figure 8: Comparison with ShareGPT4V [46] and Florence [62] in visual understanding and spatial relationships. The blue underline correspond to areas with more detailed and accurate descriptions, while red underline and red strikethrough represent the incorrect and insufficient descriptions respectively.

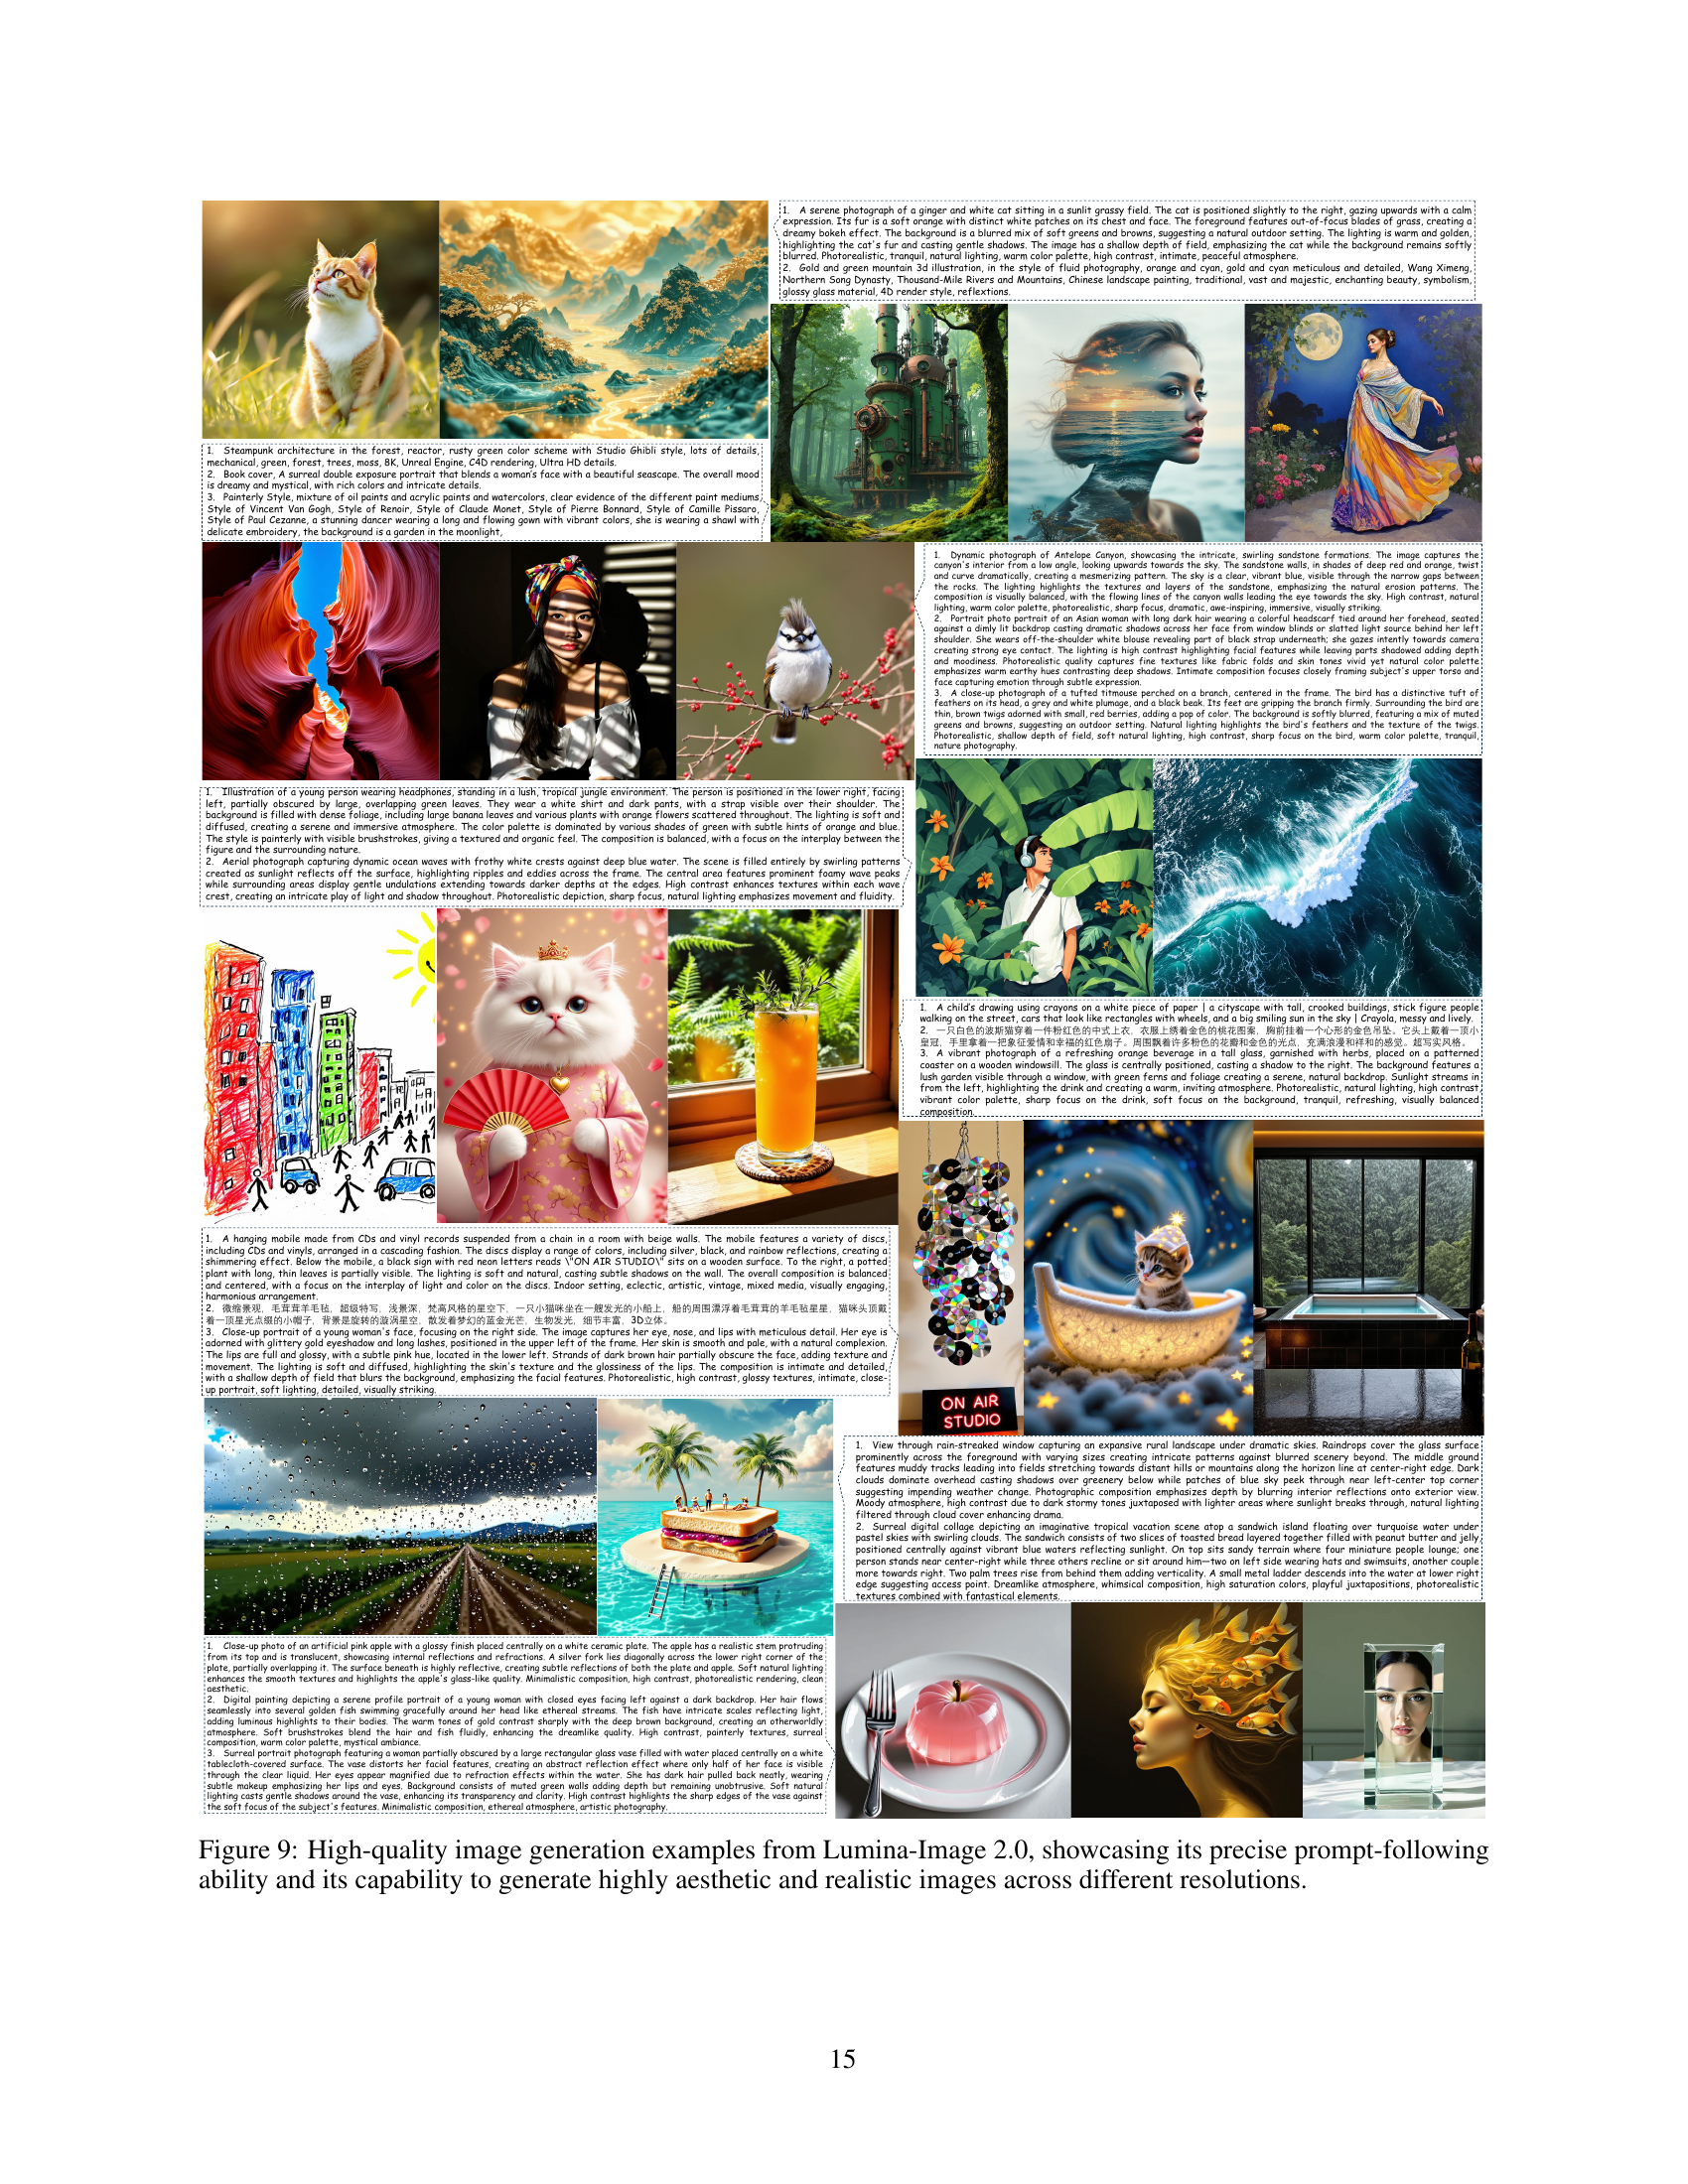
🔼 Figure 9 presents a collection of images generated by Lumina-Image 2.0. These examples highlight the model’s ability to accurately interpret and fulfill detailed user prompts, producing highly realistic and visually appealing results. The images showcase a variety of styles and subjects, demonstrating the model’s versatility and capacity to generate high-quality output across different resolutions. The figure serves as visual evidence of the model’s capabilities in precise prompt-following, aesthetic generation, and resolution scalability.
read the caption
Figure 9: High-quality image generation examples from Lumina-Image 2.0, showcasing its precise prompt-following ability and its capability to generate highly aesthetic and realistic images across different resolutions.

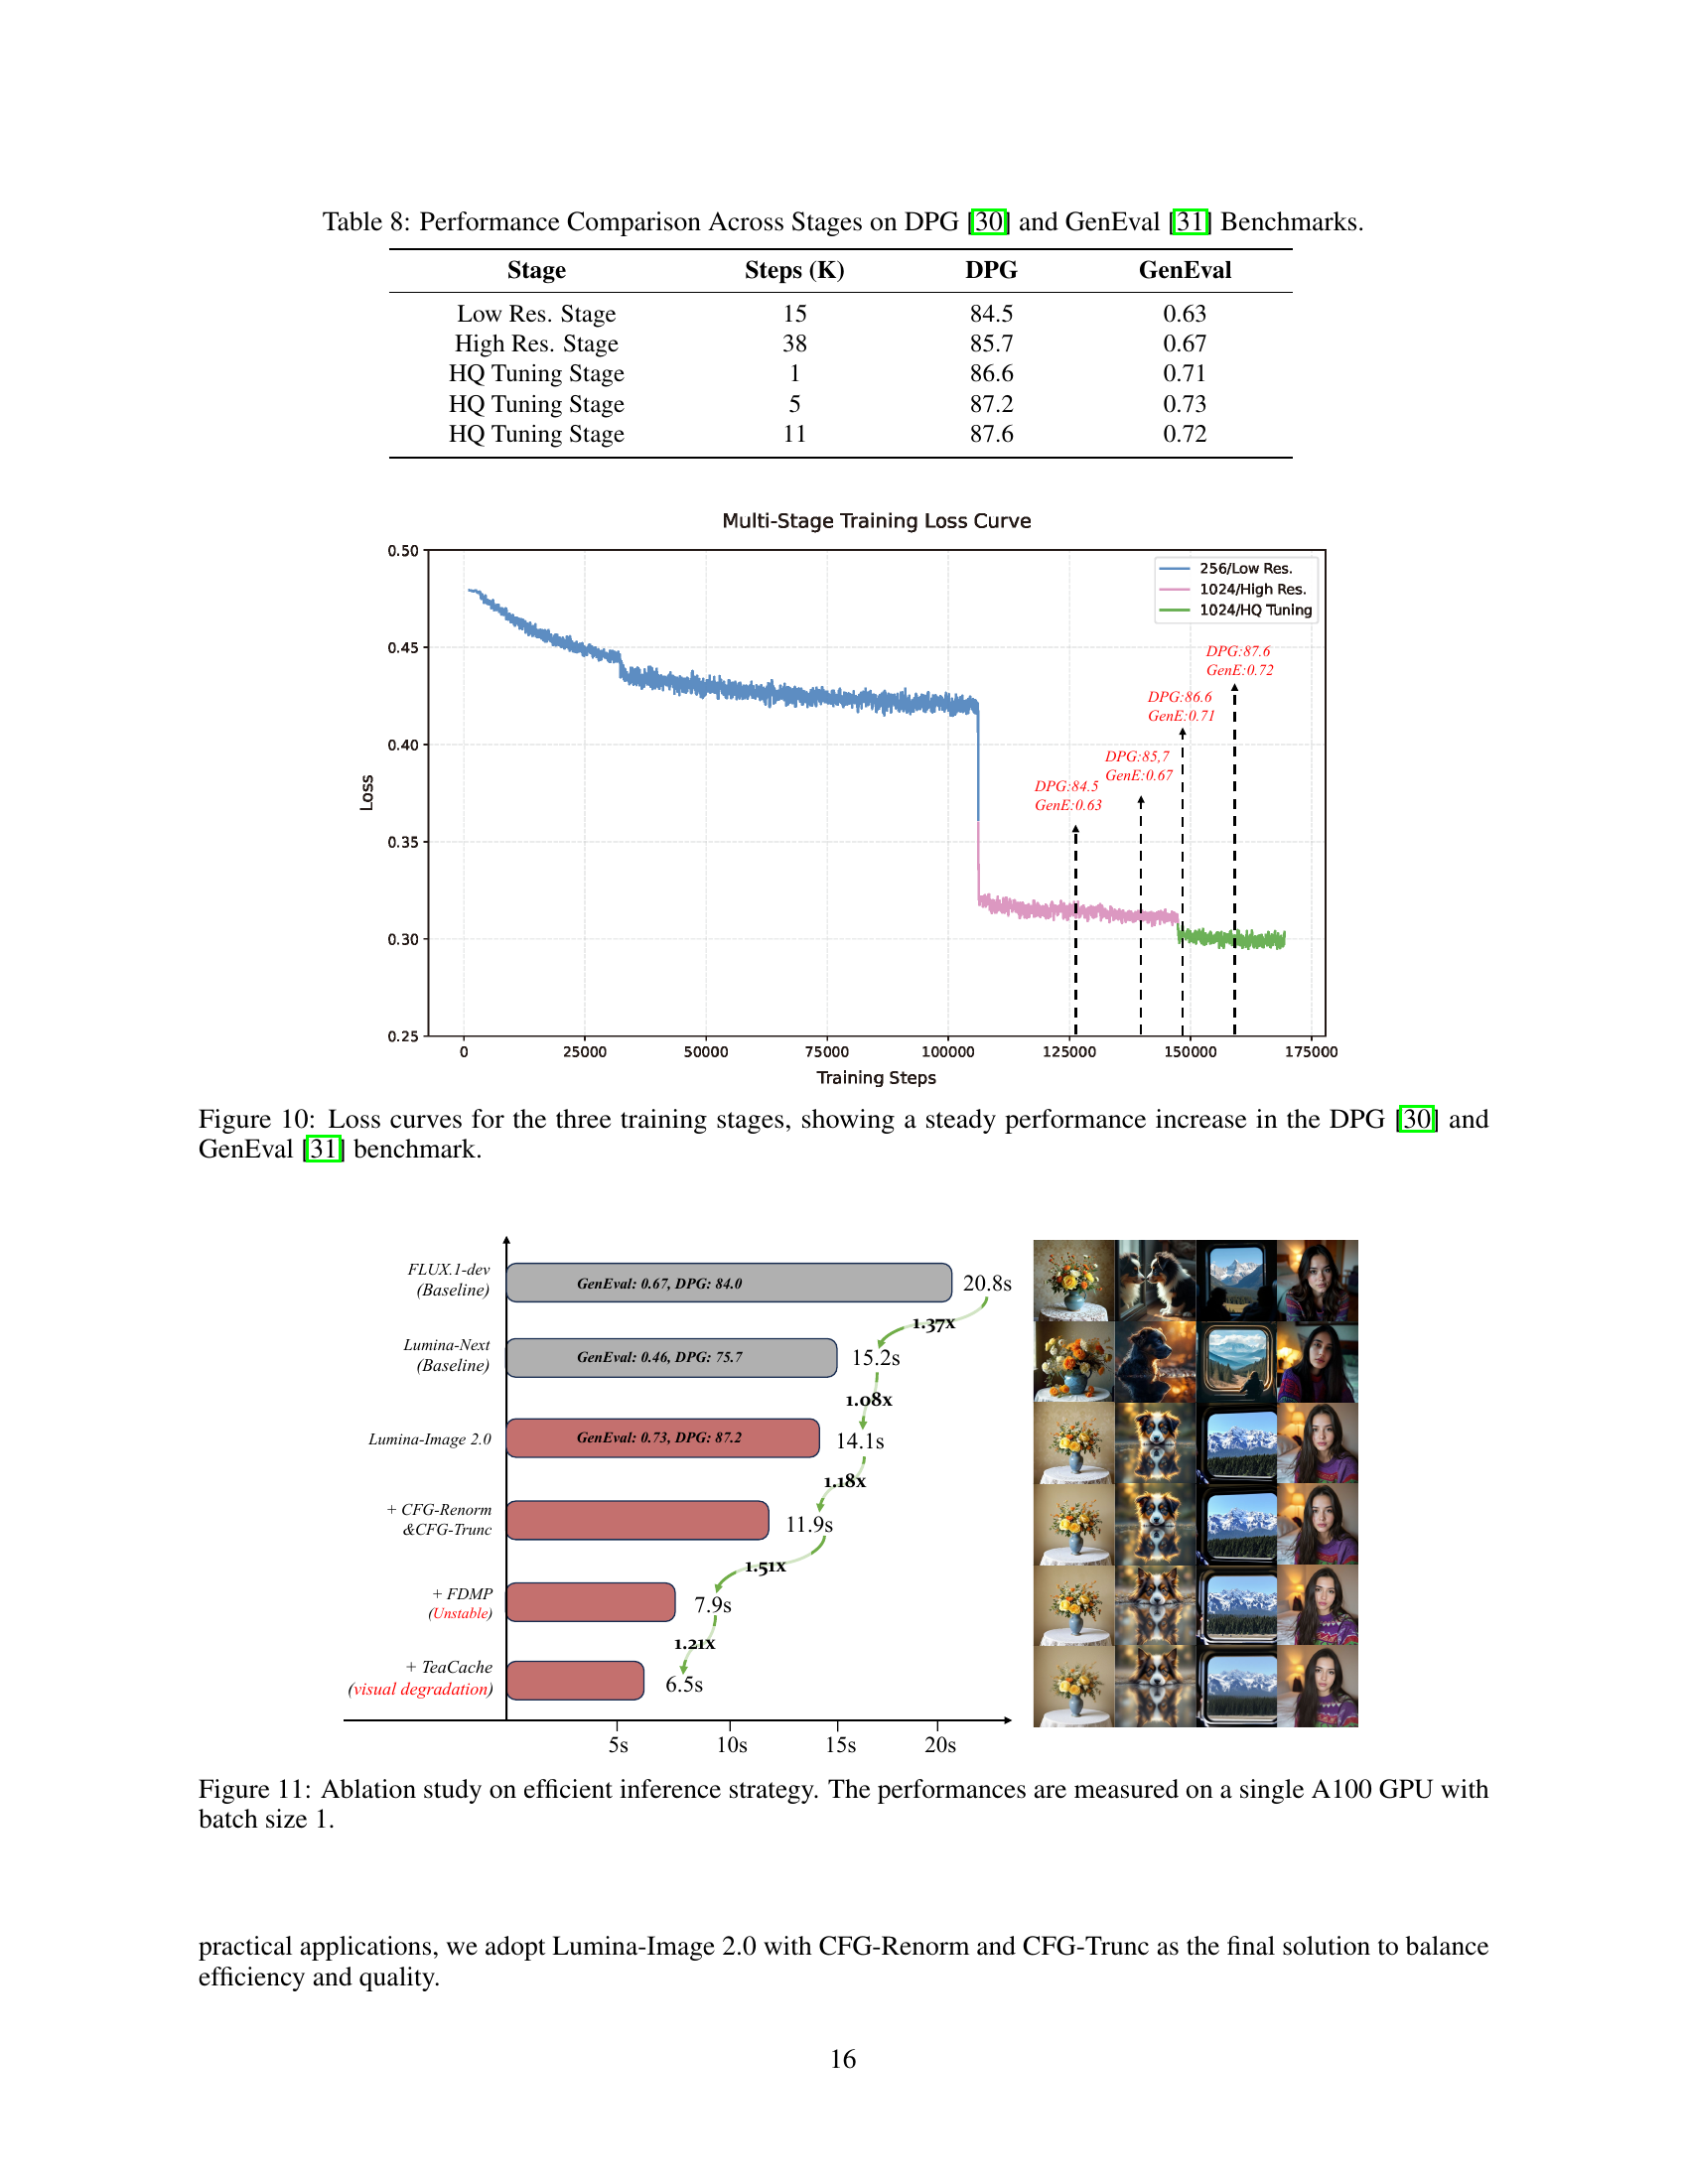
🔼 This figure presents the training loss curves for Lumina-Image 2.0 across three training stages: low-resolution, high-resolution, and high-quality tuning. Each stage is characterized by a distinct dataset resolution and size, with progressively higher quality data used in later stages. The curves show a general downward trend, indicating that the model is learning effectively throughout the training process. Notably, there is a clear improvement in performance (lower loss) as the training progresses to the later stages, which demonstrates the effectiveness of the multi-stage training strategy on both DPG and GenEval benchmarks.
read the caption
Figure 10: Loss curves for the three training stages, showing a steady performance increase in the DPG [30] and GenEval [31] benchmark.
More on tables
| Model | Params | Patch Size | Dimension | Heads | KV Heads | Layers | RMSNorm [72] | Pos. Emb. |
| Lumina-Next | 1.7B | 2 | 2304 | 16 | 8 | 24 | 2D-RoPE | |
| Lumina-Image 2.0 | 2.6B | 2 | 2304 | 24 | 8 | 26 | M-RoPE |
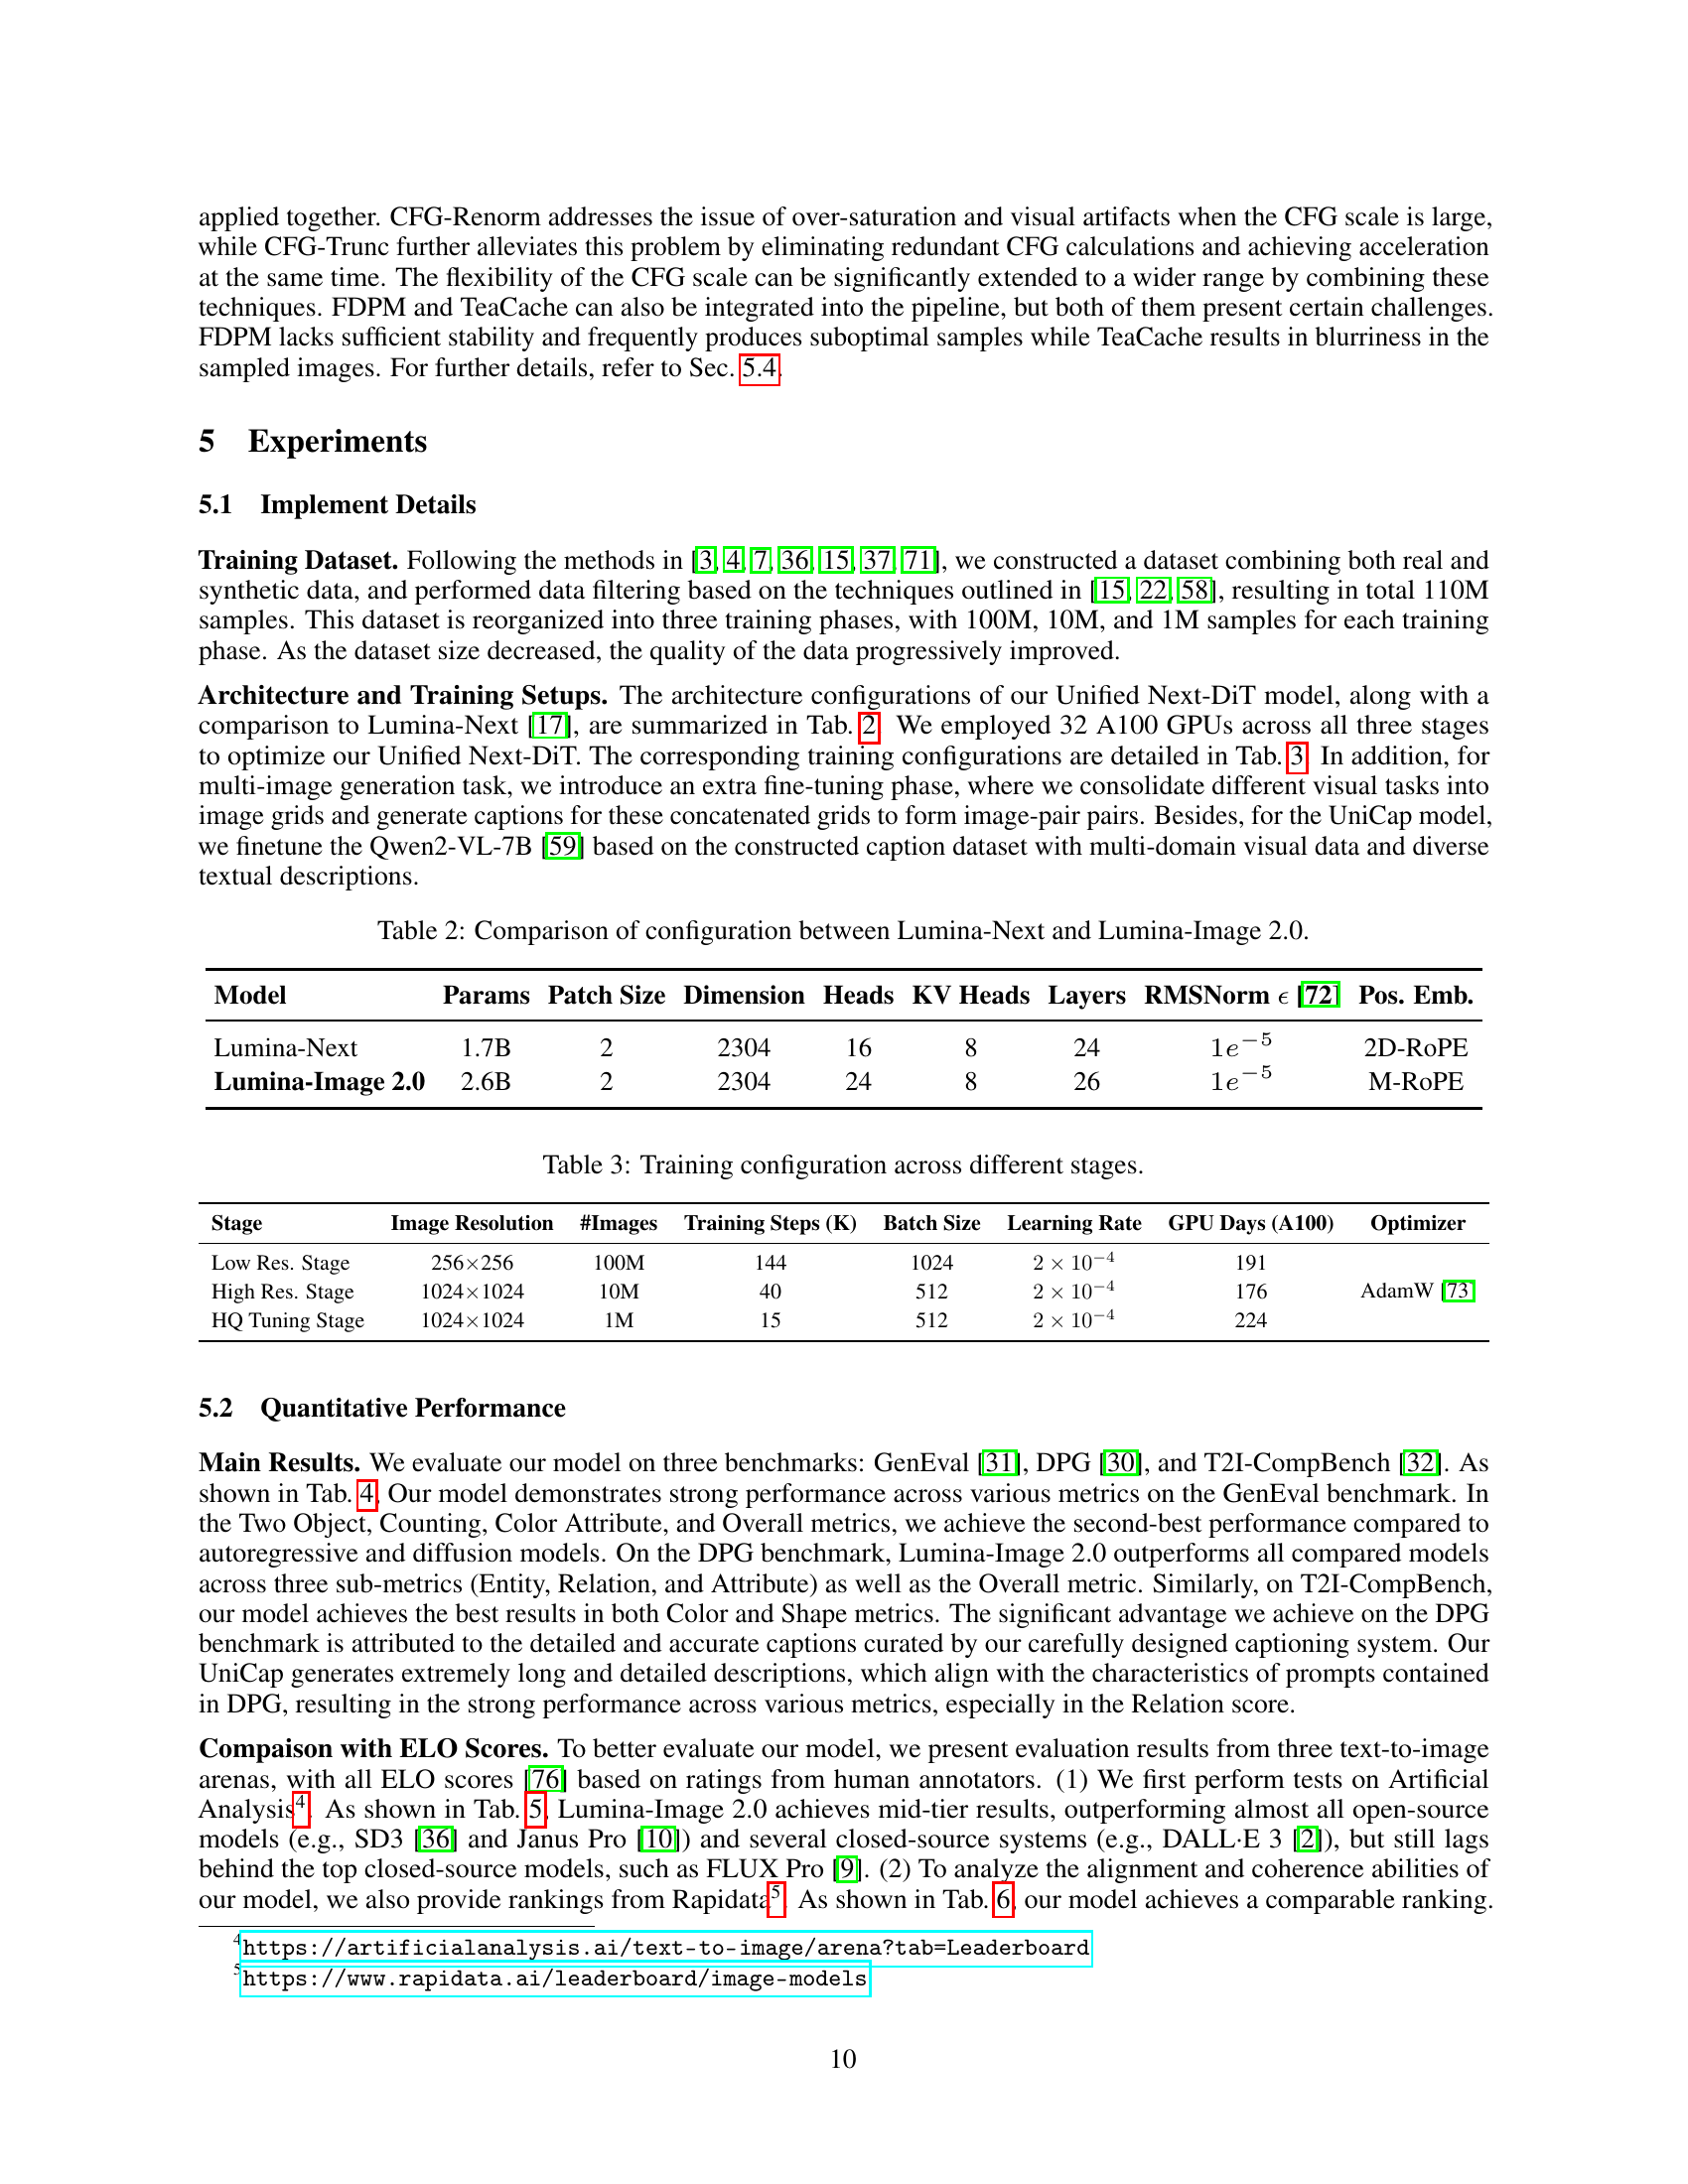
🔼 This table compares the architecture configurations of Lumina-Next and Lumina-Image 2.0, highlighting key differences in the number of parameters, patch size, dimensions, number of heads (both KV and key value heads), the number of layers, the type of normalization used (RMSNorm), and the type of positional embedding used (2D-ROPE and Multimodal-ROPE). It provides a quantitative overview of the architectural changes between the two models, allowing for a direct comparison of their computational complexity and design choices.
read the caption
Table 2: Comparison of configuration between Lumina-Next and Lumina-Image 2.0.
| Stage | Image Resolution | #Images | Training Steps (K) | Batch Size | Learning Rate | GPU Days (A100) | Optimizer |
| Low Res. Stage | 256256 | 100M | 144 | 1024 | 191 | AdamW [73] | |
| High Res. Stage | 10241024 | 10M | 40 | 512 | 176 | ||
| HQ Tuning Stage | 10241024 | 1M | 15 | 512 | 224 |
🔼 This table details the training configurations used for Lumina-Image 2.0 across its three-stage training process: low-resolution, high-resolution, and high-quality tuning. For each stage, it specifies the image resolution, the number of images used, the number of training steps (in thousands), the batch size, the learning rate, the number of GPU days consumed (using A100 GPUs), and the optimizer used (AdamW). This information is crucial in understanding the training choices made in developing the model and the computational resources required.
read the caption
Table 3: Training configuration across different stages.
| Methods | # Params | GenEval | DPG | T2I-CompBench | ||||||||
| Two Obj. | Counting | Color Attri. | Overall | Entity | Relation | Attribute | Overall | Color | Shape | Texture | ||
| AutoRegressive Models | ||||||||||||
| LlamaGen [4] | 0.8B | 0.34 | 0.21 | 0.04 | 0.32 | - | - | - | 65.16 | - | - | - |
| Chameleon [5] | 7B | - | - | - | 0.39 | - | - | - | - | - | - | - |
| HART [6] | 732M | - | - | - | - | - | - | - | 80.89 | - | - | - |
| Show-o [3] | 1.3B | 0.52 | 0.49 | 0.28 | 0.53 | - | - | - | 67.48 | - | - | - |
| Emu3 [7] | 8.0B | 0.81 | 0.49 | 0.45 | 0.66 | 87.17 | 90.61 | 86.33 | 81.60 | 0.7544 | 0.5706 | 0.7164 |
| Infinity [44] | 2B | 0.85 | - | 0.57 | 0.73 | - | 90.76 | - | 83.46 | - | - | - |
| Janus-Pro-1B [10] | 1.5B | 0.82 | 0.51 | 0.56 | 0.73 | 88.63 | 88.98 | 88.17 | 82.63 | - | - | - |
| Janus-Pro-7B [10] | 7B | 0.89 | 0.59 | 0.66 | 0.80 | 88.90 | 89.32 | 89.40 | 84.19 | - | - | - |
| Diffusion Models | ||||||||||||
| LDM [1] | 1.4B | 0.29 | 0.23 | 0.05 | 0.37 | - | - | - | 63.18 | - | - | - |
| SDv1.5 [1] | 0.9B | - | - | - | 0.40 | 74.23 | 73.49 | 75.39 | 63.18 | 0.3730 | 0.3646 | 0.4219 |
| Lumina-Next [17] | 1.7B | 0.49 | 0.38 | 0.15 | 0.46 | 83.78 | 89.78 | 82.67 | 75.66 | 0.5088 | 0.3386 | 0.4239 |
| SDv2.1 [1] | 0.9B | 0.51 | 0.44 | 0.50 | 0.47 | - | - | - | 68.09 | 0.5694 | 0.4495 | 0.4982 |
| PixArt- [15] | 0.6B | 0.50 | 0.44 | 0.07 | 0.48 | 79.32 | 82.57 | 78.60 | 71.11 | 0.6886 | 0.5582 | 0.7044 |
| SDXL [33] | 2.6B | 0.74 | 0.39 | 0.23 | 0.55 | 82.43 | 86.76 | 80.91 | 74.65 | 0.6369 | 0.5408 | 0.5637 |
| SD3-medium [36] | 2B | 0.74 | 0.63 | 0.36 | 0.62 | 91.01 | 80.70 | 88.83 | 84.08 | - | - | - |
| JanusFlow [74] | 1.3B | 0.59 | 0.45 | 0.42 | 0.63 | 87.31 | 89.79 | 87.39 | 80.09 | - | - | - |
| Sana-0.6B [8] | 0.6B | 0.76 | 0.64 | 0.39 | 0.64 | 89.50 | 90.10 | 89.30 | 83.60 | - | - | - |
| Sana-1.6B [8] | 1.6B | 0.77 | 0.62 | 0.47 | 0.66 | 91.50 | 91.90 | 88.90 | 84.80 | - | - | - |
| DALL-E3 [2] | - | 0.87 | 0.47 | 0.45 | 0.67 | 89.61 | 90.58 | 88.39 | 83.50 | 0.8110 | 0.6750 | 0.8070 |
| OmniGen [37] | 3.8B | 0.86 | 0.64 | 0.55 | 0.70 | - | - | - | - | - | - | - |
| Sana-1.5 [67] | 4.8B | 0.85 | 0.77 | 0.54 | 0.72 | - | - | - | 85.00 | - | - | - |
| Lumina-Image 2.0 | 2.6B | 0.87 | 0.67 | 0.62 | 0.73 | 91.97 | 94.85 | 90.20 | 87.20 | 0.8211 | 0.6028 | 0.7417 |
🔼 This table presents a quantitative comparison of various text-to-image models across three benchmark datasets: GenEval, DPG, and T2I-CompBench. For each model, the table shows the number of parameters, and performance scores on several metrics for each benchmark. The metrics evaluate different aspects of image generation quality, such as object recognition accuracy, color and shape representation quality, and overall image quality. Higher scores generally indicate better performance, as specified by the up and down arrows in the header. The best performing model in each metric is shown in bold, while the second-best is underlined. This allows for a direct comparison of the capabilities of different models on various aspects of image generation.
read the caption
Table 4: Performance comparison across different models on GenEval [31], DPG [30], and T2I-CompBench [32] benchmarks. '↓↓\downarrow↓' or '↑↑\uparrow↑' indicate lower or higher values are better. Bold indicates the best performance, while underlining denotes the second-best performance.
| Methods | ||||
| Overall | Traditional Art | Fantasy & Mythical | Anime | |
| FLUX1.1 [pro] [9] | 1122 | 1075 | 1111 | 1127 |
| FLUX1 [pro] [9] | 1107 | 983 | 1081 | 1051 |
| Lumina-Image 2.0 | 982 | 1015 | 1051 | 1037 |
| DALLE 3 [2] | 970 | 1008 | 1026 | 977 |
| SD3 Medium [36] | 945 | 990 | 1026 | 929 |
| Janus Pro [10] | 748 | 828 | 784 | 766 |
🔼 This table presents a comparison of ELO scores obtained from the AGI-Eval 3 text-to-image arena as of February 23, 2025. ELO scores represent a ranking of models based on their performance in head-to-head comparisons against other models in the arena, determined by human judges. The table lists several models and their corresponding ELO scores, providing a relative measure of each model’s performance in generating images from textual descriptions.
read the caption
Table 7: Comparison of ELO scores evaluated in text-to-image arena from AGI-Eval 3 (as of February 23, 2025).
| Methods | |||
| Overall | Alignment | Coherence | |
| FLUX1.1 [pro] [9] | 1040 | 1036 | 1023 |
| Imagen 3 [75] | 1018 | 1003 | 1032 |
| Lumina-Image 2.0 | 969 | 1031 | 986 |
| DALLE 3 [2] | 952 | 1022 | 958 |
| SD3 Medium [36] | 952 | 1022 | 984 |
| Janus Pro [10] | 734 | 932 | 947 |
🔼 This table presents a performance comparison of the Lumina-Image 2.0 model across three training stages: low-resolution, high-resolution, and high-quality tuning. It shows the number of training steps, and the resulting scores on the DPG (Dense Prompt Generation) and GenEval benchmarks for each stage, illustrating the performance gains as the model progresses through the training stages. This demonstrates the effectiveness of the multi-stage progressive training strategy used in the model.
read the caption
Table 8: Performance Comparison Across Stages on DPG [30] and GenEval [31] Benchmarks.
Full paper#