↗ OpenReview ↗ NeurIPS Proc. ↗ Hugging Face ↗ Chat
TL;DR#
Current inverse molecular design struggles with incorporating multiple properties (e.g., synthetic accessibility, gas permeability) as conditions during molecule generation. Existing methods often convert these conditions into a single one, potentially losing crucial information on property relationships, or use extra predictor models which may not generalize well. This leads to inaccurate or incomplete generation results and prevents the design of molecules meeting various property requirements.
To address this, the researchers developed Graph DiT. This method employs a condition encoder to learn multi-property representations and a graph denoiser that uses a novel graph-dependent noise model for accurate noise estimation. Extensive experiments show that Graph DiT outperforms existing methods in multi-conditional polymer and small molecule generation tasks across various metrics, validating its superior accuracy and controllability in meeting multiple conditions simultaneously. The polymer inverse design case study with feedback from domain experts further strengthens its practicality.
Key Takeaways#
Why does it matter?#
This paper is important because it presents Graph DiT, a novel approach for multi-conditional molecular generation, outperforming existing methods. It addresses the challenge of integrating multiple, diverse properties into molecular design, opening new avenues for materials and drug discovery and showcasing the power of diffusion models in complex chemical tasks.
Visual Insights#

This figure compares the results of existing single-conditional graph generation methods with the proposed multi-conditional method. (a) shows the limitations of existing methods, where a median rank of 30 indicates that less than half of the test polymers met multiple property criteria simultaneously. The generated graphs from different single-condition sets rarely overlapped. (b) demonstrates the improved results of the proposed multi-conditional approach, achieving a much higher median rank (4, 9, and 11 for different properties), indicating successful generation of polymers satisfying multiple property constraints.

This table presents the results of generating 10,000 polymer molecules using different models, under multiple conditions (synthetic score and gas permeability for O2, N2, and CO2). It compares the performance of various models across nine metrics: Validity, Coverage, Diversity, Similarity, Distance (measuring how well the generated molecules match the reference set), MAE (Mean Absolute Error) for the synthetic score and the three gas permeabilities. The lowest MAE values indicate better control over the properties of the generated molecules. The best results for each metric are highlighted.
In-depth insights#
Multi-conditional Gen#
Multi-conditional generation in molecular design presents a significant challenge, aiming to create molecules satisfying multiple, potentially conflicting properties. Existing single-conditional approaches often fail to capture complex interdependencies between properties, leading to suboptimal results. The core of the challenge lies in effectively encoding and integrating diverse property types (numerical and categorical) into a model that can learn their relationships and balance them during generation. Successful multi-conditional generation requires advanced model architectures capable of handling these complexities and learning intricate patterns from data. Strategies for encoding and integrating diverse property types into a unified representation are crucial, as is developing effective model architectures (e.g., graph neural networks) to guide the generation process, which might use novel noise models for graphs to improve accuracy. Evaluation of multi-conditional generators necessitates comprehensive metrics that assess both the validity of the generated molecules and their adherence to the specified conditions. The ultimate goal is to move beyond simple satisfaction of individual properties to creating molecules with optimized combinations that offer enhanced functionality. The field is ripe for innovation in model architecture and training strategies.
Graph Diffusion Model#
Graph diffusion models offer a powerful framework for generative modeling on graph-structured data, such as molecules. They leverage the principles of diffusion processes, gradually adding noise to the data until it reaches a simple, easily-sampled distribution. The key idea is to learn a reverse diffusion process that can recover the original data from the noisy version. A crucial aspect is the design of the noise model, which should capture the structural properties and dependencies within the graph, ensuring accurate estimation of graph-related noise. This is particularly important for multi-conditional generation, where multiple properties need to be integrated as constraints. Efficient noise scheduling techniques are essential for faster training and better sampling performance. Recent advancements focus on integrating transformers for better handling of long-range dependencies in graph structures and incorporating sophisticated layer normalization strategies for improved conditioning. Graph-dependent noise models offer superior accuracy and better align with the inherent complexities of graph-structured data. Applications in molecular design benefit significantly from the ability to generate molecules with specific properties, guided by multiple conditional constraints.
Noise Model Novelty#
The novelty in the paper’s noise model lies in its graph-dependent nature, departing from previous methods that added noise independently to atoms and bonds. This approach acknowledges the intricate dependencies within molecular graphs, leading to a more accurate estimation of graph-related noise during the diffusion process. By considering the joint distribution of nodes and edges, the model captures the structural properties of molecules more effectively. This is crucial for precise generation, particularly in multi-conditional scenarios where accurate noise estimation is critical for balancing multiple property constraints. The unified representation of node and edge features via graph tokens further streamlines this process, enabling the model to efficiently learn the graph-dependent noise structure and subsequently, generate molecules that closely align with desired properties.
Ablation Study#
An ablation study systematically removes components of a machine learning model to assess their individual contributions. In the context of a molecular generation model, this might involve removing parts of the architecture (e.g., specific layers in a transformer network, the condition encoder, or the graph-dependent noise model), different property encoding techniques, or various components of the denoising process. By observing the performance changes (e.g., in terms of accuracy, diversity, and validity) after each ablation, researchers can determine which parts are crucial to the model’s success. This helps pinpoint the most effective aspects of the design and identify areas for potential improvement or simplification. The key insight from such studies is not just identifying the importance of certain components, but also gaining a better understanding of the underlying mechanisms. For example, an ablation study might reveal that the graph-dependent noise model is critical for capturing structural dependencies in molecules, or that a specific type of property encoding is more effective than others at integrating multiple conditions. Well-designed ablation studies are vital for establishing the robustness and interpretability of a model. They provide a controlled experimental method for probing the model’s behaviour and offer valuable insights for future model development and refinement.
Inverse Design#
Inverse design in the context of molecular generation represents a paradigm shift from traditional methods. Instead of synthesizing molecules and then evaluating their properties, inverse design starts with the desired properties and aims to computationally discover molecules possessing those characteristics. This approach is particularly powerful for materials and drug discovery, where optimizing multiple properties simultaneously is crucial. The challenges lie in translating complex property constraints into a format usable by machine learning models. The success of inverse design hinges on the capabilities of the generative model to explore the vast chemical space efficiently and accurately predict the properties of generated molecules. The accuracy and efficiency of these predictive models directly impact the success rate and practicality of the approach, making it a very active area of research. Furthermore, the incorporation of domain expertise or feedback loops can significantly enhance the efficiency and relevance of the generated molecules.
More visual insights#
More on figures

This figure illustrates the architecture of the Graph Diffusion Transformer (Graph DiT). Panel (a) shows the denoising process, illustrating how the model uses a condition encoder to learn representations of multiple properties. These representations are then integrated with the graph denoiser to guide the diffusion process. Panel (b) details the condition encoder, which uses clustering and one-hot encoding for numerical and categorical properties, respectively. These encodings are then used to generate the representations of conditions. Panel (c) shows the graph denoiser, which uses transformer layers and adaptive layer normalization (AdaLN) with condition statistics to denoise the graph tokens and ultimately generate the molecule.

This figure compares the performance of five different models (MARS, LSTM-HC, DiGress, MOOD, and the proposed Graph DiT) in generating polymers for O2/N2 gas separation. Four domain experts evaluated the generated polymers based on their usefulness (Utility Score) and agreement on the usefulness ranking (Agreement Score). The figure displays the top three polymers generated by each model, highlighting that Graph DiT generated the polymers deemed most useful by the experts.

The figure compares the relative performance of different model design choices in multi-conditional molecular generation. It shows the performance improvement of using clustering-based encoding for numerical conditions, AdaLN for layer normalization, and a graph-dependent noise model compared to alternative methods. Higher bars indicate better performance relative to a baseline.

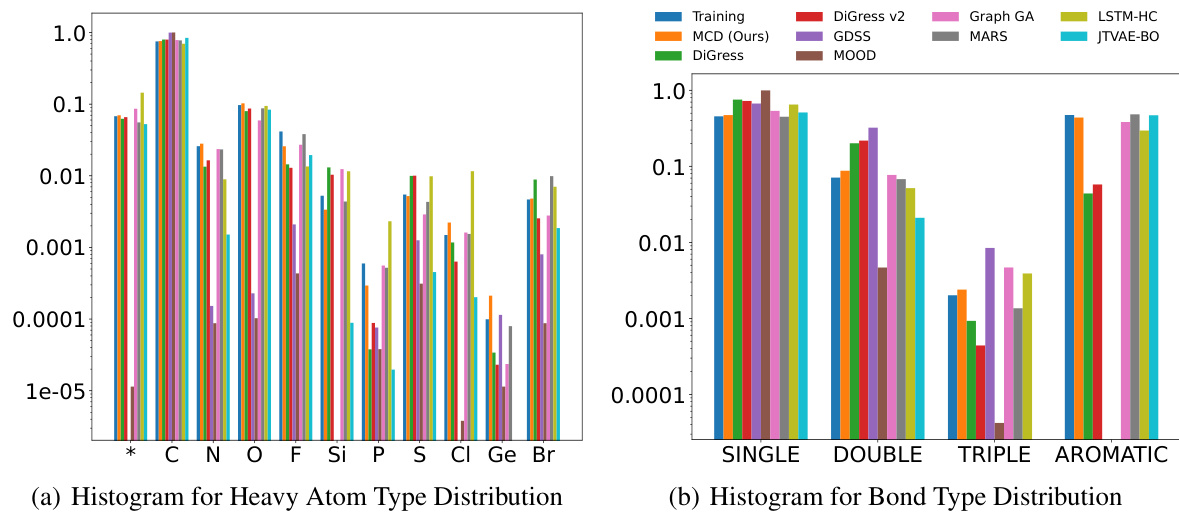
This figure compares the distribution of atom and bond types generated by Graph DiT and other models against the training data distribution for the polymer gas permeability tasks. The histograms show that Graph DiT’s generated molecules have atom and bond type distributions closer to the training data, indicating its superior ability to learn molecular distributions.

Figure 1 illustrates the challenges in multi-conditional molecular generation, comparing existing methods that treat multiple properties as a single condition with the proposed Graph DiT model. (a) shows the limitations of existing methods, highlighting the difficulty in finding polymers that satisfy multiple properties simultaneously. The median rank of 30 means that in more than half of the test cases, a desirable polymer was not found within the top 30 generated molecules for each individual property. (b) demonstrates the superior performance of Graph DiT, illustrating how it generates polymers that successfully satisfy multiple properties with significantly better ranking (median rank of 4).

This figure compares the distribution of generated molecules by different models with the training data distribution. It visualizes the data points in a two-dimensional space for each task (O2, N2, CO2 permeability and BBBP, BACE, HIV datasets). Graph DiT’s distribution closely aligns with the training data, demonstrating good interpolation and extrapolation capabilities.

This figure compares the distributions of training and generated molecules for various models across different datasets. The visualizations use t-SNE to reduce dimensionality and show the distribution in 2D space. Graph DiT’s generated molecules show a distribution that closely matches the training data, indicating good model performance in learning the underlying data distribution and extrapolating to unseen data points. Other models show varying degrees of fit to the training data, highlighting the superior performance of Graph DiT.

This figure displays the results of a polymer inverse design task for O2/N2 gas separation. Four domain experts evaluated polymers generated by five different methods (MARS, LSTM-HC, DiGress, MOOD, and Graph DiT), ranking them based on utility and agreement scores. The top three polymers, all generated by Graph DiT, are highlighted, indicating its superior performance in this specific task. The conditions used for generation were SAS=3.8, SCS=4.3, O2Perm=34.0, and N2Perm=5.2.

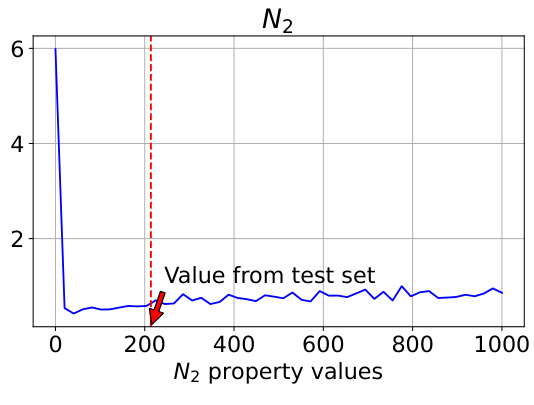
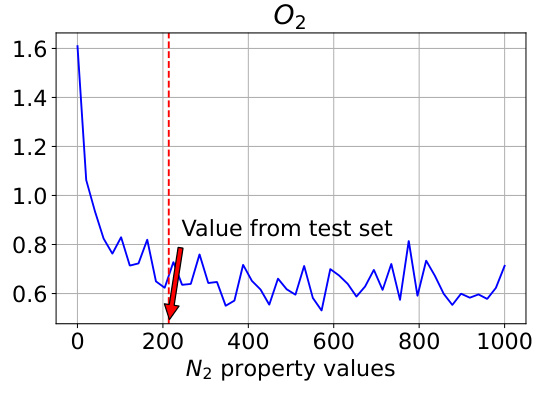
This figure analyzes the model’s controllability when varying the N2 property value. The true N2 value from the test set is 213.75. The plot shows changes in Validity and MAE (Mean Absolute Error) for the target synthesizability, N2, and O2 as the N2 property value varies from 0 to 1000. The MAE values for N2 and O2 are measured on a log scale. The figure demonstrates the model’s ability to control the generated properties and shows that performance is best when the input N2 value is close to the true value (213.75).

This figure analyzes how well the model controls the generation of polymers when a specific property (N2 permeability) is varied. The true N2 value from the test set is 213.75, and the model’s performance is evaluated across a range of N2 values (from 0 to 1000). The plot shows that the model’s controllability (measured as Mean Absolute Error or MAE) is best when the N2 value is close to 213.75. The MAE for both N2 and O2 is shown, indicating an interdependence between the properties. Notably, MAE values are on a logarithmic scale.

This figure analyzes the model’s controllability when varying N2 values in a polymer gas separation task. The true N2 value from the test set is 213.75. The plots show the changes in validity, MAE for synthesizability, MAE for N2, and MAE for O2 as N2 property values vary from 0 to 1000. The results indicate that controllability is best when the sampled N2 value is near the true value (213.75) and decreases as it approaches the extremes of the range.

This figure analyzes how well the model controls the generation of polymers when the N2 property value is varied, while other properties remain constant. The true N2 value from the test set is 213.75. The plots show that the model’s controllability (measured by Mean Absolute Error or MAE) of both N2 and O2 properties is best when the input N2 value is close to the true value of 213.75. As the N2 value deviates from 213.75, the controllability decreases, demonstrating an interdependency between the properties and showing the model’s ability to capture these relationships.

This figure presents the ablation study on the final MLP layer of GraphDiT model. It compares the performance of using a Multi-layer Perceptron (MLP) versus a linear layer for the final layer in terms of various metrics such as O2 permeability, N2 permeability, CO2 permeability, distance, similarity and diversity. The bar chart shows that MLP consistently outperforms the linear layer across all metrics.
More on tables

This table presents the results of multi-conditional generation of 10,000 small molecules across three datasets (BACE, BBBP, and HIV). Each dataset includes a numerical synthesizability score and a categorical task-specific property. The table evaluates model performance using several metrics, including validity, distribution learning measures (coverage, diversity, similarity, and distance), and condition control measures (MAE for synthesizability and accuracy for the task-specific property). The best-performing model for each metric is highlighted.

This table presents the results of generating 10,000 polymers using different models. The models were evaluated on their ability to generate polymers with specific properties (synthetic score, and gas permeability for O2, N2, and CO2). The Mean Absolute Error (MAE) between the desired properties and the generated polymers is reported for each model, along with metrics assessing the quality of the generated molecules. The best performing model for each metric is highlighted.

This table presents the results of generating 10,000 polymers using various models under multi-conditional settings. The models are evaluated based on nine metrics across three categories: Validity (measuring the correctness of the generated molecules), Distribution Learning (assessing how well the generated molecules match the distribution of molecules in the training data), and Condition Control (measuring the accuracy of the models in controlling the desired properties). The table highlights the best-performing models for each metric, allowing for easy comparison and analysis of the various approaches.

This table presents the results of generating 10,000 polymer molecules under multiple conditions using various models. The conditions include a synthetic score and three numerical properties (gas permeability for O2, N2, and CO2). The table compares the performance of different models across multiple metrics: validity, coverage, diversity, similarity, distance, and mean absolute error (MAE) for each property and overall. The MAE measures the difference between the input conditions and the generated properties. The best performance for each metric is highlighted.

This table presents the results of generating 10,000 polymers using different models under multi-conditional settings. The models are evaluated based on nine metrics: validity, coverage, diversity, similarity, distance, and mean absolute error (MAE) for synthetic score and three gas permeability properties (O2, N2, CO2). Lower MAE values indicate better performance. The best-performing model for each metric is highlighted.

This table compares the novelty and uniqueness scores across different conditions for various models, including Graph GA, MARS, LSTM-HC, JTVAE-BO, Digress, DiGress v2, GDSS, MOOD, and Graph DiT. Novelty measures the proportion of generated molecules that are unique to a specific condition set, while Uniqueness assesses the diversity of molecules generated across all conditions.

This table shows the performance of three different oracle methods (Random Forest, Gaussian Process, and Support Vector Machine) trained on various datasets (O2Perm, N2Perm, CO2Perm, BACE, BBBP, HIV) to predict molecular properties. The random forest model achieved the lowest Mean Absolute Error (MAE) and the highest Area Under the Curve (AUC) in training.
Full paper#


