↗ OpenReview ↗ NeurIPS Proc. ↗ Chat
TL;DR#
Traditional A* search algorithms can struggle in complex problems with less accurate heuristic functions. They often get trapped in local optima and fail to find the optimal solution efficiently. This paper addresses this limitation by incorporating exploration into the A* search via selective sampling, enhancing the algorithm’s ability to escape local optima and explore other promising branches.
The paper proposes SeeA*, an algorithm that uses selective sampling to create a dynamic subset of nodes awaiting expansion, enabling exploration beyond the node with the best heuristic value. Three different sampling strategies are presented, and a theoretical analysis proves SeeA*’s superior efficiency over A* when the heuristic is less accurate. Experiments on retrosynthetic planning, logic synthesis, and Sokoban demonstrate SeeA*’s efficiency improvements and superior performance compared to existing state-of-the-art algorithms.
Key Takeaways#
Why does it matter?#
This paper is important because it introduces SeeA, a novel algorithm that significantly improves the efficiency of heuristic search, particularly when the accuracy of the heuristic function is low.* This is a significant advancement in AI search algorithms and has broad implications across various fields. The theoretical analysis and empirical results demonstrate its effectiveness, opening avenues for future research in improving search strategies with deep learning and addressing the challenges of inaccurate heuristics. The code is publicly available, enabling researchers to readily build upon and extend this work.
Visual Insights#

This figure illustrates how SeeA* addresses the limitations of the A* search algorithm, particularly when dealing with inaccurate heuristic estimations. Subfigure (a) shows an optimal search path using the exact cost function f*(n). Subfigure (b) shows that A* search might get trapped in a suboptimal branch due to inaccurate cost estimations provided by f(n). Subfigures (c) and (d) demonstrates that SeeA* avoids this by selectively sampling nodes and expanding the node with the best heuristic value within this sample. SeeA* may choose a node different from the best node in the entire open set (O), which enables exploration of other promising branches.

This table presents a comparison of different algorithms for retrosynthetic planning on the USPTO benchmark dataset. The algorithms compared include Retro*, Retro*+, MCTS, A*, WA*, LevinTS, PHS, ε-Greedy, and the three variants of the SeeA* algorithm (Uniform, Cluster, UCT). For each algorithm, the table shows the success rate (percentage of molecules for which a solution was found), the average length of the solutions found, the average number of nodes expanded during the search, and the average computation time in seconds. The results demonstrate that the SeeA* algorithm, particularly the Cluster and UCT variants, outperforms the other algorithms in terms of success rate and solution length while maintaining a relatively low computation time.
In-depth insights#
SeeA*: Algorithm#
The proposed SeeA* algorithm enhances the A* search algorithm by incorporating a selective sampling process. Instead of expanding the node with the minimum f-value from the entire open set, SeeA* samples a subset of open nodes and expands the best node from this subset. This strategy allows SeeA* to explore more promising branches, particularly when the heuristic function is inaccurate, which is a common issue in many applications. Three sampling techniques (uniform, clustering, and UCT-like) are introduced to manage the trade-off between exploration and exploitation. The paper presents a theoretical analysis showing SeeA*’s superiority over A*, especially when heuristic accuracy is low, and experimental results on retrosynthetic planning, logic synthesis, and Sokoban demonstrate SeeA*’s efficiency and effectiveness compared to state-of-the-art algorithms. The core innovation lies in its ability to dynamically adapt the search, striking a balance between focused expansion (exploitation) and broader exploration of the search space, leading to better solution quality and efficiency.
Sampling Strategies#
The effectiveness of SeeA* hinges significantly on its sampling strategies, which determine the subset of open nodes considered for expansion. Three strategies are explored: uniform sampling, which offers unbiased selection but might overlook promising branches; clustering sampling, which aims to balance exploration and exploitation by sampling from diverse node clusters; and a UCT-like strategy, inspired by Monte Carlo Tree Search, which incorporates both exploitation (nodes with low estimated costs) and exploration (nodes at shallower depths). The theoretical analysis and experimental results strongly suggest that the choice of sampling strategy significantly impacts SeeA*’s performance, particularly when heuristic accuracy is limited. A key insight is that, while uniform sampling provides a simple baseline, the more sophisticated approaches (clustering and UCT-like) demonstrably enhance the search efficiency and solution quality in challenging real-world problems. This highlights the importance of tailoring sampling strategies to the problem domain and heuristic quality, making the choice of sampling strategy a crucial design parameter of SeeA*.
Theoretical Analysis#
A theoretical analysis section in a research paper would ideally delve into a rigorous mathematical framework to support the claims made. It would likely involve defining clear assumptions about the problem domain, such as the nature of the heuristic function’s error distribution. Formal proofs would then be presented to demonstrate the algorithm’s superiority, possibly by comparing its performance metrics (e.g., number of node expansions) to existing algorithms under specified conditions. For instance, it might prove that under certain assumptions about prediction errors, the proposed algorithm consistently outperforms traditional methods. Key theorems and corollaries should provide intermediate steps and support the main conclusions. The analysis should not only focus on efficiency but also consider other important factors, such as optimality guarantees and the trade-offs between exploration and exploitation. A comprehensive theoretical study would strengthen the paper’s contribution significantly by providing a solid mathematical foundation for the empirical findings. Limitations of the theoretical framework should also be clearly acknowledged, along with a discussion of their potential impact on the conclusions.
Experiment Results#
The “Experiment Results” section of a research paper is crucial for validating the claims and demonstrating the efficacy of the proposed approach. A strong results section should present findings clearly and concisely, ideally using visualizations like graphs and tables to aid understanding. Statistical significance should be rigorously addressed, clarifying whether observed improvements are meaningful or due to chance. Comparison with baselines or state-of-the-art methods is necessary to showcase the novelty and impact of the work. A thoughtful discussion interpreting the results, acknowledging limitations, and providing potential explanations for unexpected findings adds further weight. Reproducibility is paramount; sufficient details about the experimental setup, data, and methodology should be provided to allow others to replicate the experiments. A robust experimental design with adequate sample size and appropriate controls further strengthens the credibility of the results. Therefore, a well-structured and thorough “Experiment Results” section is critical for convincing readers of the paper’s contributions and impact.
Future Work#
Future research directions stemming from this work on SeeA* could explore more sophisticated sampling strategies to further enhance the balance between exploration and exploitation. Investigating adaptive sampling methods that dynamically adjust the sampling rate based on the characteristics of the search space would be valuable. Additionally, theoretical analysis could be extended to cover a broader range of heuristic function error distributions, moving beyond the uniform distribution used in this paper. Exploring the application of SeeA* to other challenging problem domains, such as large-scale planning and combinatorial optimization problems, would provide further validation of its effectiveness. Finally, a comprehensive empirical comparison with a wider array of state-of-the-art heuristic search algorithms across diverse datasets and problem instances would solidify SeeA*’s place and further reveal its advantages.
More visual insights#
More on figures

This figure compares two different sampling strategies used in the SeeA* algorithm: uniform sampling and clustering sampling. The uniform sampling strategy randomly selects candidate nodes from the open set, while the clustering sampling strategy first groups the open nodes into clusters and then samples nodes from each cluster. This is done to improve exploration by ensuring nodes from a wider range of potential solutions are selected for consideration in the next expansion step. The figure visually shows how the two strategies differ in selecting the next node for expansion, highlighting that the clustering method promotes more diverse exploration.

This figure illustrates the monotonicity of the probability P(f(n) ≤ f(n’)|f*(n’), σ) concerning the prediction error σ. The plot shows two curves representing the probability for different values of σ (1.0 and 3.0). The x-axis represents the true cost f*(n’), and the y-axis represents the probability P(f(n) ≤ f(n’)). The figure demonstrates how, for a given true cost f*(n’), the probability P(f(n) ≤ f(n’)) changes with the level of prediction error σ. The arrows highlight that the probability is not always monotonically decreasing with σ, but the overall trend supports the claim made in Corollary 4.2.

This figure illustrates how chemical retrosynthetic routes are transformed into a search tree representation used in the paper’s algorithm. Part (a) shows a real retrosynthetic route where a molecule is broken down into its constituent reactants through reverse reactions. Part (b) displays the equivalent search tree where each node encapsulates all molecules resulting from the decomposition of the target molecule along a specific reaction path. This transformation is crucial for applying the SeeA* search algorithm.

This figure illustrates the logic synthesis process. It starts with a hardware design represented as an And-Inverter Graph (AIG), which is then optimized through a series of transformations. The goal is to reduce the area-delay product (ADP) while maintaining the functionality. The figure shows the initial AIG, the sequence of transformations, the post-technology mapping stage using an ABC library, the final optimized AIG, and the evaluation process to determine the ADP reduction.

This figure shows the mean squared error (MSE) loss during the training of the value estimator used in the logic synthesis experiments. The x-axis represents the training update steps, and the y-axis represents the MSE loss. The plot shows a sharp decrease in MSE at the beginning of training, indicating the model is learning effectively. Then, the MSE loss fluctuates around a low value, suggesting that the model has converged to a good solution.

This figure shows the search tree generated by the A* algorithm when solving the logic synthesis problem for the alu4 circuit. The tree visually represents the nodes expanded during the search process, highlighting the path chosen by the A* algorithm. It demonstrates how the A* algorithm might get stuck in a suboptimal branch, lacking exploration capabilities, and focusing on nodes with seemingly minimal cost according to the heuristic function. The percentages at the bottom indicate the proportion of times each action was selected during the search.

This figure shows a comparison of the search tree generated by the SeeA* algorithm with different sampling strategies against other search algorithms like A* and MCTS for solving a logic synthesis problem. The figure highlights how SeeA* balances exploration and exploitation, expanding a moderate number of branches to avoid getting trapped in local optima like A*, but also avoiding excessive exploration across irrelevant branches like MCTS. The percentage values below each node represent the proportion of times that node was expanded during the search process.
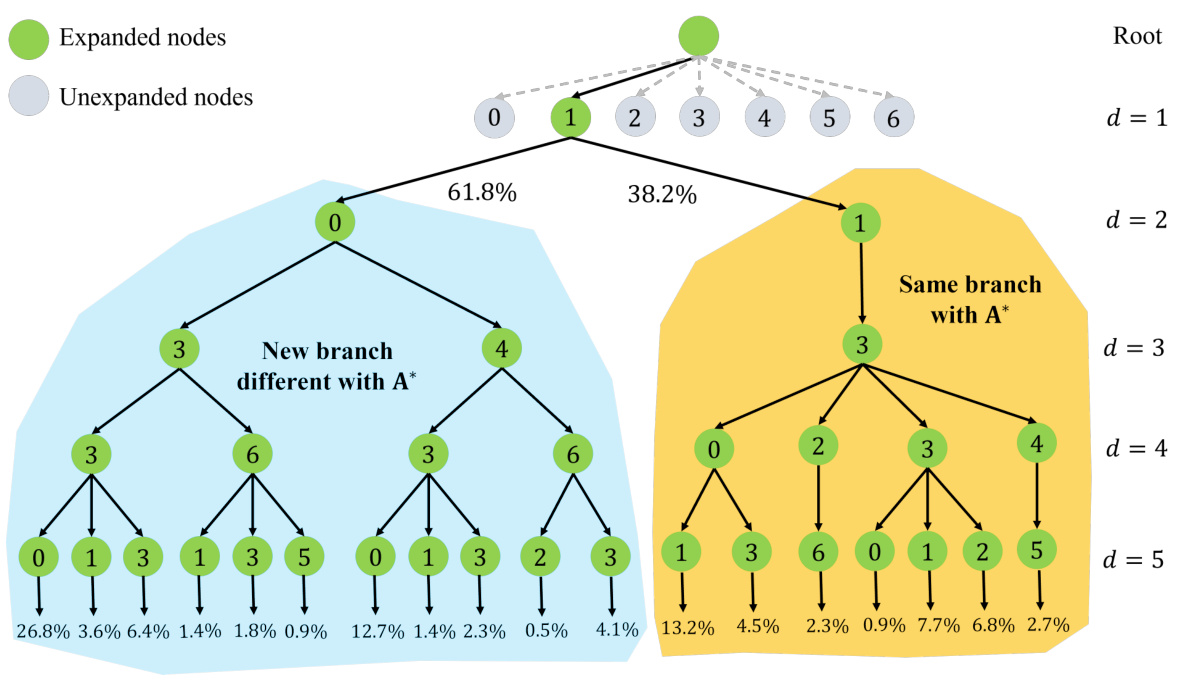
The figure shows the search tree generated by SeeA* when solving the logic synthesis problem for the alu4 circuit. SeeA* balances exploration and exploitation, avoiding getting stuck in a suboptimal branch like A*, but also avoiding excessive exploration like MCTS. The nodes are color-coded to indicate whether they were expanded or not, and percentages show the proportion of times each node was selected as the next node to expand. The tree demonstrates SeeA*’s capacity to explore alternative branches effectively, finding a better solution than A* and with fewer node expansions than MCTS.

This figure shows the training loss curve of the value estimator used in the logic synthesis task. The x-axis represents the number of updates during training, and the y-axis represents the mean squared error (MSE) loss. The curve starts at a high MSE and gradually decreases as the training progresses, indicating that the model is learning effectively to estimate the value of different actions in the logic synthesis process.

This figure shows the success rate and average solution length for retrosynthetic planning on the USPTO benchmark dataset using the SeeA* algorithm with a uniform sampling strategy. The x-axis represents the candidate set size (K), which is a hyperparameter controlling the exploration-exploitation balance. The green line shows the success rate, indicating that the algorithm performs better with moderate K values, not too small and not too large. The orange line shows the average solution length, which also shows a trend of shorter lengths in the same moderate range of K values, suggesting that an appropriate balance between exploration and exploitation is crucial for efficiency.
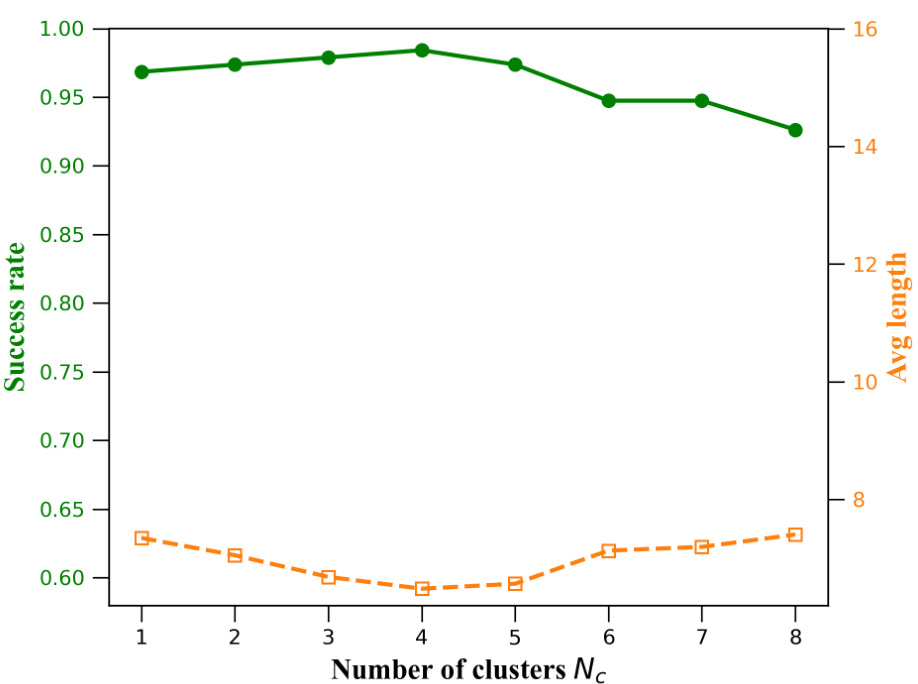
This figure shows the impact of the number of clusters (Nc) on the performance of the SeeA* algorithm with the clustering sampling strategy. The x-axis represents the number of clusters used in the sampling process. The y-axis shows two metrics: success rate (green line) and average solution length (orange dashed line). The results suggest that a moderate number of clusters leads to the best performance, with both high success rate and short solution lengths. Too few clusters may not provide sufficient exploration, while too many clusters might introduce excessive noise, reducing performance.

This figure shows the success rate and average solution length on the USPTO benchmark using the UCT-like sampling strategy in SeeA*. The x-axis represents the hyperparameter cb which controls the balance between exploration and exploitation. The y-axis on the left shows the success rate, while the y-axis on the right shows the average solution length. The results indicate an optimal range for cb, where increasing or decreasing it beyond this range negatively impacts performance.
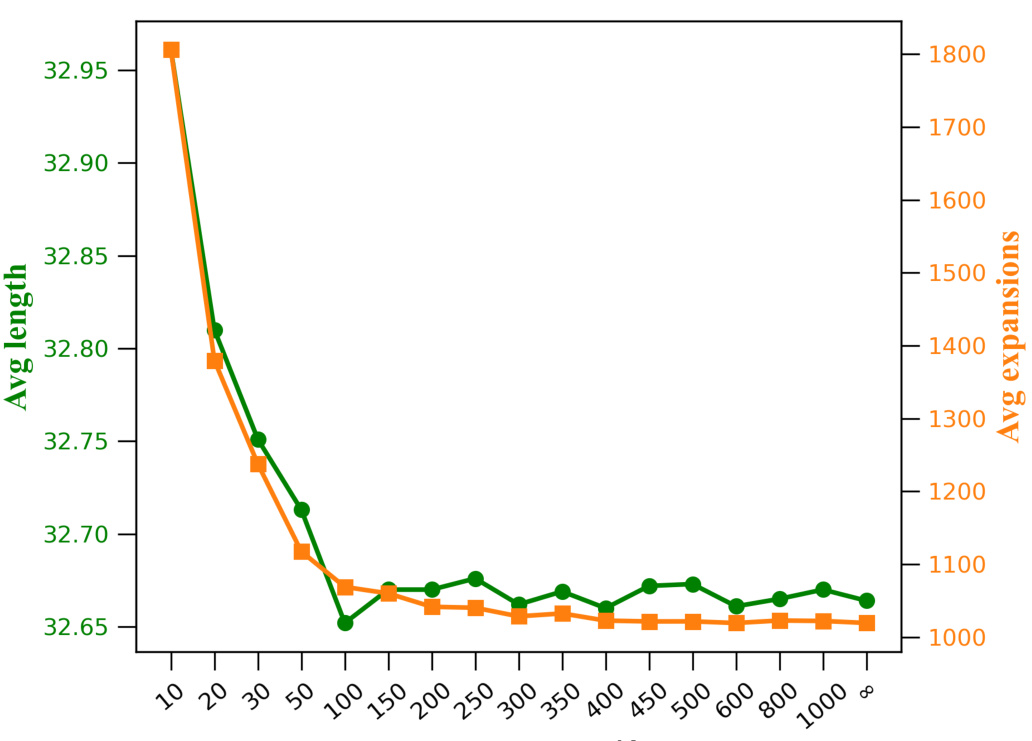
This figure shows the results of an experiment comparing the average solution length and the number of node expansions required by SeeA* in solving the Sokoban game. The experiment used uniform sampling to select candidate nodes, varying the size (K) of the candidate set. As the size of the candidate set increases, the average solution length decreases and the average number of node expansions increases. The figure demonstrates the trade-off between exploration (larger K) and exploitation (smaller K) in the SeeA* algorithm.
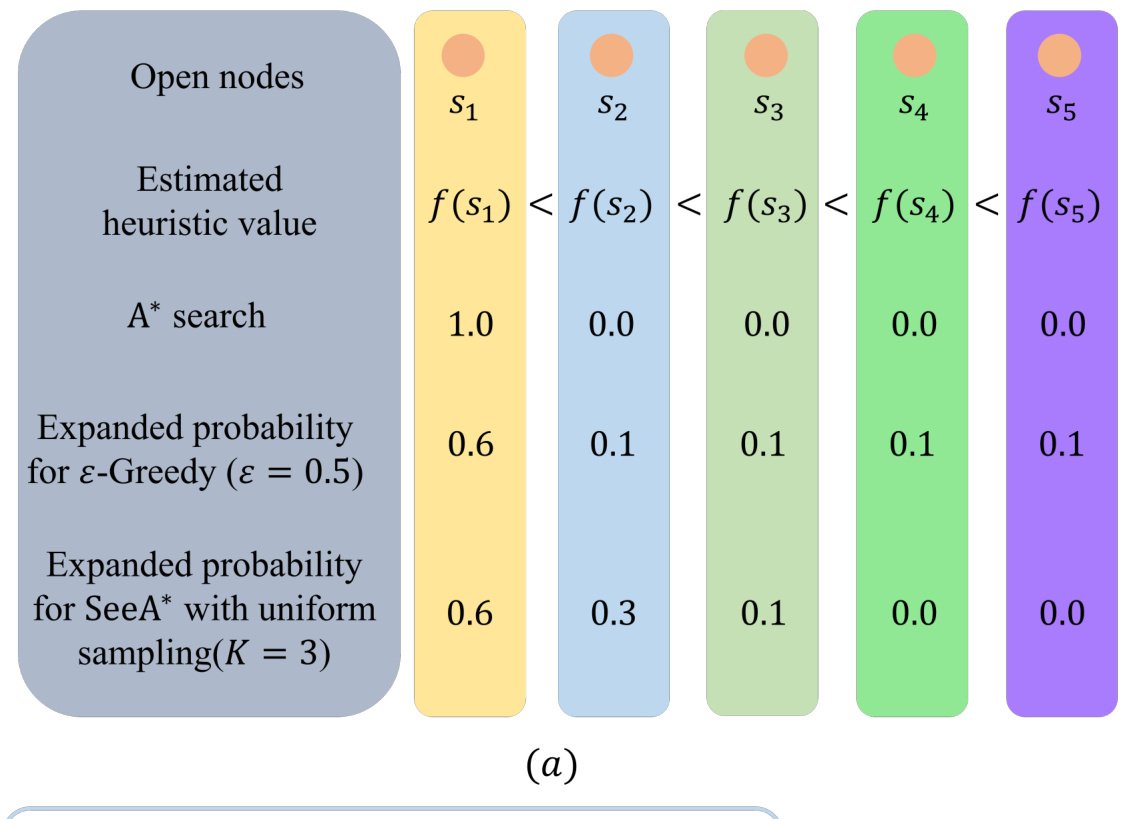
This figure compares the node expansion probabilities of three search algorithms: A*, ε-Greedy, and SeeA*. It shows how the probability of expanding a node changes based on its heuristic value and the algorithm used. A* deterministically expands the node with the lowest heuristic value. ε-Greedy randomly explores other nodes with a small probability. SeeA*, using a uniform sampling strategy, creates a subset of nodes and expands the one with the lowest heuristic value in the subset. The figure illustrates how SeeA* balances exploitation (favoring the best node) and exploration (considering other nodes).

This figure illustrates two different sampling strategies used in the SeeA* algorithm to select candidate nodes for expansion. (a) shows the uniform sampling, where nodes are randomly selected from the open set. This results in a relatively even distribution of selected nodes across the search space but may miss promising areas. (b) shows the clustering sampling strategy, where the open nodes are first grouped into clusters, and then nodes are sampled from each cluster. This strategy ensures that all clusters are represented in the candidate set, improving the chance of selecting promising nodes, even if they are not the top candidates in the open set overall. The clustering strategy helps to balance exploration (exploring different areas of the search space) and exploitation (focusing on nodes with the best heuristic values).
More on tables

This table presents the Area-Delay Product (ADP) reduction rates achieved by different algorithms on the MCNC benchmark dataset for logic synthesis. The ADP reduction is calculated relative to a baseline algorithm called
resyn2. Each column represents a different circuit from the MCNC benchmark, and the final column shows the average ADP reduction across all circuits. The table allows for a comparison of the performance of various algorithms, including SeeA* and several state-of-the-art techniques, highlighting the effectiveness of the proposed SeeA* algorithm in terms of ADP reduction.

This table presents the results of retrosynthetic planning experiments conducted on the USPTO benchmark dataset. Multiple algorithms, including Retro*, Retro*+, MCTS, A*, WA*, LevinTS, PHS, ε-Greedy, and the three variants of SeeA*, were compared based on four metrics: the percentage of solved molecules (Solved (%)), the average length of solutions (Length), the average number of node expansions (Expansions), and the average runtime (Avg time). The results demonstrate the superior performance of SeeA* in terms of solution quality, speed, and success rate, particularly when compared to traditional algorithms like A* search.

This table presents the results of different algorithms on the USPTO benchmark dataset for retrosynthetic planning. It compares the success rate (percentage of molecules for which a solution was found), average solution length (number of steps in the synthesis pathway), average number of node expansions (a measure of computational cost), and average runtime for various algorithms, including Retro*, Retro*+, MCTS, A*, WA*, LevinTS, PHS, and three variants of the SeeA* algorithm using different sampling strategies: uniform, clustering, and UCT-like. SeeA* consistently outperforms other algorithms across all metrics, indicating superior efficiency in solving retrosynthetic planning problems.

This table presents the performance comparison of various algorithms on the USPTO benchmark dataset for retrosynthetic planning. The algorithms include Retro*, Retro*+, A*, WA*, MCTS, LevinTS, PHS, ε-Greedy, and three variants of the proposed SeeA* algorithm (using uniform, clustering, and UCT-like sampling strategies). Metrics reported include the percentage of solved molecules, the average solution length, the average number of expansions performed by each algorithm, and the average runtime in seconds. The results demonstrate the superior performance of SeeA*, especially in terms of success rate and solution length, when compared to state-of-the-art algorithms.
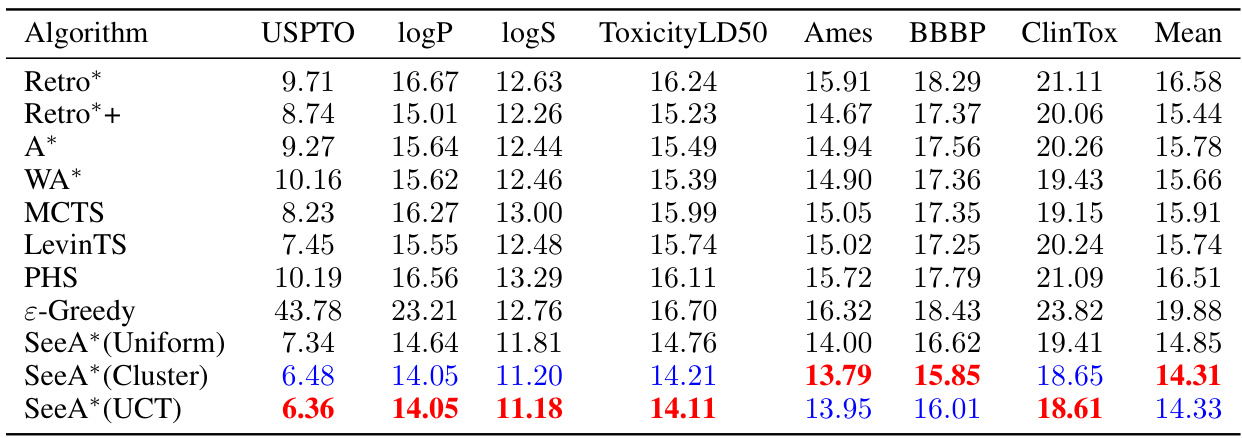
This table presents a comparison of different retrosynthetic planning algorithms on the USPTO benchmark dataset. The metrics used are the percentage of solved molecules, the average length of the solutions found, the average number of expansions performed, and the average runtime. The algorithms compared include Retro*, Retro*+, A*, WA*, MCTS, LevinTS, PHS, ε-Greedy, and three variations of the proposed SeeA* algorithm using different sampling strategies (Uniform, Cluster, UCT). The table shows that the proposed SeeA* algorithm generally outperforms other methods in terms of success rate and solution length, while maintaining reasonable computational efficiency.

This table presents the characteristics of the training circuits used in the logic synthesis experiments. For each circuit, it lists the number of inputs, outputs, total number of nodes, and the level of the circuit. The MCNC dataset is a benchmark suite commonly used in logic synthesis research to evaluate different optimization techniques. The number of nodes and levels are important metrics to understand circuit complexity, while the number of inputs and outputs determines the size of the input and output signals.

This table presents the characteristics of twelve MCNC benchmark circuits used for testing in the logic synthesis experiments. For each circuit, it provides the number of inputs, outputs, nodes (in the initial And-Inverter Graph representation), and the level (depth) of the circuit. This data is crucial for understanding the complexity and scale of the problems solved using the proposed SeeA* algorithm.

This table presents the results of several search algorithms on 1000 Sokoban test cases. The algorithms compared include A*, WA*, LevinTS, PHS, DeepCubeA, and three variants of the proposed SeeA* algorithm (SeeA* Uniform, SeeA* Cluster, SeeA* UCT). The table shows the percentage of problems solved, the average solution length (number of steps), and the average number of nodes expanded for each algorithm. The results demonstrate the comparative performance of SeeA* against state-of-the-art heuristic search algorithms on this challenging puzzle-solving problem.

This table shows the results of ablation studies on logic synthesis using SeeA* with uniform sampling. It demonstrates the robustness of the algorithm’s performance across various sizes of the candidate set (K), consistently outperforming the standard A* search (K = ∞). The ADP reduction rate, a measure of improvement in Area-Delay Product, is reported for each K value.

This table shows the results of logic synthesis experiments using the UCT-like sampling strategy in SeeA*. The ADP (Area-Delay Product) reduction rate is reported for different values of the hyperparameter cb, which controls the balance between exploration and exploitation. Higher values of cb generally lead to more exploration.
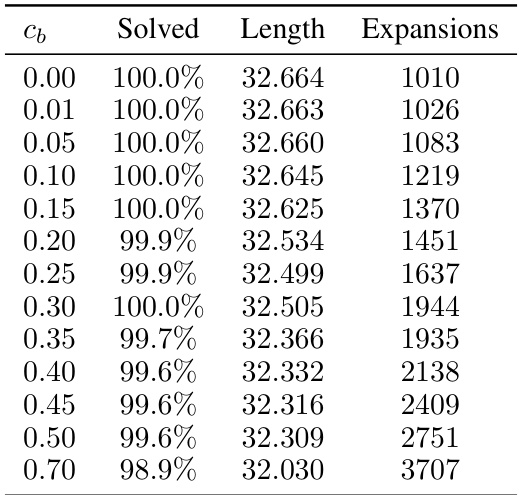
This table presents the results of the Sokoban experiments using the UCT-like sampling strategy with varying hyperparameter cb and a fixed candidate set size K of 100. It shows the success rate (percentage of solved puzzles), average solution length (number of steps), and average number of node expansions for each value of cb. The results demonstrate the impact of the exploration-exploitation trade-off controlled by cb on the algorithm’s performance.
Full paper#


