↗ OpenReview ↗ NeurIPS Proc. ↗ Hugging Face ↗ Chat
TL;DR#
Current multimodal LLMs (MLLMs) often underutilize the potential of vision components, hindering accurate sensory grounding. Existing MLLM benchmarks also struggle to comprehensively evaluate visual representation methods, primarily relying on language-heavy evaluations. This research reveals a need for a more vision-centric approach in MLLM development and evaluation.
The paper introduces Cambrian-1, a family of open-source, vision-centric MLLMs that achieve state-of-the-art performance. Key components include a novel Spatial Vision Aggregator (SVA) for efficient integration of visual features, a curated high-quality dataset of visual instructions, and a new vision-centric benchmark, CV-Bench, designed to address existing evaluation limitations. The open-source nature of Cambrian-1 promotes community engagement and facilitates progress in multimodal learning.
Key Takeaways#
Why does it matter?#
This paper is crucial for researchers in multimodal large language models (MLLMs) and visual representation learning. It introduces Cambrian-1, a fully open and comprehensive resource, advancing the state-of-the-art while offering valuable insights into vision-centric design choices. This opens new avenues for research in various areas of MLLMs, including data collection, model architectures, and evaluation protocols. Its open-source nature fosters community engagement and accelerates innovation in the field.
Visual Insights#

This figure illustrates the Cambrian-1 framework for evaluating visual representations using multimodal large language models (MLLMs). It draws a parallel between traditional evaluation protocols (linear probing or end-to-end tuning on datasets like ImageNet-1k, COCO, and ADE20k) and the use of MLLMs for visual question answering (VQA). The bottom part of the figure highlights the five key components of the Cambrian-1 framework: visual representations, connector design, instruction tuning data, instruction tuning recipes, and evaluation protocol. The figure shows how different vision models (e.g., CLIP, DINO) can be incorporated into the MLLM pipeline and how the visual information is integrated with the LLM to answer questions.

This table compares the performance of the proposed Spatial Vision Aggregator (SVA) against other methods for aggregating features from multiple vision encoders. The SVA module significantly improves performance across all benchmark categories, especially excelling at aggregating high-resolution vision data. The table highlights that the SVA’s dynamic and spatially-aware approach effectively integrates vision features with LLMs while mitigating information loss, a key challenge in handling high-resolution visual data.
In-depth insights#
Vision-Centric MLLMs#
Vision-centric Multimodal Large Language Models (MLLMs) represent a significant shift in multimodal AI. Instead of prioritizing language models and treating vision as an add-on, this approach places visual understanding at the core. This necessitates a thorough investigation of various visual representations, moving beyond the common reliance on CLIP-like models. Self-supervised methods, such as DINO, become crucial as they offer richer visual understanding without the linguistic bias inherent in language-supervised training. A key challenge is creating effective connectors between vision and language models, requiring novel designs like the Spatial Vision Aggregator (SVA) which efficiently integrates high-resolution visual features while reducing computational cost. Furthermore, curating high-quality visual instruction-tuning data is essential, highlighting the need for balanced datasets and careful consideration of data source distribution to avoid bias. Ultimately, vision-centric MLLMs promise more robust and accurate sensory grounding, leading to more reliable and versatile multimodal AI systems.
Instruction Tuning#
Instruction tuning, a crucial technique in multimodal large language models (MLLMs), involves fine-tuning pre-trained models on a dataset of visual instructions. This process bridges the gap between visual input and language understanding, enabling the model to generate accurate and relevant textual descriptions, answers, or other outputs in response to images. The effectiveness of instruction tuning heavily depends on data quality and quantity. High-quality datasets are paramount as they must be diverse and well-balanced to mitigate potential biases, such as over-representation of certain image categories or styles. The authors highlight the importance of data curation, emphasizing the need for balanced data sources and distribution for optimal model performance. Furthermore, the choice of instruction tuning methodology significantly impacts the final model’s capabilities. The authors evaluate various approaches, comparing the performance of different strategies with respect to the impact on model performance. Key to success is also the design of the connector that integrates the visual and language models. A well-designed connector ensures efficient information exchange between these components and facilitates the seamless integration of visual information into the LLM’s reasoning process. The exploration of different architectural choices for the connector, as well as the effect of freezing or unfreezing the vision encoder during tuning, directly affects the accuracy and overall effectiveness of the instruction tuning process.
SVA Connector#
The Spatial Vision Aggregator (SVA) connector presents a novel approach to integrating multimodal data, particularly focusing on visual information. Its core innovation lies in its spatially-aware design, which directly addresses the limitations of previous methods that suffer from information loss due to interpolation or inefficient token usage. By employing learnable latent queries and cross-attention mechanisms, the SVA dynamically aggregates features from multiple vision encoders while significantly reducing the number of tokens needed. This spatial inductive bias is crucial for preserving the spatial context of high-resolution visual features, preventing loss of information, especially when dealing with various image resolutions and multiple modalities. Multi-layer aggregation, a key feature, further enhances the model’s ability to integrate visual information at different LLM layers, allowing for repeated access and flexible integration throughout the model’s processing stages. This architecture enhances efficiency and efficacy, making it superior to simpler concatenation or resampling methods which are less computationally efficient, and result in more substantial information loss. The SVA’s dynamic and multi-modal approach is demonstrably more effective, particularly in tasks demanding high-resolution visual understanding and detailed spatial awareness.
Benchmark Analysis#
A thorough benchmark analysis is crucial for evaluating the effectiveness of any machine learning model, especially in the rapidly evolving field of multimodal large language models (MLLMs). It involves a critical examination of existing benchmarks, identifying their strengths and weaknesses, and potentially developing new benchmarks that better reflect the complexities of real-world scenarios. A key aspect is understanding the limitations of existing benchmarks, such as a potential language bias in some datasets, which may overestimate model capabilities. Therefore, a detailed evaluation of the benchmark datasets should be presented, including their composition, size, and characteristics, to help determine whether they are fit for the proposed model evaluation. The analysis should focus on tasks that accurately measure the core capabilities of the model. Moreover, considering various evaluation metrics and comprehensively comparing the results across multiple models and benchmarks allows for a more robust and reliable assessment of the MLLM’s overall performance and specific areas that need improvement. Ultimately, a well-conducted benchmark analysis provides valuable insights into the model’s strengths, limitations, and areas requiring further development.
Future Directions#
Future research should explore several key areas to advance the field of multimodal LLMs. Improving visual representation learning is crucial, moving beyond current limitations of language-heavy models like CLIP to embrace self-supervised and other vision-centric approaches. This includes investigating high-resolution image processing techniques and addressing the inherent challenges in consolidating and interpreting results from various visual tasks. Developing more robust and comprehensive benchmarks is also essential to accurately assess visual grounding capabilities, moving beyond existing benchmarks’ limitations by incorporating more diverse and challenging real-world scenarios. Finally, research should focus on improving the efficiency and scalability of training multimodal LLMs, addressing computational bottlenecks and optimizing training strategies for high-resolution visual data, while simultaneously focusing on ethical implications such as mitigating bias and promoting responsible use to counter the risks of misinformation and hallucination.
More visual insights#
More on figures

This figure shows examples of different vision models used in the paper, categorized by their training method and architecture. It visually represents the variety of visual encoders investigated in the Cambrian-1 project. The models include both class label supervised models (ImageNet-1k), language supervised models (CLIP), self-supervised models using contrastive (DINOv2) and masking (MAE) approaches, diffusion models (Stable Diffusion), depth-supervised models (MiDaS), and segmentation-supervised models (SAM). Each category is represented by an example image illustrating the model’s output or training process. This illustrates the breadth of vision encoders used to explore and evaluate visual representations for multimodal large language models (MLLMs).

This figure presents a comparative analysis of Multimodal Large Language Models (MLLMs) performance with and without visual input across various benchmarks. The left panel shows a bar chart illustrating the performance difference between vision-enabled and vision-disabled MLLMs for each benchmark, sorted by the magnitude of this difference. The right panel displays a principal component analysis (PCA) plot, visualizing the clustering of benchmarks based on their performance similarity. The clusters are labelled and color-coded, categorizing them into General, Knowledge, Chart & OCR, and Vision-Centric.

This figure shows the effect of different training recipes on the performance of multimodal large language models (MLLMs). Four training recipes are compared: (1) freezing the visual encoder with no adapter data (OM), (2) freezing with 0.5M adapter data, (3) freezing with 1.2M adapter data, and (4) unfreezing the visual encoder with 1.2M adapter data. The boxplots show the distribution of benchmark scores across four categories of benchmarks: General, Knowledge, OCR & Chart, and Vision-Centric. The results indicate that increasing the amount of adapter data generally improves performance, especially for general and vision-centric benchmarks. Unfreezing the visual encoder also tends to improve performance across all benchmark categories.

This figure shows the average performance of different vision models across four benchmark categories (General, Knowledge, OCR & Chart, Vision-Centric). Language-supervised models (like CLIP) generally perform best, particularly in the OCR & Chart and Knowledge categories. However, a well-trained self-supervised model like DINOv2 shows competitive performance in the Vision-Centric category, suggesting potential for improving self-supervised visual representations.

This figure compares the performance of models using CLIP and DINOv2 vision encoders with varying amounts of instruction tuning data (0.7M and 5M). It shows that DINOv2, initially lagging behind CLIP, significantly improves its performance with more data and when the vision encoder is unfrozen during training. The performance gap between DINOv2 and CLIP narrows considerably at the 5M data point, particularly in knowledge and vision-centric tasks, demonstrating the potential of self-supervised methods with sufficient training data.

This figure illustrates the architecture of the Spatial Vision Aggregator (SVA), a novel connector designed to efficiently integrate visual features from multiple vision encoders into an LLM. The SVA uses learnable latent queries to perform cross-attention with the visual features, resulting in a dynamic and spatially-aware integration that reduces the number of tokens required. The figure shows the SVA being incorporated multiple times within the LLM’s transformer blocks to repeatedly access and integrate visual information.

This figure illustrates the composition of the Cambrian-7M dataset, a curated version of the larger Cambrian-10M dataset. The left panel shows a donut chart visualizing the distribution of data across different categories in Cambrian-10M. The right panel provides a detailed breakdown of all data sources used in the Cambrian dataset. The outer ring highlights the curated subset (Cambrian-7M) and shows how data from different sources were filtered or included during the curation process to achieve a more balanced and high-quality dataset for training multimodal LLMs.

This figure presents a comparative analysis of multimodal large language models (MLLMs) performance with and without visual input across various benchmarks. The left panel displays a bar chart illustrating the difference in performance with and without visual input for each benchmark, revealing the benchmarks’ reliance on visual information. Benchmarks are sorted by the magnitude of this performance difference. The right panel showcases a principal component analysis (PCA) of the benchmark scores, visually clustering the benchmarks into four categories based on their performance characteristics: General, Knowledge, Chart & OCR, and Vision-Centric. The size of each point in the PCA plot represents the size of the benchmark dataset.

This figure presents a comparative analysis of multimodal large language models (MLLMs) with and without visual input across various benchmarks. The left panel shows a bar chart illustrating the performance difference between vision-enabled and vision-disabled MLLMs for each benchmark, highlighting the benchmarks’ reliance on visual input. The right panel displays a principal component analysis (PCA) plot that clusters the benchmarks into four groups based on performance similarities: General, Knowledge, Chart & OCR, and Vision-Centric. These clusters represent different aspects of MLLM capabilities and their reliance on visual information. The size of each bubble in the PCA plot corresponds to the size of the benchmark dataset.

This figure shows four example images from the Cambrian Vision-Centric Benchmark (CV-Bench). CV-Bench repurposes existing vision benchmarks (ADE20K, COCO, Omni3D) to assess various aspects of multimodal large language models (MLLMs) by evaluating their ability to answer questions about images. The four examples represent four different tasks: Spatial Relationship (2D), Object Count (2D), Depth Order (3D), and Relative Distance (3D). Each image has a question posed to illustrate how the benchmark tests the model’s understanding of spatial relationships, object counting, depth perception, and relative object distances.

This figure shows the workflow of the data curation process for the Cambrian Vision-Centric Benchmark (CV-Bench). It starts with three existing vision datasets: ADE20k, COCO, and Omni3D. These datasets are used to generate question-answer pairs for four different visual tasks: spatial relationship (2D), object count (2D), depth order (3D), and relative distance (3D). A manual filtering step is then applied to remove inaccurate or ambiguous examples. The resulting dataset is a curated set of question-answer pairs suitable for evaluating the visual understanding capabilities of multimodal large language models.

This figure shows two graphs. The left graph displays the performance difference between MLLMs with and without visual input across various benchmarks. The benchmarks are ordered by the difference in performance, highlighting which tasks heavily rely on visual information versus language understanding. The right graph shows the result of a principal component analysis performed on the benchmark scores. This analysis reveals clusters of benchmarks based on their similarity in performance across different MLLMs, and these clusters are labeled as ‘General’, ‘Knowledge’, ‘Chart & OCR’, and ‘Vision-Centric’. This helps to categorize the benchmarks based on what aspects of MLLM capabilities they primarily assess.

This figure illustrates the Cambrian-1 framework for evaluating visual representations using Multimodal Large Language Models (MLLMs). It highlights the key components involved in the process, including pretrained vision models, visual instruction tuning with LLMs, connector design, instruction tuning data, and evaluation protocols. The framework draws parallels between traditional methods of evaluating visual representations and the novel use of MLLMs, particularly focusing on visual question answering to tackle real-world perception challenges. The five pillars of the Cambrian-1 study are also highlighted: visual representations, connector design, instruction tuning data, instruction tuning recipes, and evaluation protocols.

This figure illustrates the Cambrian-1 methodology for evaluating visual representations using Multimodal Large Language Models (MLLMs). It highlights the parallels between traditional evaluation protocols (like linear probing and end-to-end tuning) and the use of MLLMs for assessing various visual encoders. The MLLM framework leverages visual question answering (VQA) to address real-world perception challenges. The figure’s lower section emphasizes the five key pillars of Cambrian-1: Visual Representations, Connector Design, Instruction Tuning Data, Instruction Tuning Recipes, and Evaluation Protocol.

This figure shows the process of filtering the data used for the Cambrian Vision-Centric Benchmark (CV-Bench). The process starts with classic 2D (ADE20K, COCO) and 3D (Omni3D) computer vision benchmarks and reformulates them into visual question answering (VQA) tasks. The initial data generated through this process is then manually filtered to remove inaccurate or ambiguous questions. The filtering criteria are described for the counting, relative distance and depth order tasks and the final dataset is used for evaluation.

The figure shows the cumulative sum of counts for entries sorted by counts from tail to head for different data balancing methods. Data Mix 1 is unfiltered, while Data Mixes 2-5 apply different thresholds (t) to filter data from various sources. The plot demonstrates that applying a threshold between 150k and 350k is effective in preventing an explosive heavy tail, leading to a more balanced dataset. This helps to mitigate the issue of noisy and unbalanced data that often leads to suboptimal performance in multimodal large language models (MLLMs).

This figure compares the average performance of Cambrian-1 and other leading MLLMs across different benchmark categories (General, Knowledge, OCR & Chart, and Vision-Centric). Cambrian-1 demonstrates superior performance across all categories, particularly in the OCR & Chart and Vision-Centric tasks, which emphasizes its vision-centric design.
The left panel of the figure shows the performance difference between MLLMs with and without visual input enabled across different benchmarks. The benchmarks are sorted by the difference. Benchmarks with a small difference indicate a lesser dependence on visual input. The right panel shows a principal component analysis clustering benchmarks into four groups based on their performance metrics: General, Knowledge, Chart & OCR, and Vision-Centric.
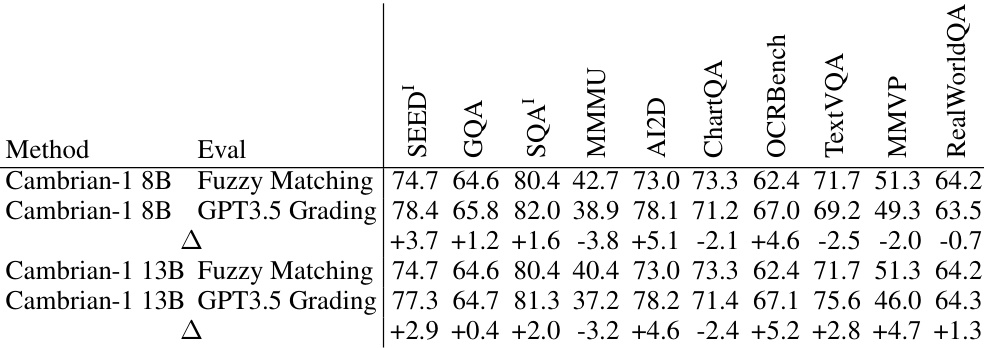
The figure presents two plots analyzing the performance of Multimodal Large Language Models (MLLMs). The left plot compares MLLM performance with and without visual input across several benchmarks. Benchmarks are ranked by the difference in MLLM scores with and without vision. The right plot shows a principal component analysis (PCA) clustering benchmarks into four groups (general, knowledge, chart & OCR, and vision-centric) based on their performance metrics.

This figure compares the average performance of Cambrian-1, Mini-Gemini-HD, and LLaVA-NeXT across four benchmark categories (General, Knowledge, OCR & Chart, and Vision-Centric) for three different model sizes (8B, 13B, and 34B parameters). It shows that Cambrian-1 consistently outperforms the other two open-source models, especially in the OCR & Chart and Vision-Centric categories, demonstrating the effectiveness of its vision-centric design.
This figure illustrates the Cambrian-1 framework, which uses multimodal large language models (MLLMs) to evaluate visual representations. It highlights the relationship between traditional evaluation protocols (linear probing, end-to-end fine-tuning) and the use of MLLMs for evaluating a wider range of real-world visual perception tasks. The figure also emphasizes the five key research pillars of Cambrian-1: visual representations, connector design, instruction tuning data, instruction tuning recipes, and evaluation protocol.
More on tables

This table compares the performance of Cambrian-1, a new family of multimodal LLMs (MLLMs), to other leading MLLMs across various benchmark categories. It highlights Cambrian-1’s superior performance compared to other open-source models and its competitiveness with proprietary models, particularly given its use of significantly fewer visual tokens (576) than some of the others (2880). The results showcase its strength in OCR & Chart and Vision-Centric tasks.

This table details the breakdown of tasks in the Cambrian Vision-Centric Benchmark (CV-Bench). It categorizes tasks into 2D and 3D types. Each task type then lists the specific tasks, their descriptions, the source datasets used to generate them, and the number of samples available for each task. This benchmark is specifically designed for vision-centric multimodal LLMs, and these tasks aim to assess various aspects of 2D and 3D understanding of an MLLM.

This table lists the vision backbones used in the experiments. It details their architecture (e.g., ViT-L, ConvNeXt-L), patch size, resolution, number of tokens, and hidden size. The table is categorized by supervision type (language-supervised, self-supervised, etc.) and method. The † symbol indicates that the number of tokens for some models was adjusted via interpolation to match the specified number.
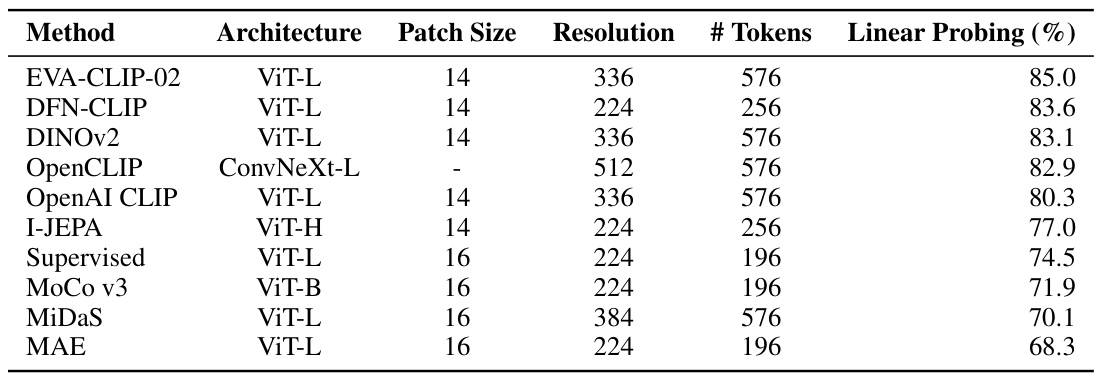
This table shows the linear probing results for different vision backbones. Linear probing is a technique used to evaluate the quality of learned visual representations by assessing their performance when used as input features for a linear classifier. The table lists various vision models along with their architectures, patch size, resolution, number of tokens (used as input), and their respective linear probing accuracy (%). The higher the accuracy, the better the quality of the learned visual representation.

This table presents the ranking of various Multimodal Large Language Models (MLLMs) based on their performance across different benchmark categories. The benchmarks assess various capabilities, including general understanding, knowledge-based reasoning, OCR and chart processing, and vision-centric tasks. The table highlights the relative strengths and weaknesses of different MLLMs built using either language-supervised or self-supervised vision encoders. The full results for all models on each benchmark can be found in Table 11 of the paper.
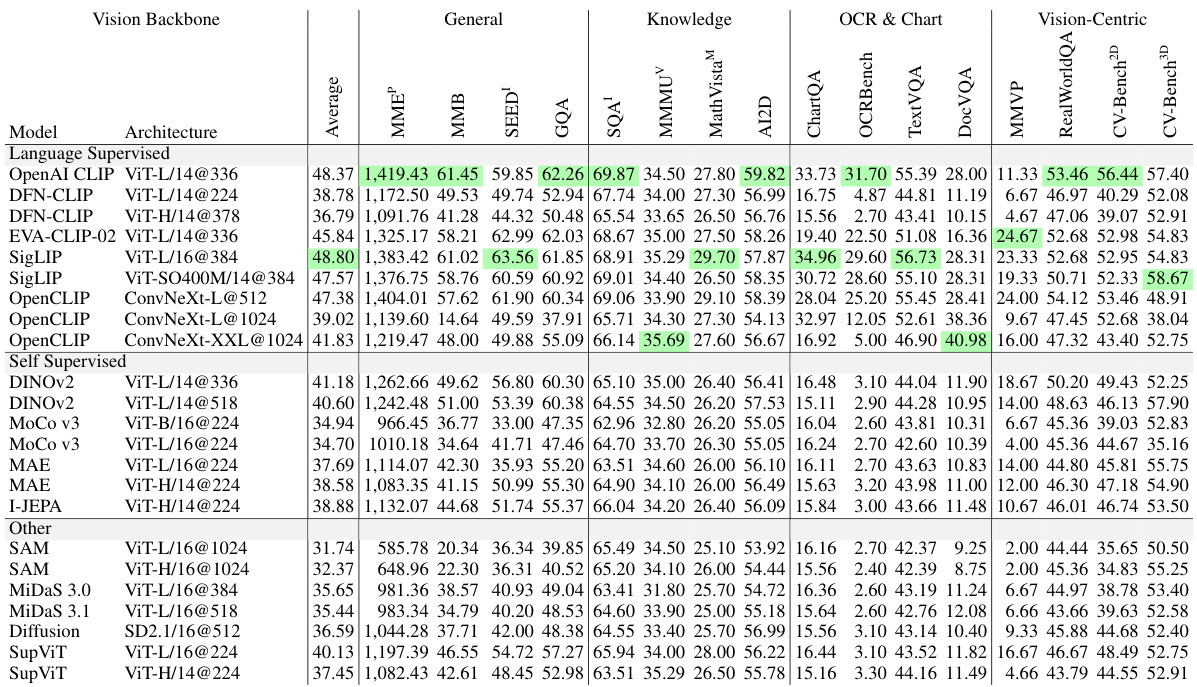
This table lists various vision backbones used in the experiments, categorized by supervision type (Language-Supervised, Self-Supervised, Other), and provides details about their architecture (e.g., ViT-L, ConvNeXt-L), patch size, resolution, number of tokens, and hidden size. The ‘†’ symbol indicates that the number of visual tokens has been adjusted (interpolated) to match the specified value.

This table lists the vision backbones used in the experiments, categorized by supervision type (Language-Supervised, Self-Supervised, Other, Class Labels). For each backbone, the architecture, patch size, resolution, number of tokens, and hidden size are specified. The ‘†’ symbol indicates that the number of visual tokens has been reduced via interpolation.
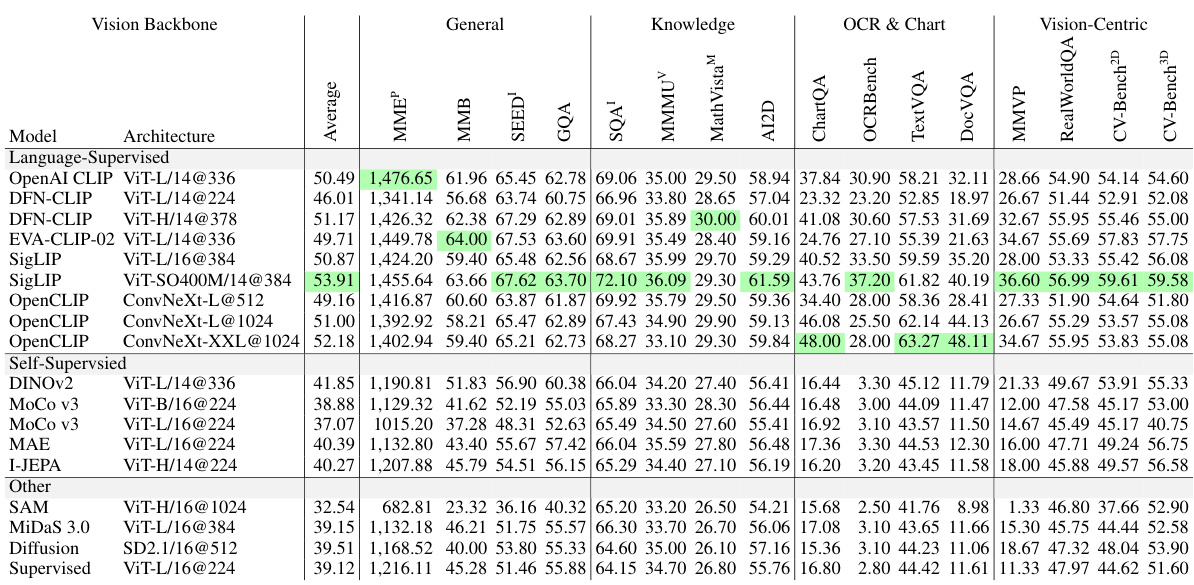
This table compares the performance of Cambrian-1 with other leading Multimodal Large Language Models (MLLMs) across various benchmarks. It shows that Cambrian-1 surpasses open-source models and achieves competitive results against proprietary models like GPT-4V, Gemini, and Grok-1.5. A key finding is that even with a significantly lower number of visual tokens (576 compared to 2880 in Mini-Gemini-HD and LLaVA-NeXT), Cambrian-1 demonstrates superior performance on tasks related to Optical Character Recognition (OCR), charts, and vision-centric challenges.

This table lists the vision backbones used in the experiments. It details the type of supervision (language-supervised, self-supervised, other, class labels), the method used to train the model, the architecture, patch size, resolution, number of tokens, and hidden size for each backbone. The † symbol indicates that the number of visual tokens for that model was interpolated down to the specified number.

This table compares the performance of Cambrian-1 against other leading multimodal large language models (MLLMs), both open-source and proprietary. It highlights Cambrian-1’s superior performance, especially considering its efficient use of visual tokens (576) compared to other models using significantly more (2880). The comparison is broken down by benchmark category, showing Cambrian-1’s strengths in OCR & Chart and Vision-Centric tasks.

This table compares the performance of Cambrian-1 against other leading multi-modal LLMs (MLLMs) across various benchmarks. It highlights Cambrian-1’s competitive performance compared to both open-source and proprietary models, particularly in OCR & Chart and Vision-Centric tasks. A key point is that Cambrian-1 achieves this performance despite using significantly fewer visual tokens (576) than some of its competitors (e.g., Mini-Gemini-HD and LLaVA-NeXT, which use 2880).

This table lists the various vision backbones used in the experiments. It details the type of supervision (language-supervised, self-supervised, other, or class labels), the method used to train the model, the architecture of the model (e.g., ViT, ConvNeXt), the patch size, resolution, number of tokens, and hidden size for each backbone. The † symbol indicates that the number of visual tokens was adjusted through interpolation.
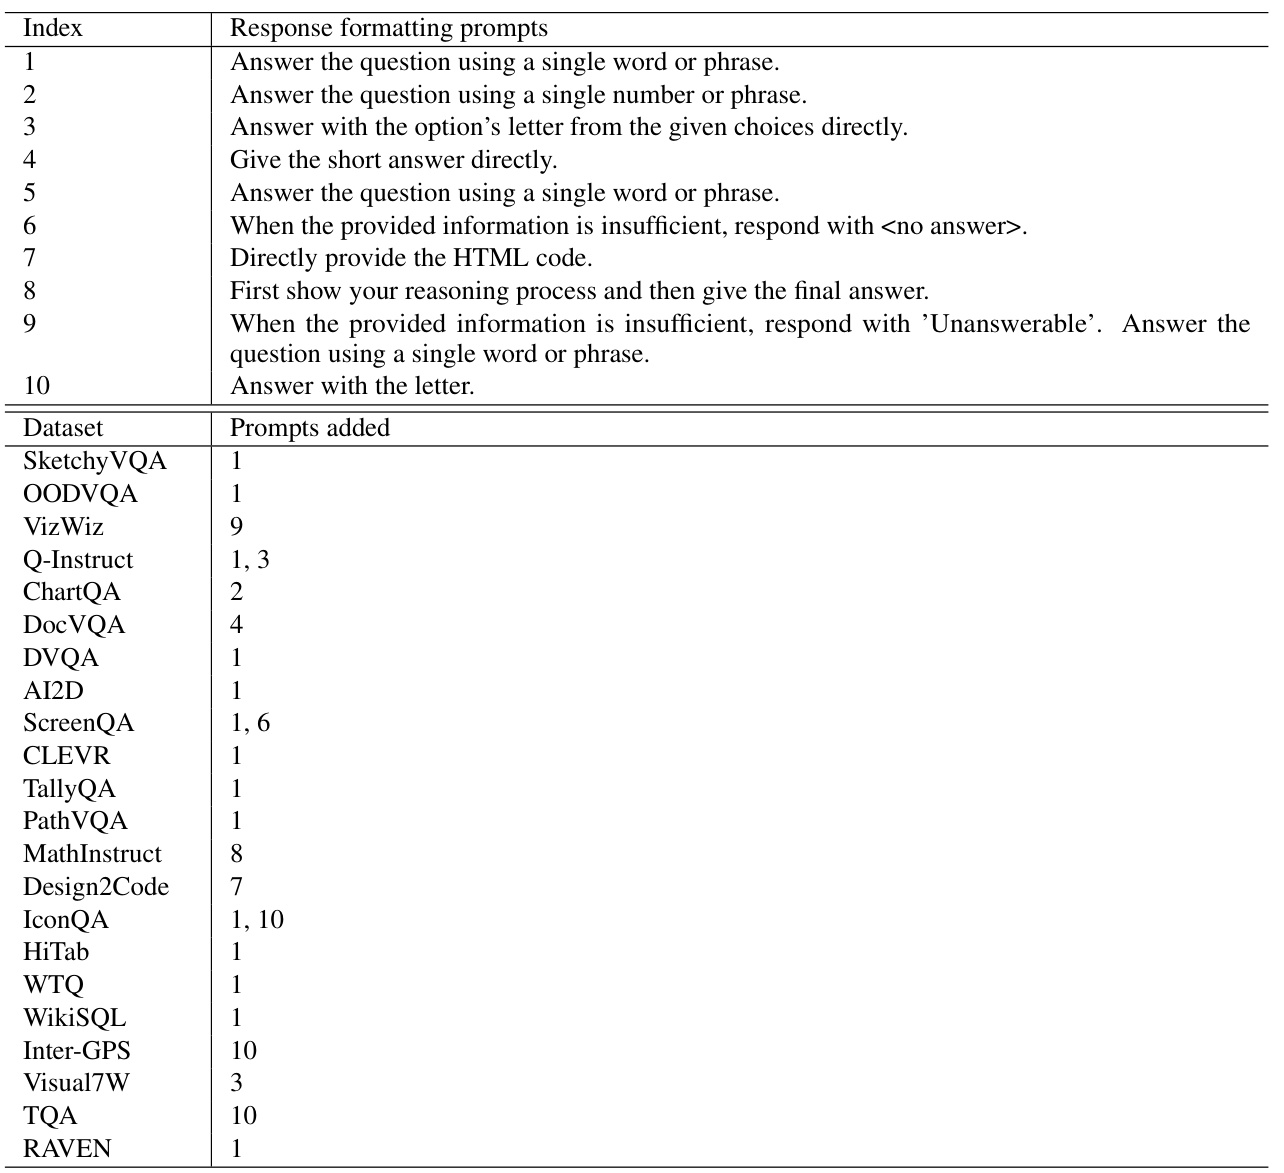
This table lists the various vision backbones used in the experiments, categorized by supervision type (language-supervised, self-supervised, other, class labels), along with details such as the method, architecture, patch size, resolution, number of tokens, and hidden size. The ‘†’ symbol indicates that the number of tokens for some models were adjusted through interpolation to match the target number of tokens used in the experiments.

This table compares the performance of Cambrian-1 with other leading Multimodal Large Language Models (MLLMs) across various benchmarks. It highlights Cambrian-1’s superior performance compared to other open-source models and its competitiveness against proprietary models like GPT-4V and Gemini. A key observation is that Cambrian-1 achieves better results on OCR & Chart and Vision-Centric tasks despite using significantly fewer visual tokens (576) than its competitors (Mini-Gemini-HD and LLaVA-NeXT, which use 2880 tokens). This suggests that Cambrian-1’s design is particularly efficient and effective in processing visual information.
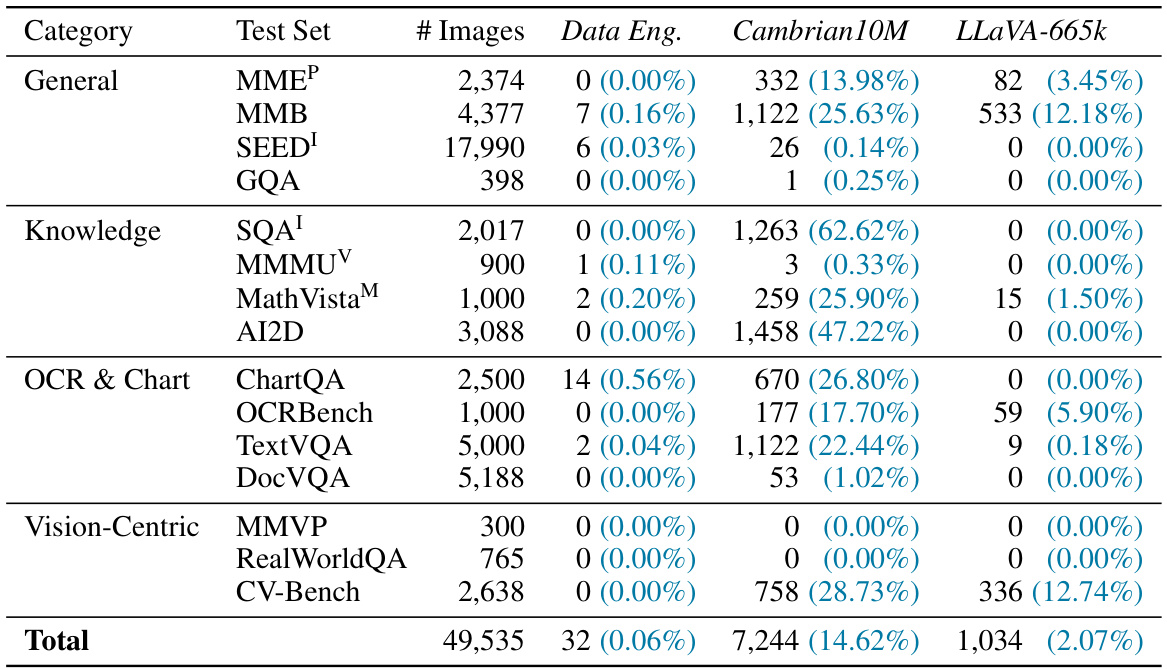
This table presents the results of an analysis to determine the extent of overlap between test images and images from three training datasets: Cambrian10M Data Engine (161k subset), Cambrian10M, and LLaVA-665k. Image hashing was used to identify overlapping images. The table shows the number of images in each test set, and the number and percentage of matching images found for each training dataset. The results indicate minimal overlap (0.06%), suggesting that the training data does not contain significant leakage from the test datasets.

This table compares the performance of the Spatial Vision Aggregator (SVA) against other methods for aggregating features from multiple vision encoders. The results show that the SVA consistently achieves better performance across various benchmark categories, particularly excelling when handling high-resolution vision information. The comparison involves several alternative aggregation techniques, highlighting the superior performance of the SVA architecture.

This table compares the performance of the Spatial Vision Aggregator (SVA) against other methods for aggregating visual features in a multimodal large language model. The SVA consistently achieves better results across different benchmark categories, particularly excelling at handling high-resolution visual inputs. The comparison highlights SVA’s advantage in efficiently integrating information from multiple visual encoders while minimizing information loss during the aggregation process. The table shows the performance of each method on four benchmark categories: General, Knowledge, OCR & Chart, and Vision-Centric.

This table shows the percentage of attention weights assigned to different vision encoders (SigLIP, CLIP, DINOV2, and ConvNext) when processing images from three different benchmark categories: GQA (general visual question answering), DocVQA (document visual question answering), and ScienceQA (science visual question answering). The results show that the attention distribution varies depending on the image category, reflecting the relative importance of different visual features for different types of questions.

This table lists the details of the 23 vision backbones used in the Cambrian-1 experiments. For each backbone, the table specifies the supervision type (language-supervised, self-supervised, depth-supervised, or other), the training method (e.g., contrastive, masked), the architecture (e.g., ViT-L, ConvNeXt), the patch size, resolution, number of tokens, and hidden dimension size. The ‘†’ symbol indicates that the visual tokens were interpolated to match the specified number of tokens.

This table lists various vision backbones used in the experiments. It provides details on the type of supervision used to train each model (language-supervised, self-supervised, other), the specific model architecture, patch size, resolution, number of tokens, and hidden size. The † symbol indicates that the number of visual tokens has been reduced through interpolation.
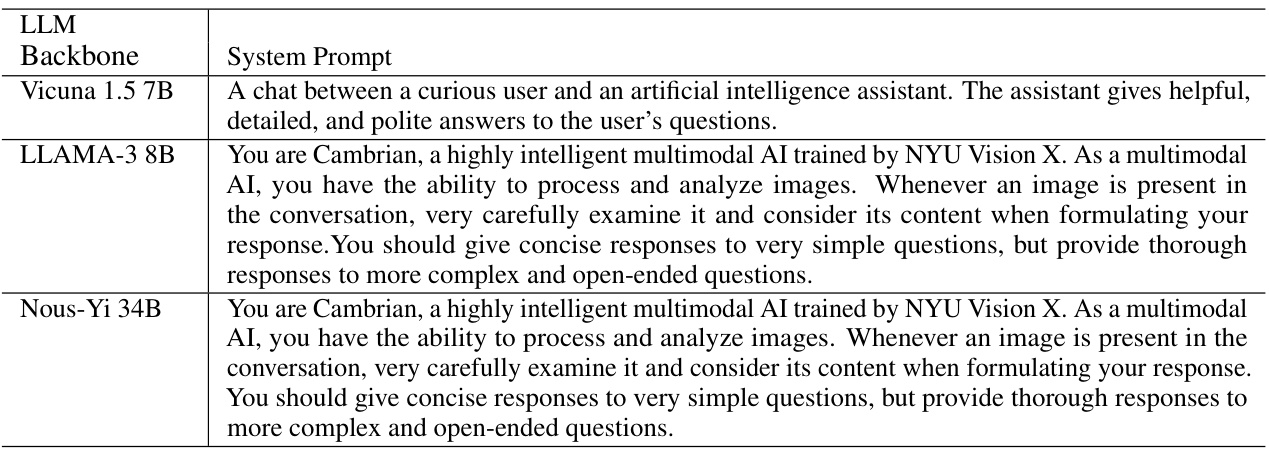
This table compares the performance of Cambrian-1 with other leading multimodal large language models (MLLMs), including both open-source and proprietary models. It shows the performance of each model across various benchmark categories (General, Knowledge, OCR & Chart, and Vision-Centric), highlighting Cambrian-1’s competitive performance, particularly its superior performance on OCR & Chart and Vision-Centric tasks despite using significantly fewer visual tokens (576) compared to other models (2880).
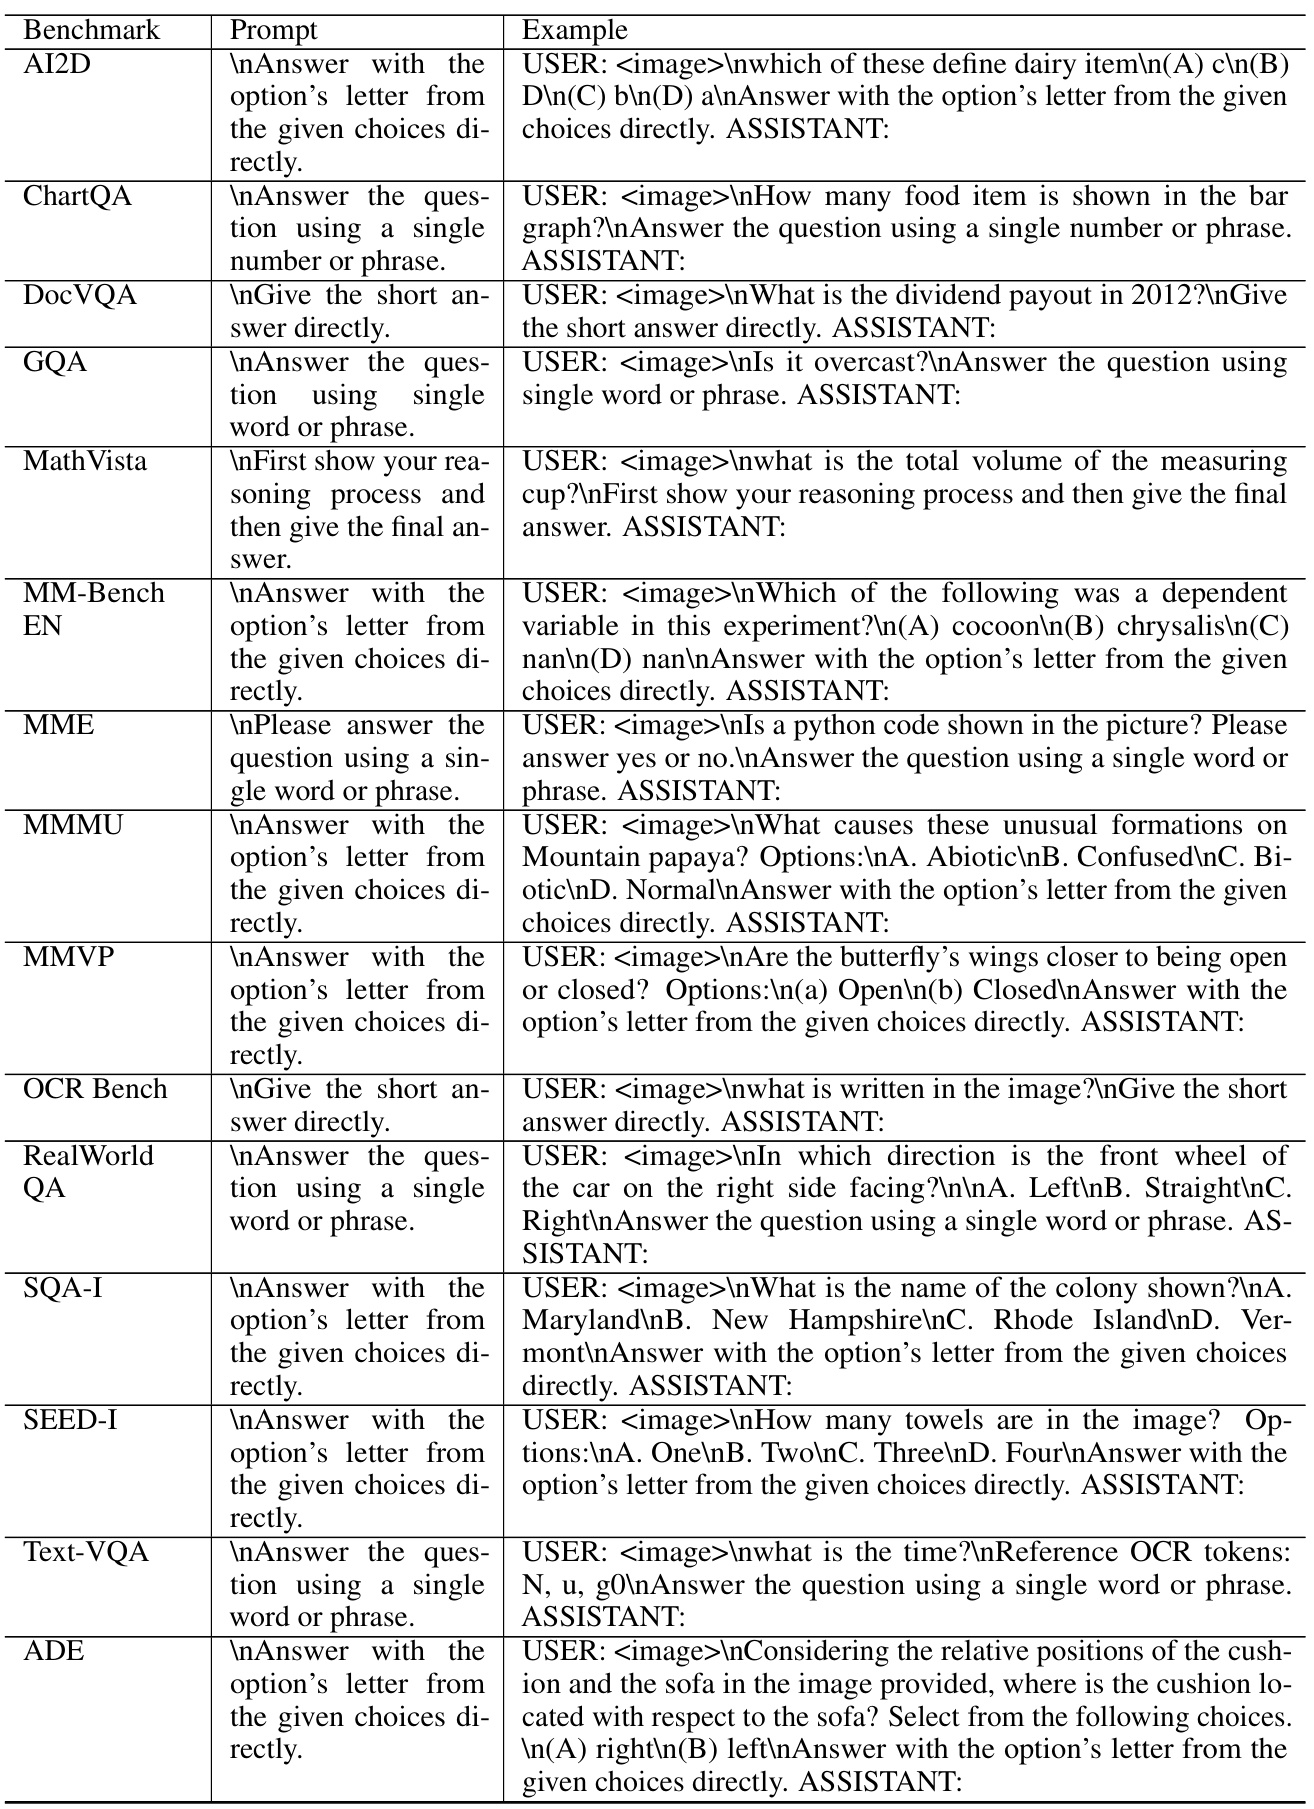
This table compares the performance of Cambrian-1 against other leading Multimodal Large Language Models (MLLMs) across various benchmarks. It highlights Cambrian-1’s superior performance over open-source alternatives while showing competitive results against proprietary models like GPT-4V, Gemini, and Grok-1.5. Notably, despite using significantly fewer visual tokens (576 vs 2880), Cambrian-1 surpasses Mini-Gemini-HD and LLaVA-NeXT on OCR & Chart and Vision-Centric tasks.

This table lists the details of various vision backbones used in the experiments, categorized by their supervision type (Language-Supervised, Self-Supervised, Other, Class Labels), method (Language, Contrastive, Masked, Depth, Diffusion), architecture (ViT, ConvNeXt, VAE+UNet, ViT-B), patch size, resolution, number of tokens, and hidden size. The symbol † indicates that the number of visual tokens has been interpolated to the specified number.
Full paper#


