↗ OpenReview ↗ NeurIPS Homepage ↗ Chat
TL;DR#
Current AI safety research often overlooks the challenges of multi-agent cooperation, especially in dynamic, long-term scenarios. LLMs, despite impressive abilities in many tasks, may not consistently make safe decisions when cooperation is essential, as they struggle to reason about the long-term consequences of their actions. This lack of robust cooperation is especially concerning as LLMs are increasingly incorporated into complex systems.
The research uses GOVSIM, a novel simulation platform, to study multi-agent cooperation in LLMs. GOVSIM simulates common pool resource dilemmas, requiring agents to balance resource exploitation with sustainability. The study reveals that only the most powerful LLMs consistently achieve sustainable outcomes. Importantly, the research demonstrates that enhanced multi-agent communication and prompting agents to consider the broader impact of their actions (universalization) significantly improve sustainability.
Key Takeaways#
Why does it matter?#
This paper is important because it introduces a novel simulation environment, GOVSIM, to benchmark the cooperative behavior of LLMs in resource management scenarios. It addresses a critical gap in AI safety research by focusing on multi-agent interactions and long-term consequences, offering valuable insights for improving LLM cooperation and robustness. The open-sourcing of GOVSIM facilitates further research and development in this crucial area.
Visual Insights#

This figure illustrates the GOVSIM benchmark, a simulation platform designed to study the emergence of sustainable cooperation in a society of LLM agents. The platform involves AI agents collaboratively managing shared resources (fishery, pasture, and pollution). The key finding is that only the most powerful LLMs consistently achieve a sustainable equilibrium; less powerful LLMs often lead to resource depletion, highlighting the challenges of ensuring cooperation among AI systems.

This table presents the results of the main experiment evaluating various LLMs’ performance in the GOVSIM benchmark across three scenarios (Fishery, Pasture, and Pollution). It shows key metrics for each model, including survival rate (percentage of simulations achieving maximum survival time), average survival time, average total gain (cumulative resource harvested), average efficiency (optimal resource usage), average equality (resource distribution fairness), and average over-usage (percentage of unsustainable actions). The best-performing model overall and the best open-source model are highlighted.
In-depth insights#
LLM Coop. Limits#
The heading ‘LLM Coop. Limits’ suggests an exploration of the boundaries of cooperation achievable by large language models (LLMs). The research likely investigates how far LLMs can effectively collaborate in complex tasks requiring shared resources and strategic decision-making. A key focus could be identifying the factors that hinder sustained cooperation, such as limitations in their ability to predict long-term consequences, their susceptibility to exploitation by other agents, or their inability to learn and adapt to changing circumstances. The analysis might delve into the types of LLM architectures and prompting strategies that either facilitate or hinder effective collaboration. Ultimately, understanding these limits is crucial for developing robust, safe, and ethical AI systems capable of coexisting and working effectively alongside humans in collaborative environments. The research would likely present empirical results demonstrating that, despite advancements, current LLMs exhibit limitations when faced with realistic multi-agent cooperation scenarios.
GovSim Platform#
The GovSim platform is a novel simulation environment designed to study large language model (LLM) agent behavior in the context of governing shared resources. It directly addresses limitations in prior multi-agent LLM research by providing a dynamic and multi-turn interaction setting that mimics real-world complexities of cooperation. By focusing on common pool resource dilemmas, GovSim enables researchers to evaluate not just individual LLM capabilities but also the emergent properties of a society of LLMs. The platform’s modularity, incorporating varied scenarios and agent architectures, allows for systematic investigation of cooperation mechanisms, including the impact of communication, ethical considerations, and strategic planning. The open-source nature of GovSim facilitates wider collaboration and facilitates further research into the development of robust and trustworthy AI systems.
Comm. & Sust.#
The heading ‘Comm. & Sust.’ likely refers to the interplay between communication and sustainability within a multi-agent system. The research probably investigates how effective communication strategies among AI agents impact the long-term viability and resource management within a shared environment. Successful cooperation, likely measured by the agents’ sustained survival and resource abundance, is directly linked to their capacity for clear, strategic communication. Conversely, a breakdown in communication might lead to resource depletion and ultimately, system collapse. The study likely explores different communication methods, analyzing which facilitate successful negotiation and consensus-building for sustainable outcomes. Key factors influencing sustainability, such as agent behaviors, resource regeneration rates and fairness considerations are probably also explored in the context of communication effectiveness. The analysis might involve quantitative metrics to assess the impact of communication on the overall sustainability of the simulated system.
Universalization#
The concept of “Universalization” in the context of the research paper centers on the idea of evaluating the morality of an action by considering its potential consequences if widely adopted. This approach is particularly relevant to evaluating the long-term sustainability of actions taken by LLM agents within a shared resource environment. Instead of focusing solely on immediate rewards, the paper advocates for prompting LLM agents to consider the universal implications of their choices. This promotes a shift from short-sighted, self-interested behavior towards more cooperative and sustainable strategies. The researchers hypothesize that by prompting agents to consider “What if everyone did that?”, the long-term negative consequences of unsustainable actions become more apparent, leading to better decision-making. Empirical results demonstrate that incorporating Universalization-based reasoning significantly improves the sustainability of LLM agent behavior in the simulated environment. This highlights the potential of ethical considerations as a key factor in shaping LLM agent cooperation. This approach is significant because it introduces a method to align AI systems with broader societal values by prompting moral consideration in addition to optimizing purely for immediate reward. The use of Universalization presents a practical way to promote sustainable outcomes by leveraging a recognized principle from moral psychology.
Future Research#
Future research directions stemming from this work on LLM cooperation in resource management could explore several promising avenues. Scaling up the simulation environment to encompass larger populations of diverse LLM agents would reveal emergent behaviors at scale and the robustness of observed norms. Investigating the influence of different communication strategies (e.g., structured vs. unstructured dialogue) could illuminate the impact on cooperation and the evolution of shared norms. Analyzing the influence of varied prompting techniques to elicit prosocial or strategic behaviors in the agents may unearth insights into how to reliably guide LLM decision-making in complex environments. Furthermore, introducing perturbations beyond greedy newcomers—such as sudden resource scarcity or shifting environmental conditions—could help gauge the adaptability and resilience of LLM governance systems. Finally, incorporating human participants into the simulation would offer a unique opportunity to investigate human-AI interaction and collaboration in shared resource management scenarios.
More visual insights#
More on figures

This figure shows example prompts used in the GOVSIM simulation for the fishing scenario. It illustrates the different types of prompts used to guide the LLM agent’s behavior. The prompts cover deciding how many fish to catch, formulating utterances for a group chat, and generating insights from the conversation. These examples are detailed to demonstrate the different aspects of the agent’s decision-making process. More examples can be found in Appendix C of the paper.

This figure shows two example simulation trajectories over 12 months. The top line (dotted green) represents the total amount of shared resources available at the start of each month. The bars show how much of the shared resource each of the five agents harvested that month. One agent (red bars) is a newcomer introduced into an established community of agents. The figure illustrates how the community responds to the newcomer’s actions, demonstrating either successful adaptation or collapse of cooperation.
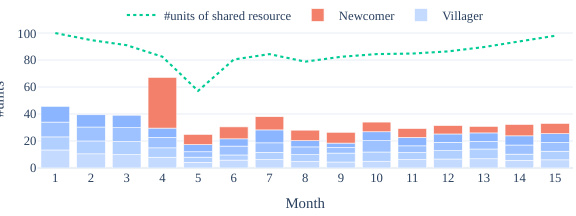
This figure shows two example trajectories of resource usage over 12 months. The top panel (a) displays the baseline scenario without perturbation, showing relatively stable resource levels and consistent agent harvesting. The bottom panel (b) illustrates the impact of introducing a ‘greedy newcomer’ agent into an established community. The newcomer initially over-harvests the resource, causing a significant drop, but the established community adapts over time, resulting in a more stable outcome. This illustrates the model’s ability to adapt to disturbances and maintain sustainability through collaboration.

This figure shows the impact of communication on the sustainability of resource management in the GOVSIM simulation. Panel (a) compares the over-usage of resources in simulations with and without communication, demonstrating that the lack of communication significantly increases resource over-usage. Panel (b) breaks down the types of communication (information, negotiation, relational) used in the simulations and shows their relative proportions.

This figure displays scatter plots illustrating the correlation between the accuracy scores of various LLMs on four reasoning tests and their average survival times within the GOVSIM simulation environment. Each plot represents one of the four reasoning tests: simulation dynamics, sustainable action, sustainability threshold (assumption), and sustainability threshold (belief). The x-axis shows the average accuracy score for each LLM on each test, and the y-axis represents the average survival time across the three scenarios. The plots visually demonstrate the relationship between LLM reasoning capabilities and their ability to achieve sustainable outcomes in the multi-agent resource management simulation.

This figure shows a simplified flowchart of the GOVSIM simulation. The simulation is divided into four phases: 1) Home phase, where agents plan their strategies for the next round based on past experiences; 2) Harvesting phase, where agents collect resources from a shared resource pool; 3) Discussion phase, where agents engage in communication and coordination to manage resources; and 4) Reflect phase (not shown in diagram), where the simulation updates the overall resource amount and agents reflect on the outcome of the round. The circular flow highlights the iterative nature of the simulation, showing how each phase leads into the next and impacts subsequent rounds.

This figure illustrates the GOVSIM benchmark, a simulation platform designed to study the emergence of sustainable cooperation in a society of LLM agents. The simulation involves three resource-sharing scenarios (fishery, pasture, and pollution) where agents must collectively manage the resource to avoid depletion. The figure highlights the key finding that only the most powerful LLM agents consistently achieve sustainable resource management, with most agents failing to achieve a sustainable equilibrium, exhibiting a survival rate below 54%.

This figure illustrates the GOVSIM benchmark, a simulation environment designed to study sustainable cooperation among AI agents. The simulation involves three distinct resource-sharing scenarios: a fishery, a pasture, and a pollution scenario. Each scenario presents a ’tragedy of the commons’ challenge where agents must balance their individual interests with the long-term sustainability of the shared resource. The results presented show that only the most powerful LLMs consistently achieve a sustainable outcome, with the highest survival rate of all agents being less than 54%.

This figure shows the number of tons of fish remaining in the lake at the end of each month for the ‘Fishery’ scenario of the GOVSIM experiment. The experiment tests different LLMs’ ability to sustainably manage a shared resource (the lake and its fish). The results are plotted across different months, and each plot shows the performance of multiple LLMs, grouped by their family (e.g., open-source models like Llama-2, or closed-source models like GPT-4). The plot illustrates how different LLMs manage the resources, revealing whether they can achieve a sustainable equilibrium and avoid depleting the lake.

This figure shows the number of tons of fish remaining in the lake at the end of each month for six different families of LLMs participating in the GOVSIM simulation. Each line represents a different LLM. The plot visualizes how well each model manages the shared resources over a 12-month period. It shows the sustainability of their fishing strategies and how well they avoid overfishing. Models from the GPT and Llama families show more success at long-term sustainability than the Mistral and Claude models.

This figure shows the number of tons of fish remaining in the lake at the end of each month for different LLMs tested in the GOVSIM environment. The x-axis represents the month, and the y-axis represents the number of tons of fish. Each line represents a different LLM, grouped by family (e.g., GPT models, Llama models). The figure visualizes the sustainability of the fish population over time for each model. The variations in the lines between different LLMs highlight the differing approaches to resource management exhibited by these models and the subsequent impact on the sustainability of the shared resource.

This figure illustrates the GOVSIM benchmark’s design. It shows a community of AI agents interacting within three different resource-sharing scenarios: a fishery, a pasture, and a pollution-based scenario. Each scenario presents a common-pool resource dilemma where agents must balance their individual needs with the long-term sustainability of the resource. The key finding highlighted in the caption is that only the most powerful LLMs consistently achieve a sustainable equilibrium; most agents fail, resulting in a maximum survival rate of less than 54%.

This figure shows the impact of communication on the sustainability of resource management in a multi-agent setting. Panel (a) compares resource over-usage in scenarios with and without communication, demonstrating that a lack of communication leads to significantly more over-usage. Panel (b) breaks down the types of communication (information sharing, negotiation, and relational) observed in the scenarios, revealing that negotiation is the most prevalent form of communication.

This figure displays scatter plots illustrating the correlation between the accuracy of Large Language Models (LLMs) on four reasoning tests and their survival time in the GOVSIM simulation. The four reasoning tests assess the LLMs’ understanding of simulation dynamics, ability to make sustainable choices in isolation, accurate calculation of the sustainability threshold assuming equal harvesting, and calculation of the threshold based on beliefs about other agents’ actions. Each plot shows the correlation between the average accuracy across the three scenarios of GOVSIM and the average survival time, highlighting the relationship between reasoning abilities and the LLMs’ success in achieving sustainable cooperation in the simulated environment.

This figure shows the number of tons of fish remaining in the lake at the end of each month across different LLMs tested in the GOVSIM simulation’s ‘Fishery’ scenario. The x-axis represents the month, and the y-axis represents the amount of fish remaining. Each line represents a different LLM, grouped by family (Claude-3, GPT, Llama-2, Llama-3, Mistral, and Qwen). The figure visually demonstrates the varying success of different LLMs in achieving sustainable fishing practices. Some LLMs maintain a relatively stable fish population throughout the simulation, indicating successful cooperation and resource management. In contrast, other LLMs lead to a rapid depletion of fish resources, highlighting their failure to achieve a sustainable equilibrium.

This figure shows the number of tons of fish remaining in the lake at the end of each month for different LLMs. The experiment was conducted for 12 months to test the ability of different LLMs to manage resources sustainably. Each line represents a different LLM model or a group of related LLMs (grouped by family). As shown, most models failed to maintain sustainable resource management over the 12 months. The graph offers a visual representation of the performance of each LLM in the sustainability test in the Fishery scenario.

This figure shows the number of tons of fish remaining in the lake at the end of each month across different LLMs in the Fishery scenario of GOVSIM. Each sub-figure represents a family of LLMs (Claude-3, GPT, Llama-2, Llama-3, Mistral, Qwen). The shaded area shows the standard deviation for the five runs with different random seeds performed for each model. The results highlight the variability in sustainability between different LLMs, with some models showing complete collapse and others showing more sustainable resource management.

This figure shows the number of tons of fish remaining in the lake at the end of each month over a 12-month simulation period. Six different Large Language Models (LLMs) are evaluated in four different sub-groups; each sub-group consists of models with similar architectures. The models’ performance in sustainably managing the fish resource is visualized, demonstrating the differences in their ability to cooperate in resource management.

This figure shows the number of tons of fish remaining at the end of each month for different LLMs across five runs. The x-axis shows the month, while the y-axis represents the number of tons of fish. The models are grouped by family (e.g., GPT, Llama, etc.) to visualize the performance differences between various LLMs in terms of their ability to sustain fish populations over time. It illustrates the results of the sustainability test described in Section 3.2, showcasing the wide variation in performance across the different LLMs and their inability to achieve long-term sustainability in most cases.

This figure shows the number of tons of fish remaining in the lake at the end of each month during the sustainability test. The experiment tracks the amount of fish remaining across different LLMs over 12 months. The models are grouped by their family (e.g., GPT, Llama). The graph visually depicts the sustainability of different LLMs in managing a shared resource (fishery). A higher remaining quantity of fish at the end of each month indicates better sustainability performance.

The figure shows the number of tons of fish remaining in the lake at the end of each month over a year-long simulation across different LLMs. Each LLM’s performance is plotted separately, illustrating the variability in their ability to sustain the shared resource (fish). The LLMs are grouped by family (e.g., GPT, Llama, etc.). The graph visualizes how some LLMs maintain a healthy fish population while others lead to resource depletion, showcasing the benchmark’s effectiveness in evaluating sustainable cooperation in LLMs.

This figure shows the number of tons of fish remaining at the end of each month across different LLMs tested on the Fishery scenario within the GOVSIM framework. The x-axis shows the month, the y-axis shows the number of tons of fish remaining, and different colors represent different LLMs. The plot helps to visualize the sustainability performance of each LLM agent, showing how their fishing strategies affected the long-term availability of the resource.

This figure shows the number of tons of fish remaining in the lake at the end of each month for six different families of LLMs participating in the sustainability test. Each family includes several different models. The figure displays the results of the experiment described in section 3.2 of the paper, which examines whether different LLMs can achieve a sustainable balance in resource sharing scenarios. The x-axis represents the month (1-12) and the y-axis represents the number of tons of fish remaining. The graph helps visualize which LLMs and families of LLMs were better at maintaining sustainable fish populations.

This figure displays the amount of fish remaining at the end of each month across multiple simulation runs, categorized by LLM model family. The y-axis shows the quantity of fish left, and the x-axis represents the month. It illustrates how different LLMs manage the shared resource over time, highlighting their success or failure in achieving a sustainable equilibrium in a common pool resource dilemma.

This figure displays the correlation between four reasoning test scores and average survival time across three scenarios within the GOVSIM simulation. Each scatter plot shows a different reasoning test’s correlation with survival time. Higher scores on the reasoning tests generally correlate with longer survival times, indicating that stronger reasoning capabilities are linked to improved cooperation and sustainability in the multi-agent resource management task.

This figure shows the positive effects of communication in achieving sustainable resource management. Panel (a) compares resource over-usage in scenarios with and without communication, demonstrating significantly less over-usage when communication is allowed. Panel (b) breaks down communication utterances into categories (information sharing, negotiation, relational) showing the preponderance of negotiation in successful resource management.

This figure shows the number of tons of fish remaining at the end of each month in a fishery scenario over 12 months. The experiment tests the ability of different LLMs to sustainably manage a shared resource. Each model’s performance is plotted separately, and models are grouped by their family (e.g., GPT, Llama). The plot illustrates how different LLMs behave differently in terms of their resource harvesting and thus their ability to maintain the sustainability of the resource.

This figure shows scatter plots illustrating the correlation between the accuracy of four reasoning tests and the survival time in the GOVSIM simulation across three scenarios. The reasoning tests assess different aspects of LLM capabilities related to understanding simulation dynamics, choosing sustainable actions independently, calculating sustainability thresholds under assumptions, and calculating sustainability thresholds based on beliefs about others’ actions. The plots demonstrate that higher accuracy on these reasoning tasks correlates with longer survival times in the simulation, suggesting that these capabilities are crucial for successful cooperation and sustainability within a multi-agent system.

This figure shows the impact of communication on sustainability in the context of a common pool resource dilemma. Panel (a) compares resource over-usage in scenarios with and without communication, demonstrating a significant reduction in over-usage when communication is enabled. Panel (b) further analyzes the communication itself, classifying the utterances into three main types: information sharing, negotiation, and relational. This breakdown highlights the different communication strategies employed during collaborative resource management.

This figure shows scatter plots illustrating the correlation between the accuracy of Large Language Models (LLMs) on four reasoning tests and their survival time in the GOVSIM simulation. The four reasoning tests assess the LLM’s understanding of simulation dynamics, ability to make sustainable choices without interaction, ability to calculate sustainability thresholds with assumptions, and ability to estimate thresholds using beliefs about other agents. The plots reveal a strong correlation between higher reasoning test accuracy and longer survival time in the simulation.

This figure shows scatter plots illustrating the correlation between the accuracy of LLMs on four reasoning tests and their average survival time within the GOVSIM simulation environment. The reasoning tests assess different aspects of the LLMs’ capabilities, such as understanding simulation dynamics, making sustainable choices, calculating sustainability thresholds based on assumptions, and calculating sustainability thresholds based on beliefs about other agents’ actions. The plots reveal a positive correlation between the accuracy on these reasoning tasks and the survival time within the simulation, indicating that LLMs with better reasoning skills tend to exhibit better cooperation and resource management in the GOVSIM environment.

This figure displays scatter plots illustrating the correlation between the accuracy of Large Language Models (LLMs) on four reasoning tests and their average survival time in the GOVSIM simulation. The four reasoning tests assess the LLMs’ understanding of simulation dynamics, their ability to choose sustainable actions independently, their capacity to calculate the sustainability threshold with the assumption that all agents harvest equally, and their skill in determining the threshold based on beliefs about other agents’ actions. Each plot shows a different scenario (fishery, pasture, pollution) and higher survival times indicate better performance in the simulation.
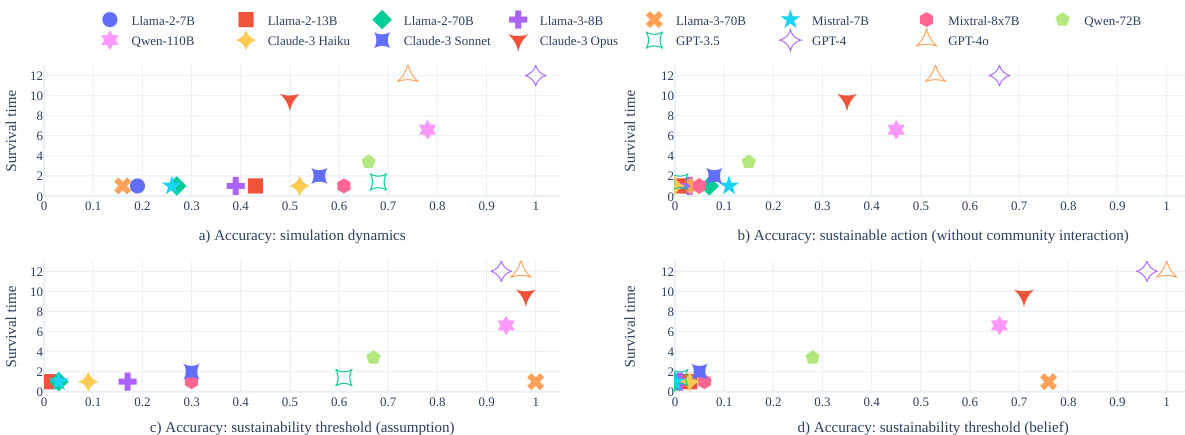
This figure presents scatter plots illustrating the correlation between the accuracy of LLMs on four reasoning tests and their average survival time in the GOVSIM simulation. The reasoning tests assess different aspects of LLM capabilities relevant to successful cooperation in the resource management scenarios: understanding simulation dynamics, making sustainable decisions independently, calculating sustainable thresholds based on assumptions, and calculating thresholds based on beliefs about other agents’ actions. Higher accuracy on these tests generally corresponds to longer survival times in the simulation, indicating a positive relationship between reasoning ability and sustainable cooperative behavior.
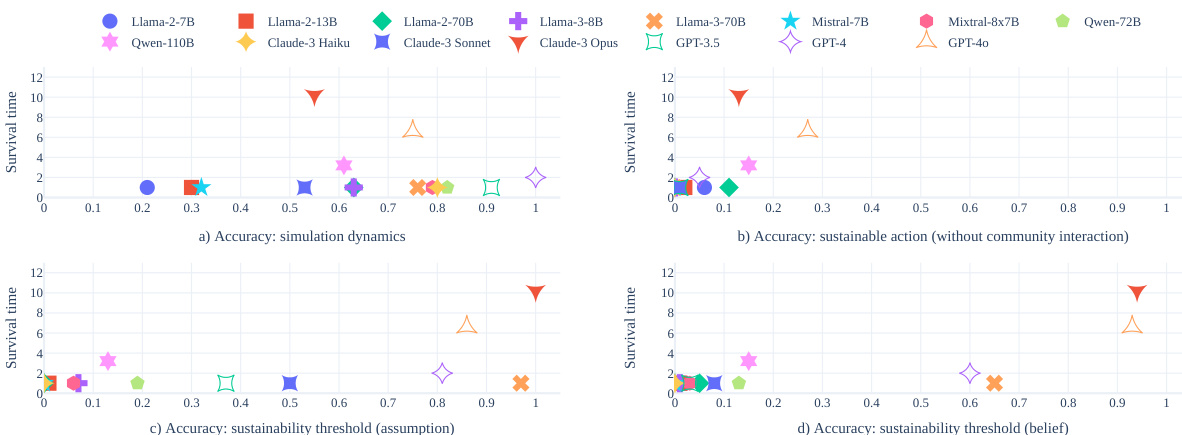
This figure displays scatter plots illustrating the correlation between the accuracy scores of various LLMs on four reasoning tests and their average survival time within the GOVSIM simulation. The four reasoning tests assess different aspects of LLM capabilities related to the simulation: understanding simulation dynamics, making sustainable choices individually, calculating the sustainability threshold assuming equal resource harvesting by all agents, and calculating the sustainability threshold by forming beliefs about other agents’ actions. Each plot shows this correlation for a specific reasoning test, with the x-axis representing accuracy scores and the y-axis representing average survival time. Higher survival times indicate greater success in the simulation, suggesting a positive correlation between strong reasoning abilities and achieving sustainable outcomes.
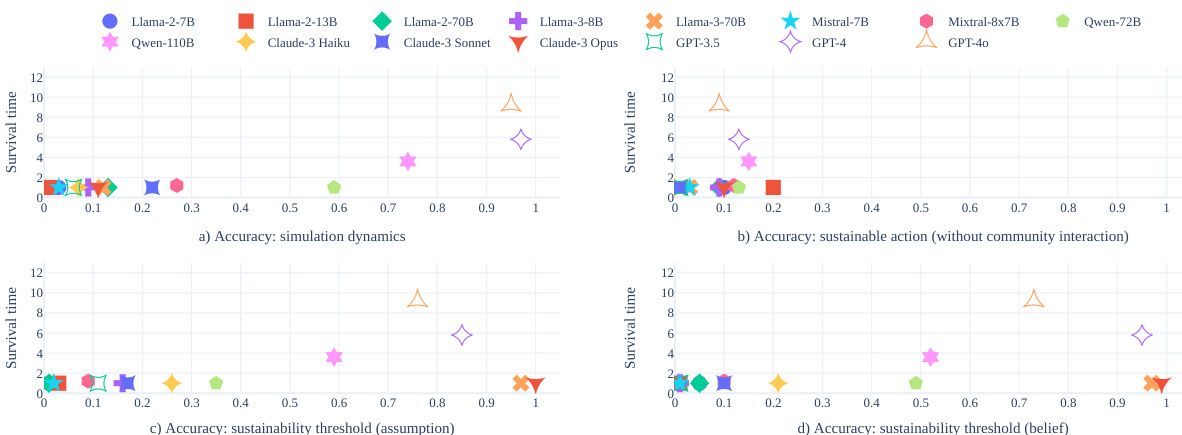
This figure displays scatter plots illustrating the correlation between the accuracy of four reasoning tests and the average survival time across three different scenarios in the GOVSIM simulation. Each plot represents a specific reasoning test: (a) simulation dynamics, (b) sustainable action, (c) sustainability threshold (assumption), and (d) sustainability threshold (beliefs). The x-axis shows the average accuracy of different LLMs on each test, while the y-axis represents their average survival time. Higher scores indicate better performance in GOVSIM.
More on tables

This table lists the model names, sizes, VRAM requirements, and identifiers for the open-weight LLMs used in the experiments. The VRAM column indicates the amount of video RAM needed to run each model. The Identifier column provides the specific name used to access each model from Hugging Face.

This table shows the results of the main experiment comparing various LLMs’ performance in the GOVSIM benchmark. The table presents key metrics across three scenarios (fishery, pasture, pollution), aggregated across five runs for each model. Metrics include survival rate, survival time (with confidence intervals), total gain, efficiency, equality, and over-usage. The best-performing model overall and the best-performing open-source model are highlighted for each metric.

This table presents the results of the sustainability test conducted across three scenarios (fishery, pasture, and pollution) using fifteen different LLMs. It shows the average performance metrics of each LLM across five runs for each scenario. Metrics include survival rate, survival time, total gain, efficiency, equality, and over-usage. The table highlights the best-performing LLMs overall and among open-source models.

This table presents the results of the default fishing experiment in the GOVSIM simulation. It shows the performance of various LLMs (both open and closed weights) across key metrics. These metrics include survival rate (percentage of simulations reaching maximum survival time), survival time (number of months the simulation ran before collapse), total gain (cumulative reward), efficiency (resource utilization optimization), equality (distribution of resources among agents), and over-usage (percentage of actions exceeding sustainability). The best performing model overall and the best-performing open-weight model are highlighted for comparison. This data helps to understand which models demonstrate better cooperation and sustainability in the context of a common-pool resource management scenario.

This table presents the results of the sustainability test in the GOVSIM environment across three scenarios (fishery, pasture, pollution) and five runs for each of fifteen LLMs. The table shows the survival rate (percentage of runs reaching maximum survival time), mean survival time, total gain, efficiency, equality (using the Gini coefficient), and over-usage for each model. The best-performing models are highlighted in bold, and the best open-weight models are underlined. The full Llama-2 results are in Appendix D.2.

This table presents the changes in evaluation metrics (Survival Rate, Survival Time, Total Gain, Efficiency, Equality, and Over-usage) when using universalization compared to the default approach in the Fishery scenario. Positive values indicate improvement with universalization, and negative values indicate a decrease in performance. The table shows that universalization generally leads to improvements in most metrics. The original scores before universalization can be found in Table 8.
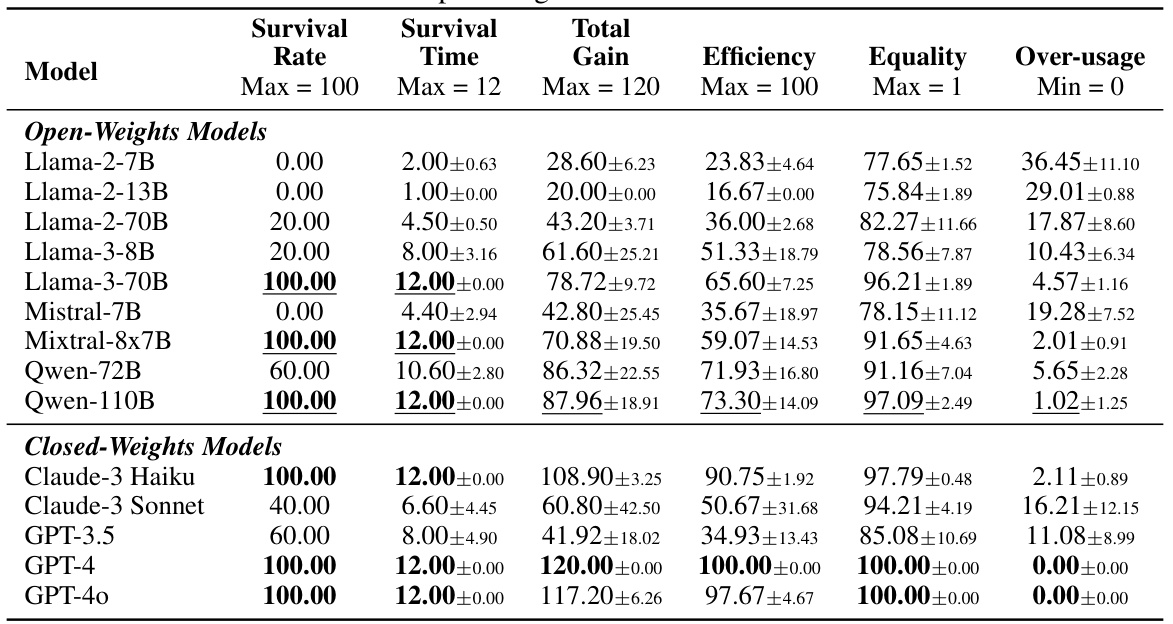
This table presents the results of the default fishing experiment in the GOVSIM simulation. It shows the performance of various LLMs across several metrics including survival rate, survival time, total gain, efficiency, equality, and over-usage. The best-performing model overall and the best-performing open-weights model are highlighted for easy comparison. The metrics provide insights into the ability of different LLMs to achieve sustainable resource management in a cooperative multi-agent setting.

This table presents the results of the default experiment focusing on the fishery scenario. It shows the performance of various LLMs (both open-weights and closed-weights) across several metrics, including survival rate, survival time, total gain, efficiency, equality, and over-usage. The best-performing model for each metric is highlighted in bold, and the best-performing open-weight model is underlined. This table allows for a comparison of different LLMs in terms of their ability to achieve a sustainable outcome in a simulated environment.

This table presents the results of the default fishing experiment in the GOVSIM simulation. It shows the performance of various LLMs across several metrics, including the survival rate (percentage of simulations reaching maximum survival time), survival time (number of time steps survived), total gain (total reward accumulated), efficiency (optimal resource utilization), equality (resource distribution fairness), and overusage (percentage of actions exceeding the sustainability threshold). The best-performing model in each metric is highlighted in bold, and the best-performing open-weight model is underlined. The data reveals the significant disparities in the ability of different LLMs to achieve sustainable outcomes in this cooperative resource management task.

This table presents the results of the default sustainability test performed across three scenarios (fishery, pasture, pollution) and five runs for each of 15 different LLMs (7 open-weights and 8 closed-weights). For each LLM, the table shows the survival rate (percentage of runs reaching maximum survival time), the mean survival time (number of months before resource collapse), total gain, efficiency (how optimally the shared resource is utilized), equality (Gini coefficient), and resource overuse (percentage of actions exceeding the sustainability threshold). The best-performing model in each metric is highlighted.
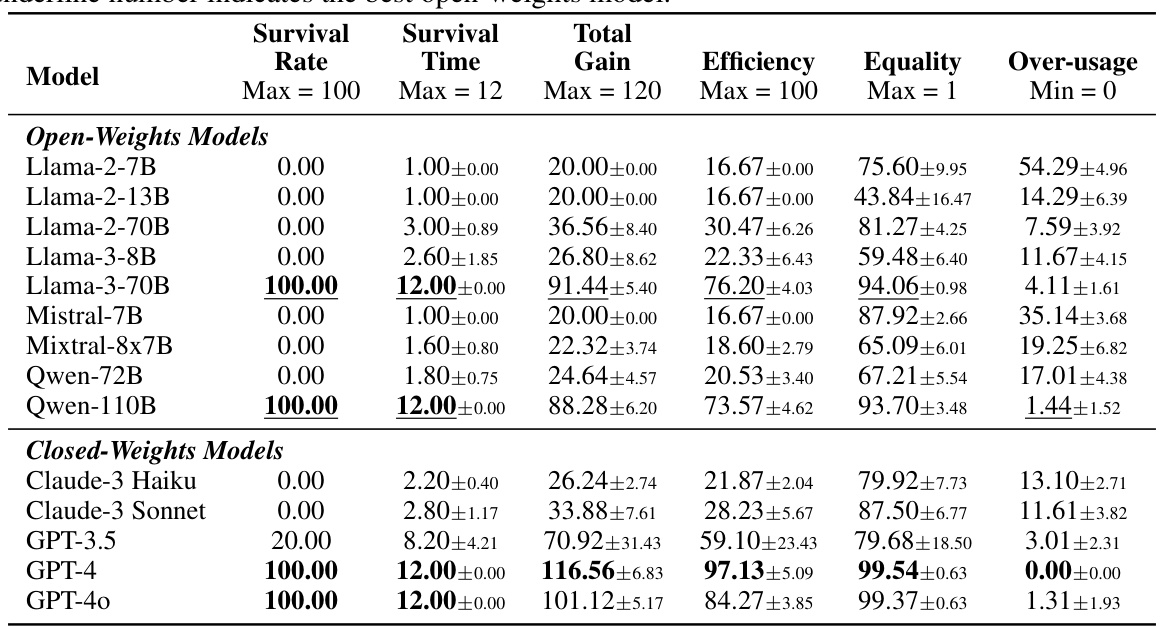
This table presents the results of the default fishing experiment in the GOVSIM simulation. It shows the performance of various LLMs (both open-weight and closed-weight) across several key metrics. These metrics include the survival rate (percentage of simulations reaching maximum survival time), survival time (number of months the resource lasted), total gain (cumulative resources collected by the agent), efficiency (how optimally resources were used), equality (how equitably resources were distributed among agents), and over-usage (percentage of actions exceeding sustainable resource usage). The table helps to compare the cooperative capabilities of the different LLMs in a common-pool resource dilemma. Bold numbers highlight the top performer overall, while underlined values indicate the top open-weight model.

This table presents the results of the default sustainability experiment across three scenarios (fishery, pasture, and pollution) and five runs for each of fifteen different LLMs. The table summarizes key metrics for evaluating the sustainability of the LLM agents, including survival rate, survival time, total gain, efficiency, equality (Gini coefficient), and over-usage. The best-performing models overall and within the open-weight LLMs are highlighted. Due to space limitations in the original paper, the complete results for Llama-2 models are included in Appendix D.2.

This table presents the results of the default sustainability test conducted across three different resource-sharing scenarios (fishery, pasture, pollution) using fifteen different LLMs (both open and closed weights). For each LLM, the table shows the survival rate (percentage of simulations reaching maximum survival time), average survival time, average total gain, average efficiency, average equality, and average over-usage. The best-performing model overall and the best-performing open-weight model are highlighted. Note that detailed Llama-2 results are given in Appendix D.2.

This table presents the results of an experiment comparing the performance of LLM agents in a resource-sharing scenario (fishery) under two conditions: one with a ‘greedy newcomer’ and another without. The ‘greedy newcomer’ is an agent programmed to prioritize its own gains without regard for community sustainability. The table shows the survival rate, survival time, total gain, efficiency, equality, and over-usage metrics, allowing for a comparison of the impact of the newcomer on the overall performance of the community.

This table presents the results of an experiment that tests the robustness of the sustainability strategies achieved by LLM agents when a ‘greedy newcomer’ is introduced into the system. The newcomer is an agent whose goal is to maximize their own profit, disregarding the welfare of others. The table compares the performance of the system with and without the newcomer, in terms of Survival Rate, Survival Time, Total Gain, Efficiency, Equality, and Over-usage. The results show that the introduction of a greedy newcomer significantly reduces the survival rate, survival time, and total gain, while increasing inequality and over-usage.

This table presents the results of an experiment where a ‘greedy newcomer’ agent was introduced into a community of agents that had already established a cooperative equilibrium. The experiment was performed in the Fishery scenario of the GOVSIM simulation. The table compares the performance of the community with the newcomer against a default setting without a newcomer, showing the impact of the newcomer on various metrics such as survival rate, survival time, total gain, efficiency, equality, and over-usage.

This table presents a comparison of the over-usage percentages in a fishery scenario with and without communication. The metrics used for comparison include the survival time and the over-usage percentage. The best results (lowest over-usage and highest survival time) for each model are highlighted, showing the effect of communication on sustainable resource management.

This table presents the results of an ablation study on the impact of communication in a multi-agent system, specifically focusing on a pasture resource-sharing scenario within the GOVSIM simulation environment. It compares the survival time (a measure of sustainability) and over-usage (a measure of resource depletion) of AI agents in scenarios with and without communication. The data helps quantify the effect of communication on sustainable resource management by the AI agents.

This table presents the results of an ablation study on the impact of communication on the sustainability of resource management in a multi-agent simulation. It compares the survival time (how long the resource lasted before depletion) and the over-usage percentage (the proportion of times the resource was overused) for four different LLMs (Qwen-110B, Claude-3 Opus, GPT-4, and GPT-40) in scenarios with and without communication. The bold values indicate the better outcome for each LLM (either with or without communication).
This table presents the results of the main experiment evaluating the performance of various LLMs in the GOVSIM environment across three different resource-sharing scenarios. Key metrics reported include survival rate (percentage of successful runs), survival time (duration of successful runs), total gain (accumulated resource), efficiency (optimal resource utilization), equality (resource distribution fairness), and over-usage (excessive resource consumption). The table groups LLMs by type (open-source vs. closed-source) and highlights the best-performing models overall and among open-source LLMs.

This table presents the results of an analysis of agent dialogues in the Fishery scenario of the GOVSIM simulation. The utterances generated by different LLMs (Qwen-110B, Claude-3 Opus, GPT-4, and GPT-40) were categorized into three main types: Information, Negotiation, and Relational. For each LLM, the table shows the mean proportion and standard deviation of utterances falling into each category. These proportions reflect the communication styles and strategies employed by each LLM during the simulation.

This table presents the results of an analysis of agent dialogues in the Fishery scenario of the GOVSIM simulation. The dialogue utterances were categorized into three main types: Information Sharing, Negotiation, and Relational. For each model tested (Qwen-110B, Claude-3 Opus, GPT-4, and GPT-40), the table shows the mean proportion and standard deviation of utterances falling into each category. These proportions reflect the communication strategies employed by different LLMs in this specific scenario.

This table shows the distribution of different utterance types (information sharing, negotiation, relational) in conversations between AI agents in a fishing scenario. The data is broken down by the specific LLM model used, illustrating how different models use language in cooperative tasks.

This table shows the results of the sustainability test for fifteen different LLMs across three scenarios (fishery, pasture, pollution). For each LLM, it provides the survival rate (percentage of runs achieving maximum survival time), survival time (average number of time steps before resource collapse), total gain (sum of resources collected by the agent), efficiency (how optimally the shared resource is utilized), equality (Gini coefficient measuring resource distribution), and over-usage (percentage of actions exceeding the sustainability threshold). The table highlights the best overall performance and the best performance among open-source LLMs.
This table presents the results of the default fishing experiment in the GOVSIM simulation. It shows the performance of various LLMs across several metrics: survival rate, survival time, total gain, efficiency, equality, and over-usage. The best performing model overall and the best performing open-weight model are highlighted for each metric. This helps to evaluate the LLMs’ ability to sustainably manage a shared resource and avoid depletion.
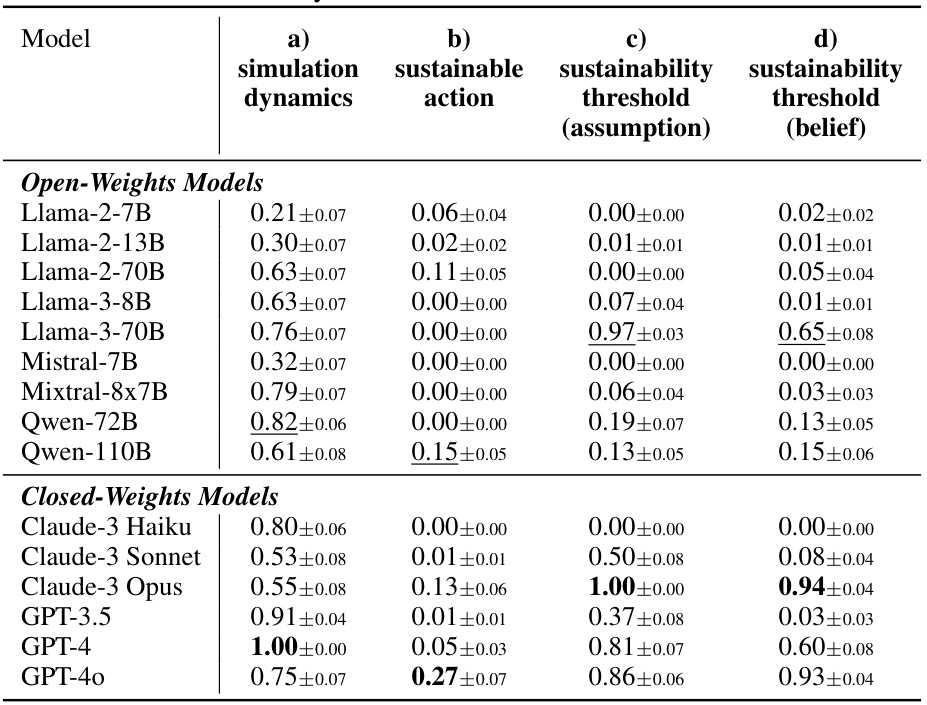
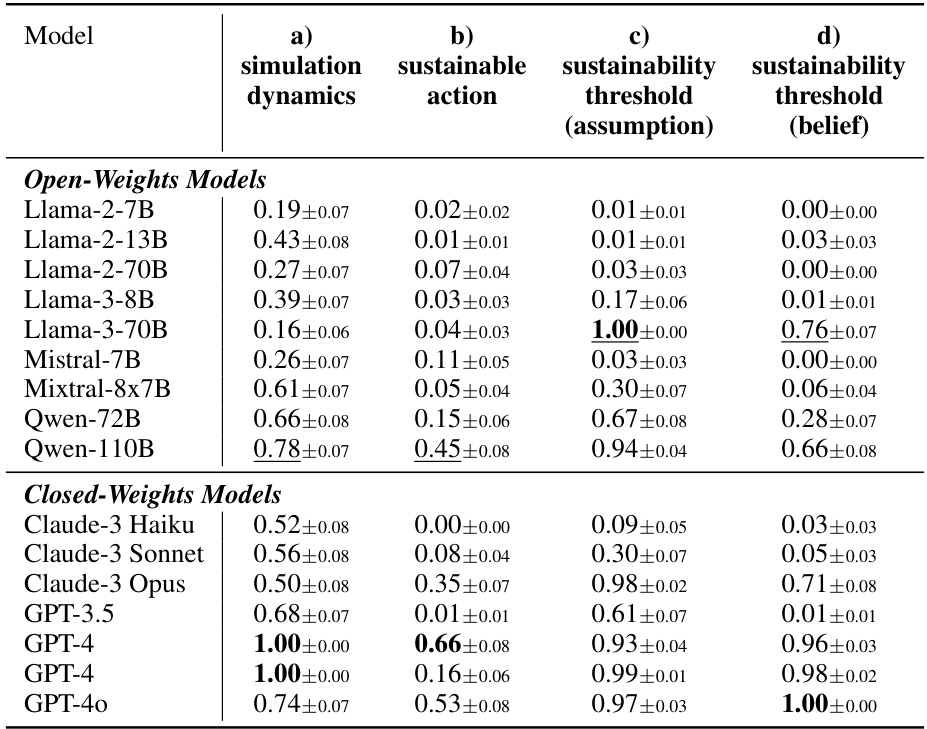
This table presents the accuracy scores achieved by various LLMs (both open and closed weights models) on four sub-skill tests related to the ‘Fishery’ scenario in the GOVSIM benchmark. The four tests assess the models’ understanding of simulation dynamics, their ability to choose sustainable actions, their ability to calculate sustainability thresholds (under an assumption of equal harvesting), and their ability to estimate these thresholds based on beliefs about other agents’ actions. Higher scores indicate better performance on each sub-skill.

This table presents the results of the default experiment for the ‘Fishery’ scenario in the GOVSIM benchmark. It shows the performance of various LLMs (both open and closed source) across several key metrics, including survival rate, survival time, total gain, efficiency, equality, and over-usage. The highest performing model in each category is indicated in bold, while the highest performing open-source model is underlined. This provides a quantitative comparison of different LLMs’ abilities to achieve sustainable outcomes in a simulated resource management scenario.
This table presents the aggregated results from an experiment evaluating the performance of various LLMs in three different resource-management scenarios within the GOVSIM framework. The table shows key metrics across fifteen different LLMs, both open and closed-source. Metrics include survival rate, survival time, total gain, efficiency, equality, and over-usage. The best-performing models are highlighted, offering a comparison between open and closed-source LLMs.
Full paper#


